Training Manual on Fertilizer Statistics in...
108
AfricaFertilizer.org is a joint initiative from IFDC, FAO, IFA and the Africa Union to facilitate exchange of information about soil fertility, fertilizers and good agricultural practices in Africa June 2012 – draft version. Training Manual on Fertilizer Statistics in Africa
Transcript of Training Manual on Fertilizer Statistics in...
AfricaFertilizer.org is a joint initiative from IFDC,
FAO, IFA and the Africa Union to facilitate exchange of information about soil fertility, fertilizers and
good agricultural practices in Africa
June 2012 – draft version.
Training Manual on Fertilizer Statistics in Africa
Table of Contents
List of Acronyms ........................................................................................................................................ 1
Useful Websites ........................................................................................................................................ 1
Introduction .............................................................................................................................................. 2
Chapter 1. Fertilizer Sub-Sector in Africa – An Overview ........................................................... 5
1.1 African Fertilizer Markets – The Global Perspective ..................................................................... 5
1.2 Functioning of Fertilizer Markets in Africa .................................................................................... 8
1.3 Constraints to Market Development .......................................................................................... 14
1.4 Concluding Remarks .................................................................................................................... 16
Chapter 2. Types, Definitions, Classification, and Uses ............................................................ 17
2.1 Defining Fertilizers and Nutrients ............................................................................................... 17
2.2 Organic Fertilizers........................................................................................................................ 20
2.3 Inorganic Fertilizers ..................................................................................................................... 21
2.4 Classification of fertilizers (HS codes) ......................................................................................... 24
2.5 Converting fertilizer products in nutrients .................................................................................. 26
Chapter 3. Fertilizer “hard data”: Production, Trade, Consumption, and Price Variables ....... 29
3.1 Hard Data Variables..................................................................................................................... 29
3.2 Fertilizer Resource Utilization Account (FRUA) ........................................................................... 30
3.3 Importance of Hard Data ............................................................................................................ 30
3.4 Fertilizer production .................................................................................................................... 31
3.5 Fertilizer consumption ................................................................................................................ 42
3.6 Fertilizer consumption in agriculture .......................................................................................... 46
3.7 Fertilizer Prices ............................................................................................................................ 49
Chapter 4: Fertilizer “Soft Data” - Policy and Market Development Variables ............................ 56
4.1 Guidelines for filling the questionnaire ....................................................................................... 56
4.2 Resolutions from the Abuja Declaration on Fertilizers use for an African Green Revolution .... 57
Chapter 5. Case Studies ............................................................................................................ 78
5.1 Converting fertilizer products into nutrients .............................................................................. 78
5.2 Collecting import data from Customs data ................................................................................. 79
5.3 Recording imports, converting into nutrients ............................................................................. 79

5.4 Describing a Bill of Lading ........................................................................................................... 80
5.5 Calculating Fertilizer consumptions and utilizations ................................................................... 82
5.6 Computing Fertilizer prices ......................................................................................................... 82
References .............................................................................................................................................. 84
Annexes ................................................................................................................................................... 85
Annex 1. Harmonized Codes for Fertilizers ........................................................................................ 85
Annex 2. Fertilizer Data Availability for African Countries ................................................................. 87
Annex 3. FAO fertilizer questionnaire (2010 / 2011) ......................................................................... 90
Annex 4. NEPAD Country Level Survey ............................................................................................... 95
Annex 5. Fertilizer Statistics Country Digest .................................................................................... 103
Annex 6. AFO Fertilizer Catalogue format (sample) ......................................................................... 104
List of figures
Figure 1: international prices for selected fertilizers (2003-2012) .......................................................... 8
Figure 2: The Fertilizer Market in Africa .................................................................................................... 9
Figure 3: Types of Fertilizer Supply Chains in SSA ................................................................................... 10
Figure 4: Fertilizer Cost Build Up: Thailand vs. Sub-Saharan Africa (2006) ............................................ 13
Figure 5: IFDC price collection network in 2011 ..................................................................................... 52
List of Tables
Table 1: Regional & sub regional fertilizer consumption 2007/08-2011/12 (in %) .................................. 6
Table 2: Essential elements for fertilizers ............................................................................................... 18
Table 3: functions of primary elements (N P K) ...................................................................................... 19
Table 4: Secondary nutrients in some commonly used fertilizers .......................................................... 19
Table 5: nutrient contents of fertilizer of animal origin .......................................................................... 21
Table 6: Summary of the different organic fertilizers ............................................................................. 21
Table 7: Different forms of inorganic fertilizers ...................................................................................... 22
Table 8: composition of some important fertilizers ................................................................................ 23
Table 10: Common HS codes for fertilizers ............................................................................................. 25
Table 9: conversion table for common fertilizers ................................................................................... 27
Table 11: FAO template for production data .......................................................................................... 33
Table 12: Fertilizer production for selected countries (2005-2009, in mt of nutrients) ......................... 33
Table 13: fertilizer production template (FAO) ....................................................................................... 34
Table 14: Intermediary table (FAO) ......................................................................................................... 35
Table 15: import / export tables (FAO) ................................................................................................... 38
Table 16: Detailed import records (KBC / CountrySTAT Kenya, May 2009) ............................................ 39
Table 17: Aggregated import data by HS Codes (GSS / CountrySTAT Ghana 2010) .............................. 40
Table 18: fertilizer domestic availability (FAO) ....................................................................................... 41
Table 19: dealer sales report (FAO) ......................................................................................................... 44
Table 20: Fertilizer utilization (FAO) ........................................................................................................ 45
Table 21: Data collection table FAO for fertilizer use ............................................................................. 47
Table 22: Data collection table IFA - FUBC .............................................................................................. 48
Table 23: price definitions ...................................................................................................................... 50
Table 24: Fertilizer Price Template (FAO) ............................................................................................... 51
Table 25: IFDC template for monthly price recordings (AMITSA / MIR+ ) .............................................. 51
Table 26: IFDC template for monthly national average prices (AMITSA, March 2012) ......................... 52
Table 27: Monthly regional prices (SRID / MOFA Ghana, Dec 2010) ..................................................... 52
Table 28: National monthly and annual average prices (SRID/MOFA Ghana, 2010) ............................. 53
Table 29: fertilizer price paid by farmers (FAO) ...................................................................................... 54
Table 30: Resolution 1 - Indicators on increasing fertilizer use .............................................................. 58
Table 31: Resolution 2 - Fertilizer Policy ................................................................................................. 59
Table 32: Resolution 2 - Fertilizer Regulatory Frameworks .................................................................... 60
Table 33: Resolution 2 - Taxes, tariffs and customs duties on fertilizers ................................................ 61
Table 34: Resolution 3 - Development of agro dealer networks ............................................................ 64
Table 35: Resolution 4 - Capacity building for the private sector ........................................................... 66
Table 36: Resolution 5 - Targeted Fertilizer Subsidies ............................................................................ 69
Table 37: Resolution 6 - Indicators on investments to improve output market incentives ................... 70
Table 38: Resolution 7- Improving Access to Finance ............................................................................. 71
Table 39: Resolution 8 - Regional Fertilizer Procurement ...................................................................... 73
Table 40: Resolution 9 - National or Regional Fertilizer Production ....................................................... 74
Table 41: Resolution 9 - promote inter- and Intra-REC Fertilizer Trade ................................................. 75
Table 42: Resolution 10 - Improved farmer access to complementary inputs ....................................... 76
List of Acronyms
AU African Union CIF Cost Insurance & Freight DAP Diammonium Phosphate DRC Democratic Republic of Congo FAO Food and Agriculture Organisation FRUA Fertilizer Resource Utilization Account FUBC Fertilizer Utilization By Crop IFA International Fertilizer Industry Association IFDC International Fertilizer Development Centre LC Letter of credit NEPAD New Partnership for Africa Development NGO Non-Governmental Organization NPK Nitrogen, Phosphorus and Potassium (Fertilizers) SC Supply Chains SSA Sub Saharan Africa HS Harmonized Systems WCO World Customs Organization
Useful Websites
AfricaFertilizer.org www.africafertilizer.org AMITSA www.amitsa.org Africa Union www.africa-union.org CountrySTAT www.countrystat.org FAO (ESS) www.fao.org/economic/ess/ess-home/en/ FAO STAT http://faostat.fao.org/site/575/default.aspx#ancor IFA www.fertilizer.org IFDC www.ifdc.org NEPAD www.nepad.org
Website: www.africafertilizer.org Facebook: www.facebook.com/africafertilizer.org Twitter: @AfricFertilizer Email: [email protected]
Page 1
Introduction
In June 2006, Africa’s leaders gathered in Abuja for the Africa Fertilizer Summit, with an aim to highlight the importance of fertilizers in achieving an African Green Revolution. The principal outcome of the Summit, the Abuja Declaration on Fertilizers for an African Green Revolution confirms the commitment of the African head of states to achieving a rapid increase in fertilizer use on the continent, from the current average of 9 kilograms per hectare to an average of at least 50 kilograms per hectare by 2015. The Declaration delineates concrete measures and actions to rapidly accelerate the accessibility, availability and affordability of fertilizers on the continent.
These actions can be summarizes as follows:
1. harmonize policies and regulations to ensure duty- and tax-free movement of fertilizers across regions, and the development of capacity for quality control;
2. develop and scale up agro dealer networks to improve farmer access to fertilizer; 3. develop and strengthen the capacity of the privates sector involved in agriculture; 4. grant targeted subsidies, with special attention to poor farmers; 5. improve output market incentives, particularly by accelerating investment in infrastructure
and strengthening farmers’ organizations ; 6. establish national financing facilities for input suppliers to accelerate access to credit; 7. promote the establishment of regional fertilizer procurement and distribution facilities
through strategic public-private partnerships; 8. promote national/regional fertilizer production and intra-regional fertilizer trade; 9. improve farmer access to complementary inputs (quality seeds, irrigation facilities, extension
services, market information, and soil nutrient testing and mapping; 10. establish an Africa Fertilizer Development Financing Mechanism.
Hence, the genesis of the AfricaFertilizer.org portal is the Abuja Declaration which confirms the lack of market information as an important constraint to fertilizer market development on the continent. Accordingly, in 2009 IFDC initiated the development of the AfricaFertilizer.org (AFO) portal. The aim of the AFO is to provide a unique combination of information and data on fertilizers and soil fertility issues in Africa. It does this by sourcing, aggregating, filtering and sharing information on fertilizer from and to international, regional and national players in the sector. It also engages the small, local fertilizer dealers and agricultural extension workers who are the “last mile” link with millions of smallholder farmers. Therefore, the Africafertilizer.org portal includes a web-based data center that has been designed to manage the following data and information: fertilizer production, fertilizer imports and exports, fertilizer production capacity, fertilizer world prices, national fertilizer retail prices, total fertilizer consumption, fertilizer use by crop and fertilizer market intelligence.
Agreement has been reached for the website to be established as a consortium, led by IFDC, supported by a short list of key partners (AU/NEPAD Agency, FAO and its “CountryStat for Sub-Saharan Africa” project, and the International Fertilizer Industry Association (IFA)). The website is currently hosted and managed by IFDC.
Page 2
CountrySTAT – a web-based information system - is a project partnership between FAO and the Gates Foundation to substantially improve the quality, accessibility, relevance, and reliability of national statistics on food and agriculture in 17 Sub-Saharan African countries. Through national and regional CountrySTAT projects, FAO forms partnerships with statistical offices and the relevant ministries to introduce the system and build the national capacity to use it. FAO and its CountrySTAT project will partner with IFDC, IFA and NEPAD through technical collaboration in a number of areas, including contribution of information, data and statistics related to fertilizers in Africa and sharing and improving methodologies, data management expertise and related tools. IFA and FAO collect data on African fertilizer statistics, but to date, [high quality data can be found only in] North Africa and South Africa. The key contribution by the AFO consortium will be to improve data from the rest of Africa for the website.
At the request of the AU Heads of State, NEPAD has been monitoring and reporting on progress in the implementation of the Abuja Declaration on Fertilizers since June 2006. Accordingly, NEPAD’s contribution to the partnership will be to provide information and data on fertilizer market intelligence in SSA, especially countries affiliated to IFDC.
Based on their experience to date in collecting, analyzing and disseminating statistics and information on fertilizer markets in Africa, the partner organizations realize there is a need to: a) improve the availability and quality of fertilizer statistics at the national level; b) Improve the knowledge on the overall performance of fertilizer markets in Africa among; c) Improve the speed and frequency of dissemination of fertilizer statistics and information to ensure relevance to policy-making and program planning and implementation.
The purpose of this manual is to be used by CountrySTAT Trainers whose mandate is to train a larger number of national Trainees. Accordingly, this training manual is designed to be used by AFO Trainers who can provide training at the country level to:
1. Improve the collection of fertilizer statistics by national statistics officers in the CountrySTAT programs (the “hard” data);
2. Improve the collection of fertilizer data and market intelligence by staff in the Ministry of Agriculture in charge of farm inputs (the “soft” data).
The target group will be CountrySTAT trainers from key AfricaFertilizer.org regions and countries to provide training on:
• AfricaFertilizer.org initiative and partners • Basic fertilizer technical knowledge (definitions, terminology, classifications, sources, key
issues for data collection, questionnaires) • Fertilizer soft and hard data and statistics (from collection to validation and publishing)
Page 3
The manual is organized as follows:
Chapter 1 provides an overview of the fertilizer market in Africa, describes the key components of well-functioning fertilizer markets, and summarizes the current status of fertilizer markets in Africa vis-à-vis these components. The purpose is to provide trainees with sufficient grounding on the fertilizer markets in Africa to understand the importance of the data and information that will be collected and its role and relevance for improving the performance of the fertilizer markets in Africa.
Chapter 2 will present fertilizer, definitions, classifications, and conversion into nutrients.
Chapter 3 will present and describe the following variables: Fertilizer Production, (Trade) Fertilizer Imports, Fertilizer Exports, Fertilizer Consumption (Apparent or Actual), Fertilizer use (by crop, by acreage), and Prices. Collectively, the quantitative information on these variables will be known as hard data. It is very crucial for agricultural statistical officers to be conversant with the understanding of the above variables in order to facilitate data collection and analysis.
Chapter 4 will discuss soft data issues. Soft data complements hard data. It (soft data) concerns itself with issues around Fertilizer Policy and Network Building in the fertilizer industry in order to share information and risks.
Chapter 5 affords participants with the opportunity of applying what they have learnt in the training sessions through case studies.
Page 4
Chapter 1. Fertilizer Sub-Sector in Africa – An Overview
Learning Objectives
• Participants are expected to appreciate the importance of fertilizer in agriculture
• To underscore the importance of local production of fertilizers as overreliance on imports may expose sub Saharan African countries to supply-shocks.
• Understanding of the Fertilizer Market in sub Saharan Africa
• Exploring ways in which SSA countries may be encouraged to make use of High-Analysis fertilizers
• Understanding the Demand-side and Supply-side constraints in fertilizer acquisition and use in SSA countries
Substantive use of fertilizer is a prerequisite for the success of efforts to improve agricultural productivity and hence increase agricultural output and farm income in Africa. No country in the world has achieved substantive agricultural growth without the use of fertilizers. But fertilizer use rates in Africa are low. Average fertilizer use in Africa is 10 kg/ha, equivalent to 10 % of the world average, and almost 20 times less than the average for Asia (191 kg/ha) and nine times less than the average for Latin America (94 kg/ha). Low fertilizer use per hectare does not auger well for achieving food security or reversing the severe soil nutrient depletion in Africa. Declining nutrient consumption and low fertilizer application rates have translated into cereal crop yields per hectare for Africa and SSA that are much lower than the world average (3.26 tons per hectare) and lower than what farmers are capable of achieving under conducive conditions. Low fertilizer use rates per hectare translate into small fertilizer markets and hence, a small share of global fertilizer consumption for Africa as a whole and for SSA in particular. Out of the 44 countries in sub-Saharan Africa, only nine countries use more than 50,000 nutrient tons and 10 countries use less than 10,000 nutrient tons.
1.1 African Fertilizer Markets – The Global Perspective
1.1.1 Consumption
Globally, fertilizer consumption in sub-Saharan Africa (SSA) was 1 million metric tons per year in 2005/06 and this level has not changed much up to 2011. Egypt, South Africa and Morocco are the leading fertilizer consuming countries in Africa as a whole; they consumed 3.2 million metric tons (mt) of nutrients and accounted for 69% of Africa’s total fertilizer consumption in 2005/06. In global terms, global fertilizer nutrient consumption for Africa accounted for only 3.4 % in the period 2007-2011. The table below shows the consumption shares of different Fertilizer nutrients for different regions in the world.
Page 5

Table 1: Regional & sub regional fertilizer consumption 2007/08-2011/12 (in %)
N P K Regions & Subregions
Share of World Cons
Annual Growth
Share of World Cons
Annual Growth
Share of World Cons
Annual Growth
World 1.4 2.0 2.4
Africa 3.4 2.9 2.5 1.0 1.6 2.0
North America 13.5 0.3 12.0 0.5 17.1 0.7
Latin America 6.3 2.4 13.0 2.8 17.5 2.9
West Asia 3.5 1.7 3.3 1.0 1.4 2.4
South Asia 19.6 2.2 20.5 3.5 10.9 4.2
East Asia 38.3 1.3 36.1 1.9 35.2 3.3
Central Europe 2.7 1.8 1.5 1.2 2.4 1.0
West Europe 8.4 -0.3 5.6 -0.7 9.5 0.0 Eastern Europe & Central Asia 3.0 2.4 2.0 4.5 3.1 1.6
Oceania 1.4 4.9 3.5 1.7 1.3 2.1
Source: World Bank
1.1.2 Production
Fertilizer production in Africa is concentrated in North Africa and South Africa. Production in SSA is extremely small although there is some production starting up in Nigeria and forecasted for Tanzania and the Democratic Republic of Congo (DRC). A key reason for the lack of production is that SSA is largely deficient in the natural gas and raw material resources (phosphate rock, sulfur and potassium salts) required for fertilizer production. Although there are numerous small deposits of phosphate rock throughout SSA, substantial commercial deposits are found only in Tanzania, Togo and Senegal. The DRC is the only country in SSA with commercial deposits of potash. Nigeria, Angola, Equatorial Guinea, Ethiopia, Mozambique, Namibia, DRC, Madagascar and Tanzania are the only countries with natural gas. In comparison, there are significant phosphate rock deposits in South Africa and the country produces 90 % of its phosphate fertilizer requirements and imports the rest. It does not produce potassium fertilizers. In North Africa, Morocco, Tunisia, Algeria and Egypt have substantial resources of phosphate rock and natural gas and produce both phosphate and nitrogen fertilizers.
Total nutrient production in Africa was 5.5 million mt in 2005/06, an increase of 13 % from the 4.9 million mt produced in 1995/96. However, this gain was offset by a 75 % decrease in production in SSA – from 0.3 million mt to 0.09 million mt – during the same period. In terms of Africa’s share of global fertilizer production, in 2005/06 the African fertilizer industry produced 3 % of the world’s total production of 164.9 million, which is similar to its share 10 years previously in 1995/96 (Figure 4). Egypt, Morocco and Tunisia accounted for the majority (78 %) of the total production of 4.4 million mt. SSA accounted for only 1.8 % of global fertilizer production in 2005/06 (Table 3).
Page 6
1.1.3 Trade
With regards to trade, trade of total nutrients (imports and exports) increased between 1995/96 and 2005/06 for Africa as a whole and for SSA. Total imports for Africa increased from 1.4 million mt of nutrients to 2.2 million mt of nutrients, an increase of 57 %. The increase for SSA was 25 %, from 0.8 million mt to 1 million mt. Total exports from Africa increased from 2.7 million mt to 3.1 million mt (an increase of 16 %). The increase for SSA was 6 %, from 78,000 mt to 82,500 mt. Therefore, Africa as whole is a net exporter; it exports more fertilizer than it imports. However, SSA is a net importer of fertilizers.
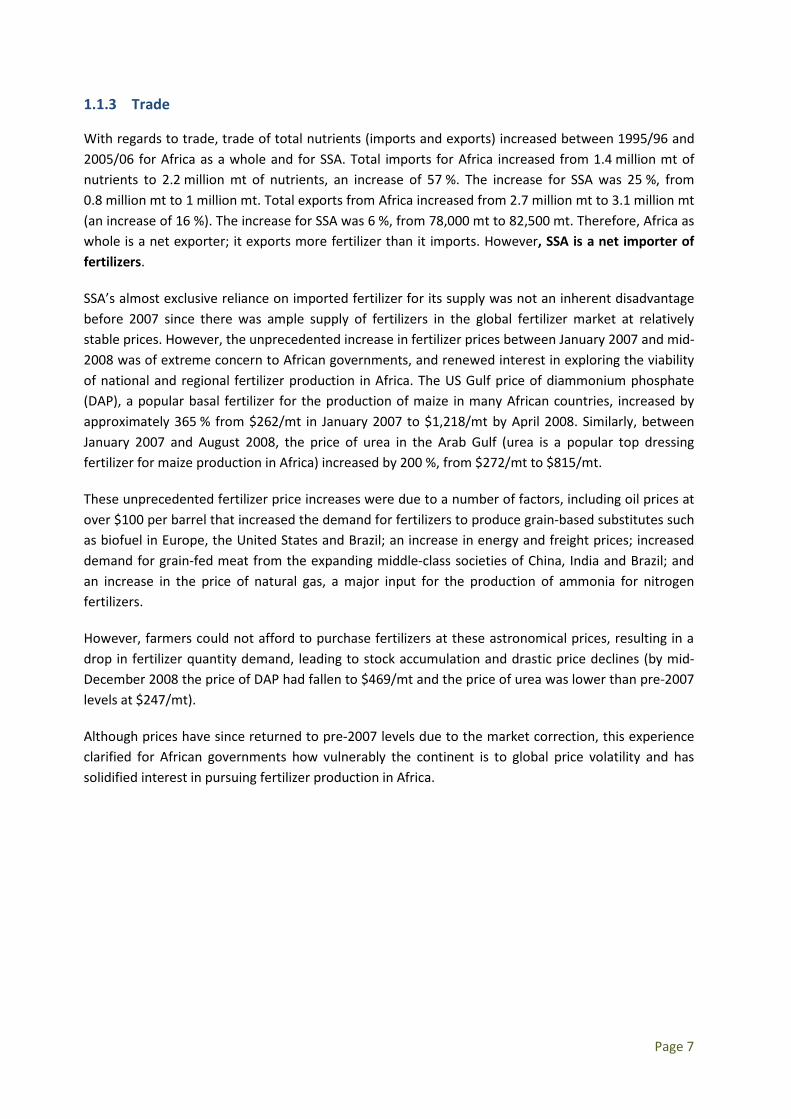
SSA’s almost exclusive reliance on imported fertilizer for its supply was not an inherent disadvantage before 2007 since there was ample supply of fertilizers in the global fertilizer market at relatively stable prices. However, the unprecedented increase in fertilizer prices between January 2007 and mid-2008 was of extreme concern to African governments, and renewed interest in exploring the viability of national and regional fertilizer production in Africa. The US Gulf price of diammonium phosphate (DAP), a popular basal fertilizer for the production of maize in many African countries, increased by approximately 365 % from $262/mt in January 2007 to $1,218/mt by April 2008. Similarly, between January 2007 and August 2008, the price of urea in the Arab Gulf (urea is a popular top dressing fertilizer for maize production in Africa) increased by 200 %, from $272/mt to $815/mt.
These unprecedented fertilizer price increases were due to a number of factors, including oil prices at over $100 per barrel that increased the demand for fertilizers to produce grain-based substitutes such as biofuel in Europe, the United States and Brazil; an increase in energy and freight prices; increased demand for grain-fed meat from the expanding middle-class societies of China, India and Brazil; and an increase in the price of natural gas, a major input for the production of ammonia for nitrogen fertilizers.
However, farmers could not afford to purchase fertilizers at these astronomical prices, resulting in a drop in fertilizer quantity demand, leading to stock accumulation and drastic price declines (by mid-December 2008 the price of DAP had fallen to $469/mt and the price of urea was lower than pre-2007 levels at $247/mt).
Although prices have since returned to pre-2007 levels due to the market correction, this experience clarified for African governments how vulnerably the continent is to global price volatility and has solidified interest in pursuing fertilizer production in Africa.
Page 7
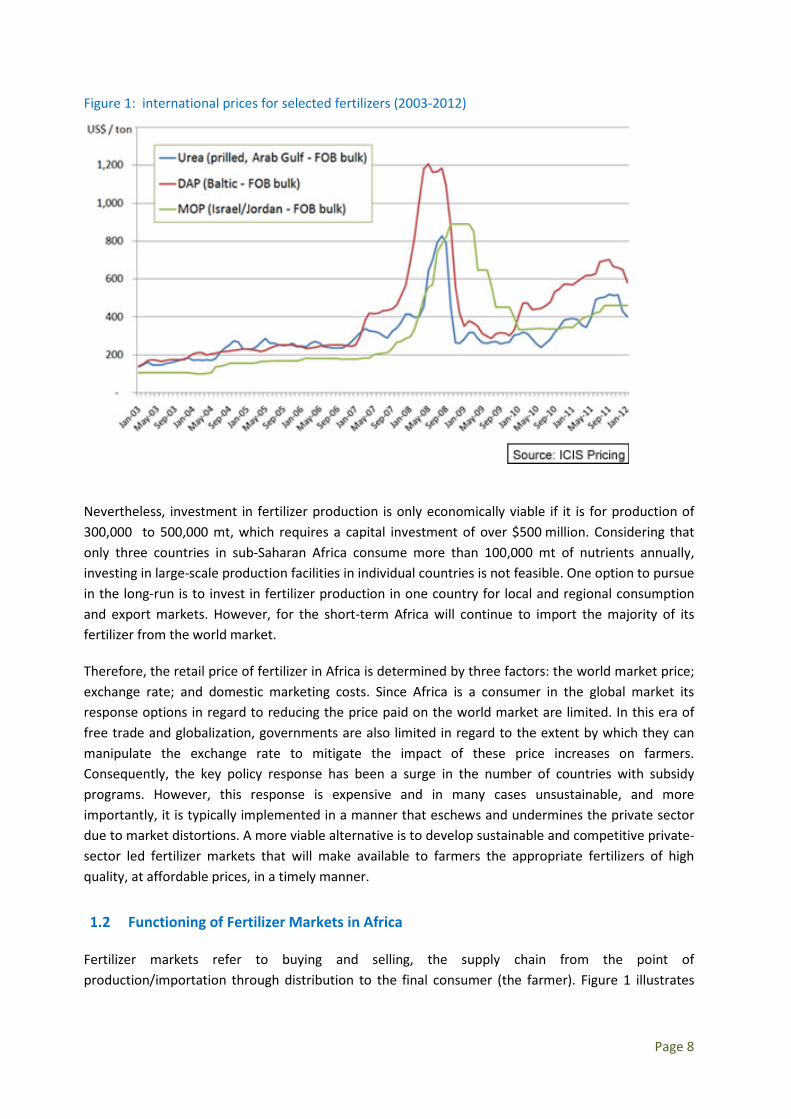
Figure 1: international prices for selected fertilizers (2003-2012)
Nevertheless, investment in fertilizer production is only economically viable if it is for production of 300,000 to 500,000 mt, which requires a capital investment of over $500 million. Considering that only three countries in sub-Saharan Africa consume more than 100,000 mt of nutrients annually, investing in large-scale production facilities in individual countries is not feasible. One option to pursue in the long-run is to invest in fertilizer production in one country for local and regional consumption and export markets. However, for the short-term Africa will continue to import the majority of its fertilizer from the world market.
Therefore, the retail price of fertilizer in Africa is determined by three factors: the world market price; exchange rate; and domestic marketing costs. Since Africa is a consumer in the global market its response options in regard to reducing the price paid on the world market are limited. In this era of free trade and globalization, governments are also limited in regard to the extent by which they can manipulate the exchange rate to mitigate the impact of these price increases on farmers. Consequently, the key policy response has been a surge in the number of countries with subsidy programs. However, this response is expensive and in many cases unsustainable, and more importantly, it is typically implemented in a manner that eschews and undermines the private sector due to market distortions. A more viable alternative is to develop sustainable and competitive private-sector led fertilizer markets that will make available to farmers the appropriate fertilizers of high quality, at affordable prices, in a timely manner.
1.2 Functioning of Fertilizer Markets in Africa
Fertilizer markets refer to buying and selling, the supply chain from the point of production/importation through distribution to the final consumer (the farmer). Figure 1 illustrates
Page 8
the physical flow of fertilizer from the overseas supplier to the farm gate in the typical fertilizer market in Africa. In doing so it depicts the players in the African fertilizer market (structure); the functions performed by these main actors (conduct) and the costs and margins generated as these functions are carried out (performance).
These functions are carried out within an enabling environment which is comprised of public policies, the regulatory framework, laws and institutions, the physical geography and climate of the country, and the infrastructural set-up. The magnitude of the costs and margins generated by carrying out each function is influenced by the policy, regulatory and institutional environment as well as the basic market conditions (size of the market, infrastructure) and physical conditions (climate, soils, land formations, etc.).
Figure 2: The Fertilizer Market in Africa
1.2.1 5 main types of supply chains
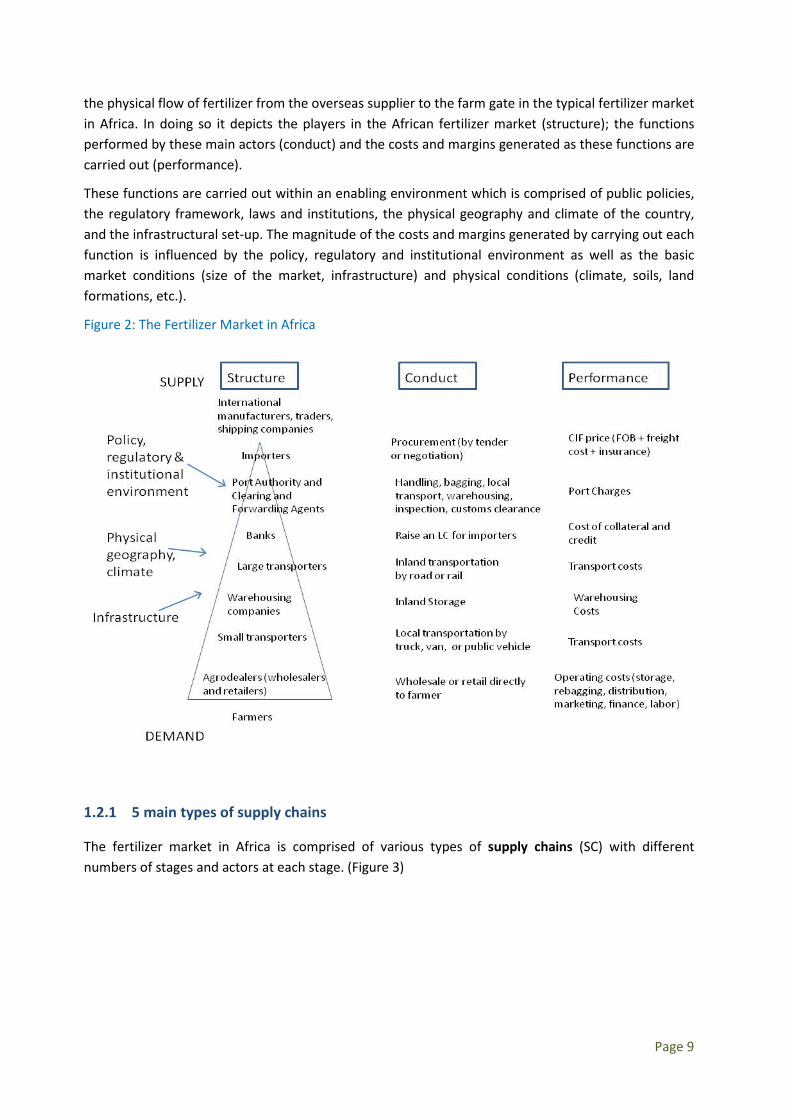
The fertilizer market in Africa is comprised of various types of supply chains (SC) with different numbers of stages and actors at each stage. (Figure 3)
Page 9

Figure 3: Types of Fertilizer Supply Chains in SSA
SC1 represents the typical organization of fertilizer supply chains in Africa where markets have been liberalized. Importers procure fertilizer from overseas suppliers and sell it mainly to wholesalers/distributors but also directly to retailers/agro-dealers. The latter typically occurs in countries like Uganda where the wholesaler/distributor level does not exist or is insubstantial. Retailers/agro-dealers also sell fertilizers directly to small-scale farmers or sell it to stockists who then
SC2 SC2 SC3
SC4 SC5
Domestic Production
Manufacturers
Wholesalers/Distributors
Retailers/Agro-Dealers
Stockists Stockists
Retailers/Agro-Dealers
Wholesalers/Distributors or Estate Crops
Importers
Export Crop Company
Large Companies Producing Cash Crops for Export
Outgrowers
Importers
NGOs
Famer Group Shops/ Service Centers
Farmers Group Members/Small-Scale
Farmers
Importers
Importers
Government-Owned Enterprises
Famer Groups/Ministry of Agriculture Extension
Unit
Small-Scale Farmers
Small-Scale Farmers
Small-Scale Farmers
Page 10
sell it to small-scale farmers. However, these supply chains are typically weak and undeveloped due to a number of supply- and demand-side constraints which will be elaborated on below.
SC2 represents a more mature organization of fertilizer market with domestic production of fertilizers and distribution via well-developed wholesaler/distributor and retail networks. However, such systems only exist in North Africa and South Africa; there are few such systems in sub-Saharan Africa.
SC3 is commonly found in the export cash crop sectors of SSA such as tea and sugar in Kenya, tobacco in Malawi, cotton in West Africa, and sugarcane in Mauritius. These companies either procure fertilizer directly from overseas suppliers or place orders with local importers for their contracted outgrowers. They supply the fertilizer on credit and deduct the cost of the inputs and other services at harvest time.
SC4 is found where NGOs implementing development projects also procure fertilizers for their farmers via local importers as part of their project objective of improving food security. The NGOs provide the fertilizers to their farmers directly for free, at subsidized prices or on credit. Alternatively, NGOs help their farmer groups set-up farmer service centers which then purchase the fertilizers from importers and sell it to members (at a discount) and to non-members.
SC5 occurs when government-owned enterprises procure fertilizers for their national fertilizer programs. They either procure it directly from overseas suppliers or via local importers using a tender system. These fertilizers are typically distributed via government parastatals or the Ministry of Agriculture extension service for free, at subsidized prices or on credit. The private sector is not involved in the distribution of fertilizers procured by the government.
1.2.2 Basic Market Conditions
Small-scale farmers produce the majority of agricultural products in SSA, but they use little or no chemical or organic fertilizers to do so. More fertilizer is applied to staple foods than to export crops; 40 % of the fertilizer consumed in SSA is used on maize, followed by other cereals (wheat, barley, teff, sorghum and millet). Fruits and vegetables and sugar cane account for 15 % of fertilizer use, and rice, tobacco, cotton and traditional tubers (cassava, yams) account for 2–3 % each (Morris et al., 2007).
Average fertilizer use in SSA is 10 kg/ha, one-tenth of the world average (100 kg/ha). Consequently, national fertilizer markets are small, with the majority of countries in SSA consuming less than 10,000 mt of nutrients per annum. These markets are characterized by too many products relative to market size. For example, the West African cotton sector has a high level of fertilizer product differentiation among different countries despite the fact that they have similar soil types. Similarly, Malawi has 20 fertilizer products in use. Many are compound fertilizers, typically NPKs with minor variations in content. Because these are low-analysis fertilizers, the nutrients are more expensive than the same nutrients found in straight high-analysis fertilizers, because it is more expensive to manufacture smaller amounts of specific types of fertilizers.
Page 11
Fertilizer markets in Africa underwent liberalization to varying degrees beginning in the late 1980s/early 1990s but in many countries there is still government involvement in fertilizer importation and/or distribution to varying degrees.
• The majority of fertilizer consumed in Africa is in granular form. Therefore, either it is imported bagged or it is imported in bulk and bagged at the port at a flat cost per bag using equipment owned by the Port Authority and/or private bagging companies.
• In regard to handling and storage, palletization is often not used in Africa; instead bags are carried manually or dragged, which can result in torn bags and spillage.
• Fertilizer is hygroscopic, so improper storage can result in caking of fertilizer and/or its chemical composition can be affected due to exposure to heat and humidity. Therefore losses due to improper handling and storage can be quite high.
• Importation of fertilizer is location-specific, while in most countries its consumption is highly dispersed and located at a distance from the port. Therefore, a reliable and efficient transportation system is required to move fertilizer to farmers in Africa.
• The road network in Africa, particularly in rural areas, is sparse and those that do exist are poorly maintained. This results in high maintenance costs for trucks and increases travel time which increases transaction costs (in terms of time and money).
As a result, there is poor availability of fertilizers in rural areas and high prices for fertilizers that do reach the farm-gate. The seasonality of demand for fertilizers and the low purchasing power of smallholders which is typically characterized by small and frequent purchases increase transportation, storage and transaction costs.
1.2.3 Performance of African Fertilizer Markets
As the main actors in the fertilizer supply chain carry out functions they generate costs and also take remuneration for their services in the form of profit margins. Figure 5 illustrates fertilizer supply chains for urea in Thailand, Tanzania (a coastal country) and Mali (a landlocked country) in 2006. It illustrates the costs that are incurred as the various functions are performed along the supply chain, and illustrates their percentage contribution to the retail price.
The main cost components are the product cost (f.o.b. and bagging), taxes and levies, transportation, finance and total profit margins by traders. Comparing the value chains for the three countries provides some useful insight with respect to performance of the fertilizer market in Africa. It is evident that (in absolute terms) product costs are relatively similar in the three countries. They account for the largest component in the supply chain, representing 81 % of the retail price in Thailand ($229/mt), 65 % of the retail price in Tanzania ($251/mt) and 49 % in Mali ($252/mt).
However, all other costs are much higher in Tanzania and Mali than in Thailand. Whereas these other costs account for 19 % of the retail price in Thailand, they account for 34.5 % of the retail price in Tanzania, and 53 % in Mali. Some proportions of these higher costs in Africa are legitimately incurred while performing the various marketing functions; however, some proportion of these costs are incurred as a result of the constraints imposed by the policy, regulatory and institutional environment.
Page 12
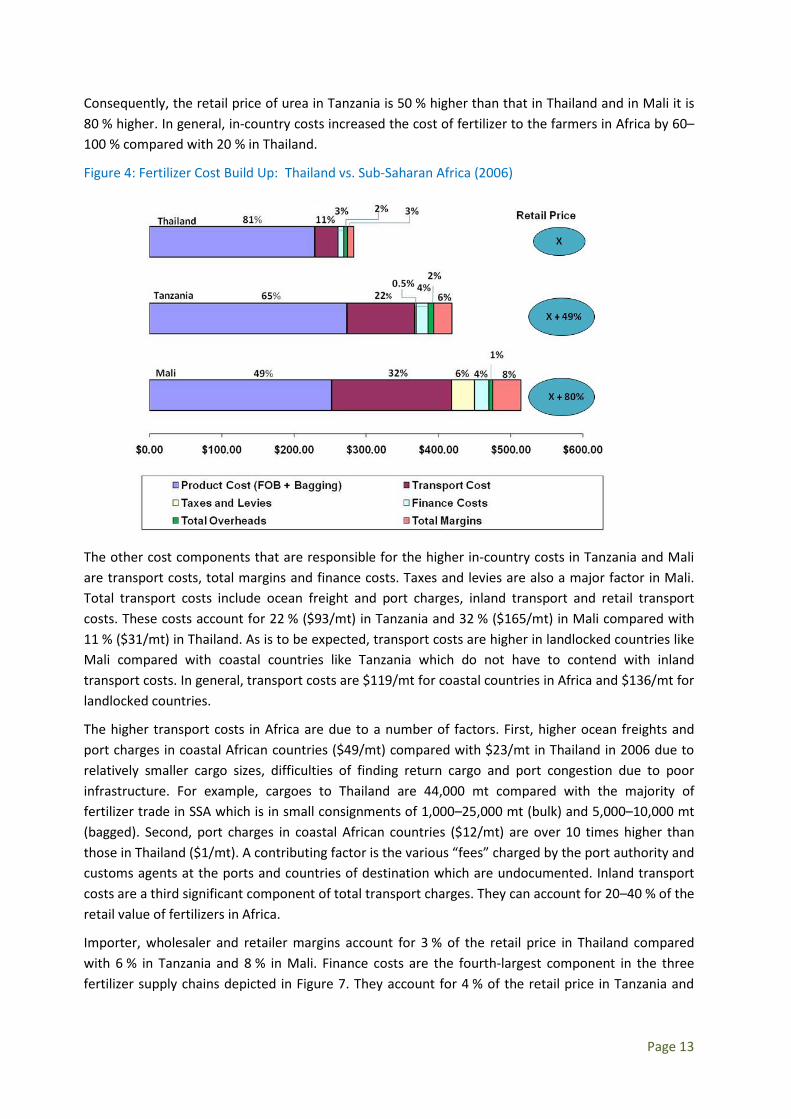
Consequently, the retail price of urea in Tanzania is 50 % higher than that in Thailand and in Mali it is 80 % higher. In general, in-country costs increased the cost of fertilizer to the farmers in Africa by 60–100 % compared with 20 % in Thailand.
Figure 4: Fertilizer Cost Build Up: Thailand vs. Sub-Saharan Africa (2006)
The other cost components that are responsible for the higher in-country costs in Tanzania and Mali are transport costs, total margins and finance costs. Taxes and levies are also a major factor in Mali. Total transport costs include ocean freight and port charges, inland transport and retail transport costs. These costs account for 22 % ($93/mt) in Tanzania and 32 % ($165/mt) in Mali compared with 11 % ($31/mt) in Thailand. As is to be expected, transport costs are higher in landlocked countries like Mali compared with coastal countries like Tanzania which do not have to contend with inland transport costs. In general, transport costs are $119/mt for coastal countries in Africa and $136/mt for landlocked countries.
The higher transport costs in Africa are due to a number of factors. First, higher ocean freights and port charges in coastal African countries ($49/mt) compared with $23/mt in Thailand in 2006 due to relatively smaller cargo sizes, difficulties of finding return cargo and port congestion due to poor infrastructure. For example, cargoes to Thailand are 44,000 mt compared with the majority of fertilizer trade in SSA which is in small consignments of 1,000–25,000 mt (bulk) and 5,000–10,000 mt (bagged). Second, port charges in coastal African countries ($12/mt) are over 10 times higher than those in Thailand ($1/mt). A contributing factor is the various “fees” charged by the port authority and customs agents at the ports and countries of destination which are undocumented. Inland transport costs are a third significant component of total transport charges. They can account for 20–40 % of the retail value of fertilizers in Africa.
Importer, wholesaler and retailer margins account for 3 % of the retail price in Thailand compared with 6 % in Tanzania and 8 % in Mali. Finance costs are the fourth-largest component in the three fertilizer supply chains depicted in Figure 7. They account for 4 % of the retail price in Tanzania and
Page 13
Mali compared with 2 % in Thailand. Finance costs are comprised of the costs of obtaining letters of credit (LC), bank fees and interest rates incurred by importers, distributors and retailers. The reasons for the discrepancy are the cost of opening accounts and the cost of LC in Thailand is much lower than that in Africa; it is 0.25 % in Thailand, which is which is one-tenth the rate charged in Africa. Moreover, interest rates in Thailand are 5 % per annum for importers and 7 % for wholesalers and retailers compared with 25–30 % per annum in Africa.
What accounts for the higher costs and margins in African countries than in Thailand? A key reason is poor market development in Africa. Thailand has lower margins and overhead costs due to a higher level of development of retail networks in terms of quantity and quality of market actors (there is one retailer per 5,000 farmers in Thailand), fierce competition at all levels of the supply chain and the high volumes of business conducted. These attributes are absent in the fertilizer market in Africa due to a number of supply- and demand-side constraints that are inflating the magnitude of these costs above what they would be in a competitive market. That is, there is a component of each cost that can be justified by the function performed (whereby Price = Marginal Cost). But in African fertilizer markets the final consumer price is not equal to the marginal cost but is above it (Price > Marginal Cost) because there are rents or additional costs. These rents emanate due to the policy, institutional and regulatory environments in which the fertilizer market operates.
1.3 Constraints to Market Development
1.3.1 Supply-Side Constraints
A key supply-side constraint is policy uncertainty and inconsistency. Many African governments are unclear about their role in a liberalized fertilizer market; specifically, what they should do to support the fledgling private sector. At the same time, governments have little faith in the capability of the private sector.
The result is two extremes in the governments’ approach to the fertilizer market. One extreme is a ‘hands-off’ approach whereby the government has withdrawn completely and left the private sector unsupported in terms of providing an enabling policy, regulatory and institutional environment. The other extreme is “government intervention,” – government involvement in the importation and/or distribution of fertilizer via the reinstatement of old parastatals, typically implemented in the form of an unclear and inconsistent subsidy policy which eschews the private sector.
Where the subsidy programs do not involve the private sector, the result is market distortions due to the sale of subsidized fertilizers by the government parastatals and the displacement of commercial sales, which discourages the private sector. Even where the private sector may be requested to import on behalf of the government, the information regarding quantities and timing is not always clear or provided in a timely manner, and the terms of participation can pose risks for private importers who decide to submit bids. For example, tenders can be unrealistic as they require physical stocks to be positioned in-country prior to tendering which poses a huge risk for importers as they have no guarantee their bid will be successful.
Page 14
Therefore, despite the liberalization of fertilizer markets in Africa, continued government involvement to varying degrees is creating an unequal playing field and disrupting the development of the burgeoning private sector.
Other supply-side constraints are fertilizer regulatory systems that are either nonexistent or ineffective where they do exist and weak market information systems. Many countries either do not have a legal and regulatory framework regarding quality, standards, measures, safety in use and business ethics vis-à-vis the importation, distribution, marketing and use of fertilizer products in the country. Where these frameworks do exist, the quality control systems are weak and implementation capacity is limited. Laboratory testing facilities are absent or outdated and the majority of countries have no inspectors or there are less than 10 inspectors for the whole country; hence inspection at the point of sale, where the risk of adulteration is highest, is limited.
Well-functioning markets require regular and accurate information about prices, quantities, stocks, deliveries and transaction costs. However, while in some countries information about output markets (commodity prices) is published in the daily newspaper, information collection and dissemination remain weak for input markets. The ministries of agriculture in many African countries do not have the human and/or financial resources to collect and disseminate market statistics and information. Consequently, importers, agro-dealers and farmers do not have sufficient, up-to-date information about market conditions to make intelligent decisions about where and when to buy and sell their fertilizers and other agricultural inputs.
1.3.2 Demand-Side Constraints
These consist of constrained fertilizer adoption due to the absence of stable output markets for increased production, outdated fertilizer recommendations, and weak or non-existent extension systems.
The existence of reliable and stable output markets provide the incentive for farmers to use productivity-enhancing technologies like fertilizers by providing reliable outlets for their marketable surpluses. However, while the markets for cash and export crops are well-developed in SSA, the markets for food crops are poorly developed. Consequently, at harvest farmers are often faced with low prices which reduce the incentive to use modern inputs.
Second, small-scale farmers in SSA lack knowledge about the correct and safe use of fertilizers. Very few farmers use basal fertilizers, some use basal (NPK) fertilizers for topdressing, or they may use a mixture of both, due to knowledge and economic constraints.
Moreover, even where farmers attempt to use fertilizers correctly their efforts are hampered by outdated fertilizer recommendations; consequently, they use fertilizer grades and quantities that are not suitable for their soils and/or crop mix. This continuous cultivation without proper and adequate use of fertilizers has resulted in severe soil infertility and degradation problems in SSA. Consequently, crop yields and profitability are much lower than what is required to achieve food security and increased incomes.
A key reason for the outdated fertilizer recommendations and poor farmer knowledge regarding correct fertilizer use in SSA is that many of the extension and research systems are defunct or if they exist, they are under-staffed and under-equipped.
Page 15
1.4 Concluding Remarks
The establishment of well-functioning fertilizer markets in Africa will require the implementation of a set of appropriate policy, regulatory, institutional, and market development measures which will attract private sector investment and engagement by establishing a level playing field for all market actors while enabling government to ensure market access for poor farmers.
The key policy measures are: the establishment of a consistent and predictable price (subsidy) and trade (tariffs, taxes) policy; introduction of risk-sharing financial mechanisms to share risk among stakeholders thus increasing access of affordable finance for importers and agro dealers; investment in human capital development for farmers and the private sector, (marketing and technical skills); development and enforcement of fertilizer legislation and supporting the supporting regulatory framework.
On the demand side, measures should be implemented to improve the prices received by farmers and dramatically increase output market demand. Output market demand can be increased by scaling-up and replicating output markets on different fronts – out grower schemes, peri-urban agriculture, niche markets and non-traditional exports.
The prices received by farmers can be improved by promoting the development of producer associations, dissemination of market information, introduction and enforcement of grade and standards for quality produce, improved storage and agro-processing facilities and warehouse collateral to facilitate the purchase of agricultural produce at harvest time.
There is a need to educate farmers about the proper use of fertilizers and management practices. Extension systems should be revived, and redesigned and capacitated to reach the widely dispersed farming community in Africa. Farmers need to be educated about correct fertilizer use and improved agronomic practices through fertilizer trials, demonstrations and field days.
In addition, laboratories and facilities should be provided to enable soil analysis and testing to update the fertilizer recommendations and make them more appropriate to the different agro ecological zones and input and output market realities faced by farmers.
However, the key policy response which is of central interest to this training manual is the development of market information systems. Ministries of Agriculture need to establish and operate market information systems to provide information to importers, agro-dealers, farmers and policymakers about market conditions. This flow of information should be regular and timely, and the content should be accurate. In this way every market participant can have access to reliable information about prices, stocks and deliveries in various segments of national, regional and global markets, and use this information to make the right decisions.
Page 16
Chapter 2. Types, Definitions, Classification, and Uses
Learning Objectives
• Participants are expected to able to explain the difference between organic and inorganic fertilizers and why inorganic fertilizers take centre stage in analysis.
• Participants should be able to identify different types of fertilizers (Straight, Complex and Micronutrients) and their usefulness to crops.
• Participants should be able to calculate nutrients and nutrient ratios contained in a given Fertilizer product.
2.1 Defining Fertilizers and Nutrients
Fertilizers are manures, chemicals, and minerals that supply one or more essential plant nutrients. Application of fertilizers at the opportune time using correct quantities can ensure reasonable growth benefit to plants.
Fertilizers can be classified into two categories:
1. Organic fertilizers: These are obtained from living or once-living material such as animal waste (manure), crop residues (such as leaves), compost, and many other byproducts of living organisms.
2. Inorganic fertilizers (also called chemical or mineral fertilizers): The products are essentially originated from non-living sources through manmade processes. Most of the commercial fertilizers fall under this category.
2.1.1 Differences between Fertilizer Products and Nutrients
Fertilizer products refer to the types of fertilizers that deliver nutrients to the crops and some of them are those which can be identified through the use of HS codes. When bagged the product is given in terms of type as well as quantity. An example can be 50kg Ammonium Nitrate. A 50kg bag Ammonium Nitrate is the product in this case.
The product is silent in telling us the individual quantities of nutrients available in it. It (product) does not state the %ages of Nitrogen, Phosphorus or Potassium available. A product may contain one or more of the principal nutrients together with any other micronutrients including some non-fertilizer material. The non-fertilizer material may be sand or some such material used as a carrier for the nutrients. This would explain why the total mass of all nutrients in a given product may be different from the product mass.
Page 17
2.1.2 The building blocks of plant nutrients
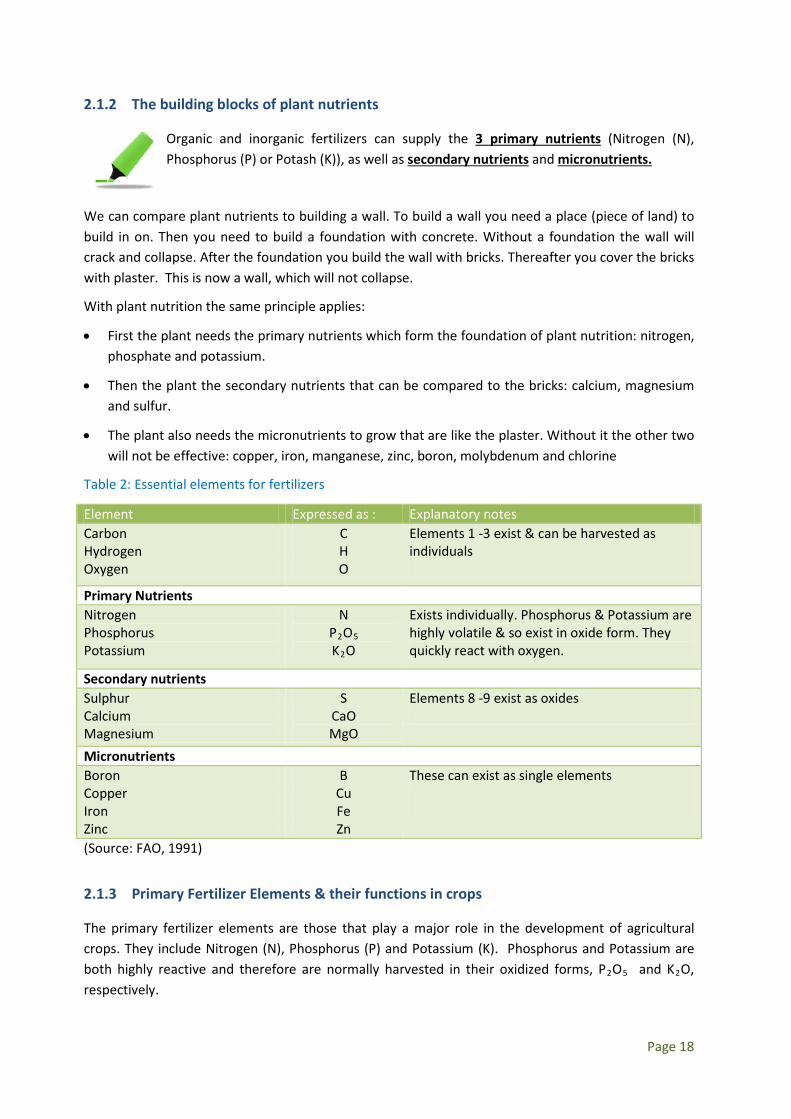
Organic and inorganic fertilizers can supply the 3 primary nutrients (Nitrogen (N), Phosphorus (P) or Potash (K)), as well as secondary nutrients and micronutrients.
We can compare plant nutrients to building a wall. To build a wall you need a place (piece of land) to build in on. Then you need to build a foundation with concrete. Without a foundation the wall will crack and collapse. After the foundation you build the wall with bricks. Thereafter you cover the bricks with plaster. This is now a wall, which will not collapse.
With plant nutrition the same principle applies:
• First the plant needs the primary nutrients which form the foundation of plant nutrition: nitrogen, phosphate and potassium.
• Then the plant the secondary nutrients that can be compared to the bricks: calcium, magnesium and sulfur.
• The plant also needs the micronutrients to grow that are like the plaster. Without it the other two will not be effective: copper, iron, manganese, zinc, boron, molybdenum and chlorine
Table 2: Essential elements for fertilizers
Element Expressed as : Explanatory notes Carbon Hydrogen Oxygen
C H O
Elements 1 -3 exist & can be harvested as individuals
Primary Nutrients Nitrogen Phosphorus Potassium
N P2O5 K2O
Exists individually. Phosphorus & Potassium are highly volatile & so exist in oxide form. They quickly react with oxygen.
Secondary nutrients Sulphur Calcium Magnesium
S CaO MgO
Elements 8 -9 exist as oxides
Micronutrients Boron Copper Iron Zinc
B Cu Fe Zn
These can exist as single elements
(Source: FAO, 1991)
2.1.3 Primary Fertilizer Elements & their functions in crops
The primary fertilizer elements are those that play a major role in the development of agricultural crops. They include Nitrogen (N), Phosphorus (P) and Potassium (K). Phosphorus and Potassium are both highly reactive and therefore are normally harvested in their oxidized forms, P2O5 and K2O, respectively.
Page 18
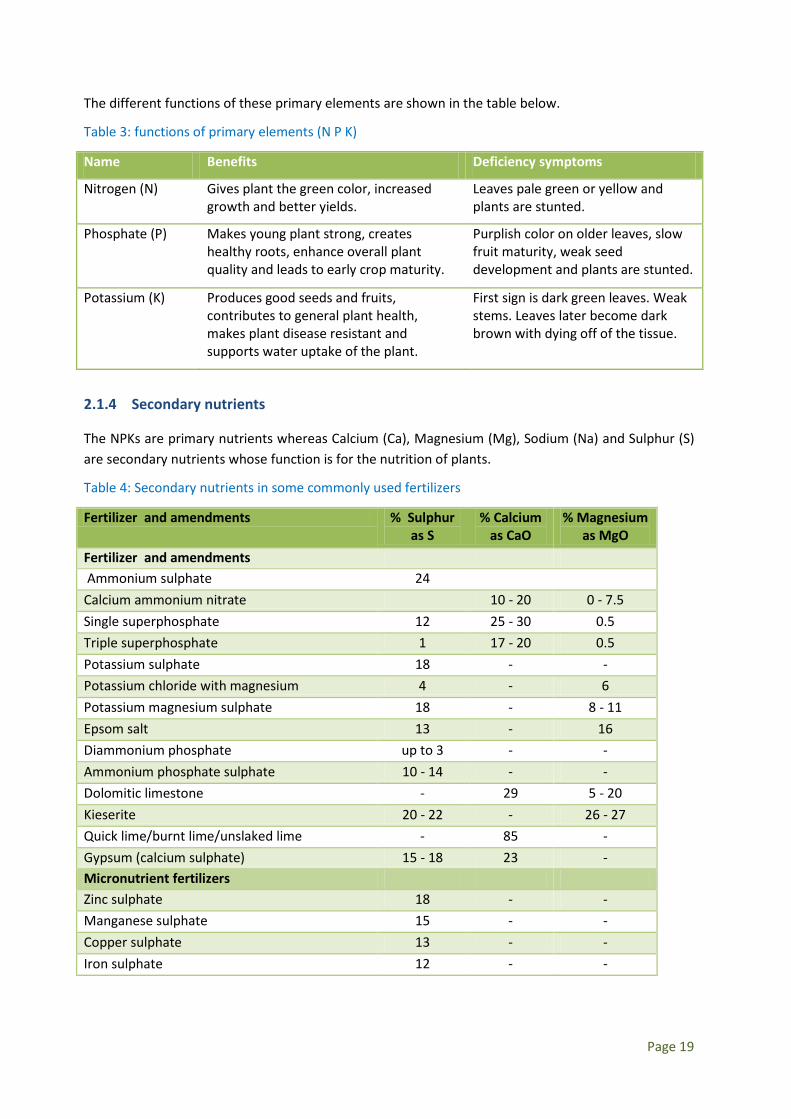
The different functions of these primary elements are shown in the table below.
Table 3: functions of primary elements (N P K)
Name Benefits Deficiency symptoms
Nitrogen (N) Gives plant the green color, increased growth and better yields.
Leaves pale green or yellow and plants are stunted.
Phosphate (P) Makes young plant strong, creates healthy roots, enhance overall plant quality and leads to early crop maturity.
Purplish color on older leaves, slow fruit maturity, weak seed development and plants are stunted.
Potassium (K) Produces good seeds and fruits, contributes to general plant health, makes plant disease resistant and supports water uptake of the plant.
First sign is dark green leaves. Weak stems. Leaves later become dark brown with dying off of the tissue.
2.1.4 Secondary nutrients
The NPKs are primary nutrients whereas Calcium (Ca), Magnesium (Mg), Sodium (Na) and Sulphur (S) are secondary nutrients whose function is for the nutrition of plants.
Table 4: Secondary nutrients in some commonly used fertilizers
Fertilizer and amendments % Sulphur as S
% Calcium as CaO
% Magnesium as MgO
Fertilizer and amendments Ammonium sulphate 24 Calcium ammonium nitrate 10 - 20 0 - 7.5 Single superphosphate 12 25 - 30 0.5 Triple superphosphate 1 17 - 20 0.5 Potassium sulphate 18 - - Potassium chloride with magnesium 4 - 6 Potassium magnesium sulphate 18 - 8 - 11 Epsom salt 13 - 16 Diammonium phosphate up to 3 - - Ammonium phosphate sulphate 10 - 14 - - Dolomitic limestone - 29 5 - 20 Kieserite 20 - 22 - 26 - 27 Quick lime/burnt lime/unslaked lime - 85 - Gypsum (calcium sulphate) 15 - 18 23 - Micronutrient fertilizers Zinc sulphate 18 - - Manganese sulphate 15 - - Copper sulphate 13 - - Iron sulphate 12 - -
Page 19
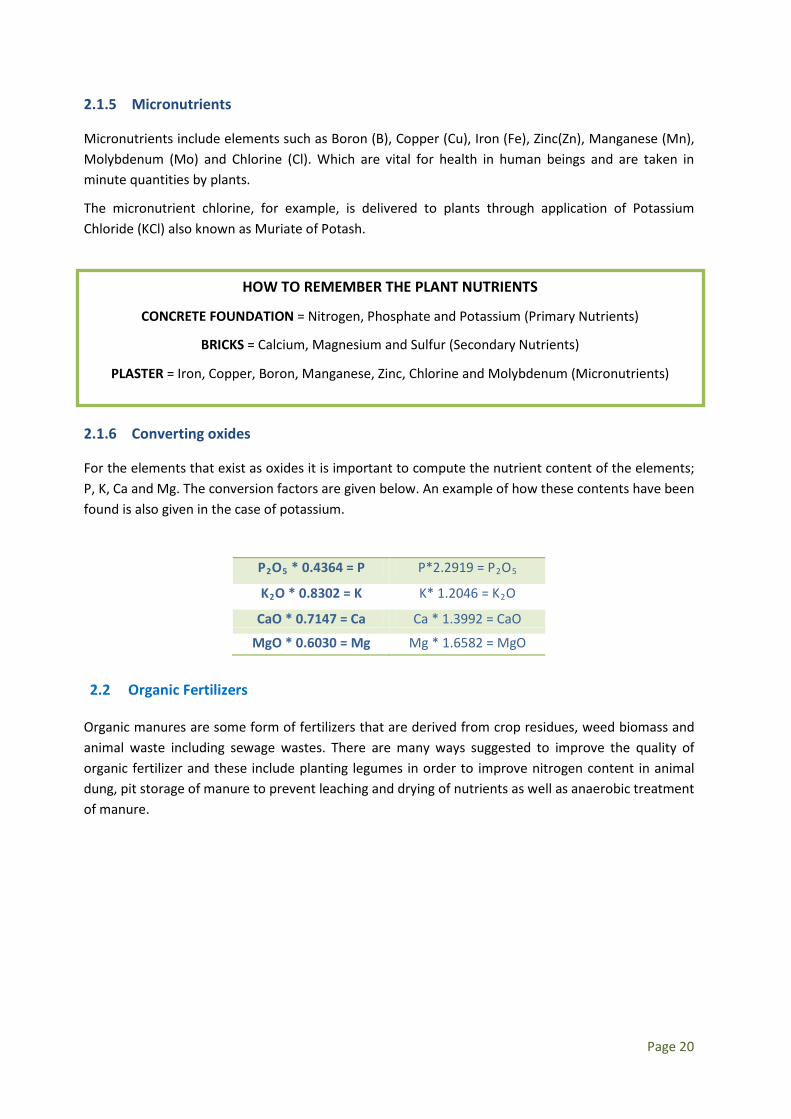
2.1.5 Micronutrients
Micronutrients include elements such as Boron (B), Copper (Cu), Iron (Fe), Zinc(Zn), Manganese (Mn), Molybdenum (Mo) and Chlorine (Cl). Which are vital for health in human beings and are taken in minute quantities by plants.
The micronutrient chlorine, for example, is delivered to plants through application of Potassium Chloride (KCl) also known as Muriate of Potash.
2.1.6 Converting oxides
For the elements that exist as oxides it is important to compute the nutrient content of the elements; P, K, Ca and Mg. The conversion factors are given below. An example of how these contents have been found is also given in the case of potassium.
P2O5 * 0.4364 = P P*2.2919 = P2O5
K2O * 0.8302 = K K* 1.2046 = K2O
CaO * 0.7147 = Ca Ca * 1.3992 = CaO
MgO * 0.6030 = Mg Mg * 1.6582 = MgO
2.2 Organic Fertilizers
Organic manures are some form of fertilizers that are derived from crop residues, weed biomass and animal waste including sewage wastes. There are many ways suggested to improve the quality of organic fertilizer and these include planting legumes in order to improve nitrogen content in animal dung, pit storage of manure to prevent leaching and drying of nutrients as well as anaerobic treatment of manure.
HOW TO REMEMBER THE PLANT NUTRIENTS
CONCRETE FOUNDATION = Nitrogen, Phosphate and Potassium (Primary Nutrients)
BRICKS = Calcium, Magnesium and Sulfur (Secondary Nutrients)
PLASTER = Iron, Copper, Boron, Manganese, Zinc, Chlorine and Molybdenum (Micronutrients)
Page 20
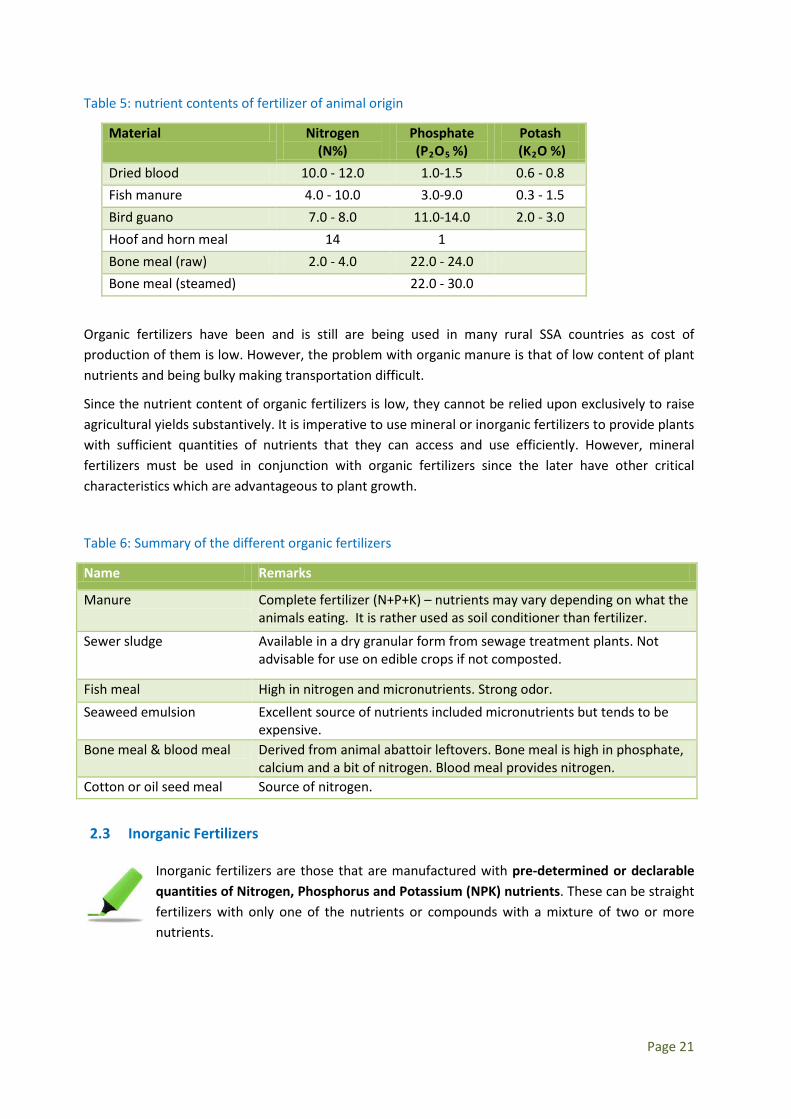
Table 5: nutrient contents of fertilizer of animal origin
Material Nitrogen (N%)
Phosphate (P2O5 %)
Potash (K2O %)
Dried blood 10.0 - 12.0 1.0-1.5 0.6 - 0.8 Fish manure 4.0 - 10.0 3.0-9.0 0.3 - 1.5 Bird guano 7.0 - 8.0 11.0-14.0 2.0 - 3.0 Hoof and horn meal 14 1 Bone meal (raw) 2.0 - 4.0 22.0 - 24.0 Bone meal (steamed) 22.0 - 30.0
Organic fertilizers have been and is still are being used in many rural SSA countries as cost of production of them is low. However, the problem with organic manure is that of low content of plant nutrients and being bulky making transportation difficult.
Since the nutrient content of organic fertilizers is low, they cannot be relied upon exclusively to raise agricultural yields substantively. It is imperative to use mineral or inorganic fertilizers to provide plants with sufficient quantities of nutrients that they can access and use efficiently. However, mineral fertilizers must be used in conjunction with organic fertilizers since the later have other critical characteristics which are advantageous to plant growth.
Table 6: Summary of the different organic fertilizers
Name Remarks
Manure Complete fertilizer (N+P+K) – nutrients may vary depending on what the animals eating. It is rather used as soil conditioner than fertilizer.
Sewer sludge Available in a dry granular form from sewage treatment plants. Not advisable for use on edible crops if not composted.
Fish meal High in nitrogen and micronutrients. Strong odor. Seaweed emulsion Excellent source of nutrients included micronutrients but tends to be
expensive. Bone meal & blood meal Derived from animal abattoir leftovers. Bone meal is high in phosphate,
calcium and a bit of nitrogen. Blood meal provides nitrogen. Cotton or oil seed meal Source of nitrogen.
2.3 Inorganic Fertilizers
Inorganic fertilizers are those that are manufactured with pre-determined or declarable quantities of Nitrogen, Phosphorus and Potassium (NPK) nutrients. These can be straight fertilizers with only one of the nutrients or compounds with a mixture of two or more nutrients.
Page 21
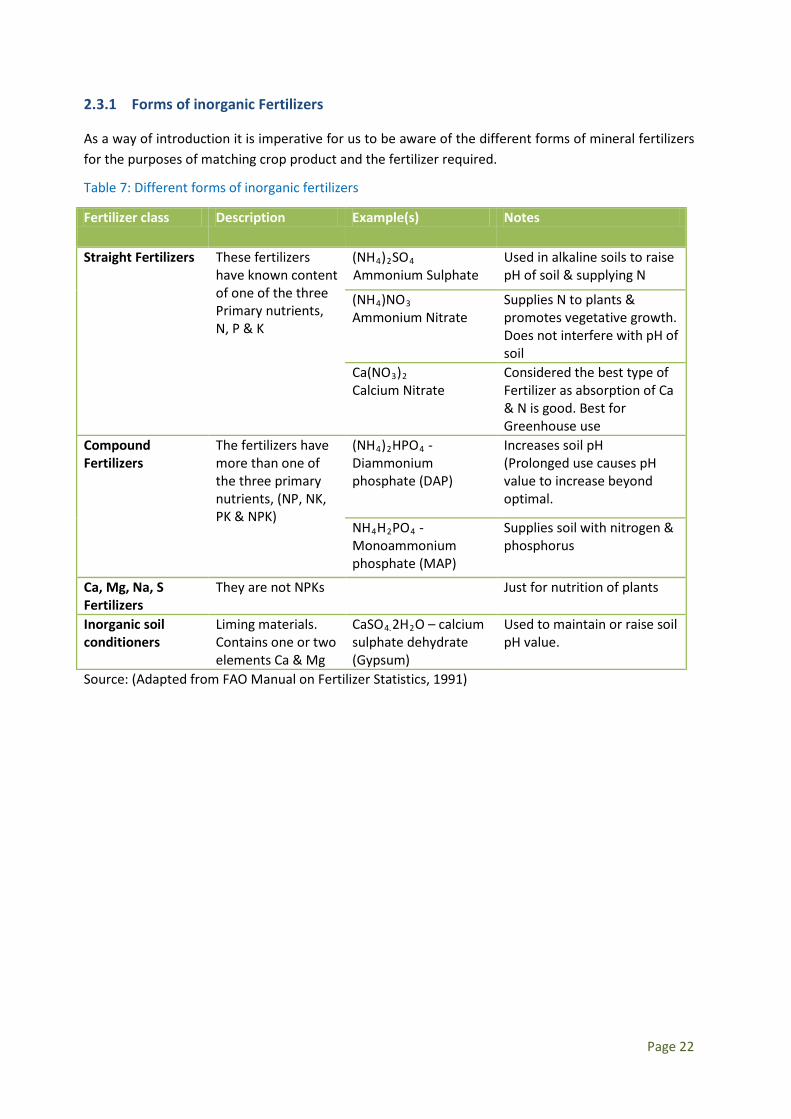
2.3.1 Forms of inorganic Fertilizers
As a way of introduction it is imperative for us to be aware of the different forms of mineral fertilizers for the purposes of matching crop product and the fertilizer required.
Table 7: Different forms of inorganic fertilizers
Fertilizer class Description Example(s) Notes
Straight Fertilizers These fertilizers have known content of one of the three Primary nutrients, N, P & K
(NH4)2SO4
Ammonium Sulphate Used in alkaline soils to raise pH of soil & supplying N
(NH4)NO3 Ammonium Nitrate
Supplies N to plants & promotes vegetative growth. Does not interfere with pH of soil
Ca(NO3)2 Calcium Nitrate
Considered the best type of Fertilizer as absorption of Ca & N is good. Best for Greenhouse use
Compound Fertilizers
The fertilizers have more than one of the three primary nutrients, (NP, NK, PK & NPK)
(NH4)2HPO4 - Diammonium phosphate (DAP)
Increases soil pH (Prolonged use causes pH value to increase beyond optimal.
NH4H2PO4 -Monoammonium phosphate (MAP)
Supplies soil with nitrogen & phosphorus
Ca, Mg, Na, S Fertilizers
They are not NPKs Just for nutrition of plants
Inorganic soil conditioners
Liming materials. Contains one or two elements Ca & Mg
CaSO4.2H2O – calcium sulphate dehydrate (Gypsum)
Used to maintain or raise soil pH value.
Source: (Adapted from FAO Manual on Fertilizer Statistics, 1991)
Page 22
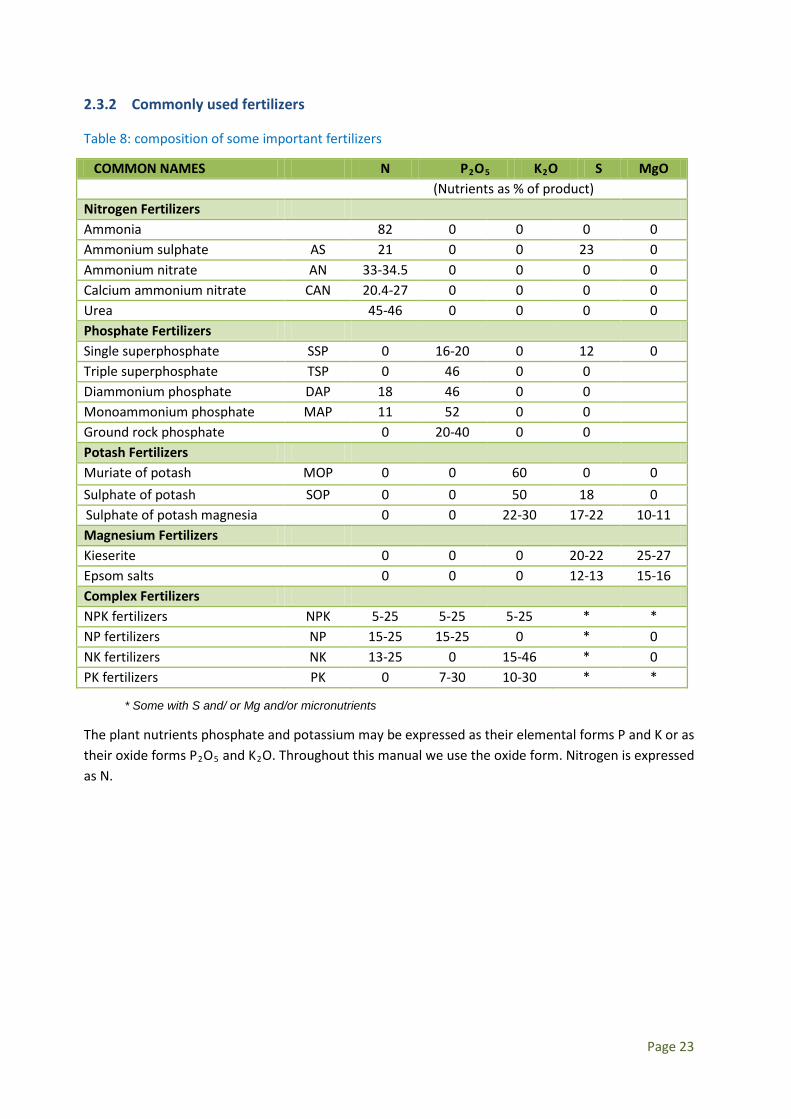
2.3.2 Commonly used fertilizers
Table 8: composition of some important fertilizers
COMMON NAMES N P2O5 K2O S MgO (Nutrients as % of product) Nitrogen Fertilizers Ammonia 82 0 0 0 0 Ammonium sulphate AS 21 0 0 23 0 Ammonium nitrate AN 33-34.5 0 0 0 0 Calcium ammonium nitrate CAN 20.4-27 0 0 0 0 Urea 45-46 0 0 0 0 Phosphate Fertilizers Single superphosphate SSP 0 16-20 0 12 0 Triple superphosphate TSP 0 46 0 0 Diammonium phosphate DAP 18 46 0 0 Monoammonium phosphate MAP 11 52 0 0 Ground rock phosphate 0 20-40 0 0 Potash Fertilizers Muriate of potash MOP 0 0 60 0 0 Sulphate of potash SOP 0 0 50 18 0
Sulphate of potash magnesia 0 0 22-30 17-22 10-11 Magnesium Fertilizers Kieserite 0 0 0 20-22 25-27 Epsom salts 0 0 0 12-13 15-16 Complex Fertilizers NPK fertilizers NPK 5-25 5-25 5-25 * * NP fertilizers NP 15-25 15-25 0 * 0 NK fertilizers NK 13-25 0 15-46 * 0 PK fertilizers PK 0 7-30 10-30 * *
The plant nutrients phosphate and potassium may be expressed as their elemental forms P and K or as their oxide forms P2O5 and K2O. Throughout this manual we use the oxide form. Nitrogen is expressed as N.
* Some with S and/ or Mg and/or micronutrients
Page 23
2.4 Classification of fertilizers (HS codes)
What is the Harmonized System?
HS stands for Harmonized Commodity Description and Coding System. The HS is the international standard for reporting goods to customs and other government agencies. It is a numeric language that is used by more than 180 countries worldwide, and almost 100% of international trade. The HS was created and is administered by the Brussels-based World Customs Organization (WCO).
What are HS Codes?
HS codes are the language of international trade. Every commodity that enters crosses an international border must be declared to customs by means of a specific Harmonized System code. Among other uses, these numerical codes are used to calculate and assess duties and taxes, determine import and export admissibility, and conduct risk assessment and targeting. The first 6 digits of the HS are used universally. Each country may then add to the original 6 to suit its own tariff and statistical needs, creating 8, 10, and sometimes 12 digit national codes.
Country-specific modifications of fertilizers
Slight modifications of imported fertilizers by countries do occur resulting in country-specific names for such products. An example could be Compound D fertilizer in Malawi. This fertilizer is an NPK 8-18-15 +6s +0.1B type of fertilizer with additions of Sulphur and Boron. Compound D fertilizers are a group of NPKs with slight variations and mostly used for cereals. The analogue of this can be found in various petroleum products in which unleaded petrol is slightly different from one garage to the other in terms of content.
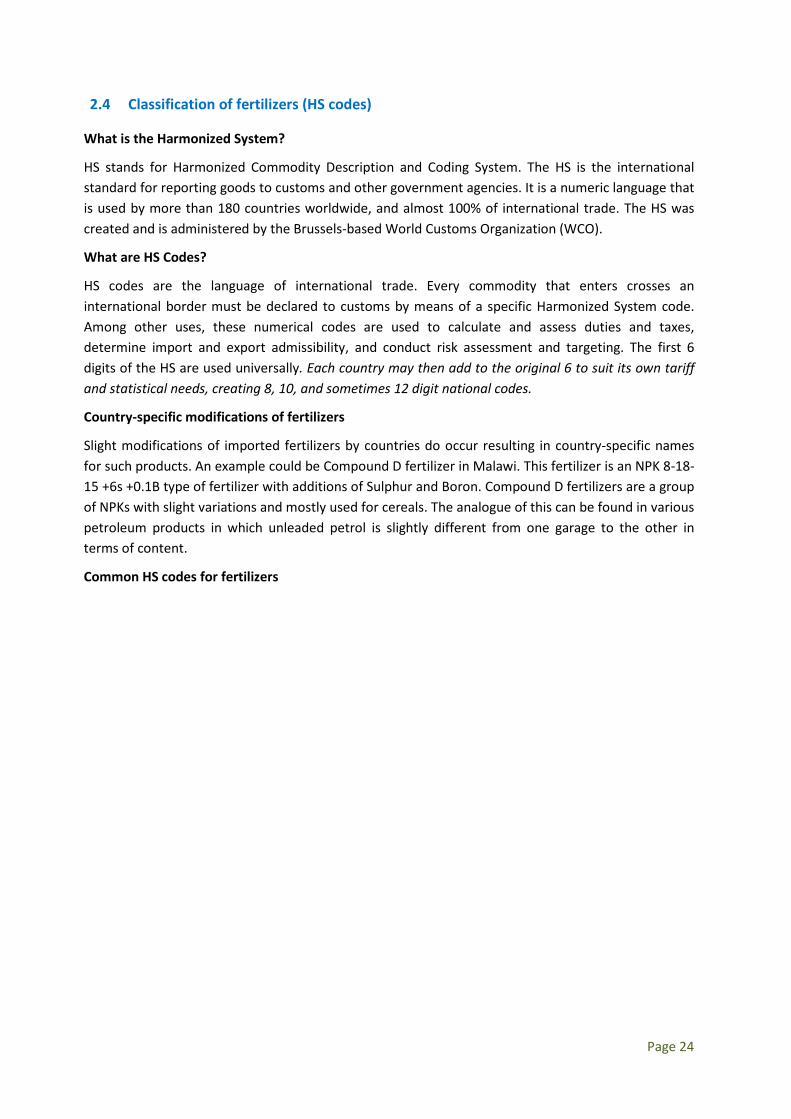
Common HS codes for fertilizers
Page 24
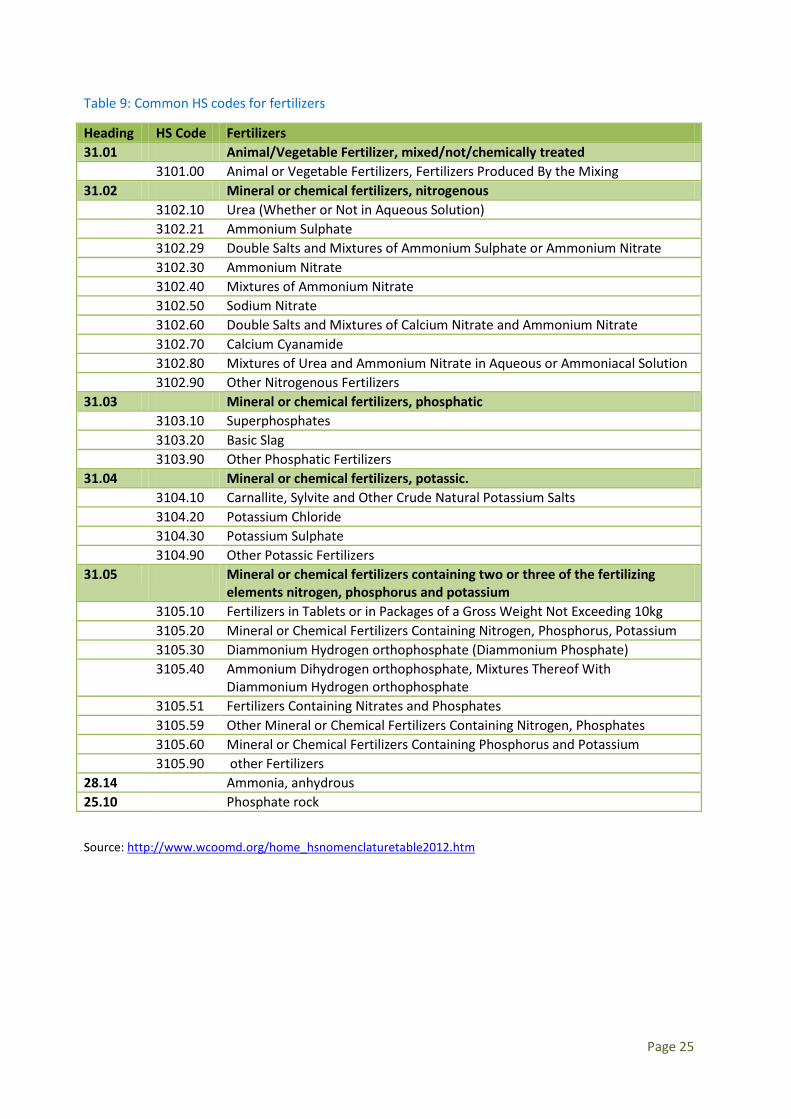
Table 9: Common HS codes for fertilizers
Heading HS Code Fertilizers 31.01 Animal/Vegetable Fertilizer, mixed/not/chemically treated 3101.00 Animal or Vegetable Fertilizers, Fertilizers Produced By the Mixing 31.02 Mineral or chemical fertilizers, nitrogenous 3102.10 Urea (Whether or Not in Aqueous Solution) 3102.21 Ammonium Sulphate 3102.29 Double Salts and Mixtures of Ammonium Sulphate or Ammonium Nitrate 3102.30 Ammonium Nitrate 3102.40 Mixtures of Ammonium Nitrate 3102.50 Sodium Nitrate 3102.60 Double Salts and Mixtures of Calcium Nitrate and Ammonium Nitrate 3102.70 Calcium Cyanamide 3102.80 Mixtures of Urea and Ammonium Nitrate in Aqueous or Ammoniacal Solution 3102.90 Other Nitrogenous Fertilizers 31.03 Mineral or chemical fertilizers, phosphatic 3103.10 Superphosphates 3103.20 Basic Slag 3103.90 Other Phosphatic Fertilizers 31.04 Mineral or chemical fertilizers, potassic. 3104.10 Carnallite, Sylvite and Other Crude Natural Potassium Salts 3104.20 Potassium Chloride 3104.30 Potassium Sulphate 3104.90 Other Potassic Fertilizers 31.05 Mineral or chemical fertilizers containing two or three of the fertilizing
elements nitrogen, phosphorus and potassium 3105.10 Fertilizers in Tablets or in Packages of a Gross Weight Not Exceeding 10kg 3105.20 Mineral or Chemical Fertilizers Containing Nitrogen, Phosphorus, Potassium 3105.30 Diammonium Hydrogen orthophosphate (Diammonium Phosphate) 3105.40 Ammonium Dihydrogen orthophosphate, Mixtures Thereof With
Diammonium Hydrogen orthophosphate 3105.51 Fertilizers Containing Nitrates and Phosphates 3105.59 Other Mineral or Chemical Fertilizers Containing Nitrogen, Phosphates 3105.60 Mineral or Chemical Fertilizers Containing Phosphorus and Potassium 3105.90 other Fertilizers 28.14 Ammonia, anhydrous 25.10 Phosphate rock
Source: http://www.wcoomd.org/home_hsnomenclaturetable2012.htm
Page 25
2.5 Converting fertilizer products in nutrients
2.5.1 Computation of Nutrient content for Fertilizers in General
It is of utmost importance to know the content of each nutrient in a given fertilizer. This is important for the purpose of applying the right amount in order to optimize on harvesting. Incorrect use may result in undesirable outcomes that include over-fertilization or underuse of the product.
2.5.1.1 The nutrient content analogue in the real world
The computation for nutrient content for Fertilizers is about calculating the content of N, P and K available in a given fertilizer which may be a straight or compound fertilizer.
By way of formula, if you are given X kg of a Fertilizer and that Z% of it is Nitrogen then the nitrogen content is computed as follows:
Amount of Nitrogen in the fertilizer (kilograms) = XZ *100
(kg)
Example 1: if one has 200 metric tons (200, 000kg) of Ammonium nitrate and that it contains 21% of
Nitrogen, then the Nitrogen nutrient in the fertilizer is kg000,42000,200*10021
= .
Example 2: f a 50kg bag of Ammonium Nitrate contains 21% Nitrogen,
then Nitrogen content = kg5.1050*10021
=
2.5.2 Fertilizer Grade (Analysis)
The grade of a fertilizer refers to the guaranteed minimum %age(s) of the nutrients it has and is expressed for N, P, and K (and if more when secondary micronutrients are known).
• Nitrogen concentration in Ammonium Nitrate is 21% (21-0-0) and therefore 100kg of Ammonium Nitrate contains 21kg of Nitrogen.
• Similarly, Diammonium phosphate (DAP) contains 18% N, 46% P2O5 and so the grade for Diammonium phosphate is 18-46-0.
Generally a compound that contains α% N, β% P and µ% K is graded α-β -µ.
Some common examples are NPK 17 17 17, NPK 15 15 15, NPK 20 20 0.
Page 26
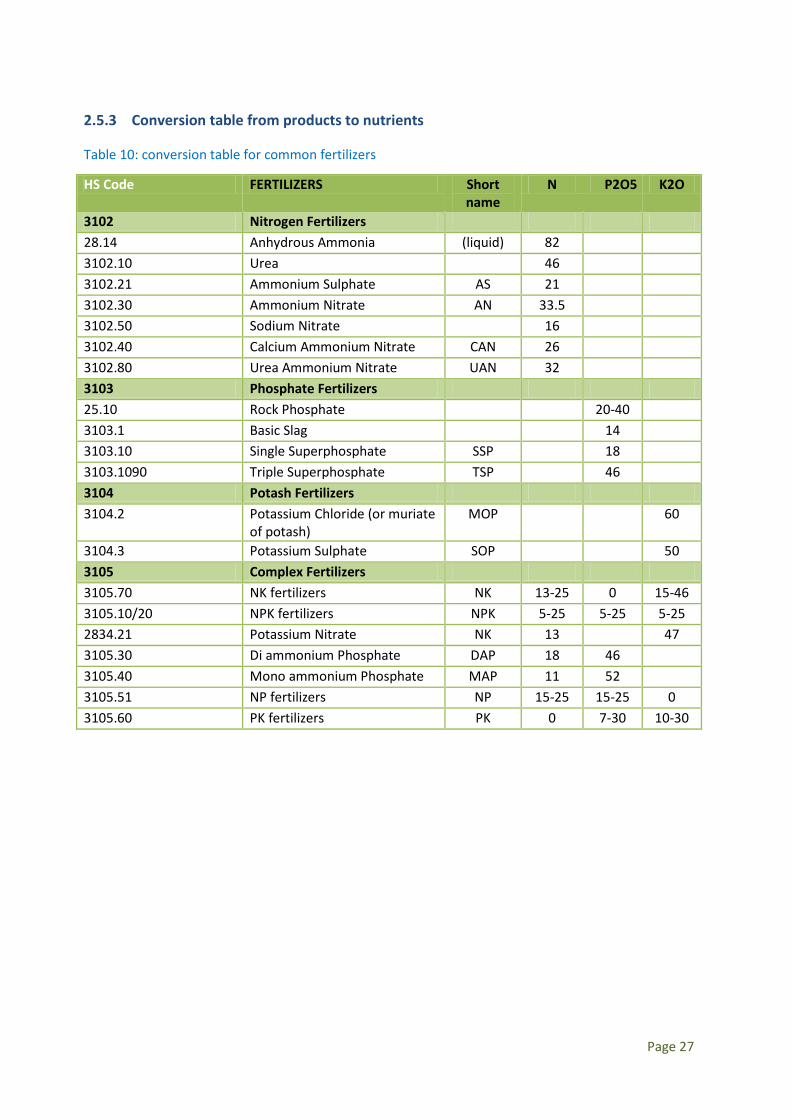
2.5.3 Conversion table from products to nutrients
Table 10: conversion table for common fertilizers
HS Code FERTILIZERS Short name
N P2O5 K2O
3102 Nitrogen Fertilizers 28.14 Anhydrous Ammonia (liquid) 82 3102.10 Urea 46 3102.21 Ammonium Sulphate AS 21 3102.30 Ammonium Nitrate AN 33.5 3102.50 Sodium Nitrate 16 3102.40 Calcium Ammonium Nitrate CAN 26 3102.80 Urea Ammonium Nitrate UAN 32 3103 Phosphate Fertilizers 25.10 Rock Phosphate 20-40 3103.1 Basic Slag 14 3103.10 Single Superphosphate SSP 18 3103.1090 Triple Superphosphate TSP 46 3104 Potash Fertilizers 3104.2 Potassium Chloride (or muriate
of potash) MOP 60
3104.3 Potassium Sulphate SOP 50 3105 Complex Fertilizers 3105.70 NK fertilizers NK 13-25 0 15-46 3105.10/20 NPK fertilizers NPK 5-25 5-25 5-25 2834.21 Potassium Nitrate NK 13 47 3105.30 Di ammonium Phosphate DAP 18 46 3105.40 Mono ammonium Phosphate MAP 11 52 3105.51 NP fertilizers NP 15-25 15-25 0 3105.60 PK fertilizers PK 0 7-30 10-30
Page 27
Fertilizer Definitions - Highlights
• Fertilizers are manures, chemicals or minerals that deliver nutrients to plants.
• Fertilizers can be organic or inorganic in nature.
• Inorganic fertilizers have declarable quantities.
• Fertilizers contain one or more of the primary nutrients N (nitrogen), P (phosphate) or K (potash) and in some cases secondary nutrients and micronutrients.
• Straight fertilizers contain only one primary nutrient; compound fertilizers are a mixture of 2 or more primary nutrients
• It is important to know and calculate the nutrient concentration in a given fertilizer. Fertilizer products are converted into nutrient contents for statistical uses.
• The HS codes are used to identify fertilizers and are grouped under class 31.
• HS codes are very useful when receiving products at the customs offices at the port of entry.
Quiz
1. What is the difference between organic and inorganic fertilizers
2. Give one example of primary fertilizer, secondary fertilizer and micronutrient
3. Given a 50kg bag of an NPK fertilizer with the following specifications NPK 23-10-5
(i) Calculate fertilizer nutrient quantities
(ii) Give the HS code for the fertilizer mentioned above.
Page 28
Chapter 3. Fertilizer “hard data”: Production, Trade, Consumption, and Price Variables
Chapter Learning Objectives
• Participants should be able to explain the important Agricultural Variables such as Fertilizer production, Fertilizer Imports, Fertilizer Exports and Fertilizer Consumption
• Participants should be able to collate and compile statistics using various templates used by FAO, IFA and CountrySTAT
o Production
o Imports and exports
o Consumption
o Prices
The focus of this chapter is on variables for which we collect purely quantitative data – so called ‘Hard’ data. ‘Hard’ data is quantitative data collected for variables such as production, consumption, prices, trade volumes and subsidies. It is largely inspired by the FAO manual on fertilizer statistics (1991).
3.1 Hard Data Variables
The ‘Hard’ data Fertilizer variables consist of the following:
Fertilizer Production
Fertilizer Production is the actual making or manufacturing of fertilizer from raw materials. In some cases the so-called raw materials may be straight fertilizers being used to make compound fertilizers.
Fertilizer Trade (Imports & Exports)
Importation of fertilizer is the deliveries of these products from abroad in order to ensure adequate supply of fertilizers for the farmers. Exports of fertilizer take place when we either export part of the fertilizer we produce or re-exportation of fertilizer products in transit. Exports of fertilizer products does not always mean we have excess of the product but that we may be fulfilling some bilateral trade arrangements we may be having with our trading partners.
Fertilizer Consumption (Fertilizer utilization)
Fertlizer consumption refers to the actual use of the products on crops. This variable is difficult to get and so we use its proxy which is the apparent consumption obtained through the use of the Fertilizer Resource Utilization Account (FRUA)
Page 29
Non-fertilizer use
Non-Fertilizer use is use of fertilizer derivatives to make pesticides or some other unwelcome uses such as manufacturing bombs.
Fertilizer Prices
Fertilizer prices are crucial as they have a huge influence on the demand and hence consumption of fertilizer.
All the above variables are connected to each other through the Fertilizer Resource Utilization Account (FRUA) given below.
3.2 Fertilizer Resource Utilization Account (FRUA)
The FRUA simply shows a summary of the important agricultural variables like Production, Trade (Imports & Exports), Non-Fertilizer use and Consumption for the NPKs. The FRUA ensures that all the values of the data are accounted for by way of an ‘accounting’ equation.
As given in the FAOSTAT (2011) document:
Production (P) + Imports (M) – Exports (X) – Non-Fertilizer use (NF) = Consumption (C)
P + M – X –NF = C
The Non Fertilizer Use (NF) figure may be zero if all fertilizers available are for crop production. The accounting equation means that we can get either Production or Consumption as residuals when supplied with other data. The residual production or consumption figures are known respectively as Apparent Production and Apparent Consumption.
3.3 Importance of Hard Data
Having such hard data helps all the fertilizer actors to: • Financially plan ahead of the season • Timeouts ordering of fertilizers by traders • Forecast future needs of inputs • Intelligent purchasing by farmers • Policy making • Implementation of subsidy programs
Chapter Highlights
• The Fertilizer Resource Utilization Account (FRUA) can be used to find apparent Consumption (C) given production (P), trade volumes [exports (X) & Imports (M)] and non-fertilizer use amount on Fertilizer (NF).
• P + M – X – NF = C
Page 30

3.4 Fertilizer production
3.4.1 Production of fertilizers: avoiding double counting
Clear definitions of the kind of producer help to avoid problems of the double counting of nutrients.
Primary producers are those who use feedstocks, raw materials and/or intermediates to produce finished fertilizers.
Feedstocks is a term that refers to the main raw materials used in the manufacture of a product. In the case of fertilizers the main raw materials are Nitrogen (N), Potassium Oxide (K2O) and Phosphorus Pentoxide (P2O5).
Secondary producers are those who use finished fertilizer materials to produce other fertilizers.
Only the production of the primary producers should be included in the production data, otherwise the same material will be counted twice (double counted).
Straight fertilizers and ammonium phosphate, domestically produced and imported, are often used to manufacture other fertilizers. It is important that the production statistics should not include these products twice, both as straights and then again as the compounds from which they are produced.
Urea, for example, is sometimes used to produce or enrich grades of compound fertilizers. The urea may be produced by the manufacturer, imported or procured from other domestic urea manufacturers. A manufacturer tends to measure his total production of N including the contribution from urea. The quantity of urea (from either own production or an external supply) so used should not, in fact, be included when reporting the total N produced by the manufacturer. Otherwise it is double counted.
Gross production is defined as the production of all fertilizers produced in a country from feedstocks, intermediates, raw materials or from other finished fertilizers, whether these are home produced or imported.
Net production comprises production from feedstocks, raw materials or intermediates, whether produced locally or imported, but excluding products manufactured from other fertilizers. It is the net production figure which should be used for statistical reporting purposes.
It is recommended that the production figures of the straight fertilizers and the ammonium phosphates should relate to their total production, whether they are sold as such or are further processed to make compounds and, of course, that the production statistics for compound fertilizers should not include these quantities.
Compound fertilizers produced from imported straight fertilizers or ammonium phosphate, should also not be included in the production figures.
3.4.2 Other production data
Production Capacities
Page 31
Information on the production capacities of domestic plants should be assembled at least once a year by the central agency. Proposals for new production capacities and for the expansion of existing capacities should also be recorded.
Secondary manufacturers
Although the production and deliveries of the secondary producers should not be included in the national statistics, because of double-counting, it may be desirable to assemble separate information on the production and deliveries of the secondary producers if the mixtures or blends they manufacture play an important role in the national fertilizer market.
The production of raw materials and intermediates
It will normally be necessary to record also the production of the major raw materials and intermediates, i.e. ammonia, phosphate rock (by grade), phosphoric acid, and sulfur.
Ammonia and phosphoric acid purchased from outside sources should evidently be excluded from the national production figures of these materials.
In practice, it is difficult to differentiate between quantities of raw materials and intermediates intended for fertilizer use, and quantities intended for non-fertilizer use.
3.4.3 Production tables from the primary manufacturers
Normally production and related statistics are assembled by a governmental coordinating agency, which:
• collects data from the primary manufacturers on behalf of the Government, • keeps a cumulative record, • issues a consolidated report, recording the situation at a national level.
A specimen reporting form for manufacturers, monthly production, delivery and stock statistics is given in the table below. In most countries, the deliveries will need to be broken down by region. This information can be given in a separate table.
Page 32
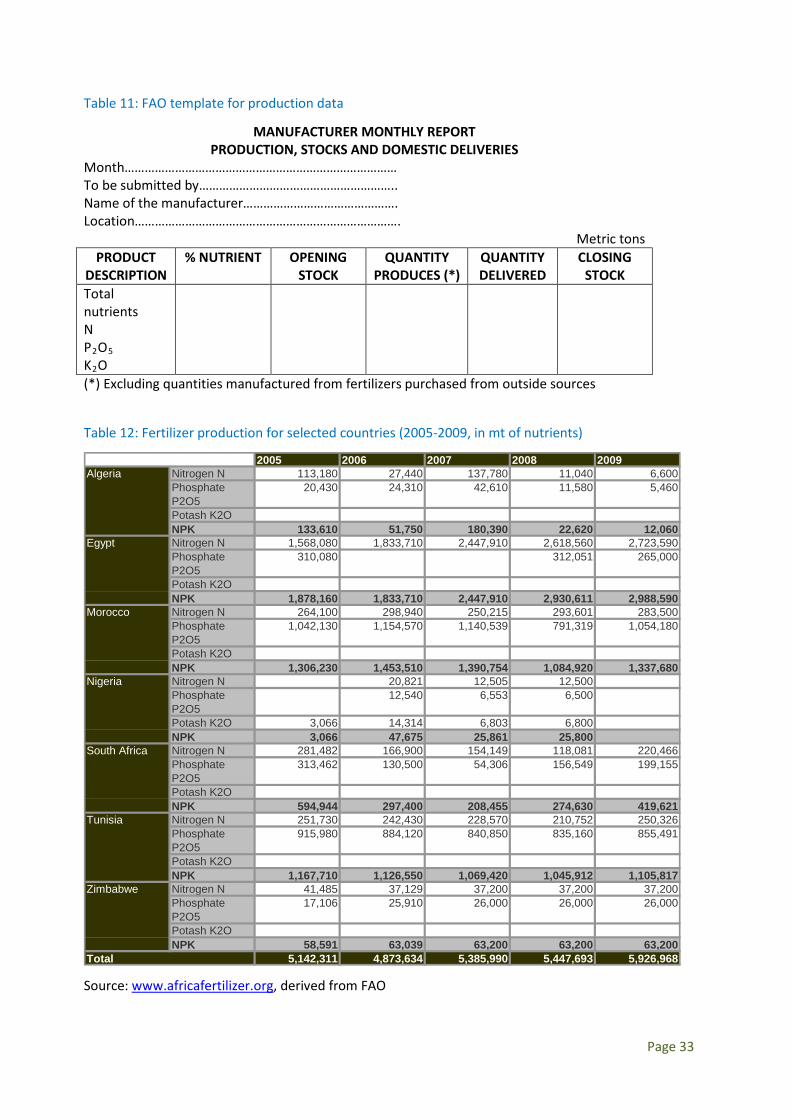
Table 11: FAO template for production data
MANUFACTURER MONTHLY REPORT PRODUCTION, STOCKS AND DOMESTIC DELIVERIES
Month……………………………………………………………………… To be submitted by………………………………………………….. Name of the manufacturer………………………………………. Location…………………………………………………………………….
Metric tons PRODUCT
DESCRIPTION % NUTRIENT OPENING
STOCK QUANTITY
PRODUCES (*) QUANTITY DELIVERED
CLOSING STOCK
Total nutrients N P2O5
K2O
(*) Excluding quantities manufactured from fertilizers purchased from outside sources
Table 12: Fertilizer production for selected countries (2005-2009, in mt of nutrients)
2005 2006 2007 2008 2009Nitrogen N 113,180 27,440 137,780 11,040 6,600Phosphate P2O5
20,430 24,310 42,610 11,580 5,460
Potash K2ONPK 133,610 51,750 180,390 22,620 12,060Nitrogen N 1,568,080 1,833,710 2,447,910 2,618,560 2,723,590Phosphate P2O5
310,080 312,051 265,000
Potash K2ONPK 1,878,160 1,833,710 2,447,910 2,930,611 2,988,590Nitrogen N 264,100 298,940 250,215 293,601 283,500Phosphate P2O5
1,042,130 1,154,570 1,140,539 791,319 1,054,180
Potash K2ONPK 1,306,230 1,453,510 1,390,754 1,084,920 1,337,680Nitrogen N 20,821 12,505 12,500Phosphate P2O5
12,540 6,553 6,500
Potash K2O 3,066 14,314 6,803 6,800NPK 3,066 47,675 25,861 25,800Nitrogen N 281,482 166,900 154,149 118,081 220,466Phosphate P2O5
313,462 130,500 54,306 156,549 199,155
Potash K2ONPK 594,944 297,400 208,455 274,630 419,621Nitrogen N 251,730 242,430 228,570 210,752 250,326Phosphate P2O5
915,980 884,120 840,850 835,160 855,491
Potash K2ONPK 1,167,710 1,126,550 1,069,420 1,045,912 1,105,817Nitrogen N 41,485 37,129 37,200 37,200 37,200Phosphate P2O5
17,106 25,910 26,000 26,000 26,000
Potash K2ONPK 58,591 63,039 63,200 63,200 63,200
5,142,311 4,873,634 5,385,990 5,447,693 5,926,968
Morocco
Nigeria
South Africa
Tunisia
Zimbabwe
Total
Algeria
Egypt
Source: www.africafertilizer.org, derived from FAO
Page 33
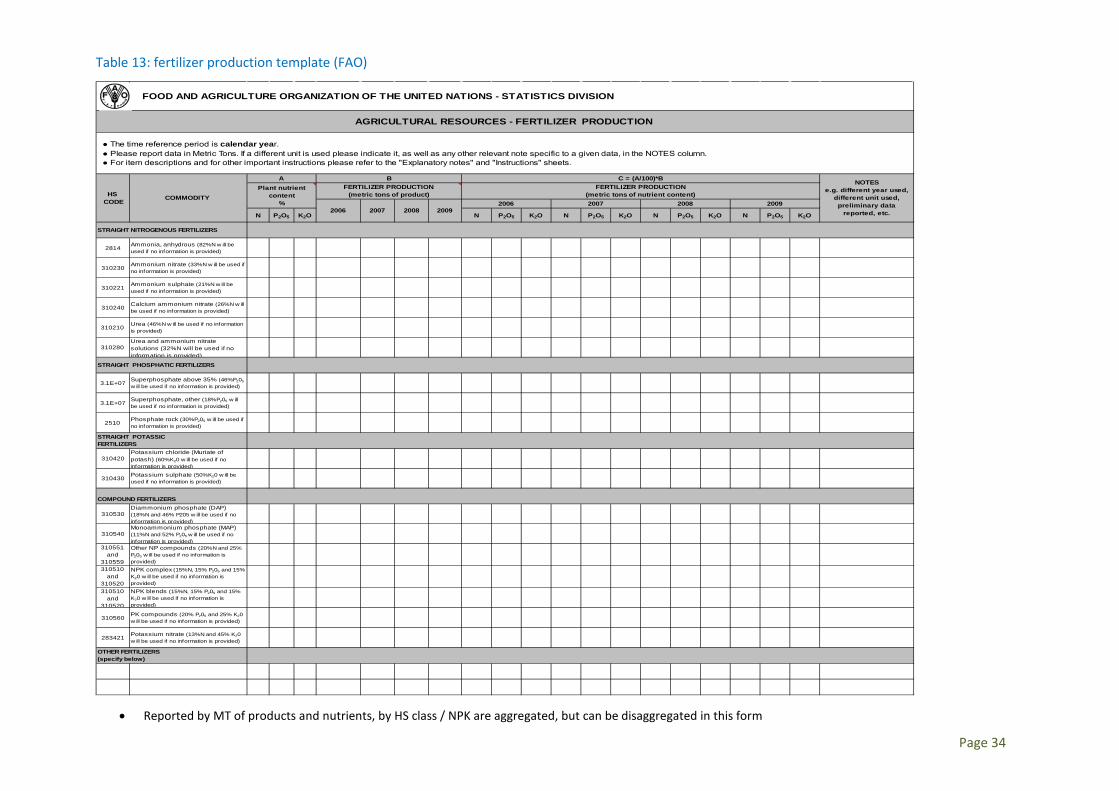
Table 13: fertilizer production template (FAO)
N P2O5 K2O N P2O5 K2O N P2O5 K2O N P2O5 K2O N P2O5 K2O
2814 Ammonia, anhydrous (82%N w ill be used if no information is provided)
310230 Ammonium nitrate (33%N w ill be used if no information is provided)
310221 Ammonium sulphate (21%N w ill be used if no information is provided)
310240 Calcium ammonium nitrate (26%N w ill be used if no information is provided)
310210 Urea (46%N w ill be used if no information is provided)
310280Urea and ammonium nitrate solutions (32%N will be used if no information is provided)
3.1E+07 Superphosphate above 35% (46%P205
w ill be used if no information is provided)
3.1E+07 Superphosphate, other (18%P205 w ill be used if no information is provided)
2510 Phosphate rock (30%P205 w ill be used if no information is provided)
310420Potassium chloride (Muriate of potash) (60%K20 w ill be used if no information is provided)
310430 Potassium sulphate (50%K20 w ill be used if no information is provided)
310530Diammonium phosphate (DAP) (18%N and 46% P205 w ill be used if no information is provided)
310540Monoammonium phosphate (MAP) (11%N and 52% P205 w ill be used if no information is provided)
310551 and
310559
Other NP compounds (20%N and 25% P205 w ill be used if no information is provided)
310510 and
310520
NPK complex (15%N, 15% P205 and 15% K20 w ill be used if no information is provided)
310510 and
310520
NPK blends (15%N, 15% P205 and 15% K20 w ill be used if no information is provided)
310560 PK compounds (20% P205 and 25% K20 w ill be used if no information is provided)
283421 Potassium nitrate (13%N and 45% K20 w ill be used if no information is provided)
OTHER FERTILIZERS (specify below)
STRAIGHT NITROGENOUS FERTILIZERS
STRAIGHT PHOSPHATIC FERTILIZERS
STRAIGHT POTASSICFERTILIZERS
COMPOUND FERTILIZERS
20072006 2007 2008 2009
FOOD AND AGRICULTURE ORGANIZATION OF THE UNITED NATIONS - STATISTICS DIVISION
AGRICULTURAL RESOURCES - FERTILIZER PRODUCTION
● The time reference period is calendar year. ● Please report data in Metric Tons. If a different unit is used please indicate it, as well as any other relevant note specific to a given data, in the NOTES column. ● For item descriptions and for other important instructions please refer to the "Explanatory notes" and "Instructions" sheets.
HS CODE COMMODITY
A B C = (A/100)*B NOTESe.g. different year used,
different unit used, preliminary data
reported, etc.
Plant nutrientcontent
%
FERTILIZER PRODUCTION(metric tons of product)
FERTILIZER PRODUCTION(metric tons of nutrient content)
2006 2008 2009
• Reported by MT of products and nutrients, by HS class / NPK are aggregated, but can be disaggregated in this form
Page 34
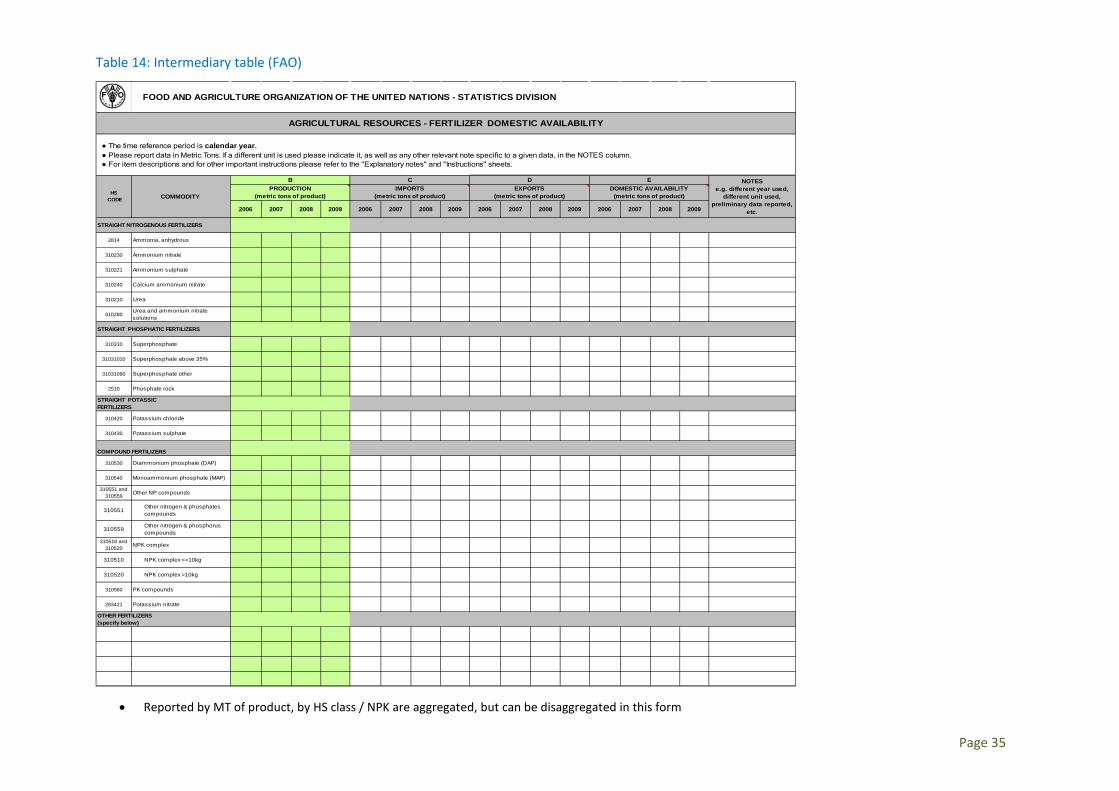
Table 14: Intermediary table (FAO)
2814 Ammonia, anhydrous
310230 Ammonium nitrate
310221 Ammonium sulphate
310240 Calcium ammonium nitrate
310210 Urea
310280Urea and ammonium nitrate solutions
310310 Superphosphate
31031010 Superphosphate above 35%
31031090 Superphosphate other
2510 Phosphate rock
310420 Potassium chloride
310430 Potassium sulphate
310530 Diammonium phosphate (DAP)
310540 Monoammonium phosphate (MAP)
310551 and 310559 Other NP compounds
310551 Other nitrogen & phosphates compounds
310559 Other nitrogen & phosphorus compounds
310510 and 310520 NPK complex
310510 NPK complex <=10kg
310520 NPK complex >10kg
310560 PK compounds
283421 Potassium nitrate
2006
OTHER FERTILIZERS (specify below)
STRAIGHT NITROGENOUS FERTILIZERS
STRAIGHT PHOSPHATIC FERTILIZERS
STRAIGHT POTASSIC FERTILIZERS
COMPOUND FERTILIZERS
FOOD AND AGRICULTURE ORGANIZATION OF THE UNITED NATIONS - STATISTICS DIVISION
AGRICULTURAL RESOURCES - FERTILIZER DOMESTIC AVAILABILITY
● The time reference period is calendar year. ● Please report data in Metric Tons. If a different unit is used please indicate it, as well as any other relevant note specific to a given data, in the NOTES column. ● For item descriptions and for other important instructions please refer to the "Explanatory notes" and "Instructions" sheets.
HS CODE COMMODITY
B C D
2006 2007 2008 2009
PRODUCTION(metric tons of product)
IMPORTS(metric tons of product)
2007 2008
E NOTESe.g. different year used,
different unit used, preliminary data reported,
etc.
EXPORTS(metric tons of product)
DOMESTIC AVAILABILITY(metric tons of product)
20092006 2007 2008 2009 2006 2007 2008 2009
• Reported by MT of product, by HS class / NPK are aggregated, but can be disaggregated in this form
Page 35
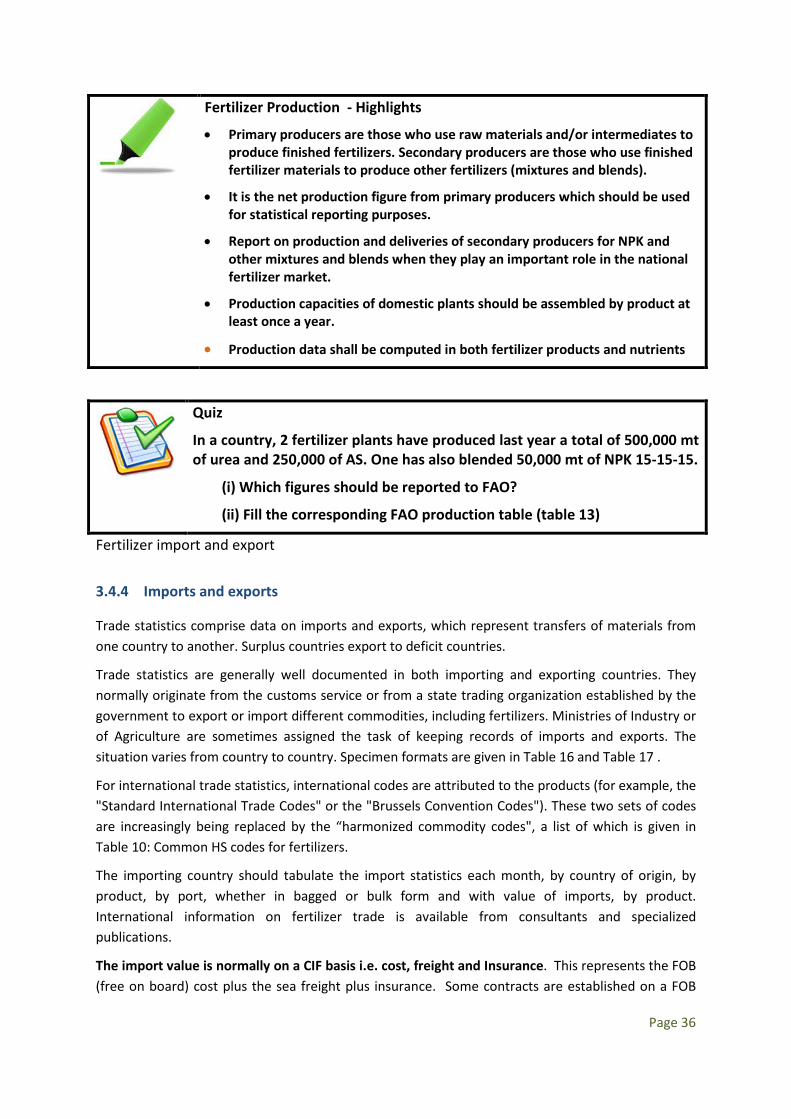
Fertilizer Production - Highlights
• Primary producers are those who use raw materials and/or intermediates to produce finished fertilizers. Secondary producers are those who use finished fertilizer materials to produce other fertilizers (mixtures and blends).
• It is the net production figure from primary producers which should be used for statistical reporting purposes.
• Report on production and deliveries of secondary producers for NPK and other mixtures and blends when they play an important role in the national fertilizer market.
• Production capacities of domestic plants should be assembled by product at least once a year.
• Production data shall be computed in both fertilizer products and nutrients
Quiz
In a country, 2 fertilizer plants have produced last year a total of 500,000 mt of urea and 250,000 of AS. One has also blended 50,000 mt of NPK 15-15-15.
(i) Which figures should be reported to FAO?
(ii) Fill the corresponding FAO production table (table 13)
Fertilizer import and export
3.4.4 Imports and exports
Trade statistics comprise data on imports and exports, which represent transfers of materials from one country to another. Surplus countries export to deficit countries.
Trade statistics are generally well documented in both importing and exporting countries. They normally originate from the customs service or from a state trading organization established by the government to export or import different commodities, including fertilizers. Ministries of Industry or of Agriculture are sometimes assigned the task of keeping records of imports and exports. The situation varies from country to country. Specimen formats are given in Table 16 and Table 17 .
For international trade statistics, international codes are attributed to the products (for example, the "Standard International Trade Codes" or the "Brussels Convention Codes"). These two sets of codes are increasingly being replaced by the “harmonized commodity codes", a list of which is given in Table 10: Common HS codes for fertilizers.
The importing country should tabulate the import statistics each month, by country of origin, by product, by port, whether in bagged or bulk form and with value of imports, by product. International information on fertilizer trade is available from consultants and specialized publications.
The import value is normally on a CIF basis i.e. cost, freight and Insurance. This represents the FOB (free on board) cost plus the sea freight plus insurance. Some contracts are established on a FOB
Page 36

basis, with the importing countries making their own arrangements for shipping the material from the exporting countries.
3.4.5 Re-export
Substantial quantities of fertilizers are shipped to countries which are not their final destination. This may be because the port is a convenient (perhaps the only) point of entry, or because the material is imported in bulk and bagged before being re-exported, or for political reasons etc. Sometimes fertilizers are received as part of an exchange agreement and part of the quantity is re-exported.
Re-exported material is in principle, should not be included in the import nor in the export figures of the transit country. The situation is less serious if the material is recorded in both the import and in the export statistics of the transit country, since the figures cancel out in the net trade balance and the informed user of the statistics will not be misled. But sometimes this is not the case.
Re-exported materials are fertilizers that have been received from abroad and then re-packaged. After re-packaging into smaller quantities then the fertilizer can be exported to other countries. Goods in transit are not re-packaged but are forwarded unopened to the final destinations.
Wherever possible, the recorded destination of the material should be its final destination; otherwise the trade statistics give a false picture of the movements.
3.4.6 Import and export of fertilizer raw materials
Many countries both import and export fertilizers. On the other hand, trade in fertilizing raw materials and intermediates tends to be one way. Therefore, data collection for these materials is more straightforward. For raw materials, the terms "deficit" (production less than requirement) or "surplus" (production more than requirement) are not strictly valid.
A raw material producing country normally will not have adequate fertilizer manufacturing capacity to utilize all the raw materials produced and all complementary raw materials necessary to manufacture fertilizer may not be available in the country.
Data on the import or export of phosphate rock should be compiled by grade, expressed as % BPL (*)1, and by country and may be monthly, quarterly or annual. Countries which have inadequate indigenous resources and which import the balance to supplement the shortfall are required to maintain both production (mined) and import data
1 (*) = “Bone Phosphate of lime”: 1% of BPL = 0.458% P2O5 .
Page 37
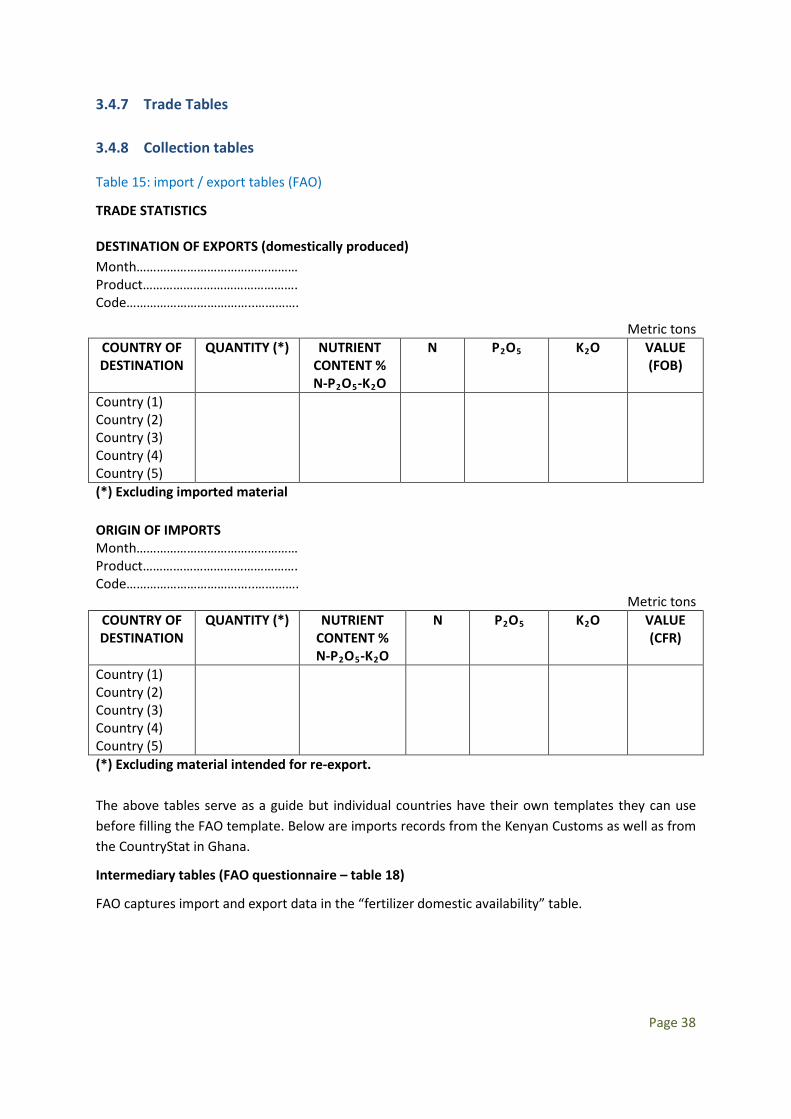
3.4.7 Trade Tables
3.4.8 Collection tables
Table 15: import / export tables (FAO)
TRADE STATISTICS
DESTINATION OF EXPORTS (domestically produced) Month………………………………………… Product………………………………………. Code………………………………..………….
Metric tons COUNTRY OF DESTINATION
QUANTITY (*) NUTRIENT CONTENT % N-P2O5-K2O
N P2O5 K2O VALUE (FOB)
Country (1) Country (2) Country (3) Country (4) Country (5)
(*) Excluding imported material ORIGIN OF IMPORTS Month………………………………………… Product………………………………………. Code………………………………..………….
Metric tons COUNTRY OF DESTINATION
QUANTITY (*) NUTRIENT CONTENT % N-P2O5-K2O
N P2O5 K2O VALUE (CFR)
Country (1) Country (2) Country (3) Country (4) Country (5)
(*) Excluding material intended for re-export. The above tables serve as a guide but individual countries have their own templates they can use before filling the FAO template. Below are imports records from the Kenyan Customs as well as from the CountryStat in Ghana.
Intermediary tables (FAO questionnaire – table 18)
FAO captures import and export data in the “fertilizer domestic availability” table.
Page 38
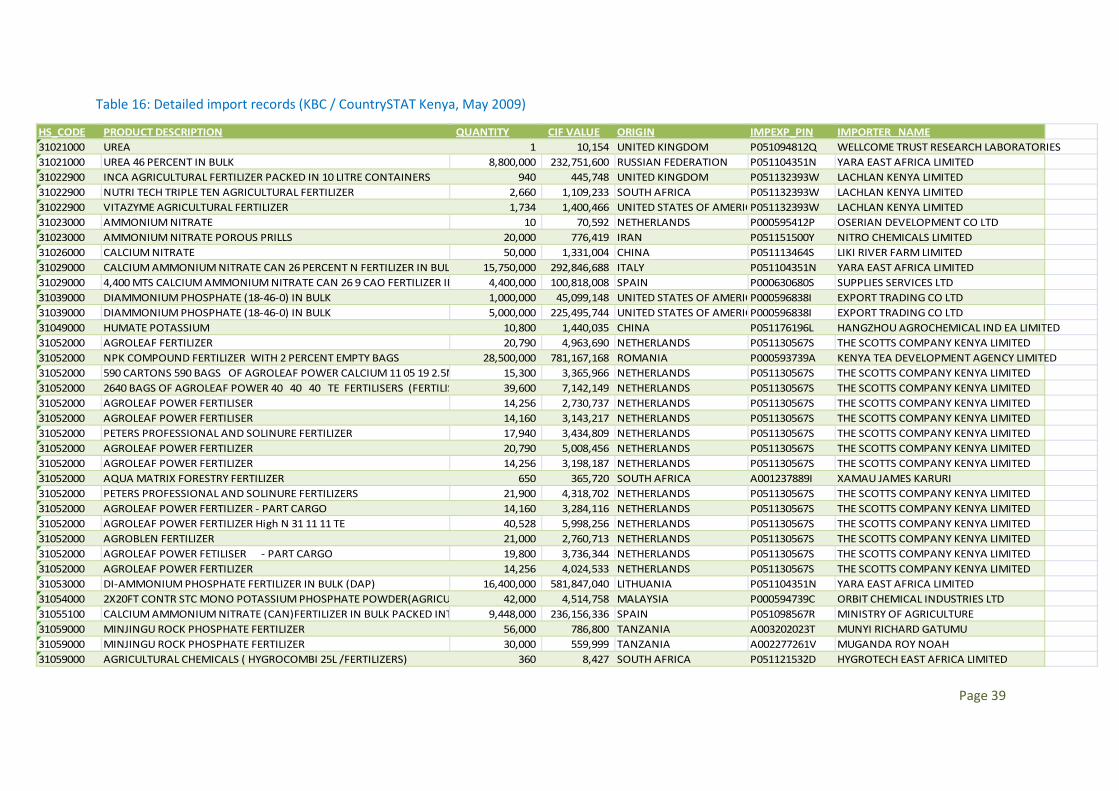
Table 16: Detailed import records (KBC / CountrySTAT Kenya, May 2009)
HS_CODE PRODUCT DESCRIPTION QUANTITY CIF VALUE ORIGIN IMPEXP_PIN IMPORTER NAME31021000 UREA 1 10,154 UNITED KINGDOM P051094812Q WELLCOME TRUST RESEARCH LABORATORIES31021000 UREA 46 PERCENT IN BULK 8,800,000 232,751,600 RUSSIAN FEDERATION P051104351N YARA EAST AFRICA LIMITED31022900 INCA AGRICULTURAL FERTILIZER PACKED IN 10 LITRE CONTAINERS 940 445,748 UNITED KINGDOM P051132393W LACHLAN KENYA LIMITED31022900 NUTRI TECH TRIPLE TEN AGRICULTURAL FERTILIZER 2,660 1,109,233 SOUTH AFRICA P051132393W LACHLAN KENYA LIMITED31022900 VITAZYME AGRICULTURAL FERTILIZER 1,734 1,400,466 UNITED STATES OF AMERICP051132393W LACHLAN KENYA LIMITED31023000 AMMONIUM NITRATE 10 70,592 NETHERLANDS P000595412P OSERIAN DEVELOPMENT CO LTD31023000 AMMONIUM NITRATE POROUS PRILLS 20,000 776,419 IRAN P051151500Y NITRO CHEMICALS LIMITED31026000 CALCIUM NITRATE 50,000 1,331,004 CHINA P051113464S LIKI RIVER FARM LIMITED31029000 CALCIUM AMMONIUM NITRATE CAN 26 PERCENT N FERTILIZER IN BUL 15,750,000 292,846,688 ITALY P051104351N YARA EAST AFRICA LIMITED31029000 4,400 MTS CALCIUM AMMONIUM NITRATE CAN 26 9 CAO FERTILIZER IN 4,400,000 100,818,008 SPAIN P000630680S SUPPLIES SERVICES LTD31039000 DIAMMONIUM PHOSPHATE (18-46-0) IN BULK 1,000,000 45,099,148 UNITED STATES OF AMERICP000596838I EXPORT TRADING CO LTD31039000 DIAMMONIUM PHOSPHATE (18-46-0) IN BULK 5,000,000 225,495,744 UNITED STATES OF AMERICP000596838I EXPORT TRADING CO LTD31049000 HUMATE POTASSIUM 10,800 1,440,035 CHINA P051176196L HANGZHOU AGROCHEMICAL IND EA LIMITED31052000 AGROLEAF FERTILIZER 20,790 4,963,690 NETHERLANDS P051130567S THE SCOTTS COMPANY KENYA LIMITED31052000 NPK COMPOUND FERTILIZER WITH 2 PERCENT EMPTY BAGS 28,500,000 781,167,168 ROMANIA P000593739A KENYA TEA DEVELOPMENT AGENCY LIMITED31052000 590 CARTONS 590 BAGS OF AGROLEAF POWER CALCIUM 11 05 19 2.5M 15,300 3,365,966 NETHERLANDS P051130567S THE SCOTTS COMPANY KENYA LIMITED31052000 2640 BAGS OF AGROLEAF POWER 40 40 40 TE FERTILISERS (FERTILIS 39,600 7,142,149 NETHERLANDS P051130567S THE SCOTTS COMPANY KENYA LIMITED31052000 AGROLEAF POWER FERTILISER 14,256 2,730,737 NETHERLANDS P051130567S THE SCOTTS COMPANY KENYA LIMITED31052000 AGROLEAF POWER FERTILISER 14,160 3,143,217 NETHERLANDS P051130567S THE SCOTTS COMPANY KENYA LIMITED31052000 PETERS PROFESSIONAL AND SOLINURE FERTILIZER 17,940 3,434,809 NETHERLANDS P051130567S THE SCOTTS COMPANY KENYA LIMITED31052000 AGROLEAF POWER FERTILIZER 20,790 5,008,456 NETHERLANDS P051130567S THE SCOTTS COMPANY KENYA LIMITED31052000 AGROLEAF POWER FERTILIZER 14,256 3,198,187 NETHERLANDS P051130567S THE SCOTTS COMPANY KENYA LIMITED31052000 AQUA MATRIX FORESTRY FERTILIZER 650 365,720 SOUTH AFRICA A001237889I XAMAU JAMES KARURI31052000 PETERS PROFESSIONAL AND SOLINURE FERTILIZERS 21,900 4,318,702 NETHERLANDS P051130567S THE SCOTTS COMPANY KENYA LIMITED31052000 AGROLEAF POWER FERTILIZER - PART CARGO 14,160 3,284,116 NETHERLANDS P051130567S THE SCOTTS COMPANY KENYA LIMITED31052000 AGROLEAF POWER FERTILIZER High N 31 11 11 TE 40,528 5,998,256 NETHERLANDS P051130567S THE SCOTTS COMPANY KENYA LIMITED31052000 AGROBLEN FERTILIZER 21,000 2,760,713 NETHERLANDS P051130567S THE SCOTTS COMPANY KENYA LIMITED31052000 AGROLEAF POWER FETILISER - PART CARGO 19,800 3,736,344 NETHERLANDS P051130567S THE SCOTTS COMPANY KENYA LIMITED31052000 AGROLEAF POWER FERTILIZER 14,256 4,024,533 NETHERLANDS P051130567S THE SCOTTS COMPANY KENYA LIMITED31053000 DI-AMMONIUM PHOSPHATE FERTILIZER IN BULK (DAP) 16,400,000 581,847,040 LITHUANIA P051104351N YARA EAST AFRICA LIMITED31054000 2X20FT CONTR STC MONO POTASSIUM PHOSPHATE POWDER(AGRICU 42,000 4,514,758 MALAYSIA P000594739C ORBIT CHEMICAL INDUSTRIES LTD31055100 CALCIUM AMMONIUM NITRATE (CAN)FERTILIZER IN BULK PACKED INT 9,448,000 236,156,336 SPAIN P051098567R MINISTRY OF AGRICULTURE31059000 MINJINGU ROCK PHOSPHATE FERTILIZER 56,000 786,800 TANZANIA A003202023T MUNYI RICHARD GATUMU31059000 MINJINGU ROCK PHOSPHATE FERTILIZER 30,000 559,999 TANZANIA A002277261V MUGANDA ROY NOAH31059000 AGRICULTURAL CHEMICALS ( HYGROCOMBI 25L /FERTILIZERS) 360 8,427 SOUTH AFRICA P051121532D HYGROTECH EAST AFRICA LIMITED
Page 39
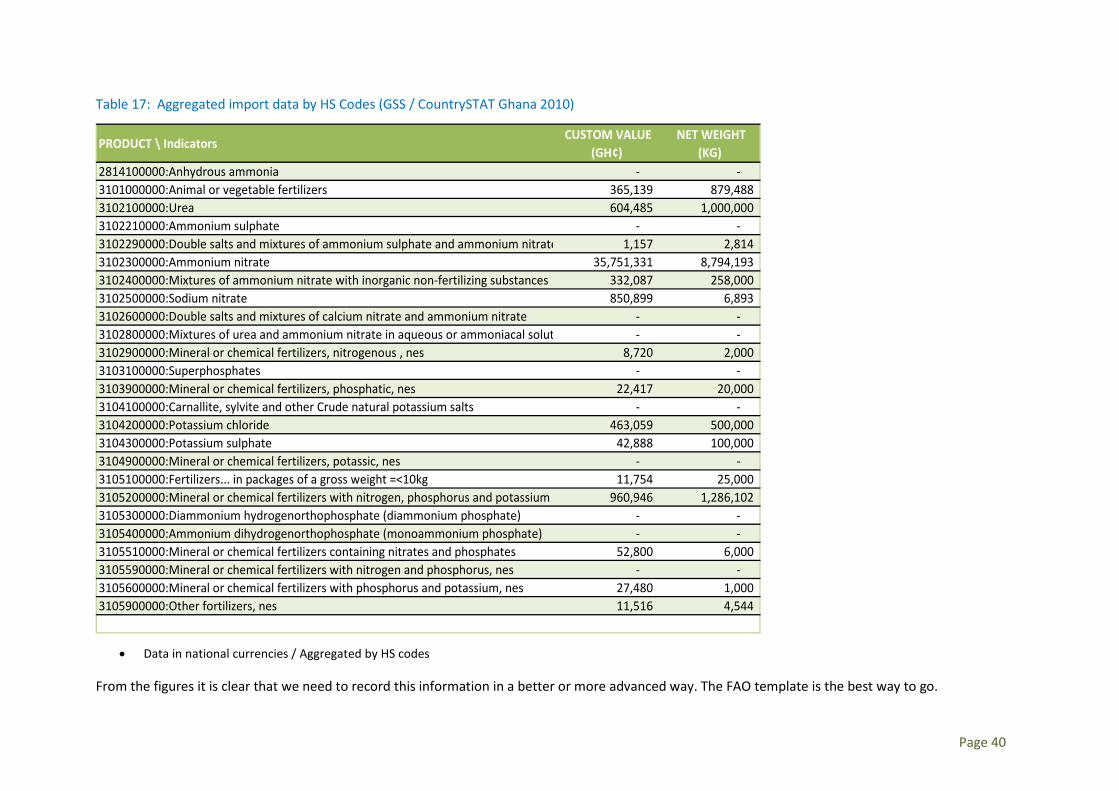
Table 17: Aggregated import data by HS Codes (GSS / CountrySTAT Ghana 2010)
PRODUCT \ Indicators CUSTOM VALUE
(GH¢) NET WEIGHT
(KG) 2814100000:Anhydrous ammonia - - 3101000000:Animal or vegetable fertilizers 365,139 879,488 3102100000:Urea 604,485 1,000,000 3102210000:Ammonium sulphate - - 3102290000:Double salts and mixtures of ammonium sulphate and ammonium nitrate 1,157 2,814 3102300000:Ammonium nitrate 35,751,331 8,794,193 3102400000:Mixtures of ammonium nitrate with inorganic non-fertilizing substances 332,087 258,000 3102500000:Sodium nitrate 850,899 6,893 3102600000:Double salts and mixtures of calcium nitrate and ammonium nitrate - - 3102800000:Mixtures of urea and ammonium nitrate in aqueous or ammoniacal solut - - 3102900000:Mineral or chemical fertilizers, nitrogenous , nes 8,720 2,000 3103100000:Superphosphates - - 3103900000:Mineral or chemical fertilizers, phosphatic, nes 22,417 20,000 3104100000:Carnallite, sylvite and other Crude natural potassium salts - - 3104200000:Potassium chloride 463,059 500,000 3104300000:Potassium sulphate 42,888 100,000 3104900000:Mineral or chemical fertilizers, potassic, nes - - 3105100000:Fertilizers... in packages of a gross weight =<10kg 11,754 25,000 3105200000:Mineral or chemical fertilizers with nitrogen, phosphorus and potassium 960,946 1,286,102 3105300000:Diammonium hydrogenorthophosphate (diammonium phosphate) - - 3105400000:Ammonium dihydrogenorthophosphate (monoammonium phosphate) - - 3105510000:Mineral or chemical fertilizers containing nitrates and phosphates 52,800 6,000 3105590000:Mineral or chemical fertilizers with nitrogen and phosphorus, nes - - 3105600000:Mineral or chemical fertilizers with phosphorus and potassium, nes 27,480 1,000 3105900000:Other fortilizers, nes 11,516 4,544
• Data in national currencies / Aggregated by HS codes
From the figures it is clear that we need to record this information in a better or more advanced way. The FAO template is the best way to go.
Page 40
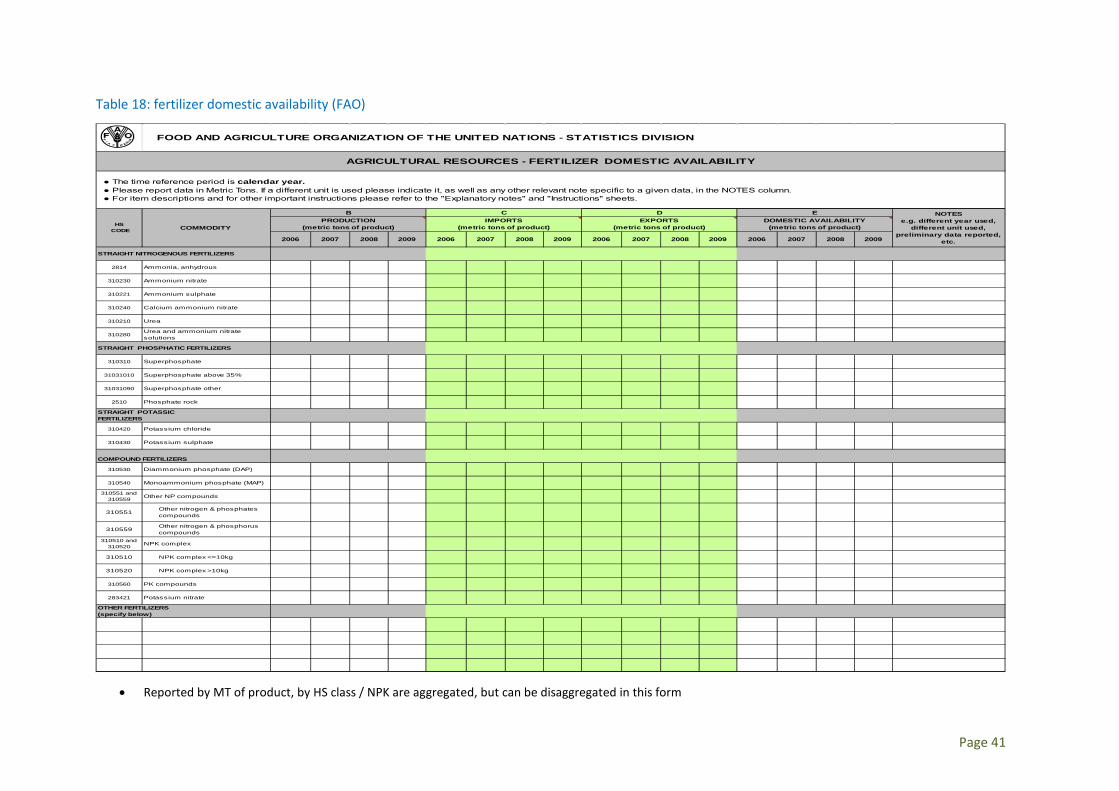
Table 18: fertilizer domestic availability (FAO)
2814 Ammonia, anhydrous
310230 Ammonium nitrate
310221 Ammonium sulphate
310240 Calcium ammonium nitrate
310210 Urea
310280Urea and ammonium nitrate solutions
310310 Superphosphate
31031010 Superphosphate above 35%
31031090 Superphosphate other
2510 Phosphate rock
310420 Potassium chloride
310430 Potassium sulphate
310530 Diammonium phosphate (DAP)
310540 Monoammonium phosphate (MAP)
310551 and 310559 Other NP compounds
310551 Other nitrogen & phosphates compounds
310559 Other nitrogen & phosphorus compounds
310510 and 310520 NPK complex
310510 NPK complex <=10kg
310520 NPK complex >10kg
310560 PK compounds
283421 Potassium nitrate
2006
OTHER FERTILIZERS (specify below)
STRAIGHT NITROGENOUS FERTILIZERS
STRAIGHT PHOSPHATIC FERTILIZERS
STRAIGHT POTASSIC FERTILIZERS
COMPOUND FERTILIZERS
FOOD AND AGRICULTURE ORGANIZATION OF THE UNITED NATIONS - STATISTICS DIVISION
AGRICULTURAL RESOURCES - FERTILIZER DOMESTIC AVAILABILITY
● The time reference period is calendar year. ● Please report data in Metric Tons. If a different unit is used please indicate it, as well as any other relevant note specific to a given data, in the NOTES column. ● For item descriptions and for other important instructions please refer to the "Explanatory notes" and "Instructions" sheets.
HS CODE COMMODITY
B C D
2006 2007 2008 2009
PRODUCTION(metric tons of product)
IMPORTS(metric tons of product)
2007 2008
E NOTESe.g. different year used,
different unit used, preliminary data reported,
etc.
EXPORTS(metric tons of product)
DOMESTIC AVAILABILITY(metric tons of product)
20092006 2007 2008 2009 2006 2007 2008 2009
• Reported by MT of product, by HS class / NPK are aggregated, but can be disaggregated in this form
Page 41
Fertilizer Trade - Highlights
• Trade data should comprise at least HS codes, volumes, value, country of origin or destination.
• A good description of the fertilizer product is needed to assign the right HS code and to determine the nutrient contents.
• Importation of fertilizers are reported on CIF (cost, insurance & freight) value. Exportation of fertilizers are reported on FOB (free-on-board) value.
• Re-exported fertilizers should not be included on import and export figures of a transit country.
• Trade data shall be reported by fertilizer product.
Quiz
1. Make a distinction between Re-exports and Fertilizer in transit
2. Why are fertilizers in the re-exports excluded in the imports total?
3. A country is importing 200,000 mt of urea, 80,000 mt of DAP and 50,000 mt of NPK 15 15 15. Fill the corresponding FAO production table (table 18)
3.5 Fertilizer consumption
3.5.1 Consumption data from dealers or farmers
Ideally, consumption should relate to the quantities actually used by farmers on crops. This concept is difficult to apply as it requires costly surveys which cannot be conducted regularly. Therefore, it is ruled out as a tool for measuring consumption, on a comprehensive, timely and regular basis.
In general, farmers apply the fertilizers during the year of purchase and sales at retail level can be equated to consumption. In practice, the regular collection of sales data from retail dealers, particularly in large countries, is difficult. Their numbers are large and not all retailers keep a proper record of their sales.
Some countries have developed regulations and legislation concerning packaging, distribution, sale, quality, specifications, price, etc. for fertilizers. The maintenance of records of stocks and sales by the retailer is often included in the regulations. In this case, dealer reporting forms (see table 17) could be sent to the central agency at specified intervals.
3.5.2 Consumption data from manufacturers and sales organizations
In most countries, the consumption statistics are in fact the actual deliveries to agriculture by the manufacturers. The figures may not reflect accurately current consumption in agriculture due to stock changes, but they are reliable since the recording unit is the factory or the trading enterprise (whose numbers are generally small) and such units keep good records of their operations. In the
Page 42
medium term, the stock changes cancel each other out. The delivery figures are included in the manufacturers monthly report (table 17).
Importers who deliver fertilizers directly to dealers must also send a monthly report to the central agency, giving details on their deliveries by product and by region.
The sum of the sales from two sources (domestic and imported) represents overall consumption, both passing through a common distribution channel.
3.5.3 Apparent consumption
Apparent consumption is used as a proxy for actual consumption. Sometimes it is difficult to do a survey of all the farmers in order to capture actual consumption. We therefore turn to other means that will give us a fair approximate of the actual.
The concept of apparent consumption assumes stability of stock levels at various channels of distribution - private trade, institutional agencies, importing agency (if operating separately). It assumes that supply (availability) equals consumption.
Apparent consumption = Production + Imports – Exports – Non-Fertilizer Use.
When this formula is used to estimate consumption, it implicitly assumes that stocks at the beginning and at the end of the period remain more or less unchanged. In the longer run, stock-level changes should cancel each other out. However, in the shorter term, closing stocks are not normally exactly equal to opening stocks.
This concept has its merits. Production data are normally fairly accurate and reliable since manufacturers keep their records up-to-date and report to the central agency every month. Secondly, the number of manufacturers is normally not very large in any given country. The import and export data are also reliable. The only uncertainties are the opening and closing stocks.
Page 43
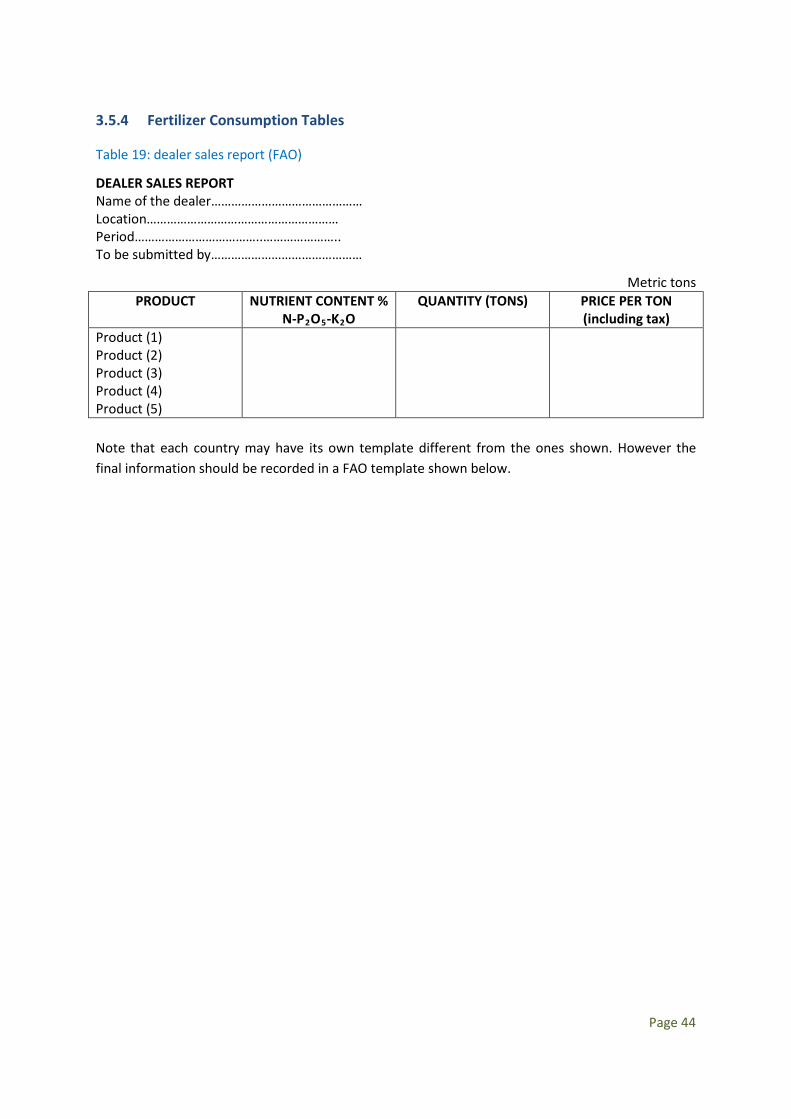
3.5.4 Fertilizer Consumption Tables
Table 19: dealer sales report (FAO)
DEALER SALES REPORT Name of the dealer……………………………………… Location………………………………………………… Period………………………………..………………….. To be submitted by………………………………………
Metric tons PRODUCT NUTRIENT CONTENT %
N-P2O5-K2O QUANTITY (TONS) PRICE PER TON
(including tax) Product (1) Product (2) Product (3) Product (4) Product (5)
Note that each country may have its own template different from the ones shown. However the final information should be recorded in a FAO template shown below.
Page 44
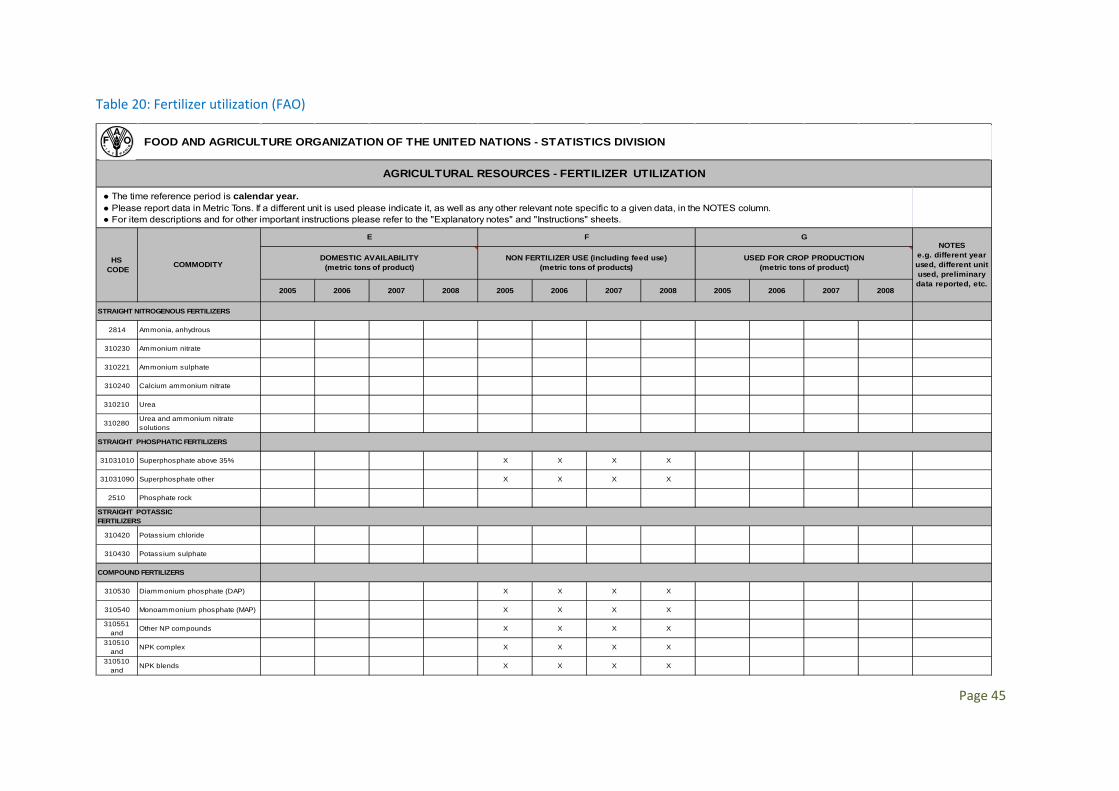
Table 20: Fertilizer utilization (FAO)
2814 Ammonia, anhydrous
310230 Ammonium nitrate
310221 Ammonium sulphate
310240 Calcium ammonium nitrate
310210 Urea
310280 Urea and ammonium nitrate solutions
31031010 Superphosphate above 35% X X X X
31031090 Superphosphate other X X X X
2510 Phosphate rock
310420 Potassium chloride
310430 Potassium sulphate
310530 Diammonium phosphate (DAP) X X X X
310540 Monoammonium phosphate (MAP) X X X X
310551 and Other NP compounds X X X X
310510 and NPK complex X X X X
310510 and NPK blends X X X X
2005 2006 20072006 2008 2005 2006 2007
STRAIGHT NITROGENOUS FERTILIZERS
● The time reference period is calendar year. ● Please report data in Metric Tons. If a different unit is used please indicate it, as well as any other relevant note specific to a given data, in the NOTES column. ● For item descriptions and for other important instructions please refer to the "Explanatory notes" and "Instructions" sheets.
FOOD AND AGRICULTURE ORGANIZATION OF THE UNITED NATIONS - STATISTICS DIVISION
AGRICULTURAL RESOURCES - FERTILIZER UTILIZATION
DOMESTIC AVAILABILITY(metric tons of product)
NON FERTILIZER USE (including feed use)(metric tons of products)
USED FOR CROP PRODUCTION(metric tons of product)
NOTESe.g. different year used, different unit used, preliminary data reported, etc.
2005 2007 2008 2008
HS CODE COMMODITY
E F G
STRAIGHT PHOSPHATIC FERTILIZERS
STRAIGHT POTASSIC FERTILIZERS
COMPOUND FERTILIZERS
Page 45
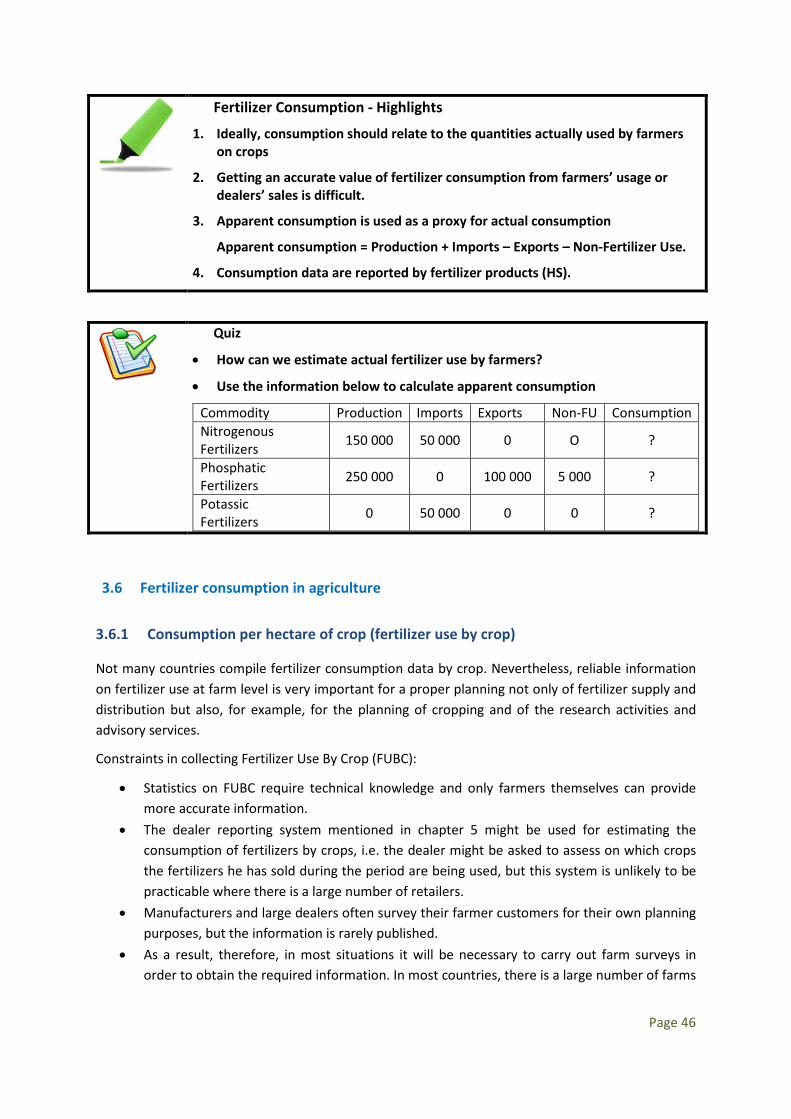
Fertilizer Consumption - Highlights
1. Ideally, consumption should relate to the quantities actually used by farmers on crops
2. Getting an accurate value of fertilizer consumption from farmers’ usage or dealers’ sales is difficult.
3. Apparent consumption is used as a proxy for actual consumption
Apparent consumption = Production + Imports – Exports – Non-Fertilizer Use.
4. Consumption data are reported by fertilizer products (HS).
Quiz
• How can we estimate actual fertilizer use by farmers?
• Use the information below to calculate apparent consumption
Commodity Production Imports Exports Non-FU Consumption Nitrogenous Fertilizers 150 000 50 000 0 O ?
Phosphatic Fertilizers 250 000 0 100 000 5 000 ?
Potassic Fertilizers 0 50 000 0 0 ?
3.6 Fertilizer consumption in agriculture
3.6.1 Consumption per hectare of crop (fertilizer use by crop)
Not many countries compile fertilizer consumption data by crop. Nevertheless, reliable information on fertilizer use at farm level is very important for a proper planning not only of fertilizer supply and distribution but also, for example, for the planning of cropping and of the research activities and advisory services.
Constraints in collecting Fertilizer Use By Crop (FUBC):
• Statistics on FUBC require technical knowledge and only farmers themselves can provide more accurate information.
• The dealer reporting system mentioned in chapter 5 might be used for estimating the consumption of fertilizers by crops, i.e. the dealer might be asked to assess on which crops the fertilizers he has sold during the period are being used, but this system is unlikely to be practicable where there is a large number of retailers.
• Manufacturers and large dealers often survey their farmer customers for their own planning purposes, but the information is rarely published.
• As a result, therefore, in most situations it will be necessary to carry out farm surveys in order to obtain the required information. In most countries, there is a large number of farms
Page 46
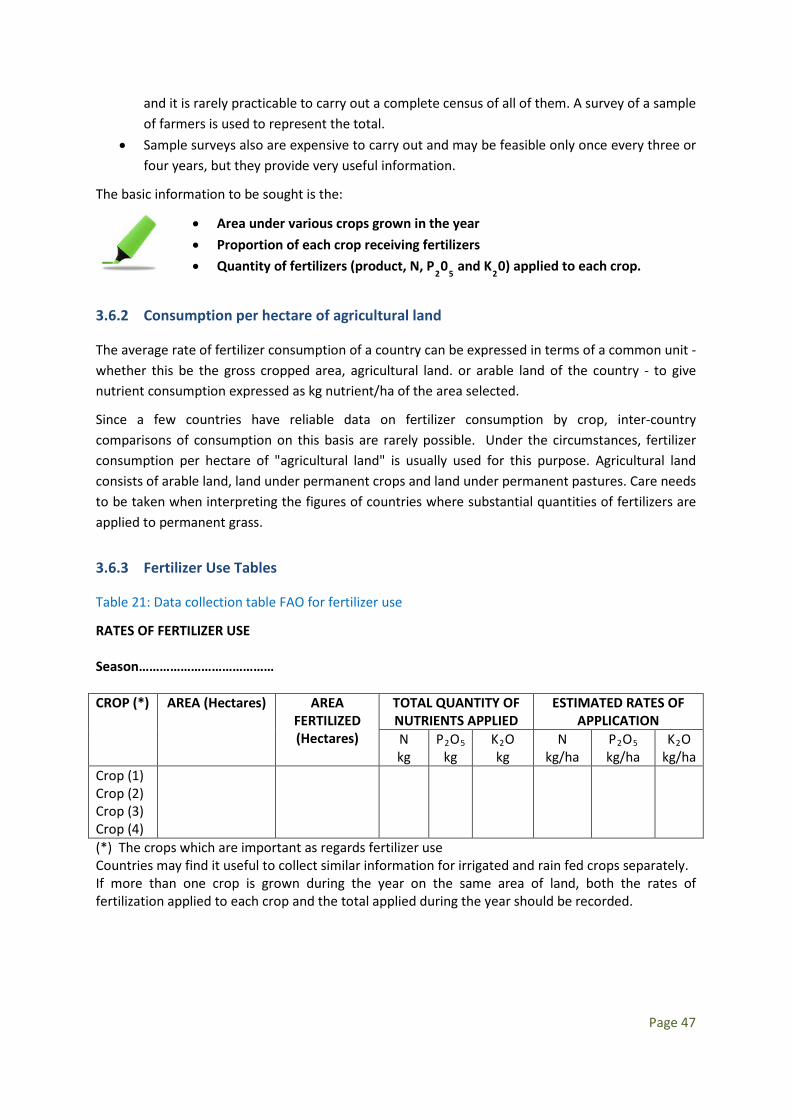
and it is rarely practicable to carry out a complete census of all of them. A survey of a sample of farmers is used to represent the total.
• Sample surveys also are expensive to carry out and may be feasible only once every three or four years, but they provide very useful information.
The basic information to be sought is the:
• Area under various crops grown in the year • Proportion of each crop receiving fertilizers • Quantity of fertilizers (product, N, P
20
5 and K
20) applied to each crop.
3.6.2 Consumption per hectare of agricultural land
The average rate of fertilizer consumption of a country can be expressed in terms of a common unit - whether this be the gross cropped area, agricultural land. or arable land of the country - to give nutrient consumption expressed as kg nutrient/ha of the area selected.
Since a few countries have reliable data on fertilizer consumption by crop, inter-country comparisons of consumption on this basis are rarely possible. Under the circumstances, fertilizer consumption per hectare of "agricultural land" is usually used for this purpose. Agricultural land consists of arable land, land under permanent crops and land under permanent pastures. Care needs to be taken when interpreting the figures of countries where substantial quantities of fertilizers are applied to permanent grass.
3.6.3 Fertilizer Use Tables
Table 21: Data collection table FAO for fertilizer use
RATES OF FERTILIZER USE
Season………………………………… CROP (*) AREA (Hectares) AREA
FERTILIZED (Hectares)
TOTAL QUANTITY OF NUTRIENTS APPLIED
ESTIMATED RATES OF APPLICATION
N kg
P2O5 kg
K2O kg
N kg/ha
P2O5 kg/ha
K2O kg/ha
Crop (1) Crop (2) Crop (3) Crop (4)
(*) The crops which are important as regards fertilizer use Countries may find it useful to collect similar information for irrigated and rain fed crops separately. If more than one crop is grown during the year on the same area of land, both the rates of fertilization applied to each crop and the total applied during the year should be recorded.
Page 47
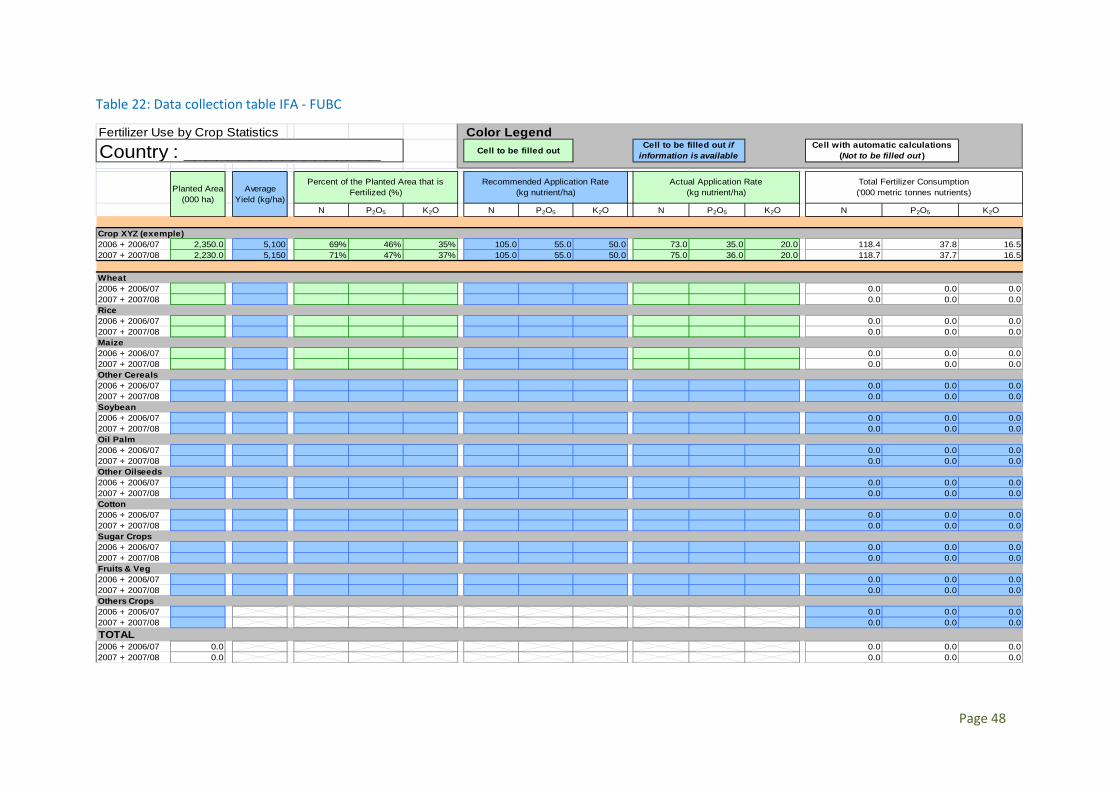
Table 22: Data collection table IFA - FUBC
Fertilizer Use by Crop Statistics Color Legend
N P2O5 K2O N P2O5 K2O N P2O5 K2O N P2O5 K2O
Crop XYZ (exemple)2006 + 2006/07 2,350.0 5,100 69% 46% 35% 105.0 55.0 50.0 73.0 35.0 20.0 118.4 37.8 16.52007 + 2007/08 2,230.0 5,150 71% 47% 37% 105.0 55.0 50.0 75.0 36.0 20.0 118.7 37.7 16.5
Wheat2006 + 2006/07 0.0 0.0 0.02007 + 2007/08 0.0 0.0 0.0Rice2006 + 2006/07 0.0 0.0 0.02007 + 2007/08 0.0 0.0 0.0Maize2006 + 2006/07 0.0 0.0 0.02007 + 2007/08 0.0 0.0 0.0Other Cereals2006 + 2006/07 0.0 0.0 0.02007 + 2007/08 0.0 0.0 0.0Soybean2006 + 2006/07 0.0 0.0 0.02007 + 2007/08 0.0 0.0 0.0Oil Palm2006 + 2006/07 0.0 0.0 0.02007 + 2007/08 0.0 0.0 0.0Other Oilseeds2006 + 2006/07 0.0 0.0 0.02007 + 2007/08 0.0 0.0 0.0Cotton2006 + 2006/07 0.0 0.0 0.02007 + 2007/08 0.0 0.0 0.0Sugar Crops2006 + 2006/07 0.0 0.0 0.02007 + 2007/08 0.0 0.0 0.0Fruits & Veg2006 + 2006/07 0.0 0.0 0.02007 + 2007/08 0.0 0.0 0.0Others Crops2006 + 2006/07 0.0 0.0 0.02007 + 2007/08 0.0 0.0 0.0TOTAL2006 + 2006/07 0.0 0.0 0.0 0.02007 + 2007/08 0.0 0.0 0.0 0.0
Country : __________________Total Fertilizer Consumption ('000 metric tonnes nutrients)
Actual Application Rate (kg nutrient/ha)Planted Area
(000 ha)Average
Yield (kg/ha)
Percent of the Planted Area that is Fertilized (%)
Recommended Application Rate(kg nutrient/ha)
Cell to be filled out Cell to be filled out if information is available
Cell with automatic calculations (Not to be filled out )
Page 48

Fertilizer Use by Crop - Highlights
• The basic information to be sought is the:
• Area under various crops grown in the year • Proportion of each crop receiving fertilizers • Quantity of fertilizers (product, N, P
20
5 and K
20) applied to each crop.
• Data should be reported for most important crops
• Total fertilizer consumption is calculated per hectare of "agricultural land" i.e. arable land, land under permanent crops and land under permanent pasture
Quiz
1. Which are the three important variables required to compute statistics on fertilizer utilization by a given crop?
2. 50,000 mt of fertilizer NPK 23-10-5 were sold to maize farmers. The recommended rate of application is 100 kg/ha. Total acreage of maize planted this year is 800,000 ha. Calculate the corresponding actual application rate (in nutrient) using Table 21 and 22
3.7 Fertilizer Prices
Ultimately, it is the relationship between crop and fertilizer prices that determines to what extent inputs will be purchased by the farmer and whether the crop price will cover his investment costs and expenses incurred in growing the crops. Sale prices of both the input and the output have to be remunerative for the producers, i.e. the manufacturer and the farmer. In the developing countries a subsidy is often required to keep the input prices low, so that the output prices can be kept at an acceptable level. Experience shows that it is preferable to maintain a reasonable input-output price relationship to enable the farmer to use fertilizer profitably and, at the same time, to keep food grain prices reasonably low. Inputs generally constitute a costly item in the farmers’ budget and it may be necessary to subsidize them to achieve the objective of a satisfactory input-output price relationship.
Page 49
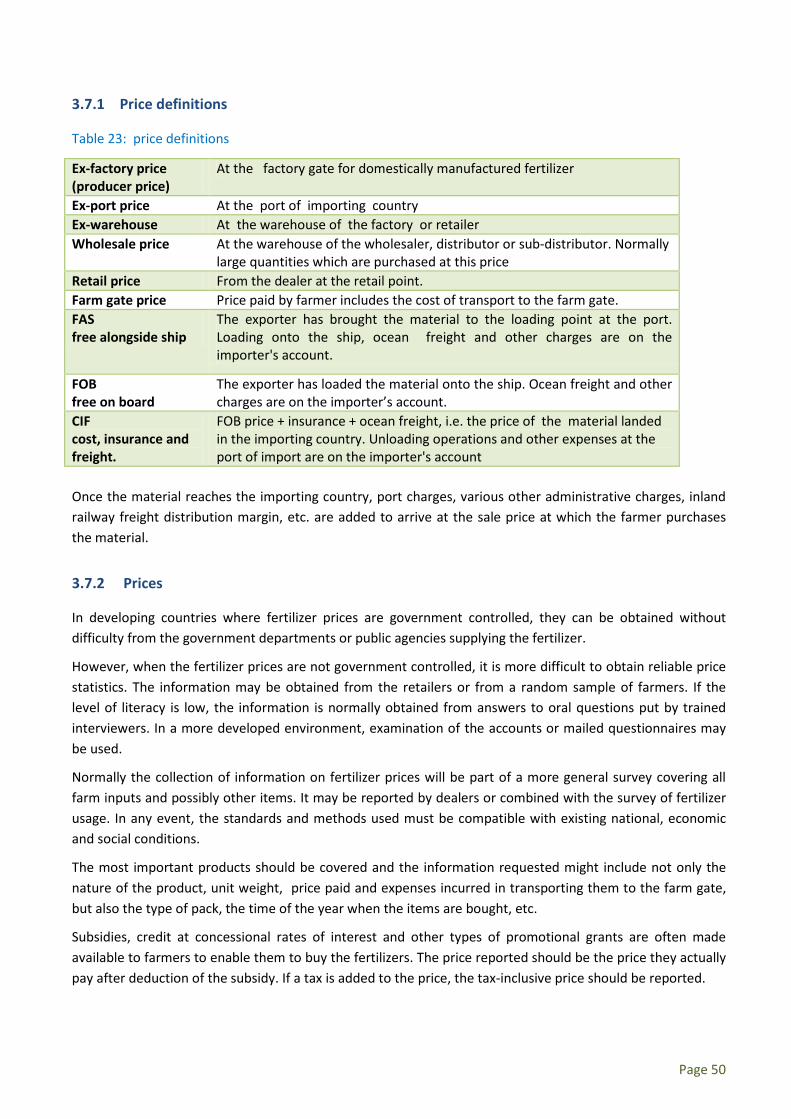
3.7.1 Price definitions
Table 23: price definitions
Ex-factory price (producer price)
At the factory gate for domestically manufactured fertilizer
Ex-port price At the port of importing country Ex-warehouse At the warehouse of the factory or retailer Wholesale price At the warehouse of the wholesaler, distributor or sub-distributor. Normally
large quantities which are purchased at this price Retail price From the dealer at the retail point. Farm gate price Price paid by farmer includes the cost of transport to the farm gate. FAS free alongside ship
The exporter has brought the material to the loading point at the port. Loading onto the ship, ocean freight and other charges are on the importer's account.
FOB free on board
The exporter has loaded the material onto the ship. Ocean freight and other charges are on the importer’s account.
CIF cost, insurance and freight.
FOB price + insurance + ocean freight, i.e. the price of the material landed in the importing country. Unloading operations and other expenses at the port of import are on the importer's account
Once the material reaches the importing country, port charges, various other administrative charges, inland railway freight distribution margin, etc. are added to arrive at the sale price at which the farmer purchases the material.
3.7.2 Prices
In developing countries where fertilizer prices are government controlled, they can be obtained without difficulty from the government departments or public agencies supplying the fertilizer.
However, when the fertilizer prices are not government controlled, it is more difficult to obtain reliable price statistics. The information may be obtained from the retailers or from a random sample of farmers. If the level of literacy is low, the information is normally obtained from answers to oral questions put by trained interviewers. In a more developed environment, examination of the accounts or mailed questionnaires may be used.
Normally the collection of information on fertilizer prices will be part of a more general survey covering all farm inputs and possibly other items. It may be reported by dealers or combined with the survey of fertilizer usage. In any event, the standards and methods used must be compatible with existing national, economic and social conditions.
The most important products should be covered and the information requested might include not only the nature of the product, unit weight, price paid and expenses incurred in transporting them to the farm gate, but also the type of pack, the time of the year when the items are bought, etc.
Subsidies, credit at concessional rates of interest and other types of promotional grants are often made available to farmers to enable them to buy the fertilizers. The price reported should be the price they actually pay after deduction of the subsidy. If a tax is added to the price, the tax-inclusive price should be reported.
Page 50
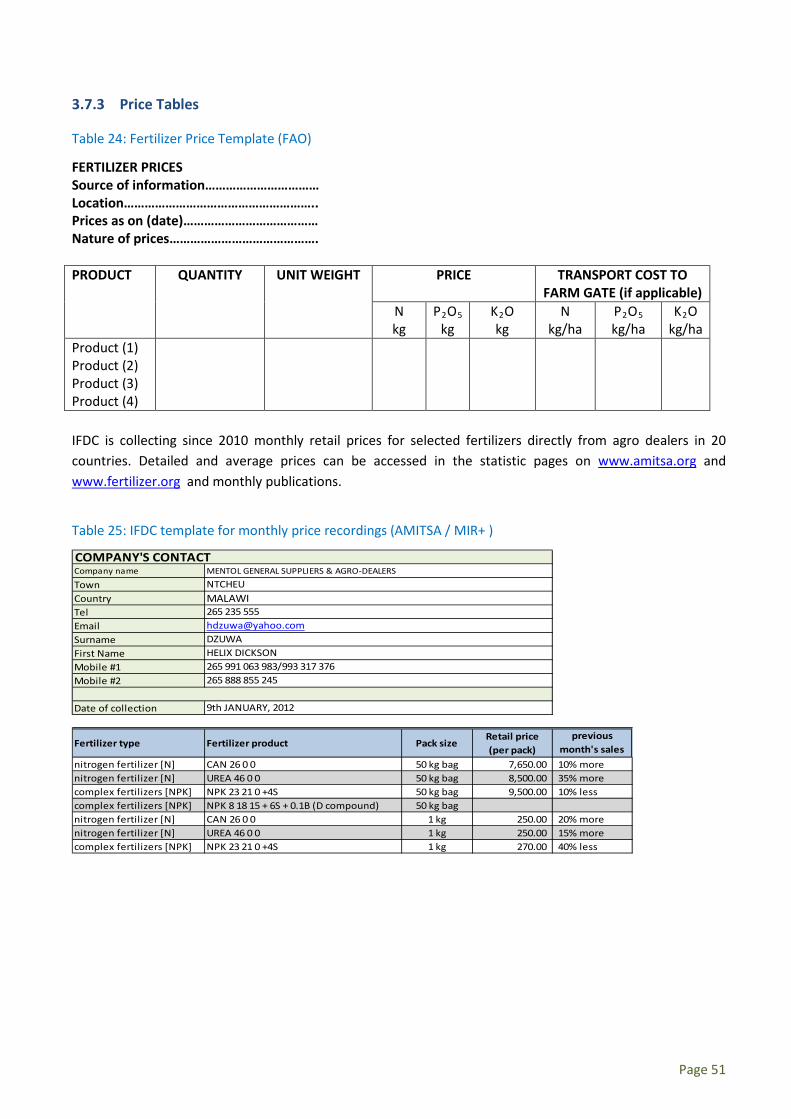
3.7.3 Price Tables
Table 24: Fertilizer Price Template (FAO)
FERTILIZER PRICES Source of information…………………………… Location……………………………………………….. Prices as on (date)………………………………… Nature of prices……………………………………. PRODUCT QUANTITY UNIT WEIGHT PRICE TRANSPORT COST TO
FARM GATE (if applicable) N kg
P2O5 kg
K2O kg
N kg/ha
P2O5 kg/ha
K2O kg/ha
Product (1) Product (2) Product (3) Product (4)
IFDC is collecting since 2010 monthly retail prices for selected fertilizers directly from agro dealers in 20 countries. Detailed and average prices can be accessed in the statistic pages on www.amitsa.org and www.fertilizer.org and monthly publications.
Table 25: IFDC template for monthly price recordings (AMITSA / MIR+ )
Company name
TownCountryTelEmailSurnameFirst NameMobile #1Mobile #2
Date of collection
Fertilizer type Fertilizer product Pack sizeRetail price (per pack)
previous month's sales
nitrogen fertilizer [N] CAN 26 0 0 50 kg bag 7,650.00 10% more nitrogen fertilizer [N] UREA 46 0 0 50 kg bag 8,500.00 35% morecomplex fertilizers [NPK] NPK 23 21 0 +4S 50 kg bag 9,500.00 10% lesscomplex fertilizers [NPK] NPK 8 18 15 + 6S + 0.1B (D compound) 50 kg bagnitrogen fertilizer [N] CAN 26 0 0 1 kg 250.00 20% morenitrogen fertilizer [N] UREA 46 0 0 1 kg 250.00 15% morecomplex fertilizers [NPK] NPK 23 21 0 +4S 1 kg 270.00 40% less
9th JANUARY, 2012
COMPANY'S CONTACTMENTOL GENERAL SUPPLIERS & AGRO-DEALERSNTCHEUMALAWI265 235 [email protected] DICKSON265 991 063 983/993 317 376265 888 855 245
Page 51
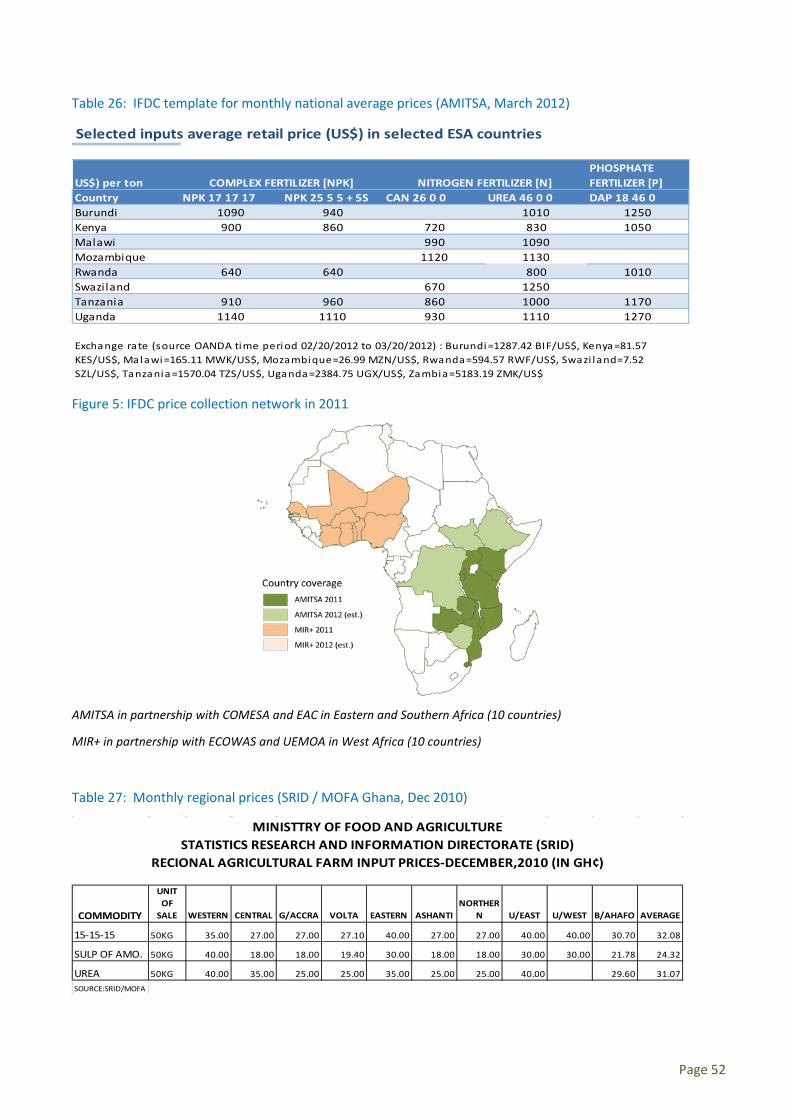
Table 26: IFDC template for monthly national average prices (AMITSA, March 2012)
Selected inputs average retail price (US$) in selected ESA countries
US$) per tonPHOSPHATE FERTILIZER [P]
Country NPK 17 17 17 NPK 25 5 5 + 5S CAN 26 0 0 UREA 46 0 0 DAP 18 46 0Burundi 1090 940 1010 1250Kenya 900 860 720 830 1050Malawi 990 1090Mozambique 1120 1130Rwanda 640 640 800 1010Swaziland 670 1250Tanzania 910 960 860 1000 1170Uganda 1140 1110 930 1110 1270
Exchange rate (source OANDA time period 02/20/2012 to 03/20/2012) : Burundi=1287.42 BIF/US$, Kenya=81.57 KES/US$, Malawi=165.11 MWK/US$, Mozambique=26.99 MZN/US$, Rwanda=594.57 RWF/US$, Swazi land=7.52 SZL/US$, Tanzania=1570.04 TZS/US$, Uganda=2384.75 UGX/US$, Zambia=5183.19 ZMK/US$
COMPLEX FERTILIZER [NPK] NITROGEN FERTILIZER [N]
Figure 5: IFDC price collection network in 2011
AMITSA in partnership with COMESA and EAC in Eastern and Southern Africa (10 countries)
MIR+ in partnership with ECOWAS and UEMOA in West Africa (10 countries)
Table 27: Monthly regional prices (SRID / MOFA Ghana, Dec 2010)
COMMODITY
UNIT OF
SALE WESTERN CENTRAL G/ACCRA VOLTA EASTERN ASHANTINORTHER
N U/EAST U/WEST B/AHAFO AVERAGE
15-15-15 50KG 35.00 27.00 27.00 27.10 40.00 27.00 27.00 40.00 40.00 30.70 32.08
SULP OF AMO. 50KG 40.00 18.00 18.00 19.40 30.00 18.00 18.00 30.00 30.00 21.78 24.32
UREA 50KG 40.00 35.00 25.00 25.00 35.00 25.00 25.00 40.00 29.60 31.07SOURCE:SRID/MOFA
MINISTTRY OF FOOD AND AGRICULTURESTATISTICS RESEARCH AND INFORMATION DIRECTORATE (SRID)
RECIONAL AGRICULTURAL FARM INPUT PRICES-DECEMBER,2010 (IN GH¢)
Page 52
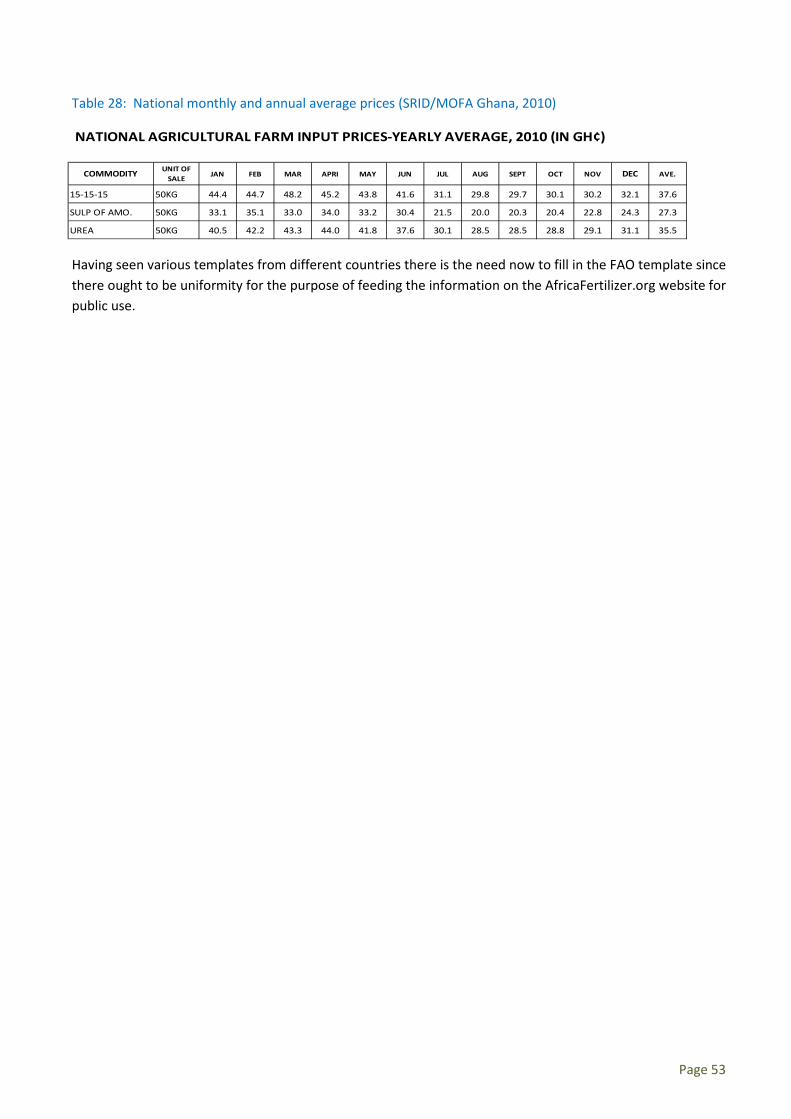
Table 28: National monthly and annual average prices (SRID/MOFA Ghana, 2010)
Having seen various templates from different countries there is the need now to fill in the FAO template since there ought to be uniformity for the purpose of feeding the information on the AfricaFertilizer.org website for public use.
COMMODITY UNIT OF SALE JAN FEB MAR APRI MAY JUN JUL AUG SEPT OCT NOV DEC AVE.
15-15-15 50KG 44.4 44.7 48.2 45.2 43.8 41.6 31.1 29.8 29.7 30.1 30.2 32.1 37.6
SULP OF AMO. 50KG 33.1 35.1 33.0 34.0 33.2 30.4 21.5 20.0 20.3 20.4 22.8 24.3 27.3
UREA 50KG 40.5 42.2 43.3 44.0 41.8 37.6 30.1 28.5 28.5 28.8 29.1 31.1 35.5
NATIONAL AGRICULTURAL FARM INPUT PRICES-YEARLY AVERAGE, 2010 (IN GH¢)
Page 53
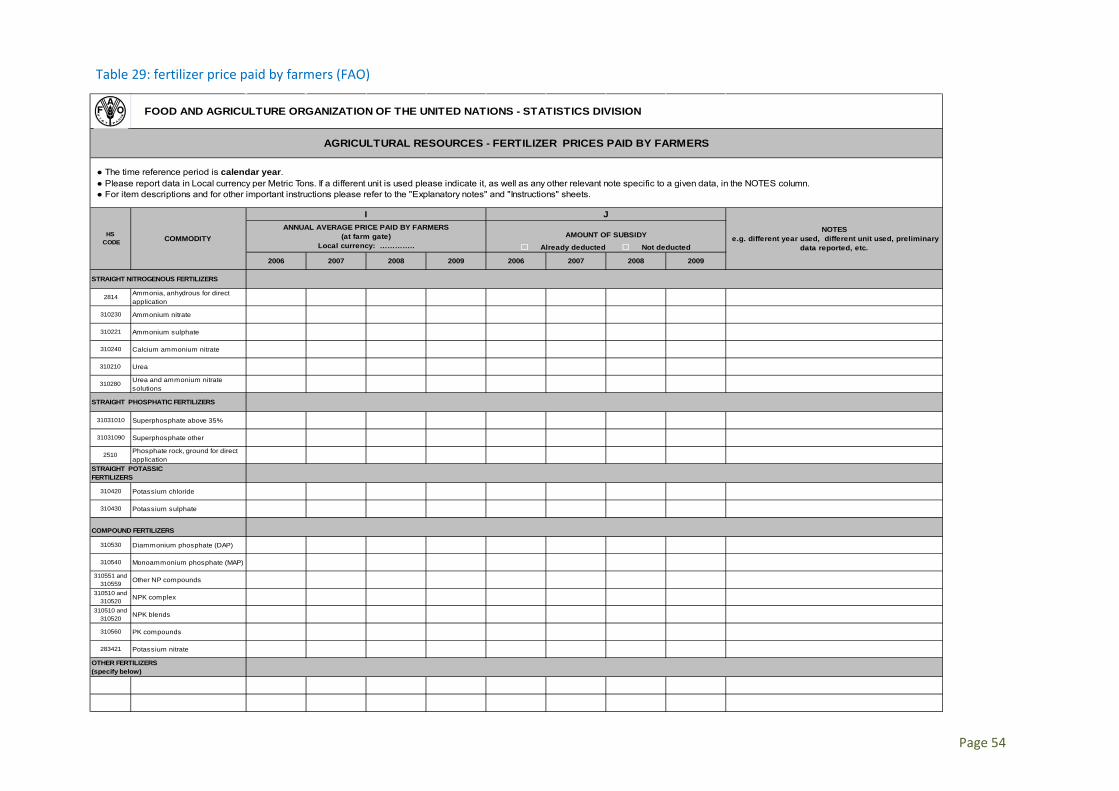
Table 29: fertilizer price paid by farmers (FAO)
2006 2007 2008 2009 2006 2007 2008 2009
2814 Ammonia, anhydrous for direct application
310230 Ammonium nitrate
310221 Ammonium sulphate
310240 Calcium ammonium nitrate
310210 Urea
310280 Urea and ammonium nitrate solutions
31031010 Superphosphate above 35%
31031090 Superphosphate other
2510 Phosphate rock, ground for direct application
310420 Potassium chloride
310430 Potassium sulphate
310530 Diammonium phosphate (DAP)
310540 Monoammonium phosphate (MAP)
310551 and 310559 Other NP compounds
310510 and 310520 NPK complex
310510 and 310520 NPK blends
310560 PK compounds
283421 Potassium nitrate
FOOD AND AGRICULTURE ORGANIZATION OF THE UNITED NATIONS - STATISTICS DIVISION
AGRICULTURAL RESOURCES - FERTILIZER PRICES PAID BY FARMERS
● The time reference period is calendar year. ● Please report data in Local currency per Metric Tons. If a different unit is used please indicate it, as well as any other relevant note specific to a given data, in the NOTES column. ● For item descriptions and for other important instructions please refer to the "Explanatory notes" and "Instructions" sheets.
HS CODE COMMODITY
I JNOTES
e.g. different year used, different unit used, preliminary data reported, etc.
ANNUAL AVERAGE PRICE PAID BY FARMERS(at farm gate)
Local currency: …………..AMOUNT OF SUBSIDY
Already deducted Not deducted
OTHER FERTILIZERS (specify below)
STRAIGHT NITROGENOUS FERTILIZERS
STRAIGHT PHOSPHATIC FERTILIZERS
STRAIGHT POTASSIC FERTILIZERS
COMPOUND FERTILIZERS
Page 54
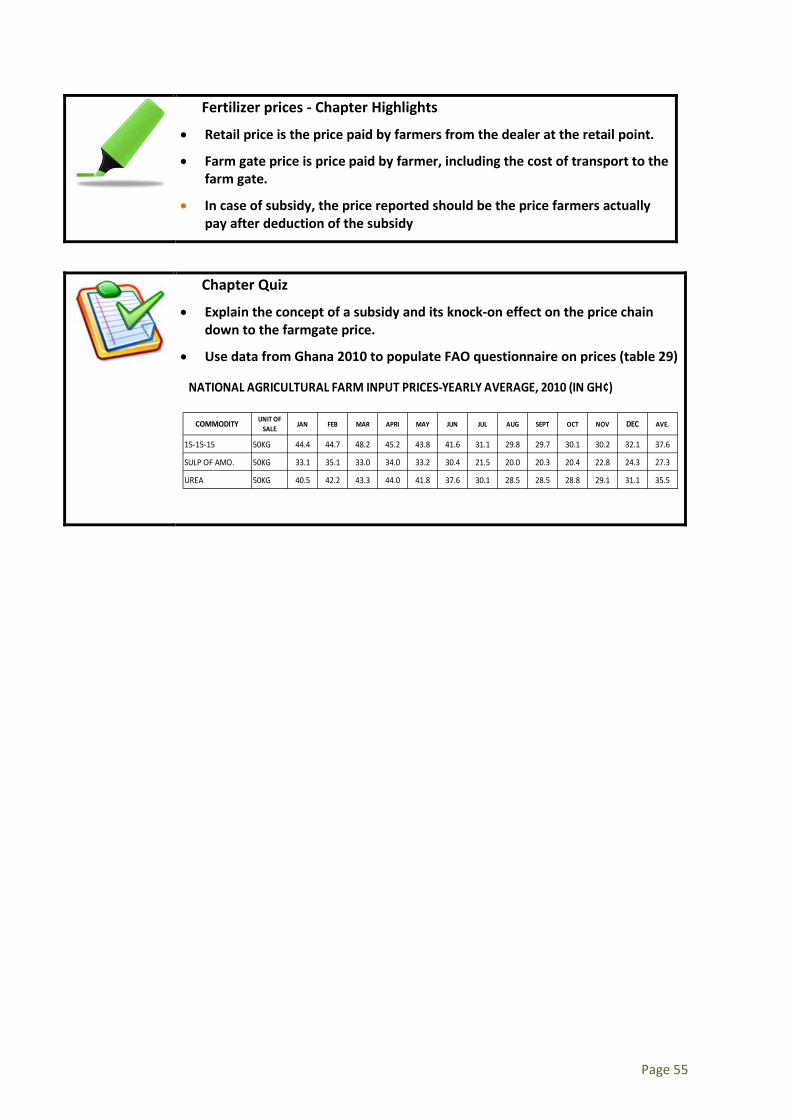
Fertilizer prices - Chapter Highlights
• Retail price is the price paid by farmers from the dealer at the retail point.
• Farm gate price is price paid by farmer, including the cost of transport to the farm gate.
• In case of subsidy, the price reported should be the price farmers actually pay after deduction of the subsidy
Chapter Quiz
• Explain the concept of a subsidy and its knock-on effect on the price chain down to the farmgate price.
• Use data from Ghana 2010 to populate FAO questionnaire on prices (table 29)
COMMODITY UNIT OF SALE JAN FEB MAR APRI MAY JUN JUL AUG SEPT OCT NOV DEC AVE.
15-15-15 50KG 44.4 44.7 48.2 45.2 43.8 41.6 31.1 29.8 29.7 30.1 30.2 32.1 37.6
SULP OF AMO. 50KG 33.1 35.1 33.0 34.0 33.2 30.4 21.5 20.0 20.3 20.4 22.8 24.3 27.3
UREA 50KG 40.5 42.2 43.3 44.0 41.8 37.6 30.1 28.5 28.5 28.8 29.1 31.1 35.5
NATIONAL AGRICULTURAL FARM INPUT PRICES-YEARLY AVERAGE, 2010 (IN GH¢)
Page 55

Chapter 4: Fertilizer “Soft Data” - Policy and Market Development Variables
The understanding of fertilizer statistics requires the explicit understanding of soft data. ‘Soft’ data is a mixture of both quantitative and qualitative data and is collected for policy and market development variables such as policies and regulations, taxes, quality control, fertilizer subsidies, etc. Therefore, this chapter presents the main policy and market development variables, and discusses the best methodologies for estimation and sources for this type of data.
Chapter Learning Objectives
• Know the different types of ‘soft’ data and understand their role in the development of fertilizer markets in Africa
• Understand the current situation in Africa vis-à-vis each of the soft data variables
• Know the ‘ideal’ situation with regards to each soft data variable and actions government can take
• Learn the best sources of this data
• Know how to calculate the indicators using the correct methodology
4.1 Guidelines for filling the questionnaire
The collection, use and application of soft data will be sourced from administrative and farm survey sources. The official statistics will be based on two main sources – data gathered from statistical surveys, and data extracted from administrative and management data systems. By using administrative and management data which is already available within administrative or management systems, rather than collecting data afresh, we will limit the overall burden placed on data providers, and also avoid the costs of mounting dedicated data collection exercises. In addition, the information extracted from such systems often has the advantage of being more timely than statistical data. `
Such data can be collected from country revenue authorities; statistical agencies; FAO; IFA; NEPAD and CountryStat among other sources. Therefore, for each data requirement we have two possible data sources:
o Administrative source: required data may already exist (secondary data) or is available but not yet collected
o Farm Survey source: the majority of countries conduct annual farm surveys but in many countries a fertilizer module is not included or a fertilizer module exists but it is not suitable for the calculation of the indicator (s), i.e. does not collect appropriate/relevant data
Page 56
• For every indicator, include a description of the variable, the data source and methodology used to calculate the indicator (see Tables).
• To facilitate data collection, countries should categorize questions according to data source and assign responsibilities accordingly. So, for example, data and information to be collected through interviews should be grouped together and assigned to Person A; whereas data to be collected by farm surveys should be collated and assigned to Person B.
• Data verification:
o For each response if an official document exists that substantiates your answer please attach a copy of this document to the completed questionnaire. Such documents would include: copies of the fertilizer law; customs documents showing government importation of fertilizers; newspaper articles, etc.
o Provide the official response but please also provide any additional documentation/anecdotal evidence from interviews with other sources particularly if the information differs from the official response.
4.2 Resolutions from the Abuja Declaration on Fertilizers use for an African Green Revolution
Note: The following resolutions are excluded:
• Resolution 11, which refers to the establishment of AFFM. AUC monitors and reports on progress on this resolution
• Resolution 12, which calls for NEPAD and the AUC to monitor and report on progress to the AU Heads of State. The questionnaires are filled annually by the countries and on this basis progress reports are compiled by NEPAD and submitted to the African Union Commission.
4.2.1 Resolution 1 - Increase fertilizer use from 8kg/ha (in 2006) to at least 50kg/ha by 2015
Average levels of fertilizer use in Africa are extremely low (10kg/ha) compared to the world average of over 100 kg/ha. Given the strategic importance of fertilizer in achieving the African Green Revolution to end hunger, the African Union Member States resolve to increase the level of use of fertilizer from the current average of 8 kilograms per hectare to an average of at least 50 kilograms per hectare by 2015.
Page 57
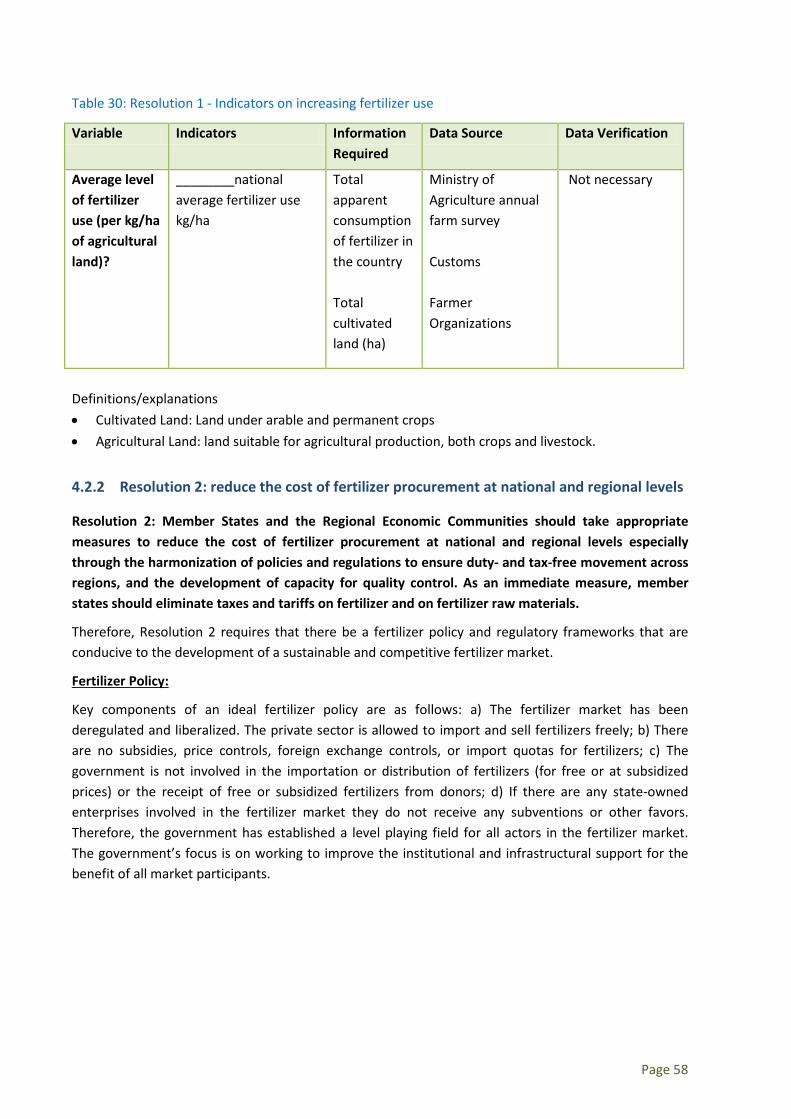
Table 30: Resolution 1 - Indicators on increasing fertilizer use
Variable Indicators Information Required
Data Source Data Verification
Average level of fertilizer use (per kg/ha of agricultural land)?
________national average fertilizer use kg/ha
Total apparent consumption of fertilizer in the country Total cultivated land (ha)
Ministry of Agriculture annual farm survey Customs Farmer Organizations
Not necessary
Definitions/explanations • Cultivated Land: Land under arable and permanent crops • Agricultural Land: land suitable for agricultural production, both crops and livestock.
4.2.2 Resolution 2: reduce the cost of fertilizer procurement at national and regional levels
Resolution 2: Member States and the Regional Economic Communities should take appropriate measures to reduce the cost of fertilizer procurement at national and regional levels especially through the harmonization of policies and regulations to ensure duty- and tax-free movement across regions, and the development of capacity for quality control. As an immediate measure, member states should eliminate taxes and tariffs on fertilizer and on fertilizer raw materials.
Therefore, Resolution 2 requires that there be a fertilizer policy and regulatory frameworks that are conducive to the development of a sustainable and competitive fertilizer market.
Fertilizer Policy:
Key components of an ideal fertilizer policy are as follows: a) The fertilizer market has been deregulated and liberalized. The private sector is allowed to import and sell fertilizers freely; b) There are no subsidies, price controls, foreign exchange controls, or import quotas for fertilizers; c) The government is not involved in the importation or distribution of fertilizers (for free or at subsidized prices) or the receipt of free or subsidized fertilizers from donors; d) If there are any state-owned enterprises involved in the fertilizer market they do not receive any subventions or other favors. Therefore, the government has established a level playing field for all actors in the fertilizer market. The government’s focus is on working to improve the institutional and infrastructural support for the benefit of all market participants.
Page 58
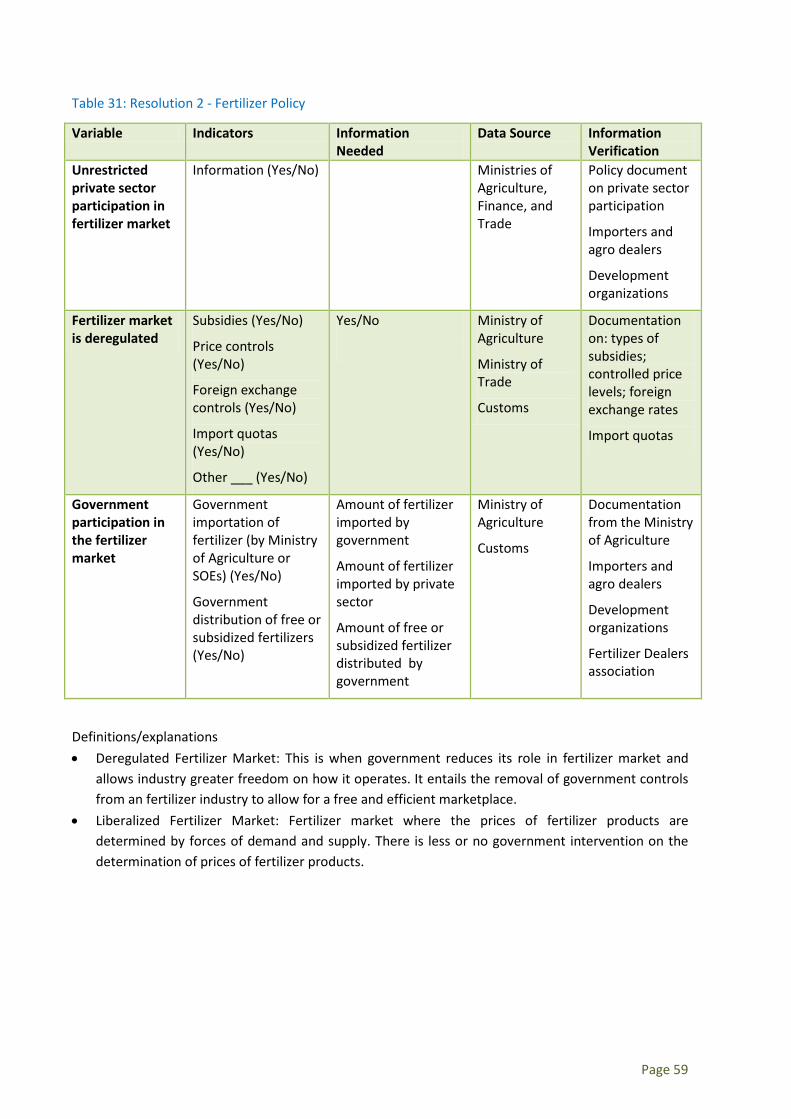
Table 31: Resolution 2 - Fertilizer Policy
Variable Indicators Information Needed
Data Source Information Verification
Unrestricted private sector participation in fertilizer market
Information (Yes/No) Ministries of Agriculture, Finance, and Trade
Policy document on private sector participation
Importers and agro dealers
Development organizations
Fertilizer market is deregulated
Subsidies (Yes/No)
Price controls (Yes/No)
Foreign exchange controls (Yes/No)
Import quotas (Yes/No)
Other ___ (Yes/No)
Yes/No
Ministry of Agriculture
Ministry of Trade
Customs
Documentation on: types of subsidies; controlled price levels; foreign exchange rates
Import quotas
Government participation in the fertilizer market
Government importation of fertilizer (by Ministry of Agriculture or SOEs) (Yes/No)
Government distribution of free or subsidized fertilizers (Yes/No)
Amount of fertilizer imported by government
Amount of fertilizer imported by private sector
Amount of free or subsidized fertilizer distributed by government
Ministry of Agriculture
Customs
Documentation from the Ministry of Agriculture
Importers and agro dealers
Development organizations
Fertilizer Dealers association
Definitions/explanations • Deregulated Fertilizer Market: This is when government reduces its role in fertilizer market and
allows industry greater freedom on how it operates. It entails the removal of government controls from an fertilizer industry to allow for a free and efficient marketplace.
• Liberalized Fertilizer Market: Fertilizer market where the prices of fertilizer products are determined by forces of demand and supply. There is less or no government intervention on the determination of prices of fertilizer products.
Page 59
The effective operations of the fertilizer market require a deregulated environment with minimal government interventions in the market. Governments together with other stakeholders should develop an enabling infrastructure that allows the market to operate freely.
Identify what market interventions by governments distort the free operation of the fertilizer market
Fertilizer Regulatory Frameworks
Countries should develop and implement robust fertilizer regulatory frameworks to ensure that fertilizers of good quality are sold in the market. Countries need to enact a fertilizer law that defines and regulates fertilizer products in the country and develop capacity for effective enforcement of the laws and regulations. Financial resources should be allocated to regulatory agencies and input associations to increase the availability of trained and competent inspectors and analysts to perform quality control functions. The ideal regulatory framework for fertilizer should be comprised of the following: a) compulsory registration of fertilizer manufacturers, importers, and agro dealers; b) Specification and registration of all fertilizers manufactured/imported and sold in the country; c) Guidelines on packaging and labeling on the fertilizer bags (truth-in-labeling); d) Appointment of enforcement agencies and hiring of inspectors; e) Establishment of quality control laboratories and hiring of analysts; f) Prohibition on manufacture/import and sale of non-standard/spurious/adulterated fertilizers. The framework should also have provisions for cancellation of authorization/registration certificates of importers and agro dealers and manufacturers as well as the enforceable punishment for offenders.
Table 32: Resolution 2 - Fertilizer Regulatory Frameworks
Variable Indicators Information Required
Data Source Information Verification
Formal legislation and regulatory framework for fertilizer
Title and date of enactment of Fertilizer Law
If no law exists, information on status of draft law and legislation
Fertilizer Law/Legislation
Ministry of Agriculture
Interviews agro dealers; regulatory bodies and relevant ministries
Attach fertilizer law if available
Relevant regulatory bodies
Inspections of importers and agro dealers premises and testing of fertilizer samples
No of fertilizer inspectors and analysts
No of inspections per year
No of tests per year
No of fertilizer inspectors and analysts
No of inspections per year
No of tests per year
Ministry of Agriculture
Interviews agro dealers; regulatory bodies and relevant ministries
Importers and agrodealers
Regulatory bodies
Definitions/explanations
Page 60
• Regulatory Framework: This is a model people can use to for reforming and enacting regulations in an effective and logical way. Such frameworks are then used to come up with laws and regulations that are flexible and responsive.
• Fertilizer quality is effectively managed and ensured through regulation that monitors all quality variables.
• Regulation ensures compliance as set put in the verification exercises. • Low fertilizer production in Africa with less inter and intra regional trade in
fertilizer products.
1. Why is it important to ensure that the quality of fertilizer is monitored ? 2. What are the major challenges that are faced by countries in ensuring
compliance with fertilizer regulatory frameworks ?
Tariffs and Taxes on Fertilizer
Resolution 2 of the Abuja Declaration 2006 also calls for governments to eliminate tariffs and taxes on Fertilizer. Low fertilizer production in sub-Saharan Africa requires that the fertilizer deficit is met through imports. These imports are mainly from outside Africa. Import tariffs have the effect of increasing the price farmers pay for fertilizers in Africa. Fertilizer is also subjected to taxes which inflate the price. The most typical tax imposed on fertilizers is value-added tax (VAT) which can range anywhere from 15-20%. VAT is typically calculated as a tax rate (%) on the sales value of the fertilizer. Countries may also impose VAT on services and transport of fertilizers and other inexplicable taxes such as withholding tax. Third, customs duty is levied by customs offices on fertilizers, typically in the range of 2.5% of the value of the imported fertilizer. Other taxes include fees charged at the ports and at the borders.
As noted in Chapter 1, there was an unprecedented increase in fertilizer prices in 2007/2008, and although prices have since come down from these unprecedented heights, they have not returned to their pre-2007 levels. Global fertilizer prices continue to be at historically high levels, placing them out of reach of the majority of small-scale farmers in SSA. Reducing import tariffs and customs duties, as well as domestic taxes on fertilizers can lower the price African farmers pay for fertilizers.
Table 33: Resolution 2 - Taxes, tariffs and customs duties on fertilizers
Variable Indicators Information Data Source Information
Page 61
required Verification Import tariffs on fertilizers
Import tariff (Yes/No)
Import tariff (%)
Import tariffs Ministry of Agriculture
Ministry of Finance
Supporting documents e.g. customs law Importers
VAT on fertilizer VAT on fertilizer (Yes/No)
VAT (%)
VAT rates Ministry of Agriculture
Ministry of Finance
Supporting documents
Importers
Customs duty on fertilizers
Customs duty on fertilizers (Yes/No)
Customs duty (%)
Customs duty thresholds
Custom duty rates
Ministry of Agriculture
Ministry of Finance
Supporting documents
Importers
Port charges on fertilizer imports (e.g. IDF Levy)
Port charges on fertilizer imports (Yes/No)
Port charges:
IDF Levy
Other _____
Port charges on fertilizer imports
IDF Levy
Ministry of Agriculture
Ministry of Finance
Supporting documents
Importers
Port Authority
Other fees and taxes imposed on fertilizers
Other (Yes/No)
Other fees and taxes:
Withholding tax (%)
Other _____
Ministry of Agriculture
Ministry of Finance
Supporting documents
Importers
Definitions/explanations • Import tariffs: Tax levied on the on the value including freight and insurance of imported fertilizer
• Value-Added Tax (VAT): This is a of consumption tax that is placed on a product whenever value is added at a stage of production and at final sale
• Customs Duty: A tax levied on imports (and, sometimes, on exports) by the customs authorities of a country to raise state revenue, and/or to protect domestic industries from more efficient or predatory competitors from abroad. Customs duty is based generally on the value of goods or upon the weight, dimensions.
• IDF Levy: This is a duty called Imports Declaration Fee and is levied on CIF subject to minimum payable.
• Global prices of fertilizers continue to escalate beyond the reach of farmers in SSA. • Customs duties and import tariffs also add up to the increasing prices of fertilizers
leading to marked cost induced reduction in fertilizer use.
State the major reasons why some governments in SSA are reluctant to totally remove import tariffs and duties on fertilizers.
Page 62
4.2.3 Resolution 3 - Development of agro dealer networks
During the summit the critical role of agro dealers was noted. Resolution 3 of the Abuja declaration 2006 implored countries to formulate policies that deliberately develop agro dealer networks. Agro-dealers are small retailers and stockists who sell fertilizers and other agricultural inputs directly to small-scale farmers.
However, they are typically concentrated in main towns or district headquarters rather than in rural areas close to the farm gate. This makes it difficult for farmers to access inputs. It is common for small-scale farmers to travel 10- 20km jus to purchase a bag of fertilizers and at the end of their journey they frequently find that the fertilizer is out of stock.
Moreover, the quantity and quality of agro dealers is limited. The number of agro dealers in a country is typically inadequate to reach the whole of the smallholder farming community. Additionally, marketing and technical skills of stockists are inadequate and they do not have full product knowledge and information about input recommendations. In order to improve the skills of dealers, there is a need for training and technical assistance.
Lack of access to affordable fertilizers has made it virtually impossible for small-scale farmers in Africa to improve their food security and incomes, reinforcing widespread poverty. There is a need to develop a network of skilled and knowledgeable agro dealers located close to the farm gates who make fertilizers available to farmers in a variety of bag sizes, at affordable prices, and in a timely manner.
Page 63

Table 34: Resolution 3 - Development of agro dealer networks
Variable Indicators Information required
Data Source Information Verification
Private sector share of the fertilizer market
% of fertilizer imported by private sector
Amounts of fertilizer imported last year by government and private sector(
Ministry of Agriculture
Ministry of Trade
Customs
Ministry of Finance
Supporting documentation
Importers
Subsidized fertilizer share of the
market
% of total fertilizer imported for the government fertilizer subsidy program?
Total fertilizer imported
Total fertilizer imported for subsidy program
Ministry of Agriculture
Ministry of Trade
Agrodealer associations
Development projects
Supporting documentation
Importers
Spatial coverage of agrodealer network
Number of agrodealers
Average distance traveled by farmer to purchase fertilizer
Number of agrodealers
Distance travelled by each farmer
Number of farmers
Ministry of Agriculture
Supporting documentation
Importers
Efficiency of agrodealer network
Average retail price
Ratio average retail price/c.i.f price
Prices charged by agrodealers
CIF prices
Retailers/agrodealers survey
MIS (AMITSA etc.)
Ministry of Agriculture
Effectiveness of agrodealer network
% small-scale farmers using chemical fertilizers
Number of small scale farmers (< 2 hectares)
Number of small scale farmers using chemical fertilizer
Ministry of Agriculture annual farm survey
Development partners
Importers
Service provision to farmers
Variety of bag sizes sold by agro dealers (50kg, 25kg, 10kg, etc.)
Bag sizes sold bt agro dealers
Interviews/agro dealer survey
Ministry of Agriculture
Definitions/explanations: • No.1) Total amount of fertilizer imported by the government (No. 2) No.1 minus No. 2) equals:
Total amount of fertilizer imported by private sector (No.3) • % imported by the private sector: the focus here is on the quantity imported by the private sector
for its own distribution network. Therefore, quantities imported by the private sector for the government subsidy program should be excluded.
Page 64
• Agro dealers play a critical role in the easy accessibility of agro-inputs. • The networks of the dealers are still limited.
Why are agro dealer networks not well developed?
4.2.4 Resolution 4 - develop and strengthen the capacity of the private sector
Resolution 4 calls for governments to take concrete measures to develop and strengthen the capacity of the private sector
The private sector has a critical role to play in the increased supply and use of fertilizers by small-scale farmers in sub-Saharan Africa. In the liberalized African fertilizer market, it is incumbent upon the government to create a conducive business and investment environment to encourage private sector participation and investment in the fertilizer market.
Private sector participation is influenced by factors such as: market size; availability of raw materials for production/blending, macroeconomic environment (exchange rate, interest rate, rural infrastructure); anti-corruption laws; trade regulations; level of political stability; access to finance and technology; and institutions and support services. In many cases, the private sector also lacks the capacity to provide the essential services required by farmers.
The government needs to gain a better understanding of the perceptions, activities and business environment the private sector is operating in, identify the gaps and needs, and on this basis intervene effectively to build the capacity of the private sector to serve the small-scale farming community.
The private sector needs to make available the correct type of fertilizers, at an affordable price, at the right place and in a timely manner. The government can enhance the capacity of the private sector to participate in the fertilizer markets through: investment in rural infrastructure; provision of tax incentives; and promotion of public-private partnerships.
Page 65

Table 35: Resolution 4 - Capacity building for the private sector
Variable Indicators Information required
Data Source Information Verification
Training courses/workshops by the government and/or development partners
No. of training courses/workshops for private sector per year
No. of trainings by Government
No. of trainings by Development partners
Ministry of Agriculture
Relevant development partners
Agrodealer association
Tax breaks and/or subsidies (low-interest government loans, etc)
Information and (%)
Low interest government loans
Tax breaks
Subsidies forms
Ministry of Agriculture
Relevant development partners
Agrodealer association
Establishment of public-private partnerships with agri-input businesses
No. of PPPs and details
PPP agreements
Ministry of Agriculture
Relevant development partners
Agrodealer association
Other (specify): -_______
Depends on the type of intervention
Ministry of Agriculture
Relevant development partners
Agrodealer association
Definitions/explanations • Tax Breaks: any item which reduces tax, including any tax exemption, tax deduction, or tax credit.
• Public Private Partnerships: describes a government service or private business venture which is funded and operated through a partnership of government and one or more private sector companies. PPP involves a contract between a public sector authority and a private party, in which the private party provides a public service or project and assumes substantial financial, technical and operational risk in the project.
• The private sector plays a critical developmental role in promoting the increased use of fertilizer in SSA.
• The private sector faces capacity gaps and requires Government support for them to better serve the community
1. What are the major reasons why some governments seem not to appreciate the role that is played by the private sector in increasing the use of fertilizers ?
2. State the major capacity constraints that are faced by the private when assisting farmers
Page 66
4.2.5 Resolution 5 - Improve farmers’ access to fertilizer by granting targeted subsidies
Resolution 5: Improve farmers’ access to fertilizer by granting targeted subsidies with special attention to poor farmers.
A subsidy is a government policy of making a private good available at below market price. A subsidy usually takes the form of a cash payment to producers/consumers. However, if the government procures goods, such as food grains, at higher than market prices or if it sells as lower than market prices, subsidies are implied. A subsidy can also take many invisible forms: it may be hidden in reduced tax-liability, low-interest government loans, or government equity participation.
Transfers which are straight income supplements need to be distinguished from subsidies. An unconditional transfer to an individual would augment his income and would be distributed over the entire range of his expenditures. A subsidy however refers to a specific good, the relative price of which has been lowered because of the subsidy with a view to changing the consumption/ allocation decisions in favor of the subsidized goods. Even when subsidy is hundred %, i.e. the good is supplied free of cost, it should be distinguished from an income-transfer (of an equivalent amount) which need not be spent exclusively on the subsidized good
Historically, fertilizer subsidies have played a major role in boosting agricultural productivity and food production. Fertilizer subsidies were a central component of the Green Revolutions in Asian and Latin America. In recent years, many African governments have reintroduced fertilizer subsidies in the wake of the call in 2006 by African Heads of State for the introduction of targeted fertilizer subsidies through the Abuja Declaration on Fertilizers for an African Green Revolution; the oil crisis that caused an unprecedented increase in fertilizer prices between January 2007 and mid-2008; and the soaring food prices of 2007/2008 which resulted in many food import-dependent countries in Africa being unable to purchase adequate food stocks to meet their domestic consumption requirements. The emerging demand for biofuels as an energy alternative put further pressure on maize prices and hence fertilizers prices.
The economic justification for fertilizer subsidies is usually one of the following:
• Efficiency: fertilizer use by farmers sub-optimal because of lack of information; lack of liquidity; or risk aversion. (value of incremental production should exceed the cost of subsidy)
• Equity: transfer income to farmers who are poor or live in remote areas, (or both) and cannot afford to use fertilizers (poor but viable).
• Externalities: Fertilizer subsidies justified if fertilizer use generates benefits to others beside the farmer. For example: fertilizer increases plant growth which reduces soil erosion and run-off which then benefits other farmers downstream.
In SSA, subsidies typically take the form of free fertilizers or a subsidy on price. Subsidies on fertilizer in Africa are on average 50% of the market price.
The subsidy can take the form of universal (non-targeted) distribution of free or subsidized fertilizers to the general farming population (typically via government organs) or it can be targeted (via government organs or the private sector). A non-targeted fertilizer subsidy is a subsidy on the price of fertilizer (as illustrated in the table above) and anyone with the money to pay the subsidized price can access the subsidized fertilizer.
Page 67
The subsidized fertilizer is typically made available by the government organs (it does not use the private sector distribution networks). This type of non-targeted subsidy system has two drawbacks: 1) Farmers who can afford to buy fertilizers at market price can also benefit from the subsidy which leaves less available for farmers who cannot afford to purchase fertilizer at market price, or can only afford to purchase small quantities; 2) It weakens the private sector (“crowding out” effect”) because farmers who can afford to buy fertilizer at market price will instead choose to purchase the subsidized fertilizers, leaving the private sector with unsold stock. The following year, if the subsidy continues, the private sector will import smaller quantities if at all, thus weakening the private sector network.
The Abuja Declaration called for targeted subsidies. A targeted subsidy is aimed at a particular segment of the farming population depending on the objective of the subsidy program.
If the purpose of the subsidy is to boost food production, then the subsidy should be targeted to farmers who already use fertilizers and know how to use them efficiently, but are unable to buy sufficient quantities. Then a subsidy of 25% or 50% will boost their purchasing power so they can afford to buy larger quantities of fertilizers and increase their total output.
If the purpose of the subsidy is to increase food security, then the subsidy should targeted small-scale farmers that are currently non-users as they are too poor to purchase fertilizers.
In either case, the subsidy has to use an instrument to target the desired segment of the farming population. An instrument that has gained popular use is an input voucher. This is a certificate which entitles farmers to buy inputs at a subsidized price. The input vendor (agrodealer) can redeem the voucher for cash from the government.
A targeted subsidy can be administered by government organs or the private sector. In the latter case, the input voucher can be redeemed by farmers at their local agrodealer. This has the advantage of strengthening the linkages between the farming community and the private sector input delivery network and in the case where the objective of the subsidy is food security, the subsidy program will not crowd-out the private sector but rather begin to create linkages with a new customer base.
Page 68
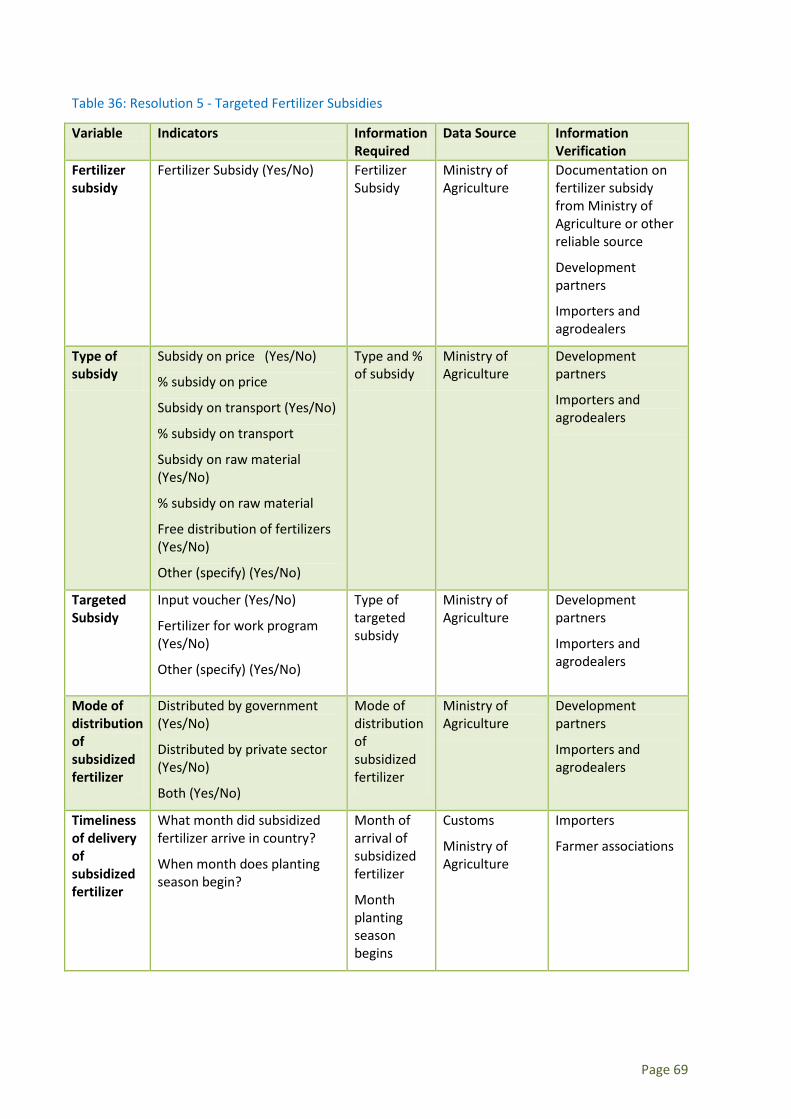
Table 36: Resolution 5 - Targeted Fertilizer Subsidies
Variable Indicators Information Required
Data Source Information Verification
Fertilizer subsidy
Fertilizer Subsidy (Yes/No)
Fertilizer Subsidy
Ministry of Agriculture
Documentation on fertilizer subsidy from Ministry of Agriculture or other reliable source
Development partners
Importers and agrodealers
Type of subsidy
Subsidy on price (Yes/No)
% subsidy on price
Subsidy on transport (Yes/No)
% subsidy on transport
Subsidy on raw material (Yes/No)
% subsidy on raw material
Free distribution of fertilizers (Yes/No)
Other (specify) (Yes/No)
Type and % of subsidy
Ministry of Agriculture
Development partners
Importers and agrodealers
Targeted Subsidy
Input voucher (Yes/No)
Fertilizer for work program (Yes/No)
Other (specify) (Yes/No)
Type of targeted subsidy
Ministry of Agriculture
Development partners
Importers and agrodealers
Mode of distribution of subsidized fertilizer
Distributed by government (Yes/No)
Distributed by private sector (Yes/No)
Both (Yes/No)
Mode of distribution of subsidized fertilizer
Ministry of Agriculture
Development partners
Importers and agrodealers
Timeliness of delivery of subsidized fertilizer
What month did subsidized fertilizer arrive in country?
When month does planting season begin?
Month of arrival of subsidized fertilizer
Month planting season begins
Customs
Ministry of Agriculture
Importers
Farmer associations
Page 69
Targeted Subsidies promote the use of fertilizer in communities in a way that benefits both farmers and the private sector.
Many African governments have reintroduced fertilizer subsidies in the wake of the call in 2006 by African Heads of State for the introduction of targeted fertilizer subsidies through the Abuja Declaration on Fertilizers for an African Green Revolution.
Fertilizer subsidies in some countries have resulted in massive corruption and the beneficiaries abusing the schemes. Some scholars have argued against subsidies saying they distort the market the stakeholders want to freely operate.
Should we promote subsidies? If yes, what needs to be done to ensure that they are put to effective use.
4.2.6 Resolution 6 - Investments in infrastructure
Resolution 6: Accelerate investments in infrastructure, particularly transport, and other measures to improve output market incentives
Demand for fertilizer is derived from the final demand for the crops being produced. Therefore access to output markets is an important determinant of farmer incentives to use fertilizers
Table 37: Resolution 6 - Indicators on investments to improve output market incentives
Variable Indicators Information
Required
Data Source Information Verification
Aaverage distance farmers travel (to the nearest district town or wholesale market) to sell their maize (or equivalent staple food crop)?
Aaverage distance traveled _____km
Distance to nearest market from famers
Number of farmers who responded
Ministry of Agriculture annual farm survey
Agrodealer associations
MIS
Ministry of Agriculture
Average transport cost per 50kg bag of fertilizer from a retailer in a large district town to the farm-gate?
Average transport cost per 50kg bag of $_______
Number of farmers
Average transport cost per 50kg bag of fertilizer from a retailer to farm-gate
Farmer Organizations
Ministry of Agriculture
Investment in infrastructure is very critical for the development of agriculture in Africa. The infrastructural developments include roads and rail networks. This should be supported by fiscal incentives which all lead to support of the output market
Page 70
List the infrastructure and fiscal incentives that governments can put in place to support output markets
4.2.7 Resolution 7 - Establish national financing facilities for agri-input businesses.
Resolution 7 of Abuja Declaration 2006 calls for member states to establish national financing facilities for agri-input businesses.
Importers and agro dealers in SSA are severely constrained in their activities limited access to finance and liquidity; they often use their own savings to start a business. Some of them get suppliers’ credit, but very few of them are able to borrow from commercial or development banks. Resolution 7 of Abuja Declaration 2006 calls for member states to Establish national financing facilities for agri-input businesses. Commercial banks are reluctant to lend to agriculture because of high risk; they impose stringent collateral requirements to minimize the risk of default. While finance is critical to business development, its non-availability adds to transaction costs and restricts the scale of business operations. Few dealers have adequate personal savings to expand the scale of business operations or start a new business.
The following three innovations can assist in removing the financial constraints and improving access to finance for imports and agrodealers in the country.
1. Credit Guarantee Funds: The main goal of this fund is to build solid business linkages between importers and agrodealers on the one hand, and commercial banks on the other, by reducing risk for the bank. The arrangement would be as follows: any importer or agrodealer who is interested in starting or expanding the fertilizer business should provide a certain %age (for example, 30%) of the needed capital and the participating commercial bank should provide the balance (for example) 70% of the needed funds, but the commercial bank should get a guarantee for these funds from a fertilizer fund that has been set up by the government. Hence, this arrangement spreads the risk of financing the fertilizer business across importers and agrodealers, commercial banks, and society at large (represented by the government).
2. Supplier’s credit: Over time and with goodwill, dealers should be linked with wholesalers and importers who could provide 30-60 days credit, thereby reducing the dependence on the fund. Likewise, importers could be linked with global suppliers to get supplier’s credit.
3. Warehouse collateral arrangement can further reduce the borrowing needs of dealers and importers. A supplier/dealer can bring a large quantity of fertilizer and leave it in a warehouse where the dealer and the commercial bank can have joint ownership, but the bank can release this quantity in small lots so the dealer does not have to arrange for huge sums.
Table 38: Resolution 7- Improving Access to Finance
Variable Indicators Information required
Data Source Information Verification
Public-private initiatives to improve access
PPP initiatives (Yes/No)
Number of
PPP agreements Ministry of Agriculture
Supporting documentation
Page 71
to finance for importers and agrodealers
initiatives
Importers and agrodealer survey
Importers and agrodealers
Development partners
Credit guarantee funds
Credit guarantee funds (Yes/No)
Number of funds
Credit guarantee agreements
Ministry of Agriculture
Importers and agrodealer survey
Interviews with banks
Supporting documentation
Importers and agrodealers
Development partners
Suppliers’ credit Suppliers’ credit (Yes/No)
No. of arrangements
Suppliers’ credit agreements
Importers and agrodealers survey
Supporting documentation
Development partners
Warehouse collateral arrangements
Warehouse collateral arrangements (Yes/No)
No. of arrangements
Warehouse collateral arrangements
Importers and agrodealers survey
Interviews with banks
Supporting documentation
Ministry of Agriculture
Development partners
Small businesses in the fertilizer market face funding and liquidity problems. Innovative funding mechanisms should be designed by stakeholders to promote the development of importers and agro dealers.
What are the major reasons why agro dealers and small farmers find it difficult to secure financing from established financial institutions?
4.2.8 Resolution 8 - Regional Fertilizer Procurement and Distribution Facilities
Resolution 8 requires member states to establish Regional Fertilizer Procurement and Distribution Facilities with the support of the African Development Bank, the Economic Commission for Africa, the Regional Economic Communities, and the Regional Development Banks, through strategic public-private partnerships.
Individual country fertilizer purchases are very small and are generally expensive. Fertilizer markets in SSA are typically less than 100,000 tons. As a result, the individual countries cannot realize economies of scale in procurement and transportation, so they end up paying higher prices for imported fertilizers. Regional procurement of fertilizers is a potential solution to this problem. It refers to the joint procurement of fertilizers by importers in two or more countries in a region to realize economies of
Page 72
scale in procurement, shipping and transportation through bulk purchasing. Ideally, this pooling of import transactions should be private sector based. National governments and development partners can support the initiative by facilitating business linkages between the traders of various countries by providing relevant training, technical assistance, policy workshops and study tours.2
Table 39: Resolution 8 - Regional Fertilizer Procurement
Variable Indicators Information required
Data Source Information Verification
Initiatives to promote regional procurement?
Regional procurement initiatives (Yes/No) Information
Regional procurement agreements
Interviews with importers Ministry of Agriculture
Development partners
Fertilizer trade in Africa should be encouraged. Countries and RECs should quantify and valuate this trade to improve the knowledge base regarding how much fertilizer trade is already taking place on the continent and how to increase this trade.
State the major constraints on regional procurement
4.2.9 Resolution 9 - promote national and regional fertilizer production and trade
Resolution 9 calls for member states to promote national and regional fertilizer production and intra-regional fertilizer trade to capture a bigger market and take advantage of economies of scale through appropriate measures such as tax incentives and infrastructure development.
Africa has raw materials for fertilizer production. Significant quantities of natural gas are found in Algeria, Angola, Democratic Republic of Congo, Egypt, Equatorial Guinea, Ethiopia, Madagascar, Mozambique, Namibia, Nigeria, Tanzania and Tunisia. There are numerous phosphate rock and potash deposits throughout Africa. However, the deposits of these raw materials in many countries are too small to be commercially viable. For example, only Algeria, Egypt, Togo, Tunisia and Senegal have deposits that are substantial enough to be of economic significance. This is due to unsuitable quantity and/or quality of the raw material, resources that are poorly located in relation to domestic and export markets and/or markets that are too small to realize economies of scale in production.
At the moment, production is concentrated in North Africa and South Africa. Three countries in North Africa, including Egypt and Tunisia, account for 92 % of production. South Africa is the fourth-largest fertilizer producer in Africa. The main fertilizer producers in Sub-Saharan Africa are Mauritius, Senegal and Zimbabwe. Nigeria has also recently resumed production.
Total continental production is 5,791,436 mt of nutrients, which is equivalent to 4 % of world production. South Africa produces phosphate fertilizers, while countries in North Africa, including
2 Gregory D.I. and Balu Bumb (2006), “Factors Affecting Supply of Fertilizer in Sub-Saharan Africa” Agriculture and Rural Development Discussion Paper 24, World Bank.
Page 73
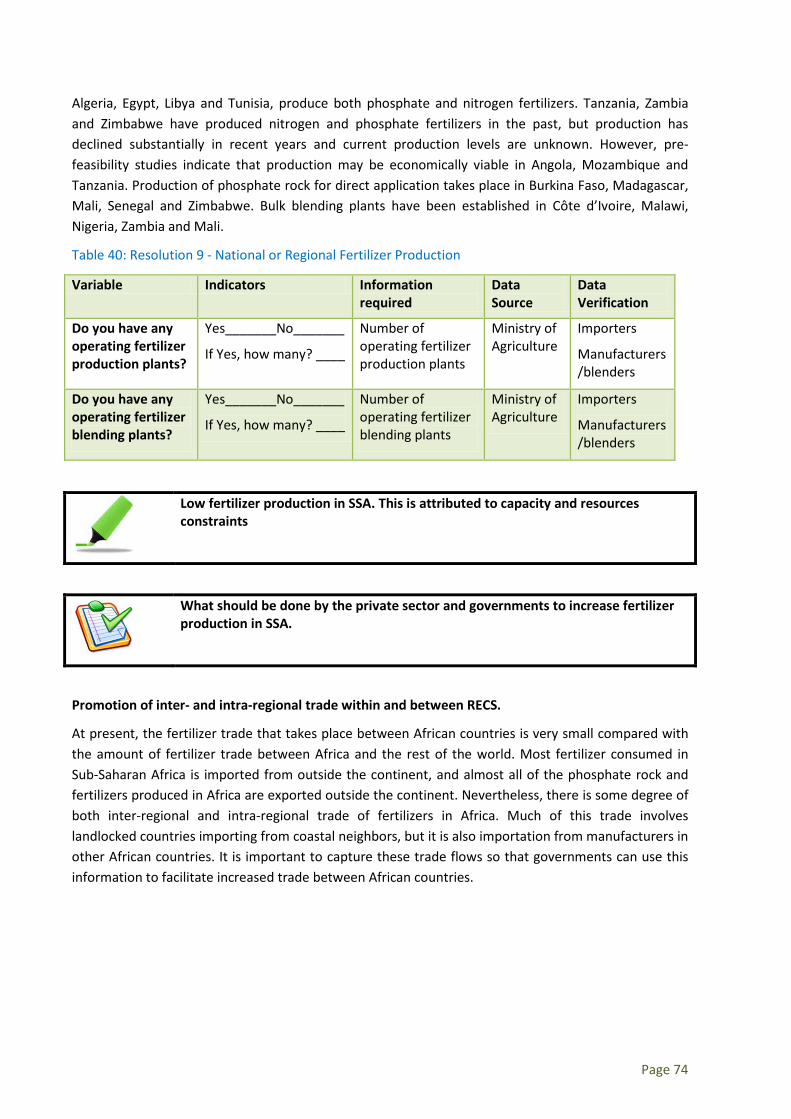
Algeria, Egypt, Libya and Tunisia, produce both phosphate and nitrogen fertilizers. Tanzania, Zambia and Zimbabwe have produced nitrogen and phosphate fertilizers in the past, but production has declined substantially in recent years and current production levels are unknown. However, pre-feasibility studies indicate that production may be economically viable in Angola, Mozambique and Tanzania. Production of phosphate rock for direct application takes place in Burkina Faso, Madagascar, Mali, Senegal and Zimbabwe. Bulk blending plants have been established in Côte d’Ivoire, Malawi, Nigeria, Zambia and Mali.
Table 40: Resolution 9 - National or Regional Fertilizer Production
Variable Indicators Information required
Data Source
Data Verification
Do you have any operating fertilizer production plants?
Yes_______No_______
If Yes, how many? ____
Number of operating fertilizer production plants
Ministry of Agriculture
Importers
Manufacturers/blenders
Do you have any operating fertilizer blending plants?
Yes_______No_______
If Yes, how many? ____
Number of operating fertilizer blending plants
Ministry of Agriculture
Importers
Manufacturers/blenders
Low fertilizer production in SSA. This is attributed to capacity and resources constraints
What should be done by the private sector and governments to increase fertilizer production in SSA.
Promotion of inter- and intra-regional trade within and between RECS.
At present, the fertilizer trade that takes place between African countries is very small compared with the amount of fertilizer trade between Africa and the rest of the world. Most fertilizer consumed in Sub-Saharan Africa is imported from outside the continent, and almost all of the phosphate rock and fertilizers produced in Africa are exported outside the continent. Nevertheless, there is some degree of both inter-regional and intra-regional trade of fertilizers in Africa. Much of this trade involves landlocked countries importing from coastal neighbors, but it is also importation from manufacturers in other African countries. It is important to capture these trade flows so that governments can use this information to facilitate increased trade between African countries.
Page 74

Table 41: Resolution 9 - promote inter- and Intra-REC Fertilizer Trade
Variable Indicators Information required Data Source Data Verification
Do you import fertilizers from other countries in Africa?
Information (Yes/No)
List of countries
Fertilizer imported from other countries in Africa
Importers
Use Customs database
Customs
Number of tons and/or %age of total fertilizer imports that are imported from other African countries annually
______ (tons)
______ (%)
Total fertilizer imported
Total fertilizer imported from other African countries
Importers
Use Customs database
Customs
Export of nationally produced fertilizers to other African countries?
Information (Yes/No)
List of countries
Total fertilizer exported
Total fertilizer exported to other African countries
Importers
Use Customs database
Customs
Number of tons and/or %age of total fertilizers produced that are exported to other African countries annually?
______ (tons)
______ (%)
Total fertilizer exported
Total fertilizer exported to other African countries
Manufacturers/blenders
Use Customs database
Customs
Low fertilizer production in Africa with less inter and intra regional trade in fertilizer products.
Explain why there is limited inter and intra regional trade in fertilizer products
4.2.10 Resolution 10 - Improve farmer access to complementary inputs.
Resolution 10 of the Abuja Declaration 2006 calls on member states to improve farmer access to complementary inputs.
Farmers will only obtain the full benefit of fertilizer use if they use fertilizers in conjunction with hybrid seeds and water. Crop protection products (pesticides, herbicides, and fungicides) are also critical to ensure the crop reaches its full growth potential and for protection of the crop post-harvest. Farmers also need knowledge regarding the correct use of fertilizers and these other inputs and this is best accomplished through technology transfer activities (on-farm trials and field demonstrations).
Page 75
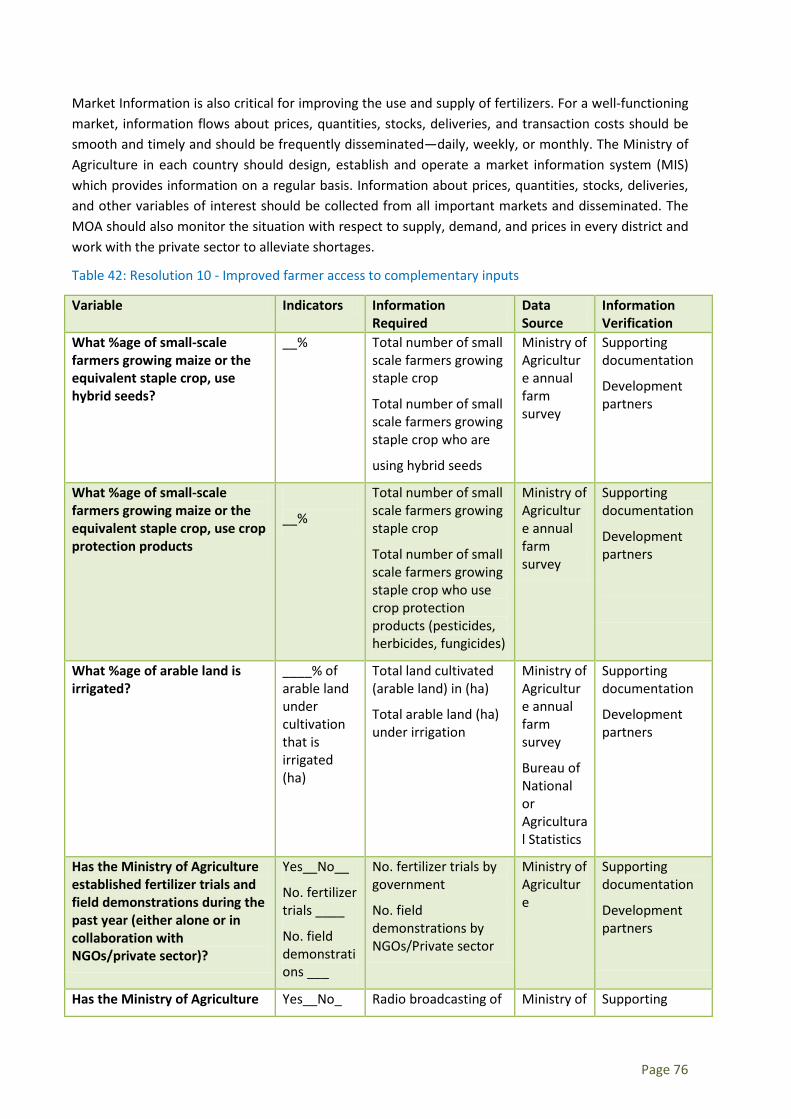
Market Information is also critical for improving the use and supply of fertilizers. For a well-functioning market, information flows about prices, quantities, stocks, deliveries, and transaction costs should be smooth and timely and should be frequently disseminated—daily, weekly, or monthly. The Ministry of Agriculture in each country should design, establish and operate a market information system (MIS) which provides information on a regular basis. Information about prices, quantities, stocks, deliveries, and other variables of interest should be collected from all important markets and disseminated. The MOA should also monitor the situation with respect to supply, demand, and prices in every district and work with the private sector to alleviate shortages.
Table 42: Resolution 10 - Improved farmer access to complementary inputs
Variable Indicators Information Required
Data Source
Information Verification
What %age of small-scale farmers growing maize or the equivalent staple crop, use hybrid seeds?
__% Total number of small scale farmers growing staple crop
Total number of small scale farmers growing staple crop who are
using hybrid seeds
Ministry of Agriculture annual farm survey
Supporting documentation
Development partners
What %age of small-scale farmers growing maize or the equivalent staple crop, use crop protection products
__%
Total number of small scale farmers growing staple crop
Total number of small scale farmers growing staple crop who use crop protection products (pesticides, herbicides, fungicides)
Ministry of Agriculture annual farm survey
Supporting documentation
Development partners
What %age of arable land is irrigated?
____% of arable land under cultivation that is irrigated (ha)
Total land cultivated (arable land) in (ha)
Total arable land (ha) under irrigation
Ministry of Agriculture annual farm survey
Bureau of National or Agricultural Statistics
Supporting documentation
Development partners
Has the Ministry of Agriculture established fertilizer trials and field demonstrations during the past year (either alone or in collaboration with NGOs/private sector)?
Yes__No__
No. fertilizer trials ____
No. field demonstrations ___
No. fertilizer trials by government
No. field demonstrations by NGOs/Private sector
Ministry of Agriculture
Supporting documentation
Development partners
Has the Ministry of Agriculture Yes__No_ Radio broadcasting of Ministry of Supporting
Page 76
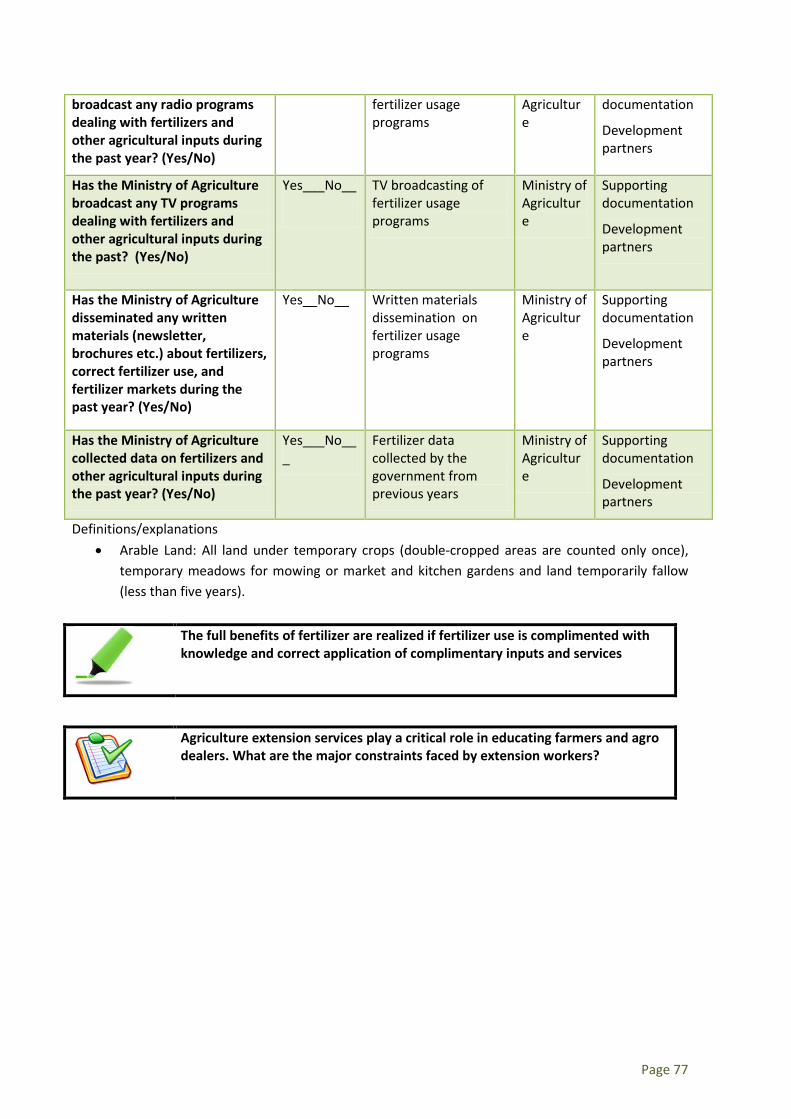
broadcast any radio programs dealing with fertilizers and other agricultural inputs during the past year? (Yes/No)
fertilizer usage programs
Agriculture
documentation
Development partners
Has the Ministry of Agriculture broadcast any TV programs dealing with fertilizers and other agricultural inputs during the past? (Yes/No)
Yes___No__
TV broadcasting of fertilizer usage programs
Ministry of Agriculture
Supporting documentation
Development partners
Has the Ministry of Agriculture disseminated any written materials (newsletter, brochures etc.) about fertilizers, correct fertilizer use, and fertilizer markets during the past year? (Yes/No)
Yes__No__
Written materials dissemination on fertilizer usage programs
Ministry of Agriculture
Supporting documentation
Development partners
Has the Ministry of Agriculture collected data on fertilizers and other agricultural inputs during the past year? (Yes/No)
Yes___No___
Fertilizer data collected by the government from previous years
Ministry of Agriculture
Supporting documentation
Development partners
Definitions/explanations • Arable Land: All land under temporary crops (double-cropped areas are counted only once),
temporary meadows for mowing or market and kitchen gardens and land temporarily fallow (less than five years).
The full benefits of fertilizer are realized if fertilizer use is complimented with knowledge and correct application of complimentary inputs and services
Agriculture extension services play a critical role in educating farmers and agro dealers. What are the major constraints faced by extension workers?
Page 77
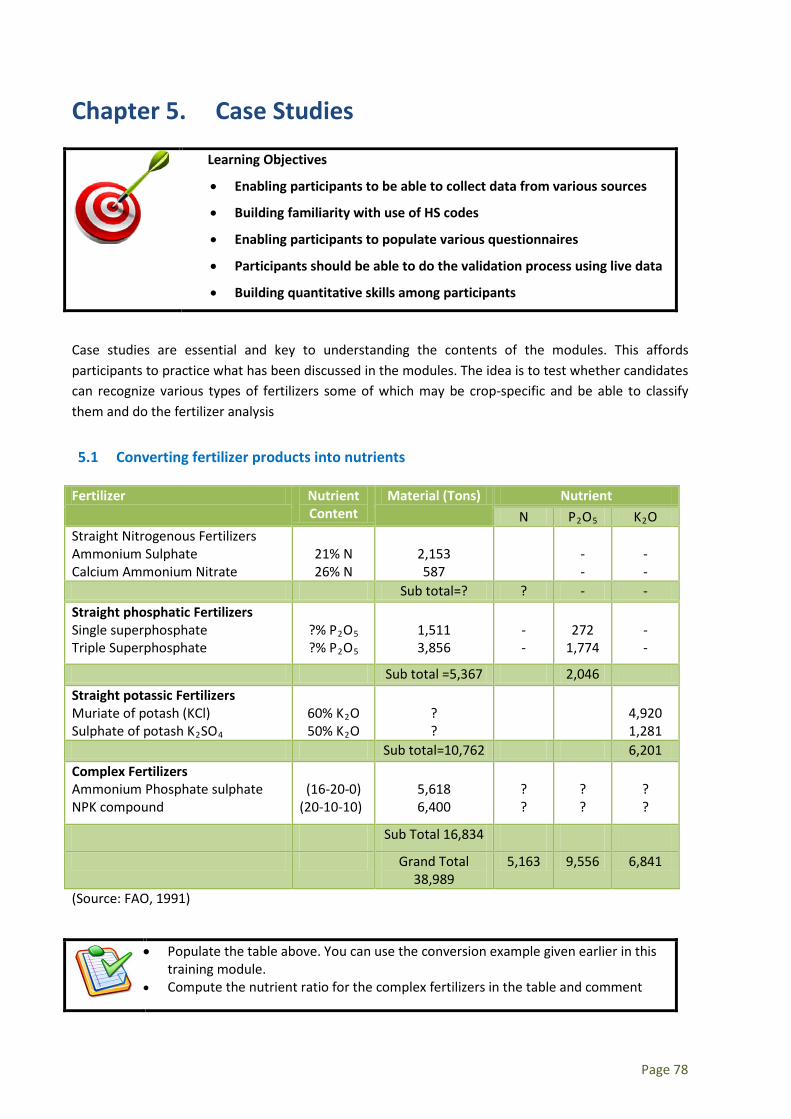
Chapter 5. Case Studies
Learning Objectives
• Enabling participants to be able to collect data from various sources
• Building familiarity with use of HS codes
• Enabling participants to populate various questionnaires
• Participants should be able to do the validation process using live data
• Building quantitative skills among participants
Case studies are essential and key to understanding the contents of the modules. This affords participants to practice what has been discussed in the modules. The idea is to test whether candidates can recognize various types of fertilizers some of which may be crop-specific and be able to classify them and do the fertilizer analysis
5.1 Converting fertilizer products into nutrients
Fertilizer Nutrient Content
Material (Tons) Nutrient N P2O5 K2O
Straight Nitrogenous Fertilizers Ammonium Sulphate Calcium Ammonium Nitrate
21% N 26% N
2,153 587
- -
- -
Sub total=? ? - - Straight phosphatic Fertilizers Single superphosphate Triple Superphosphate
?% P2O5 ?% P2O5
1,511 3,856
- -
272
1,774
- -
Sub total =5,367 2,046 Straight potassic Fertilizers Muriate of potash (KCl) Sulphate of potash K2SO4
60% K2O 50% K2O
? ?
4,920 1,281
Sub total=10,762 6,201 Complex Fertilizers Ammonium Phosphate sulphate NPK compound
(16-20-0)
(20-10-10)
5,618 6,400
? ?
? ?
? ?
Sub Total 16,834
Grand Total 38,989
5,163 9,556 6,841
(Source: FAO, 1991)
• Populate the table above. You can use the conversion example given earlier in this training module.
• Compute the nutrient ratio for the complex fertilizers in the table and comment
Page 78

5.2 Collecting import data from Customs data
Fertilizer import data – Kenya (2006 – in kg and KHS)
HS_CODE PRODUCT DESCRIPTION QUANTITY CIF VALUE31021000 UREA 1 10,154 31021000 UREA 46 PERCENT IN BULK 8,800,000 232,751,600 31023000 AMMONIUM NITRATE 10 70,592 31023000 AMMONIUM NITRATE POROUS PRILLS 20,000 776,419 31026000 CALCIUM NITRATE 50,000 1,331,004 31029000 CALCIUM AMMONIUM NITRATE CAN 26 PERCENT N FERTILIZER IN BUL 15,750,000 292,846,688 31029000 4,400 MTS CALCIUM AMMONIUM NITRATE CAN 26 9 CAO FERTILIZER IN 4,400,000 100,818,008 31039000 DIAMMONIUM PHOSPHATE (18-46-0) IN BULK 1,000,000 45,099,148 31039000 DIAMMONIUM PHOSPHATE (18-46-0) IN BULK 5,000,000 225,495,744 31055100 CALCIUM AMMONIUM NITRATE (CAN)FERTILIZER IN BULK PACKED INT 9,448,000 236,156,336 31059000 MINJINGU ROCK PHOSPHATE FERTILIZER 56,000 786,800
• Can you detect some errors or data discrepancies in this table? • Use these records to generate primary and secondary tables using FAO templates
(requires conversions into nutrients)
5.3 Recording imports, converting into nutrients
Fertilizer imports data - Ghana (2006, in old Ghana cedis and kg)
Fertilizer Imports (2006) CUSTOM VALUE
(GH¢) NET WEIGHT
(KG) 2814100000:Anhydrous ammonia - - 3101000000:Animal or vegetable fertilizers 365,139 879,488 3102100000:Urea 604,485 1,000,000 3102290000:Double salts and mixtures of ammonium sulphate and ammonium nitrate 1,157 2,814 3102300000:Ammonium nitrate 35,751,331 8,794,193 3102400000:Mixtures of ammonium nitrate with inorganic non-fertilizing substances 332,087 258,000 3102500000:Sodium nitrate 850,899 6,893 3102900000:Mineral or chemical fertilizers, nitrogenous , nes 8,720 2,000 3103900000:Mineral or chemical fertilizers, phosphatic, nes 22,417 20,000 3104200000:Potassium chloride 463,059 500,000 3104300000:Potassium sulphate 42,888 100,000 3105100000:Fertilizers... in packages of a gross weight =<10kg 11,754 25,000 3105200000:Mineral or chemical fertilizers with nitrogen, phosphorus and potassium 960,946 1,286,102 3105510000:Mineral or chemical fertilizers containing nitrates and phosphates 52,800 6,000 3105600000:Mineral or chemical fertilizers with phosphorus and potassium, nes 27,480 1,000 Source: MOFA, Ghana
• Use the data to fill in the appropriate table showing fertilizer classes, description and amounts of nutrients in the three important elements of Nitrogen (N), Potash (K2O) and Phosphorus (P2O5)
• Looking at the Ghana Import data, is there any reason to suggest that the data supplied is doubtful and therefore requires validation?
• What do you recommend done to authenticate the validity of this data?
Page 79

5.4 Describing a Bill of Lading
The Bill of Lading serves as a receipt for goods. It shows evidence of the contract of carriage and document of title to the goods at sea. In the case of road and air transportation the document is known as the Consignment note or Waybill.
Typically the Bill contains both the hard data and soft data. The soft data would be about the name of shipper, the consignee, terms of carriage etcetera and the hard data is the description and quantities of the goods being shipped.
In terms of data collection on exports and imports this would be a good source provided every formal transaction is recorded.
You are supplied with a Bill of lading in the next page for a private importer of fertilizer in Ghana.
• Study the bill and identify the name and type of product being shipped and calculate the nutrient content of N, K and P.
• For the purposes of nutrient calculation which of the two figures would you use, Net mass or Gross mass in kilograms and why?
• A product with 15% N, 15% P and 15% K is written as a 15-15-15 compound. Give the same presentation for the product that was imported by Golden Stork of Ghana.
• Can you explain the importance of the HS code for this consignment?
Page 80
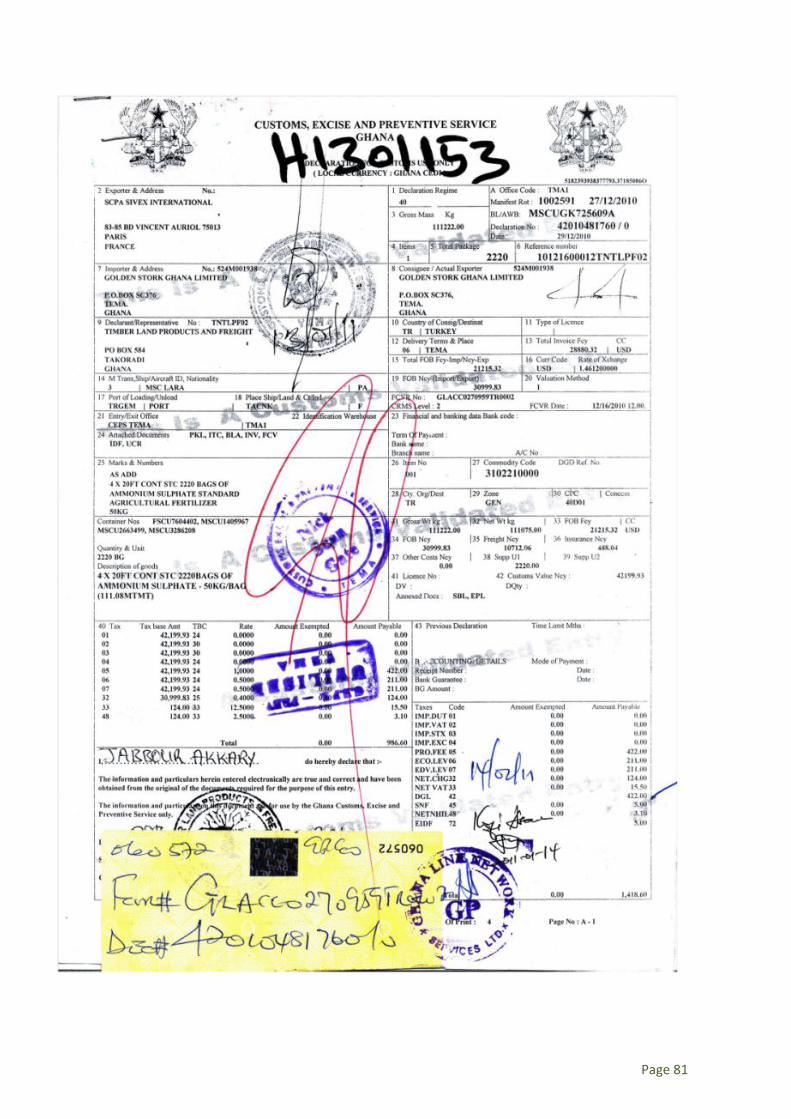
Page 81
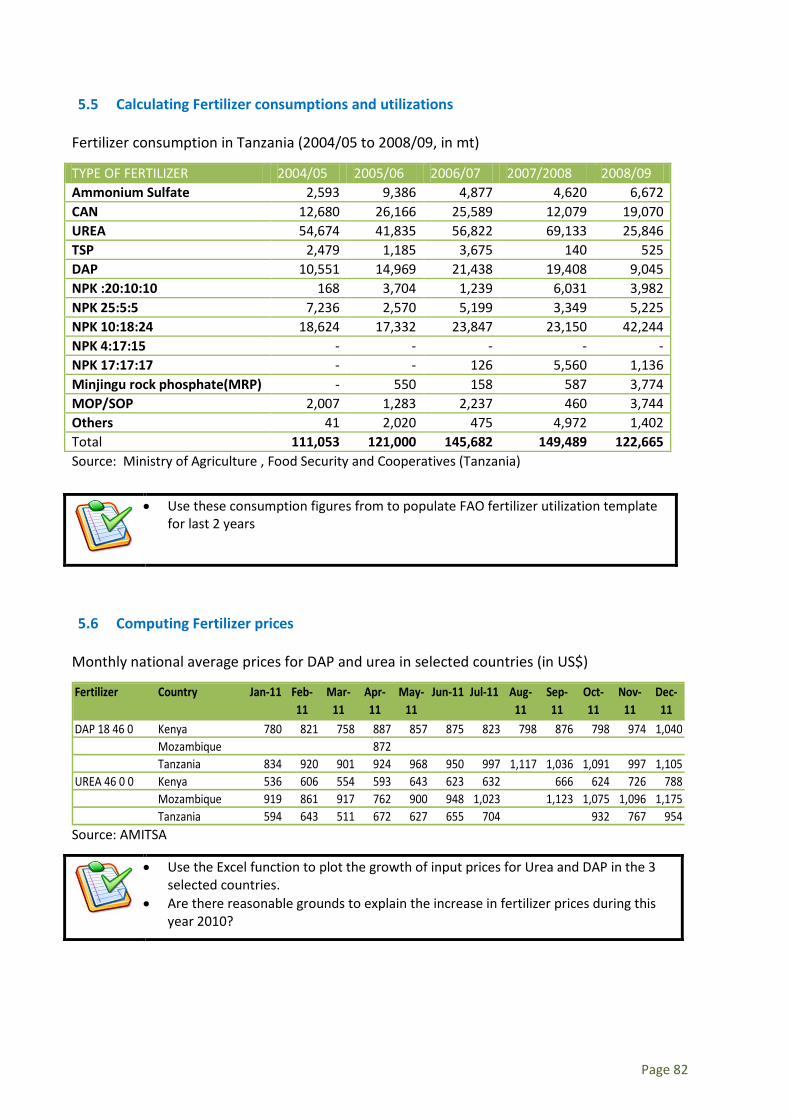
5.5 Calculating Fertilizer consumptions and utilizations
Fertilizer consumption in Tanzania (2004/05 to 2008/09, in mt)
TYPE OF FERTILIZER 2004/05 2005/06 2006/07 2007/2008 2008/09 Ammonium Sulfate 2,593 9,386 4,877 4,620 6,672 CAN 12,680 26,166 25,589 12,079 19,070 UREA 54,674 41,835 56,822 69,133 25,846 TSP 2,479 1,185 3,675 140 525 DAP 10,551 14,969 21,438 19,408 9,045 NPK :20:10:10 168 3,704 1,239 6,031 3,982 NPK 25:5:5 7,236 2,570 5,199 3,349 5,225 NPK 10:18:24 18,624 17,332 23,847 23,150 42,244 NPK 4:17:15 - - - - - NPK 17:17:17 - - 126 5,560 1,136 Minjingu rock phosphate(MRP) - 550 158 587 3,774 MOP/SOP 2,007 1,283 2,237 460 3,744 Others 41 2,020 475 4,972 1,402 Total 111,053 121,000 145,682 149,489 122,665 Source: Ministry of Agriculture , Food Security and Cooperatives (Tanzania)
• Use these consumption figures from to populate FAO fertilizer utilization template for last 2 years
5.6 Computing Fertilizer prices
Monthly national average prices for DAP and urea in selected countries (in US$)
Fertilizer Country Jan-11 Feb-11
Mar-11
Apr-11
May-11
Jun-11 Jul-11 Aug-11
Sep-11
Oct-11
Nov-11
Dec-11
DAP 18 46 0 Kenya 780 821 758 887 857 875 823 798 876 798 974 1,040Mozambique 872Tanzania 834 920 901 924 968 950 997 1,117 1,036 1,091 997 1,105
UREA 46 0 0 Kenya 536 606 554 593 643 623 632 666 624 726 788Mozambique 919 861 917 762 900 948 1,023 1,123 1,075 1,096 1,175Tanzania 594 643 511 672 627 655 704 932 767 954
Source: AMITSA
• Use the Excel function to plot the growth of input prices for Urea and DAP in the 3 selected countries.
• Are there reasonable grounds to explain the increase in fertilizer prices during this year 2010?
Page 82
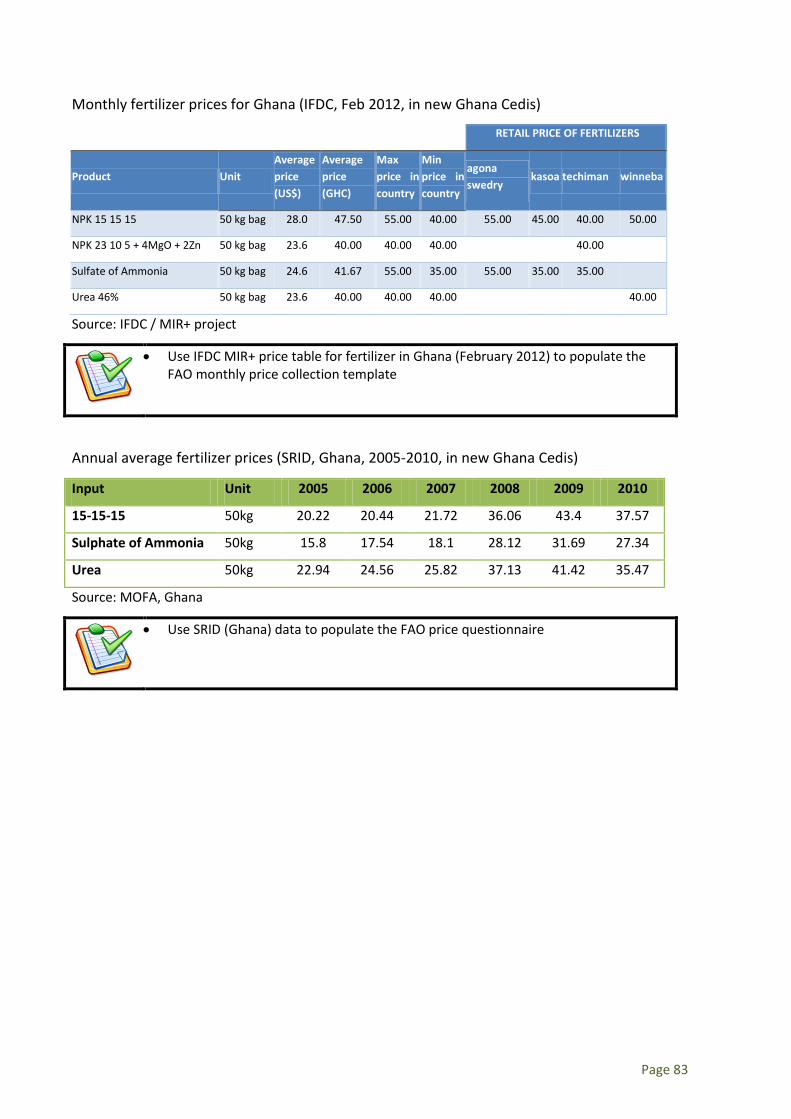
Monthly fertilizer prices for Ghana (IFDC, Feb 2012, in new Ghana Cedis)
RETAIL PRICE OF FERTILIZERS
Product Unit Average price (US$)
Average price (GHC)
Max price in country
Min price in country
agona swedry
kasoa techiman winneba
NPK 15 15 15 50 kg bag 28.0 47.50 55.00 40.00 55.00 45.00 40.00 50.00
NPK 23 10 5 + 4MgO + 2Zn 50 kg bag 23.6 40.00 40.00 40.00
40.00
Sulfate of Ammonia 50 kg bag 24.6 41.67 55.00 35.00 55.00 35.00 35.00
Urea 46% 50 kg bag 23.6 40.00 40.00 40.00
40.00
Source: IFDC / MIR+ project
• Use IFDC MIR+ price table for fertilizer in Ghana (February 2012) to populate the FAO monthly price collection template
Annual average fertilizer prices (SRID, Ghana, 2005-2010, in new Ghana Cedis)
Input Unit 2005 2006 2007 2008 2009 2010
15-15-15 50kg 20.22 20.44 21.72 36.06 43.4 37.57
Sulphate of Ammonia 50kg 15.8 17.54 18.1 28.12 31.69 27.34
Urea 50kg 22.94 24.56 25.82 37.13 41.42 35.47
Source: MOFA, Ghana
• Use SRID (Ghana) data to populate the FAO price questionnaire
Page 83
References
Eurostat, 2005: Quality in Statistics: Integrating Data Quality Indicators into the FAO Statistical System, Rome
FAO, The World Bank, & UN 2010: Global Strategy To Improve Agricultural and rural statistics, report No. 56719-GLB, Washington
Heffer, P (2009). Assessment of Fertilizer Use by Crop at the Global Level 2006/07 – 2007/08. IFA. France.
Mayo, R . 2008; Fertilizer data collection, processing and dissemination: Experiences from the new Fertilizer domain in FAOSTAT, Rome
Roy, A (2007). Africa Fertilizer Summit Outcomes and Follow Up. Unpublished, USA
Shetto, M C ; (2007). Proceedings Of A Workshop On Rationalization And Harmonisation Of Policies, Regulations, Procedures, Grades And Standards In The Fertiliser Sub-Sector In East And Central Africa - A Case Of Tanzania, Tanzania.
Wanzala, M (2009). Implementation of the Abuja Declaration on Fertilizers for an African Green Revolution: A Progress Report. Presented at the COMESA 2nd AAMP Fertilizer Policy Seminar, June 15-16, 2009, Livingstone, Zambia. Unpublished.
Page 84
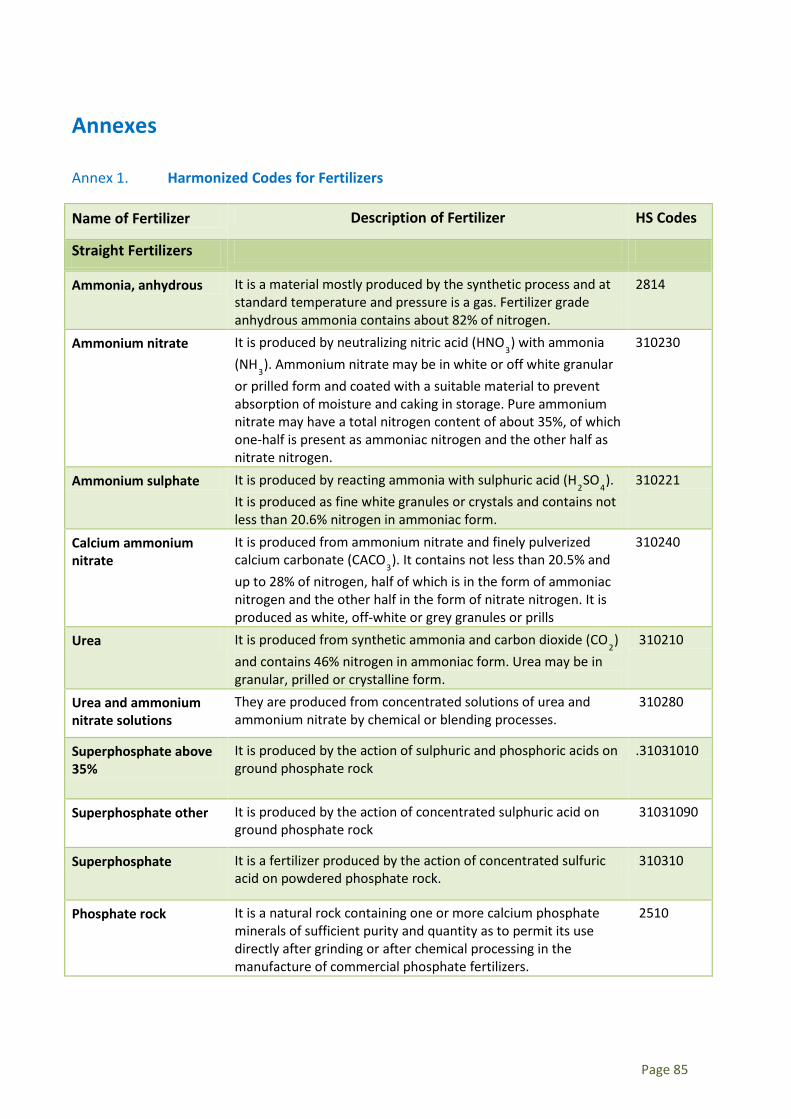
Annexes
Annex 1. Harmonized Codes for Fertilizers
Name of Fertilizer Description of Fertilizer HS Codes
Straight Fertilizers
Ammonia, anhydrous It is a material mostly produced by the synthetic process and at standard temperature and pressure is a gas. Fertilizer grade anhydrous ammonia contains about 82% of nitrogen.
2814
Ammonium nitrate It is produced by neutralizing nitric acid (HNO3) with ammonia
(NH3). Ammonium nitrate may be in white or off white granular
or prilled form and coated with a suitable material to prevent absorption of moisture and caking in storage. Pure ammonium nitrate may have a total nitrogen content of about 35%, of which one-half is present as ammoniac nitrogen and the other half as nitrate nitrogen.
310230
Ammonium sulphate It is produced by reacting ammonia with sulphuric acid (H2SO
4).
It is produced as fine white granules or crystals and contains not less than 20.6% nitrogen in ammoniac form.
310221
Calcium ammonium nitrate
It is produced from ammonium nitrate and finely pulverized calcium carbonate (CACO
3). It contains not less than 20.5% and
up to 28% of nitrogen, half of which is in the form of ammoniac nitrogen and the other half in the form of nitrate nitrogen. It is produced as white, off-white or grey granules or prills
310240
Urea It is produced from synthetic ammonia and carbon dioxide (CO2)
and contains 46% nitrogen in ammoniac form. Urea may be in granular, prilled or crystalline form.
310210
Urea and ammonium nitrate solutions
They are produced from concentrated solutions of urea and ammonium nitrate by chemical or blending processes.
310280
Superphosphate above 35%
It is produced by the action of sulphuric and phosphoric acids on ground phosphate rock
.31031010
Superphosphate other It is produced by the action of concentrated sulphuric acid on ground phosphate rock
31031090
Superphosphate It is a fertilizer produced by the action of concentrated sulfuric acid on powdered phosphate rock.
310310
Phosphate rock It is a natural rock containing one or more calcium phosphate minerals of sufficient purity and quantity as to permit its use directly after grinding or after chemical processing in the manufacture of commercial phosphate fertilizers.
2510
Page 85
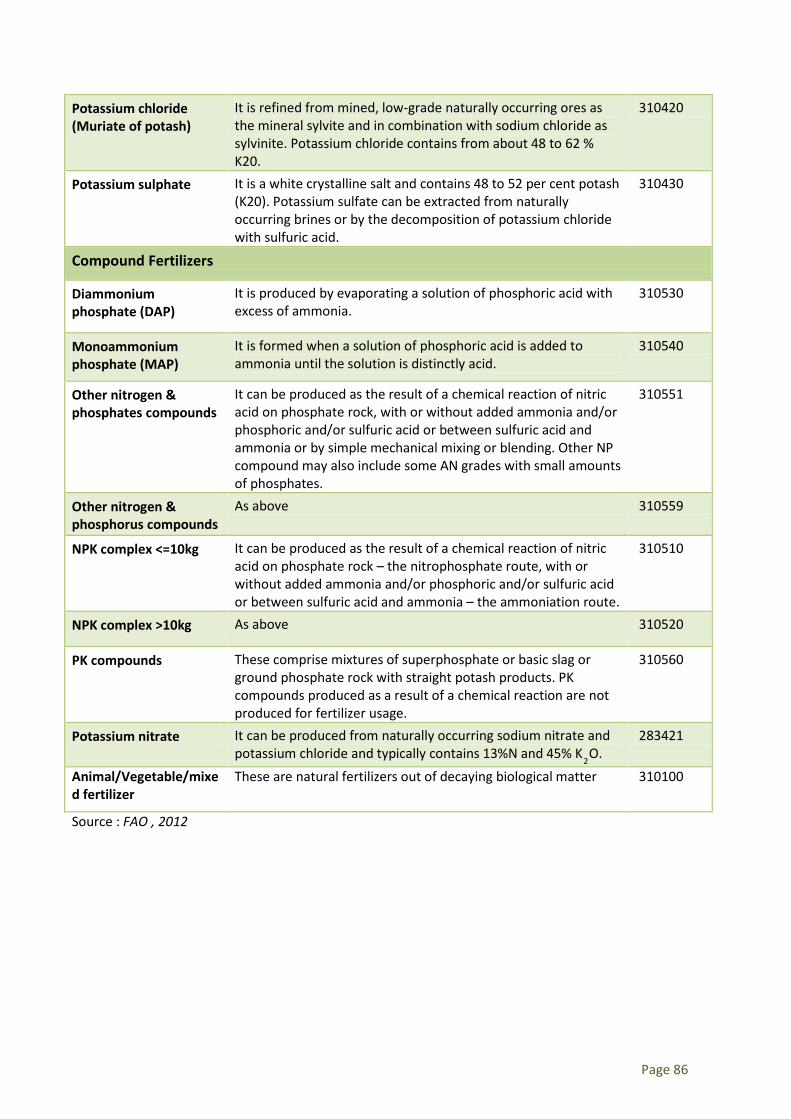
Potassium chloride (Muriate of potash)
It is refined from mined, low-grade naturally occurring ores as the mineral sylvite and in combination with sodium chloride as sylvinite. Potassium chloride contains from about 48 to 62 % K20.
310420
Potassium sulphate It is a white crystalline salt and contains 48 to 52 per cent potash (K20). Potassium sulfate can be extracted from naturally occurring brines or by the decomposition of potassium chloride with sulfuric acid.
310430
Compound Fertilizers
Diammonium phosphate (DAP)
It is produced by evaporating a solution of phosphoric acid with excess of ammonia.
310530
Monoammonium phosphate (MAP)
It is formed when a solution of phosphoric acid is added to ammonia until the solution is distinctly acid.
310540
Other nitrogen & phosphates compounds
It can be produced as the result of a chemical reaction of nitric acid on phosphate rock, with or without added ammonia and/or phosphoric and/or sulfuric acid or between sulfuric acid and ammonia or by simple mechanical mixing or blending. Other NP compound may also include some AN grades with small amounts of phosphates.
310551
Other nitrogen & phosphorus compounds
As above 310559
NPK complex <=10kg It can be produced as the result of a chemical reaction of nitric acid on phosphate rock – the nitrophosphate route, with or without added ammonia and/or phosphoric and/or sulfuric acid or between sulfuric acid and ammonia – the ammoniation route.
310510
NPK complex >10kg As above 310520
PK compounds These comprise mixtures of superphosphate or basic slag or ground phosphate rock with straight potash products. PK compounds produced as a result of a chemical reaction are not produced for fertilizer usage.
310560
Potassium nitrate It can be produced from naturally occurring sodium nitrate and potassium chloride and typically contains 13%N and 45% K
2O.
283421
Animal/Vegetable/mixed fertilizer
These are natural fertilizers out of decaying biological matter 310100
Source : FAO , 2012
Page 86
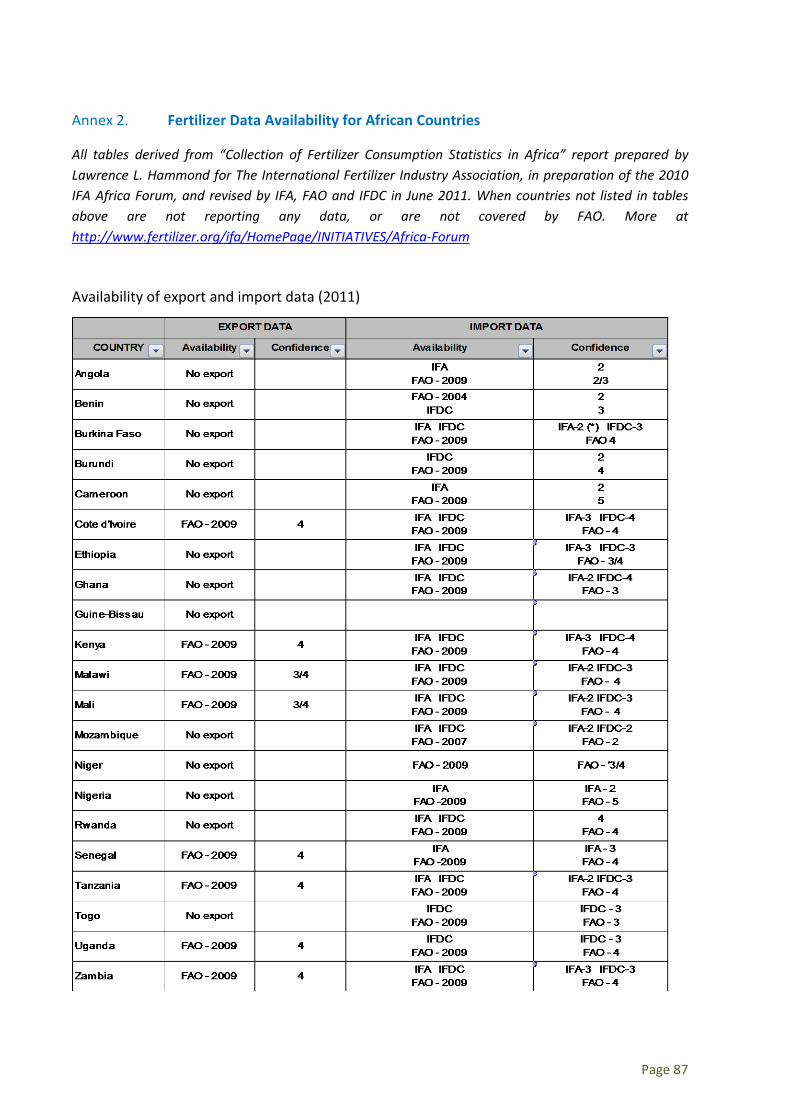
Annex 2. Fertilizer Data Availability for African Countries
All tables derived from “Collection of Fertilizer Consumption Statistics in Africa” report prepared by Lawrence L. Hammond for The International Fertilizer Industry Association, in preparation of the 2010 IFA Africa Forum, and revised by IFA, FAO and IFDC in June 2011. When countries not listed in tables above are not reporting any data, or are not covered by FAO. More at http://www.fertilizer.org/ifa/HomePage/INITIATIVES/Africa-Forum
Availability of export and import data (2011)
Page 87
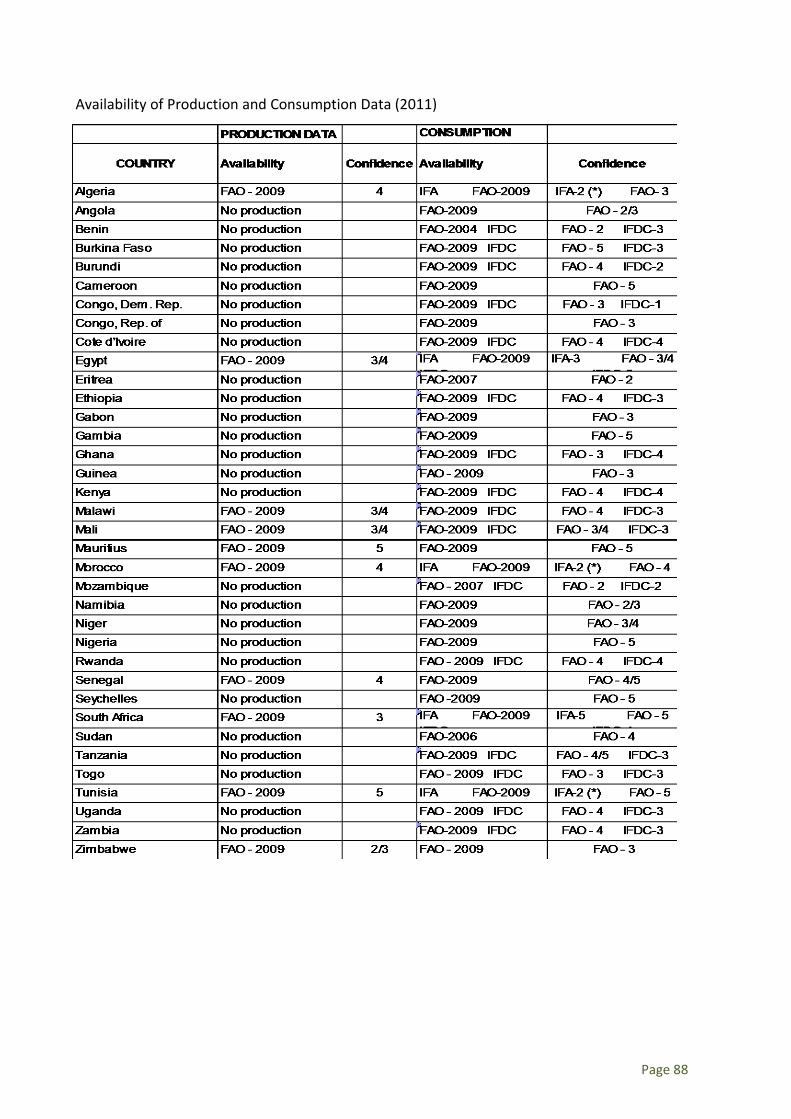
Availability of Production and Consumption Data (2011)
Page 88
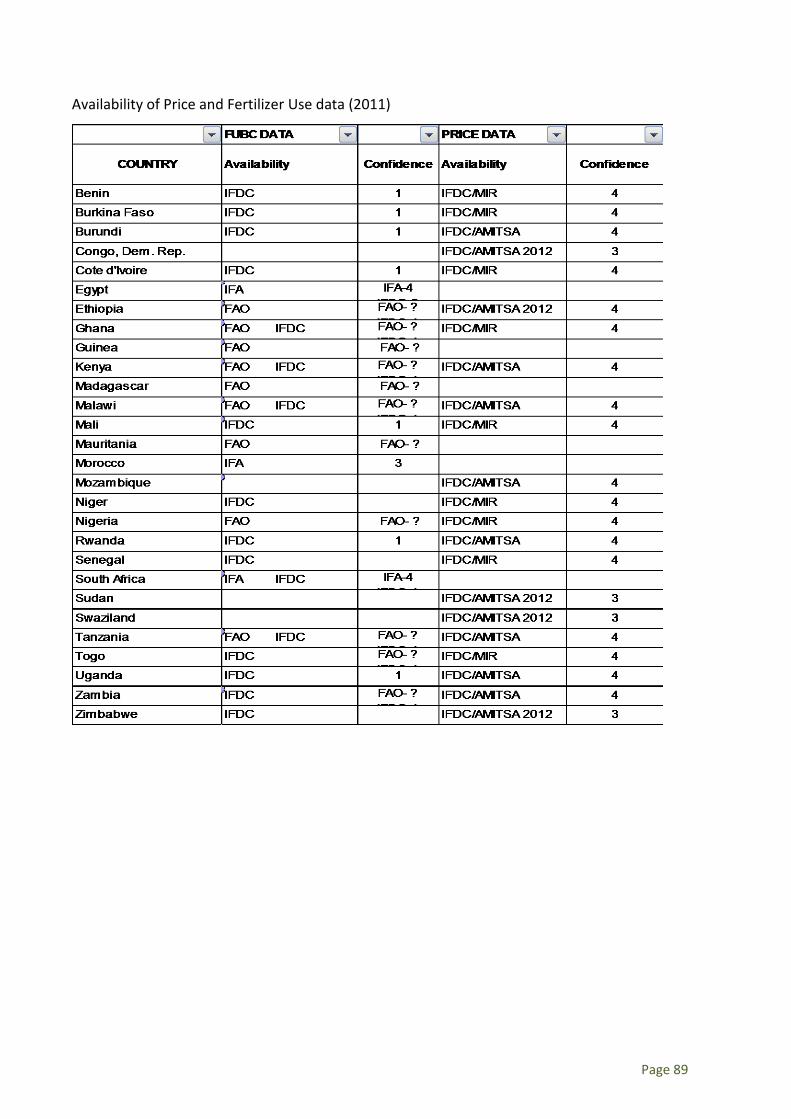
Availability of Price and Fertilizer Use data (2011)
Page 89

Annex 3. FAO fertilizer questionnaire (2010 / 2011)
Fertilizer Production
N P2O5 K2O N P2O5 K2O N P2O5 K2O N P2O5 K2O N P2O5 K2O
2814 Ammonia, anhydrous (82%N w ill be used if no information is provided)
310230 Ammonium nitrate (33%N w ill be used if no information is provided)
310221 Ammonium sulphate (21%N w ill be used if no information is provided)
310240 Calcium ammonium nitrate (26%N w ill be used if no information is provided)
310210 Urea (46%N w ill be used if no information is provided)
310280Urea and ammonium nitrate solutions (32%N will be used if no information is provided)
3.1E+07 Superphosphate above 35% (46%P205
w ill be used if no information is provided)
3.1E+07 Superphosphate, other (18%P205 w ill be used if no information is provided)
2510 Phosphate rock (30%P205 w ill be used if no information is provided)
310420Potassium chloride (Muriate of potash) (60%K20 w ill be used if no information is provided)
310430 Potassium sulphate (50%K20 w ill be used if no information is provided)
310530Diammonium phosphate (DAP) (18%N and 46% P205 w ill be used if no information is provided)
310540Monoammonium phosphate (MAP) (11%N and 52% P205 w ill be used if no information is provided)
310551 and
310559
Other NP compounds (20%N and 25% P205 w ill be used if no information is provided)
310510 and
310520
NPK complex (15%N, 15% P205 and 15% K20 w ill be used if no information is provided)
310510 and
310520
NPK blends (15%N, 15% P205 and 15% K20 w ill be used if no information is provided)
310560 PK compounds (20% P205 and 25% K20 w ill be used if no information is provided)
283421 Potassium nitrate (13%N and 45% K20 w ill be used if no information is provided)
OTHER FERTILIZERS (specify below)
STRAIGHT NITROGENOUS FERTILIZERS
STRAIGHT PHOSPHATIC FERTILIZERS
STRAIGHT POTASSICFERTILIZERS
COMPOUND FERTILIZERS
20072006 2007 2008 2009
FOOD AND AGRICULTURE ORGANIZATION OF THE UNITED NATIONS - STATISTICS DIVISION
AGRICULTURAL RESOURCES - FERTILIZER PRODUCTION
● The time reference period is calendar year. ● Please report data in Metric Tons. If a different unit is used please indicate it, as well as any other relevant note specific to a given data, in the NOTES column. ● For item descriptions and for other important instructions please refer to the "Explanatory notes" and "Instructions" sheets.
HS CODE COMMODITY
A B C = (A/100)*B NOTESe.g. different year used,
different unit used, preliminary data
reported, etc.
Plant nutrientcontent
%
FERTILIZER PRODUCTION(metric tons of product)
FERTILIZER PRODUCTION(metric tons of nutrient content)
2006 2008 2009
Page 90
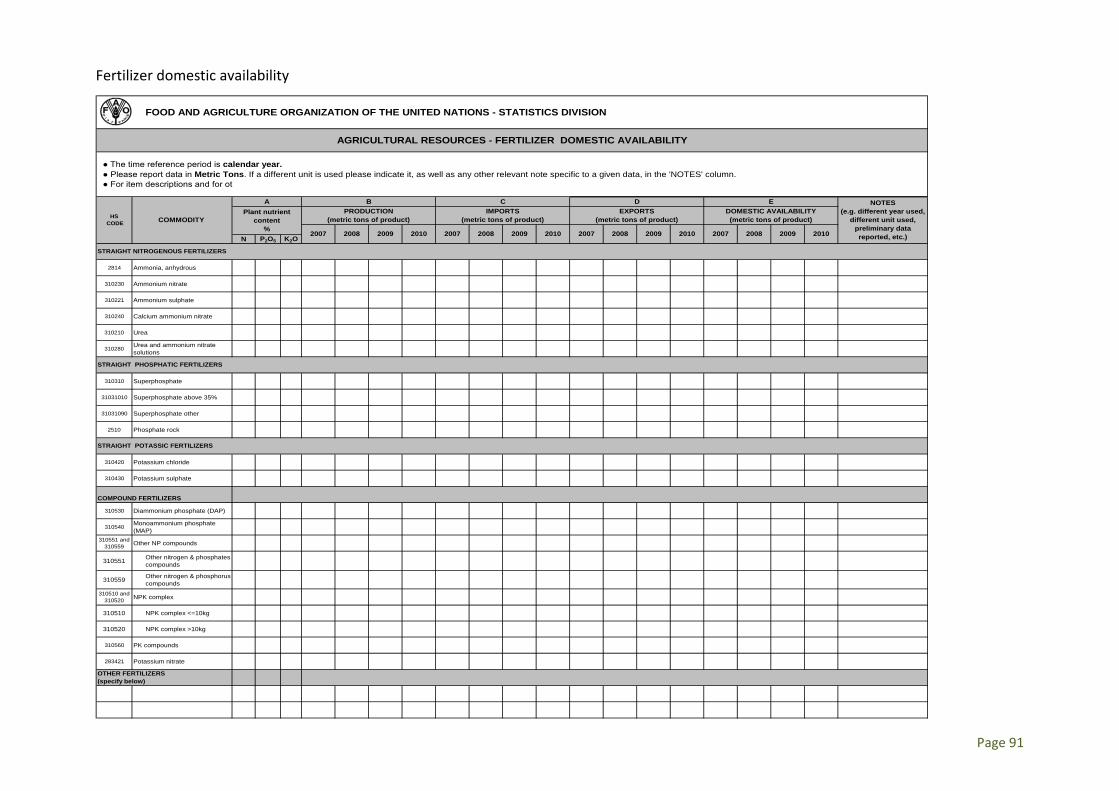
Fertilizer domestic availability
N P2O5 K2O
2814 Ammonia, anhydrous
310230 Ammonium nitrate
310221 Ammonium sulphate
310240 Calcium ammonium nitrate
310210 Urea
310280 Urea and ammonium nitrate solutions
310310 Superphosphate
31031010 Superphosphate above 35%
31031090 Superphosphate other
2510 Phosphate rock
310420 Potassium chloride
310430 Potassium sulphate
310530 Diammonium phosphate (DAP)
310540 Monoammonium phosphate (MAP)
310551 and 310559 Other NP compounds
310551 Other nitrogen & phosphates compounds
310559 Other nitrogen & phosphorus compounds
310510 and 310520 NPK complex
310510 NPK complex <=10kg
310520 NPK complex >10kg
310560 PK compounds
283421 Potassium nitrate
APlant nutrient
content%
2008 2009 20102008 2009 20102007 2007 2007 2008 2009 20102007 2008
STRAIGHT NITROGENOUS FERTILIZERS
STRAIGHT PHOSPHATIC FERTILIZERS
STRAIGHT POTASSIC FERTILIZERS
FOOD AND AGRICULTURE ORGANIZATION OF THE UNITED NATIONS - STATISTICS DIVISION
AGRICULTURAL RESOURCES - FERTILIZER DOMESTIC AVAILABILITY
● The time reference period is calendar year. ● Please report data in Metric Tons. If a different unit is used please indicate it, as well as any other relevant note specific to a given data, in the 'NOTES' column. ● For item descriptions and for ot
HS CODE COMMODITY
B C D E NOTES(e.g. different year used,
different unit used, preliminary data reported, etc.)
DOMESTIC AVAILABILITY(metric tons of product)
OTHER FERTILIZERS (specify below)
COMPOUND FERTILIZERS
IMPORTS(metric tons of product)
EXPORTS(metric tons of product)
PRODUCTION(metric tons of product)
20102009
Page 91

Fertilizer Utilization
2814 Ammonia, anhydrous
310230 Ammonium nitrate
310221 Ammonium sulphate
310240 Calcium ammonium nitrate
310210 Urea
310280 Urea and ammonium nitrate solutions
310310 Superphosphate X X X X
31031010 Superphosphate above 35% X X X X
31031090 Superphosphate other X X X X
2510 Phosphate rock
310420 Potassium chloride
310430 Potassium sulphate
310530 Diammonium phosphate (DAP) X X X X
310540 Monoammonium phosphate (MAP) X X X X
310551 and 310559 Other NP compounds X X X X
310510 and310520 NPK complex X X X X
310510 and310520 NPK blends X X X X
310560 PK compounds X X X X
283421 Potassium nitrate
● The time reference period is calendar year. ● Please report data in Metric Tons. If a different unit is used please indicate it, as well as any other relevant note specific to a given data, in the 'NOTES' column. ● For item descriptions and for ot
N P2O5 K2O 2009
COMMODITY
E
Plant nutrientcontent
%
FOOD AND AGRICULTURE ORGANIZATION OF THE UNITED NATIONS - STATISTICS DIVISION
AGRICULTURAL RESOURCES - FERTILIZER UTILIZATION
DOMESTIC AVAILABILITY(metric tons of product)
NON FERTILIZER USE (including feed use)(metric tons of products)
USED FOR CROP PRODUCTION(metric tons of product)
HS CODE
20092008
OTHER FERTILIZERS (specify below)
2010 2007
STRAIGHT NITROGENOUS FERTILIZERS
STRAIGHT PHOSPHATIC FERTILIZERS
2010
STRAIGHT POTASSIC FERTILIZERS
2008
COMPOUND FERTILIZERS
NOTES(e.g. different year used, different unit used, preliminary
data reported, etc.)2007
F G
2007 2008 2009
A
2010
Page 92
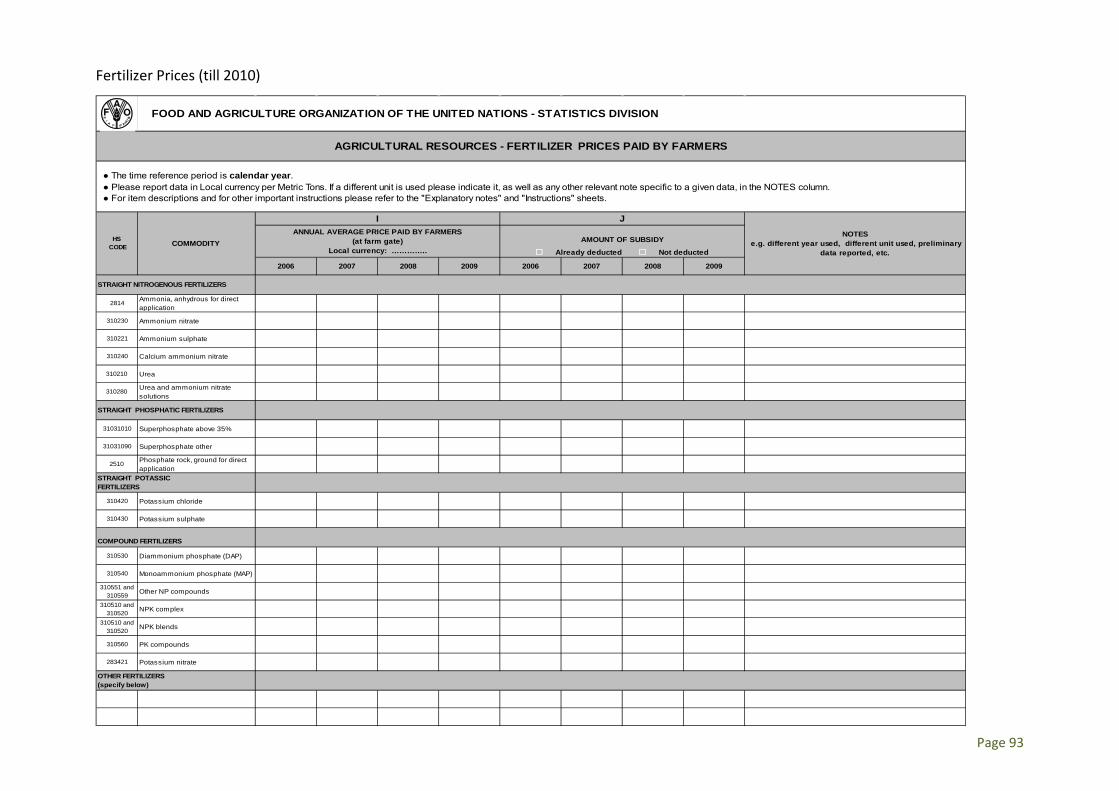
Fertilizer Prices (till 2010)
2006 2007 2008 2009 2006 2007 2008 2009
2814 Ammonia, anhydrous for direct application
310230 Ammonium nitrate
310221 Ammonium sulphate
310240 Calcium ammonium nitrate
310210 Urea
310280 Urea and ammonium nitrate solutions
31031010 Superphosphate above 35%
31031090 Superphosphate other
2510 Phosphate rock, ground for direct application
310420 Potassium chloride
310430 Potassium sulphate
310530 Diammonium phosphate (DAP)
310540 Monoammonium phosphate (MAP)
310551 and 310559 Other NP compounds
310510 and 310520 NPK complex
310510 and 310520 NPK blends
310560 PK compounds
283421 Potassium nitrate
FOOD AND AGRICULTURE ORGANIZATION OF THE UNITED NATIONS - STATISTICS DIVISION
AGRICULTURAL RESOURCES - FERTILIZER PRICES PAID BY FARMERS
● The time reference period is calendar year. ● Please report data in Local currency per Metric Tons. If a different unit is used please indicate it, as well as any other relevant note specific to a given data, in the NOTES column. ● For item descriptions and for other important instructions please refer to the "Explanatory notes" and "Instructions" sheets.
HS CODE COMMODITY
I JNOTES
e.g. different year used, different unit used, preliminary data reported, etc.
ANNUAL AVERAGE PRICE PAID BY FARMERS(at farm gate)
Local currency: …………..AMOUNT OF SUBSIDY
Already deducted Not deducted
OTHER FERTILIZERS (specify below)
STRAIGHT NITROGENOUS FERTILIZERS
STRAIGHT PHOSPHATIC FERTILIZERS
STRAIGHT POTASSIC FERTILIZERS
COMPOUND FERTILIZERS
Page 93
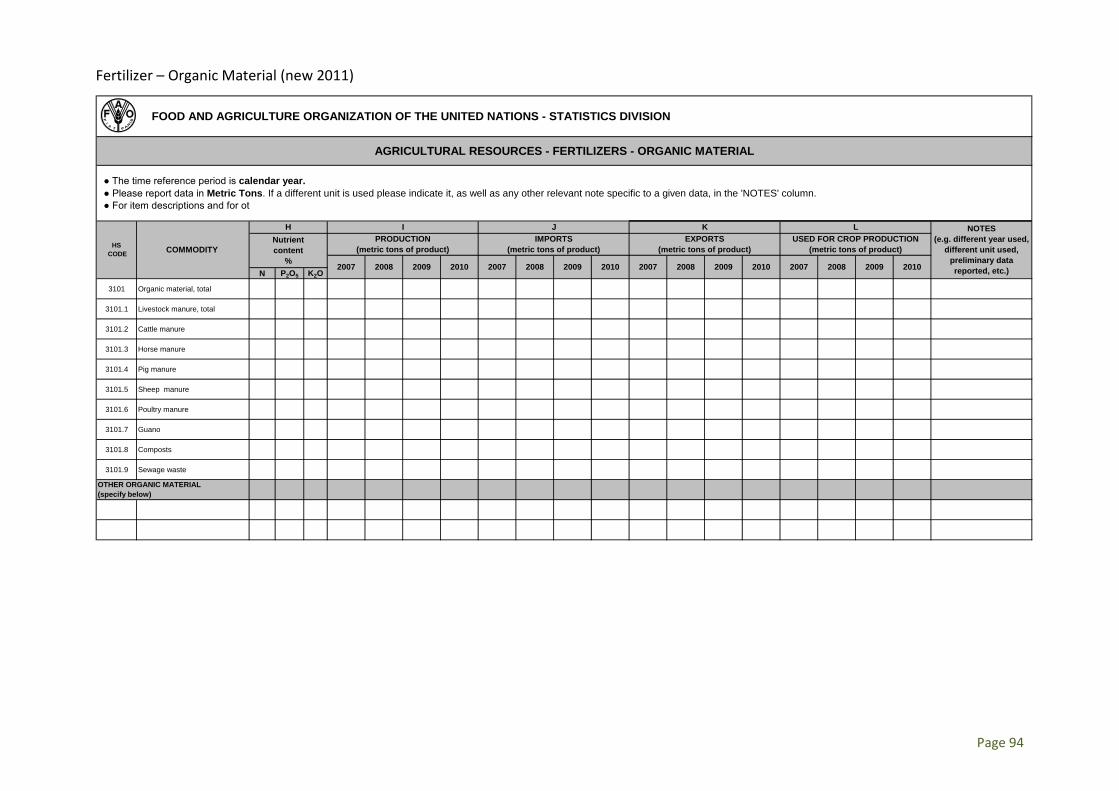
Fertilizer – Organic Material (new 2011)
N P2O5 K2O
3101 Organic material, total
3101.1 Livestock manure, total
3101.2 Cattle manure
3101.3 Horse manure
3101.4 Pig manure
3101.5 Sheep manure
3101.6 Poultry manure
3101.7 Guano
3101.8 Composts
3101.9 Sewage waste
2008 2009 20102007 20102007 2007 2008 2009 20102007 2008 2009
FOOD AND AGRICULTURE ORGANIZATION OF THE UNITED NATIONS - STATISTICS DIVISION
AGRICULTURAL RESOURCES - FERTILIZERS - ORGANIC MATERIAL
● The time reference period is calendar year. ● Please report data in Metric Tons. If a different unit is used please indicate it, as well as any other relevant note specific to a given data, in the 'NOTES' column. ● For item descriptions and for ot
HS CODE COMMODITY
I J
2008 2009 2010
K L NOTES(e.g. different year used,
different unit used, preliminary data reported, etc.)
OTHER ORGANIC MATERIAL(specify below)
IMPORTS(metric tons of product)
EXPORTS(metric tons of product)
USED FOR CROP PRODUCTION(metric tons of product)
PRODUCTION(metric tons of product)
HNutrientcontent
%
Page 94
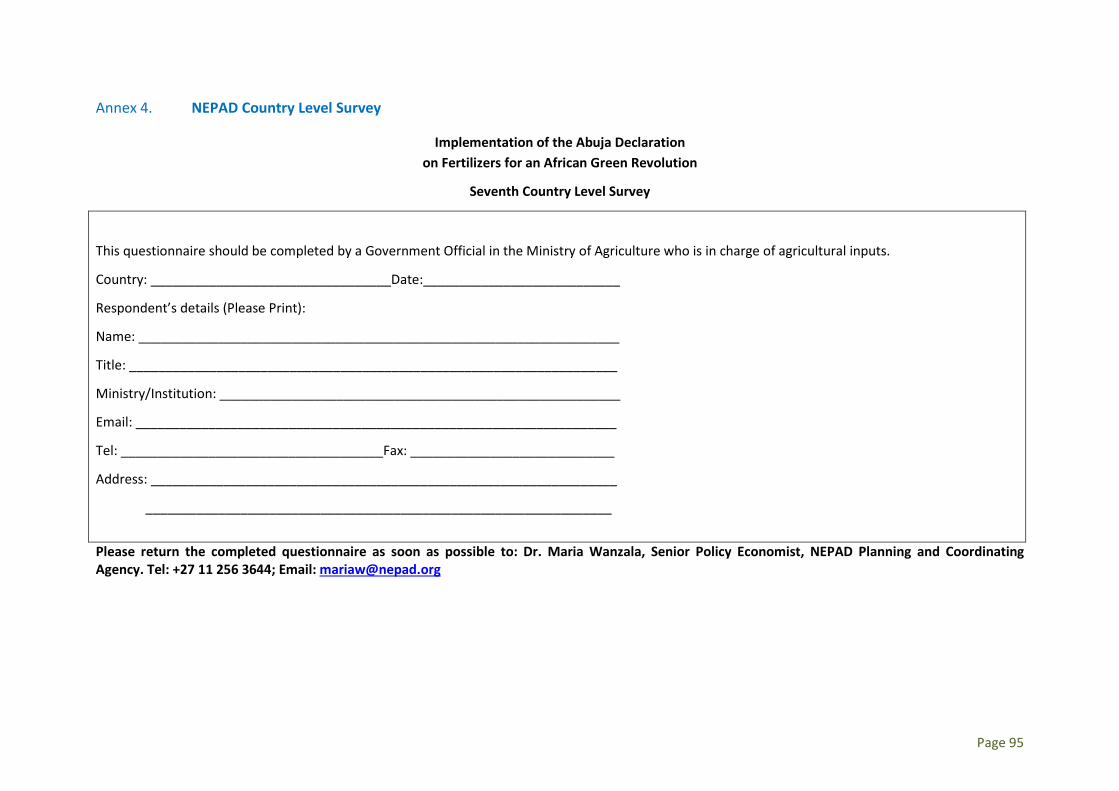
Annex 4. NEPAD Country Level Survey
Implementation of the Abuja Declaration on Fertilizers for an African Green Revolution
Seventh Country Level Survey
This questionnaire should be completed by a Government Official in the Ministry of Agriculture who is in charge of agricultural inputs.
Country: _________________________________Date:___________________________
Respondent’s details (Please Print):
Name: __________________________________________________________________
Title: ___________________________________________________________________
Ministry/Institution: _______________________________________________________
Email: __________________________________________________________________
Tel: ____________________________________Fax: ____________________________
Address: ________________________________________________________________
________________________________________________________________
Please return the completed questionnaire as soon as possible to: Dr. Maria Wanzala, Senior Policy Economist, NEPAD Planning and Coordinating Agency. Tel: +27 11 256 3644; Email: [email protected]
Page 95
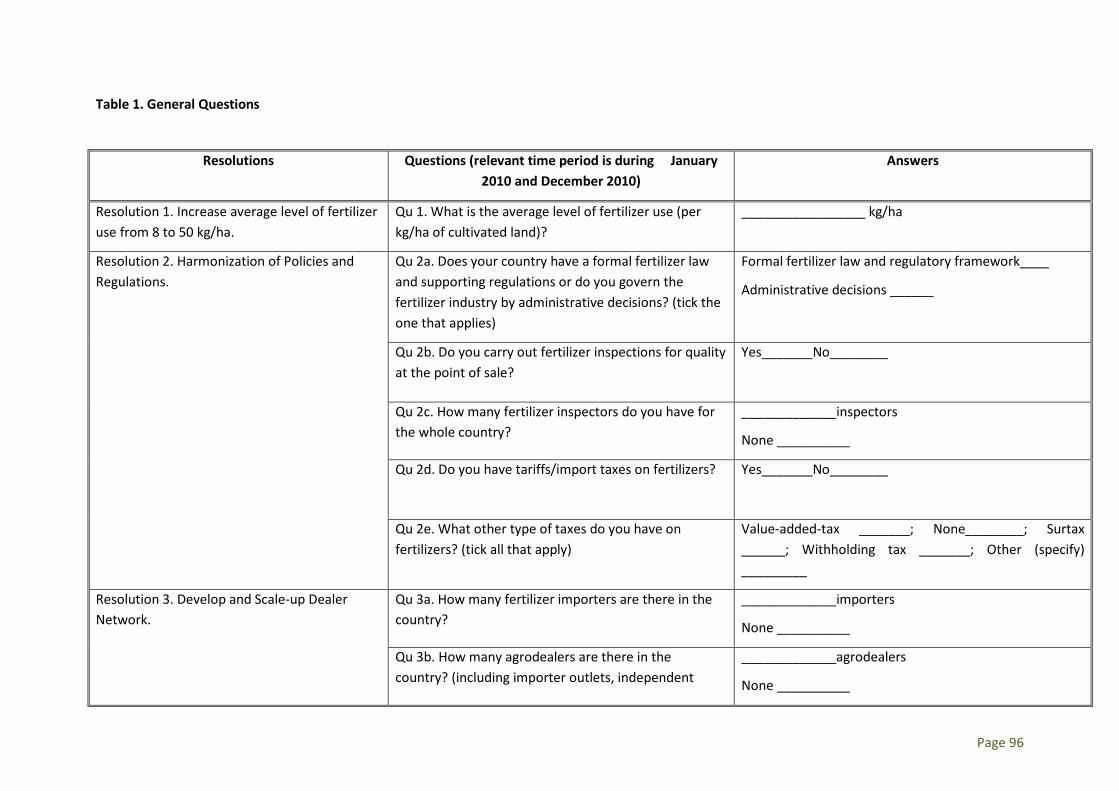
Table 1. General Questions
Resolutions Questions (relevant time period is during January 2010 and December 2010)
Answers
Resolution 1. Increase average level of fertilizer use from 8 to 50 kg/ha.
Qu 1. What is the average level of fertilizer use (per kg/ha of cultivated land)?
_________________ kg/ha
Resolution 2. Harmonization of Policies and Regulations.
Qu 2a. Does your country have a formal fertilizer law and supporting regulations or do you govern the fertilizer industry by administrative decisions? (tick the one that applies)
Formal fertilizer law and regulatory framework____
Administrative decisions ______
Qu 2b. Do you carry out fertilizer inspections for quality at the point of sale?
Yes_______No________
Qu 2c. How many fertilizer inspectors do you have for the whole country?
_____________inspectors
None __________
Qu 2d. Do you have tariffs/import taxes on fertilizers? Yes_______No________
Qu 2e. What other type of taxes do you have on fertilizers? (tick all that apply)
Value-added-tax _______; None________; Surtax ______; Withholding tax _______; Other (specify) _________
Resolution 3. Develop and Scale-up Dealer Network.
Qu 3a. How many fertilizer importers are there in the country?
_____________importers
None __________
Qu 3b. How many agrodealers are there in the country? (including importer outlets, independent
_____________agrodealers
None __________
Page 96
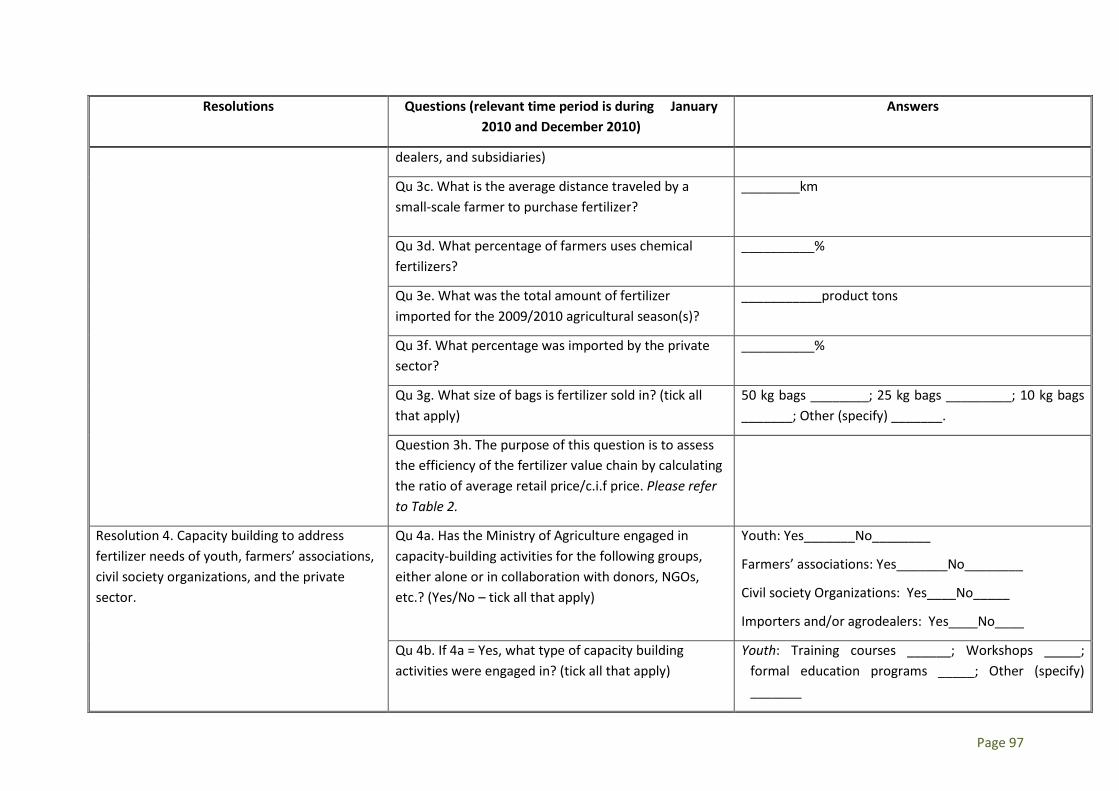
Resolutions Questions (relevant time period is during January 2010 and December 2010)
Answers
dealers, and subsidiaries)
Qu 3c. What is the average distance traveled by a small-scale farmer to purchase fertilizer?
________km
Qu 3d. What percentage of farmers uses chemical fertilizers?
__________%
Qu 3e. What was the total amount of fertilizer imported for the 2009/2010 agricultural season(s)?
___________product tons
Qu 3f. What percentage was imported by the private sector?
__________%
Qu 3g. What size of bags is fertilizer sold in? (tick all that apply)
50 kg bags ________; 25 kg bags _________; 10 kg bags _______; Other (specify) _______.
Question 3h. The purpose of this question is to assess the efficiency of the fertilizer value chain by calculating the ratio of average retail price/c.i.f price. Please refer to Table 2.
Resolution 4. Capacity building to address fertilizer needs of youth, farmers’ associations, civil society organizations, and the private sector.
Qu 4a. Has the Ministry of Agriculture engaged in capacity-building activities for the following groups, either alone or in collaboration with donors, NGOs, etc.? (Yes/No – tick all that apply)
Youth: Yes_______No________
Farmers’ associations: Yes_______No________
Civil society Organizations: Yes____No_____
Importers and/or agrodealers: Yes____No____
Qu 4b. If 4a = Yes, what type of capacity building activities were engaged in? (tick all that apply)
Youth: Training courses ______; Workshops _____; formal education programs _____; Other (specify) _______
Page 97
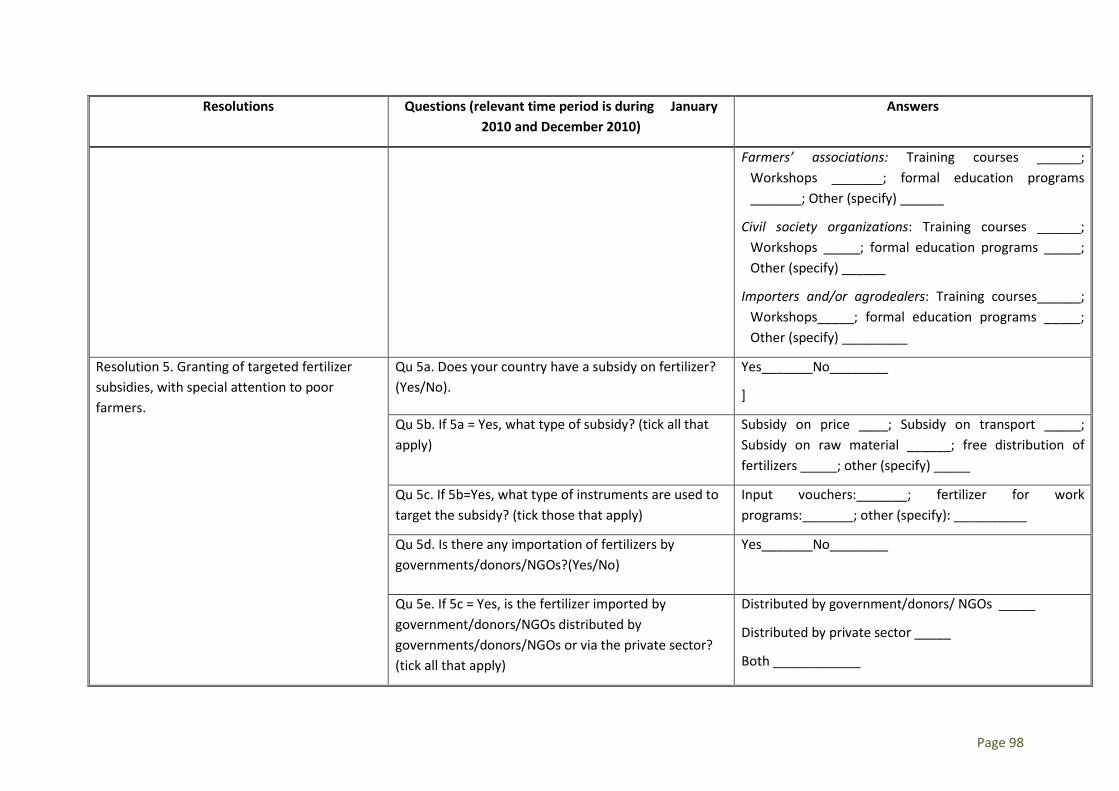
Resolutions Questions (relevant time period is during January 2010 and December 2010)
Answers
Farmers’ associations: Training courses ______; Workshops _______; formal education programs _______; Other (specify) ______
Civil society organizations: Training courses ______; Workshops _____; formal education programs _____; Other (specify) ______
Importers and/or agrodealers: Training courses______; Workshops_____; formal education programs _____; Other (specify) _________
Resolution 5. Granting of targeted fertilizer subsidies, with special attention to poor farmers.
Qu 5a. Does your country have a subsidy on fertilizer? (Yes/No).
Yes_______No________
]
Qu 5b. If 5a = Yes, what type of subsidy? (tick all that apply)
Subsidy on price ____; Subsidy on transport _____; Subsidy on raw material ______; free distribution of fertilizers _____; other (specify) _____
Qu 5c. If 5b=Yes, what type of instruments are used to target the subsidy? (tick those that apply)
Input vouchers:_______; fertilizer for work programs:_______; other (specify): __________
Qu 5d. Is there any importation of fertilizers by governments/donors/NGOs?(Yes/No)
Yes_______No________
Qu 5e. If 5c = Yes, is the fertilizer imported by government/donors/NGOs distributed by governments/donors/NGOs or via the private sector? (tick all that apply)
Distributed by government/donors/ NGOs _____
Distributed by private sector _____
Both ____________
Page 98
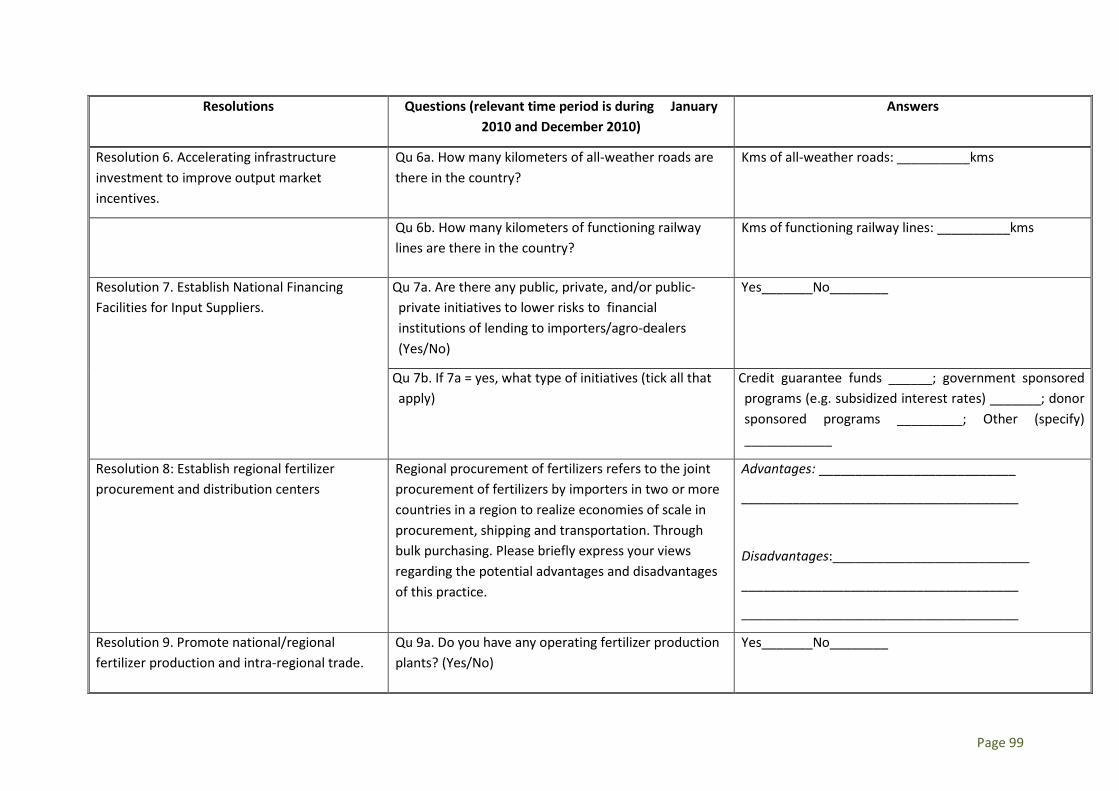
Resolutions Questions (relevant time period is during January 2010 and December 2010)
Answers
Resolution 6. Accelerating infrastructure investment to improve output market incentives.
Qu 6a. How many kilometers of all-weather roads are there in the country?
Kms of all-weather roads: __________kms
Qu 6b. How many kilometers of functioning railway lines are there in the country?
Kms of functioning railway lines: __________kms
Resolution 7. Establish National Financing Facilities for Input Suppliers.
Qu 7a. Are there any public, private, and/or public-private initiatives to lower risks to financial institutions of lending to importers/agro-dealers (Yes/No)
Yes_______No________
Qu 7b. If 7a = yes, what type of initiatives (tick all that apply)
Credit guarantee funds ______; government sponsored programs (e.g. subsidized interest rates) _______; donor sponsored programs _________; Other (specify) ____________
Resolution 8: Establish regional fertilizer procurement and distribution centers
Regional procurement of fertilizers refers to the joint procurement of fertilizers by importers in two or more countries in a region to realize economies of scale in procurement, shipping and transportation. Through bulk purchasing. Please briefly express your views regarding the potential advantages and disadvantages of this practice.
Advantages: ___________________________
______________________________________
Disadvantages:___________________________
______________________________________
______________________________________
Resolution 9. Promote national/regional fertilizer production and intra-regional trade.
Qu 9a. Do you have any operating fertilizer production plants? (Yes/No)
Yes_______No________
Page 99
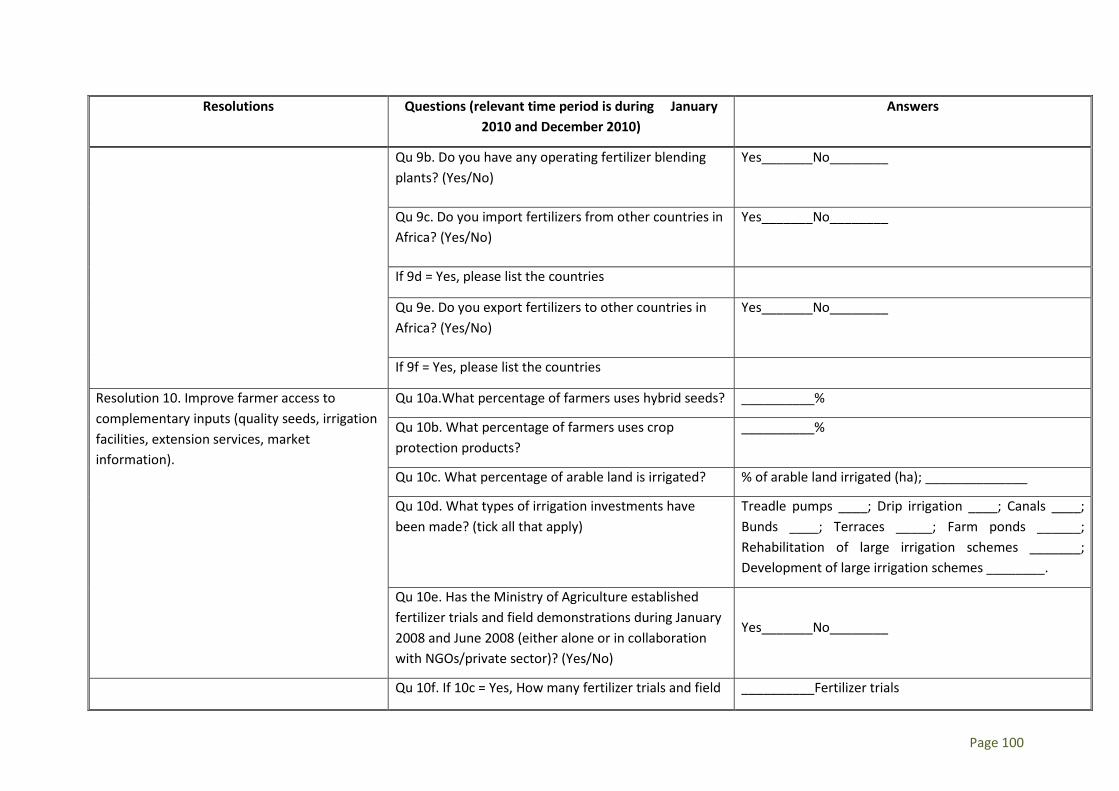
Resolutions Questions (relevant time period is during January 2010 and December 2010)
Answers
Qu 9b. Do you have any operating fertilizer blending plants? (Yes/No)
Yes_______No________
Qu 9c. Do you import fertilizers from other countries in Africa? (Yes/No)
Yes_______No________
If 9d = Yes, please list the countries
Qu 9e. Do you export fertilizers to other countries in Africa? (Yes/No)
Yes_______No________
If 9f = Yes, please list the countries
Resolution 10. Improve farmer access to complementary inputs (quality seeds, irrigation facilities, extension services, market information).
Qu 10a.What percentage of farmers uses hybrid seeds? __________%
Qu 10b. What percentage of farmers uses crop protection products?
__________%
Qu 10c. What percentage of arable land is irrigated? % of arable land irrigated (ha); ______________
Qu 10d. What types of irrigation investments have been made? (tick all that apply)
Treadle pumps ____; Drip irrigation ____; Canals ____; Bunds ____; Terraces _____; Farm ponds ______; Rehabilitation of large irrigation schemes _______; Development of large irrigation schemes ________.
Qu 10e. Has the Ministry of Agriculture established fertilizer trials and field demonstrations during January 2008 and June 2008 (either alone or in collaboration with NGOs/private sector)? (Yes/No)
Yes_______No________
Qu 10f. If 10c = Yes, How many fertilizer trials and field __________Fertilizer trials
Page 100
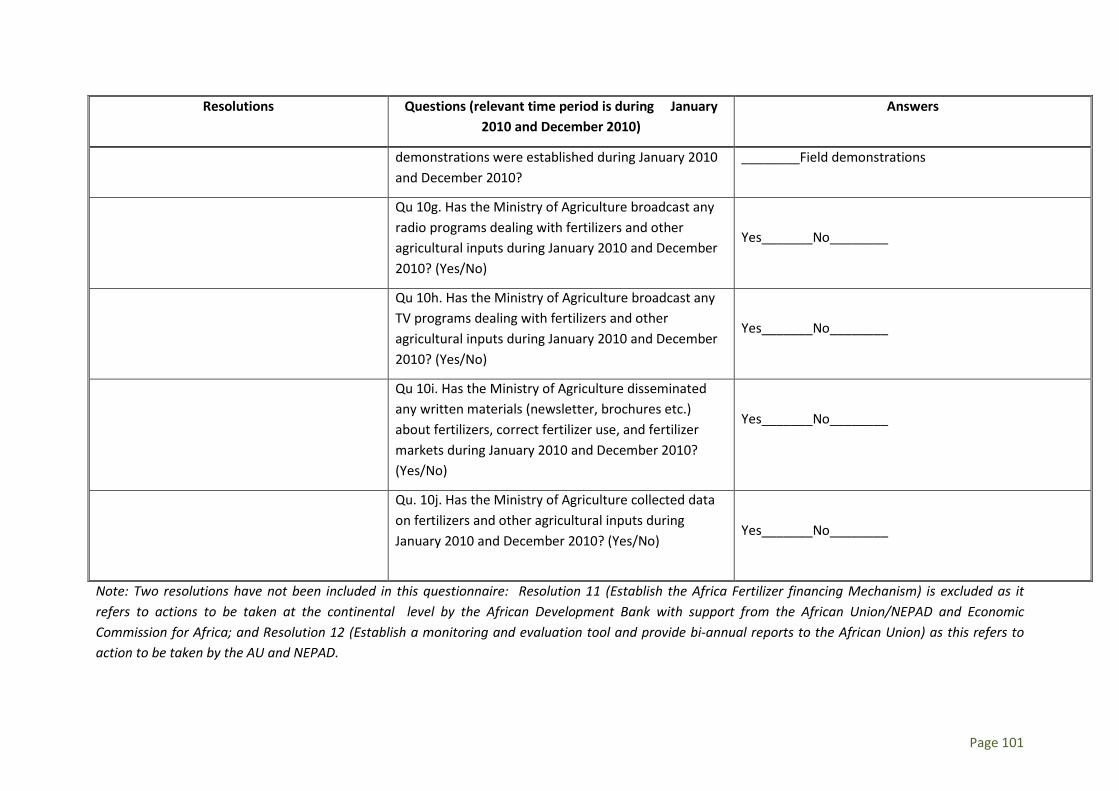
Resolutions Questions (relevant time period is during January 2010 and December 2010)
Answers
demonstrations were established during January 2010 and December 2010?
________Field demonstrations
Qu 10g. Has the Ministry of Agriculture broadcast any radio programs dealing with fertilizers and other agricultural inputs during January 2010 and December 2010? (Yes/No)
Yes_______No________
Qu 10h. Has the Ministry of Agriculture broadcast any TV programs dealing with fertilizers and other agricultural inputs during January 2010 and December 2010? (Yes/No)
Yes_______No________
Qu 10i. Has the Ministry of Agriculture disseminated any written materials (newsletter, brochures etc.) about fertilizers, correct fertilizer use, and fertilizer markets during January 2010 and December 2010? (Yes/No)
Yes_______No________
Qu. 10j. Has the Ministry of Agriculture collected data on fertilizers and other agricultural inputs during January 2010 and December 2010? (Yes/No)
Yes_______No________
Note: Two resolutions have not been included in this questionnaire: Resolution 11 (Establish the Africa Fertilizer financing Mechanism) is excluded as it refers to actions to be taken at the continental level by the African Development Bank with support from the African Union/NEPAD and Economic Commission for Africa; and Resolution 12 (Establish a monitoring and evaluation tool and provide bi-annual reports to the African Union) as this refers to action to be taken by the AU and NEPAD.
Page 101
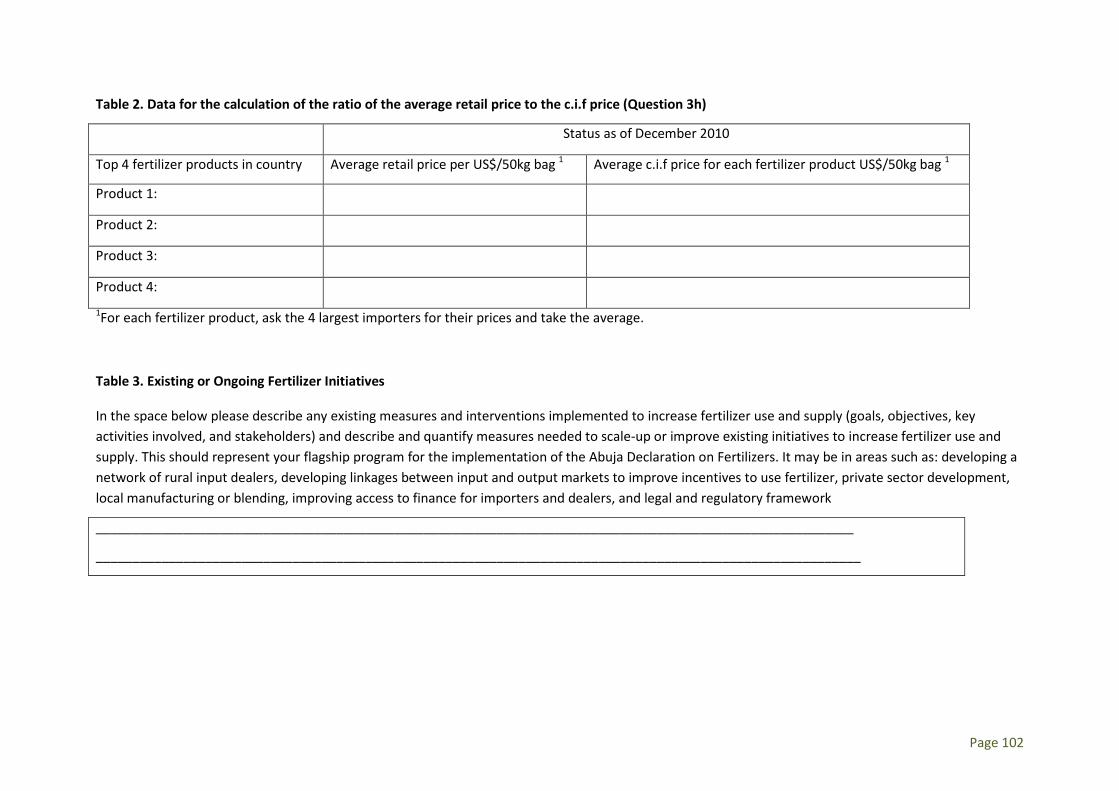
Table 2. Data for the calculation of the ratio of the average retail price to the c.i.f price (Question 3h)
Status as of December 2010
Top 4 fertilizer products in country Average retail price per US$/50kg bag 1 Average c.i.f price for each fertilizer product US$/50kg bag 1
Product 1:
Product 2:
Product 3:
Product 4: 1For each fertilizer product, ask the 4 largest importers for their prices and take the average.
Table 3. Existing or Ongoing Fertilizer Initiatives
In the space below please describe any existing measures and interventions implemented to increase fertilizer use and supply (goals, objectives, key activities involved, and stakeholders) and describe and quantify measures needed to scale-up or improve existing initiatives to increase fertilizer use and supply. This should represent your flagship program for the implementation of the Abuja Declaration on Fertilizers. It may be in areas such as: developing a network of rural input dealers, developing linkages between input and output markets to improve incentives to use fertilizer, private sector development, local manufacturing or blending, improving access to finance for importers and dealers, and legal and regulatory framework
________________________________________________________________________________________________________
_________________________________________________________________________________________________________
Page 102
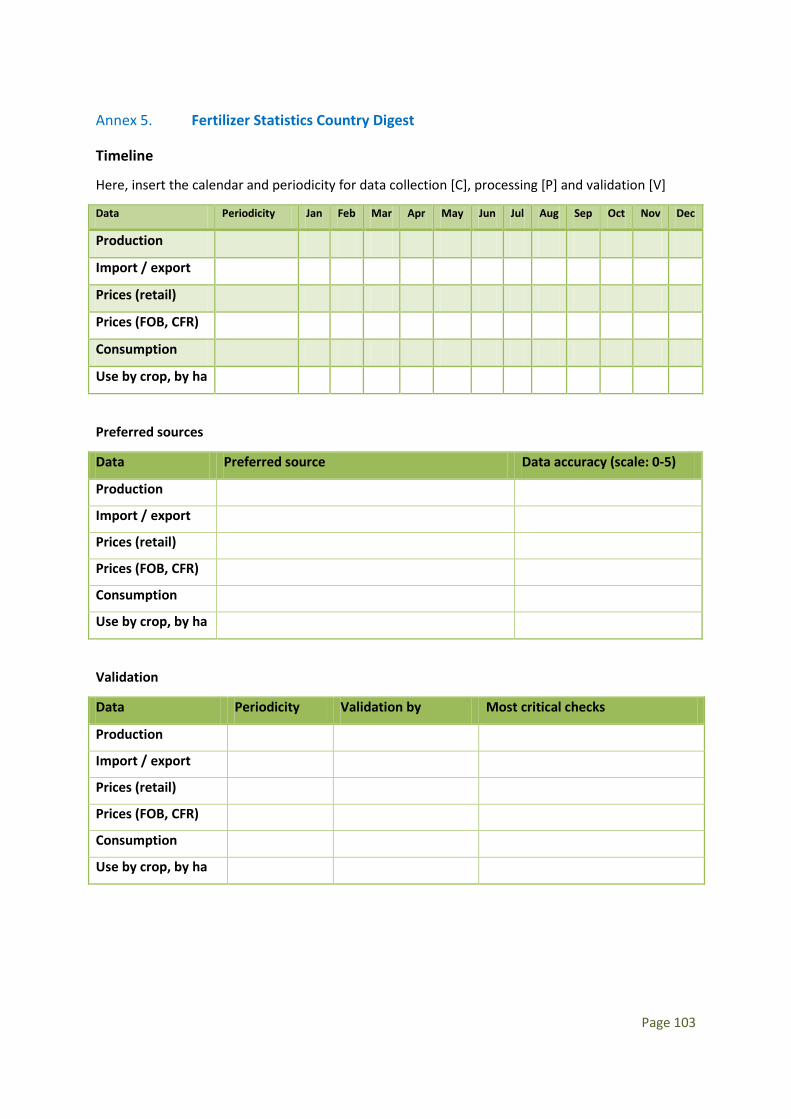
Annex 5. Fertilizer Statistics Country Digest
Timeline
Here, insert the calendar and periodicity for data collection [C], processing [P] and validation [V]
Data Periodicity Jan Feb Mar Apr May Jun Jul Aug Sep Oct Nov Dec
Production
Import / export
Prices (retail)
Prices (FOB, CFR)
Consumption
Use by crop, by ha
Preferred sources
Data Preferred source Data accuracy (scale: 0-5)
Production
Import / export
Prices (retail)
Prices (FOB, CFR)
Consumption
Use by crop, by ha
Validation
Data Periodicity Validation by Most critical checks
Production
Import / export
Prices (retail)
Prices (FOB, CFR)
Consumption
Use by crop, by ha
Page 103
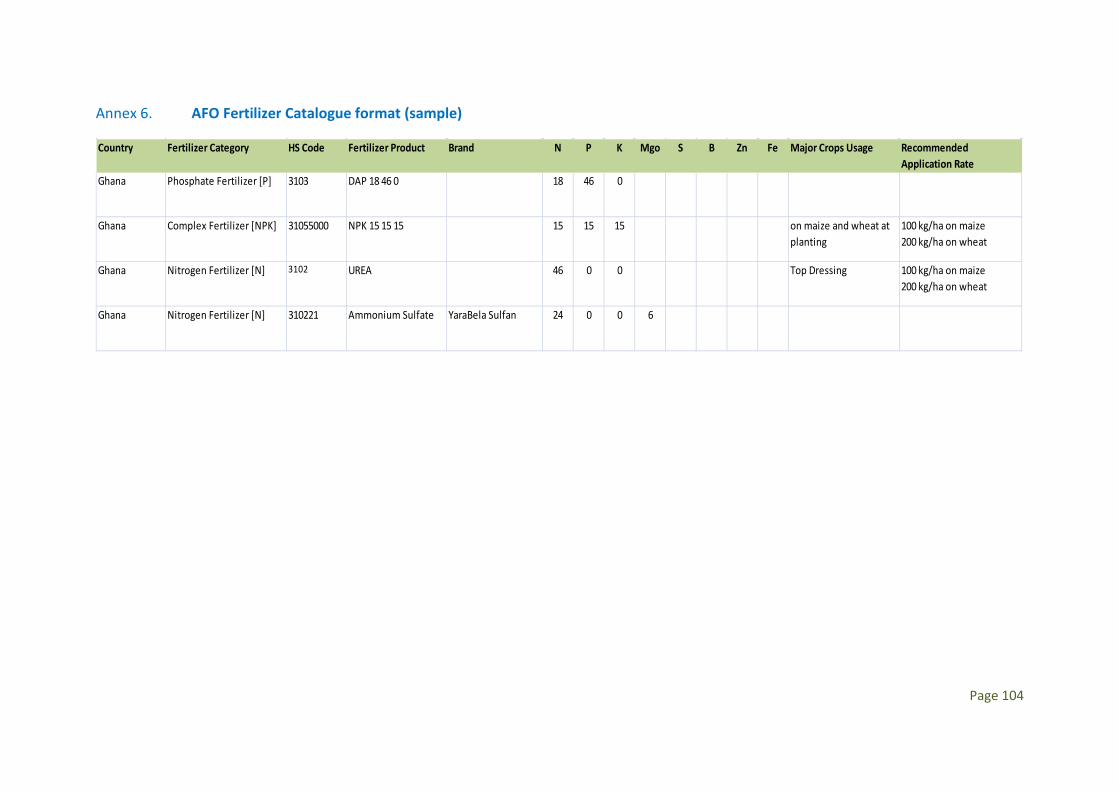
Annex 6. AFO Fertilizer Catalogue format (sample)
Country Fertilizer Category HS Code Fertilizer Product Brand N P K Mgo S B Zn Fe Major Crops Usage Recommended Application Rate
Ghana Phosphate Fertilizer [P] 3103 DAP 18 46 0 18 46 0
Ghana Complex Fertilizer [NPK] 31055000 NPK 15 15 15 15 15 15 on maize and wheat at planting
100 kg/ha on maize200 kg/ha on wheat
Ghana Nitrogen Fertilizer [N] 3102 UREA 46 0 0 Top Dressing 100 kg/ha on maize200 kg/ha on wheat
Ghana Nitrogen Fertilizer [N] 310221 Ammonium Sulfate YaraBela Sulfan 24 0 0 6
Page 104