TRAINING MANUAL - Localizing the...
48
ON SELECTED HUMAN SETTLEMENTS INDICATORS OF THE SDG TRAINING MANUAL
Transcript of TRAINING MANUAL - Localizing the...
ON SELECTED HUMAN SETTLEMENTS INDICATORS OF THE SDG
TRAINING MANUAL
HOW TO USE THE MANUAL?Read this manual before use. Read each module again for clarity before you begin. The manual provides the following information for each module:
1. Objectives: This describes what participants should learn by going through the module. Introduce every module to the participants by informing them of the key points in the module and what is to be covered in it.
2. Duration: This is how long training on the module should take, based on experience. This duration is however not fixed and may need to be adjusted in view of the target participants undertaking the training programme.
3. Facilitator’s notes: These notes will assist the facilitator to facilitate the module better by identifying and highlighting key points to focus on and prepare for. The facilitator reads these notes before embarking on facilitation. This manual contains a few legal concepts, words and terminologies that the facilitator may not use often. It is vital to know the meaning of the concepts and terminologies when facilitating the modules in this manual. A legal dictionary is an important resource for interpretation of legal terms.
TRAINING MODULE LAYOUT: Each module begins with an overview, followed by the learning objectives; the session and the time needed for each session, the method to be used or process to be followed-step by step. Time allocated for the modules is estimated and can be shortened or lengthened depending on the mode and pace of facilitation.

i i iTRAINING MANUAL ON SELECTED HUMAN SETTLEMENTS INDICATORS OF THE SDG
TABLE OF CONTENTS
CONTENTS
Module 1...................................................................................................................................................................................v Module Overview .............................................................................................................................................................v
Objectives ...................................................................................................................................................................v Notes for the Facilitator .........................................................................................................................................v Duration.......................................................................................................................................................................v Target Group ..............................................................................................................................................................v
Unit 1: Introduction ........................................................................................................................................................vi Objectives ...................................................................................................................................................................v Rationale of the Module ........................................................................................................................................v Concepts and Definitions ......................................................................................................................................v
Unit 2: Methodology .....................................................................................................................................................6 Objectives ...................................................................................................................................................................6 Activities ......................................................................................................................................................................6 Data Sources ..............................................................................................................................................................6 Software ......................................................................................................................................................................6
Unit 3:Rationale for Monitoring .................................................................................................................................22 Data Collection .........................................................................................................................................................22 Capacity Development ..........................................................................................................................................22 Data Release ...............................................................................................................................................................22 General Limitations of the Data ..........................................................................................................................22 Additional Limitations ............................................................................................................................................23 References ..................................................................................................................................................................23
Module 2...................................................................................................................................................................................24Module Overview ...........................................................................................................................................................25Unit 1:Introduction .........................................................................................................................................................26 Background ................................................................................................................................................................26 Concepts and Definition ........................................................................................................................................26
Unit 2: Methodology .....................................................................................................................................................29 Objectives ...................................................................................................................................................................29 Activities ......................................................................................................................................................................29 Data Sources ..............................................................................................................................................................29 Software ......................................................................................................................................................................29
Unit 3:Rationale for Monitoring .................................................................................................................................38 Data collection ..........................................................................................................................................................38 Capacity Development ..........................................................................................................................................38 Data Release ...............................................................................................................................................................38
Unit 4: General Limitations ..........................................................................................................................................39References .........................................................................................................................................................................41

iv TRAINING MANUAL ON SELECTED HUMAN SETTLEMENTS INDICATORS OF THE SDG
MODULE 1TARGET 11.1 By 2030, ensure access for all to adequate, safe and affordable housing and basic services and upgrade slums.
Indicator 11.1.1: Proportion of urban population living in slums, informal settlements or inadequate housing

vTRAINING MANUAL ON SELECTED HUMAN SETTLEMENTS INDICATORS OF THE SDG
MODULE OVERVIEW
OBJECTIVES
At the end of the module, participants will be able to: § Understand the essential concepts and definitions of the indicator.
§ Understand how to develop strategies for collecting, validating, and analysing data based on the data collected and the methodology given.
§ Understand the monitoring and reporting timelines
§ Understand the general limitations of the indicator in terms of data collection, monitoring and reporting.
NOTES FOR THE FACILITATOR § Allow participants to share observations about the tenure rights to land. § Introduce the session by informing the participants that this session is designed to deepen their
understanding slums, informal settlements and inadequate housing.
DURATIONThis module will be taught in Two (2) hours
§ This module aims at providing practical guide to information tools, data collection procedures and analysis for the computation of indicator 11.1.1 of Goal 11.
§ As you begin, you will need to know the essentials about data collection including selecting the most appropriate and reliable types and sources of data, data collection and analysis methods. This module addresses these issues, with particular focus on statistics and spatial data collection (where applicable), analysis.
§ Through a series of presentations, examples and exercises, this module will provide you with a number of tools and techniques necessary to complete the data collection and analysis.
TARGET GROUP: § Local government authorities
§ City leaders,
§ Civil societies,
§ National Statistical officers
§ Urban experts

vi TRAINING MANUAL ON SELECTED HUMAN SETTLEMENTS INDICATORS OF THE SDG
UNIT ONE: INTRODUCTION
OBJECTIVES
§ Understand the concepts and definitions of slums, informal settlements and inadequate housing.
§ Allow for safe discussion and exploration of participants own views on slums, informal settlements and inadequate housing.
1. RATIONALE OF THE MODULE More than half of the world’s population lives in cities today. It is anticipated that 95% of the growth in urban areas in the next two decades will results in the cities becoming home to more the 4 billion people that translates to about 80% of future urban population. This Rapid urbanization when not monitored effectively or controlled may lead to the rise of informal settlements as well as inadequate housing that is a manifestation of signs of urban poverty. With increased urban growth, various inequalities will develop if the appropriate policies are not designed effectively to counter the resulting effects of the externalities because of this growth.
Inequalities in urban areas can be captured and explained through various means, they can be economic, gender or spatial. Spatial inequalities are usually expressed as segregations of groups within the society. This is indicated in the housing conditions of the urban inhabitants and commonly expressed as the existence of inadequate living conditions or in the emergence of slum households that provide inadequate living conditions. In order to develop the adequate policies, it is important to identify and quantify the proportion of the population that lives in slums and as well as the total number of inhabitants within the urban area those lives in informal settlements or have inadequate housing.
A range of interrelated factors usually causes both slums and inadequate housing. These may vary from the consequence of weaknesses in housing policies, poor planning and land management, urban migration related to urban densification, disasters, conflicts, long-term poverty as well as the lack of affordable housing. All these factors point to the fact the measurement of the indicator in respective aspect will provide a broad field for spectrum analysis of the urban related issues towards the achievement of the Agenda 2030.
ACTIVITIES
In the plenary, ask the participants to identify the difference between slums, informal settlements and inadequate housing.

1TRAINING MANUAL ON SELECTED HUMAN SETTLEMENTS INDICATORS OF THE SDG
Concepts and Definitions
a. Slums
Slum household defined as as one in which the inhabitants are suffer one or more of the following: 1) Lack of access to improved water source, 2) Lack of access to improved sanitation facilities, 3) Lack of sufficient living area, 4) Lack of housing durability and 5) Lack of security of tenure.
Access to improved water: A household is considered to have access to improved drinking water if it has sufficient amount of water (20 litres/person/day) for family use, at an affordable price (less than 10% of the total household income) as well as available to all household members without being subjected to extreme efforts (less than one hour a day for the minimum sufficient quantity).
In addition, the facility (source of drinking water) is protected from outside contamination, in particular faecal matter. Improved drinking water sources include: piped in water into dwelling, plot or yard; public tap/stand pipe service with no more than 5 households; protected spring; rain water collection; bottled water if secondary source is also improved; bore hole/tube well; and protected dug well.
Access to improved sanitation- households have access to improved sanitation if either an excreta disposal system is available to household members, in the form of a private toilet or a public toilet shared with a reasonable number of people. Such improved sanitation facilities, thus, hygienically separates human waste from human contact.
The improved facilities include; flush/pour-flush toilets or latrines connected to a sewer, septic tank or pit; ventilated improved pit latrine; pit latrine with a slab or platform that covers the pit entirely; and, composting toilets/latrines.
Sufficient living area: - A household dwelling unit provides sufficient living area for the household members if not more than three people share the same habitable room.
Structural quality/durability of dwellings: A housing structure is considered as ‘durable’ if it is built on a non-hazardous location and has a permanent and adequate structure able to protect its inhabitants from the extremes of climatic conditions such as rain, heat, cold, and humidity. In order to determine the household durability, consider the following elements:
1. Permanency of structure (permanent building material for the walls, roof and floor; compliance with building codes; the dwelling is not in a dilapidated state; the dwelling is not in need of major repair); and
2. Location of house (The house is not located on or near toxic waste, in a flood plain, not located on a steep slope, not located in a dangerous right of way of rail, highway, airport, and power lines).
Security of tenure: A housing structure should have security of tenure. This means that the members of the household should have a legal status against arbitrary unlawful eviction, harassment as well as any other threats. The housing structure should have statutory or customary law or informal or hybrid arrangements that safeguard the house members against forced evictions.

2 TRAINING MANUAL ON SELECTED HUMAN SETTLEMENTS INDICATORS OF THE SDG
Discussion (15 minutes)
From the pictures above. Ask the participants to identify the various components of a slum

3TRAINING MANUAL ON SELECTED HUMAN SETTLEMENTS INDICATORS OF THE SDG
b) Informal Settlements: Informal residents are residential areas where:
1. Inhabitants have no security of tenure vis-à-vis the land or dwellings they inhabit, with modalities ranging from squatting to informal rental housing,
2. The neighbourhoods usually lack, or are cut off from, basic services and formal city infrastructure,
3. The housing may not comply with current planning and building regulations, situated in geographically and environmentally hazardous areas, and may lack a municipal permit.
c) Inadequate Housing: A housing unit is considered if at a minimum:
1. Has a legal security of tenure, such that all the members of the household have guaranteed legal protection against forced evictions, harassment and other threats.
2. Has adequate and available services, materials, facilities and infrastructure, such as safe drinking water, adequate sanitation, and energy for cooking, heating, lighting, food storage or refuse disposal.
3. Affordability, as housing is not adequate if its cost threatens or compromises the occupants’ enjoyment of other human rights.
4. Guarantee physical safety, provide adequate space, and give protection against cold, damp, heat, rain, wind and other threats to health and structural hazards.
5. Accessibility as housing is not adequate if the specific needs of disadvantaged and marginalized groups are not taken into account ( such as the poor, people who face all forms of discrimination, persons with disabilities and victims of natural disasters).
6. Location, as housing is not adequate if it is not easy access to employment opportunities, health-care services, schools, childcare centres and other social facilities. It should not be located in dangerous or polluted sites or in areas that are in close proximity to pollution sources.

4 TRAINING MANUAL ON SELECTED HUMAN SETTLEMENTS INDICATORS OF THE SDG
7. Cultural adequacy, as housing is not adequate if it does not respect to take into account the expression of cultural identity and the members ways of life
NOTES:
………………………………………………………………………………………………………………
………………………………………………………………………………………………………………
………………………………………………………………………………………………………………
………………………………………………………………………………………………………………
………………………………………………………………………………………………………………
………………………………………………………………………………………………………………
………………………………………………………………………………………………………………
………………………………………………………………………………………………………………
………………………………………………………………………………………………………………
………………………………………………………………………………………………………………
………………………………………………………………………………………………………………
………………………………………………………………………………………………………………
………………………………………………………………………………………………………………
………………………………………………………………………………………………………………
………………………………………………………………………………………………………………

5TRAINING MANUAL ON SELECTED HUMAN SETTLEMENTS INDICATORS OF THE SDG
……………………………………………………………………………………………………………………………………
……………………………………………………………………………………………………………………………………
……………………………………………………………………………………………………………………………………
……………………………………………………………………………………………………………………………………
……………………………………………………………………………………………………………………………………
……………………………………………………………………………………………………………………………………
……………………………………………………………………………………………………………………………………
……………………………………………………………………………………………………………………………………
……………………………………………………………………………………………………………………………………
……………………………………………………………………………………………………………………………………
……………………………………………………………………………………………………………………………………
……………………………………………………………………………………………………………………………………
……………………………………………………………………………………………………………………………………
……………………………………………………………………………………………………………………………………
……………………………………………………………………………………………………………………………………
……………………………………………………………………………………………………………………………………
……………………………………………………………………………………………………………………………………
……………………………………………………………………………………………………………………………………
……………………………………………………………………………………………………………………………………
……………………………………………………………………………………………………………………………………
……………………………………………………………………………………………………………………………………
……………………………………………………………………………………………………………………………………
……………………………………………………………………………………………………………………………………
……………………………………………………………………………………………………………………………………
……………………………………………………………………………………………………………………………………
……………………………………………………………………………………………………………………………………
……………………………………………………

6 TRAINING MANUAL ON SELECTED HUMAN SETTLEMENTS INDICATORS OF THE SDG
UNIT TWO: METHODOLOGY
OBJECTIVES
§ Understand how to develop the essentials for collecting and validating data
§ Demonstrate how to compute the indicator based on the data collected and the methodology defined concepts and definitions of the indicator.
DATA SOURCES § Domestic Household Surveys (DHS) § Multiple Indicator Cluster Survey (MICS) § Census § EU statistics on income and living conditions
SOFTWARE § SPSS Version 12 onwards § Stata Version 10 onwards, § R+
IN THIS SECTION, YOU WILL LEARN HOW TO1. Collect and validate data2. Compute the indicator based on the data collected and methodology provide
THIS INDICATOR IS COMPOSED OF THREE MAIN COMPONENTS.a. Slum Householdsb. Informal settlements householdsc. Inadequate housing households
ACTIVITY ONE:COMPUTATION OF SLUM HOUSEHOLDS
Demo Data: Ecuador Census data for 2012
Step one: Collect all primary data sources for the country. Household survey data are preferred whenever they are available.
The Demographic and Health Surveys (DHS), Multiple Indicator Cluster Surveys (MICS) or other household data (Surveys or census) are the primary data sources preferred.
Example:
ACTIVITIES
In the plenary, ask the participants to identify how, where and ways of collecting data related to land tenure rights.
7TRAINING MANUAL ON SELECTED HUMAN SETTLEMENTS INDICATORS OF THE SDG
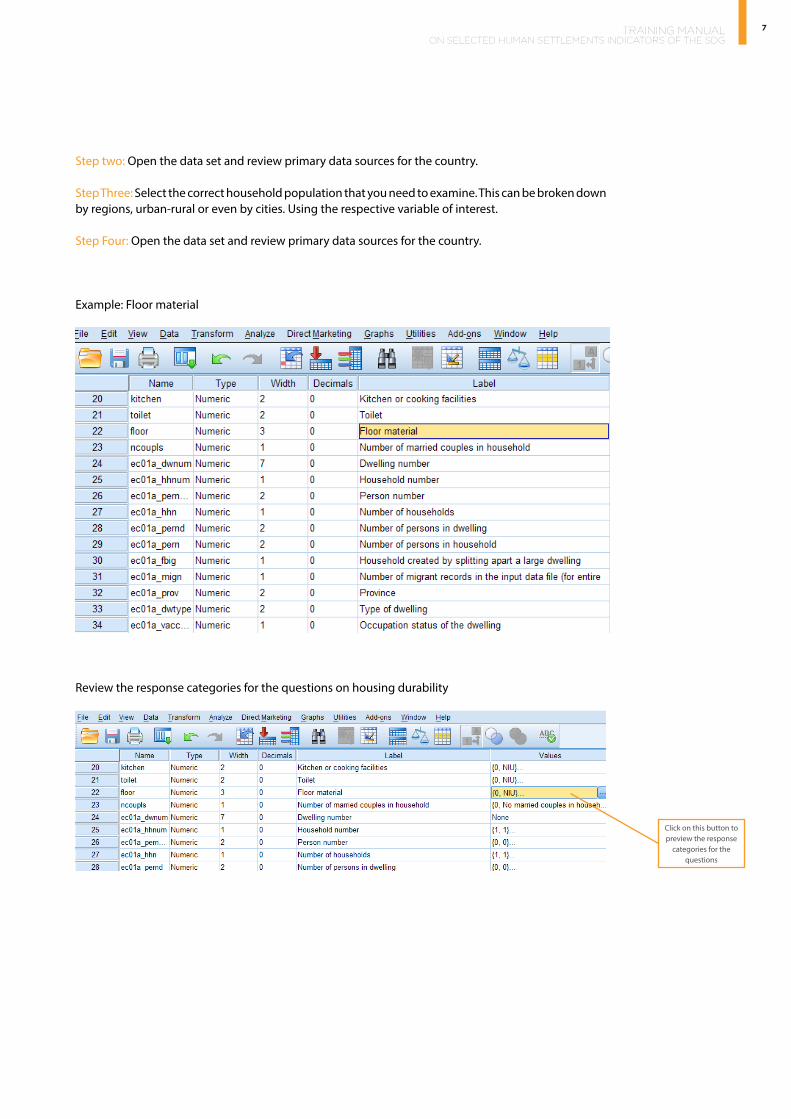
Step two: Open the data set and review primary data sources for the country.
Step Three: Select the correct household population that you need to examine. This can be broken down by regions, urban-rural or even by cities. Using the respective variable of interest.
Step Four: Open the data set and review primary data sources for the country.
Example: Floor material
Review the response categories for the questions on housing durability
Click on this button to preview the response
categories for the questions

8 TRAINING MANUAL ON SELECTED HUMAN SETTLEMENTS INDICATORS OF THE SDG
Example of a preview window for the responses under floor material
* Where possible the various responses categories are grouped and interpreted according to the definitions for informal settlements. (Not all surveys or census data use the same categories to define ownership of the dwelling)
The categories grouped for Security of tenure can use the following criteria. Example on Ownership of dwelling)
HOUSING
Original Variable Name EC10A_FLOOR
Variable Label Predominant materials of the floor
Selected Value labels For Improved Housing
1 Fitted-groove wood, parquet, boards, or finished wood
3 Ceramic, tile, vinyl, or marble
4 Brick or cement
To group the question responses, we use the following syntax to develop the new indicator. Floor This will tabulate the frequencies into tables as shown below.

9TRAINING MANUAL ON SELECTED HUMAN SETTLEMENTS INDICATORS OF THE SDG
Original Indicator
Frequency PercentValid
PercentCumulative
Percent
1 Fitted-groove wood, parquet, boards, or finished wood
738630 16.1 16.1 16.1
2 Unfinished boards 356370 7.8 7.8 23.9
3 Ceramic, tile, vinyl, or marble 1692950 36.9 36.9 60.8
4 Brick or cement 1596820 34.8 34.8 95.5
5 Cane 10580 .2 .2 95.8
6 Dirt 137370 3.0 3.0 98.8
7 Other materials 40010 .9 .9 99.6
9 NIU (not in universe) 16460 .4 .4 100.0
Total 4589190 100.0 100.0
New Indicator
Frequency PercentValid
PercentCumulative
Percent
.00 Unimproved Housing 560790 12.2 12.2 12.2
1.00 Improved Housing 4028400 87.8 87.8 100.0
Total 4589190 100.0 100.0
DURABLE HOUSING
EC10A_FLOOR Predominant materials of the floor
Valid
floor1 durable house
Valid
This should be done for the response categories for the questions on access to improved water, improved sanitation, sufficient living area, improved housing and lack of security of tenure for slums need to be re-viewed to ensure that they meet the defined criteria.
Step Five: Repeat ‘step four’ for all the elements of slums and obtain the respective new indicators. The new indicators should be coded as follows.
Indicator codes:
Water1 = 1: Improved water 2: Unimproved waterToilet1 = 1: Improved sanitation 2: Unimproved sanitationLiving1 = 1: Sufficient Living Area 2: OvercrowdingFloor1 = 1: Durable Housing 2: Non-Durable HousingSecure1= 1: Secure Tenure 2: Unsecure Tenure
* In this example, the slum computation will only rely on the first four only for demonstration purposes.
Step Six: Using the new variables with, focus only on urban households, identified in ‘step four’ we compute the slum household by the respective deprivation (These form part of the quantifiable derivatives for the measurement of target 11.1) as shown below.

10 TRAINING MANUAL ON SELECTED HUMAN SETTLEMENTS INDICATORS OF THE SDG
Shelter Deprivation measures how many components a household does not have i.e.1: One Shelter Deprivation - household has 3 components and is only missing 1 other component.2: Two Shelter Deprivation - household has 2 components and is only missing 2 other components.3: Three Shelter Deprivation - household has 1 component and is only missing 3 other components.4: Four Shelter Deprivation - household has NONE of the required components
Slum = One Shelter Deprivation + Two Shelter Deprivation + Three Shelter Deprivation + Four Shelter Deprivation
The shelter deprivation is computed is using three steps.
First step: First, is to compute the various combinations of the respective variables as shown
This should be done to ensure that all possible combinations are considered and have been computed. Such that no combination is forgotten to ensure that all aspects have been combined.
From this we compute the slums total as follows

11TRAINING MANUAL ON SELECTED HUMAN SETTLEMENTS INDICATORS OF THE SDG
And these are labelled as indicated below
Second Step: the different combinations are computed into the different classes and then we proceed to label the classes for the slums stratification as follows.
Step Three: The slum stratifications are then grouped together as follows.

12 TRAINING MANUAL ON SELECTED HUMAN SETTLEMENTS INDICATORS OF THE SDG
If this is done properly and the results are cross-tabulated for the urban areas, we obtain the data for slums in the various disaggregation’s as shown in the compiled table below.
SLUM STRATIFICATION (URBAN POPULATION ONLY)
Count % SlumNon-slum 420,110 69.2%Slum 187,040 30.8%Total 607,150 100.0%
Slum stratification groupedNon-slum household 420,110 69.2% One shelter deprivation 100,470 16.5% Two shelter deprivations 46,510 7.7% Three shelter deprivations 35,120 5.8% Four shelter deprivations 4,940 .8%Total 607,150 100.0%
Slum stratificationNon-slum household 420,110 69.2%Lack sanitation only 12,370 2.0%Lack water only 23,740 3.9%Lack housing only 33,070 5.4%Lack Living area only 31,290 5.2%Water and sanitation only 6,280 1.0%Water and living area 4,500 .7%water and housing 17,540 2.9%sanitation and living area 2,460 .4%sanitation and housing 7,390 1.2%living area and housing 8,340 1.4%Water and sanitation and living area 1,700 .3%Water and sanitation and housing 24,080 4.0%Water and living area and housing 6,690 1.1%Sanitation and living area and housing 2,650 .4%Water and sanitation and living area and housing 4,940 .8%Total 607,150 100.0%
Country one
Slum households (SH): Number of people living in slum
City population= 100 [
Slum households (SH) =100187,040
607,150[ [
Slum households (SH) = 30.81%
ACTIVITY TWO:COMPUTATION INFORMAL SETTLEMENT HOUSEHOLDS
Demo data: Ecuador Census data for 2012
*The computation Informal settlements is similar to the computation of slum household and follows similar steps with a differentiation on the type of indicators being examined.
Step one: Collect all primary data sources for the country. Household survey data are preferred whenever they are available.
The Demographic and Health Surveys (DHS), Multiple Indicator Cluster Surveys (MICS) or other household data (Surveys or census) are the primary data sources preferred.

13TRAINING MANUAL ON SELECTED HUMAN SETTLEMENTS INDICATORS OF THE SDG
Example:
Step Two: Open the data set and review primary data sources for the country.
Step Three: Select the correct household population that you need to examine. This can be broken down by regions, urban-rural or even by cities. Using the respective variable of interest.
Step Four: Open the data set and review primary data sources for the country.
Example: Ownership of dwelling
Review the response categories for the questions on housing durability

14 TRAINING MANUAL ON SELECTED HUMAN SETTLEMENTS INDICATORS OF THE SDG
Example of a preview window for the responses under ownership of dwelling
* Where possible the various responses categories are grouped and interpreted according to the definitions for informal settlements. (Not all surveys or census data use the same categories to define ownership of the dwelling)
The categories grouped for Security of tenure can use the following criteria. Example on Ownership of dwelling)
SECURITY OF TENURE
Original Variable Name EC10A_OWNERSHIP OF DWELLING
Variable Label Status of ownership of dwelling
Selected Value labels For Improved Housing
1.Owned, owned building and land, owned house, owned purchased, Owned house, owned condominium Occupant owned building and land, occupant owned building only
3.Free
4.Free for Service
Group the question responses, and develop the new indicators as shown below
.

15TRAINING MANUAL ON SELECTED HUMAN SETTLEMENTS INDICATORS OF THE SDG
Original Indicator
Frequency Percent Valid Percent Cumulative Percent
1 Owned 8476240 69.8 69.8 69.8
2 Rented 2482850 20.5 20.5 90.3
3 Sharecropping 48450 .4 .4 90.7
3 Free 637640 5.3 5.3 95.9
4 For services 322690 2.7 2.7 98.6
5 Other 83570 .7 .7 99.3
6 NIU (Not in Universe) 85810 .7 .7 100.0
Total 12137250 100.0 100.0
New Indicator
Frequency Percent Valid Percent Cumulative Percent
.00 No Security of Tenure 2700680 22.3 22.3 22.3
1.00 Security of Tenure 9436570 77.7 77.7 100.0
Total 12137250 100.0 100.0
Valid
Ownership of the dwelling
Valid
Security of Tenure
Security of tenure 1
§ This should be done for the response categories for the questions on Lack of basic services and formal city infrastructure, Noncompliance with current planning regulations, and location on non-hazardous location for informal settlements need to be reviewed to ensure that they meet the defined criteria.
Step Five: Repeat ‘step four’ for all the elements of informal settlements and obtain the respective new indicators. The new indicators can be coded i\to reflect the new indicator computed.
Tenure1 = 1: Secure Tenure 2: Insecure Tenure Compliance1 = 1: Compliance to regulations 2: Non Compliance to regulationLocation1 = 1: Non-Hazardous locale 2: Hazardous Locale
Step Six: Using the new variables with, focus only on urban households, identified in ‘step five’ we compute the informal household by the respective deprivation (These form part of the quantifiable derivatives for the measurement of target 11.1) as shown below.
Shelter Deprivation measures how many components a household does not have i.e.
1: One Shelter Deprivation - household has 3 components and is only missing 1 other component.2: Two Shelter Deprivation - household has 2 components and is only missing 2 other components.3: Three Shelter Deprivation - household has 1 component and is only missing 3 other components.4: Four Shelter Deprivation - household has NONE of the required components
Informal settlement = One Shelter Deprivation + Two Shelter Deprivation + Three Shelter Deprivation + Four Shelter Deprivation
*For informal shelter the deprivation is computed on the basis of the elements of informal shelter that are different for the ones in slums.
16 TRAINING MANUAL ON SELECTED HUMAN SETTLEMENTS INDICATORS OF THE SDG
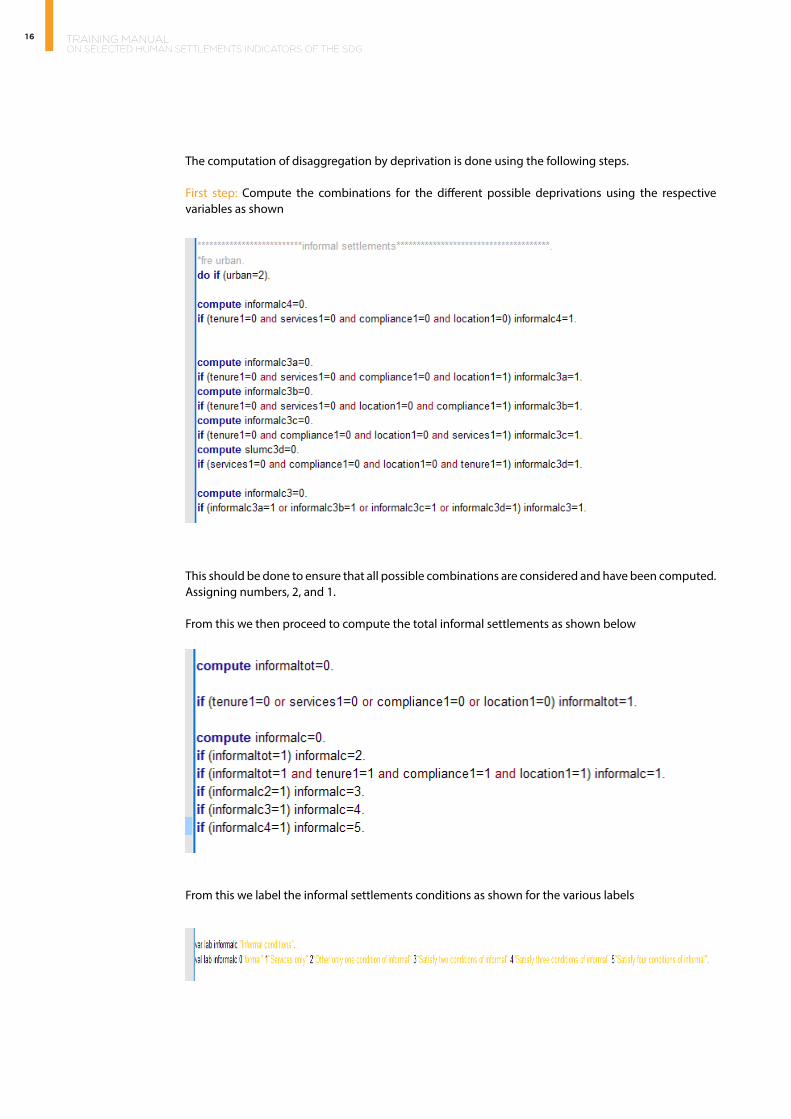
The computation of disaggregation by deprivation is done using the following steps.
First step: Compute the combinations for the different possible deprivations using the respective variables as shown
This should be done to ensure that all possible combinations are considered and have been computed. Assigning numbers, 2, and 1.
From this we then proceed to compute the total informal settlements as shown below
From this we label the informal settlements conditions as shown for the various labels

17TRAINING MANUAL ON SELECTED HUMAN SETTLEMENTS INDICATORS OF THE SDG
Second Step: the different combinations are computed into the different classes and then labelled as follows then we proceed to label the classes for the various informal settlement stratification as follows.
Third Step: The informal settlement stratifications are then grouped into the different stratification groups as shown below
If this is done properly and the results are cross-tabulated for the urban areas, we obtain the data for informal settlements in the various disaggregation’s as shown in the compiled table below.

18 TRAINING MANUAL ON SELECTED HUMAN SETTLEMENTS INDICATORS OF THE SDG
Country A
Count %
Formal settlements 405890 86.5%
Informal Settlements 63280 13.5%
Total 469170 100.0%
Informal settlements stratification groupedFormal Settlements 405890 86.5%
One shelter deprivation 54980 11.7%
Two shelter deprivations 6570 1.4%
Three shelter deprivations 1670 .4%
Four shelter deprivations 60 .0%
Total 469170 100.0%
Informal stratificationFormal Settlements 405890 86.5%
Lack Services only 4530 1.0%
Lack tenure only 4710 1.0%
Lack location only 32230 6.9%
Lack compliance only 13510 2.9%
Tenure and Services only 920 .2%
Tenure and Compliance 450 .1%
Tenure and Location 680 .1%
Services and Compliance 490 .1%
Services and Location 1040 .2%
Compliance and Location 2990 .6% Tenure and Services and Compliance
140 .0%
Tenure and Services and Location
1120 .2%
Tenure and Compliance and Location
150 .0%
Services and Compliance and Location
260 .1%
Tenure and Services and Compliance and Location
60 .0%
Total 469170 100.0%
Informal settlements households (ISH): = 100 [No.of people living in informal settlements households] City population
Informal settlements households (ISH):
Informal settlements households (ISH): 13.5%
469170100[63280]
19TRAINING MANUAL ON SELECTED HUMAN SETTLEMENTS INDICATORS OF THE SDG
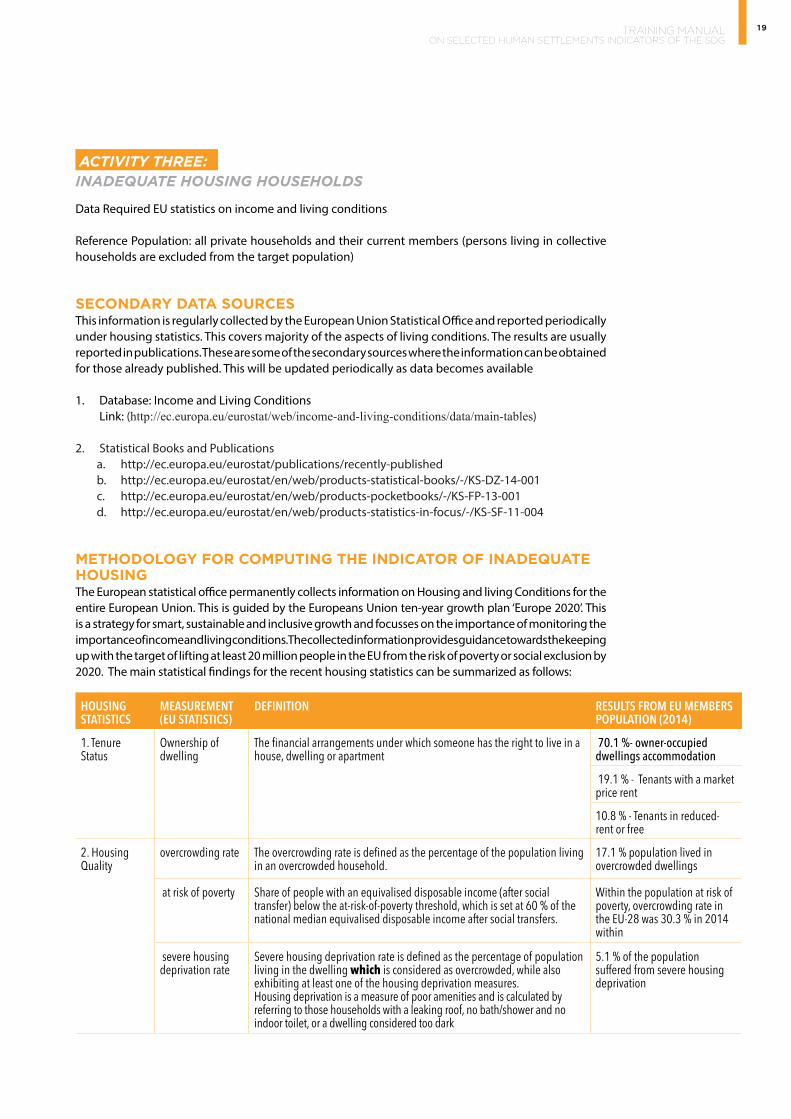
ACTIVITY THREE:INADEQUATE HOUSING HOUSEHOLDS
Data Required EU statistics on income and living conditions
Reference Population: all private households and their current members (persons living in collective households are excluded from the target population)
SECONDARY DATA SOURCESThis information is regularly collected by the European Union Statistical Office and reported periodically under housing statistics. This covers majority of the aspects of living conditions. The results are usually reported in publications. These are some of the secondary sources where the information can be obtained for those already published. This will be updated periodically as data becomes available
1. Database: Income and Living Conditions Link: (http://ec.europa.eu/eurostat/web/income-and-living-conditions/data/main-tables)
2. Statistical Books and Publications a. http://ec.europa.eu/eurostat/publications/recently-publishedb. http://ec.europa.eu/eurostat/en/web/products-statistical-books/-/KS-DZ-14-001c. http://ec.europa.eu/eurostat/en/web/products-pocketbooks/-/KS-FP-13-001d. http://ec.europa.eu/eurostat/en/web/products-statistics-in-focus/-/KS-SF-11-004
METHODOLOGY FOR COMPUTING THE INDICATOR OF INADEQUATE HOUSINGThe European statistical office permanently collects information on Housing and living Conditions for the entire European Union. This is guided by the Europeans Union ten-year growth plan ‘Europe 2020’. This is a strategy for smart, sustainable and inclusive growth and focusses on the importance of monitoring the importance of income and living conditions. The collected information provides guidance towards the keeping up with the target of lifting at least 20 million people in the EU from the risk of poverty or social exclusion by 2020. The main statistical findings for the recent housing statistics can be summarized as follows:
HOUSING STATISTICS
MEASUREMENT (EU STATISTICS)
DEFINITION RESULTS FROM EU MEMBERS POPULATION (2014)
1. Tenure Status
Ownership of dwelling
The financial arrangements under which someone has the right to live in a house, dwelling or apartment
70.1 %- owner-occupied dwellings accommodation
19.1 % - Tenants with a market price rent
10.8 % - Tenants in reduced-rent or free
2. Housing Quality
overcrowding rate The overcrowding rate is defined as the percentage of the population living in an overcrowded household.
17.1 % population lived in overcrowded dwellings
at risk of poverty Share of people with an equivalised disposable income (after social transfer) below the at-risk-of-poverty threshold, which is set at 60 % of the national median equivalised disposable income after social transfers.
Within the population at risk of poverty, overcrowding rate in the EU-28 was 30.3 % in 2014 within
severe housing deprivation rate
Severe housing deprivation rate is defined as the percentage of population living in the dwelling which is considered as overcrowded, while also exhibiting at least one of the housing deprivation measures.Housing deprivation is a measure of poor amenities and is calculated by referring to those households with a leaking roof, no bath/shower and no indoor toilet, or a dwelling considered too dark
5.1 % of the population suffered from severe housing deprivation

20 TRAINING MANUAL ON SELECTED HUMAN SETTLEMENTS INDICATORS OF THE SDG
HOUSING STATISTICS
MEASUREMENT (EU STATISTICS)
DEFINITION RESULTS FROM EU MEMBERS POPULATION (2014)
3. Housing Affordability
housing cost overburden rate
The housing cost overburden rate is the percentage of the population living in households where the total housing costs (‘net’ of housing allowances) represent more than 40 % of disposable income (‘net’ of housing allowances).
11.4 % - population lived in households that spent 40 % or more of their equivalised disposable income on housing.
highest for tenants with market price rents (27.1 %) and
lowest for persons in owner-occupied dwellings without a loan or mortgage (6.8 %).
The results capture 95% of the aspects of inadequate housing as defined by the SDGs. (See table below) Countries within the EU region already have data available. The methodology for collecting the indicator for inadequate housing will be for the countries that are not part of the EU have no collected the data.
Criteria for measuring inadequate housing check list for EU Statistics and SDGs
CONDITIONS FOR INADEQUATE HOUSING SDGS EU HOUSING STATISTICS
a. Legal security of tenure x x
b. Has adequate and available basic services x x
c. The housing unit should be affordable. x x
d. Guaranteed physical safety x x
e. Not disadvantage to disadvantaged and marginalized groups. x --
f. Located in areas of easy access to opportunities. x x
g. Take into account the expression of cultural identity and the members ways of life x --
The EU statistics methodology fails to incorporate the seven criteria for determining inadequate housing. The method for collecting the indicator is still thus under consideration and formulation.
Inadequate housing households (IHH): = 100 [No. of people living in inadequate housing] City population

21TRAINING MANUAL ON SELECTED HUMAN SETTLEMENTS INDICATORS OF THE SDG
NOTES
……………………………………………………………………………………………………………………………………
…………………………………………………………………………………………………………………………………
…………………………………………………………………………………………………………………………………
……………………………………………………………………………………………………………………………………
……………………………………………………………………………………………………………………………………
……………………………………………………………………………………………………………………………………
……………………………………………………………………………………………………………………………………
……………………………………………………………………………………………………………………………………
……………………………………………………………………………………………………………………………………
……………………………………………………………………………………………………………………………………
……………………………………………………………………………………………………………………………………
……………………………………………………………………………………………………………………………………
……………………………………………………………………………………………………………………………………
……………………………………………………………………………………………………………………………………
……………………………………………………………………………………………………………………………………
……………………………………………………………………………………………………………………………………
……………………………………………………………………………………………………………………………………
……………………………………………………………………………………………………………………………………
……………………………………………………………………………………………………………………………………
……………………………………………………………………………………………………………………………………
……………………………………………………………………………………………………………………………………
……………………………………………………………………………………………………………………………………
……………………………………………………………………………………………………………………………………
……………………………………………………………………………………………………………………………………

22 TRAINING MANUAL ON SELECTED HUMAN SETTLEMENTS INDICATORS OF THE SDG
UNIT THREE: RATIONALE FOR MONITORINGDATA COLLECTION The National agencies are responsible for data collection, no difference between country-produced data and international estimated data on the indicator are expected to arise if standard methodologies and procedures are followed at all stages of the reporting process.
CAPACITY DEVELOPMENTThis indicator has largely been successful due to the collaborations between several organizations and institution including UN-Habitat, UNEP, Cities Alliance Slum dwellers International, and World Bank.
Final Compilation and reporting at the global level will be led and guided by UN-Habitat, and selected partners.
DATA RELEASEThe monitoring of this indicator will be repeated at regular intervals of 3-5 years, allowing for three –five-year reporting points until the year 2030.
GENERAL LIMITATIONS OF THE DATA
DATA LIMITATIONS POSSIBLE SOLUTIONS
The lack of appropriate tools at national and city levels to measure all the components required to monitor indicator 11.1 has often brought challenges for statistics offices to reliably include all components that measure slums, sometimes resulting in the underestimation of poor housing units or slum households.
Indicator 11.1.1 does not capture homelessness, as it is not included in household surveys.
Several technical workshops and EGMs scheduled that will help build the capacity for reporting in the first 3 years of the 2030 Agenda for Sustainable Development.
Many countries still have limited capacities for data management, data collection and monitoring, and continue to grapple with limited data on large or densely populated geographical areas
This means that complementarity in data reporting will be key to ensure that both national and global figures achieve consistencies in the final reported data.
In the case of security of tenure, its complicated relation with land and property makes it a difficult aspect to include in the different related surveys and, therefore, to measure and monitor due to lack of routine data.
In most recent years, important progress has been made to integrate the measurement of this component into major surveys and censuses in several countries
23TRAINING MANUAL ON SELECTED HUMAN SETTLEMENTS INDICATORS OF THE SDG
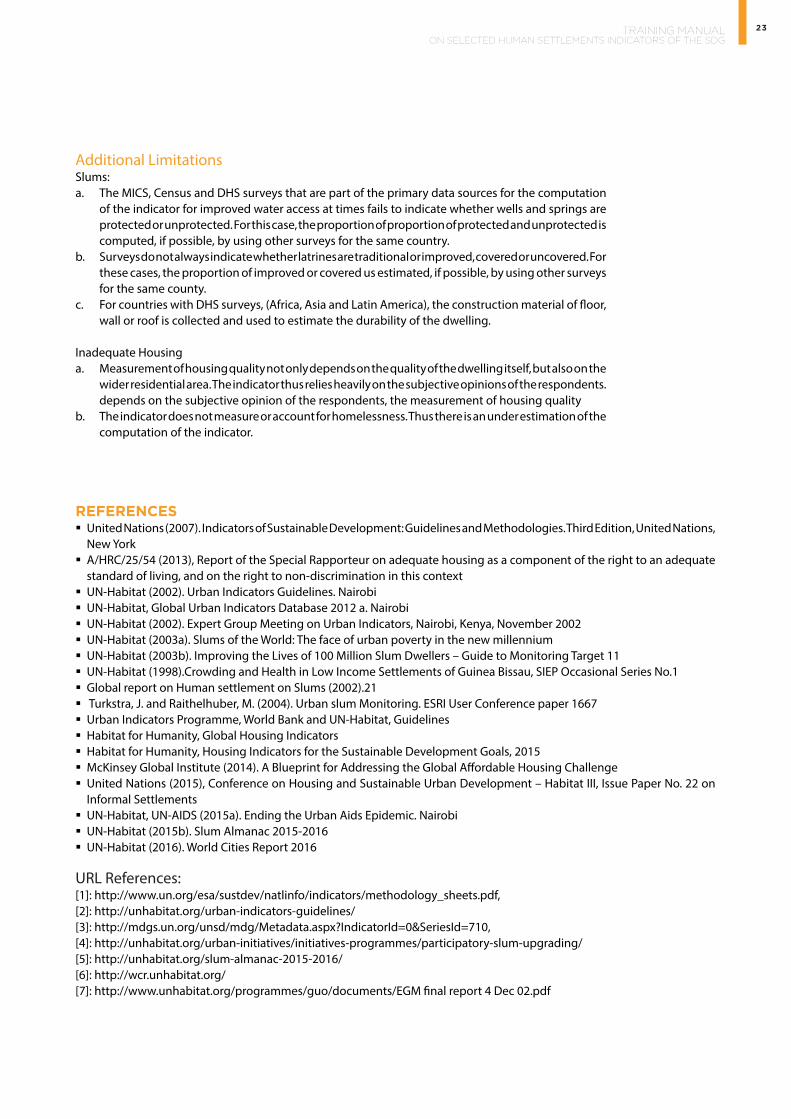
Additional LimitationsSlums: a. The MICS, Census and DHS surveys that are part of the primary data sources for the computation
of the indicator for improved water access at times fails to indicate whether wells and springs are protected or unprotected. For this case, the proportion of proportion of protected and unprotected is computed, if possible, by using other surveys for the same country.
b. Surveys do not always indicate whether latrines are traditional or improved, covered or uncovered. For these cases, the proportion of improved or covered us estimated, if possible, by using other surveys for the same county.
c. For countries with DHS surveys, (Africa, Asia and Latin America), the construction material of floor, wall or roof is collected and used to estimate the durability of the dwelling.
Inadequate Housinga. Measurement of housing quality not only depends on the quality of the dwelling itself, but also on the
wider residential area. The indicator thus relies heavily on the subjective opinions of the respondents. depends on the subjective opinion of the respondents, the measurement of housing quality
b. The indicator does not measure or account for homelessness. Thus there is an under estimation of the computation of the indicator.
REFERENCES § United Nations (2007). Indicators of Sustainable Development: Guidelines and Methodologies. Third Edition, United Nations,
New York § A/HRC/25/54 (2013), Report of the Special Rapporteur on adequate housing as a component of the right to an adequate
standard of living, and on the right to non-discrimination in this context § UN-Habitat (2002). Urban Indicators Guidelines. Nairobi § UN-Habitat, Global Urban Indicators Database 2012 a. Nairobi § UN-Habitat (2002). Expert Group Meeting on Urban Indicators, Nairobi, Kenya, November 2002 § UN-Habitat (2003a). Slums of the World: The face of urban poverty in the new millennium § UN-Habitat (2003b). Improving the Lives of 100 Million Slum Dwellers – Guide to Monitoring Target 11 § UN-Habitat (1998).Crowding and Health in Low Income Settlements of Guinea Bissau, SIEP Occasional Series No.1 § Global report on Human settlement on Slums (2002).21 § Turkstra, J. and Raithelhuber, M. (2004). Urban slum Monitoring. ESRI User Conference paper 1667 § Urban Indicators Programme, World Bank and UN-Habitat, Guidelines § Habitat for Humanity, Global Housing Indicators § Habitat for Humanity, Housing Indicators for the Sustainable Development Goals, 2015 § McKinsey Global Institute (2014). A Blueprint for Addressing the Global Affordable Housing Challenge § United Nations (2015), Conference on Housing and Sustainable Urban Development – Habitat III, Issue Paper No. 22 on
Informal Settlements § UN-Habitat, UN-AIDS (2015a). Ending the Urban Aids Epidemic. Nairobi § UN-Habitat (2015b). Slum Almanac 2015-2016 § UN-Habitat (2016). World Cities Report 2016
URL References:[1]: http://www.un.org/esa/sustdev/natlinfo/indicators/methodology_sheets.pdf,[2]: http://unhabitat.org/urban-indicators-guidelines/[3]: http://mdgs.un.org/unsd/mdg/Metadata.aspx?IndicatorId=0&SeriesId=710,[4]: http://unhabitat.org/urban-initiatives/initiatives-programmes/participatory-slum-upgrading/[5]: http://unhabitat.org/slum-almanac-2015-2016/[6]: http://wcr.unhabitat.org/[7]: http://www.unhabitat.org/programmes/guo/documents/EGM final report 4 Dec 02.pdf

24 TRAINING MANUAL ON SELECTED HUMAN SETTLEMENTS INDICATORS OF THE SDG
MODULE 2TARGET 11.2:By 2030, provide access to safe, affordable, accessible and sustainable transport systems for all, improving road safety, notably by expanding public transport, with special attention to the needs of those in vulnerable situations, women, and children, persons with disabilities and older persons.
11.2.1: Proportion of the population that has convenient access to public transport by sex, age and persons with disabilities

25TRAINING MANUAL ON SELECTED HUMAN SETTLEMENTS INDICATORS OF THE SDG
MODULE OVERVIEW
OBJECTIVES
At the end of the module, participants will be able to: § Understand the essential concepts and definitions of the indicator.
§ Understand how to develop strategies for collecting, validating, and analysing data based on the data collected and the methodology given.
§ Understand the monitoring and reporting timelines
§ Understand the general limitations of the indicator in terms of data collection, monitoring and reporting
NOTES FOR THE FACILITATOR § Allow participants to openly share observations about Public transport. § Introduce the session by informing the participants that this session is designed to deepen their
understanding about accessibility to public transport.
DURATIONThis module will be taught in two (2) hours
§ This module aims at providing practical guide to information tools, data collection procedures and analysis for the computation of indicator 11.2.1 of Goal 11.
§ As you begin, you will need to know the essentials about data collection including selecting the most appropriate and reliable types and sources of data, data collection and analysis methods. This module addresses these issues, with particular focus on statistics and spatial data collection (where applicable), analysis.
§ Through a series of presentations, examples and exercises, this module will provide you with a number of tools and techniques necessary to complete the data collection and analysis.No
§ tes for the Facilitator
TARGET GROUP: § Local government authorities
§ City leaders,
§ Civil societies,
§ National Statistical officers
§ Urban experts

26 TRAINING MANUAL ON SELECTED HUMAN SETTLEMENTS INDICATORS OF THE SDG
ACTIVITIES
In the plenary, ask the participants to identify what is public transport and write them down on a flip chart and discuss the
UNIT ONE: INTRODUCTION
OBJECTIVES § Understand the essential concepts and the definitions of the indicator.
§ The module will allow for safe discussion and exploration of participants own views on public transport and accessibility.
1. BACKGROUND Accessibility based urban mobility paradigm critically needs good, high-capacity public transport systems that are well integrated in a multimodal arrangement with public transport access points located within comfortable walking or cycling distances from homes and jobs for all.
Achieving SDG 11.2 requires a fundamental shift in the thinking on transport with the focus on the goal of transport rather than on its means. With accessibility to services, goods and opportunities for all as the ultimate goal, priority is given to make cities more compact and walkable through better planning and the integration of land-use planning with transport planning. The means of transport are also important but the SDG’s imperative to make the city more inclusive means that cities will have to move away from car based travel to public transport and active modes of transport such as walking and cycling with good inter-modal connectivity. This indicator is empirically proven that public transport makes cities more inclusive, safe and sustainable. Effective and low-cost transportation is critical for reducing urban poverty and inequalities and enhancing economic development because it provides access to jobs, health care, education services and other public goods.
CONCEPTS AND DEFINITIONSPublic transport: Defined as shared passenger transport service that is available to the public. It includes cars, buses, trolleys, trams, trains, subways, and ferries that are shared by strangers without prior arrangement. However, it excludes taxis, car pools, and hired buses, which are not shared by strangers without prior arrangement. It also excludes informal, unregulated modes of transport (paratransit), motorcycle taxis, three-wheelers, etc.
27TRAINING MANUAL ON SELECTED HUMAN SETTLEMENTS INDICATORS OF THE SDG
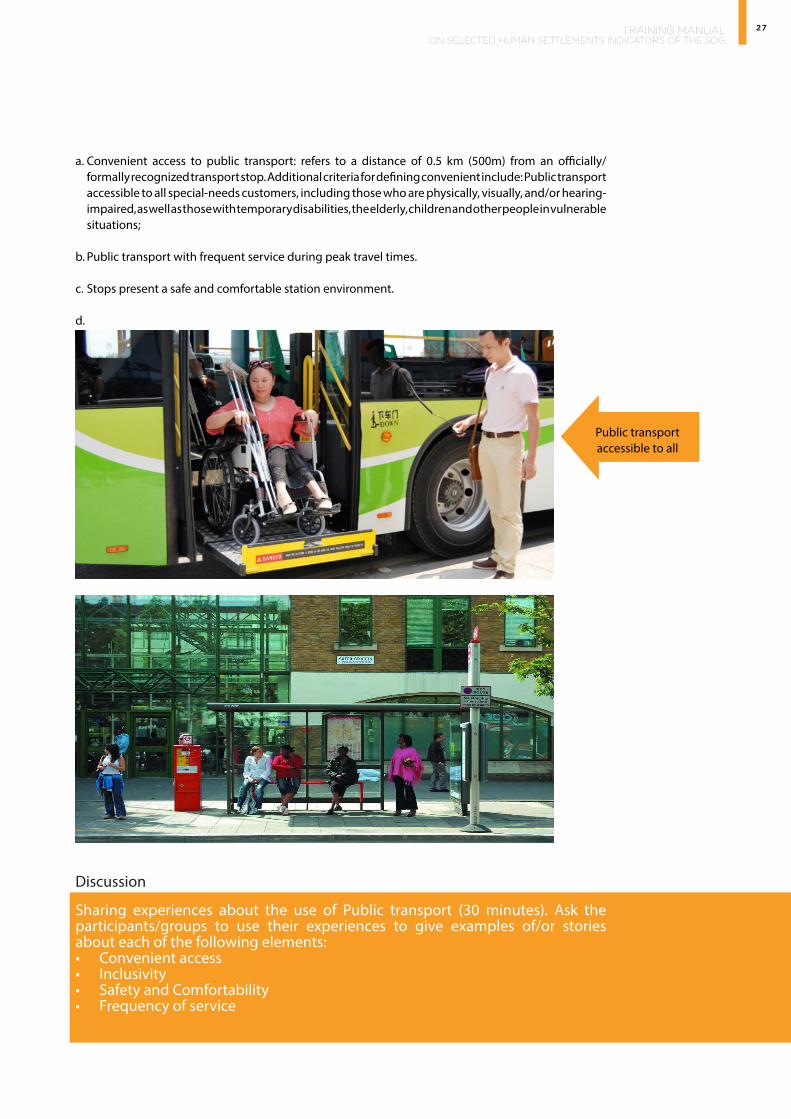
a. Convenient access to public transport: refers to a distance of 0.5 km (500m) from an officially/ formally recognized transport stop. Additional criteria for defining convenient include: Public transport accessible to all special-needs customers, including those who are physically, visually, and/or hearing-impaired, as well as those with temporary disabilities, the elderly, children and other people in vulnerable situations;
b. Public transport with frequent service during peak travel times.
c. Stops present a safe and comfortable station environment.
d.
Discussion
Sharing experiences about the use of Public transport (30 minutes). Ask the participants/groups to use their experiences to give examples of/or stories about each of the following elements:• Convenient access• Inclusivity• Safety and Comfortability• Frequency of serviceNOTES:
Public transport accessible to all

28 TRAINING MANUAL ON SELECTED HUMAN SETTLEMENTS INDICATORS OF THE SDG
NOTES
………………………………………………………………………………………………………………
………………………………………………………………………………………………………………
………………………………………………………………………………………………………………
………………………………………………………………………………………………………………
………………………………………………………………………………………………………………
………………………………………………………………………………………………………………
………………………………………………………………………………………………………………
………………………………………………………………………………………………………………
………………………………………………………………………………………………………………
………………………………………………………………………………………………………………
………………………………………………………………………………………………………………
………………………………………………………………………………………………………………
………………………………………………………………………………………………………………
………………………………………………………………………………………………………………
………………………………………………………………………………………………………………
………………………………………………………………………………………………………………
………………………………………………………………………………………………………………
………………………………………………………………………………………………………………
………………………………………………………………………………………………………………
………………………………………………………………………………………………………………
………………………………………………………………………………………………………………
………………………………………………………………………………………………………………
………………………………………………………………………………………………………………
………………………………………………………………………………………………………………
………………………………………………………………………………………………………………
………………………………………………………………………………………………………………
………………………………………………………………………………………………………………

29TRAINING MANUAL ON SELECTED HUMAN SETTLEMENTS INDICATORS OF THE SDG
UNIT TWO: METHODOLOGY
OBJECTIVES
§ Understand how to develop the essentials for collecting and validating data
§ Demonstrate how to compute the indicator based on the data collected and the methodology defined concepts and definitions of the indicator.
ACTIVITIES In the plenary, ask the participants to identify how, where and ways of collecting data related to accessibility of public transport systems.
DATA SOURCES § Satellite Imagery: USGS, GLCF and Geo-rectified Google Earth Imagery
§ City administration,
§ National Transport agencies
§ Household surveys,
§ Census data
SOFTWARE § ArcMap provide by ESRI
§ QGIS open source software
§ OPTA accessibility tool provided by World Bank
IN THIS SECTION, YOU WILL LEARN HOW TO; 1. Identify the service areas ( convenient access)
2. Identify the population served by public transport stops
3. Calculate the population with access to public transport

30 TRAINING MANUAL ON SELECTED HUMAN SETTLEMENTS INDICATORS OF THE SDG
ACTIVITY ONE:IDENTIFICATION OF SERVICE AREA
Data required:
Public transport stops (point shapes), Urban footprint (Pre-requisite for all spatial indicators).
Demo Data: Census tracts for the State of Georgia, USA
(The example provided is based on the use of the ArcMap program)
Step One: In ArcMap, add the public transport stops. The public stop will be the point of reference to creating the buffer.
The first thing you will need to do add a buffer distance field of 500 meter for each of the stops.
Step Two: Right click the Stops layer and select open attribute table. Once the attribute table is open, click the icon on the top left corner and a dialogue box open, scroll to Add field (this opens a dialogue box to add a new field to the table), write Buffer Distance on the Name field,. Click ok. A new column is added on the attributed.
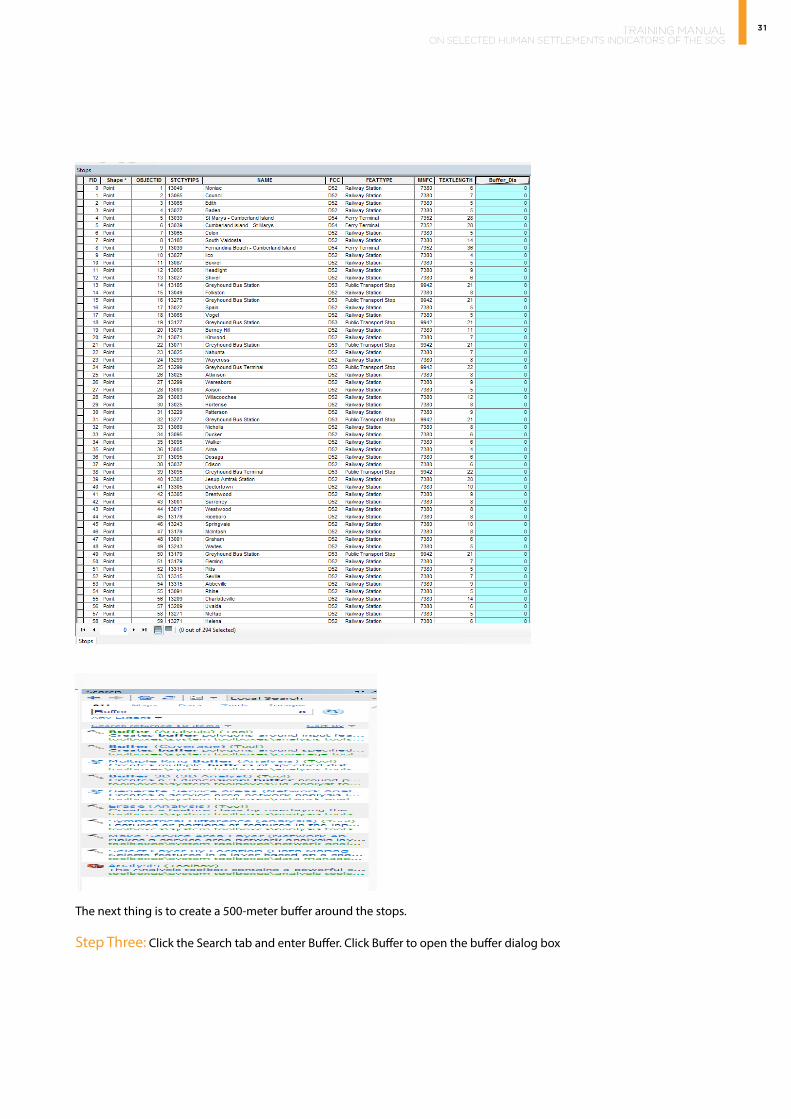
31TRAINING MANUAL ON SELECTED HUMAN SETTLEMENTS INDICATORS OF THE SDG
The next thing is to create a 500-meter buffer around the stops.
Step Three: Click the Search tab and enter Buffer. Click Buffer to open the buffer dialog box
32 TRAINING MANUAL ON SELECTED HUMAN SETTLEMENTS INDICATORS OF THE SDG
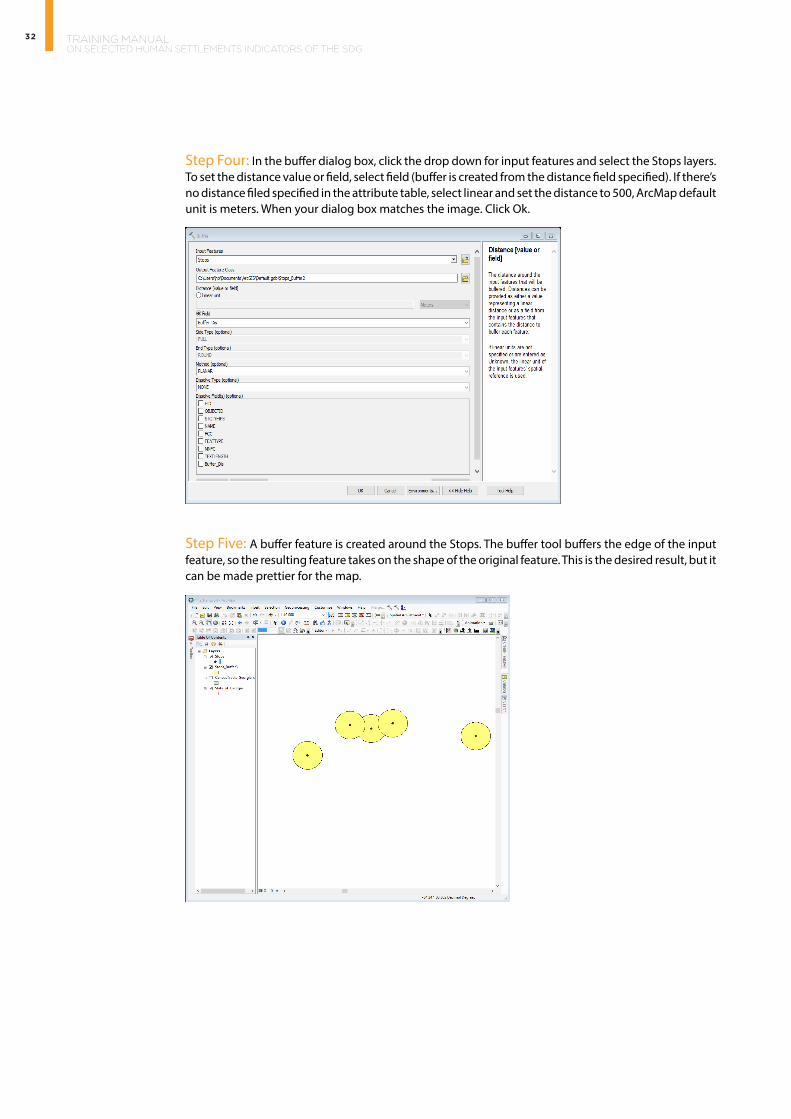
Step Four: In the buffer dialog box, click the drop down for input features and select the Stops layers. To set the distance value or field, select field (buffer is created from the distance field specified). If there’s no distance filed specified in the attribute table, select linear and set the distance to 500, ArcMap default unit is meters. When your dialog box matches the image. Click Ok.
Step Five: A buffer feature is created around the Stops. The buffer tool buffers the edge of the input feature, so the resulting feature takes on the shape of the original feature. This is the desired result, but it can be made prettier for the map.

33TRAINING MANUAL ON SELECTED HUMAN SETTLEMENTS INDICATORS OF THE SDG
Step Six: Right click the Buffer layer and open the properties. Go to Display Tab. Set the Transparent value to 60%. Click OK to close the properties dialog box.
ACTIVITY TWO:IDENTIFICATION OF POPULATION SERVED.
Data Required
Public transport stops (point shapes), Urban footprint, Service areas (500m buffer), Population data (census tracts with population figures, and any other socio-demographic data).
Demo Data: Census tracts for the State of Georgia, USAOnce the service areas area constructed, the next step is to overlay the socio-demographic data.

34 TRAINING MANUAL ON SELECTED HUMAN SETTLEMENTS INDICATORS OF THE SDG
Step One: Add the socio-demographic data to the workspace. The Socio-demographic data becomes the analysis zones
Step Two: Right click the socio-demographic layer (Census Tract Georgia) and Select, Open attribute table to view the data contained in the layer. The selected column contains the total population for each census tract. The other columns have data disaggregated suing various variables such as, sex, age, race etc.
The next step is to label the census tract layer to ease identification of population figures.
Step Three: Right click the socio-demographic layer (Census Tract Georgia) open the properties. Go to Labels Tab. Check the label features in this layer box. Set the Label field to field that contains the data required (DP0010001). Click OK to close the properties dialog box.

35TRAINING MANUAL ON SELECTED HUMAN SETTLEMENTS INDICATORS OF THE SDG
Step Four: To identify the population served by the public transport service, the following should be noted. A service buffer (denoted as i) intersects, either fully or partially, with more than one analysis zone j (j=1…1). The population served by the public transport buffer i, Pi is thus equal to the sum of the population in each of the intersecting area, Pij. Hence
J
Pi=∑ Pij (j=1) Where, Pij is estimated based on the amount of interaction between service buffer i and analysis zone j. In estimating Pij we will assume that the population is uniformly distributed within the analysis zone.
Step Five: Hence, to calculate the population served, Select the individual service area (Buffer) and record the total population served. In the figure, the service area (with a purple boundary) serves two census tracts (in blue boundary).
The total population for served by Union Bus terminal buffer is
i= Union Bus terminalPij= 5795+3648Total = 5647709.1108
Repeat the process for all the service areas and analysis zones
Tip: Label the buffers for easy identification.

36 TRAINING MANUAL ON SELECTED HUMAN SETTLEMENTS INDICATORS OF THE SDG
Step Six: Finally, the population with access to public transport out of the entire city population is will be computed as follows:
Examples of Usage
DeKalb County of Georgia
SERVICE BUFFER
POPULATION SERVED TOTALINTERSECT
1INTERSECT 2 INTERSECT 3 INTERSECT 4 INTERSECT 5 INTERSECT 6
1 2376 3574 2000 2802 10,752
2 3574 4052 5361 4433 2444 19,864
3 1590 3991 3228 2434 11,243
4 3176 3187 3228 3991 13,582
5 5795 3648 9,443
6 5361 5795 11,156
7 5795 2275 3552 3648 15,270
8 4774 3007 4232 12,013
9 3975 4379 5051 13,405
10 3200 4561 3486 11,247
11 5177 3932 3975 13,084
12 5022 5371 7712 18,105
TOTAL POPULATION WITH CONVENIENT ACCESS TO PUBLIC TRANSPORT 159,164
Total Population with convenient access to public transport= 159, 164/km2
County Population= 691,893/km2
% with access to public transport=469170
100[63280]
% with access to public transport = 23%
37TRAINING MANUAL ON SELECTED HUMAN SETTLEMENTS INDICATORS OF THE SDG
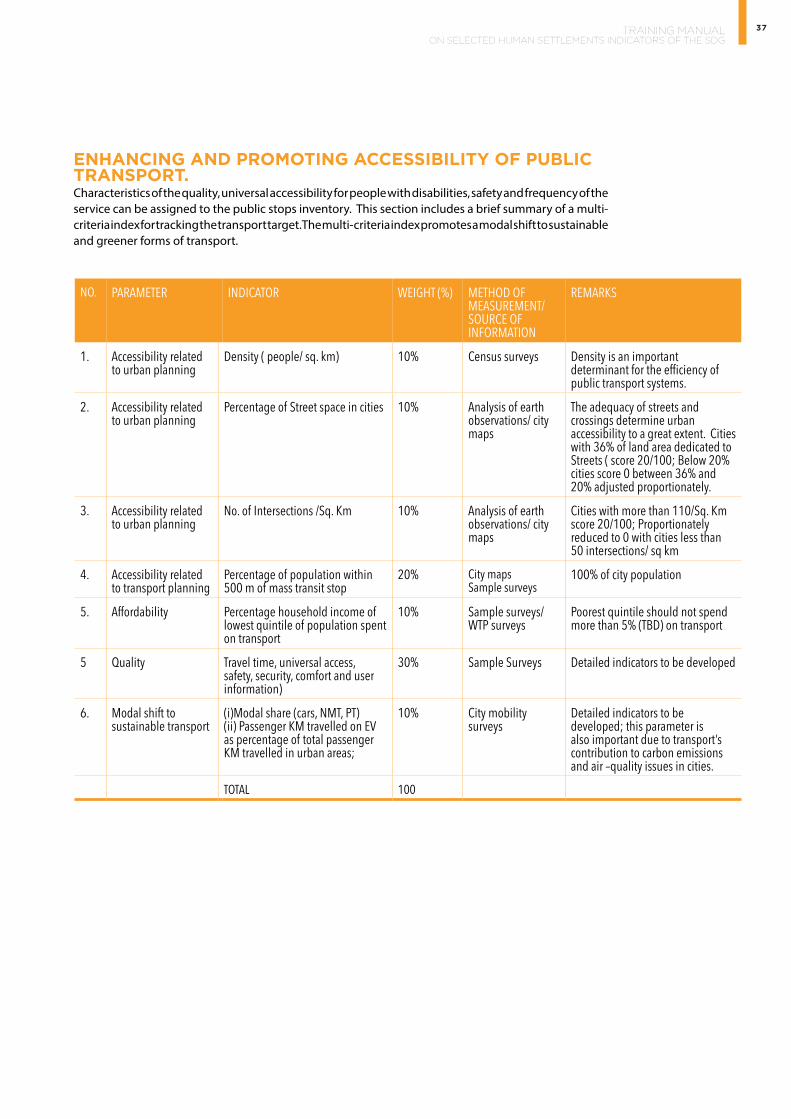
ENHANCING AND PROMOTING ACCESSIBILITY OF PUBLIC TRANSPORT. Characteristics of the quality, universal accessibility for people with disabilities, safety and frequency of the service can be assigned to the public stops inventory. This section includes a brief summary of a multi-criteria index for tracking the transport target. The multi-criteria index promotes a modal shift to sustainable and greener forms of transport.
NO. PARAMETER INDICATOR WEIGHT (%) METHOD OF MEASUREMENT/ SOURCE OF INFORMATION
REMARKS
1. Accessibility related to urban planning
Density ( people/ sq. km) 10% Census surveys Density is an important determinant for the efficiency of public transport systems.
2. Accessibility related to urban planning
Percentage of Street space in cities 10% Analysis of earth observations/ city maps
The adequacy of streets and crossings determine urban accessibility to a great extent. Cities with 36% of land area dedicated to Streets ( score 20/100; Below 20% cities score 0 between 36% and 20% adjusted proportionately.
3. Accessibility related to urban planning
No. of Intersections /Sq. Km 10% Analysis of earth observations/ city maps
Cities with more than 110/Sq. Km score 20/100; Proportionately reduced to 0 with cities less than 50 intersections/ sq km
4. Accessibility related to transport planning
Percentage of population within 500 m of mass transit stop
20% City mapsSample surveys
100% of city population
5. Affordability Percentage household income of lowest quintile of population spent on transport
10% Sample surveys/ WTP surveys
Poorest quintile should not spend more than 5% (TBD) on transport
5 Quality Travel time, universal access, safety, security, comfort and user information)
30% Sample Surveys Detailed indicators to be developed
6. Modal shift to sustainable transport
(i)Modal share (cars, NMT, PT)(ii) Passenger KM travelled on EV as percentage of total passengerKM travelled in urban areas;
10% City mobility surveys
Detailed indicators to be developed; this parameter is also important due to transport’s contribution to carbon emissions and air –quality issues in cities.
TOTAL 100

38 TRAINING MANUAL ON SELECTED HUMAN SETTLEMENTS INDICATORS OF THE SDG
UNIT THREE: RATIONALE FOR MONITORING
DATA COLLECTION Responsibility of national agencies.
Survey data will be available every 2 to 5 years depending on the frequency.
Open Trip Planner Analyst (OPTA) accessibility tool will be available to government officials and all urban transport infrastructure.
CAPACITY DEVELOPMENT UN Habitat and its partner organizations and National Focal points will work closely to provide capacity building and quality assurance support.
UN-Habitat, International Association of Public Transport will support lead the annual monitoring and reporting.
DATA RELEASEMonitoring of the indicator will be repeated at annual intervals, allowing several reporting points until the year 2030. Comprehensive reporting will be undertaken on a biennial basis.
Monitoring at annual intervals will allow determining whether the proportion of the population with convenient public transport is increasing significantly over time, as well monitor the share of the global urban population living in cities where the convenient access to public transport is below the acceptable minimum.

39TRAINING MANUAL ON SELECTED HUMAN SETTLEMENTS INDICATORS OF THE SDG
UNIT FOUR: GENERAL LIMITATIONS
DATA LIMITATIONS POSSIBLE SOLUTIONS
The methodology described above covers public transport service solely based on proximity analysis to transport stops. It does not incorporate temporal dimension asscocited with the availability of public transport.
Factors such as affordability, safety and universal accessibilty may influence the usage of public means of transport.
The temporal aspect is important in measures of accessibility as a service within walking distance is not necessarily considered as available if waiting time goes beyond a certain threshold level that is required.
Harmonized global/local data on urban transport does not exist, nor are they comparable at the world level
An open source software platform for measuring accessibility, the Open Trip Planner Analyst (OPTA) accessibility tool, will be available to government officials and all urban transport practitioners.Expert Group Meeting to harmonize the tools and existing data to ensure a more uniform and standard format for reporting on this indicator.
The road segments should include attributes allowing for a selection of streets accessible to pedestrians, however road network is not incorporated in the measurement of the target.
To be able to access the ease of access stops, a comprehensive road network is needed.

40 TRAINING MANUAL ON SELECTED HUMAN SETTLEMENTS INDICATORS OF THE SDG
NOTES
………………………………………………………………………………………………………………………
………………………………………………………………………………………………………………………
………………………………………………………………………………………………………………………
………………………………………………………………………………………………………………………
………………………………………………………………………………………………………………………
………………………………………………………………………………………………………………………
………………………………………………………………………………………………………………………
………………………………………………………………………………………………………………………
………………………………………………………………………………………………………………………
………………………………………………………………………………………………………………………
………………………………………………………………………………………………………………………
………………………………………………………………………………………………………………………
………………………………………………………………………………………………………………………
………………………………………………………………………………………………………………………
………………………………………………………………………………………………………………………
………………………………………………………………………………………………………………………
………………………………………………………………………………………………………………………
………………………………………………………………………………………
………………………………………………………………………………………………………………………
………………………………………………………………………………………………………………………
………………………………………………………………………………………………………………………
………………………………………………………………………………………………………………………
………………………………………………………………………………………………………………………
………………………………………………………………………………………………………………………
………………………………………………………………………………………………………………………
………………………………………………………

41TRAINING MANUAL ON SELECTED HUMAN SETTLEMENTS INDICATORS OF THE SDG
REFERENCES § Alain Bertaud, Cities as Labor Markets, February 2014, http:// marroninstitute.nyu.edu/uploads/content/
Cities_as_Labor_ Markets.pdf. § http://data.london.gov.uk/dataset/public-transport. § http://ec.europa.eu/regional_policy/sources/docgener/work/2015_01_publ_transp.pdf § http://unhabitat.org/planning-and-design-for-sustainable-urban-mobility-global-report-on-
humansettlements-2013/ § http://unhabitat.org/urban-themes/mobility/ § http://www.digitalmatatus.com/ § http://www.slocat.net/content-stream/187 § https://www.census.gov/geo/maps-data/data/tiger.html § https://www.jtlu.org/index.php/jtlu/article/view/68 3/665 § Tracking the SDG Targets: An Issue Based Alliance for Transport.
FREQUENTLY ASKED QUESTIONS
1. How important are good public transport systems to urban and social development?Answer: Good public transport systems are an essential part of safe, clean and affordable transport for development. Public transport is often the only means of transport for the poor, without it, they would be able to look opportunities only within walking distance of their homes, so public transport improves their livelihood opportunities. Public transport is also the main means of mobility for the elderly, people with disabilities and children. It gives greater access to education, health and recreation facilities.
2. What are key elements of sustainable public systems?
Answer: A good transport system must be easy and convenient to use, fast, safe, clean and affordable. A key feature is that they integrate multiple technologies such as metro rail, light rail, BRT making it easy for passengers to transfer from one mode to another
3. Can you give examples of cities that have elements of sustainable public transport system?Answer: Seoul, Singapore, Hong Kong.
4. What are the barriers to sustainable public transport?Answer: Having a large number of small operators that allows for low-cost services yet the quality is poor. While single publicly owned entities may offer higher quality of services but costs tend to be high and the quantity service is often inadequate.
5. What are the main obstacles associated with this particular methodology?Answer: The methodology described above covers public transport service solely based on proximity analysis to transport stops . It does not incorporate tempral dimension asscocited with the availability of public transport as well as the road network that shows the access of stops.

© UN-HabitatContact: Robert Ndugwa
Head of Global Urban [email protected]
Eduardo Lopez [email protected]
Research and Capacity Development Branch