
Traffic Volume Data Collection Daniel Jenkins, PE Substitute – Steven Jessberger Office of Highway...
29
Traffic Volume Data Collection Daniel Jenkins, PE Substitute – Steven Jessberger Office of Highway Policy Information October 23, 2012
-
Upload
elwin-dennis -
Category
Documents
-
view
214 -
download
1
Transcript of Traffic Volume Data Collection Daniel Jenkins, PE Substitute – Steven Jessberger Office of Highway...
Traffic Volume Data Collection
Daniel Jenkins, PESubstitute – Steven Jessberger
Office of Highway Policy InformationOctober 23, 2012
Why Collect Volume Data?
• Planning/Environment• Project Development• Operations• OHPI needs it• MAP-21

Planning/Environment Needs
• Air quality analysis• Noise studies• Traffic projections

Project Development Needs
• Interchange Justification Reports• Design• Maintenance of Traffic Decisions
Operations needs
• Traffic signal timing• HOV operations• Work zone decisions
OHPI Needs
• HPMS• Monthly TVT report• Temporal Traffic Studies
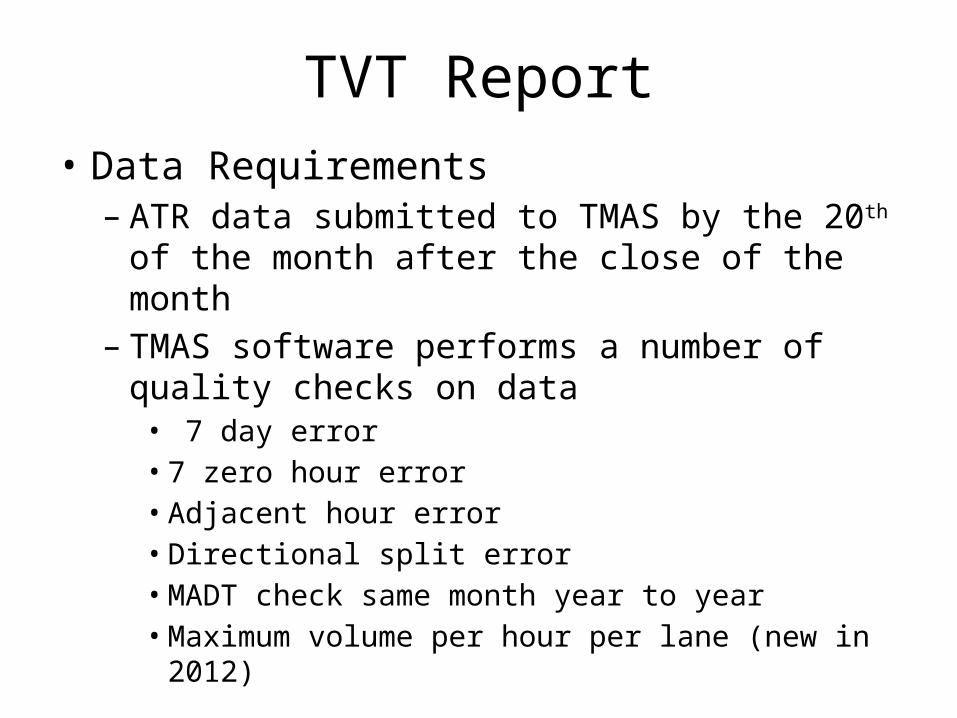
TVT Report• Data Requirements
– ATR data submitted to TMAS by the 20th of the month after the close of the month
– TMAS software performs a number of quality checks on data• 7 day error• 7 zero hour error• Adjacent hour error• Directional split error• MADT check same month year to year• Maximum volume per hour per lane (new in 2012)
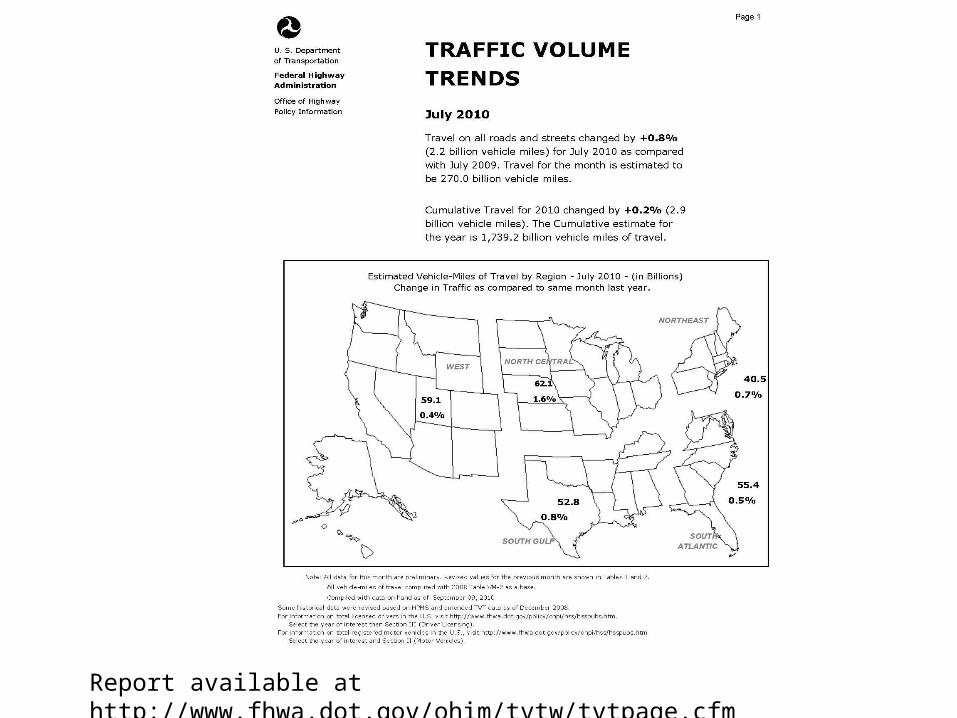
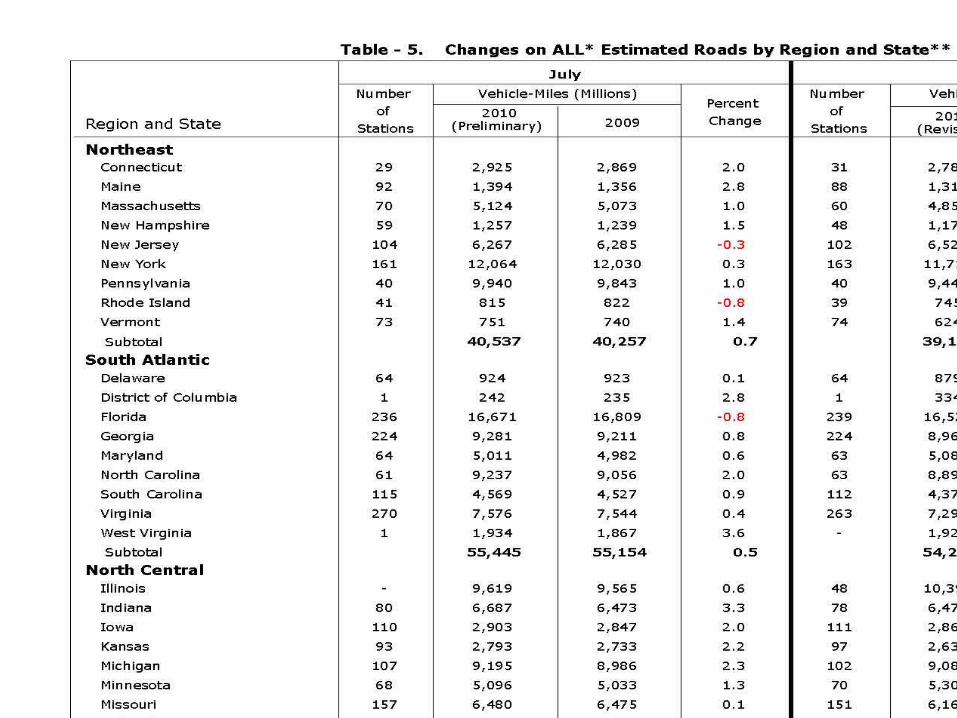
Report available at http://www.fhwa.dot.gov/ohim/tvtw/tvtpage.cfm

Who wants TVT?
• Automotive industry companies• Insurance companies• Financial services• Retail
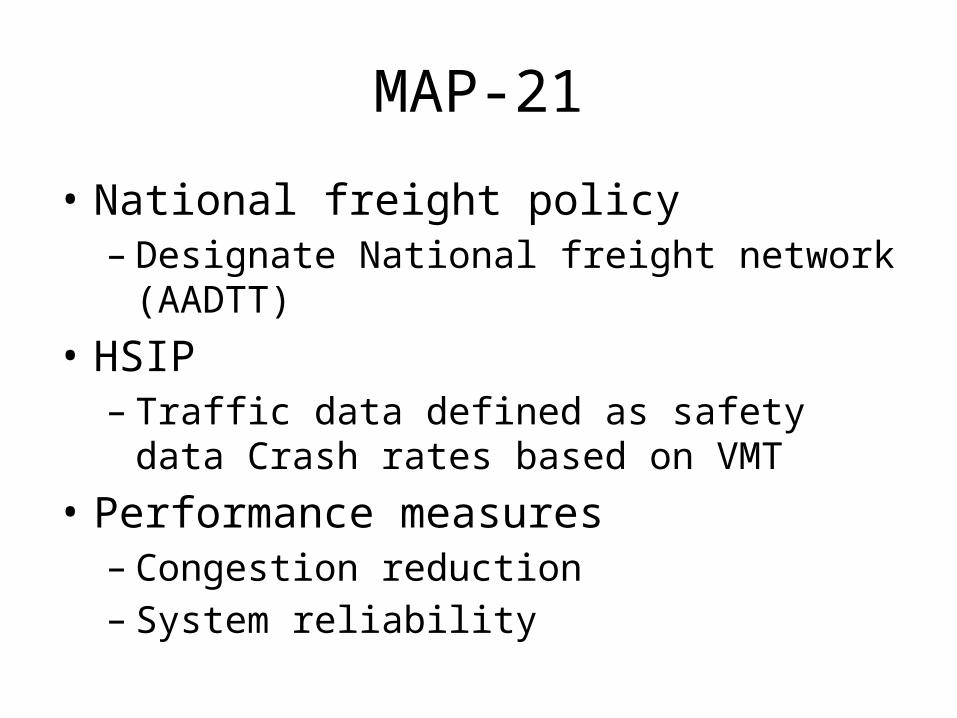
MAP-21
• National freight policy– Designate National freight network (AADTT)
• HSIP– Traffic data defined as safety data Crash rates
based on VMT• Performance measures
– Congestion reduction– System reliability

QUALITY DATA
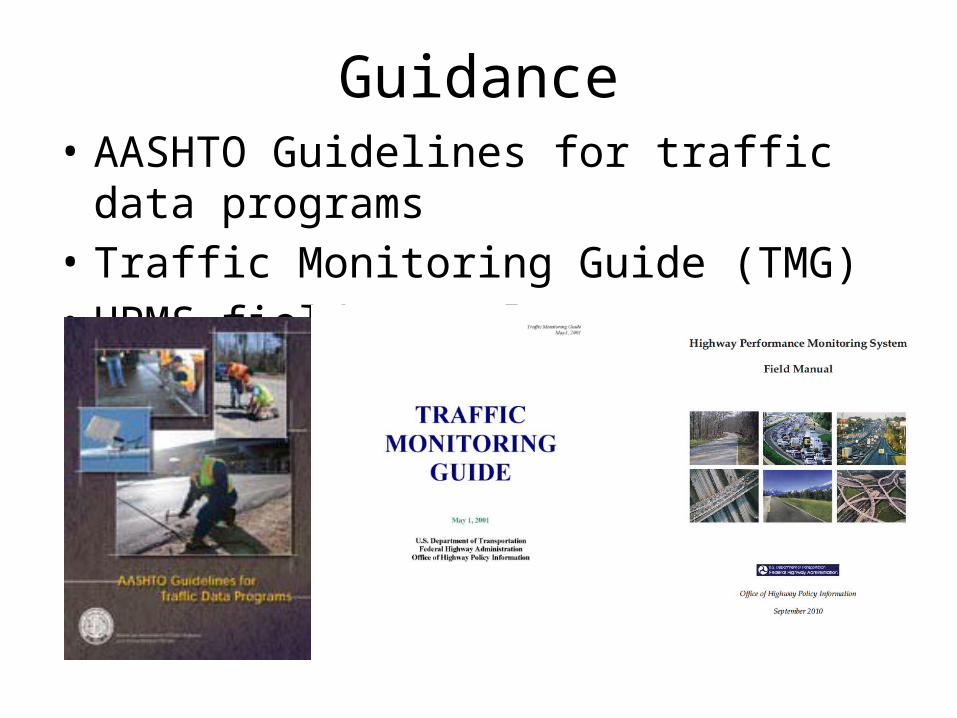
Guidance• AASHTO Guidelines for traffic data programs• Traffic Monitoring Guide (TMG)• HPMS field Manual
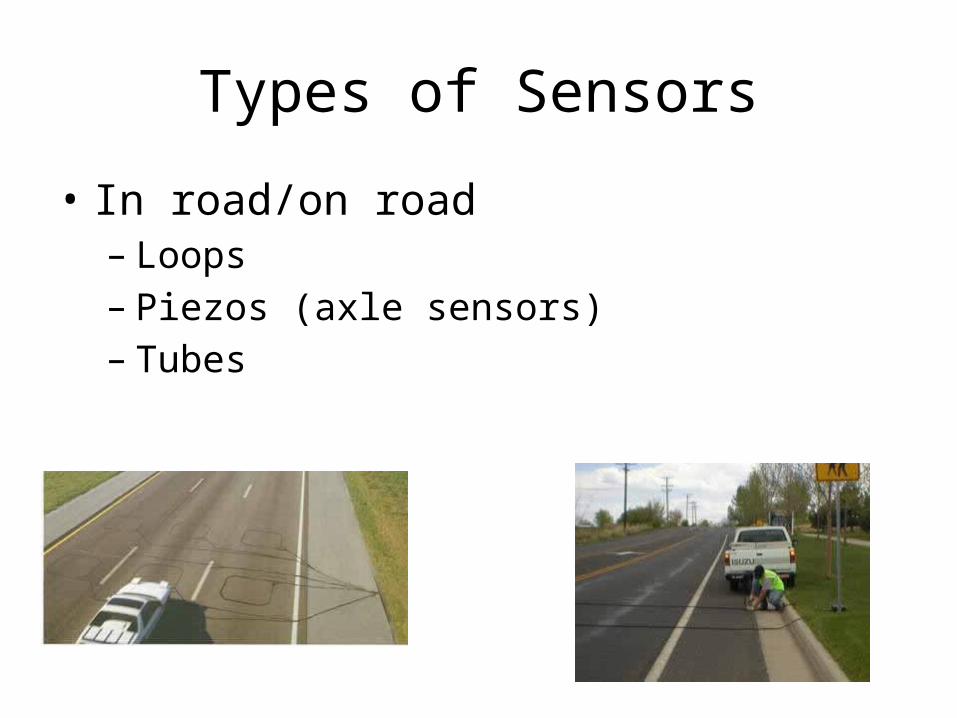
Types of Sensors
• In road/on road– Loops– Piezos (axle sensors)– Tubes
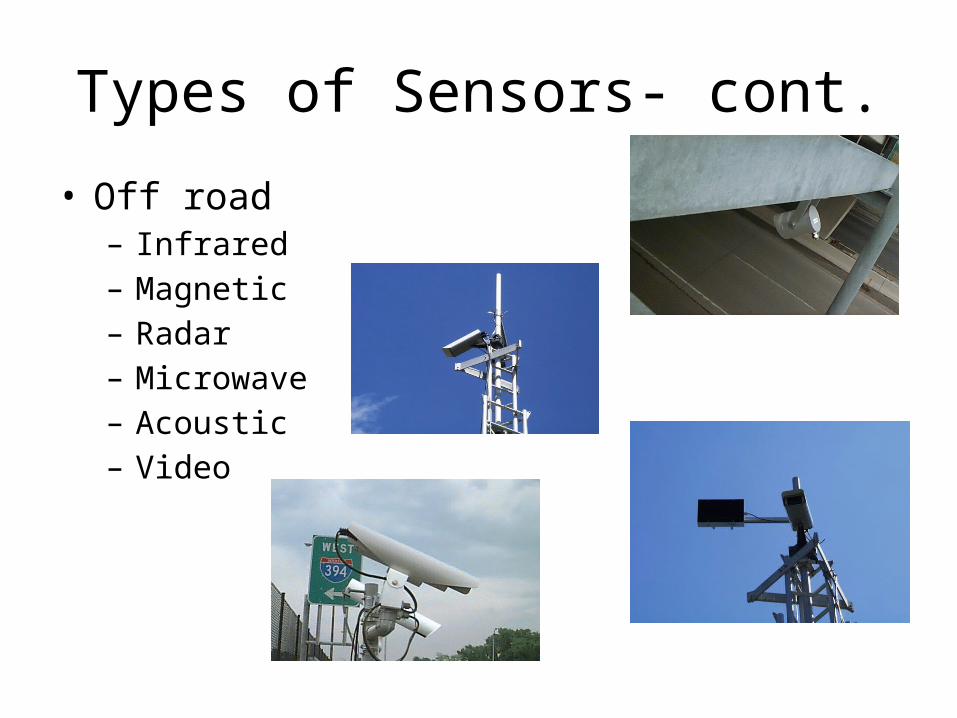
Types of Sensors- cont.
• Off road– Infrared– Magnetic– Radar– Microwave– Acoustic– Video
Factors
• Monthly Factors• Day of Week Factors• Axle Correction Factors• Yearly Growth/Reduction Factors
Determining an accurate AADT is very important to a successful program!
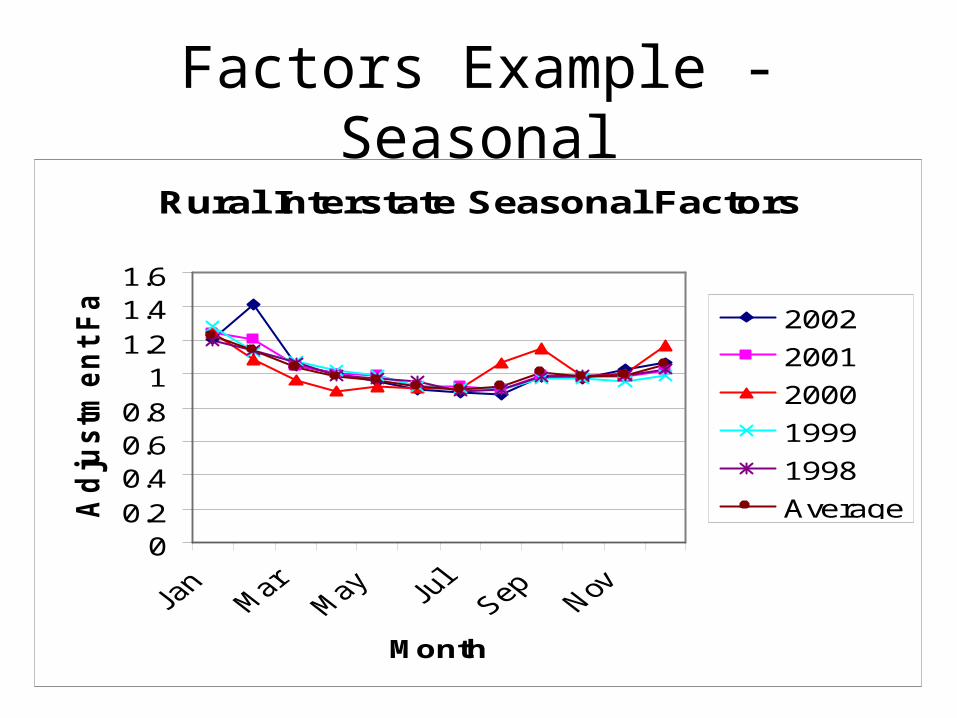
Factors Example - SeasonalRural Interstate Seasonal Factors
00.20.40.60.81
1.21.41.6
Month
Ad
jus
tme
nt
Fa
cto
r
2002
2001
2000
1999
1998
Average
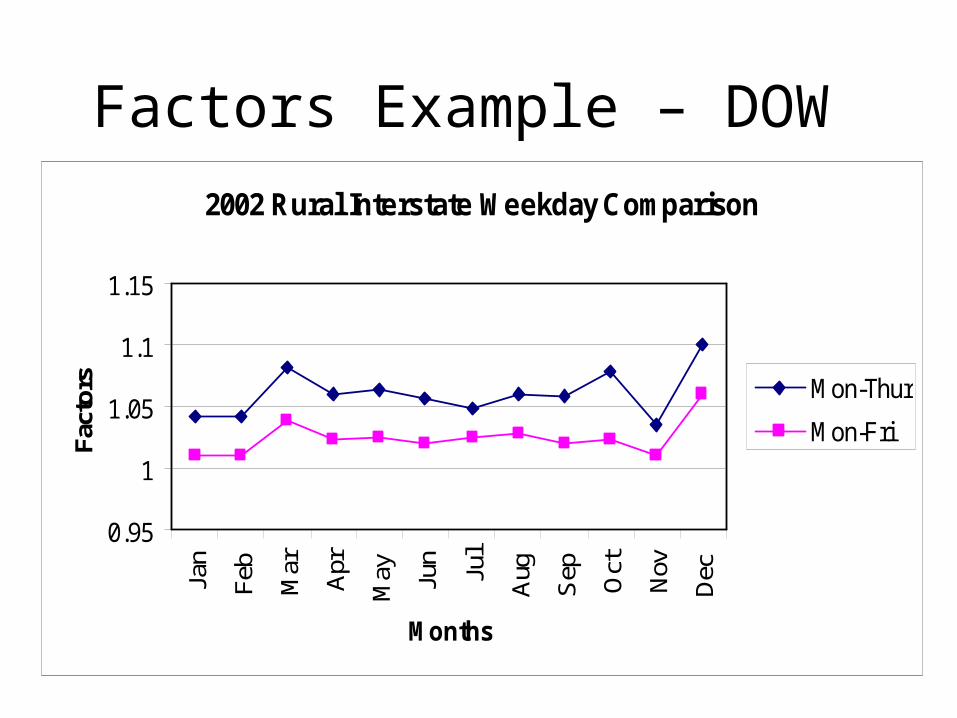
Factors Example – DOW 2002 Rural Interstate Weekday Comparison
0.95
1
1.05
1.1
1.15
Jan
Feb
Mar
Apr
May Jun
Jul
Aug
Sep Oct
Nov
Dec
Months
Fact
ors Mon-Thur
Mon-Fri
Factors
• Misusing the DOW factor can lead to a 5% underestimate
• Misusing the Monthly factor can lead to a 15% overestimate
• Do you factor and are you following the TMG or some other method?
Problem
• The DOT did a traffic count on a minor rural collector (Site A) between January 26-28 (Tuesday-Thursday). The total count for three days was 3,600 vehicles. Calculate the AADT for Site A.
Solving Problem
• Locate an ATR on a similar class facility
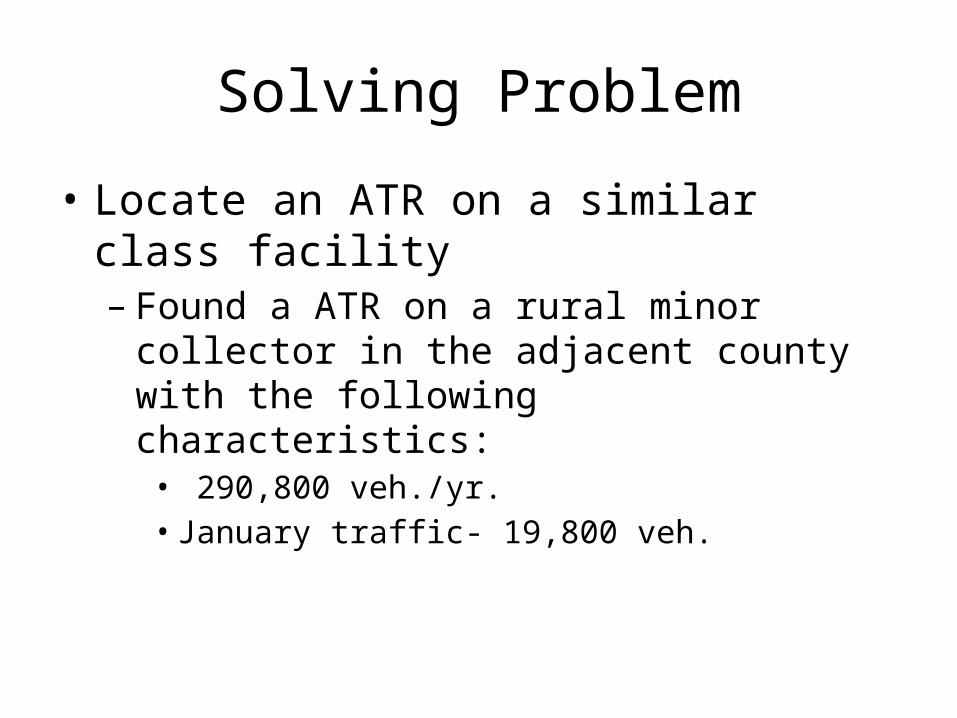
Solving Problem
• Locate an ATR on a similar class facility– Found a ATR on a rural minor collector in the
adjacent county with the following characteristics:• 290,800 veh./yr.• January traffic- 19,800 veh.
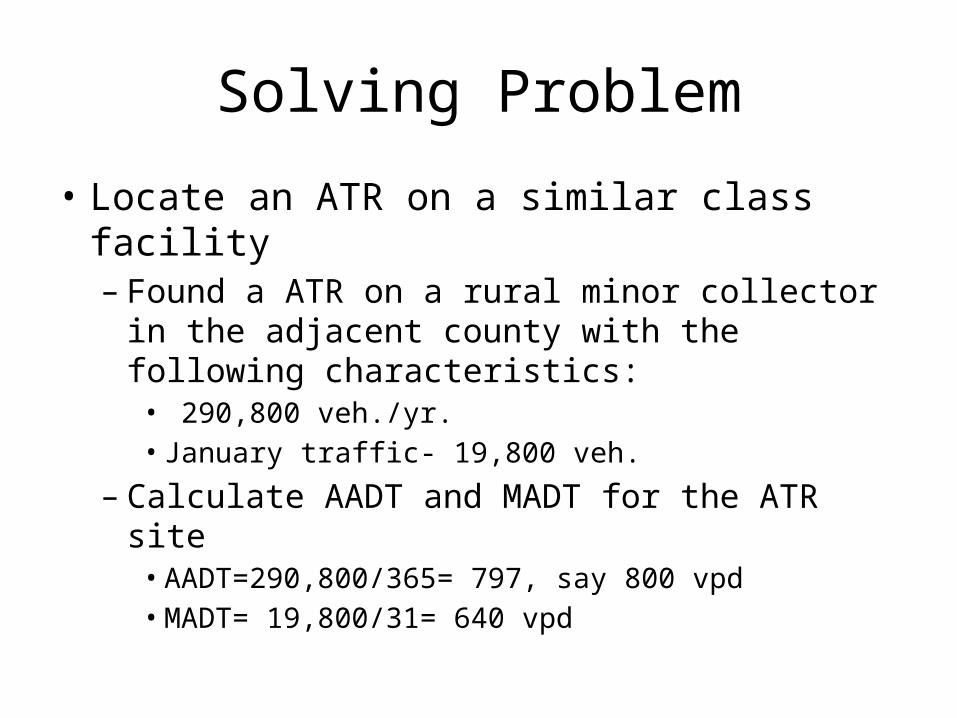
Solving Problem
• Locate an ATR on a similar class facility– Found a ATR on a rural minor collector in the
adjacent county with the following characteristics:• 290,800 veh./yr.• January traffic- 19,800 veh.
– Calculate AADT and MADT for the ATR site• AADT=290,800/365= 797, say 800 vpd• MADT= 19,800/31= 640 vpd
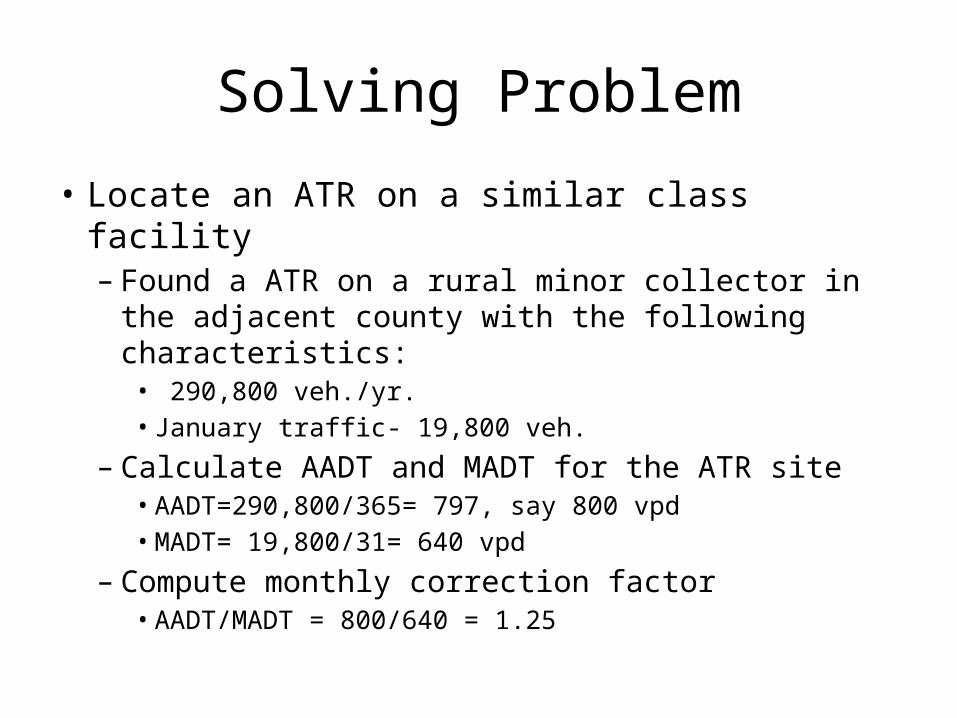
– Compute monthly correction factor• AADT/MADT = 800/640 = 1.25
Solving Problem
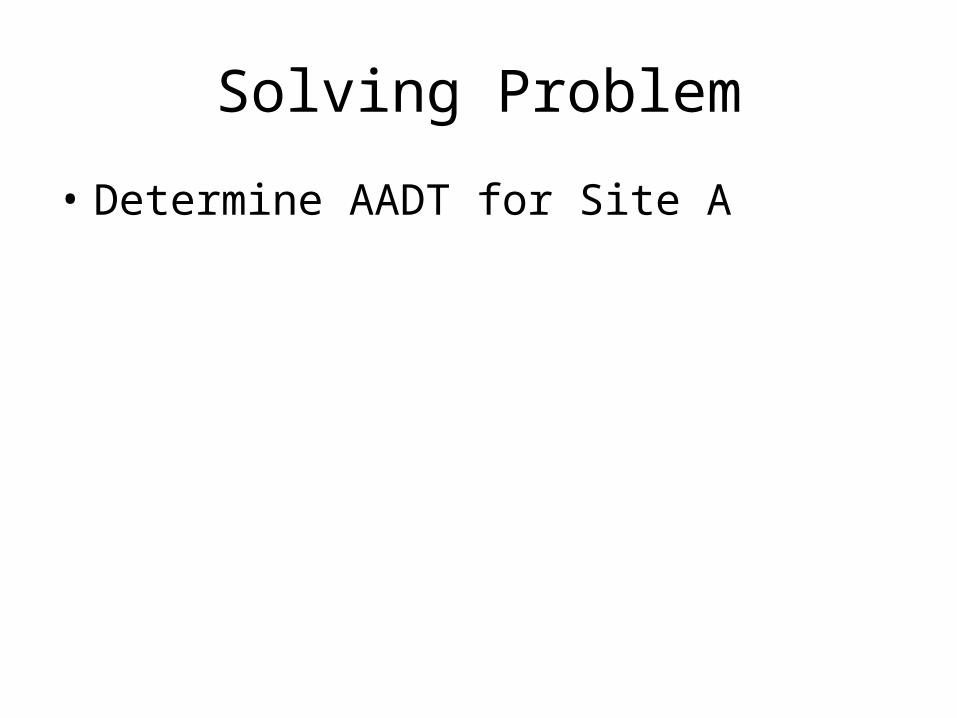
• Determine AADT for Site A
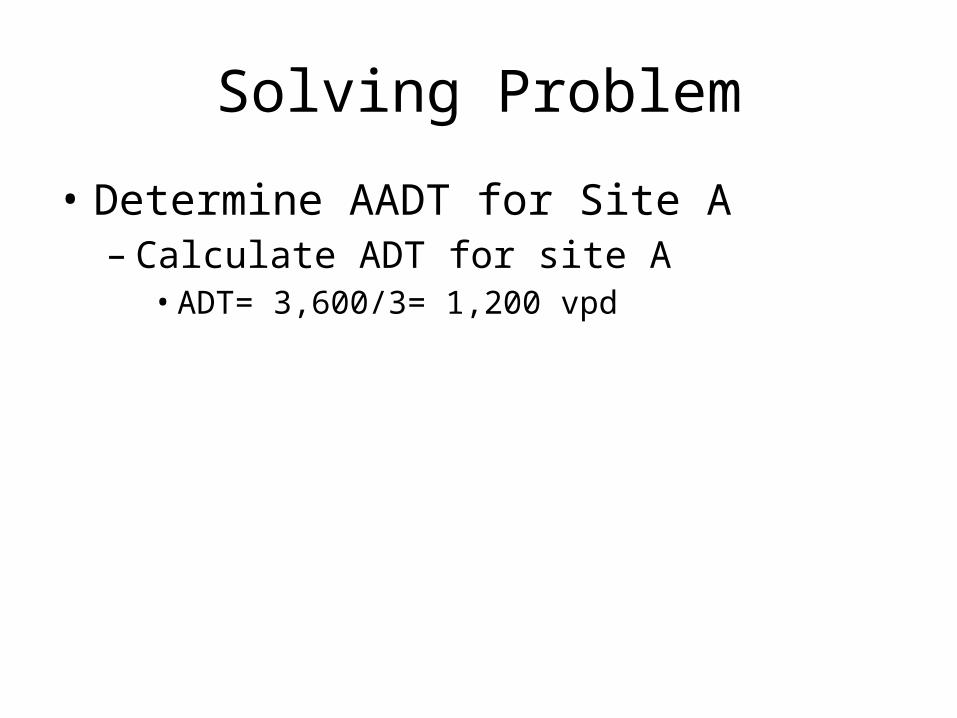
Solving Problem
• Determine AADT for Site A– Calculate ADT for site A
• ADT= 3,600/3= 1,200 vpd
Solving Problem
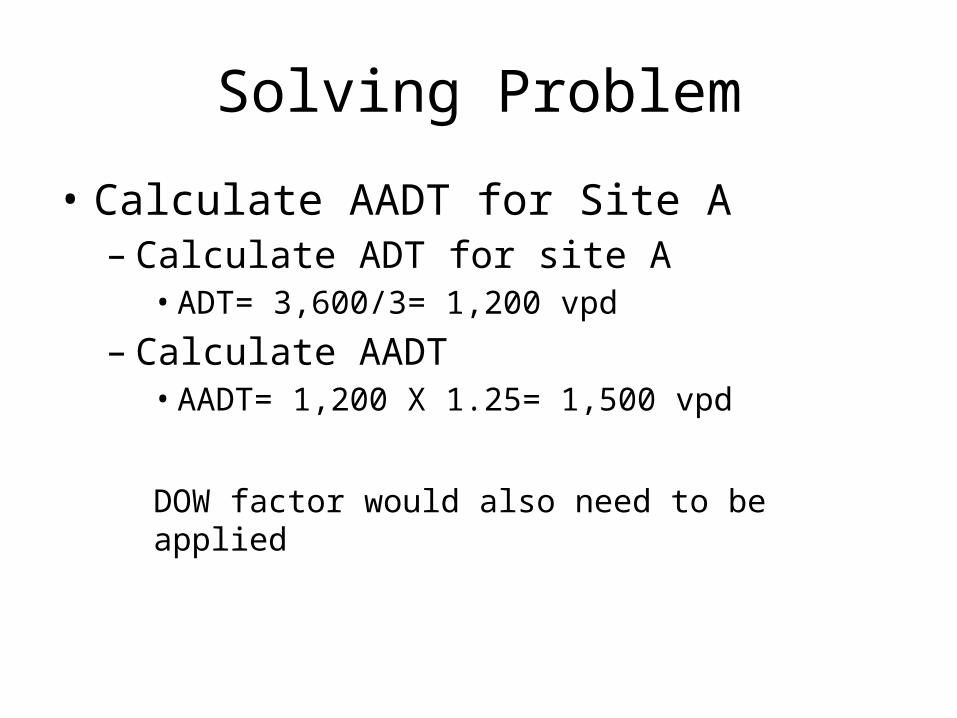
• Calculate AADT for Site A– Calculate ADT for site A
• ADT= 3,600/3= 1,200 vpd
– Calculate AADT• AADT= 1,200 X 1.25= 1,500 vpd
DOW factor would also need to be applied

Data- Collect once, correctly anduse many times

QUESTIONS?????????????
Danny Jenkins, PEVolume Program Manager