TRAFFIC TECHNOLOGIES LTD ABN 21 080 415 407 …2012/08/21 · TRAFFIC TECHNOLOGIES LTD ABN 21 080...
103
TRAFFIC TECHNOLOGIES LTD ABN 21 080 415 407 AND CONTROLLED ENTITIES PRELIMINARY FINAL REPORT FOR THE YEAR ENDED 30 JUNE 2012 PROVIDED TO THE ASX UNDER LISTING RULE 4.3A For personal use only
Transcript of TRAFFIC TECHNOLOGIES LTD ABN 21 080 415 407 …2012/08/21 · TRAFFIC TECHNOLOGIES LTD ABN 21 080...

TRAFFIC TECHNOLOGIES LTD ABN 21 080 415 407
AND CONTROLLED ENTITIES
PRELIMINARY FINAL REPORT FOR THE YEAR ENDED 30 JUNE 2012
PROVIDED TO THE ASX UNDER LISTING RULE 4.3A
For
per
sona
l use
onl
y

1
Appendix 4E
Preliminary final report
Name of entity
TRAFFIC TECHNOLOGIES LTD
ABN or equivalent company reference
Year ended:
current period
Previous corresponding
period
ABN 21 080 415 407
30 June 2012 30 June 2011
Results for announcement to the market
Continuing Operations Revenues from ordinary activities (item 2.1)
up
11%
to
A$’000
$53,065 Earnings before interest and tax up 45% to $3,958 Net profit/(loss) after tax from continuing
operations
up to $1,890
Total Operations
Profit/(loss) from ordinary activities after tax attributable to members (item 2.2)
up 194% to $1,709
Net profit/(loss) for the period attributable to members (item 2.3)
up
194%
to
$1,709
Dividends (distributions) (item 2.4) Amount per security
Franked amount per security
Interim dividend
Final dividend
Nil ¢
Nil ¢
Record date for determining entitlements to the dividend (item 2.5)
Not applicable
For
per
sona
l use
onl
y

Traffic Technologies Ltd – Appendix 4E Preliminary Final Report Other Information
2
Brief explanation of any of the figures in 2.1 to 2.4 necessary to enable the figures to be understood (item 2.6):
For commentary on the results for the period and review of operations, refer to Directors’ Report.
Comparative figures have been restated – refer note 1 to the financial statements.
1. Net Tangible Asset Backing
As at 30 June 2012
As at 30 June 2011
Net tangible assets per share (8.3) cents (9.0) cents
2. Dividends The Company does not propose to pay a dividend. No dividend or distribution plans are in operation. 3. Status of Audit The unqualified, signed annual financial report is attached. 4. Corporate Information Directors Mr. Alan Brown Mr. Con Liosatos Mr. Ray Horsburgh Company Secretary Mr. Peter Crafter Registered Office and Principal Place of Business Traffic Technologies Ltd 31 Brisbane Street Eltham VIC 3095 Share Register Computershare Investor Services Pty Limited Yarra Falls, 452 Johnson Street Abbotsford VIC 3067 Tel: 1300 787 272 Traffic Technologies Ltd shares are listed on the Australian Stock Exchange (stock code: TTI) Lawyers Middletons Level 25 525 Collins Street Melbourne VIC 3000 Bankers Westpac Banking Corporation Level 10 360 Collins Street Melbourne VIC 3000 Auditors Moore Stephens Melbourne Level 10 530 Collins Street Melbourne VIC 3000
For
per
sona
l use
onl
y

For
per
sona
l use
onl
y
For
per
sona
l use
onl
y

TRAFFIC TECHNOLOGIES LTD
ABN 21 080 415 407
AND CONTROLLED ENTITIES
ANNUAL FINANCIAL REPORT
FOR THE YEAR ENDED 30 JUNE 2012
For
per
sona
l use
onl
y

ABN 21 080 415 407 Traffic Technologies Ltd.
address. 31 Brisbane Street, Eltham Victoria 3095 Australia PO Box 828, Eltham Victoria 3095 Australia
phone. + 61 3 9430 0222 facsimile. + 61 3 9430 0244 web. www.trafficltd.com.au
Traffic Technologies Ltd and Controlled Entities
Chairman’s Letter
Dear Shareholder,
I have pleasure in enclosing the Annual Report for Traffic Technologies Ltd for the year ended 30 June 2012. Earnings have continued to grow with a further increase in profitability in the financial year. Most importantly, the
Group has achieved a positive net profit after tax of $1.7m. The Group has also achieved a significant improvement
in its operating results for the financial year ended 30 June 2012 with Earnings before Interest and Tax (EBIT) of
$4.0m. This was a significant improvement from EBIT of $2.7m in the previous financial year. Revenue from
continuing operations has also increased substantially. For the financial year ending 30 June 2012 revenue was
$53.1m compared to $47.9m in the previous financial year. The Traffic Products Division has continued its strong performance. During the year the Group continued the
upgrade of approximately 1,000 intersections in Victoria with LED traffic signals. The Traffic Products Division
enjoys a dominant position in Australia and New Zealand for LED traffic signals and has a strong strategic program
to develop export markets in Europe and Asia. A major achievement during the financial year was the entry into an
agreement with Transport for London (TfL) for the supply of Pedestrian Countdown Timers. The first tranche was
installed at intersections in London in time for the Olympic Games, which was an exciting achievement. During the
financial year, the Group also entered the Road Lighting market which represents a significant opportunity for future
revenue growth. The sale of the Traffic Hire business and continued profitable trading has again enabled the Company to reduce net
debt and finance costs significantly. A number of achievements by the Company are not yet reflected in its share price, but a key priority for the Group
continues to be the improvement of shareholder value by reducing gearing and associated finance costs. The Board
and management will also ensure all possible strategies to reduce debt and enhance shareholder value are pursued in
the upcoming financial year. The Board hopes to be in a position to announce a dividend to shareholders by the time
of the Company’s AGM to be held later this year. The Group maintains a strong position in the traffic signals market, bolstered by an innovative track record of
developing new products in the Intelligent Transport Systems (ITS) area, such as electronic signage. The Group also
remains well positioned to take advantage of the opportunities presented by ongoing Federal and State Government
road infrastructure spending programs. Along with my fellow Directors, I thank you for your continued support. We look forward to further increasing shareholder value in the year ahead.
Alan Brown
Chairman
For
per
sona
l use
onl
y

ABN 21 080 415 407
Traffic Technologies Ltd. address. 31 Brisbane Street, Eltham Victoria 3095 Australia
PO Box 828, Eltham Victoria 3095 Australia phone. + 61 3 9430 0222 facsimile. + 61 3 9430 0244
web. www.trafficltd.com.au
Traffic Technologies Ltd and Controlled Entities
Managing Directors’ Report
Dear Shareholder, I am very pleased to share with you the achievements of our Company in the 2012 financial year. A rise in profits, a
growth in revenue and a significant reduction in debt have all been achieved in a year that was capped off by our involvement in helping London prepare for the Olympic Games. Financial Overview In the past 12 months profitability for the Group has increased by 194%. This represents a net profit after tax of $1.7m. These very healthy results have been driven by our ongoing commitment to reducing costs and expenditure
while we aggressively pursue new markets. They are also the result of our decision to accelerate research and
development programs to ensure we are market leaders in producing energy efficient products which are increasingly
demanded by the global traffic industry. Revenues have also continued to grow. The Group achieved revenues from continuing operations of $53.1m and
EBIT of $4.0m in the 2012 financial year. This represents an increase in revenue of 11% and an increase of 45% in
EBIT from continuing operations compared to the previous financial year. We have remained focused on reducing finance costs and I am pleased to advise that net debt as of 30th June 2012
has been substantially reduced to $21.0m. This represents a reduction of 24% ($6.6m) compared to the previous
financial year. A large part of this debt reduction is the result of positive cash flows from continuing operations and
the divestment of the Traffic Hire business in December 2011.
Also notable is the continued improvement in net profit after tax (NPAT). This is illustrated in the graph below
which shows clear growth in profitability over the past three years. This reflects our rigorous focus on driving
operational efficiencies, reducing finance costs and executing our solid commercial strategy.
-$254
$582
$1,709
-$500
$0
$500
$1,000
$1,500
$2,000
2010 2011 2012
Net Profit After Tax ($'000)
For
per
sona
l use
onl
y
Review of Operations
Over the 2012 financial year the Group has continued to deliver upon expectations and we remain the dominant
supplier and manufacturer of LED traffic signals and auxiliary equipment throughout Australia and New Zealand.
The Group has also continued to develop its export program throughout Europe and Asia. In addition, we have
recognised and met significant customer demand for more efficient and innovative products for the expanding
Intelligent Transport Systems (ITS) industry. This can be seen through our work in London in the lead up to the Olympic Games. Traffic Technologies was proud
to sign a supply agreement with Transport for London (TfL) for the supply of Pedestrian Countdown Timers. These
Timers were installed at intersections in London in time for the Opening Ceremony. This is an exciting achievement
for the Group. Having easily passed a rigorous testing regime, we now set the standard for safety on UK roads. The result for the financial year has been boosted by the ongoing upgrade of traffic signals for VicRoads at
approximately 1,000 intersections across Victoria to LED technology. This brings the total value of the contract to
over $18 million, including contract variation orders. The Group also entered into a supply agreement with Rexel Group Australia (Rexel). This means the Group now
supplies a range of road lighting products for distribution and sale through Rexel’s branch network across Australia.
The entry into the Road Lighting market represents a significant opportunity for the Group, providing unprecedented access to this lucrative industry. The Group’s road lighting business forms part of our strategy of expanding
activities into the growing Intelligent Transport Systems (ITS) sector. This involves using information and
communication technology to manage traffic flows. Traffic Technologies is uniquely placed to achieve growth given
our expertise in this area. The Signage business has continued to face strong competition. But a continued focus by management and staff on
cost control and factory efficiency has enabled the Signage business to contribute to profits in the 2012 financial
year. As the leading provider of innovative technical products and services to the industry, Traffic Technologies is well
positioned to benefit from opportunities presented by Federal and State government spending on road infrastructure
projects. We will also continue to expand export opportunities. Moving forward, the Group will build on the success
of the Traffic Products Division and take full advantage of the opportunities in the lucrative road lighting market. With extremely professional and experienced management team intent on further cost reductions and ongoing
efficiency improvements, the Group is anticipating solid earnings as we continue to roll out our strategies in the
coming financial year. We are pleased to have your ongoing support, and look forward to continued profitability and consolidation in the
year ahead.
Con Liosatos
Managing DirectorFor
per
sona
l use
onl
y

Corporate Information
This annual report covers both Traffic Technologies Ltd (ABN 21 080 415 407) and its subsidiaries. The Group’s functional and presentation currency is AUD ($).
A description of the Group’s operations and of its principal activities is included in the review of operations and
activities in the Directors’ Report.
Directors
Mr. Alan Brown
Mr. Con Liosatos
Mr. Ray Horsburgh
Company Secretary & Chief Financial Officer Mr. Peter Crafter
Registered Office & Principal Place of Business Traffic Technologies Ltd
31 Brisbane Street
Eltham VIC 3095
Share Register
Computershare Investor Services Pty Limited
Yarra Falls, 452 Johnson Street
Abbotsford VIC 3067
Tel: 1300 787 272
Traffic Technologies Ltd shares are listed on the Australian Securities Exchange (stock code: “TTI”).
Lawyers
Middletons
Level 25
525 Collins Street
Melbourne VIC 3000
Bankers
Westpac Banking Corporation Level 10
360 Collins Street
Melbourne VIC 3000
Auditors
Moore Stephens Melbourne
Level 10
530 Collins Street
Melbourne VIC 3000
For
per
sona
l use
onl
y

Traffic Technologies Ltd and Controlled Entities
Financial Report for the year ended 30 June 2012
Contents
Page No.
Directors’ Report 1
Auditor’s Independence Declaration 12
Corporate Governance Statement 13
Statement of Comprehensive Income 21
Statement of Financial Position 22
Statement of Changes in Equity 23
Statement of Cash Flows 24
Notes to the Financial Statements 25
Directors’ Declaration 86
Independent Audit Report 87
ASX Additional Information 89
For
per
sona
l use
onl
y

Traffic Technologies Ltd
Directors’ Report
1
Your Directors submit their report for the year ended 30 June 2012.
Directors
The names and details of the Company’s Directors in office during the financial year and until the date of this report
are as follows. Directors were in office for the entire period unless otherwise stated.
Name Qualifications, Experience and Special Responsibilities
Mr. Alan J Brown
FAICD
(Age 66) Non-Executive Chairman Appointed January 2004.
Mr. Brown has extensive experience in both the private and public sectors. He is a Director
of a range of private companies and has established several over a thirty-year period. He was
a Member of the Victorian Parliament from 1979-97 and is a former Leader of the Victorian
Liberal Party. As Minister for Transport he implemented major reforms to Victoria’s
transport infrastructure. He was Agent General for Victoria in London from 1997-2000. He
is Chairman of Apprenticeships Plus. He is also Chairman of Tasmanian Company Work &
Training Limited. Mr. Brown was appointed a non-executive Director of Traffic
Technologies Ltd in January 2004 and was appointed Chairman in October 2010. Mr.
Brown is Chairman of the Company, Chairman of the Nomination & Remuneration and
Corporate Governance committees and a member of the Audit & Risk committee. Mr.
Brown has not served as a Director of any other listed companies during the three years prior
to June 2012.
Mr. Constantinos L
Liosatos
MAICD
(Age 50) Managing Director. Appointed April 2003.
Mr. Liosatos has over 20 years experience in the construction industry and 12 years
experience in the traffic industry. Mr. Liosatos has qualifications in Mechanical Design and
Lighting Engineering. Mr. Liosatos is the Managing Director of Traffic Technologies Ltd.
Mr. Liosatos was appointed as a Director of Traffic Technologies Ltd in April 2003. Mr
Liosatos is a member of the Corporate Governance committee. Mr. Liosatos has not served
as a Director of any other listed companies during the three years prior to June 2012.
Mr. Raymond K
Horsburgh AM
B.Eng (Chem.)
FAICD
(Hon D Univ)
FIEAust
(Age 69) Non-Executive Director. Appointed November 2006.
Mr. Horsburgh held various positions with Australian Consolidated Industries from 1963 to
1994 including the position of Chief Executive Officer of ACI Glass which he held from
1991 to 1994. In 1994 he was appointed Chief Executive Officer of Smorgon Steel Group
Limited and was Group Managing Director and Chief Executive Officer until 2007. He is a
former Director of the Business Council of Australia, ANI Limited, Email Limited,
Metalcorp Limited and National Can Industries Limited and a former President of
Williamstown Rotary Club and of the Essendon Football Club. He is currently Chairman of
Toll Holdings Limited and Calibre Group Limited and a Non Executive Director of CSR
Limited. Mr. Horsburgh was awarded an Order of Australia on Australia Day 2006 for
Service to the Steel Industry and Service to Disadvantaged Youth. He was appointed to the
Board of Traffic Technologies Ltd in November 2006 and was Chairman from 2007 to 2010.
Mr. Horsburgh is Chairman of the Audit & Risk Committee and is a member of the
Nomination & Remuneration and Corporate Governance committees. Mr. Horsburgh has
also served as a Director of the following listed companies during the last three years: Toll
Holdings Limited, Calibre Group Limited CSR Limited and National Can Industries Limited.
For
per
sona
l use
onl
y

Traffic Technologies Ltd
Directors’ Report (Continued)
2
Name Qualifications, Experience and Special Responsibilities
Company
Secretary
Mr. Peter K Crafter
LL.B (Hons), MBA,
FCA, CA, MCT,
FAICD, FCIS
(Age 55) Company Secretary and Chief Financial Officer. Appointed Company Secretary
March 2004; appointed Chief Financial Officer October 2007.
Mr. Crafter is a Chartered Accountant in both Australia and the UK and qualified
Corporate Treasurer with extensive experience in financial management including several
years with KPMG and Touche Ross in the United Kingdom. He holds an honours degree
in Law from the University of London and an MBA from Heriot-Watt University,
Scotland. He was Chief Financial Officer of ASX-listed Software Communication Group
Limited from 1999 to 2002 and was Acting Chief Executive Officer of that Company from
2001 to 2002. He was Chief Financial Officer of ASX-listed CBD Energy Limited from
2002 to 2003. He was Company Secretary of ASX-listed The Swish Group Limited from
2003 to 2009. He was appointed Chief Financial Officer and Company Secretary of
Traffic Technologies Ltd in March 2004 and retired as Chief Financial Officer in February
2006. He was reappointed Chief Financial Officer of Traffic Technologies Ltd in October
2007.
Interests in the share and options of the Company and related bodies corporate
As at the date of this report, the interests of the Directors in the shares and options of Traffic Technologies Ltd were:
Director Number of
Ordinary
Shares
Mr. Alan Brown 3,191,965
Mr. Con Liosatos 15,063,919
Mr. Ray Horsburgh 328,400
Dividends
The Directors do not recommend the payment of a dividend for the financial year ended 30 June 2012 (2011: $Nil).
PRINCIPAL ACTIVITIES
In its goal of providing a suite of traffic products to the traffic industry, the Group operates through its Traffic Products
division, which specialises in the design, manufacture and installation of traffic signals, emergency telephones,
portable roadside technology and road lighting products and provides a wide range of directional and regulatory traffic
signs and traffic control products to road traffic authorities, municipal councils and construction companies.
In December 2011 the Group completed the sale of its Traffic Hire business for $2.5m. The net proceeds of the sale of
$2.3m were applied in reducing net debt. This divestment has enabled management to focus on the Group’s Traffic
Products business, whilst also reducing Group debt.
For
per
sona
l use
onl
y

Traffic Technologies Ltd
Directors’ Report (Continued)
3
OPERATING AND FINANCIAL REVIEW
Review of Operations
The following table summarises the Group’s results for the financial years ended 30 June 2012 and 2011.
Year Ended 30 June ($’m)
2012 2011 #
Sales revenue from continuing operations 53.1 47.9
EBIT from continuing operations 4.0 2.7
Finance costs (2.5) (3.7)
Income tax benefit 0.4 0.8
Discontinued operations (0.2) 0.8
Net profit after tax 1.7 0.6
# - Comparative figures have been restated – refer note 1 to the financial statements
EBIT from continuing operations
The Group’s results for the 2012 financial year reflect an improvement in trading conditions in which the Group
operates and improved profitability resulting from management’s continued focus on cost control and operating
efficiencies.
Finance costs
Finance costs reduced when compared to the previous year reflecting the reduction of debt following the sale of the
Traffic Hire business in December 2011 and improved profitability. Net debt was $21.0m at 30 June 2012, compared
to $27.6m at 30 June 2011.
Discontinued operations
Accounting standards require the results of the Traffic Hire business, which was sold during the financial year ended
30 June 2012, to be separately classified in the Annual Financial Report as discontinued operations and the
comparative period results to be restated. Discontinued operations in the previous financial year include the Traffic
Management business which was sold in August 2010. For further details see note 6 to the financial statements.
Net profit after tax
The Group has reported a net profit after tax for the financial year ended 30 June 2012 of $1.7m, compared to $0.6m in
the previous financial year.
Segmental Performance
Following the sale of the Traffic Hire business in December 2011, the Group has only one business segment: Traffic
Products. The following table summarises revenue and EBIT from continuing operations for the Traffic Products
segment for the financial years ended 30 June 2012 and 2011.
Revenue $m EBIT $m
2012 2011# 2012 2011#
Traffic Products 53.4 48.4 8.2 6.5
# - Comparative figures have been restated – refer note 1 to the financial statements
For
per
sona
l use
onl
y

Traffic Technologies Ltd
Directors’ Report (Continued)
4
Traffic Products
Traffic Products revenue was $53.4m (2011: $48.4m) and EBIT was $8.2m (2011: $6.5m). The result reflects the
ongoing commitment by management and the board to deliver shareholder value, which includes the ongoing positive
performance of the business and continued increase in efficiencies. The signage business has continued to face strong
competition.
Financial position
Net assets of $20.3m at 30 June 2012 (2011: $18.6m) include intangible assets of $34.1m (2011: $34.4m).
Net debt reduced to $21.0m at 30 June 2012 (2011: $27.6m). The Group’s term debt facility was $20.7m at 30 June
2012 (2011: $24.0m) and the working capital facility was $8.0m at 30 June 2012 (2011: $8.6m). The Company’s debt
facilities have been extended to 1 October 2013.
Cash flow
Net operating cash flow was $5.9m for the financial year ended 30 June 2012 (2011: $2.8m).
Net debt repayments were $8.4m in the financial year ended 30 June 2012 (2011: $12.4m). Net debt repayments
included $2.3m from the sale of the Traffic Hire business in December 2011 and improved cash flow from operations.
Debt repayments in the previous financial year included $15m from the sale of the Traffic Management business.
Risk Management
The Group takes a proactive approach to risk management. The Board is responsible for ensuring that risks, and also
opportunities, are identified on a timely basis and that the Group’s objectives and activities are aligned with the risks
and opportunities identified by the Board.
The Group believes that it is crucial for all Board members to be a part of this process and, as such, the Board has not
established a separate risk management committee. Instead sub-committees are convened as appropriate in response to
issues and risks identified by the Board as a whole and the sub-committee further examines the issues and reports back
to the Board.
The Board has a number of mechanisms in place to ensure that management’s objectives and activities are aligned with
the risks identified by the Board. These include the following:
Board approval of a strategic plan, which encompasses the Group’s vision, mission and strategy statements,
designed to meet stakeholders’ needs and manage business risk;
Implementation of Board approved business plans and budgets and Board monitoring of progress against
those budgets, including the establishment and monitoring of KPIs of both a financial and non-financial
nature; and
The establishment of sub-committees to report on and monitor specific business risks.
SIGNIFICANT CHANGES IN THE STATE OF AFFAIRS
There have been no significant changes in the nature of these activities during the year.
SIGNIFICANT AFTER BALANCE DATE EVENTS
Subsequent to balance date there have been no significant events which have affected the operations of the Group.
For
per
sona
l use
onl
y

Traffic Technologies Ltd
Directors’ Report (Continued)
5
LIKELY DEVELOPMENTS AND EXPECTED RESULTS
For the financial year ending 30 June 2013 the Group will continue to pursue the goals identified in its strategic plan.
Potential strategic acquisitions will be investigated, where appropriate, in order to augment and strengthen the Group’s
portfolio of products and services together with pursuing continual development of the existing businesses to drive
organic growth and further efficiency gains. One of the priorities for the Group in the year ahead is to reduce gearing
and the associated finance costs. With this in mind, the Board and management continue to investigate ways in which
debt can be further reduced. This may involve further cost savings and the restructure of non-core parts of the
business. With the continued uncertainty in the world economy, the Group remains cautious about the economic
outlook and accordingly is not yet in a position to give earnings guidance for the financial year ending 30 June 2013.
ENVIRONMENTAL REGULATION AND PERFORMANCE
The Traffic Products segment is regulated by the Environmental Protection Act 1970 (8056/1970) and the
Occupational Safety Regulations 2009 (54/2009) with regard to waste water run-off and the storage and treatment of
chemicals. These operations are regularly audited by an independent environmental consultant that reports directly to
the Environmental Protection Authority.
There have been no significant known breaches of the Group’s compliance with environmental regulations.
Other Group operations are not regulated by any significant environmental regulation under a law of the
Commonwealth or of a State or Territory.
SHARE OPTIONS
Unissued Shares
As at the date of this report, there were nil unissued ordinary shares under option (nil at the reporting date).
Shares Issued as a Result of the Exercise of Options
During the year, there were no options to acquire fully paid ordinary shares exercised by Directors, executives or
employees. Since the end of the financial year no Directors, executives or employees have exercised options.
INDEMNIFICATION AND INSURANCE OF DIRECTORS, OFFICERS AND AUDITORS
During the financial year ended 30 June 2012, the Group paid premiums of $52,895 in respect of a Directors’ and
Officers’ insurance policy insuring Directors and Officers in respect of claims which may be brought against them.
The contract of insurance prohibits disclosure of the nature of the liability.
The Company has not otherwise, during or since the end of the financial year, except to the extent permitted by law,
indemnified or agreed to indemnify an officer or auditor of the Company or any related body corporate against a
liability incurred as such by an officer or auditor.
For
per
sona
l use
onl
y

Traffic Technologies Ltd
Directors’ Report (Continued)
6
DIRECTORS’ MEETINGS
The number of meetings of Directors (including meetings of committees of Directors) held during the financial year
and the number of meetings attended by each Director was as follows:
Directors’ Meetings Audit & Risk
Committee
Nomination &
Remuneration
Committee
Corporate
Governance
Committee
Number
eligible
to attend
Number
attended
Number eligible
to attend
Number
attended
Number
eligible to
attend
Number
attended
Number
eligible to
attend
Number
attended
Mr. Alan Brown 11 11 3 3 1 1 1 1
Mr. Con Liosatos 11 11 3 3 1 1 1 1
Mr. Ray Horsburgh 11 11 3 3 1 1 1 1
Committee Membership
As at the date of this report the Company had an Audit & Risk Committee, a Nomination & Remuneration Committee
and a Corporate Governance Committee of the Board of Directors.
The eligibility and attendance of each of the Directors is as disclosed in the table above. The chairman of each
committee was:
Audit & Risk – Mr. Ray Horsburgh
Nomination & Remuneration – Mr. Alan Brown
Corporate Governance – Mr. Alan Brown
ROUNDING
The amounts contained in this report and in the financial report have been rounded to the nearest $1,000 (unless
otherwise stated) under the option available to the Company under ASIC Class Order 98/0100. The Company is an
entity to which the Class Order applies.
AUDITOR’S INDEPENDENCE AND NON-AUDIT SERVICES
A copy of the auditor’s independence declaration in relation to the audit for the financial year is provided immediately
following this report.
During the financial year ended 30 June 2012, the Company’s auditor, Moore Stephens Melbourne, was appointed tax
advisers to the Company. For details of auditor’s remuneration, see note 23.
The Directors are satisfied that the provision of non-audit services is compatible with the general standard of
independence imposed by the Corporations Act 2001. The nature and scope of each type of non-audit service provided
means that auditor independence was not compromised.
For
per
sona
l use
onl
y

Traffic Technologies Ltd
Directors’ Report (Continued)
7
REMUNERATION REPORT (AUDITED)
This Remuneration Report outlines the Director and executive remuneration arrangements of the Group in accordance
with the requirements of the Corporations Act 2001 and its Regulations. For the purposes of this report, Key
Management Personnel (KMP) of the Group are defined as those persons having authority and responsibility for
planning, directing and controlling all activities of the Group, directly or indirectly, including any Director (whether
executive or otherwise) of the Group.
Nomination & Remuneration Committee
The Nomination & Remuneration Committee of the Board of Directors of the Company is responsible for determining
and reviewing remuneration arrangements for the Directors and executives.
The Nomination & Remuneration Committee comprises all independent Directors and is chaired by Mr. Alan Brown,
who is an independent Director. The Nomination & Remuneration Committee assesses the appropriateness of the
nature and amount of remuneration of executives on a periodic basis by reference to relevant employment market
conditions with the overall objective of ensuring maximum stakeholder benefit from the retention of a high quality,
high performing Director and executive team.
Remuneration Philosophy
The performance of the Group depends upon the quality of its Directors and executives. To prosper, the Group must
attract, motivate and retain highly skilled Directors and executives.
Remuneration Structure
In accordance with best practice corporate governance, the structure of non-executive Director and executive
remuneration is separate and distinct.
Non-executive Director Remuneration
Objective
The Board seeks to set aggregate remuneration at a level that provides the Company with the ability to attract and
retain Directors of the highest calibre, whilst incurring a cost that is acceptable to shareholders.
Structure
The Company’s Constitution and the ASX Listing Rules specify that the aggregate remuneration of non-executive
Directors shall be determined from time to time by a general meeting. The notice convening a general meeting at
which it is proposed to seek approval to increase that maximum aggregate sum must specify the proposed new
maximum aggregate sum and the amount of the proposed increase. Aggregate maximum non-executive Directors’
remuneration is currently $400,000 per year.
It is considered good governance for Directors to have a stake in the Company on whose board they sit. Non-executive
Directors have long been encouraged to hold shares in the Company (purchased by the Director on market). The
Company also facilitates this through the Company Share Option Plan.
The non-executive Directors do not receive retirement benefits, other than statutory superannuation, nor do they
participate in any incentive programs.
The remuneration of non-executive Directors for the financial years ended 30 June 2012 and 30 June 2011 is detailed
in Table 1 and Table 2 respectively of this report.
For
per
sona
l use
onl
y

Traffic Technologies Ltd
Directors’ Report (Continued)
8
Executive Remuneration
Objective
The Group aims to reward executives with a level and mix of remuneration commensurate with their position and
responsibilities within the Company so as to:
Reward executives for Group and individual performance;
Align the interests of executives with those of shareholders;
Link reward with the strategic goals and performance of the Group; and
Ensure total remuneration is competitive by market standards.
Structure
Currently remuneration is paid in the form of cash remuneration, superannuation contributions and share options where
applicable.
The Company did not pay any bonuses to Key Management Personnel during the financial year ended 30 June 2012.
Further details of the remuneration of Directors and Key Management Personnel are provided in Table 1 and Table 2
of this report.
The Nomination & Remuneration Committee is responsible for determining the level and make-up of executive
remuneration and makes reference to a wide range of available external research as well as assessments of individual
performance in determining the appropriate level of executive remuneration.
Share Options
All Directors and Key Management Personnel have the opportunity to qualify for participation in the Company Share
Option Plan (which forms part of long term incentive variable remuneration). The issue of options under this plan is at
the discretion of the Board. Options are used by the Company as a non-cash form of remuneration and have the
objective of aligning employee interests with the objective of increasing shareholder wealth. Any issue of options
under the plan to Directors is subject to shareholder approval.
During the financial year ended 30 June 2012 no options were granted as equity compensation benefits to Key
Management Personnel and no options vested during the year (2011: nil). There were no options outstanding as at 30
June 2012 or at the date of this report.
The Board has no policy with regard to Key Management Personnel limiting the risk of their exposure to options.
Executive Service and Management Agreements
Key Management Personnel are given the opportunity to receive their fixed remuneration in a variety of forms
including cash, superannuation contributions and fringe benefits such as motor vehicles. It is intended that the manner
of payment chosen will be optimal for the recipient without creating undue cost for the Group. The service contracts
entered into with Key Management Personnel do not prescribe how compensation levels are to be modified from year
to year. Compensation levels are reviewed each year to take into account cost-of-living changes, any change in the
scope of the role performed by the senior executive and any changes required to meet the principles of the
compensation policy.
For
per
sona
l use
onl
y

Traffic Technologies Ltd
Directors’ Report (Continued)
9
Director and Key Management Personnel Details
The following persons acted as Directors or Key Management Personnel of the Company during or since the end of the
financial year.
Mr Alan Brown Chairman
Mr. Con Liosatos Managing Director
Mr. Ray Horsburgh Non-Executive Director
Mr. Peter Crafter Chief Financial Officer and Company Secretary
Key Management Personnel
The Managing Director, Mr. Liosatos, is employed under a rolling contract. Employment may be terminated by the
giving, by either party, of nine months’ notice, or by the payment or forfeiture of an equivalent amount of pay in lieu
of notice from any monies owing. The Company retains the right to terminate the contract at any time without notice
in the case of serious misconduct. Mr. Liosatos is entitled to a bonus at the discretion of the Board based on the
Group’s financial performance. No bonus was paid in the financial year ended 30 June 2012. Mr. Liosatos’
performance is reviewed annually by the Nomination & Remuneration Committee.
Mr. Peter Crafter, Company Secretary and Chief Financial Officer, is employed under a rolling employment contract.
Employment may be terminated by the giving, by either party, of six months’ notice, or by the payment or forfeiture of
an equivalent amount of pay in lieu of notice from any monies owing. The Company retains the right to terminate the
contract at any time without notice in the case of serious misconduct. Mr. Crafter is entitled to a bonus at the
discretion of the Board based on the Group’s financial performance. No bonus was paid in the financial year ended 30
June 2012.
Non-executive Director Agreements
The non-executive Directors have entered into non-executive Director Agreements with the Company. The non-
executive Director agreements:
- entrench a Director’s rights to be indemnified by the Company to the maximum extent permitted by law;
- require the Company to take out an appropriate Directors’ and officers’ insurance policy to protect the
Director from liability (to the extent permitted by law); and
- access the books and records of the Company, which relate to the period the Director acted as a Director of
the Company. After resignation as a Director, the Director can only use this information for the purposes of
defending a claim.
Group Performance and Shareholder Returns
2012 2011
EBIT from continuing operations ($’000) $3,958 $2,729+
Net profit /(loss) attributable to equity holders of the parent
($’000)
$1,709
$582
Basic earnings / (loss) per share from continuing operations 1.07 cents (0.13 cents)
Share price at balance date 2.9 cents 1.5 cents
Share price growth over year ended 30 June 93% (46%)
+ Comparative figures have been restated – refer note 1 to the financial statements
Management remuneration is not related to Group performance and shareholder returns except to the extent disclosed
above.
For
per
sona
l use
onl
y

Traffic Technologies Ltd
Directors’ Report (Continued)
10
TABLE 1: REMUNERATION OF KEY MANAGEMENT PERSONNEL AND OTHER EXECUTIVES (AUDITED)
Short-term benefits
Post-employment
benefits Termination
Benefits
$
Long-term
benefits
Share based
payments
Total
Salary & fees
$
Non-monetary
$
Cash
Bonus
$
Superannuation
$
Long service
leave
$
Options
$ $
%
performance
related
Year ended 30 June 2012
Non-executive Directors
Mr. Alan Brown 94,500 - - 8,505 - - - 103,005 -
Mr Ray Horsburgh 51,666 - - 4,650 - - - 56,316 -
Sub-total non-executive Directors 146,166 - - 13,155 - - - 159,321 -
Key Management Personnel
Mr. Con Liosatos 433,499 76,947 - 39,015 - 16,809 - 566,270 -
Mr. Peter Crafter 228,450 17,681 - 46,721 - 11,904 - 304,756 -
661,949 94,628 - 85,736 - 28,713 - 871,026 -
Total 808,115 94,628 - 98,891 - 28,713 - 1,030,347 -
Year ended 30 June 2011
Non-executive Directors
Mr. Alan Brown 76,666 - - 6,900 - - - 83,566 -
Mr Ray Horsburgh 63,333 - - 5,700 - - - 69,033 -
Mr. Ken Jarrett 45,000 - - 4,050 - - 49,050 -
Sub-total non-executive Directors 184,999 - - 16,650 - - - 201,649 -
Key Management Personnel
Mr. Con Liosatos 406,788 40,269 - 36,611 - 6,309 - 489,977 -
Mr. Peter Crafter 207,108 14,033 - 44,800 - 4,781 - 270,722 -
613,896 54,302 - 81,411 - 11,090 - 760,699 -
Total 798,895 54,302 - 98,061 - 11,090 - 962,348 -
For
per
sona
l use
onl
y

Traffic Technologies Ltd
Directors’ Report (Continued)
11
Signed in accordance with a resolution of the Directors.
Mr. Alan Brown
Independent Non-Executive Chairman
21 August 2012
Melbourne
For
per
sona
l use
onl
y

Moore Stephens ABN 39 533 589 331. Liability limited by a scheme approved under Professional Standards Legislation. An independent member of Moore Stephens International Limited – members in principal cities throughout the world. The Melbourne Moore Stephens firm is not a partner or agent of any other Moore Stephens firm. And is a separate partnership in Victoria.
Level 10, 530 Collins Street
Melbourne VIC 3000
T +61 (0)3 8635 1800 F +61 (0)3 8102 3400
www.moorestephens.com.au
Auditor’s Independence Declaration under Section 307C of the Corporations Act
2001 to the directors of Traffic Technologies Limited
I declare that, to the best of my knowledge and belief, during the year ended 30 June 2012 there have been:
(i) No contraventions of the auditor independence requirements as set out in the Corporations Act 2001 in relation to the audit, and
(ii) No contraventions of any applicable code of professional conduct in relation to the audit.
MOORE STEPHENS Chartered Accountants
Nick Michael Partner Melbourne, 21 August 2012
For
per
sona
l use
onl
y

Traffic Technologies Ltd
Corporate Governance Statement
13
The Board of Directors of Traffic Technologies Ltd is responsible for the corporate governance framework of the
Group having regard to the ASX Corporate Governance Council’s published guidelines as well as its corporate
governance principles and recommendations. The Board guides and monitors the business and affairs of the
Company on behalf of the shareholders by whom they are elected and to whom they are accountable.
The Board of Directors has implemented the Recommendations of the ASX Corporate Governance Council to the
extent appropriate for the size and nature of the Company’s business as described below. The format of the
Corporate Governance Statement follows the ASX Corporate Governance Council’s “Second Edition - Revised
Corporate Governance Principles and Recommendations”. The Corporate Governance Statement must contain
specific information and also report on the Company’s adoption of the Council’s best practice recommendations on an exception basis, whereby disclosure is required of any recommendation that has not been adopted by the
Company, together with the reasons it has not been adopted.
The Board has established a Corporate Governance Committee, which is responsible for reviewing the Company’s
compliance with best practice corporate governance requirements, including compliance with the ASX Corporate
Governance Council’s Recommendations. The Corporate Governance Committee comprises all Board members and
is chaired by Mr. Alan Brown. For details of meetings of the Corporate Governance Committee held during the year
and attendance at those meetings, refer to the Directors’ Report.
The Company’s corporate governance practices have been in place throughout the year ended 30 June 2012. With
the exception of the departures from the Corporate Governance Council recommendations detailed below, the corporate governance practices of the Company are compliant with the Council’s best practice recommendations.
The Company’s Corporate Governance Policies are disclosed on the Company’s website.
Principle 1: Lay solid foundations for management and oversight
The Board guides and monitors the business and affairs of the Company on behalf of the shareholders by whom they
are elected and to whom they are accountable. The Board acts on behalf of and is accountable to shareholders. The
Board seeks to identify the expectations of shareholders, as well as other regulatory and ethical expectations and
obligations. In addition, the Board is responsible for identifying areas of significant business risk and ensuring
arrangements are in place to adequately manage these risks. The Board guides and monitors and fulfils its responsibility to protect shareholder interests and enhance shareholder value by:
Approving and periodically reviewing the business and financial objectives, strategies and plans of the
consolidated entity;
Monitoring the financial performance of the consolidated entity, including approval of the consolidated
entity’s financial statements;
Ensuring that adequate internal control systems and procedures exist and that compliance with these
systems and procedures is maintained;
Identifying areas of significant business or financial risk to the consolidated entity and ensuring
management takes appropriate action to manage those risks;
Reviewing the performance and remuneration of Board members and key members of staff;
Monitoring the operations of the consolidated entity and the performance of management; Establishing and maintaining appropriate ethical standards; and
Reporting to the shareholders, the Australian Securities and Investments Commission and the Australian
Securities Exchange as required.
Whilst at all times the Board retains full responsibility for guiding and monitoring the Group, in discharging its
stewardship it makes use of Committees. Board Committees are able to focus on a particular responsibility and
provide informed feedback to the Board. The Board has established the following Committees:
Corporate Governance;
Audit & Risk; and
Nomination & Remuneration.
For
per
sona
l use
onl
y
Traffic Technologies Ltd
Corporate Governance Statement (Continued)
14
The Board delegates to the Managing Director and the executive management team responsibility for the operation
and administration of the consolidated entity. The Board ensures that this team is appropriately qualified and
experienced to discharge their responsibilities and has in place procedures to assess the performance of the Managing
Director and the executive management team.
The Board is responsible for ensuring that management’s objectives and activities are aligned with the expectations
and risks identified by the Board. The Board has a number of mechanisms in place to ensure this is achieved
including:
Board approval of a strategic plan designed to meet stakeholders’ needs and manage business risk;
Ongoing development of the strategic plan and approving initiatives and strategies designed to ensure the
continued growth and success of the entity; and
Implementation of budgets by management and monitoring progress against budget, via the establishment
and reporting of both financial and non financial key performance indicators.
Other functions reserved to the Board include:
Approval of the annual and half-yearly financial reports;
Approving and monitoring the progress of major capital expenditure, capital management and acquisitions
and divestments;
Ensuring that any significant risks that arise are identified, assessed, appropriately managed and monitored;
and
Reporting to shareholders.
Principle 2: Structure the Board to add value
The Board has been structured to ensure that an appropriate mix of experience and expertise is available to provide
strategic guidance for the Company and effective oversight of management. It is the policy of the Company that the
composition of the Board is determined having regard to the following concepts:
That the Board will comprise a majority of independent Directors; That the Board will comprise a minimum of three Directors and the actual number may be higher where
additional expertise is required in specific areas and an outstanding candidate is located;
That the Chairman of the Board will be an independent non-executive Director; and
That the Board members should represent a broad range of expertise and experience
The skills, experience and expertise relevant to the position held by each Director in office at the date of the Annual
Report is included in the Directors’ Report.
The Directors in office and the term in office held by each Director at the date of this report are as follows:
Name Position Term in Office Mr. Alan Brown Independent Non-Executive Chairman 8 years, 7 months
Mr. Con Liosatos Managing Director 9 years, 3 months
Mr. Ray Horsburgh Independent Non-Executive Director 5 years, 9 months
For
per
sona
l use
onl
y

Traffic Technologies Ltd
Corporate Governance Statement (Continued)
15
A Director will be considered an independent Director if the Director:
(a) is not a substantial shareholder of the Company, being a shareholder who does not have more than a 5%
interest in the Company;
(b) has not been employed within the last 3 years as an executive of the Company;
(c) has not within the last 3 years been a principal of a material professional adviser or consultant to the
Company;
(d) is not a material supplier, customer or other contractor of the Company; and
(e) is otherwise considered by the Board to be independent.
In accordance with the definition of independence above, two of the three Directors of the Company who served
during the year ended 30 June 2012 were independent. Mr. Liosatos, the Managing Director, is a full time executive
and substantial shareholder of the Company. The Company had an independent chairman throughout the year ended
30 June 2012.
The Company’s constitution provides that a Director other than the Managing Director may not retain office for
more than three calendar years or beyond the third Annual General Meeting following his or her election, whichever
is longer, without submitting for re-election. One third of the Directors retire each year and are eligible for re-
election. The Directors who retire by rotation at each annual general meeting are those with the longest length of
time in office since their appointment or last election. All Directors must be elected by the members of the Company. It is not a requirement for a person who is a Director to own shares in the Company.
The Chair is held by an independent Director, Mr. Brown. The roles of Chair (Mr. Brown) and Managing Director
(Mr. Liosatos) are not exercised by the same individual.
Recommendation 2.4 requires listed entities to establish a Nomination Committee to oversee the appointment and
induction process for Directors and committee members and the selection, appointment and succession planning
process of the Company’s chief executive officer. All independent non-executive Directors are members of the
Nomination & Remuneration Committee, which is chaired by Mr. Brown. In considering board candidates, the
Nomination & Remuneration Committee will identify potential skill gaps and seek suitable qualified candidates to
fill such gaps, using external recruitment tools where necessary.
The Company provides the capacity for any Director to obtain separate professional advice on any matter being
discussed by the Board and for the Company to pay the cost incurred. Before the engagement is made, the Director
is required to obtain the Chairman of the Board’s approval. Approval will not be unreasonably denied and the
Director will be expected to provide the Board with a copy of that advice.
Performance
The performance of the Board, Board Committees and individual Directors is reviewed regularly by the Board as a
whole. During the reporting period, the Board reviewed the performance of each Board member and key executive.
The performance criteria against which Directors and executives are assessed are aligned with the financial and non-
financial objectives of the Company. Directors whose performance is consistently unsatisfactory may be asked to retire.
For
per
sona
l use
onl
y

Traffic Technologies Ltd
Corporate Governance Statement (Continued)
16
Principle 3: Promote ethical and responsible decision-making
All Directors and officers of the Company are required to discharge their responsibilities ethically and with integrity.
The Board has drawn up a code of conduct to guide Board members, executives and employees in carrying out their
duties and responsibilities, to guide compliance with legal and other obligations and to maintain confidence in the
Company’s integrity. Executives and employees are encouraged to report to Board members any concerns regarding
potentially unethical practices.
The Board is committed to good corporate governance and aims for continuous improvement in these practices. The Company embraces high ethical standards and requires its employees to demonstrate both personal and corporate
responsibility. Directors, officers and employees are required to safeguard the integrity of the Company and to act in
the best interests of its stakeholders (generally, shareholders).
There must be no conflict, or perception of a conflict, between the interests of any Director, officer or employee of
the Company and the responsibility of that person to the Company and to the stakeholders. No Director, officer or
employee may improperly use their position for personal or private gain to themselves, a family member, or any
other person (“associates”).
The Company has established a trading policy governing the trading of its securities. As required by the ASX
Listing Rules, a copy of the Company's trading policy is available from the Company's ASX announcements platform.
Diversity Policy
Diversity includes, but is not limited to, gender, age, ethnicity and cultural background. The Company is committed
to diversity and recognises the benefits of arising from employee and board diversity and the importance of
benefiting from all available talent. Accordingly, the Company has established a diversity policy, which is available
on the Company’s website.
The diversity policy outlines requirements for the Board to develop measurable objectives for achieving diversity
and annually assess both the objectives and the progress in achieving those objectives. Accordingly, the Board has developed the following objectives regarding gender diversity and aims to achieve these objectives over the next five
years as Director and senior executive positions become vacant and appropriately qualified candidates become
available:
Objective Objective Actual Actual
Number % Number %
Women on the Board 1 25% - -
Women in senior management roles 1 25% - -
Women employees in the Group 46 25% 34 19%
Principle 4: Safeguard integrity in financial reporting
It is the Board’s responsibility to ensure that an effective internal control framework exists within the Group. This
includes internal controls to deal with both the effectiveness and efficiency of significant business processes, the
safeguarding of assets, the maintenance of proper accounting records and the reliability of financial information.
Audit & Risk Committee
The Audit & Risk Committee plays a key role in assisting the Board of Directors with its responsibilities relating to
accounting, developing internal control systems, reporting practices and risk management and ensuring the
independence of the Company’s auditors. The Charter for this Committee incorporates policies and procedures to
ensure an effective focus from an independent perspective.
For
per
sona
l use
onl
y

Traffic Technologies Ltd
Corporate Governance Statement (Continued)
17
The Audit & Risk Committee oversees and appraises the quality of the audits conducted by the auditors of the
Company. Moore Stephens Melbourne are the currently appointed auditors of Traffic Technologies. Their
appointment will be reviewed periodically. The Company believes in the ongoing assessment of its audit
arrangements and complies with any regulatory requirements to rotate its external audit partner.
The Audit & Risk Committee includes in its Charter a review of the effectiveness of administrative, operating and
accounting controls.
Meetings of the Committee will be held a minimum of twice per annum, represented by one meeting for each of the
full-year and half-year financial accounts review, approval and recommendation to the Board. Further meetings may be held for discussion on policies and procedures and risk management matters. The auditors of the company will
also be invited to make recommendations to the Committee on policies and procedures for discussion.
The Company’s Audit & Risk Committee follows each of the principles listed below:
Consists only of independent non-executive Directors;
Consists of a majority of independent non-executive Directors; and
Has an independent Chairperson, who is not Chairperson of the Board.
All members of the Board with the exception of the Managing Director are members of the Audit & Risk
Committee. The Audit & Risk Committee is currently comprised of the two independent members of the Board and is chaired by Mr. Horsburgh, who is an independent chairman and who is not Chairman of the Board.
Qualifications of Audit & Risk Committee members
None of the Audit & Risk Committee members have formal accountancy qualifications. However, all Audit & Risk
Committee members have extensive business experience at Board level and in senior management positions.
Audit & Risk Committee meetings are attended by the partner responsible for the Company’s audit. For details of
meetings of the Audit & Risk Committee held during the year and attendance at those meetings, refer to the
Directors’ Report.
Principle 5: Make timely and balanced disclosure
The Company has established written policies and procedures designed to ensure compliance with ASX Listing Rule
disclosure requirements and to ensure accountability at a senior management level for that compliance, as required
by Recommendation 5.1.
The Company’s Continuous Disclosure Policy is designed to promote transparency and investor confidence and
ensure that all interested parties have an equal opportunity to obtain information which is issued by the Company.
The Company is committed to complying with the continuous disclosure obligations contained in the Listing Rules
of the Australian Securities Exchange (ASX) and under the Corporations Act 2001 and ensuring that all shareholders
and the market have an equal opportunity to obtain and review full and timely information about the Company’s securities.
The ASX defines continuous disclosure in its Listing Rules as “the timely advising of information to keep the market
informed of events and developments as they occur”. The Listing Rules and the Corporations Act 2001 require that
a listed entity disclose to the market matters which a reasonable person would expect to have a material effect on the
price or value of the entity’s securities. A reasonable person is taken to expect information to have a material effect
on the price or value of securities if it would, or would be likely to, influence persons who commonly invest in
securities in deciding whether or not to subscribe for, buy or sell the securities.
The Managing Director controls all the Company’s communications with assistance from the Company Secretary in
carrying out this responsibility. The Managing Director and Chairman are the only two officers allowed to authorise
For
per
sona
l use
onl
y

Traffic Technologies Ltd
Corporate Governance Statement (Continued)
18
the release of material information to the market. The Company Secretary is responsible for administering this
policy and is responsible for dealing with the ASX in relation to all Listing Rule issues. The procedures which have
been developed to comply with these rules include immediate reporting of any matter which could potentially have a
material effect, via established reporting lines to the Managing Director and/or the Company Secretary.
Disclosure of such price-sensitive information to the ASX must not be delayed and is disclosed, in the first instance,
to the ASX and only after receiving confirmation that a release of this disclosure has been made to the market will it
then be placed on the Company’s website. Material information must not be selectively disclosed (i.e. to analysts,
the media or shareholders) prior to being announced to the ASX, and all media releases must be referred to the
Managing Director for approval prior to any release.
Principle 6: Respect the rights of shareholders
The Company’s communication strategy is to promote effective communication with shareholders.
The Company is committed to:
ensuring that shareholders and the financial markets are provided with full and timely information about the
Company’s activities in a balanced and understandable way;
complying with continuous disclosure obligations contained in the applicable ASX Listing Rules and the Corporations Act 2001; and
communicating effectively with its shareholders and making it easier for shareholders to communicate with
the Company.
To promote effective communication with shareholders and encourage effective participation at general meetings,
information will be communicated to shareholders:
through the release of information to the market via the ASX;
through the distribution of the Annual Report and Notices of Annual General Meeting;
through shareholder meetings;
through letters and other forms of communications directly to shareholders;
by posting relevant information on the Company’s website; and
by providing shareholders with a choice of information delivery i.e. paper or electronic means.
The Company’s website has a dedicated Shareholder Information section and endeavours to publish on the website
all important company information and relevant announcements made to the market.
The Company’s reports and ASX announcements may be viewed and downloaded from the ASX website: (Stock
code: TTI).
The Board encourages full participation of shareholders at the Annual General Meeting to ensure a high level of
accountability and identification with the Group’s strategy and goals. The external auditor is required to attend the Annual General Meeting of the Company and is available to answer shareholder questions about the conduct of the
audit and the preparation and content of the auditor’s report.
Principle 7: Recognise and manage risk
The Board of the Company takes a proactive approach to the Company’s risk management and internal compliance
and control system. This function is dealt with by the Audit & Risk Committee.
The Audit & Risk Committee is responsible for ensuring that adverse risks and mitigation of these risks are
identified on a timely basis and that the Company’s objectives and activities are aligned with the risks and opportunities identified by the Audit & Risk Committee and the Board of Directors.
For
per
sona
l use
onl
y
Traffic Technologies Ltd
Corporate Governance Statement (Continued)
19
The Company has developed a policy on risk oversight and management and will undertake a detailed risk
assessment of the company’s operations, procedures and processes. The risk assessment will be aimed at identifying
the following:
a culture of risk control and the minimisation of adverse risk throughout the Company, which is being done
through natural or instinctive process by employees of the Company;
a culture of risk control that can easily identify adverse risks as they arise and amend practices;
the installation of practices and procedures in all areas of the business that are designed to minimise an event or incident that could have a financial or other effect on the business and its day to day management;
adoption of practices and procedures to minimise many of the standard adverse commercial risks, i.e., taking
out the appropriate insurance policies, or ensuring compliance reporting is up to date; and
adoption of regular risk management controls reporting to the Board, via the Audit & Risk Committee.
For the purposes of assisting investors to understand better the nature of the risks faced by the Company, the Board
has prepared a list of adverse operational risks as part of these disclosures. However the Board notes that this does
not necessarily represent an exhaustive list and that it may be subject to change based on underlying market events:
Adverse change in economic conditions affecting demand for the Company’s products or services;
Decrease in Federal or State government expenditure on road infrastructure;
Deferral of major projects through circumstances outside the Company’s control;
Adverse operating conditions affecting operations; and
Increasing costs of operations, including labour costs.
Managing Director and Chief Financial Officer certification
In accordance with section 295A of the Corporations Act 2001, the Managing Director and the Chief Financial
Officer have provided a written statement to the Board that:
In their view the Company’s financial report is founded on a sound system of risk management and internal
compliance and control which implements the financial policies adopted by the Board; and
The Company’s risk management and internal compliance and control system is operating effectively in all
material respects.
Principle 8: Remunerate fairly and responsibility
It is the Company’s objective to provide maximum stakeholder benefit from the retention of a high quality Board and
executive team by remunerating Directors and key executives fairly and appropriately with reference to relevant
employment market conditions. To assist in achieving this objective, the Nomination & Remuneration Committee
takes account of the Company’s financial and operating performance in setting the nature and amount of executive
Directors’ and executives’ remuneration. In relation to the payment of bonuses, options or other incentive payments,
discretion is exercised by the Nomination & Remuneration Committee, having regard to the overall performance of the Company and the performance of the individual during the period. The expected outcomes of the remuneration
structure are:
Retention and motivation of key executives;
Attraction of high quality management to the Company; and
Performance incentives that allow executives to share in the success of the Company.
For a full discussion of the Company’s remuneration philosophy and framework and the remuneration received by
Directors and executives in the current period, please refer to the Remuneration Report which is contained within the
Directors’ Report.
For
per
sona
l use
onl
y

Traffic Technologies Ltd
Corporate Governance Statement (Continued)
20
Nomination & Remuneration Committee
The Company has a Nomination & Remuneration Committee which is responsible for determining and reviewing
compensation arrangements for the Directors and the Managing Director and for approving parameters within which
the review of the compensation arrangements for the senior executive team can be conducted by the Managing
Director.
The Nomination & Remuneration Committee comprises all independent non-executive Directors and is chaired by
Mr. Brown, who is an independent Director. For details of meetings of the Nomination & Remuneration Committee
held during the year and the attendance at those meetings, refer to the Directors’ Report.
The details of the remuneration paid to Directors and Officers are included in the Remuneration Report contained in
the Director’s Report.
Non-executive Directors’ remuneration
Certain independent non-executive Directors have previously been issued share options as part of their remuneration.
All Directors and executives have the opportunity to qualify for participation in the Company Share Option Plan,
including independent non-executive Directors. Shareholder approval is required and has been obtained for all
equity-based remuneration payable to Board members. The payment of part of the remuneration of independent non-
executive Directors in a non-cash form preserves cash for use in the business. In common with other smaller-cap listed companies, the Company believes that it must pay its independent non-executive Directors adequate
remuneration in the form of cash and options in order to attract and retain independent non-executive Directors of
appropriate qualifications and experience. There were no share options outstanding during the financial year or at
the date of this report.
There is no scheme to provide retirement benefits, other than statutory superannuation, to independent non-executive
Directors.
For
per
sona
l use
onl
y

Traffic Technologies Ltd and Controlled Entities
Statement of Comprehensive Income
For the year ended 30 June 2012
21
Note Consolidated
2012 2011
$’000 $’000
Continuing operations
Revenue 2a 53,065 47,871
Other income 2b 153 197
Changes in inventories of finished goods and work
in progress
(1,225)
650
Raw materials and consumables used (25,945) (25,098)
Employee benefits expense 3a (15,230) (15,110)
Occupancy costs (2,322) (2,128)
Advertising and marketing expense (103) (222)
Equipment rental (19) (72) Other expenses 3b (2,503) (1,649)
Depreciation and amortisation expense 3c (1,913) (1,710)
Earnings before interest and tax (EBIT) 3,958 2,729
Finance costs 3d (2,486) (3,769)
Net profit/ (loss) for the year from continuing
operations before income tax
1,472 (1,040)
Income tax benefit 4b 418 812
Net profit / (loss) for the year from continuing
operations
1,890 (228)
Discontinued operations (Loss) / profit for the year from discontinued
operations 6b (181) 810
Net profit for the year 1,709 582
Other comprehensive income for the year, net of tax - -
Total comprehensive income for the year 1,709 582
Earnings/ (loss) per share Cents Cents
From continuing operations
- Basic (cents per share) 5 1.07 (0.13)
- Diluted (cents per share) 5 1.07 (0.13)
From discontinued operations - Basic (cents per share) 5 (0.10) 0.47
- Diluted (cents per share) 5 (0.10) 0.47
From continuing and discontinued operations
- Basic (cents per share) 5 0.97 0.34
- Diluted (cents per share) 5 0.97 0.34
The Statement of Comprehensive Income should be read in conjunction with the notes to the financial statements.
For
per
sona
l use
onl
y

Traffic Technologies Ltd and Controlled Entities
Statement of Financial Position
As at 30 June 2012
22
Note Consolidated
2012 2011
$’000 $’000
Current Assets
Cash and cash equivalents 19a 1,589 3,005
Trade and other receivables 7 14,334 12,178
Inventories 8 6,662 7,887
Total Current Assets 22,585 23,070
Non-Current Assets
Property, plant and equipment 10 2,461 5,489
Goodwill 11 30,535 30,535
Intangible assets 11 3,549 3,871
Other financial assets 9 1 1
Deferred tax assets 4c 899 488
Total Non-Current Assets 37,445 40,384
TOTAL ASSETS 60,030 63,454
Current Liabilities
Trade and other payables 12 14,829 11,953
Interest bearing loans and borrowings 13 1,650 6,519
Provisions 14 2,120 1,945
Derivative financial instruments 16 - 151
Total Current Liabilities 18,599 20,568
Non-Current Liabilities
Trade and other payables 12 24 56
Interest bearing loans and borrowings 13 20,936 24,087
Provisions 14 123 104
Total Non-Current Liabilities 21,083 24,247
TOTAL LIABILITIES 39,682 44,815
NET ASSETS 20,348 18,639
Equity
Contributed equity 15 41,663 41,663
Accumulated losses (22,315) (24,024)
Share-based payments reserve 1,000 1,000
TOTAL EQUITY 20,348 18,639
The Statement of Financial Position should be read in conjunction with the notes to the financial statements. For
per
sona
l use
onl
y
Traffic Technologies Ltd and Controlled Entities
Statement of Changes in Equity
For the year ended 30 June 2012
23
Ordinary
Shares
$’000
Convertible
redeemable
preference
shares
$’000
Share based
payments
Reserve
$’000
Accumulated
Losses
$’000
Total
$’000
CONSOLIDATED
At 1 July 2010 37,538 4,125 1,000 (24,606) 18,057
Profit for the year - - - 582 582
Other comprehensive income - - - - -
Total comprehensive income for the year - - - 582 582
Transactions with owners in their capacity as owners:
Conversion of 16,191,208 preference shares into
16,191,208 ordinary shares –
21 October 2010
4,048
(4,048)
-
-
-
Conversion of 1,000 preference shares into
1,000 ordinary shares –
28 April 2011
77
(77)
-
-
-
At 30 June 2011 41,663 - 1,000 (24,024) 18,639
Profit for the year - - - 1,709 1,709
Other comprehensive income - - - - -
Total comprehensive income for the year - - - 1,709 1,709
Transactions with owners in their capacity as owners:
- - - - -
At 30 June 2012 41,663 - 1,000 (22,315) 20,348
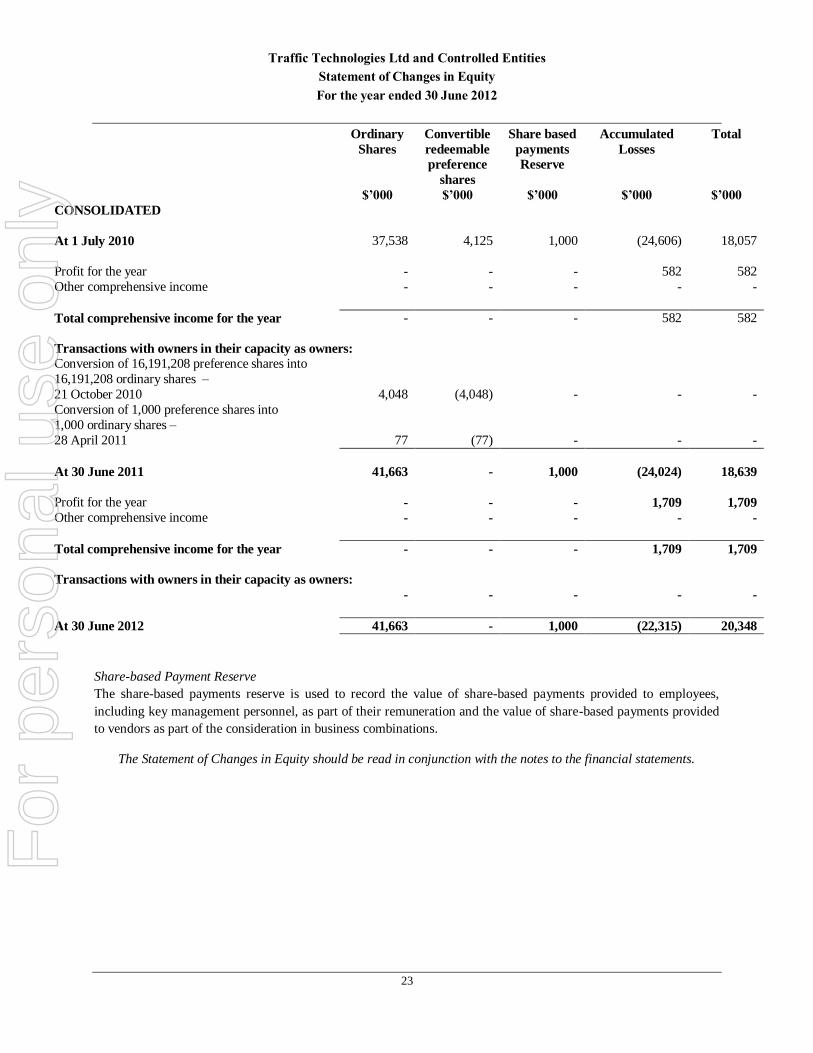
Share-based Payment Reserve
The share-based payments reserve is used to record the value of share-based payments provided to employees,
including key management personnel, as part of their remuneration and the value of share-based payments provided
to vendors as part of the consideration in business combinations.
The Statement of Changes in Equity should be read in conjunction with the notes to the financial statements.
For
per
sona
l use
onl
y
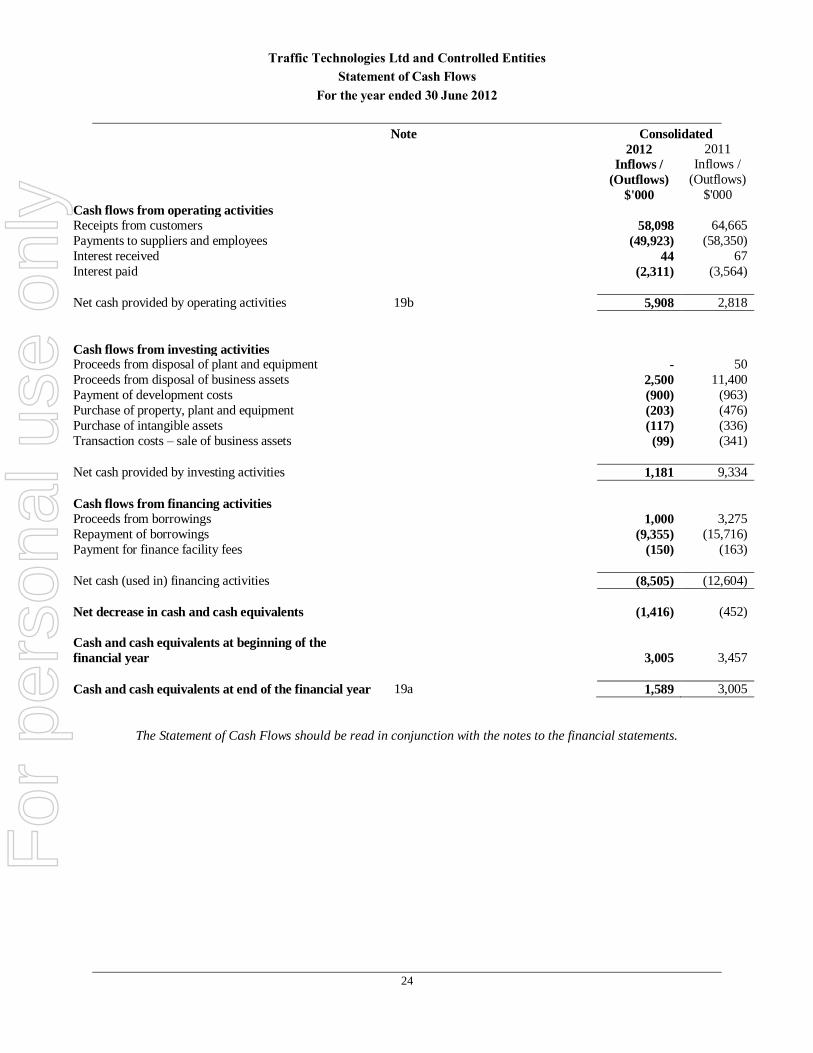
Traffic Technologies Ltd and Controlled Entities
Statement of Cash Flows
For the year ended 30 June 2012
24
Note Consolidated
2012 2011
Inflows /
(Outflows)
$'000
Inflows /
(Outflows)
$'000
Cash flows from operating activities
Receipts from customers 58,098 64,665
Payments to suppliers and employees (49,923) (58,350)
Interest received 44 67
Interest paid (2,311) (3,564)
Net cash provided by operating activities 19b 5,908 2,818
Cash flows from investing activities Proceeds from disposal of plant and equipment - 50
Proceeds from disposal of business assets 2,500 11,400
Payment of development costs (900) (963)
Purchase of property, plant and equipment (203) (476)
Purchase of intangible assets (117) (336)
Transaction costs – sale of business assets (99) (341)
Net cash provided by investing activities 1,181 9,334
Cash flows from financing activities
Proceeds from borrowings 1,000 3,275
Repayment of borrowings (9,355) (15,716)
Payment for finance facility fees (150) (163)
Net cash (used in) financing activities (8,505) (12,604)
Net decrease in cash and cash equivalents (1,416) (452)
Cash and cash equivalents at beginning of the
financial year
3,005
3,457
Cash and cash equivalents at end of the financial year 19a 1,589 3,005
The Statement of Cash Flows should be read in conjunction with the notes to the financial statements.
For
per
sona
l use
onl
y
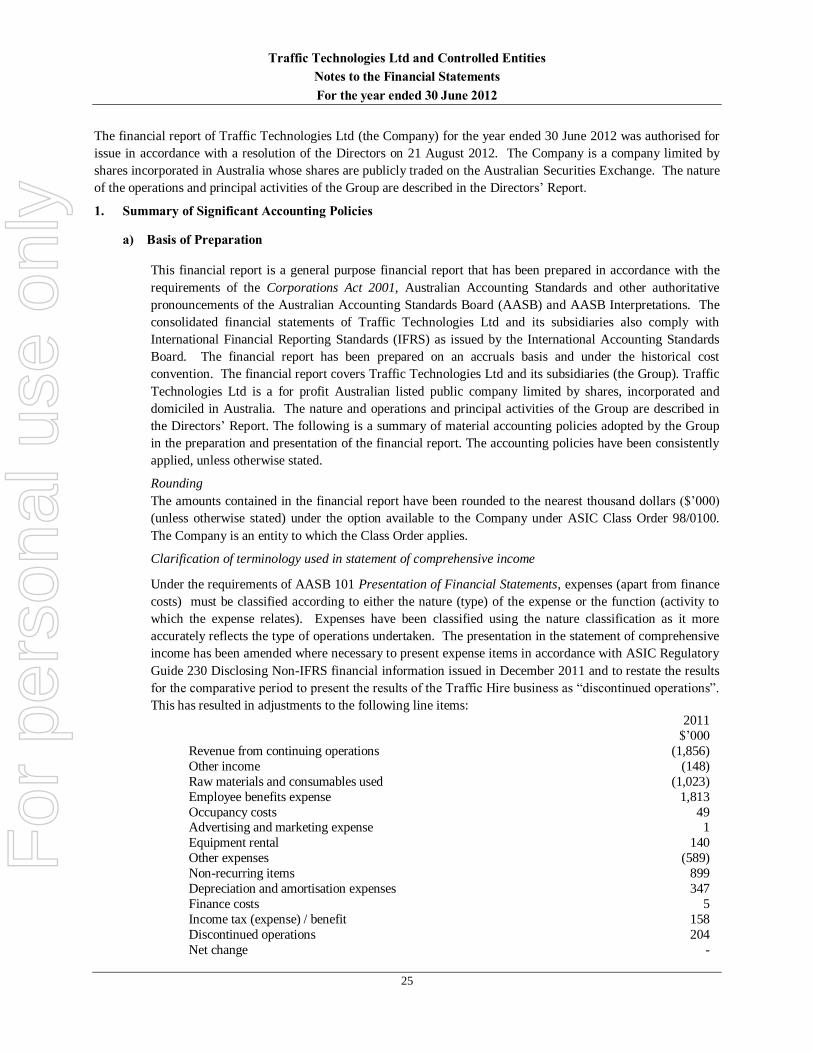
Traffic Technologies Ltd and Controlled Entities
Notes to the Financial Statements
For the year ended 30 June 2012
25
The financial report of Traffic Technologies Ltd (the Company) for the year ended 30 June 2012 was authorised for
issue in accordance with a resolution of the Directors on 21 August 2012. The Company is a company limited by
shares incorporated in Australia whose shares are publicly traded on the Australian Securities Exchange. The nature
of the operations and principal activities of the Group are described in the Directors’ Report.
1. Summary of Significant Accounting Policies
a) Basis of Preparation
This financial report is a general purpose financial report that has been prepared in accordance with the
requirements of the Corporations Act 2001, Australian Accounting Standards and other authoritative
pronouncements of the Australian Accounting Standards Board (AASB) and AASB Interpretations. The
consolidated financial statements of Traffic Technologies Ltd and its subsidiaries also comply with
International Financial Reporting Standards (IFRS) as issued by the International Accounting Standards
Board. The financial report has been prepared on an accruals basis and under the historical cost
convention. The financial report covers Traffic Technologies Ltd and its subsidiaries (the Group). Traffic
Technologies Ltd is a for profit Australian listed public company limited by shares, incorporated and
domiciled in Australia. The nature and operations and principal activities of the Group are described in
the Directors’ Report. The following is a summary of material accounting policies adopted by the Group
in the preparation and presentation of the financial report. The accounting policies have been consistently
applied, unless otherwise stated.
Rounding
The amounts contained in the financial report have been rounded to the nearest thousand dollars ($’000)
(unless otherwise stated) under the option available to the Company under ASIC Class Order 98/0100.
The Company is an entity to which the Class Order applies.
Clarification of terminology used in statement of comprehensive income
Under the requirements of AASB 101 Presentation of Financial Statements, expenses (apart from finance
costs) must be classified according to either the nature (type) of the expense or the function (activity to
which the expense relates). Expenses have been classified using the nature classification as it more
accurately reflects the type of operations undertaken. The presentation in the statement of comprehensive
income has been amended where necessary to present expense items in accordance with ASIC Regulatory
Guide 230 Disclosing Non-IFRS financial information issued in December 2011 and to restate the results
for the comparative period to present the results of the Traffic Hire business as “discontinued operations”.
This has resulted in adjustments to the following line items: 2011
$’000
Revenue from continuing operations (1,856)
Other income (148)
Raw materials and consumables used (1,023)
Employee benefits expense 1,813
Occupancy costs 49 Advertising and marketing expense 1
Equipment rental 140
Other expenses (589)
Non-recurring items 899
Depreciation and amortisation expenses 347
Finance costs 5
Income tax (expense) / benefit 158
Discontinued operations 204
Net change -
For
per
sona
l use
onl
y
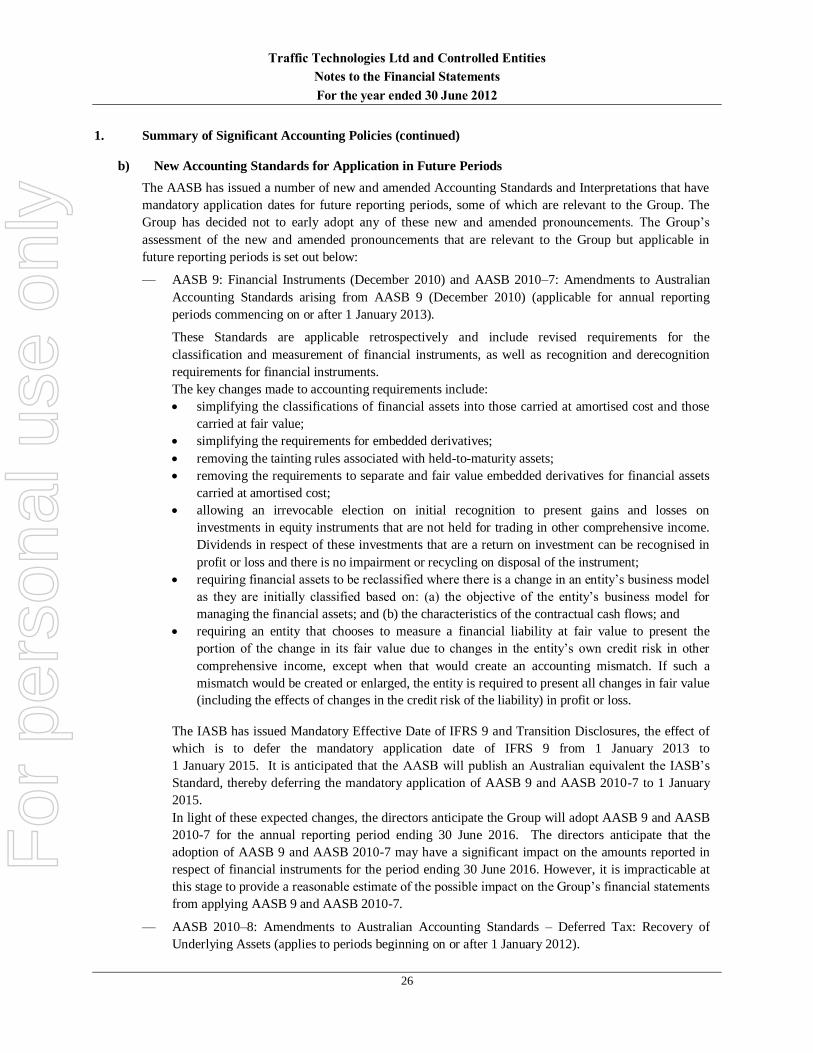
Traffic Technologies Ltd and Controlled Entities
Notes to the Financial Statements
For the year ended 30 June 2012
26
1. Summary of Significant Accounting Policies (continued)
b) New Accounting Standards for Application in Future Periods
The AASB has issued a number of new and amended Accounting Standards and Interpretations that have
mandatory application dates for future reporting periods, some of which are relevant to the Group. The
Group has decided not to early adopt any of these new and amended pronouncements. The Group’s
assessment of the new and amended pronouncements that are relevant to the Group but applicable in
future reporting periods is set out below:
— AASB 9: Financial Instruments (December 2010) and AASB 2010–7: Amendments to Australian
Accounting Standards arising from AASB 9 (December 2010) (applicable for annual reporting
periods commencing on or after 1 January 2013).
These Standards are applicable retrospectively and include revised requirements for the
classification and measurement of financial instruments, as well as recognition and derecognition
requirements for financial instruments.
The key changes made to accounting requirements include:
simplifying the classifications of financial assets into those carried at amortised cost and those
carried at fair value;
simplifying the requirements for embedded derivatives;
removing the tainting rules associated with held-to-maturity assets;
removing the requirements to separate and fair value embedded derivatives for financial assets
carried at amortised cost;
allowing an irrevocable election on initial recognition to present gains and losses on
investments in equity instruments that are not held for trading in other comprehensive income.
Dividends in respect of these investments that are a return on investment can be recognised in
profit or loss and there is no impairment or recycling on disposal of the instrument;
requiring financial assets to be reclassified where there is a change in an entity’s business model
as they are initially classified based on: (a) the objective of the entity’s business model for
managing the financial assets; and (b) the characteristics of the contractual cash flows; and
requiring an entity that chooses to measure a financial liability at fair value to present the
portion of the change in its fair value due to changes in the entity’s own credit risk in other
comprehensive income, except when that would create an accounting mismatch. If such a
mismatch would be created or enlarged, the entity is required to present all changes in fair value
(including the effects of changes in the credit risk of the liability) in profit or loss.
The IASB has issued Mandatory Effective Date of IFRS 9 and Transition Disclosures, the effect of
which is to defer the mandatory application date of IFRS 9 from 1 January 2013 to
1 January 2015. It is anticipated that the AASB will publish an Australian equivalent the IASB’s
Standard, thereby deferring the mandatory application of AASB 9 and AASB 2010-7 to 1 January
2015.
In light of these expected changes, the directors anticipate the Group will adopt AASB 9 and AASB
2010-7 for the annual reporting period ending 30 June 2016. The directors anticipate that the
adoption of AASB 9 and AASB 2010-7 may have a significant impact on the amounts reported in
respect of financial instruments for the period ending 30 June 2016. However, it is impracticable at
this stage to provide a reasonable estimate of the possible impact on the Group’s financial statements
from applying AASB 9 and AASB 2010-7.
— AASB 2010–8: Amendments to Australian Accounting Standards – Deferred Tax: Recovery of
Underlying Assets (applies to periods beginning on or after 1 January 2012).
For
per
sona
l use
onl
y

Traffic Technologies Ltd and Controlled Entities
Notes to the Financial Statements
For the year ended 30 June 2012
27
This Standard makes amendments to AASB 112: Income Taxes and incorporates Interpretation 121:
Income Taxes – Recovery of Revalued Non-Depreciable Assets into AASB 112.
Under the current AASB 112, the measurement of deferred tax liabilities and deferred tax assets
depends on whether an entity expects to recover an asset by using it or by selling it. The
amendments introduce a presumption that an investment property is recovered entirely through sale.
This presumption is rebutted if the investment property is held within a business model whose
objective is to consume substantially all of the economic benefits embodied in the investment
property over time, rather than through sale.
The amendments are not expected to significantly impact the Group.
— AASB 10: Consolidated Financial Statements, AASB 11: Joint Arrangements, AASB 12: Disclosure
of Interests in Other Entities, AASB 127: Separate Financial Statements [August 2011], AASB 128:
Investments in Associates and Joint Ventures [August 2011] and AASB 2011-7: Amendments to
Australian Accounting Standards arising from the Consolidation and Joint Arrangements Standards
(applicable for annual reporting periods commencing on or after 1 January 2013).
AASB 10 replaces parts of AASB 127 [March 2008, as amended] and Interpretation 112:
Consolidation – Special Purpose Entities. AASB 10 provides a revised definition of control and
additional application guidance so that a single control model will apply to all investees.
AASB 11 replaces AASB 131: Interests in Joint Ventures (July 2004, as amended). AASB 11
requires joint arrangements to be classified as either ‘joint operations’ (where the parties that have
joint control of the arrangement have rights to the assets and obligations for the liabilities) or ‘joint
ventures’ (where the parties that have joint control of the arrangement have rights to the net assets of
the arrangement). Joint ventures are required to adopt the equity method of accounting
(proportionate consolidation is no longer allowed).
AASB 12 contains the disclosure requirements applicable to entities that hold an interest in a
subsidiary, joint venture, joint operation or associate. AASB 12 also introduces the concept of a
‘structured entity’, replacing the ‘special purpose entity’ concept currently used in Interpretation
112, and requires specific disclosures in respect of any investments in unconsolidated structured
entities.
To facilitate the application of AASBs 10, 11 and 12, revised versions of AASB 127 and AASB 128
have also been issued.
These Standards are not expected to significantly impact the Group’s financial statements.
— AASB 13: Fair Value Measurement and AASB 2011-8: Amendments to Australian Accounting
Standards arising from AASB 13 (applicable for annual reporting periods commencing on or after
1 January 2013).
AASB 13 defines fair value, sets out in a single Standard a framework for measuring fair value, and
requires disclosures about fair value measurement.
AASB 13 requires:
inputs to all fair value measurements to be categorised in accordance with a fair value
hierarchy; and
enhanced disclosures regarding all assets and liabilities (including, but not limited to, financial
assets and financial liabilities) measured at fair value.
These Standards are expected to result in more detailed fair value disclosures, but are not expected
to significantly impact the amounts recognised in the Group’s financial statements.
AASB 2011-4: Amendments to Australian Accounting Standards to Remove Individual Key
For
per
sona
l use
onl
y

Traffic Technologies Ltd and Controlled Entities
Notes to the Financial Statements
For the year ended 30 June 2012
28
Management Personnel Disclosure Requirements (applicable for annual reporting periods beginning
on or after 1 July 2013)
This Standard makes amendments to AASB 124: Related Party Disclosures to remove the individual
key management personnel disclosure requirements (including paragraphs Aus29.1 to Aus29.9.3).
These amendments serve a number of purposes, including furthering trans-Tasman convergence,
removing differences from IFRSs, and avoiding any potential confusion with the equivalent
Corporations Act 2001 disclosure requirements.
This Standard is not expected to significantly impact the Group’s financial report as a whole
because:
some of the disclosures removed from AASB 124 will continue to be required under section
300A of the Corporations Act 2001, which is applicable to the Group; and
AASB 2011-4 does not affect the related party disclosure requirements in AASB 124
applicable to all reporting entities, and some of these requirements require similar disclosures
to those removed by AASB 2011-4.
— AASB 2011-9: Amendments to Australian Accounting Standards - Presentation of Items of Other
Comprehensive Income (applicable for annual reporting periods commencing on or after 1 July
2012).
The main change arising from this Standard is the requirement for entities to group items presented
in other comprehensive income (OCI) on the basis of whether they are potentially reclassifiable to
profit or loss subsequently.
This Standard affects presentation only and is therefore not expected to significantly impact the
Group’s financial statements.
— AASB 119: Employee Benefits [September 2011] and AASB 2011-10: Amendments to Australian
Accounting Standards arising from AASB 119 (applicable for annual reporting periods commencing
on or after 1 January 2013)
These Standards introduce a number of changes to accounting and presentation of defined benefit
plans. The Group does not have any defined benefit plans and so is not impacted by the amendment.
AASB 119 [September 2011] also includes changes to:
(a) require only those benefits that are expected to be settled wholly before twelve months after the
end of the annual reporting period in which the employees render the related service to be classified
as short-term employee benefits. All other employee benefits are to be classified as either other long-
term employee benefits, post-employment benefits or termination benefits , as appropriate; and
(b) the accounting for termination benefits that require an entity to recognise an obligation for such
benefits at the earlier of:
(i) for an offer that may be withdrawn – when the employee accepts;
(ii) for an offer that cannot be withdrawn – when the offer is communicated to affected
employees; and
(iii) where the termination is associated with a restructuring of activities under AASB 137 and if
earlier than the first two conditions – when the related restructuring costs are recognised.
These Standards are not expected to significantly impact the Group’s financial statements.
— AASB 2012-3: Amendments to Australian Accounting Standards – Offsetting Financial Assets and
Financial Liabilities [AASB 132] (applicable for annual reporting periods commencing on or after
For
per
sona
l use
onl
y

Traffic Technologies Ltd and Controlled Entities
Notes to the Financial Statements
For the year ended 30 June 2012
29
1 January 2014)
This Amending Standard adds application guidance to
AASB 132: Financial Instruments: Presentation to address potential inconsistencies identified in
applying some of the offsetting criteria of AASB 132, including clarifying the meaning of “currently
has a legally enforceable right of set-off” and that some gross settlement systems may be considered
equivalent to net settlement.
This Standard is not expected to significantly impact the Group’s financial statements.
— AASB 2012-2: Amendments to Australian Accounting Standards – Disclosures – Offsetting
Financial Assets and Financial Liabilities [AASB 7 & AASB 132] (applicable for annual reporting
periods commencing on or after 1 January 2013)
AASB 2012-3 principally amends AASB 7: Financial Instruments: Disclosures to require entities to
include information that will enable users of their financial statements to evaluate the effect or
potential effect of netting arrangements, including rights of set-off associated with the entity’s
recognised financial assets and recognised financial liabilities, on the entity’s financial position.
This Standard is not expected to significantly impact the Group’s financial statements.
AASB 2012-5: Amendments to Australian Accounting Standards arising from Annual
Improvements 2009-2011 Cycle [AASBs 1, 101, 116, 132 & 134 and Interpretation 2] (applicable
for annual reporting periods commencing on or after 1 January 2013)
This Amending Standard amends a number of Australian Accounting Standards as a consequence of
the issuance of Annual Improvements to IFRSs 2009-2011 Cycle by the International Accounting
Standards Board, including:
AASB 1: First-time Adoption of Australian Accounting Standards to clarify the requirements
in respect of the application of AASB 1 when an entity discontinues and then resumes applying
Australian Accounting Standards;
AASB 101: Presentation of Financial Statements and
AASB 134: Interim Financial Reporting to clarify the requirements for presenting comparative
information;
AASB 116: Property, Plant and Equipment to clarify the accounting treatment of spare parts,
stand-by equipment and servicing equipment;
AASB 132 and Interpretation 2: Members’ Shares in Co-operative Entities and Similar
Instruments to clarify the accounting treatment of any tax effect of a distribution to holders of
equity instruments; and
AASB 134 to facilitate consistency between the measures of total assets and liabilities an
entity reports for its segments in its interim and annual financial statements.
This Standard is not expected to significantly impact the Group’s financial statements.
For
per
sona
l use
onl
y

Traffic Technologies Ltd and Controlled Entities
Notes to the Financial Statements
For the year ended 30 June 2012
30
1. Summary of Significant Accounting Policies (continued)
c) Basis of consolidation
The consolidated financial statements comprise the financial statements of Traffic Technologies Ltd and
its subsidiaries as at 30 June each year (the Group).
Subsidiaries are all those entities over which the Group has the power to govern the financial and
operating policies so as to obtain benefits from their activities. The existence and effect of potential
voting rights that are currently exercisable or convertible are considered when assessing whether a Group
controls another entity. The financial statements of the subsidiaries are prepared for the same reporting
period as the parent company, using consistent accounting policies. In preparing the consolidated
financial statements, all intercompany balances and transactions, income and expenses and profit and
losses resulting from intra-group transactions have been eliminated in full. Subsidiaries are fully
consolidated from the date on which control is obtained by the Group and cease to be consolidated from
the date on which control is transferred out of the Group.
d) Significant accounting judgements, estimates and assumptions
The preparation of the financial statements requires management to make judgements, estimates and
assumptions that affect the reported amounts in the financial statements. Management continually
evaluates its judgements and estimates in relation to assets, liabilities, contingent liabilities, revenue and
expenses. Management bases its judgements and estimates on historical experience and other various
factors it believes to be reasonable under the circumstances, the result of which form the basis of the
carrying values of assets and liabilities that are not readily apparent from other sources. Actual results
may differ from these estimates under different assumptions and conditions.
Management has identified the following critical accounting policies for which significant judgements,
estimates and assumptions are made. Actual results may differ from these estimates under different
assumptions and conditions and may materially affect financial results or the financial position reported in
future periods.
Further details of the nature of these assumptions and conditions may be found in the relevant notes to the
financial statements.
Significant accounting judgements
Impairment of non-financial assets other than goodwill
The Group assesses impairment of all assets at each reporting date by evaluating conditions specific to the
Group and to the particular asset that may lead to impairment. These include product and manufacturing
performance, technology, economic and political environments and future product and service delivery
expectations. If an impairment trigger exists the recoverable amount of the asset is determined. This
involves value in use calculations, which incorporate a number of key estimates and assumptions.
For
per
sona
l use
onl
y
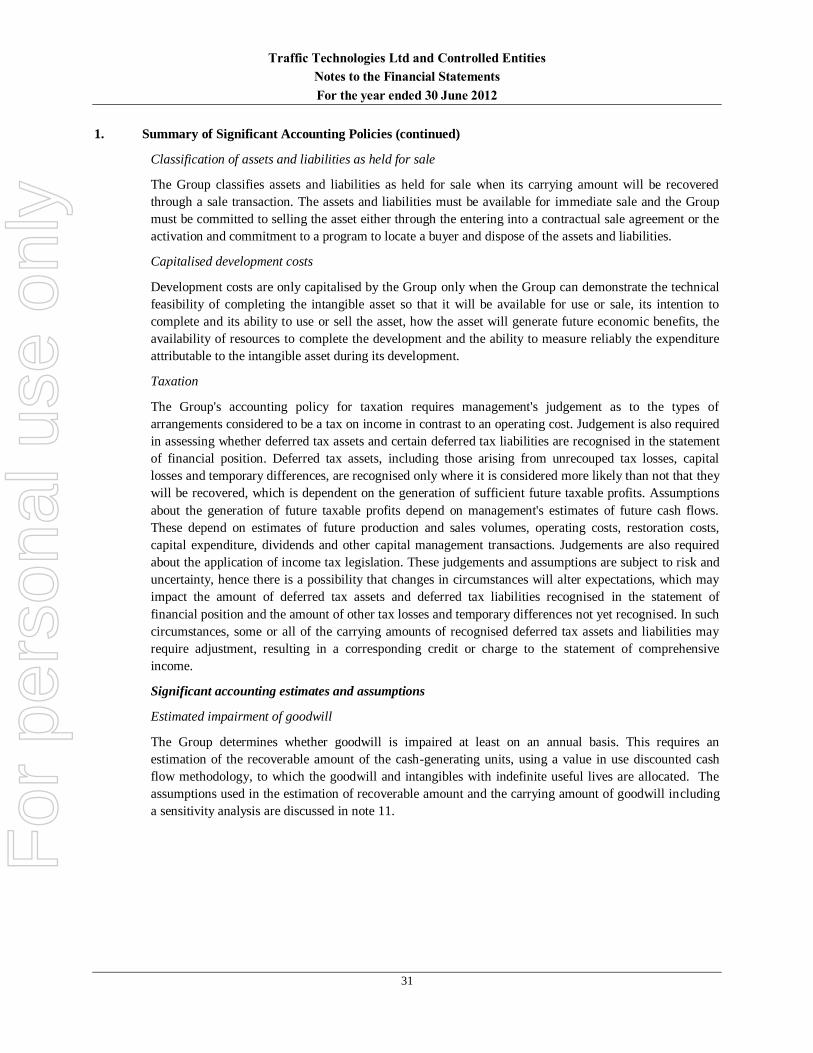
Traffic Technologies Ltd and Controlled Entities
Notes to the Financial Statements
For the year ended 30 June 2012
31
1. Summary of Significant Accounting Policies (continued)
Classification of assets and liabilities as held for sale
The Group classifies assets and liabilities as held for sale when its carrying amount will be recovered
through a sale transaction. The assets and liabilities must be available for immediate sale and the Group
must be committed to selling the asset either through the entering into a contractual sale agreement or the
activation and commitment to a program to locate a buyer and dispose of the assets and liabilities.
Capitalised development costs
Development costs are only capitalised by the Group only when the Group can demonstrate the technical
feasibility of completing the intangible asset so that it will be available for use or sale, its intention to
complete and its ability to use or sell the asset, how the asset will generate future economic benefits, the
availability of resources to complete the development and the ability to measure reliably the expenditure
attributable to the intangible asset during its development.
Taxation
The Group's accounting policy for taxation requires management's judgement as to the types of
arrangements considered to be a tax on income in contrast to an operating cost. Judgement is also required
in assessing whether deferred tax assets and certain deferred tax liabilities are recognised in the statement
of financial position. Deferred tax assets, including those arising from unrecouped tax losses, capital
losses and temporary differences, are recognised only where it is considered more likely than not that they
will be recovered, which is dependent on the generation of sufficient future taxable profits. Assumptions
about the generation of future taxable profits depend on management's estimates of future cash flows.
These depend on estimates of future production and sales volumes, operating costs, restoration costs,
capital expenditure, dividends and other capital management transactions. Judgements are also required
about the application of income tax legislation. These judgements and assumptions are subject to risk and
uncertainty, hence there is a possibility that changes in circumstances will alter expectations, which may
impact the amount of deferred tax assets and deferred tax liabilities recognised in the statement of
financial position and the amount of other tax losses and temporary differences not yet recognised. In such
circumstances, some or all of the carrying amounts of recognised deferred tax assets and liabilities may
require adjustment, resulting in a corresponding credit or charge to the statement of comprehensive
income.
Significant accounting estimates and assumptions
Estimated impairment of goodwill
The Group determines whether goodwill is impaired at least on an annual basis. This requires an
estimation of the recoverable amount of the cash-generating units, using a value in use discounted cash
flow methodology, to which the goodwill and intangibles with indefinite useful lives are allocated. The
assumptions used in the estimation of recoverable amount and the carrying amount of goodwill including
a sensitivity analysis are discussed in note 11.
F
or p
erso
nal u
se o
nly

Traffic Technologies Ltd and Controlled Entities
Notes to the Financial Statements
For the year ended 30 June 2012
32
1. Summary of Significant Accounting Policies (continued)
Long service leave provision
As discussed in note 1(s), the liability for long service leave is recognised and measured at the present
value of the estimated future cash flows to be made in respect of all employees at balance date. In
determining the present value of the liability, attrition rates and pay increases through inflation and
promotion have been taken into account.
Allowance for impairment loss on receivables
Where receivables are outstanding beyond the normal trading terms, the likelihood of recovery of these
receivables is assessed by management. Debts that are considered to be uncollectible are written off when
identified.
Estimation of useful lives of assets
The estimation of useful lives of assets has been based on historical experience (for plant and equipment),
lease terms (for leased equipment) and turnover policies (for motor vehicles). In addition, the condition of
assets is assessed at least once a year and considered against the remaining useful life. Adjustments to
useful life are made when considered necessary. Depreciation charges are disclosed in note 10.
Maintenance warranty
In determining the level of the provision required for warranties, the Group has made judgements in
respect of the expected performance of the products and any liability resulting from installation works.
Historical experience and current knowledge of the performance of products has been used in determining
this provision. The related carrying amounts are disclosed in note 14.
e) Revenue recognition
Revenue is recognised and measured at the fair value of the consideration received or receivable to the
extent that it is probable that the economic benefits will flow to the Group and the revenue can be reliably
measured. The following specific recognition criteria must be met before revenue is recognised:
(i) Sale of goods
Revenue from the sale of goods is recognised when there is persuasive evidence, usually in the form of an
executed sales agreement at the time of delivery of the goods to customer, indicating that there has been a
transfer of risks and rewards to the customer, no further work or processing is required, the quantity and
quality of the goods has been determined, the price is fixed and generally title has passed (for shipped
goods this is the bill of lading date).
(ii) Rendering of services
Revenue is recognised by reference to the stage of completion of a contract. Stage of completion is
measured by reference to labour hours incurred to date as a percentage of total estimated labour hours for
each contract. When the contract outcome cannot be estimated reliably, revenue is recognised only to the
extent of the expenses recognised that are recoverable.
For
per
sona
l use
onl
y

Traffic Technologies Ltd and Controlled Entities
Notes to the Financial Statements
For the year ended 30 June 2012
33
1. Summary of Significant Accounting Policies (continued)
(iii) Interest revenue
Interest revenue is recognised as interest accrues using the effective interest method. This is a method of
calculating the amortised cost of a financial asset and allocating the interest income over the relevant
period using the effective interest rate, which is the rate that exactly discounts estimated future cash
receipts through the expected life of the financial asset to the net carrying amount of the financial asset.
f) Leases
The determination of whether an arrangement is or contains a lease is based on the substance of the
arrangement and requires an assessment of whether the fulfilment of the arrangement is dependent on the
use of a specific asset or assets and the arrangement conveys a right to use the asset.
Group as a lessee
Finance leases, which transfer to the Group substantially all the risks and benefits incidental to ownership
of the leased item, are capitalised at the inception of the lease at the fair value of the leased property or, if
lower, at the present value of the minimum lease payments. Lease payments are apportioned between the
finance charges and reduction of the lease liability so as to achieve a constant rate of interest on the
remaining balance of the liability. Finance charges are recognised as an expense.
Capitalised leased assets are depreciated over the shorter of the estimated useful life of the asset and the
lease term if there is no reasonable certainty that the Group will obtain ownership by the end of the lease
term.
Operating lease payments are recognised as an expense on a straight-line basis over the lease term. Lease
incentives are recognised as an integral part of the total lease expense.
g) Cash and cash equivalents
Cash and cash equivalents in the statement of financial position comprise cash at bank and in hand and
short-term deposits with an original maturity of three months or less.
For the purposes of the statement of cash flows, cash and cash equivalents consist of cash and cash
equivalents as defined above, net of outstanding bank overdrafts.
h) Trade and other receivables
Trade receivables, which generally have 30 day terms, are recognised initially at fair value and
subsequently measured at amortised cost using the effective interest rate method, less an allowance for
any uncollectible amounts.
Collectability of trade receivables is reviewed on an ongoing basis. Debts that are known to be
uncollectible are written off when identified. An allowance for doubtful debts is raised when there is
objective evidence that the Group may not be able to collect the receivable. Financial difficulties of the
debtor, default payments or debts more than 90-120 days overdue are considered objective evidence of
impairment. The amount of the impairment loss is the difference between the receivables carrying amount
and the present value of its estimated future cash flows, discounted at the original effective interest rate.
For
per
sona
l use
onl
y

Traffic Technologies Ltd and Controlled Entities
Notes to the Financial Statements
For the year ended 30 June 2012
34
1. Summary of Significant Accounting Policies (continued)
i) Inventories
Inventories including raw materials, work-in-progress and finished goods are valued at the lower of cost
and net realisable value.
Costs incurred in bringing each product to its present location and condition are accounted for as follows:
Raw materials – purchase cost on a first-in, first-out basis. The cost of purchase comprises the
purchase price, import duties and other taxes (other than those subsequently recoverable by the entity
from the taxing authorities), transport, handling and other costs directly attributable to the acquisition
of raw materials and volume discounts and rebates.
Finished goods and work-in-progress – cost of direct materials and labour and a proportion of
variable and fixed manufacturing overheads based on normal operating capacity but excluding
borrowing costs.
Net realisable value is the estimated selling price in the ordinary course of business, less estimated costs of
completion and the estimated costs necessary to make the sale.
j) Income tax and other taxes
Current tax assets and liabilities for the current and prior periods are measured at the amount expected to
be recovered from or paid to the taxation authorities. The tax rates and tax laws used to compute the
amount are those that are enacted or substantively enacted by the balance date.
Deferred income tax is provided on all temporary differences at the balance date between the tax bases of
assets and liabilities and their carrying amounts for financial reporting purposes.
Deferred income tax liabilities are recognised for all taxable temporary differences except:
When the deferred income tax liability arises from the initial recognition of goodwill or of an asset or
liability in a transaction that is not a business combination and that, at the time of the transaction,
affects neither the accounting profit nor taxable profit or loss; or
When the taxable temporary difference is associated with investments in subsidiaries and the timing
of the reversal of the temporary difference can be controlled and it is probable that the temporary
difference will not reverse in the foreseeable future.
Deferred income tax assets are recognised for all deductible temporary differences and unused tax losses,
to the extent that is probable that taxable profit will be available against which the deductible temporary
differences and the carry forward of unused tax credits and unused tax losses can be utilised, except:
When the deferred income tax asset relating to the deductible temporary difference arises from the
initial recognition of an asset or liability in a transaction that is not a business combination and, at the
time of the transaction, affects neither the accounting profit nor taxable profit or loss; or
When the deductible temporary difference is associated with investments in subsidiaries in which
case a deferred tax asset is only recognised to the extent that it is probable that the temporary
difference will reverse in the foreseeable future and taxable profit will be available against which the
temporary difference can be utilised.
The carrying amount of deferred income tax assets is reviewed at each balance date and reduced to the
extent that it is no longer probable that sufficient taxable profit will be available to allow all or part of the
deferred income tax asset to be utilised.
For
per
sona
l use
onl
y

Traffic Technologies Ltd and Controlled Entities
Notes to the Financial Statements
For the year ended 30 June 2012
35
1. Summary of Significant Accounting Policies (continued)
Unrecognised deferred income tax assets are reassessed at each balance date and are recognised to the
extent that it has become probable that future taxable profit will allow the deferred tax asset to be recovered.
Deferred tax assets and liabilities are measured at the tax rates that are expected to apply to the year when
the asset is realised or the liability is settled, based on tax rates (and tax laws) that have been enacted or
substantively enacted at the balance date.
Income taxes relating to items recognised directly in equity are recognised in equity.
Deferred tax assets and deferred tax liabilities are offset only if a legally enforceable right exists to set off
current tax assets against current tax liabilities and the deferred tax assets and liabilities relate to the same
taxable entity and the same taxation authority.
Tax consolidation
The Company and all its wholly owned Australian entities are part of a tax consolidated group as of 1 July
2005 under Australian taxation law.
Traffic Technologies Ltd is the head entity in the tax consolidated group. Tax expense/income, deferred tax
liabilities and deferred tax assets arising from temporary differences of the members of the tax consolidated
group are recognised in the separate financial statements of the members of the tax consolidated group
using the ‘stand alone taxpayer’ approach by reference to the carrying amounts in the separate financial
statements of each entity and the tax values applying under tax consolidation. Current tax liabilities and
assets and deferred tax assets arising from unused tax losses and relevant tax credits of the members of the
tax consolidated group are recognised by the Company (as head entity in the tax consolidated group).
Due to the existence of a tax funding arrangement between the entities in the tax consolidated group,
amounts are recognised as payable to or receivable by the Company and each member of the Group in
relation to the tax contribution amounts paid or payable between the parent entity and the other members of
the tax consolidated group in accordance with the arrangement. Further information about the tax funding
arrangement is detailed in note 4 to the financial statements. Where the tax contribution amount recognised
by each member of the tax consolidated group for a particular period is different to the aggregate of the
current tax liability or asset and any deferred tax asset arising from unused tax losses and tax credits in
respect of that period, the difference is recognised as a contribution from (or distribution to) equity
participants.
Other taxes
Revenues, expenses and assets are recognised net of the amount of Goods and Services Tax (GST) except:
When the GST incurred on a purchase of goods and services is not recoverable from the taxation
authority, in which case the GST is recognised as part of the cost of acquisition of the asset or as part of
the expense item as applicable; and
Receivables and payables, which are stated with the amount of GST included.
The net amount of GST recoverable from, or payable to, the taxation authority is included as part of
receivables or payables in the statement of financial position.
Cash flows are included in the statement of cash flows on a gross basis and the GST component of cash
flows arising from investing and financing activities, which is recoverable from, or payable to, the taxation
authority, are classified as operating cash flows.
For
per
sona
l use
onl
y

Traffic Technologies Ltd and Controlled Entities
Notes to the Financial Statements
For the year ended 30 June 2012
36
1. Summary of Significant Accounting Policies (continued)
Commitments and contingencies are disclosed net of the amount of GST recoverable from, or payable to,
the taxation authority.
k) Property, plant and equipment
Plant and equipment is stated at historical cost less accumulated depreciation and any accumulated
impairment losses. Such cost includes the cost of replacing parts that are eligible for capitalisation when the
cost of replacing the parts is incurred. Similarly, when each major inspection is performed, its cost is
recognised in the carrying amount of the plant and equipment as a replacement only if it is eligible for
capitalisation. All other repairs and maintenance are recognised in the statement of comprehensive income
as incurred.
Buildings are measured at cost less accumulated depreciation on buildings.
Depreciation is calculated on a straight-line basis over the estimated useful life of the specific assets as
follows:
2012 2011
Buildings 40 years 40 years
Leasehold improvements 10 years 10 years
Office furniture and fittings 4 to 10 years 4 to 10 years
Office furniture and fittings under finance lease 4 to 10 years 4 to 10 years
Motor vehicles 8 years 8 years
Motor vehicles under finance lease 8 years 8 years
Plant and equipment, including signage 1 to 15 years 1 to 15 years
The assets' residual values, useful lives and amortisation methods are reviewed and adjusted, if appropriate,
at each financial year end.
Derecognition
An item of property, plant and equipment is derecognised upon disposal or when no further future economic
benefits are expected from its use or disposal. Any gain or loss arising on derecognition of the asset
(calculated as the difference between the net disposal proceeds and the carrying amount of the asset) is
included in the statement of comprehensive income in the year the asset is derecognised.
l) Assets held for sale and discontinued operations
Assets are classified as held for sale and measured at the lower of their carrying amount and fair value less
costs to sell if their carrying amount will be recovered principally through a sale transaction. They are not
depreciated or amortised. For an asset to be classified as held for sale it must be available for immediate
sale in its present condition and its sale must be highly probable.
An impairment loss is recognised for any initial or subsequent write down of the asset to fair value less
costs to sell. A gain is recognised for any subsequent increases in fair value less costs to sell of an asset, but
not in excess of any cumulative impairment loss previously recognised. A gain or loss not previously
recognised by the date of the sale of the sale of the non-current asset is recognised at the date of
derecognition.
For
per
sona
l use
onl
y

Traffic Technologies Ltd and Controlled Entities
Notes to the Financial Statements
For the year ended 30 June 2012
37
1. Summary of Significant Accounting Policies (continued)
A discontinued operation is a component of the entity that has been disposed of or is classified as held for
sale and that represents a separate major line of business or geographical area of operations, is part of a
single coordinated plan to dispose of such a line of business or area of operations or is a subsidiary acquired
exclusively with a view to resale. The results of discontinued operations are presented separately in the
statement of comprehensive income and the assets and liabilities are presented separately in the statement of
financial position.
m) Goodwill
The consideration transferred in a business combination is measured at fair value, which is calculated as the
sum of the acquisition date fair values of the assets transferred by the acquirer, the liabilities incurred by the
acquirer to former owners of the acquiree and the equity issued by the acquirer and the amount of any non-
controlling interest in the acquiree. For each business combination, the acquirer measures the non-
controlling interest in the acquiree either at fair value or at the proportionate share of the acquiree's
identifiable net assets. Acquisition-related costs are expensed as incurred.
The difference between the above items and the fair value of the consideration (including the fair value of
any pre-existing investment in the acquiree) is goodwill or a discount on acquisition.
Following initial recognition, goodwill is measured at cost less any accumulated impairment losses.
Goodwill is reviewed for impairment annually or more frequently if events or changes in circumstances
indicate that the carrying value may be impaired.
For the purpose of impairment testing, goodwill acquired in a business combination is, from the acquisition
date, allocated to each of the Group’s cash-generating units, or groups of cash-generating units, that are
expected to benefit from the synergies of the combination, irrespective of whether other assets or liabilities
of the Group are assigned to those units or groups of units. Each unit or group of units to which the
goodwill is so allocated:
represents the lowest level within the Group at which the goodwill is monitored for internal
management purposes; and
is not larger than an operating segment determined in accordance with AASB 8 Segment Reporting.
Impairment is determined by assessing the recoverable amount of the cash-generating unit (group of cash-
generating units) to which the goodwill relates.
The Group performs its impairment testing as at 30 June each year using a value in use, discounted cash
flow methodology for its cash-generating units to which goodwill has been allocated. Impairment testing
may be performed at other dates where an indicator of impairment exists.
When the recoverable amount of the cash-generating unit (group of cash-generating units) is less than the
carrying amount, an impairment loss is recognised. When goodwill forms part of a cash-generating unit
(group of cash-generating units) and an operation within that unit is disposed of, the goodwill associated
with the operation disposed of is included in the carrying amount of the operation when determining the
gain or loss on disposal of the operation. Goodwill disposed of in this manner is measured based on the
relative values of the operation disposed of and the portion of the cash-generating unit retained.
Impairment losses recognised for goodwill are not subsequently reversed.
For
per
sona
l use
onl
y
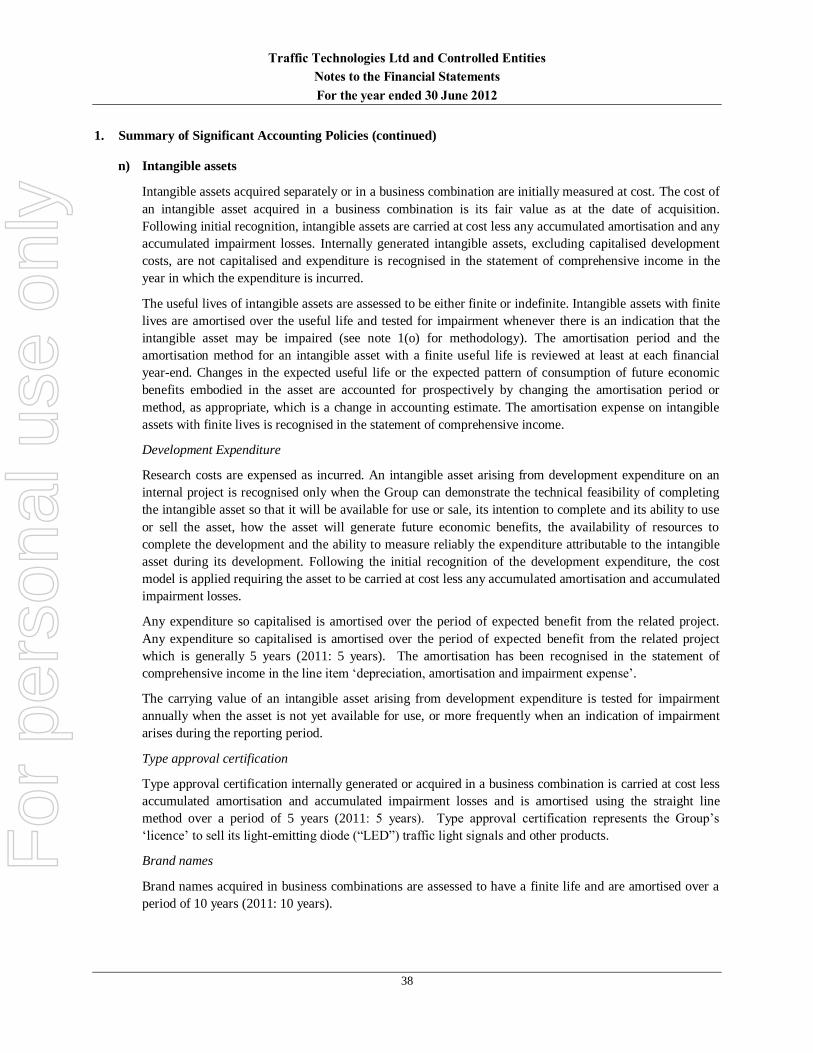
Traffic Technologies Ltd and Controlled Entities
Notes to the Financial Statements
For the year ended 30 June 2012
38
1. Summary of Significant Accounting Policies (continued)
n) Intangible assets
Intangible assets acquired separately or in a business combination are initially measured at cost. The cost of
an intangible asset acquired in a business combination is its fair value as at the date of acquisition.
Following initial recognition, intangible assets are carried at cost less any accumulated amortisation and any
accumulated impairment losses. Internally generated intangible assets, excluding capitalised development
costs, are not capitalised and expenditure is recognised in the statement of comprehensive income in the
year in which the expenditure is incurred.
The useful lives of intangible assets are assessed to be either finite or indefinite. Intangible assets with finite
lives are amortised over the useful life and tested for impairment whenever there is an indication that the
intangible asset may be impaired (see note 1(o) for methodology). The amortisation period and the
amortisation method for an intangible asset with a finite useful life is reviewed at least at each financial
year-end. Changes in the expected useful life or the expected pattern of consumption of future economic
benefits embodied in the asset are accounted for prospectively by changing the amortisation period or
method, as appropriate, which is a change in accounting estimate. The amortisation expense on intangible
assets with finite lives is recognised in the statement of comprehensive income.
Development Expenditure
Research costs are expensed as incurred. An intangible asset arising from development expenditure on an
internal project is recognised only when the Group can demonstrate the technical feasibility of completing
the intangible asset so that it will be available for use or sale, its intention to complete and its ability to use
or sell the asset, how the asset will generate future economic benefits, the availability of resources to
complete the development and the ability to measure reliably the expenditure attributable to the intangible
asset during its development. Following the initial recognition of the development expenditure, the cost
model is applied requiring the asset to be carried at cost less any accumulated amortisation and accumulated
impairment losses.
Any expenditure so capitalised is amortised over the period of expected benefit from the related project.
Any expenditure so capitalised is amortised over the period of expected benefit from the related project
which is generally 5 years (2011: 5 years). The amortisation has been recognised in the statement of
comprehensive income in the line item ‘depreciation, amortisation and impairment expense’.
The carrying value of an intangible asset arising from development expenditure is tested for impairment
annually when the asset is not yet available for use, or more frequently when an indication of impairment
arises during the reporting period.
Type approval certification
Type approval certification internally generated or acquired in a business combination is carried at cost less
accumulated amortisation and accumulated impairment losses and is amortised using the straight line
method over a period of 5 years (2011: 5 years). Type approval certification represents the Group’s
‘licence’ to sell its light-emitting diode (“LED”) traffic light signals and other products.
Brand names
Brand names acquired in business combinations are assessed to have a finite life and are amortised over a
period of 10 years (2011: 10 years).
For
per
sona
l use
onl
y

Traffic Technologies Ltd and Controlled Entities
Notes to the Financial Statements
For the year ended 30 June 2012
39
1. Summary of Significant Accounting Policies (continued)
Patents and trademarks
Patents and trademarks acquired separately or in a business combination are initially measured at cost. The
cost of an intangible asset acquired in a business combination is its fair value as at the date of acquisition.
Following initial recognition, intangible assets are carried at cost less any accumulated amortisation and any
accumulated impairment losses.
Patents and trademarks are amortised on a straight line basis over a period of 3-10 years (2011: 3-10 years).
Customer contracts and relationships
Customer contracts and relationships acquired in a business combination are carried at cost less
accumulated amortisation and accumulated impairment losses. These intangible assets have been assessed
as having a finite life and are amortised using the straight line method over their existing contract life and
existing customer base. The amortisation has been recognised in the statement of comprehensive income in
the line item ‘depreciation, amortisation and impairment expense’.
Software development
Purchased software development is assessed to have a finite life and is amortised over a period of 1-4 years
(2011: 1-4 years).
o) Impairment of non-financial assets other than goodwill
Intangible assets that have an indefinite useful life are not subject to amortisation and are tested annually for
impairment, or more frequently if events or changes in circumstances indicate that they might be impaired.
Other assets are tested for impairment whenever events or changes in circumstances indicate that the
carrying amount may not be recoverable.
The Group conducts an annual internal review of asset values, which is used as a source of information to
assess for any indicators of impairment. External factors, such as changes in expected future processes,
technology and economic conditions, are also monitored to assess for indicators of impairment. If any
indication of impairment exists, an estimate of the asset's recoverable amount is calculated.
An impairment loss is recognised for the amount by which the asset's carrying amount exceeds its
recoverable amount. Recoverable amount is the higher of an asset's fair value less costs to sell and value in
use. For the purposes of assessing impairment, assets are grouped at the lowest levels for which there are
separately identifiable cash inflows that are largely independent of the cash inflows from other assets or
groups of assets (cash-generating units). Non-financial assets other than goodwill that have suffered an
impairment are tested for possible reversal of the impairment whenever events or changes in circumstances
indicate that the impairment may have reversed.
p) Trade and other payables
Trade and other payables are carried at amortised cost due to their short term nature and are not discounted.
They represent liabilities for goods and services provided to the Group prior to the end of the financial year
that are unpaid and arise when the Group becomes obliged to make future payments in respect of the
purchase of these goods and services. The amounts are unsecured and are usually paid within 60 days of
recognition.
For
per
sona
l use
onl
y

Traffic Technologies Ltd and Controlled Entities
Notes to the Financial Statements
For the year ended 30 June 2012
40
1. Summary of Significant Accounting Policies (continued)
q) Interest bearing loans and borrowings
All loans and borrowings are initially recognised at the fair value of the consideration received less directly
attributable transaction costs. After initial recognition, interest bearing loans and borrowings are
subsequently measured at amortised cost using the effective interest rate method. Fees paid on the
establishment of loan facilities that are yield related are included as part of the carrying amount of the loans
and borrowings.
Borrowings are classified as current liabilities unless the Group has an unconditional right to defer
settlement of the liability for at least 12 months after balance date.
r) Derivative financial instruments and hedging
The Group uses derivative financial instruments to hedge its interest rate risk exposures, including interest
rate swaps and interest rate caps.
Derivatives are initially recognised at fair value at the date a derivative contract is entered into and are
subsequently remeasured to their fair value at each reporting date. The resulting gain or loss is recognised in
the statement of comprehensive income immediately.
The fair values of forward currency contracts are calculated by reference to current forward exchange rates
for contracts with similar maturity profiles. The fair values of interest rate swap contracts and interest rate
cap contracts are determined by reference to market values for similar instruments.
s) Provisions and employee benefits
Provisions are recognised when the Group has a present obligation (legal or constructive) as a result of a
past event, it is probable that an outflow of resources embodying economic benefits will be required to
settle the obligation and a reliable estimate can be made of the amount of the obligation.
When the Group expects some or all of a provision to be reimbursed, for example under an insurance
contract, the reimbursement is recognised as a separate asset but only when the reimbursement is virtually
certain. The expense relating to any provision is presented in the statement of comprehensive income net of
any reimbursement.
Provisions are measured at the present value of management's best estimate of the expenditure required to
settle the present obligation at balance date using a discounted cash flow methodology. The risks specific to
the provision are factored into the cash flows. If the effect of the time value of money is material,
provisions are discounted using a current pre-tax rate that reflects the time value of money and the risks
specific to the liability. The increase in the provision resulting from the passage of time is recognised in
finance costs.
For
per
sona
l use
onl
y
Traffic Technologies Ltd and Controlled Entities
Notes to the Financial Statements
For the year ended 30 June 2012
41
1. Summary of Significant Accounting Policies (continued)
Employee leave benefits
(i) Wages, salaries, annual leave and sick leave
Liabilities for wages and salaries, including non-monetary benefits and annual leave expected to be settled
within 12 months of the reporting date are recognised in current payroll liabilities (see note 12) and current
provisions (see note 14) in respect of employees’ services up to the balance date. They are measured at the
amounts expected to be paid when the liabilities are settled. Liabilities for non-accumulating sick leave are
recognised when the leave is taken and are measured at the rates paid or payable.
(ii) Long service leave
The liability for long service leave is recognised in the provision for employee benefits and is measured as
the present value of expected future payments to be made in respect of services provided by employees up
to the balance date. Consideration is given to expected future wage and salary levels, experience of
employee departures and periods of service. Expected future payments are discounted using market yields at
the balance date on national government bonds with terms to maturity and currencies that match, as closely
as possible, the estimated future cash outflows.
t) Foreign currency translation
(i) Functional and presentation currency
The individual financial statements of each Group entity are presented in the currency of the primary
economic environment in which the entity operates (its functional currency). The consolidated financial
statements, are presented in Australian dollars, which is the functional and presentation currency of the
Group.
(ii) Transactions & balances
Transactions in foreign currencies are initially recorded in the functional currency by applying the exchange
rates ruling at the date of the transaction. Monetary assets and liabilities denominated in foreign currencies
are retranslated at the rate of exchange ruling at the balance date. Non-monetary items that are measured in
terms of historical cost in a foreign currency are translated using the exchange rate as at the date of the
initial transaction. Non-monetary items measured at fair value in a foreign currency are translated using the
exchange rates at the date when the fair value was determined.
u) Share-based payment transactions
Equity settled transactions
The Group provides benefits to employees (including key management personnel) in the form of share-
based payments, whereby employees render services in exchange for shares or rights over shares (equity-
settled transactions).
The cost of these equity-settled transactions with employees is measured by reference to the fair value of the
equity instruments at the date at which they are granted.
The cost of equity-settled transactions is recognised, together with a corresponding increase in equity, over
the period in which the performance and/or service conditions are fulfilled (the vesting period), ending on
the date on which the relevant employees become fully entitled to the award (the vesting date).
The charge to the statement of comprehensive income for the period is the cumulative amount as calculated
above less the amounts already charged in previous periods. There is a corresponding entry to equity.
For
per
sona
l use
onl
y

Traffic Technologies Ltd and Controlled Entities
Notes to the Financial Statements
For the year ended 30 June 2012
42
1. Summary of Significant Accounting Policies (continued)
v) Contributed equity
Convertible non-cumulative redeemable preference shares
The component of convertible non-cumulative redeemable preference shares that exhibits characteristics of
a liability is recognised as a liability in the statement of financial position, net of transaction costs.
On issuance of the convertible redeemable preference shares, the fair value of the liability component is
determined using a market rate for an equivalent non-convertible bond and this amount is carried as a long-
term liability on the amortised cost basis until extinguished on conversion or redemption.
The remainder of the proceeds is allocated to the conversion option that is recognised and included in
shareholders’ equity, net of transaction costs. The carrying amount of the conversion option is not re-
measured in subsequent years.
Ordinary Shares
Ordinary shares are classified as contributed equity. Incremental costs directly attributable to the issue of
new shares or options are shown in equity as a deduction, net of tax, from the proceeds.
w) Earnings per share
Basic earnings per share is calculated as net profit/loss attributable to members of the parent entity, adjusted
to exclude any costs of servicing equity (other than dividends) and preference share dividends, divided by
the weighted average number of ordinary shares.
Diluted earnings per share is calculated as net profit/loss attributable to members of the parent entity,
adjusted for:
costs of servicing equity (other than dividends) and preference share dividends;
the after tax effect of dividends and interest associated with dilutive potential ordinary shares that have
been recognised as expenses; and
other non-discretionary changes in revenues or expenses during the period that would result from the
dilution of potential ordinary shares, divided by the weighted average number of ordinary shares and
dilutive potential ordinary shares, adjusted for any bonus element.
x) Business combinations
Business combinations are accounted for using the acquisition method. The acquisition method of
accounting involves recognising at acquisition date, separately from goodwill, the identifiable assets
acquired, the liabilities assumed and any non-controlling interest in the acquiree. The identifiable assets
acquired and the liabilities assumed are measured at their acquisition date fair values.
When the Group acquires a business, it assesses the financial assets and liabilities assumed for appropriate
classification and designation in accordance with the contractual terms, economic conditions, the Group’s
operating or accounting policies and other pertinent conditions as at the acquisition date. If the business
combination is achieved in stages, the acquisition date fair value of the acquirer's previously held equity
interest in the acquiree is remeasured at fair value as at the acquisition date through the statement of
comprehensive income.
Any contingent consideration to be transferred by the acquirer will be recognised at fair value at the
acquisition date. Subsequent changes to the fair value of the contingent consideration which is deemed to be
an asset or liability will be recognised in accordance with AASB 139 in the statement of comprehensive
income. If the contingent consideration is classified as equity, it will not be remeasured.
For
per
sona
l use
onl
y
Traffic Technologies Ltd and Controlled Entities
Notes to the Financial Statements
For the year ended 30 June 2012
43
1. Summary of Significant Accounting Policies (continued)
y) Operating segments
An operating segment is a component of an entity that engages in business activities from which it may earn
revenues and incur expenses (including revenues and expenses relating to transactions with other
components of the same entity), whose operating results are regularly reviewed by the entity's chief
operating decision maker to make decisions about resources to be allocated to the segment and assess its
performance and for which discrete financial information is available. Management will also consider other
factors in determining operating segments such as the existence of a line manager and the level of segment
information presented to the Board of Directors.
Operating segments have been identified based on the information provided to the chief operating decision
maker. The Group aggregates two or more operating segments when they have similar economic
characteristics and the segments are similar in each of the following respects:
Nature of the products and services;
Nature of the production processes;
Type or class of customer for the products and services;
Methods used to distribute the products or provide the services; and
Nature of the regulatory environment.
Operating segments that meet the quantitative criteria as prescribed by AASB 8 are reported separately.
However, an operating segment that does not meet the quantitative criteria is still reported separately where
information about the segment would be useful to users of the financial statements. Information about other
business activities and operating segments that are below the quantitative criteria are combined and
disclosed in a separate category for “all other segments”.
For
per
sona
l use
onl
y

Traffic Technologies Ltd and Controlled Entities
Notes to the Financial Statements
For the year ended 30 June 2012
44
2. Revenues
Consolidated Consolidated
2012
$’000
2011
$’000
(a) Revenue
Continuing operations
Sale of goods 53,021 47,655
Rendering of services - 149
Bank interest receivable 44 67
53,065 47,871
Discontinued operations
Rendering of services 972 6,085
Total revenue 54,037 53,956
(b) Other income
Fair value of interest rate contracts 151 182
Net gain on disposal of fixed assets - 12
Other income 2 3
153 197
Discontinued operations - 148
Total other income 153 345
For
per
sona
l use
onl
y

Traffic Technologies Ltd and Controlled Entities
Notes to the Financial Statements
For the year ended 30 June 2012
45
3. Expenses
Consolidated Consolidated
2012
$’000
2011
$’000
(a) Employee related expenses
Wages and salaries 8,838 7,180
Superannuation (defined contribution) 955 938
Other employee benefits expense 5,437 6,992
15,230 15,110
(b) Other expenses
Administrative costs 2,104 1,394
Public company costs 399 255
2,503 1,649
(c) Depreciation, amortisation and
impairment expense
Depreciation of non-current assets:
Plant and equipment 323 325
Office furniture and fittings 80 78
Motor vehicles 98 148
Land and Buildings 9 8
Leasehold improvements 19 17
529 576
Amortisation of non-current assets:
Development costs 321 279
Type approvals 741 520
Software costs 219 236
Patents and trademarks 55 51
Brand names 48 48
1,384 1,134
Total depreciation and amortisation expense 1,913 1,710
(d) Finance costs
Amortisation of capitalised transaction costs 177 210
Bank loans and overdrafts 2,254 3,460
Lease interest 38 44
Other 17 55
Total finance costs 2,486 3,769
(e) Research and development costs
Research and development costs charged directly to
cost of sales in profit or loss 23 66
For
per
sona
l use
onl
y

Traffic Technologies Ltd and Controlled Entities
Notes to the Financial Statements
For the year ended 30 June 2012
46
4. Income Tax
Consolidated Consolidated
2012
$’000
2011
$’000
(a) Income tax expense / (benefit)
The major components of income tax expense / (benefit) are:
Statement of Comprehensive Income
Current income tax
Current income tax charge / (benefit) - -
Adjustment recognised in the current year in relation to the current
tax of prior years
-
-
Deferred income tax
Relating to origination and reversal of temporary differences (418) (454)
Derecognition of tax losses - -
Income tax expense/(benefit) reported in the statement of
comprehensive income
(418)
(454)
(b) Numerical reconciliation between aggregate tax expense
recognised in the statement of comprehensive income and tax
expense calculated per the statutory income tax rate
Accounting profit/(loss) before income tax from continuing
operations 1,472 (1,040)
Accounting (loss)/profit before income tax from discontinued
operations
(174) 1,168
1,298 128
Prima facie income tax expense / (benefit) at the Group’s statutory
income tax rate of 30% (2011: 30%)
389
38
Incidental on sale of assets 10 101
Gain on sale of fixed assets - (374)
Current losses not recognised - 868
Under provision in respect of fixed assets - 196
Over provision for income tax in prior years - (1,404)
Capitalised intangibles 285 -
Recognition of losses not previously recognised (625) -
Recoupment of losses not previously recognised (716) -
Not deductible in determining taxable profit 246 121
Aggregate income tax expense / (benefit) (411) (454)
Aggregate income tax expense / (benefit) is attributable to:
Continuing operations (418) (812) Discontinued operations 7 358
Income tax expense / (benefit) (411) (454) For
per
sona
l use
onl
y

Traffic Technologies Ltd and Controlled Entities
Notes to the Financial Statements
For the year ended 30 June 2012
47
4. Income Tax (continued)
(c) Deferred tax balances
Deferred tax assets/(liabilities) arise from the following:
30 June 2012
Consolidated
Opening
balance
$’000
Charged/
(credited) to income
$’000
Charged to
equity
$’000
Disposals
$’000
Closing balance
$’000
Temporary differences
Intangible assets (1,070) 5 - 1 (1,064)
Property, plant and
equipment 167 (68) - - 99
Employee provisions 585 112 - (2) 695
Warranty provisions 30 9 - - 39
Inventory provisions 98 (98) - - -
Doubtful debts 2 (2) - - -
Credit notes 22 (2) - (6) 14
Unclaimed share issue costs 13 (4) - - 9 Accruals 455 (97) - - 358
Capital expenditure 186 (62) - - 124
488 (207) - (7) 274
Unused tax losses - 625 - - 625
488 418 - (7) 899
30 June 2011
Consolidated
Opening
balance
$’000
Charged/
Credited) to
income
$’000
Charged to
equity
$’000
Disposals
$’000
Closing balance
$’000
Temporary differences
Intangible assets (1,035) (35) - - (1,070)
Property, plant and
equipment - 167 - - 167
Employee provisions 565 302 - (282) 585
Warranty provisions 33 (3) - - 30
Unfavourable contract provision
51
(51)
-
-
-
Inventory provisions 75 23 - - 98
Doubtful debts 7 (5) - - 2
Credit notes 130 (108) - - 22
Unclaimed share issue costs 46 (33) - - 13
Accruals 444 11 - - 455
Capital expenditure - 186 - - 186
316 454 - (282) 488
Unused tax losses - - - - -
316 454 - (282) 488
For
per
sona
l use
onl
y

Traffic Technologies Ltd and Controlled Entities
Notes to the Financial Statements
For the year ended 30 June 2012
48
4. Income Tax (continued)
Consolidated Consolidated
2012
$’000
2011
$’000
The following tax losses have not been recognised as a deferred tax asset:
Tax losses – revenue 3,555 4,930
Tax losses – capital 100 100
Total deferred tax assets 3,655 5,030
“Tax losses – revenue” are available to carry forward against future “taxable profits – revenue” (but not against capital related
profits) without expiry.
Unrecognised temporary differences
At 30 June 2012 there are no unrecognised temporary differences associated with the Group’s investment in
subsidiaries or associates as the Group has no liability for additional taxation should unremitted earnings be remitted
(2011: $nil).
(d) Tax consolidation
Traffic Technologies Ltd and its 100% owned Australian resident subsidiaries formed a tax consolidated group with
effect from 1 July 2005 and are therefore taxed as a single entity from that date. The head entity within the tax
consolidated group is Traffic Technologies Ltd. Each wholly owned subsidiary of Traffic Technologies Ltd is a
member of the tax consolidated group, as identified at note 20.
(e) Nature of tax funding and tax sharing agreements
Entities within the tax consolidated group have entered into a tax funding arrangement and a tax sharing arrangement
with the head entity. Under the terms of the tax funding arrangement, Traffic Technologies Ltd and each of the
entities in the tax consolidated group has agreed to pay a tax equivalent payment to or from the head entity, based on
the current tax liability or current tax asset of the entity. Such amounts are reflected in amounts receivable from or
payable to other entities in the tax consolidated group.
The tax sharing agreement entered into between members of the tax consolidated group provides for the
determination of the allocation of income tax liabilities between the entities should the head entity default on its tax
payment obligations or if an entity should leave the tax consolidated group. The effect of the tax sharing agreement
is that each member’s liability for the tax payable by the tax consolidated group is limited to the amount payable to
the head entity under the tax funding agreement.
For
per
sona
l use
onl
y
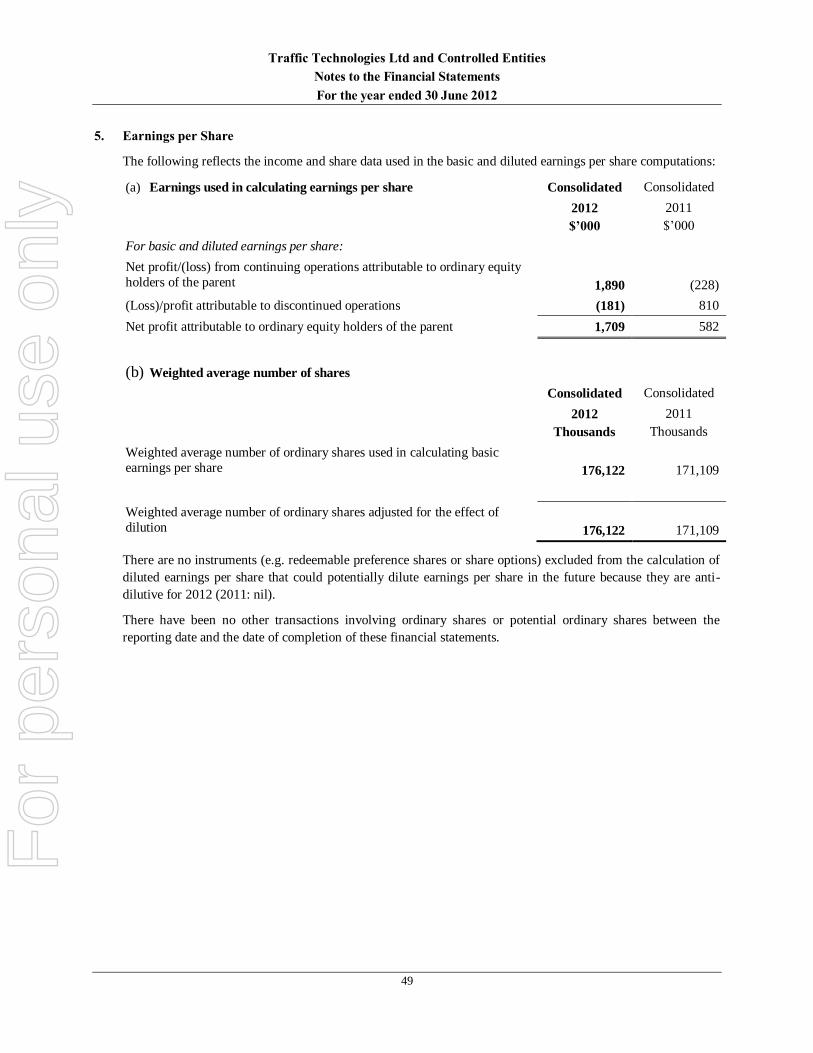
Traffic Technologies Ltd and Controlled Entities
Notes to the Financial Statements
For the year ended 30 June 2012
49
5. Earnings per Share
The following reflects the income and share data used in the basic and diluted earnings per share computations:
(a) Earnings used in calculating earnings per share Consolidated Consolidated
2012
$’000
2011
$’000
For basic and diluted earnings per share:
Net profit/(loss) from continuing operations attributable to ordinary equity
holders of the parent
1,890
(228)
(Loss)/profit attributable to discontinued operations (181) 810
Net profit attributable to ordinary equity holders of the parent 1,709 582
(b) Weighted average number of shares
Consolidated Consolidated
2012
Thousands
2011
Thousands
Weighted average number of ordinary shares used in calculating basic
earnings per share
176,122
171,109
Weighted average number of ordinary shares adjusted for the effect of
dilution
176,122
171,109
There are no instruments (e.g. redeemable preference shares or share options) excluded from the calculation of
diluted earnings per share that could potentially dilute earnings per share in the future because they are anti-
dilutive for 2012 (2011: nil).
There have been no other transactions involving ordinary shares or potential ordinary shares between the
reporting date and the date of completion of these financial statements.
For
per
sona
l use
onl
y

Traffic Technologies Ltd and Controlled Entities
Notes to the Financial Statements
For the year ended 30 June 2012
50
6. Discontinued operations
(a) Details of operations disposed
On 9 August 2010 the Group completed the sale of its Traffic Management business and assets (“Traffic
Management”), a business which involved the hiring out of traffic controllers to road authorities, contractors and
local councils.
On 20 December 2011 the Group completed the sale of its Traffic Hire business and assets (“Traffic Hire”), a
business which provided equipment hire (barrier guard and portable roadside technology) services to road traffic
authorities and construction companies. Traffic Hire has been classified as discontinued operations in the Half-Year Financial Report and the comparative period’s results restated.
The Traffic Management business and the Traffic Hire business previously comprised the Traffic Services business
segment.
(b) Financial performance of operations disposed
The results of discontinued operations for the year until disposal are presented below:
Traffic
Hire
2012
$’000
Traffic Management
2011
$’000
Traffic Hire
2011
$’000
Total
2011
$’000
Revenue 972 4,229 1,856 6,085
Other income - 1 148 149
Expenses (579) (4,556) (1,290) (5,846)
Depreciation and amortisation expenses (163) (94) (347) (441)
Earnings before income and tax from
discontinued operations
230
(420)
367
(53)
Finance costs (3) (21) (5) (26)
Profit/(loss) before tax from discontinued
operations 227 (441) 362
(79) Income tax benefit / (expense) (7) (200) (158) (358)
Profit/(loss) after tax from discontinued
operations 220 (641) 204
(437)
(Loss)/gain on sale before income tax (401) 1,247 - 1,247
Income tax expense - - - -
(Loss)/gain on sale after income tax (401) 1,247 - 1,247
(Loss)/profit from discontinued
operations (181) 606 204
810
For
per
sona
l use
onl
y

Traffic Technologies Ltd and Controlled Entities
Notes to the Financial Statements
For the year ended 30 June 2012
51
(c) Assets and liabilities and cash flow information of discontinued operations
The major classes of assets and liabilities disposed of were:
Traffic
Hire
Traffic
Management
2012
$’000
2011
$’000
Assets
Prepayments - 52 Property, plant and equipment 2,802 3,295
Intangibles - 9,626
Other financial assets - 124
Deferred tax asset - 283
Assets classified as discontinued operations 2,802 13,380
Liabilities
Other payables - 89
Finance lease liabilities - 2,514
Employee entitlements - 965
Liabilities directly associated with assets classified as discontinued operations - 3,568
Net assets attributable to discontinued operations 2,802 9,812
The net cash flows of discontinued operations are as follows:
Traffic
Hire
2012
$’000
Traffic
Management
2011
$’000
Traffic
Hire
2011
$’000
Total
2011
$’000
Operating activities 469 4,918
(103)
4,815 Investing activities 2,500 - 332 332
Financing activities (2,992) - (293) (293)
Net cash inflow / (outflow) (23) 4,918 (64) 4,854
For
per
sona
l use
onl
y

Traffic Technologies Ltd and Controlled Entities
Notes to the Financial Statements
For the year ended 30 June 2012
52
6. Discontinued operations (continued)
Traffic
Hire
Traffic
Management
Consideration received: 2012 2011
$’000 $’000
Net cash consideration 2,500 11,400
Less transaction costs (99) (341)
Less net assets disposed (2,802) (9,812)
(Loss) / gain on disposal before income tax expense (401) 1,247
Income tax expense - -
(Loss) / gain on disposal after income tax expense (401) 1,247
Net cash flow on disposal
Cash and cash equivalents consideration 2,500 11,400
Reflected in the statement of cash flows 2,500 11,400
7. Trade and Other Receivables (Current)
Consolidated Consolidated
2012
$’000
2011
$’000
Trade receivables 12,729 11,464
Allowance for impairment loss (a) (1) (8)
12,728 11,456 Prepayments 1,546 570
Other receivables 60 152
14,334 12,178
(a) Allowance for impairment loss – trade receivables
Trade receivables are non-interest bearing, are generally on 30 day terms and can vary depending on any individual
contract. An allowance for impairment loss is recognised when there is objective evidence that an individual trade
receivable is impaired. A net impairment loss of $93,000 (2011: $8,000) has been recognised by the Group. This
amount has been included in the administration costs line item, within other expenses. The amount of the allowance
for impairment loss has been measured as the difference between the carrying amount of the trade receivables and
the estimated future cash flows expected to be received from the relevant debtors.
For
per
sona
l use
onl
y
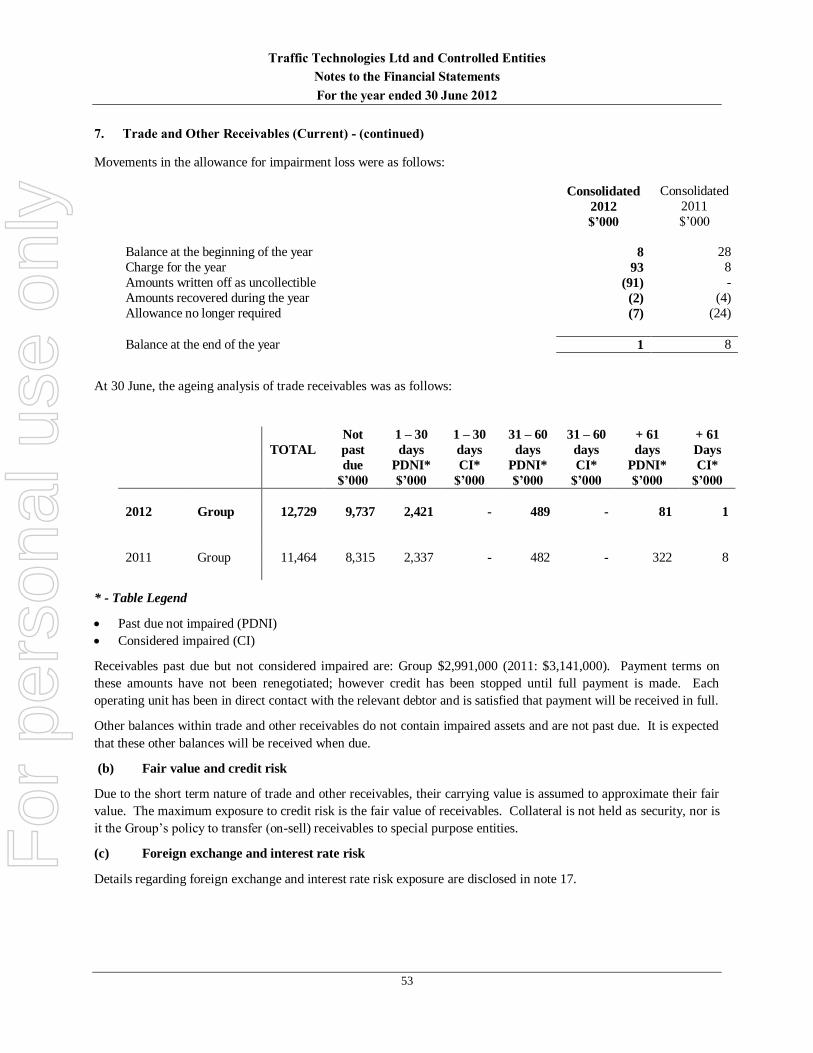
Traffic Technologies Ltd and Controlled Entities
Notes to the Financial Statements
For the year ended 30 June 2012
53
7. Trade and Other Receivables (Current) - (continued)
Movements in the allowance for impairment loss were as follows:
Consolidated Consolidated
2012
$’000
2011
$’000
Balance at the beginning of the year 8 28
Charge for the year 93 8
Amounts written off as uncollectible (91) -
Amounts recovered during the year (2) (4)
Allowance no longer required (7) (24)
Balance at the end of the year 1 8
At 30 June, the ageing analysis of trade receivables was as follows:
Not 1 – 30 1 – 30 31 – 60 31 – 60 + 61 + 61
TOTAL past days days days days days Days
due
$’000
PDNI*
$’000
CI*
$’000
PDNI*
$’000
CI*
$’000
PDNI*
$’000
CI*
$’000
2012 Group 12,729 9,737 2,421 - 489 - 81 1
2011 Group 11,464 8,315 2,337 - 482 - 322 8
* - Table Legend
Past due not impaired (PDNI)
Considered impaired (CI)
Receivables past due but not considered impaired are: Group $2,991,000 (2011: $3,141,000). Payment terms on
these amounts have not been renegotiated; however credit has been stopped until full payment is made. Each
operating unit has been in direct contact with the relevant debtor and is satisfied that payment will be received in full.
Other balances within trade and other receivables do not contain impaired assets and are not past due. It is expected
that these other balances will be received when due.
(b) Fair value and credit risk
Due to the short term nature of trade and other receivables, their carrying value is assumed to approximate their fair
value. The maximum exposure to credit risk is the fair value of receivables. Collateral is not held as security, nor is
it the Group’s policy to transfer (on-sell) receivables to special purpose entities.
(c) Foreign exchange and interest rate risk
Details regarding foreign exchange and interest rate risk exposure are disclosed in note 17.
For
per
sona
l use
onl
y

Traffic Technologies Ltd and Controlled Entities
Notes to the Financial Statements
For the year ended 30 June 2012
54
8. Inventories (Current)
Consolidated Consolidated
2012
$’000
2011
$’000
Raw materials 3,360 4,252
Work in progress 197 214
Finished goods 3,105 3,421
6,662
7,887
Inventory write-downs recognised as an expense totalled $12,000 (2011: $60,000) for the Group. During the year,
inventory write-downs of $40,000 were reversed following the disposal of associated aged/impaired inventory (2011:
$104,000). This expense/benefit is included in the statement of comprehensive income in changes in inventories of
finished goods and work in progress.
9. Other Financial Assets (Non-current)
Consolidated Consolidated
2012
$’000
2011
$’000
Listed investments, at market value 1 1
1 1
For
per
sona
l use
onl
y

Traffic Technologies Ltd and Controlled Entities
Notes to the Financial Statements
For the year ended 30 June 2012
55
10. Property, Plant and Equipment
Consolidated Consolidated
2012
$’000
2011
$’000
a) Carrying values Plant and equipment:
At cost 4,448 8,447
Accumulated depreciation* (3,027) (3,871)
Total plant and equipment 1,421 4,576
Plant and equipment under
lease:
At cost 170 170
Accumulated depreciation* (36) (5)
Total plant and equipment 134 165
Office furniture and fittings
At cost 1,137 1,090
Accumulated depreciation* (1,012) (945)
Total office furniture and fittings 125 145
Office furniture and fittings under lease
At cost 82 -
Accumulated depreciation* (12) -
Total office furniture and fittings 70 -
Motor vehicles
At cost 472 459
Accumulated depreciation* (330) (280)
Total motor vehicles 142 179
Motor vehicles under lease
At cost 436 256
Accumulated depreciation* (144) (96)
Total motor vehicles under lease 292 160
Buildings
At cost 208 200 Accumulated depreciation (55) (46)
Total land and buildings 153 154
Leasehold improvements
At cost 724 691
Accumulated depreciation* (600) (581)
Total leasehold improvements 124 110
Total property, plant and
equipment
At cost 7,677 11,313
Accumulated depreciation* (5,216) (5,824)
Total net book value 2,461 5,489
* - Includes impairment
For
per
sona
l use
onl
y
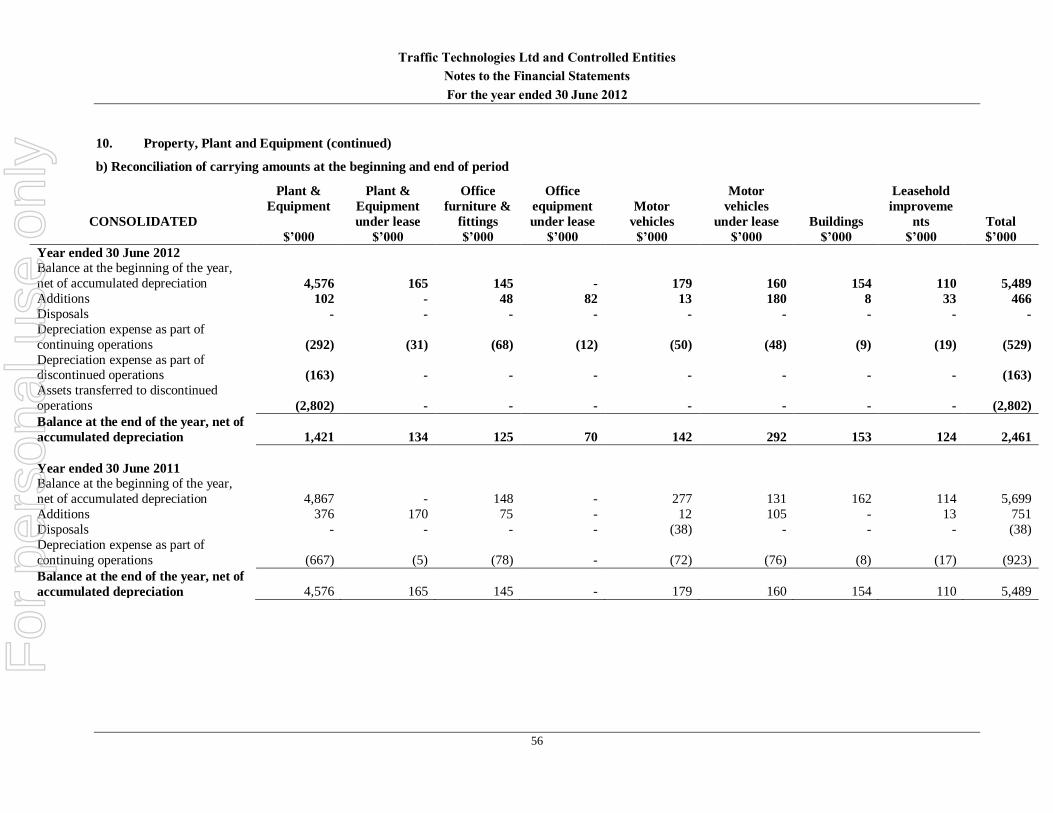
Traffic Technologies Ltd and Controlled Entities
Notes to the Financial Statements
For the year ended 30 June 2012
56
10. Property, Plant and Equipment (continued)
b) Reconciliation of carrying amounts at the beginning and end of period
CONSOLIDATED
Plant &
Equipment
$’000
Plant &
Equipment
under lease
$’000
Office
furniture &
fittings
$’000
Office
equipment
under lease
$’000
Motor
vehicles
$’000
Motor
vehicles
under lease
$’000
Buildings
$’000
Leasehold
improveme
nts
$’000
Total
$’000
Year ended 30 June 2012
Balance at the beginning of the year,
net of accumulated depreciation
4,576
165
145
-
179
160
154
110
5,489
Additions 102 - 48 82 13 180 8 33 466
Disposals - - - - - - - - -
Depreciation expense as part of
continuing operations (292) (31) (68) (12) (50) (48) (9) (19) (529)
Depreciation expense as part of discontinued operations (163) - - - - - - - (163)
Assets transferred to discontinued
operations (2,802) - - - - - - - (2,802)
Balance at the end of the year, net of
accumulated depreciation
1,421
134
125
70
142
292
153
124
2,461
Year ended 30 June 2011
Balance at the beginning of the year,
net of accumulated depreciation
4,867
-
148
-
277
131
162
114
5,699
Additions 376 170 75 - 12 105 - 13 751
Disposals - - - - (38) - - - (38)
Depreciation expense as part of
continuing operations (667) (5) (78) - (72) (76) (8) (17) (923)
Balance at the end of the year, net of
accumulated depreciation
4,576
165
145
-
179
160
154
110
5,489
For
per
sona
l use
onl
y
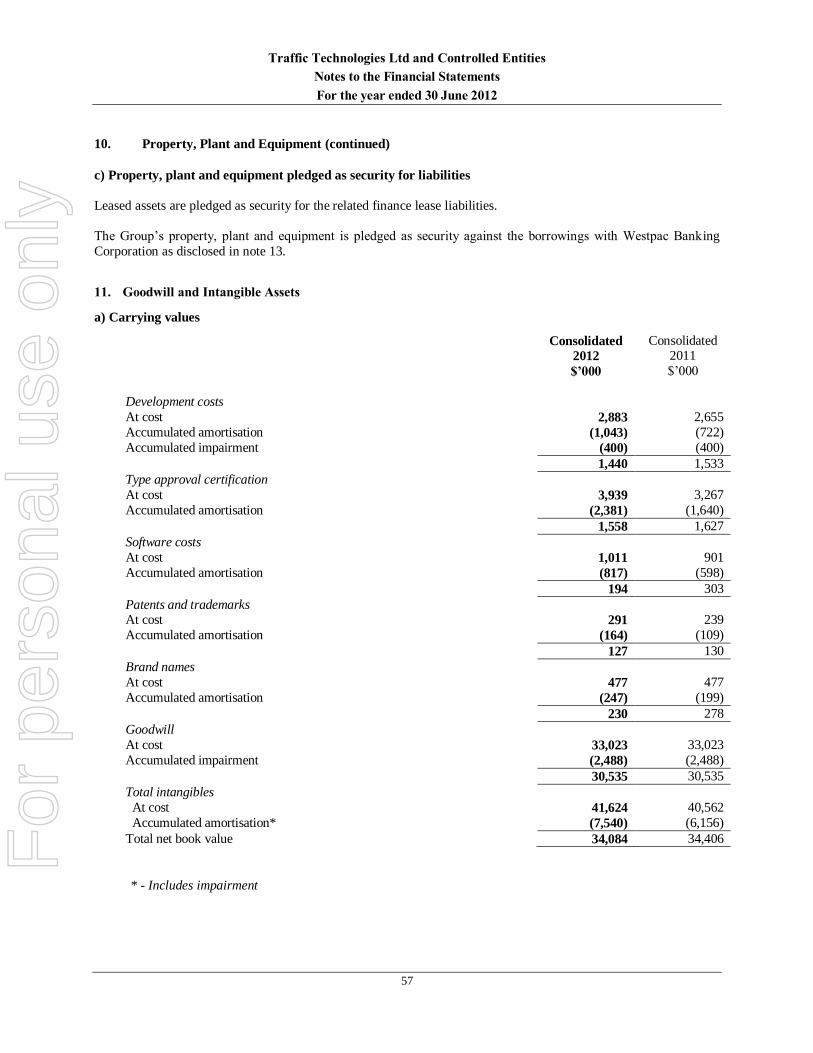
Traffic Technologies Ltd and Controlled Entities
Notes to the Financial Statements
For the year ended 30 June 2012
57
10. Property, Plant and Equipment (continued)
c) Property, plant and equipment pledged as security for liabilities
Leased assets are pledged as security for the related finance lease liabilities.
The Group’s property, plant and equipment is pledged as security against the borrowings with Westpac Banking
Corporation as disclosed in note 13.
11. Goodwill and Intangible Assets
a) Carrying values
Consolidated Consolidated 2012 2011
$’000 $’000
Development costs
At cost 2,883 2,655
Accumulated amortisation (1,043) (722)
Accumulated impairment (400) (400)
1,440 1,533
Type approval certification
At cost 3,939 3,267
Accumulated amortisation (2,381) (1,640)
1,558 1,627
Software costs
At cost 1,011 901
Accumulated amortisation (817) (598)
194 303
Patents and trademarks At cost 291 239
Accumulated amortisation (164) (109)
127 130
Brand names
At cost 477 477
Accumulated amortisation (247) (199)
230 278
Goodwill
At cost 33,023 33,023
Accumulated impairment (2,488) (2,488)
30,535 30,535
Total intangibles
At cost 41,624 40,562
Accumulated amortisation* (7,540) (6,156)
Total net book value 34,084 34,406
* - Includes impairment
For
per
sona
l use
onl
y

Traffic Technologies Ltd and Controlled Entities
Notes to the Financial Statements
For the year ended 30 June 2012
58
11. Goodwill and Intangible Assets (continued)
b) Reconciliation of carrying amounts at the beginning and end of period
Consolidated
Development
Costs*
$’000
Type
Approval
$’000
Software
Costs
$’000
Patents and
Trademarks
$’000
Brands
$’000
Goodwill
$’000
TOTAL
$’000
At 1 July 2011 net book value 1,533 1,627 303 130 278 30,535 34,406 Additions 228 672 110 52 - - 1,062
Amortisation as part of continuing
operations (321) (741) (219) (55) (48) - (1,384)
At 30 June 2012 net book value 1,440 1,558 194 127 230 30,535 34,084
At 1 July 2010 net book value 1,723 1,273 251 133 326 30,535 34,241
Additions 89 874 288 48 - - 1,299
Amortisation as part of continuing
operations (279) (520) (236) (51) (48) - (1,134)
At 30 June 2011 net book value 1,533 1,627 303 130 278 30,535 34,406
*- Internally generated intangible asset
For
per
sona
l use
onl
y

Traffic Technologies Ltd and Controlled Entities
Notes to the Financial Statements
For the year ended 30 June 2012
59
11. Goodwill and Intangible Assets (continued)
c) Description of the Group’s intangible assets and goodwill
(i) Development costs
Development costs, including type approval work-in-progress, are carried at cost less accumulated amortisation
and accumulated impairment losses. This intangible asset has been assessed as having a finite life and is
amortised using the straight line method over a period of 5 years. Once type approval projects have been
certified by the State Road Transport Authority, the costs are transferred to a separate category of intangible
assets, “type approval certification” at which point amortisation commences. The amortisation has been
recognised in the statement of comprehensive income in the line item ‘depreciation, amortisation and
impairment expense’.
(ii) Type approval certification
Type approval certification internally generated or acquired in a business combination is carried at cost less
accumulated amortisation and accumulated impairment losses and is amortised using the straight line method
over a period of 5 years. Type approval certification represents the Group’s ‘licence’ to sell its light-emitting
diode (“LED”) traffic light signals. The amortisation has been recognised in the statement of comprehensive
income in the line item ‘depreciation, amortisation and impairment expense’.
(iii) Software costs
These intangible assets have been assessed as having a finite life and are amortised using the straight line
method over a period of 1-4 years. The amortisation has been recognised in the statement of comprehensive
income in the line item ‘depreciation, amortisation and impairment expense’.
(iv) Patents and trademarks
Patents and trademarks acquired separately or in a business combination are carried at cost less accumulated
amortisation and accumulated impairment losses. These intangible assets have been assessed as having finite
lives and are amortised using the straight line method over a period of 3-10 years. The amortisation has been
recognised in the statement of comprehensive income in the line item ‘depreciation, amortisation and
impairment expense’.
(v) Brand names
After initial recognition, brand names acquired in a business combination are measured at cost less accumulated
amortisation and accumulated impairment losses. These intangible assets have been assessed as having finite
lives and are amortised using the straight line method over a period of 10 years. The amortisation has been
recognised in the statement of comprehensive income in the line item ‘depreciation, amortisation and
impairment expense’.
(vi) Goodwill
After initial recognition goodwill acquired in a business combination is measured at cost less any accumulated
impairment losses. Goodwill is not amortised but is subject to impairment testing on an annual basis or
whenever there is an indication of impairment (refer note 11(d)).
For
per
sona
l use
onl
y

Traffic Technologies Ltd and Controlled Entities
Notes to the Financial Statements
For the year ended 30 June 2012
60
11. Goodwill and Intangible Assets (continued)
d) Impairment tests for goodwill and intangible assets with indefinite useful lives
(i) Description of the cash-generating units and other relevant information
Goodwill and brand names acquired through business combinations have been allocated to the Signals cash-
generating unit for impairment testing.
The recoverable amount of the Signals cash-generating unit has been determined based on a value in use
calculation using cash flow projections based on financial budgets prepared by management covering a five
year period.
The pre tax discount rate applied to the cash flow projections is 11.0% (2011: 13.0%), which is the Group’s
WACC. The growth rate used to extrapolate the cash flows for periods beyond the five year period is 3%
(2011: 3%).
The Group believes that the growth rate selected is justified based on expected growth in demand due to
increased road infrastructure investment in line with government projections.
(ii) Carrying amount of goodwill and indefinite life intangible assets allocated to the cash-generating unit
Consolidated Consolidated
2012
$’000
2011
$’000
Signals 30,535 30,535
(iii) Key assumptions used in value in use calculations for the cash-generating unit at 30 June 2012 and 30 June 2011
The Group has based its cash flow projections on budgets prepared by management.
The cash flows have been extrapolated using the expected growth rate of 5% for the Signals cash-generating
unit (2011: 5%).
The Group believes that the growth rates selected are justified based on expected growth in demand over the
next five years in line with government projections.
It has been assumed that the current market share achieved by the Group will be maintained and that the
budgeted growth rates will be achieved through expected growth in market demand.
The projections are based on the gross margins achieved in the period immediately before the budget period,
increased for expected efficiency improvements. The Group believes that efficiency improvements of up to
5% per year can be reasonably achieved in the Signals cash generating unit.
The key assumptions used in the value in use calculations represent management’s best estimates at 30 June
2012. Management has considered the sensitivity of the value in use calculations to changes in assumptions
and does not believe there are reasonably possible changes in the key assumptions which would cause the
carrying value of the unit to materially exceed its recoverable amount. For
per
sona
l use
onl
y

Traffic Technologies Ltd and Controlled Entities
Notes to the Financial Statements
For the year ended 30 June 2012
61
12. Trade and Other Payables
Consolidated Consolidated
2012
$’000
2011
$’000
Current
Trade creditors (i) 5,850 6,645
Sundry creditors and accruals (ii) 2,391 2,477
Deferred income 5,388 1,631
Provision for legal case (see note 20) 1,200 1,200
Current Trade and Other Payables 14,829 11,953
Non-current
Sundry creditors and accruals (ii) 24 56
Non-current Trade and Other Payables 24 56
(i) Trade creditors
Trade payables are non-interest bearing and are normally settled on 60-day terms.
(ii) Sundry creditors and accruals
Current
Current sundry creditors and accruals are non-trade payables, non-interest bearing and have an average
term of 3 months.
Non-current
Non-current sundry creditors and accruals are long-term, unamortised property lease incentives ranging
from 2-5 years maturity.
(iii) Fair value
Due to the short term nature of these payables, their carrying value is assumed to approximate their fair
value.
(iv) Interest rate, foreign exchange and liquidity risk
Information regarding the effective interest rate, foreign exchange and liquidity risk exposure is set out in
note 17.
For
per
sona
l use
onl
y

Traffic Technologies Ltd and Controlled Entities
Notes to the Financial Statements
For the year ended 30 June 2012
62
13. Interest Bearing Loans and Borrowings
Consolidated Consolidated
Nominal
interest rate
Year of
maturity
2012
$’000
2011
$’000
Current borrowings
Working capital facility (secured)
(iii)
BBR + 1.25% 2013 1,500 6,400
Lease liabilities (iv) 4.7% - 18.3% 2012-2013 150 119
1,650 6,519
Non-current borrowings
Term bank facility (secured) – (i) (ii) BBR + 2.25% 2013 20,570 23,843
Lease liabilities (iv) 4.7% - 11.0% 2013-2016 366 244
20,936 24,087
All loans are denominated in Australian Dollars. The carrying amount of the Group’s current and non-
current borrowings approximates their fair value.
Reconciliation of term bank facility
Consolidated Consolidated
2012
$’000
2011
$’000
Term bank facility balance comprises:
Term bank facility – principal loan amounts payable 20,700 24,000
Less: capitalised transaction costs (130) (157)
20,570 23,843
Non-current borrowings 20,570 23,843
Terms and conditions relating to the above financial instruments:
(i) Term Facility
The term facility has been scheduled for repayment on 1 October 2013 and has been presented as non-
current in accordance with AASB 101 Presentation of Financial Statements. The term facility is secured
by fixed and floating charges over the total assets of the Group.
(ii) Working Capital Facility
The working capital facility comprises a bank overdraft facility, a bank guarantee commitment and a
revolving cash advance facility. The combination of these facilities must not exceed $8.0m at any point in
time. The facility has been scheduled for repayment on 1 October 2013 and has been presented as current
in accordance with the economic substance of a working capital facility. The working capital facility is
secured by fixed and floating charges over the total assets of the Group.
(iii) Information regarding the effective interest rate risk of borrowings is set out in note 17.
(iv) During the current and prior years, there were no defaults or breaches on any of the loans.
(v) Refer to note 19(c) for details regarding financing facilities available.
For
per
sona
l use
onl
y

Traffic Technologies Ltd and Controlled Entities
Notes to the Financial Statements
For the year ended 30 June 2012
63
14. Provisions
Consolidated Consolidated
2012
$’000
2011
$’000
Current
Annual leave 1,033 982
Long service leave 957 863
Maintenance warranties 130 100
2,120 1,945
Non-current
Long service leave 123 104
123 104
Total provisions 2,243 2,049
(a) Movements in provisions
Movements in each class of provisions during the financial year, other than provisions relating to employee
benefits, are set out below:
Maintenance
Warranties
$’000
CONSOLIDATED
At 1 July 2011 100 Arising during the year 30
Unused amounts reversed -
At 30 June 2012 130
Current 2012 130
Current 2011 100
(b) Nature and timing of provision for maintenance warranties
The Group has recognised a provision for expected warranty claims on products sold by the Traffic Products
division during the last five years, based on current sales levels, current information available about past returns
and repairs and the five year warranty period for all products sold. The provision for warranty claims represents
the present value of the Directors’ best estimate of the future outflow of economic benefits that will be required
under warranties offered for traffic signals and emergency telephones produced by the Traffic Products division.
For
per
sona
l use
onl
y
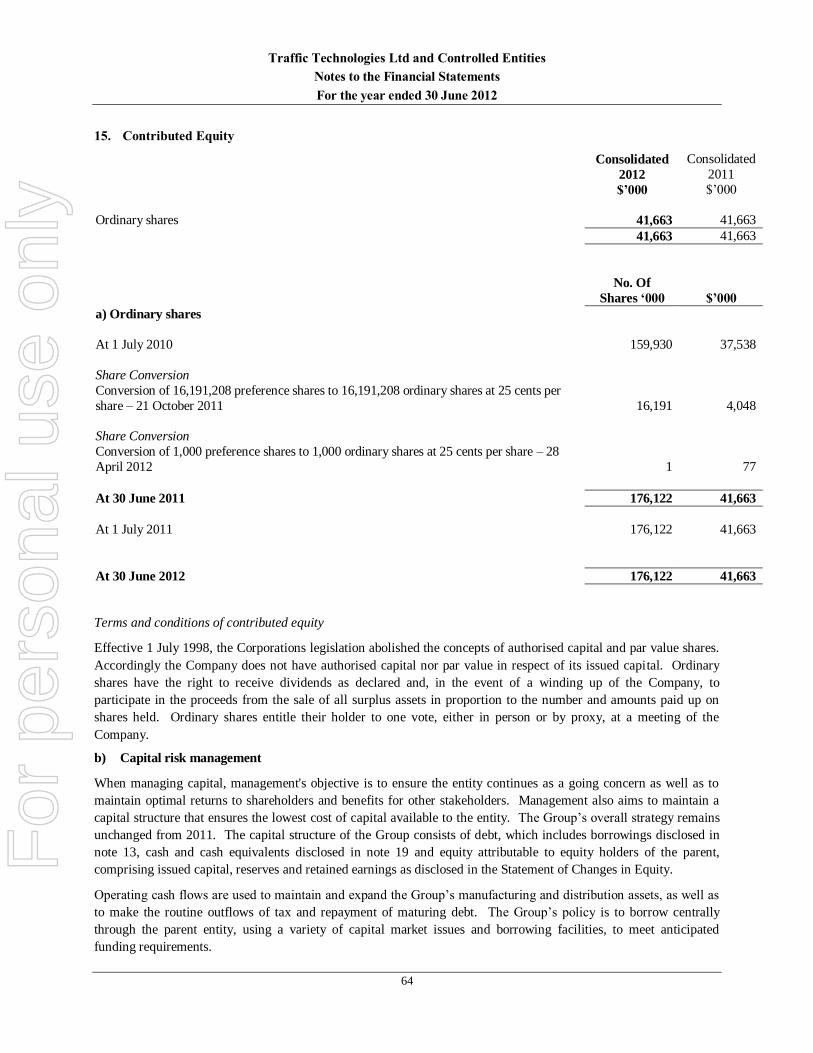
Traffic Technologies Ltd and Controlled Entities
Notes to the Financial Statements
For the year ended 30 June 2012
64
15. Contributed Equity
Consolidated Consolidated
2012
$’000
2011
$’000
Ordinary shares 41,663 41,663
41,663 41,663
No. Of
Shares ‘000 $’000
a) Ordinary shares
At 1 July 2010
159,930
37,538
Share Conversion
Conversion of 16,191,208 preference shares to 16,191,208 ordinary shares at 25 cents per
share – 21 October 2011
16,191
4,048
Share Conversion
Conversion of 1,000 preference shares to 1,000 ordinary shares at 25 cents per share – 28
April 2012
1
77
At 30 June 2011 176,122 41,663
At 1 July 2011
176,122
41,663
At 30 June 2012 176,122 41,663
Terms and conditions of contributed equity
Effective 1 July 1998, the Corporations legislation abolished the concepts of authorised capital and par value shares.
Accordingly the Company does not have authorised capital nor par value in respect of its issued capital. Ordinary
shares have the right to receive dividends as declared and, in the event of a winding up of the Company, to
participate in the proceeds from the sale of all surplus assets in proportion to the number and amounts paid up on
shares held. Ordinary shares entitle their holder to one vote, either in person or by proxy, at a meeting of the
Company.
b) Capital risk management
When managing capital, management's objective is to ensure the entity continues as a going concern as well as to
maintain optimal returns to shareholders and benefits for other stakeholders. Management also aims to maintain a
capital structure that ensures the lowest cost of capital available to the entity. The Group’s overall strategy remains
unchanged from 2011. The capital structure of the Group consists of debt, which includes borrowings disclosed in
note 13, cash and cash equivalents disclosed in note 19 and equity attributable to equity holders of the parent,
comprising issued capital, reserves and retained earnings as disclosed in the Statement of Changes in Equity.
Operating cash flows are used to maintain and expand the Group’s manufacturing and distribution assets, as well as
to make the routine outflows of tax and repayment of maturing debt. The Group’s policy is to borrow centrally
through the parent entity, using a variety of capital market issues and borrowing facilities, to meet anticipated
funding requirements.
For
per
sona
l use
onl
y

Traffic Technologies Ltd and Controlled Entities
Notes to the Financial Statements
For the year ended 30 June 2012
65
15. Contributed Equity (continued)
c) Gearing ratio
The Directors review the capital structure on a monthly basis. As a part of this review the Board considers the cost
of capital and risks associated with each class of capital. The Group has a target gearing ratio of 30-45%, which is
determined as the proportion of net debt to total capital. The Group will balance its overall capital structure through
new share issues and the redemption of existing debt, as market conditions allow. The Group is not subject to any
externally imposed capital requirements. The gearing ratios based on continuing operations at 30 June 2012 and
2011 were as follows:
Consolidated Consolidated
2012
$’000
2011
$’000
Total borrowings (i) 22,586 30,606
Cash and cash equivalents (1,589) (3,005)
Net debt 20,997 27,601
Equity (ii) 20,348 18,639
Total capital 41,345 46,240
Gearing ratio 51% 60%
(i) Total borrowings includes long and short-term interest bearing liabilities, as detailed in note 13.
(ii) Equity includes all capital and reserves.
16. Derivative Financial Instruments
Consolidated Consolidated 2012
$’000
2011
$’000
Current liabilities
Interest rate swap contract - 151
(i) Interest rate contracts
Interest bearing loans of the Group currently bear an average floating interest rate of 4.5% (2011: 4.8%). In order to
protect against rising interest rates the Group entered into an interest rate swap contract and an interest rate cap
contract under which it had a right to receive interest at variable rates and to pay interest at fixed rates. The swap
covered approximately 37.5% of the notional principal outstanding and the cap covered approximately 37.5%. The
fixed interest rate on both contracts was 7.1% and the floating interest rate on the both contracts was the Australian
BBR. Both contracts expired on 1 May 2012, being the original expiry date of the term loan to which the interest
rate contracts relate. The term loan, whose interest was hedged through these interest rate contracts, is fully
disclosed in note 13. The interest rate contracts settled on a quarterly basis. The interest payments on the term
facility loan and the interest rate contracts occurred simultaneously. The difference, if any, was recognised directly in
the statement of comprehensive income. The notional principal amounts and period of expiry of the interest rate
contracts were as follows:
Consolidated Consolidated
2012
$’000
2011
$’000
0 – 1 years - 15,513
For
per
sona
l use
onl
y
Traffic Technologies Ltd and Controlled Entities
Notes to the Financial Statements
For the year ended 30 June 2012
66
17. Financial risk management objectives and policies
Financial risk management objectives and policies
The Group’s principal financial instruments comprise a term loan facility, working capital facility, finance
leases, hire purchase contracts, forward contracts to purchase foreign currency and cash and short-term
deposits.
The Group manages its exposure to key financial risks, including interest rate and currency risk in accordance
with the Group's financial risk management policy. The objective of the policy is to support the delivery of
the Group's financial targets whilst protecting future financial security.
The Group enters into derivative transactions, principally interest rate swaps and forward currency contracts.
The purpose is to manage the interest rate and currency risks arising from the Group's operations and its
sources of finance, where appropriate. The Group has various other financial assets and liabilities such as
trade receivables and trade payables, which arise directly from its operations.
It is the Group’s policy that no trading in financial instruments shall be undertaken.
The main risks arising from the Group’s financial instruments are cash flow interest rate risk, liquidity risk,
credit risk and foreign exchange rate risk.
The Group uses different methods to measure and manage different types of risks to which it is exposed.
These include monitoring levels of exposure to interest rate and foreign exchange risk and assessments of
market forecasts for interest rate and foreign exchange prices. Ageing analyses and monitoring of specific
credit allowances are undertaken to manage credit risk. Liquidity risk is monitored through the preparation of
future rolling cash flow forecasts.
The Board reviews and agrees policies for managing each of these risks as summarised below.
Primary responsibility for identification and control of financial risks rests with the Audit & Risk Committee
under the authority of the Board. The Board reviews and agrees policies for managing each of the risks identified below, including the setting of limits for hedging cover of foreign currency and interest rate risk,
credit allowances and future cash flow forecasts.
For
per
sona
l use
onl
y

Traffic Technologies Ltd and Controlled Entities
Notes to the Financial Statements
For the year ended 30 June 2012
67
17. Financial risk management objectives and policies (continued)
Details of the significant accounting policies and methods adopted, including the criteria for recognition, the
basis of measurement and the basis on which income and expenses are recognised, in respect of each class of
financial asset, financial liability and equity instrument are disclosed in note 1 to the financial statements.
Risk exposures and responses
Fair value of financial instruments
The Directors consider that the carrying amount of financial assets and financial liabilities recorded in the
financial statements approximates their fair values (2011: fair values).
The fair values and net fair values of financial assets and financial liabilities are determined as follows:
The fair value of financial assets and financial liabilities with standard terms and conditions and traded
on active liquid markets are determined with reference to quoted market prices; and
The fair value of other financial assets and financial liabilities are determined in accordance with
generally accepted pricing models based on discounted cash flow analysis.
Interest rate risk
The Group's exposure to market interest rates relates primarily to the Group's long-term debt obligations.
Details of the Group’s debt are disclosed in note 13.
At balance date the Group had the following mix of financial assets and liabilities exposed to Australian
variable interest rate risk that are not designated in cash flow hedges:
Consolidated Consolidated
2012
$’000
2011
$’000
Financial assets Cash and cash equivalents 1,589 3,005
Other financial assets 1 1
1,590 3,006
Financial liabilities
Term bank facility (net of capitalised transaction costs) 20,570 23,843
Working capital facility 1,500 6,400
Derivative financial instruments - 151
22,070 30,394
Net exposure (20,480) (27,388)
The Group’s policy has been to manage its finance costs using a mix of fixed and variable rate debt. The
Group had entered into interest rate swaps and interest rate cap contracts, in which the Group agreed to
exchange, at specified intervals, the difference between fixed and variable rate interest amounts calculated by
reference to an agreed-upon notional principal amount. These swaps and caps, which were designated to
hedge underlying debt obligations, expired on 1 May 2012. At 30 June 2012 none of the Group's borrowings
were at a fixed rate of interest (2011: 59%).
For
per
sona
l use
onl
y
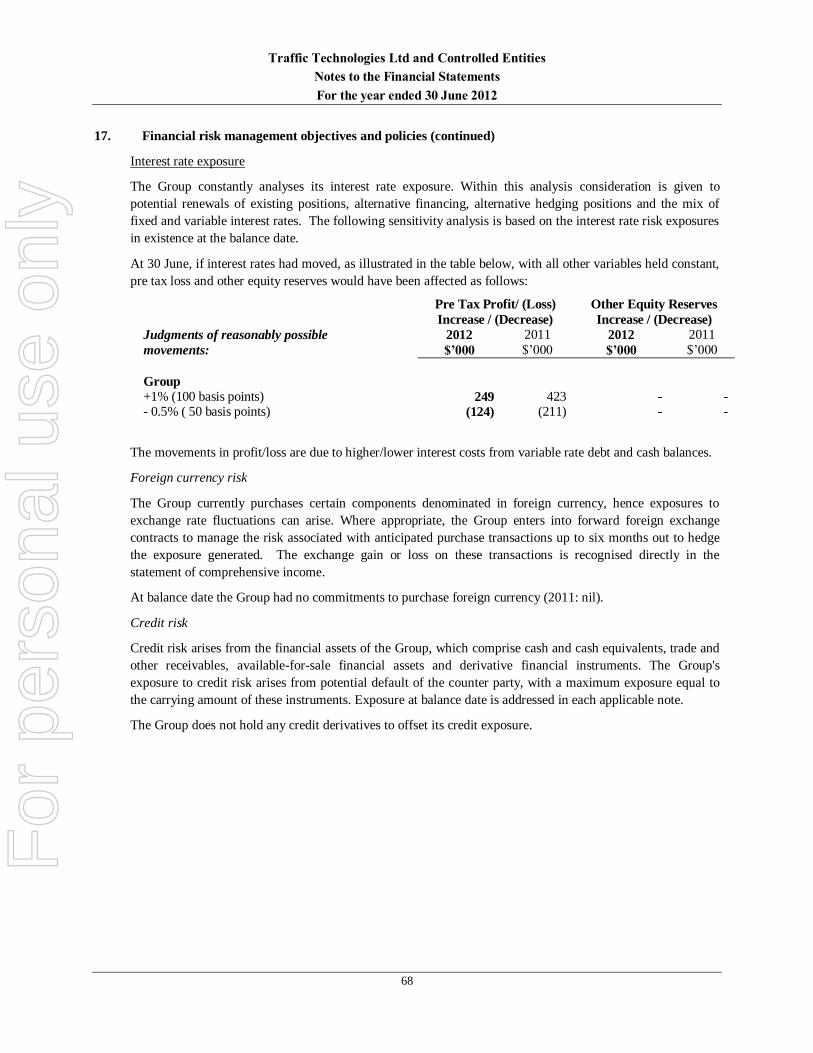
Traffic Technologies Ltd and Controlled Entities
Notes to the Financial Statements
For the year ended 30 June 2012
68
17. Financial risk management objectives and policies (continued)
Interest rate exposure
The Group constantly analyses its interest rate exposure. Within this analysis consideration is given to
potential renewals of existing positions, alternative financing, alternative hedging positions and the mix of
fixed and variable interest rates. The following sensitivity analysis is based on the interest rate risk exposures
in existence at the balance date.
At 30 June, if interest rates had moved, as illustrated in the table below, with all other variables held constant,
pre tax loss and other equity reserves would have been affected as follows:
Pre Tax Profit/ (Loss)
Increase / (Decrease)
Other Equity Reserves
Increase / (Decrease)
Judgments of reasonably possible
movements:
2012
$’000
2011
$’000 2012
$’000
2011
$’000
Group
+1% (100 basis points) 249 423 - - - 0.5% ( 50 basis points) (124) (211) - -
The movements in profit/loss are due to higher/lower interest costs from variable rate debt and cash balances.
Foreign currency risk
The Group currently purchases certain components denominated in foreign currency, hence exposures to
exchange rate fluctuations can arise. Where appropriate, the Group enters into forward foreign exchange
contracts to manage the risk associated with anticipated purchase transactions up to six months out to hedge
the exposure generated. The exchange gain or loss on these transactions is recognised directly in the
statement of comprehensive income.
At balance date the Group had no commitments to purchase foreign currency (2011: nil).
Credit risk
Credit risk arises from the financial assets of the Group, which comprise cash and cash equivalents, trade and
other receivables, available-for-sale financial assets and derivative financial instruments. The Group's
exposure to credit risk arises from potential default of the counter party, with a maximum exposure equal to
the carrying amount of these instruments. Exposure at balance date is addressed in each applicable note.
The Group does not hold any credit derivatives to offset its credit exposure.
For
per
sona
l use
onl
y

Traffic Technologies Ltd and Controlled Entities
Notes to the Financial Statements
For the year ended 30 June 2012
69
17. Financial risk management objectives and policies (continued)
The Group trades only with recognised, creditworthy third parties and, as such, collateral is not requested nor
is it the Group's policy to securitise its trade and other receivables. It is the Group's policy that all customers
who wish to trade on credit terms are subject to credit verification procedures including an assessment of their
independent credit rating, financial position, past experience and industry reputation. Risk limits are set for
each individual customer in accordance with parameters set by the Board. These risk limits are regularly
monitored.
In addition, receivable balances are monitored on an ongoing basis with the result that the Group's exposure to
bad debts is not significant.
For transactions that are not denominated in the functional currency of the relevant operating unit, the Group
does not offer credit terms without the specific approval of senior management.
There are no significant concentrations of credit risk within the Group.
Price risk
The Group’s exposure to equity securities price risk is minimal. Equity price risk arises from investments in
equity securities, which are carried at cost as an approximation to fair value. The price risk is immaterial in
terms of a possible impact on profit or loss or total equity and as such a sensitivity analysis has not been
completed.
Liquidity risk
Ultimate responsibility for liquidity risk management rests with the Board, which has built an appropriate
liquidity risk management framework for the management of the Group’s short, medium and long-term
funding and liquidity management requirements. The Group manages liquidity risk by maintaining adequate
reserves, banking facilities and reserve borrowing facilities by continuously monitoring forecast and actual
cash flows and matching the maturity profiles of financial assets and liabilities. Included in note 19(c) is a
listing of additional undrawn facilities that the Group has at its disposal to further reduce liquidity risk.
The Group’s objective is to maintain a balance between continuity of funding and flexibility through the use
of bank overdrafts, bank loans, recycling of assets through sale, finance leases and committed available credit
lines.
The Group’s policy is that not more than 20% of borrowings should mature in any 12 month period. At 30
June 2012, 0.7% of the Group’s debt is due to be retired in less than one year (2011: 0.4%), 97.7% of the
Group’s debt will mature within 18 months’ time (2011: 98.8%) and the balance of the Group’s debt will
mature in more than 18 months but not more than 5 years.
The following table details the Group’s remaining contractual maturity for its financial liabilities. The table
has been drawn up based on the undiscounted cash flows of financial liabilities based on the earliest date in
which the Group can be required to pay. The table includes both interest and principal cash flows. Cash
flows for financial liabilities without fixed timing of amount are based on conditions existing at 30 June.
For
per
sona
l use
onl
y

Traffic Technologies Ltd and Controlled Entities
Notes to the Financial Statements
For the year ended 30 June 2012
70
17. Financial risk management objectives and policies (continued)
The remaining contractual maturities of the Group’s financial liabilities are:
Consolidated
2012
$’000
2011
$’000
6 months or less 14,978 13,466
6 – 12 months 149 1,664
1 – 5 years 22,505 31,368 Over 5 years - -
37,632 46,498
Maturity analysis of financial assets and liabilities in accordance with management’s expectation
The risk implied from the values shown in the table below reflects a balanced view of cash inflows and
outflows. Leasing obligations, trade payables and other financial liabilities mainly originate from the
financing of assets used in the Group’s ongoing operations such as property, plant, equipment and investments
in working capital (e.g. inventories and trade receivables). These assets are considered in the Group’s overall
liquidity risk. To monitor existing financial assets and liabilities, as well as to enable an effective controlling
of future risks, the Group has established comprehensive risk reporting covering its business segments that
reflects management’s expectations of expected settlement of financial assets and liabilities, as illustrated in
the tables below.
Year ended 30 June 2012 ≤ 6
months
$’000
6-12 months
$’000
1 – 5
years
$’000
> 5 years
$’000
Total
$’000
Consolidated
Financial assets
Cash & cash equivalents 1,589 - - - 1,589
Trade & other receivables 14,330 - 4 - 14,334
15,919 - 4 - 15,923
Financial liabilities
Trade & other payables 13,629 - 1,200 - 14,829 Interest bearing loans & borrowings 150 - 22,436 - 22,586
Bank guarantee - - 852 - 852
13,779 - 24,488 - 38,267
Net maturity 2,140 - (24,484) - (22,344)
The difference between the contractual maturities of the Group’s financial liabilities and management
expectation of when those financial liabilities will be settled is explained by a provision in respect of a legal
claim of $1,200,000 (refer note 20(i)).
For
per
sona
l use
onl
y
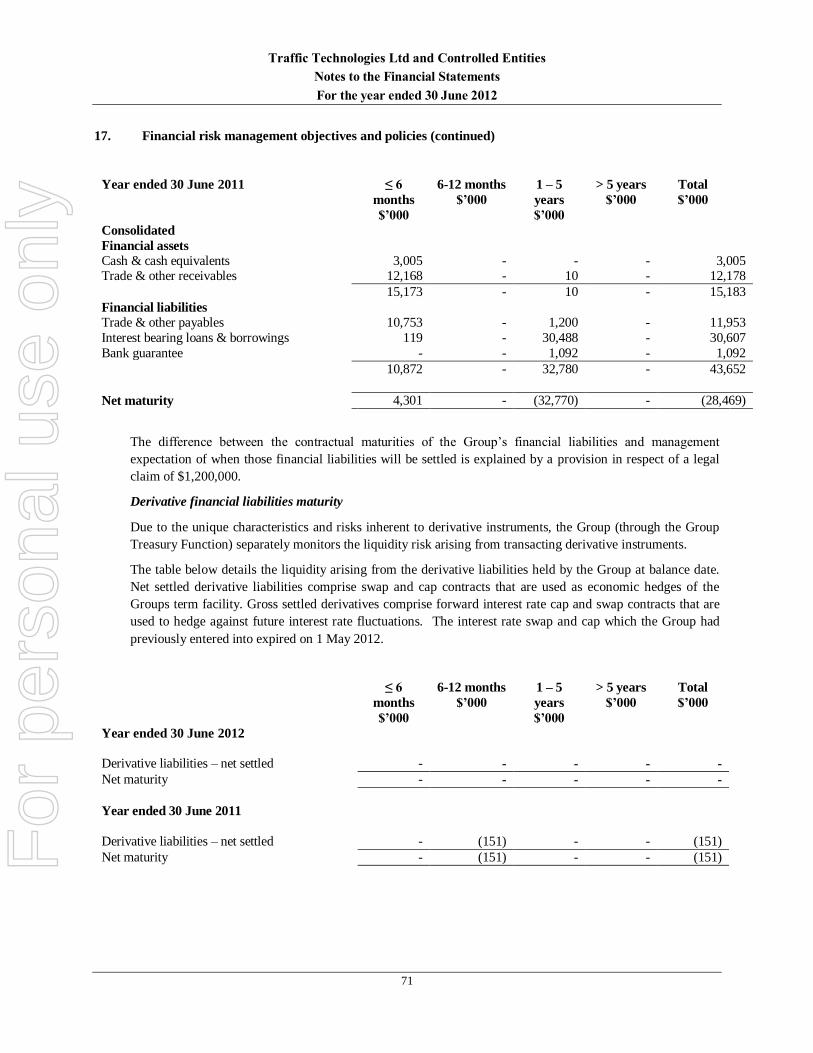
Traffic Technologies Ltd and Controlled Entities
Notes to the Financial Statements
For the year ended 30 June 2012
71
17. Financial risk management objectives and policies (continued)
Year ended 30 June 2011 ≤ 6
months
$’000
6-12 months
$’000
1 – 5
years
$’000
> 5 years
$’000
Total
$’000
Consolidated
Financial assets
Cash & cash equivalents 3,005 - - - 3,005 Trade & other receivables 12,168 - 10 - 12,178
15,173 - 10 - 15,183
Financial liabilities
Trade & other payables 10,753 - 1,200 - 11,953
Interest bearing loans & borrowings 119 - 30,488 - 30,607
Bank guarantee - - 1,092 - 1,092
10,872 - 32,780 - 43,652
Net maturity 4,301 - (32,770) - (28,469)
The difference between the contractual maturities of the Group’s financial liabilities and management
expectation of when those financial liabilities will be settled is explained by a provision in respect of a legal
claim of $1,200,000.
Derivative financial liabilities maturity
Due to the unique characteristics and risks inherent to derivative instruments, the Group (through the Group
Treasury Function) separately monitors the liquidity risk arising from transacting derivative instruments.
The table below details the liquidity arising from the derivative liabilities held by the Group at balance date.
Net settled derivative liabilities comprise swap and cap contracts that are used as economic hedges of the
Groups term facility. Gross settled derivatives comprise forward interest rate cap and swap contracts that are
used to hedge against future interest rate fluctuations. The interest rate swap and cap which the Group had
previously entered into expired on 1 May 2012.
≤ 6
months
$’000
6-12 months
$’000
1 – 5
years
$’000
> 5 years
$’000
Total
$’000
Year ended 30 June 2012
Derivative liabilities – net settled - - - - -
Net maturity - - - - -
Year ended 30 June 2011
Derivative liabilities – net settled - (151) - - (151)
Net maturity - (151) - - (151)
For
per
sona
l use
onl
y
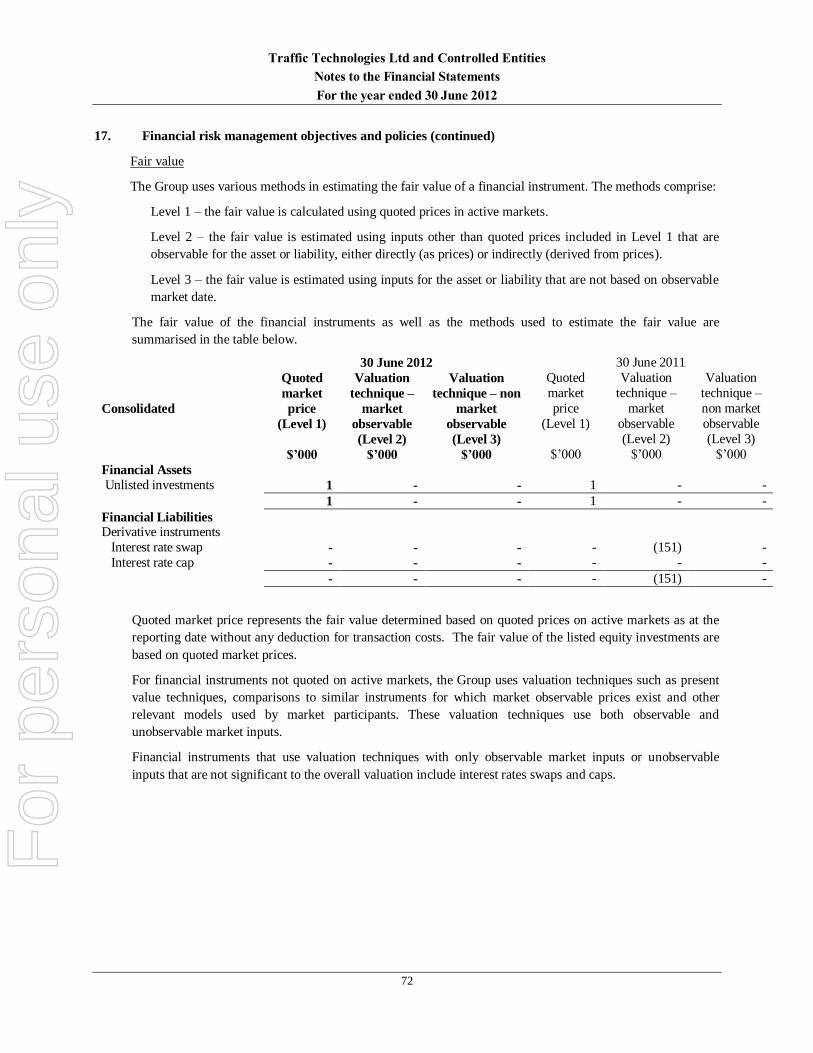
Traffic Technologies Ltd and Controlled Entities
Notes to the Financial Statements
For the year ended 30 June 2012
72
17. Financial risk management objectives and policies (continued)
Fair value
The Group uses various methods in estimating the fair value of a financial instrument. The methods comprise:
Level 1 – the fair value is calculated using quoted prices in active markets.
Level 2 – the fair value is estimated using inputs other than quoted prices included in Level 1 that are
observable for the asset or liability, either directly (as prices) or indirectly (derived from prices).
Level 3 – the fair value is estimated using inputs for the asset or liability that are not based on observable
market date.
The fair value of the financial instruments as well as the methods used to estimate the fair value are
summarised in the table below.
30 June 2012 30 June 2011
Consolidated
Quoted
market
price
(Level 1)
Valuation
technique –
market
observable
(Level 2)
Valuation
technique – non
market
observable
(Level 3)
Quoted
market
price
(Level 1)
Valuation
technique –
market
observable
(Level 2)
Valuation
technique –
non market
observable
(Level 3)
$’000 $’000 $’000 $’000 $’000 $’000
Financial Assets
Unlisted investments 1 - - 1 - -
1 - - 1 - -
Financial Liabilities Derivative instruments
Interest rate swap - - - - (151) -
Interest rate cap - - - - - -
- - - - (151) -
Quoted market price represents the fair value determined based on quoted prices on active markets as at the
reporting date without any deduction for transaction costs. The fair value of the listed equity investments are
based on quoted market prices.
For financial instruments not quoted on active markets, the Group uses valuation techniques such as present
value techniques, comparisons to similar instruments for which market observable prices exist and other
relevant models used by market participants. These valuation techniques use both observable and
unobservable market inputs.
Financial instruments that use valuation techniques with only observable market inputs or unobservable
inputs that are not significant to the overall valuation include interest rates swaps and caps.
For
per
sona
l use
onl
y

Traffic Technologies Ltd and Controlled Entities
Notes to the Financial Statements
For the year ended 30 June 2012
73
18. Expenditure Commitments
Consolidated Consolidated
2012 2011
Minimum
rentals
$’000
Minimum
rentals $’000
a) Operating lease commitments -
Premises
Within 1 year 1,403 2,040
After 1 year but not more than 5 years 1,275 2,467
More than 5 years - -
2,678 4,507
The Group leases a number of warehouse, factory and office facilities under operating leases. The leases typically run
for periods of 1 to 5 years with an option to renew the lease after that date.
b) Operating lease commitments –
Motor vehicles
Within 1 year 5 65
After 1 year but not more than 5 years - 8
5 73
The Group leases a fleet of vehicles under operating leases. The leases typically run for periods of 2 to 5 years with an
option to renew after that date.
c) Finance lease & hire purchase
Consolidated Consolidated Consolidated Consolidated
2012 2012 2011 2011
Minimum lease
payments
$’000
Present value of
lease payments
$’000
Minimum lease
payments
$’000
Present value of
lease payments
$’000
Within 1 year 297 150 179 118
After 1 year but not more than 5 years 305 366 256 245
Minimum future lease payments 602 516 435 363
Less future finance charges (86) - (72) -
Lease liability 516 516 363 363
The Group has entered into finance and hire purchase contracts in respect of various items of plant and machinery and motor vehicles. These finance and hire purchase contracts expire within 1 to 5 years. Subsequent renewal of the
contracts is at the option of the entity that holds the lease.
For
per
sona
l use
onl
y

Traffic Technologies Ltd and Controlled Entities
Notes to the Financial Statements
For the year ended 30 June 2012
74
19. Statement of Cash Flows
a) Reconciliation of Cash
Consolidated Consolidated
2012
$’000
2011
$’000
Cash at bank and in hand 1,589 3,005
1,589 3,005
Cash at bank earns interest at floating rates based on daily bank deposit rates.
b) Reconciliation of net profit/(loss) after tax to net cash flows from operations
Consolidated Consolidated
2012
$’000
2011
$’000
Net profit 1,198 582
Adjustments for:
Depreciation, amortisation and impairment of non-current
assets 2,075 2,057
Fair value of interest rate contracts (151) (182)
Loss/(profit) on sale of fixed assets - (12)
Loss/(gain) on sale of discontinued operations 401 (1,247)
Deferred tax on discontinued operations 7 (482)
Foreign exchange gain (134) (280)
Amortisation of capitalised finance fees 177 208
Doubtful debts expense 16 8
Stock obsolescence (benefit)/expense (28) (44)
Changes in assets and liabilities:
(Increase)/decrease in trade and other receivables (2,157) 5,112
(Increase)/decrease in inventories 1,225 (650) Increase/(decrease) in trade and other payables 2,983 (1,642)
(Increase)/decrease in deferred tax assets 101 (171)
Increase/(decrease) in provisions 195 (439)
Net cash provided by operating activities
5,908
2,818
Non cash financing and investing activities
During the year the Group acquired property, plant and equipment with an aggregate value of $261,878 (2011:
$274,970) by means of finance leases. These acquisitions are not reflected in the Statement of Cash Flows.
For
per
sona
l use
onl
y

Traffic Technologies Ltd and Controlled Entities
Notes to the Financial Statements
For the year ended 30 June 2012
75
19. Statement of Cash Flows (continued)
c) Financing facilities available
Consolidated Consolidated
2012
$’000
2011
$’000
Total facilities at reporting date Term facility 20,700 24,000
Working capital facility comprising:
- revolving cash advance facility
- bank overdraft facility
- bank guarantee facility
- bank letters of credit facility
5,800
1,000
1,200
-
6,400
1,000
1,200
-
28,700 32,600
Facilities used at reporting date
Term facility 20,700 24,000 Working capital facility comprising:
- revolving cash advance facility
- bank overdraft facility
- bank guarantee facility
- bank letters of credit facility
1,500
-
852
-
6,400
-
1,092
-
23,052 31,492
Facilities unused at reporting date
Term facility - -
Working capital facility comprising: - revolving cash advance facility
- bank overdraft facility
- bank guarantee facility
- bank letters of credit facility
4,300
1,000
348
-
-
1,000
108
-
5,648 1,108
For
per
sona
l use
onl
y
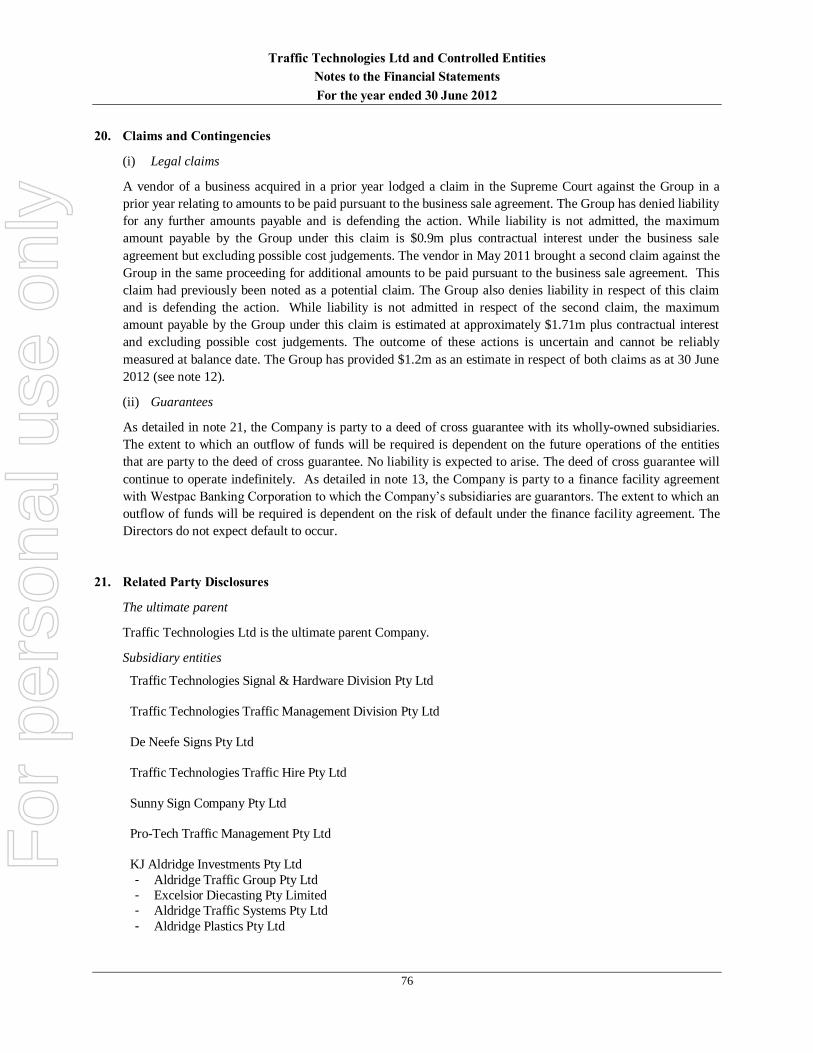
Traffic Technologies Ltd and Controlled Entities
Notes to the Financial Statements
For the year ended 30 June 2012
76
20. Claims and Contingencies
(i) Legal claims
A vendor of a business acquired in a prior year lodged a claim in the Supreme Court against the Group in a
prior year relating to amounts to be paid pursuant to the business sale agreement. The Group has denied liability
for any further amounts payable and is defending the action. While liability is not admitted, the maximum
amount payable by the Group under this claim is $0.9m plus contractual interest under the business sale
agreement but excluding possible cost judgements. The vendor in May 2011 brought a second claim against the
Group in the same proceeding for additional amounts to be paid pursuant to the business sale agreement. This
claim had previously been noted as a potential claim. The Group also denies liability in respect of this claim
and is defending the action. While liability is not admitted in respect of the second claim, the maximum
amount payable by the Group under this claim is estimated at approximately $1.71m plus contractual interest
and excluding possible cost judgements. The outcome of these actions is uncertain and cannot be reliably
measured at balance date. The Group has provided $1.2m as an estimate in respect of both claims as at 30 June
2012 (see note 12).
(ii) Guarantees
As detailed in note 21, the Company is party to a deed of cross guarantee with its wholly-owned subsidiaries.
The extent to which an outflow of funds will be required is dependent on the future operations of the entities
that are party to the deed of cross guarantee. No liability is expected to arise. The deed of cross guarantee will
continue to operate indefinitely. As detailed in note 13, the Company is party to a finance facility agreement
with Westpac Banking Corporation to which the Company’s subsidiaries are guarantors. The extent to which an
outflow of funds will be required is dependent on the risk of default under the finance facility agreement. The
Directors do not expect default to occur.
21. Related Party Disclosures
The ultimate parent
Traffic Technologies Ltd is the ultimate parent Company.
Subsidiary entities
Traffic Technologies Signal & Hardware Division Pty Ltd
Traffic Technologies Traffic Management Division Pty Ltd
De Neefe Signs Pty Ltd
Traffic Technologies Traffic Hire Pty Ltd
Sunny Sign Company Pty Ltd
Pro-Tech Traffic Management Pty Ltd
KJ Aldridge Investments Pty Ltd
- Aldridge Traffic Group Pty Ltd
- Excelsior Diecasting Pty Limited
- Aldridge Traffic Systems Pty Ltd
- Aldridge Plastics Pty Ltd
For
per
sona
l use
onl
y

Traffic Technologies Ltd and Controlled Entities
Notes to the Financial Statements
For the year ended 30 June 2012
77
21. Related Party Disclosures (continued)
Entities subject to Individual Order
Pursuant to the Individual Order granted by ASIC under subsection 340(1) of the Corporations Act 2001, relief
has been granted to the subsidiary companies from the Corporations Act 2001 requirements for preparation,
audit and lodgement of their financial reports. The relief granted under the Individual Order is equivalent to the
advantage of the relief offered by ASIC Class Order 98/1418.
As a condition of the Individual Order, Traffic Technologies Ltd and its subsidiary entities (the “Closed
Group”) entered into a Deed of Cross Guarantee on 28 June 2007. The effect of the deed is that Traffic
Technologies Ltd has guaranteed to pay any deficiency in the event of winding up of any controlled entity or if
they do not meet their obligations under the terms of overdrafts, loans, leases or other liabilities subject to the
guarantee. The controlled entities have also given a similar guarantee in the event that Traffic Technologies Ltd
is wound up or if it does not meet its obligation under the terms of overdrafts, loans or other liabilities subject to
the guarantee.
The consolidated statement of consolidated income and statement of financial position of the closed group is
equivalent to the Group’s statement of consolidated income and statement of financial position.
Transactions with Directors or Director-related entities
There were no other transactions or balances receivable from or payable to Directors or executives during the
financial year or at the date of this report.
22. Events after the Balance Date
Subsequent to balance date there have been no significant events which have affected the operations of the
Group.
23. Auditor’s Remuneration
Amounts received or due and receivable by:
Consolidated Consolidated
2012 2011
$ $
Audit or review of the financial report of the entity and
any other entity in the Group
- Current auditors – Moore Stephens Melbourne 67,000 -
- Previous auditors - BDO Audit (NSW-VIC) Pty Ltd 23,000 109,500
90,000 109,500
For
per
sona
l use
onl
y

Traffic Technologies Ltd and Controlled Entities
Notes to the Financial Statements
For the year ended 30 June 2012
78
24. Key Management Personnel Disclosures
a) Compensation of Key Management Personnel
(i) Remuneration of Key Management Personnel
Details of the nature and amount of each element of the remuneration of key management personnel are
disclosed in the Remuneration Report section of the Directors’ Report.
Consolidated
Compensation by Category:
Key Management Personnel
2012
$
2011
$
Short-term employee benefits 902,743 853,197
Post employment benefits 98,891 98,061
Other long-term benefits 28,713 11,090
1,030,347 962,348
b) Shares issued on exercise of remuneration options
No shares have been issued to key management personnel as a result of the exercise of remuneration
options.
c) Option holdings of Key Management Personnel
There were no share options outstanding at 30 June 2012 or at the date of this report (2011: nil).
d) Loans to Key Management Personnel
There were no loans made to Directors or executives during the financial year and none are outstanding as
at the date of this report.
For
per
sona
l use
onl
y

Traffic Technologies Ltd and Controlled Entities
Notes to the Financial Statements
For the year ended 30 June 2012
79
e) Shareholdings of Key Management Personnel
Ordinary shares held in Traffic Technologies Ltd
Balance at
beginning of
period
Granted
as remuneration
On exercise
of Options
Net change
other
Balance at
end of
period
1 July 2011 30 June 2012
30 June 2012 No. No. No. No. No.
Directors
Mr. Alan Brown 2,856,965 - - 335,000 3,191,965
Mr. Con Liosatos 10,129,377 - - 4,934,542 15,063,919
Mr Ray Horsburgh 328,400 - - - 328,400
Total 13,314,742 - - 5,269,542 18,584,284
Key Management Personnel
Mr. Peter Crafter 10,000 - - - 10,000
Total 10,000 - - - 10,000
Balance at
beginning of
period
Granted
as remuneration
On exercise
of Options
Net change
other #
Balance at
end of
period
1 July 2010 30 June 2011
30 June 2011 No. No. No. No. No.
Directors
Mr. Alan Brown 2,056,965 - - 800,000 2,856,965
Mr. Con Liosatos 8,374,949 - - 1,754,428 10,129,377
Mr Ray Horsburgh 150,000 - - 178,400 328,400
Mr. Ken Jarrett 9,452,563 - - (9,452,563) -
Total 20,034,477 - - (6,719,735) 13,314,742
Key Management Personnel
Mr. Peter Crafter 10,000 - - - 10,000
Total 10,000 - - - 10,000
# - includes the resignation of Mr. Ken Jarrett.
For
per
sona
l use
onl
y
Traffic Technologies Ltd and Controlled Entities
Notes to the Financial Statements
For the year ended 30 June 2012
80
25. Operating Segments
Identification of reportable segments
The Group has identified its operating/reportable segments based on the internal reports that are reviewed and used
by the Managing Director (the chief operating decision maker) in assessing performance and in determining the
allocation of resources. The reportable segments are identified by management based on the manner in which the products are sold and the nature of the services provided. Discrete financial information about each of these
operating businesses is reported to the Managing Director on at least a monthly basis. The reportable segments are
based on aggregated operating segments determined by the similarity of the products produced and sold and/or the
services provided, as these are the sources of the Group’s major risks and have the most effect on the rates of return.
Types of products and services
Traffic Products
Following the sale of the Traffic Hire business in December 2011, the Group has only one business segment: Traffic
Products. The Traffic Products division specialises in the design, manufacture and installation of traffic signals,
emergency telephones, portable roadside technology and road lighting products and provides a wide range of
directional and regulatory traffic signs and traffic control products to road traffic authorities, municipal councils and
construction companies.
Traffic Services
The Traffic Hire business, which provided equipment hire services to road traffic authorities and construction
companies, was sold in December 2011 and has been reported as discontinued operations.
Accounting policies and intersegment transactions
The accounting policies used by the Group in reporting segments internally are the same as those contained in note 1
to the accounts and in the comparative period except as detailed below.
Inter-entity sales
Inter-entity sales are recognised based on internally set transfer prices. The prices are reviewed periodically to reflect
what the business operations could achieve if they sold their output and services to external parties at arm’s length.
Segment loans payable and loans receivable
Segment loans are initially recognised at the consideration received excluding transaction costs. Inter-segment loans
receivable and loans payable that earn or incur non-market interest are not adjusted to fair value based on market
interest rates.
Income tax expense
Current income tax expense is not calculated at the operating segment level; however, effect is given for taxable or deductible temporary differences (deferred tax expense) at the operating segment level. It is the Group’s policy that
if items of revenue and expense are not allocated to operating segments then any associated assets and liabilities are
also not allocated to segments. This is to avoid asymmetrical allocations within segments which management believe
would be inconsistent.
For
per
sona
l use
onl
y

Traffic Technologies Ltd and Controlled Entities
Notes to the Financial Statements
For the year ended 30 June 2012
81
25. Operating Segments (continued)
Reportable segments
The following tables present revenue and profit information regarding reportable segments for the financial years
ended 30 June 2012 and 30 June 2011 and segment asset and liability information as at 30 June 2012 and 30 June
2011.
Year Ended 30 June 2012
Traffic
Products
Discontinued
Operations
Consol-
idated
$'000 $'000 $'000
Revenue
Sales to external customers 53,025 968 53,993
Inter-segment sales 339 4 343
Total segment revenue
53,364 972 54,336
Inter-segment elimination (343)
Interest revenue 44
Total revenue (refer to note 2) 54,037
Segment EBIT 8,204 230 8,434
Finance costs (2,030) (3) (2,033)
Segment gain before tax
6,174 227 6,401
Total segment gain before tax 6,401
Finance costs (455) Discontinued operations (227)
Corporate costs (4,247)
Profit for the year from continuing
operations before income tax per the
statement of comprehensive income
1,472
Segmental income tax benefit/(expense) 723 (7) 716
Total segment income tax benefit 716
Discontinued operations 7
Corporate costs (305)
Total income tax benefit 418
For
per
sona
l use
onl
y

Traffic Technologies Ltd and Controlled Entities
Notes to the Financial Statements
For the year ended 30 June 2012
82
25. Operating Segments (continued)
As at 30 June 2012
Traffic
Products
Discontinued
Operations
Consol-
idated
$'000 $'000 $'000
Segment assets 28,616 - 28,616
Total segment assets 28,616
Unallocated:
Cash 155
Receivables 119
Property, plant & equipment 235
Intangible assets 30,861
Deferred tax asset 44
Total assets as per the statement of financial
position
60,030
Segment liabilities 16,194 - 16,194
Total segment liabilities 16,194
Unallocated: Payables 961
Interest-bearing liabilities 22,258
Provisions 269
Total liabilities as per the statement of
financial position
39,682
For
per
sona
l use
onl
y

Traffic Technologies Ltd and Controlled Entities
Notes to the Financial Statements
For the year ended 30 June 2012
83
25. Operating Segments (continued)
Year Ended 30 June 2011
Traffic
Products
Discontinued
Operations
Consol-
idated
$'000 $'000 $'000
Revenue
Sales to external customers 47,896 5,993 53,889
Inter-segment sales 474 92 566
Total segment revenue
48,370 6,085 54,455
Inter-segment elimination (566)
Interest revenue 67
Total revenue (refer to note 2) 53,956
Segment EBIT 6,504 (53) 6,451
Finance costs (3,035) (26) (3,061)
Segment gain / (loss) before tax
3,469 (79) 3,390
Total segment gain before tax 3,390
Finance costs (734)
Discontinued operations 79
Corporate costs (3,775)
Loss for the year from continuing
operations before income tax per the
statement of comprehensive income
(1,040)
Segmental income tax benefit/(expense) 688 (358) 330
Total segment income tax benefit 330
Discontinued operations 358 Corporate costs 122
Total income tax benefit 810
For
per
sona
l use
onl
y
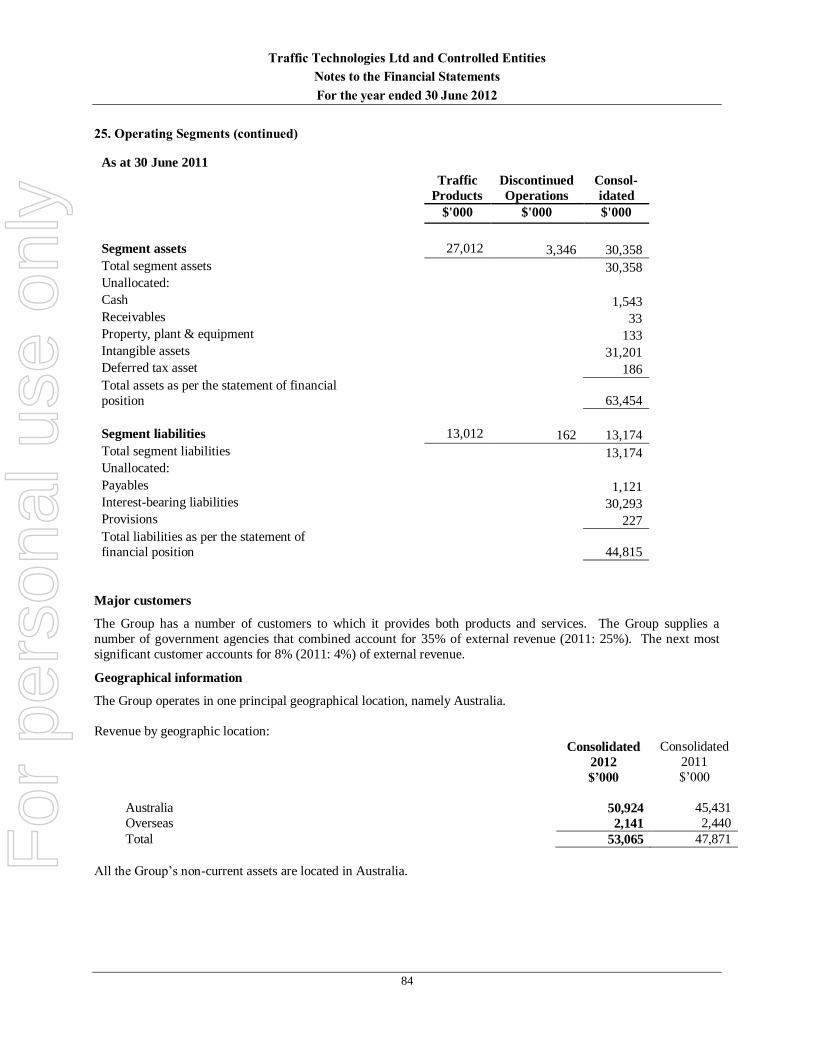
Traffic Technologies Ltd and Controlled Entities
Notes to the Financial Statements
For the year ended 30 June 2012
84
25. Operating Segments (continued)
As at 30 June 2011
Traffic
Products
Discontinued
Operations
Consol-
idated
$'000 $'000 $'000
Segment assets 27,012 3,346 30,358
Total segment assets 30,358
Unallocated:
Cash 1,543
Receivables 33
Property, plant & equipment 133
Intangible assets 31,201
Deferred tax asset 186
Total assets as per the statement of financial
position
63,454
Segment liabilities 13,012 162 13,174
Total segment liabilities 13,174 Unallocated:
Payables 1,121
Interest-bearing liabilities 30,293
Provisions 227
Total liabilities as per the statement of
financial position
44,815
Major customers
The Group has a number of customers to which it provides both products and services. The Group supplies a
number of government agencies that combined account for 35% of external revenue (2011: 25%). The next most
significant customer accounts for 8% (2011: 4%) of external revenue.
Geographical information
The Group operates in one principal geographical location, namely Australia.
Revenue by geographic location:
Consolidated Consolidated
2012
$’000
2011
$’000
Australia 50,924 45,431
Overseas 2,141 2,440
Total 53,065 47,871
All the Group’s non-current assets are located in Australia.
For
per
sona
l use
onl
y

Traffic Technologies Ltd and Controlled Entities
Notes to the Financial Statements
For the year ended 30 June 2012
85
26. Parent Entity Information
2012 2011
Information relating to Traffic Technologies Ltd:
$’000 $’000
Current assets 7,509 1,686
Total assets 51,515 45,649
Current liabilities 40,505 34,158 Total liabilities 61,244 58,063
Issued capital 41,663 41,663
Retained earnings (52,392) (55,077)
Share-based payments reserve 1,000 1,000
Total shareholders’ equity (9,729) (12,414)
Profit/(loss) of the parent entity 2,685 (4,502)
Total comprehensive income of the parent entity 2,685 (4,502)
Details of any guarantees entered into by the parent entity in relation to the
debts of its subsidiaries ^ 852 1,092
^ As a condition of the Individual Order, Traffic Technologies Ltd and its subsidiary entities (the “Closed Group”)
entered into a Deed of Cross Guarantee on 28 June 2007. The effect of the deed is that Traffic Technologies Ltd has
guaranteed to pay any deficiency in the event of winding up of any controlled entity or if they do not meet their
obligations under the terms of overdrafts, loans, leases or other liabilities subject to the guarantee. The controlled
entities have also given a similar guarantee in the event that Traffic Technologies Ltd is wound up or if it does not
meet its obligation under the terms of overdrafts, loans or other liabilities subject to the guarantee.
For
per
sona
l use
onl
y

Traffic Technologies Ltd
Directors’ Declaration
For the year ended 30 June 2012
86
Directors’ Declaration
The Directors of the Company declare that:
1. The financial statements, comprising the statement of comprehensive income, statement of financial position,
statement of cash flows, statement of changes in equity and accompanying notes, are in accordance with the
Corporations Act 2001 and:
(a) comply with Accounting Standards and the Corporations Regulations 2001; and
(b) give a true and fair view of the consolidated entity’s financial position as at 30 June 2012 and of its
performance for the year ended on that date.
1. The Company has included in the notes to the financial statements an explicit and unreserved statement of
compliance with International Financial Reporting Standards.
2. In the Directors’ opinion, there are reasonable grounds to believe that the Company will be able to pay its debts
as and when they become due and payable.
3. The remuneration disclosures included in pages 7 to 10 of the Directors’ Report (as part of the audited
Remuneration Report), for the year ended 30 June 2012, comply with section 300A of the Corporations Act
2001.
4. The Directors have been given the declarations by the Managing Director and Chief Financial Officer required
by section 295A.
The members of the Closed Group identified in note 21 are parties to the deed of cross guarantee under which each
company guarantees the debts of the others. At the date of this declaration there are reasonable grounds to believe
that the companies which are parties to this deed of cross guarantee will as a consolidated entity be able to meet any
obligations or liabilities to which they are, or may become, subject to, by virtue of the deed of cross guarantee
described in note 21.
This declaration is made in accordance with a resolution of the Board of Directors and is signed for and on behalf of
the Directors by:
On behalf of the Board
Alan Brown
Chairman
Melbourne
21 August 2012
For
per
sona
l use
onl
y
Moore Stephens ABN 39 533 589 331. Liability limited by a scheme approved under Professional Standards Legislation. An independent member of Moore Stephens International Limited – members in principal cities throughout the world. The Melbourne Moore Stephens firm is not a partner or agent of any other Moore Stephens firm. And is a separate partnership in Victoria.
Level 10, 530 Collins Street
Melbourne VIC 3000
T +61 (0)3 8635 1800 F +61 (0)3 8102 3400
www.moorestephens.com.au
INDEPENDENT AUDITOR’S REPORT
TO THE MEMBERS OF TRAFFIC TECHNOLOGIES LIMITED Report on the Financial Report We have audited the accompanying financial report of Traffic Technologies Limited, which comprises the statement of financial position as at 30 June 2012, the statement of comprehensive income, the statement of changes in equity and the statement of cash flows for the year then ended, notes comprising a summary of significant accounting policies and other explanatory information, and the directors’ declaration of the consolidated entity comprising the company and the entities it controlled at the year’s end or from time to time during the financial year. Directors’ Responsibility for the Financial Report
The directors of the company are responsible for the preparation of the financial report that gives a true and fair view in accordance with Australian Accounting Standards and the Corporations Act 2001 and for such internal control as the directors determine is necessary to enable the preparation of the financial report that is free from material misstatement, whether due to fraud or error. In Note 1 a), the directors also state, in accordance with Accounting Standard AASB 101 Presentation of Financial Statements, that the financial statements comply with International Financial Reporting Standards. Auditor’s Responsibility
Our responsibility is to express an opinion on the financial report based on our audit. We conducted our audit in accordance with Australian Auditing Standards. Those standards require that we comply with relevant ethical requirements relating to audit engagements and plan and perform the audit to obtain reasonable assurance about whether the financial report is free from material misstatement. An audit involves performing procedures to obtain audit evidence about the amounts and disclosures in the financial report. The procedures selected depend on the auditor’s judgement, including the assessment of the risks of material misstatement of the financial report, whether due to fraud or error. In making those risk assessments, the auditor considers internal control relevant to the entity’s preparation and fair presentation of the financial report in order to design audit procedures that are appropriate in the circumstances, but not for the purpose of expressing an opinion on the effectiveness of the entity’s internal control. An audit also includes evaluating the appropriateness of accounting policies used and the reasonableness of accounting estimates made by the directors, as well as evaluating the overall presentation of the financial report. We believe that the audit evidence we have obtained is sufficient and appropriate to provide a basis for our audit opinion. Independence
In conducting our audit, we have complied with the independence requirements of the Corporations Act 2001. We confirm that the independence declaration required by the Corporations Act 2001, which has been given to the directors of Traffic Technologies Limited would be the same terms if given to the directors as at the time of this auditor’s report.
For
per
sona
l use
onl
y
Opinion
In our opinion: a) the financial report of Traffic Technologies Limited is in accordance with the Corporations Act
2001, including: i) giving a true and fair view of the company’s financial position as at 30 June 2012 and of its
performance for the year ended on that date; and
ii) complying with Australian Accounting Standards and the Corporations Regulations 2001; and
b) the financial reports also complies with International Financial Reporting Standards as disclosed
in Note 1 a). Report on the Remuneration Report
We have audited the Remuneration Report included in pages 7 to 10 of the directors’ report for the year ended 30 June 2012. The directors of the company are responsible for the preparation and presentation of the Remuneration Report in accordance with section 300A of the Corporations Act 2001. Our responsibility is to express an opinion on the Remuneration Report, based on our audit conducted in accordance with Australian Auditing Standards. Opinion
In our opinion, the Remuneration Report of Traffic Technologies Limited for the year ended 30 June 2012 complies with section 300A of the Corporations Act 2001.
MOORE STEPHENS Chartered Accountants
Nick Michael Partner Melbourne 21 August 2012
For
per
sona
l use
onl
y

ASX Additional Information
As at 10 August 2012
89
Additional information required by the Australian Securities Exchange and not shown elsewhere in this report is as
follows. The information is current as at 10 August 2012.
(ii) Distribution of Equity Securities
The number of shareholders, by size of holding, in each class of share are:
Ordinary Shares
Number of
Holders
Number of
Shares
1 - 1,000 134 18,867
1,001 - 5,000 42 126,962
5,001 - 10,000 42 354,508
10,001 - 100,000 417 19,231,532
100,001 and over 174 156,390,502
809 176,122,371
Holdings less than a marketable parcel 233 682,286
d) Twenty Largest Holders
The names of the twenty largest holders of quoted shares are:
Ordinary Shares
Name Number
Percentage
1. LIOSATOS SUPERANNUATION FUND PTY LTD <LIOSATOS SUPER
FUND A/C>* 11,717,162 6.65%
2. SEASPIN PTY LTD <APHRODITE A/C> 11,573,922 6.57%
3. K J ALDRIDGE INVESTMENT GROUP PTY LTD 9,468,562 5.38%
4. CJT NOMINEES PTY LTD 8,500,000 4.83%
5. DE LA HAYE SUPER FUND PTY LTD <DE LA HAYE SUPER FUND
A/C> 6,428,000 3.65%
6. MR VICTOR JOHN PLUMMER 6,171,055 3.50%
7. BANNABY INVESTMENTS PTY LTD <BANNABY SUPER FUND A/C> 5,750,000 3.26%
8. BROWNLOW PTY LTD 5,300,000 3.01%
9. GP MANAGEMENT P/L <G&R S/F A/C> 4,607,526 2.62% 10. MR LAMBROU LIOSATAU* 3,346,757 1.90%
11. MR ALAN JOHN BROWN + MRS PAULA JANET BROWN <A & P
BROWN FAMILY S/F A/C>* 3,191,965 1.81%
12. KENSINGTON CAPITAL MANAGEMENT PTY LTD 3,100,000 1.76%
13. DOLPHIN CAPITAL PARTNERS PTY LTD 3,003,992 1.71%
14. PUNTY LANE WINES PTY LTD <THE PETHOL FAMILY A/C> 3,000,000 1.70%
15. UBS WEALTH MANAGEMENT AUSTRALIA NOMINEES PTY LTD 2,925,209 1.66%
16. MR SAMUEL KAVOURAKIS + MRS TOULA KAVOURAKIS
<KAVOURAKIS SUPERFUND A/C> 2,481,101 1.41%
17. MR PETER GEOFFREY HOLLICK 2,000,000 1.14%
18. JMW & LOB BUSINESS GROUP PTY LTD 2,000,000 1.14% 19. PAL NOMINEES PTY LTD <ANGELA WOOD SUPER FUND A/C> 2,000,000 1.14%
20. MR ROBERT SCOTT MINNEY 1,997,082 1.13%
Total 98,562,333 55.97%
* Associated with Directors.
For
per
sona
l use
onl
y
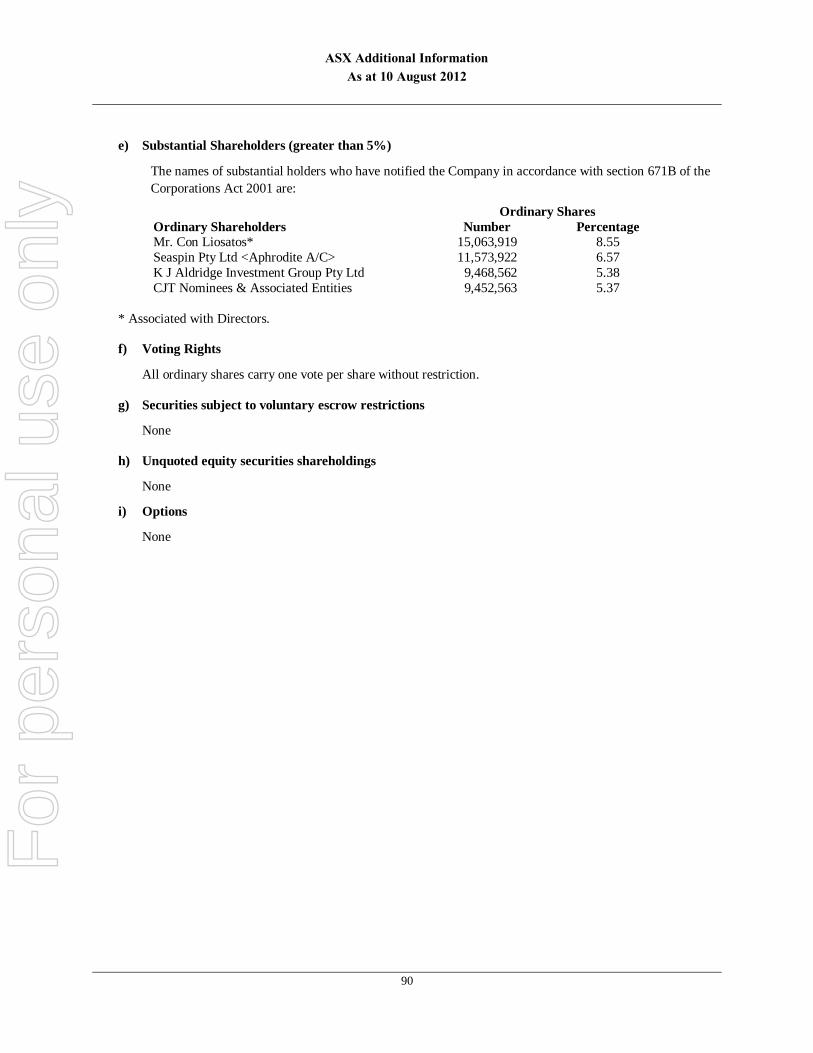
ASX Additional Information
As at 10 August 2012
90
e) Substantial Shareholders (greater than 5%)
The names of substantial holders who have notified the Company in accordance with section 671B of the
Corporations Act 2001 are:
Ordinary Shares
Ordinary Shareholders Number Percentage
Mr. Con Liosatos* 15,063,919 8.55
Seaspin Pty Ltd <Aphrodite A/C> 11,573,922 6.57
K J Aldridge Investment Group Pty Ltd 9,468,562 5.38
CJT Nominees & Associated Entities 9,452,563 5.37
* Associated with Directors.
f) Voting Rights
All ordinary shares carry one vote per share without restriction.
g) Securities subject to voluntary escrow restrictions
None
h) Unquoted equity securities shareholdings
None
i) Options
None
For
per
sona
l use
onl
y

For
per
sona
l use
onl
y

For
per
sona
l use
onl
y