Traffic-related air quality monitoring in the …...Traffic-related air quality monitoring in the...
49
Traffic-related air quality monitoring in the Wellington Region 2016/17 Tamsin Mitchell Environmental Science Department For more information, contact the Greater Wellington Regional Council: Wellington PO Box 11646 T 04 384 5708 F 04 385 6960 www.gw.govt.nz Masterton PO Box 41 T 06 378 2484 F 06 378 2146 www.gw.govt.nz GW/ESC-T-17/87 September 2017 www.gw.govt.nz [email protected]
Transcript of Traffic-related air quality monitoring in the …...Traffic-related air quality monitoring in the...
Traffic-related air quality monitoring in the Wellington Region 2016/17
Tamsin Mitchell Environmental Science Department
For more information, contact the Greater Wellington Regional Council:
Wellington PO Box 11646
T 04 384 5708 F 04 385 6960 www.gw.govt.nz
Masterton PO Box 41
T 06 378 2484 F 06 378 2146 www.gw.govt.nz
GW/ESC-T-17/87
September 2017
www.gw.govt.nz [email protected]
Report prepared by: T Mitchell Team Leader, Air and Climate
Report reviewed by: N Talbot Air Quality Scientist Auckland Council
N Talbot
Report edited by: P Fairbrother Senior Science Coordinator, GWRC
Report approved for release by: L Butcher Manager, Environmental Science
Date: 24 October 2017
DISCLAIMER
This report has been prepared by Environmental Science staff of Greater Wellington Regional Council (GWRC) and as such does not constitute Council policy.
In preparing this report, the authors have used the best currently available data and have exercised all reasonable skill and care in presenting and interpreting these data. Nevertheless, GWRC does not accept any liability, whether direct, indirect, or consequential, arising out of the provision of the data and associated information within this report. Furthermore, as GWRC endeavours to continuously improve data quality, amendments to data included in, or used in the preparation of, this report may occur without notice at any time.
GWRC requests that if excerpts or inferences are drawn from this report for further use, due care should be taken to ensure the appropriate context is preserved and is accurately reflected and referenced in subsequent written or verbal communications. Any use of the data and information enclosed in this report, for example, by inclusion in a subsequent report or media release, should be accompanied by an acknowledgement of the source.
The report may be cited as:
Mitchell T. 2017. Regional traffic-related air quality monitoring, 2016/17. Greater Wellington Regional Council, Publication No. GW/ESCI-T-17/87, Wellington.
Executive summary
A regional network of low cost monitoring sites has been established to measure trends in traffic-related air pollutants. The indicator is based on levels of nitrogen dioxide (a harmful pollutant arising from vehicle emissions) and is designed to allow reporting against the Regional Land Transport Plan 2015 (RLTP) outcome of reduced harmful emissions from transport.
A challenge for regional reporting is ensuring that monitoring data represent wider trends across the region and not an atypical local impact. A monitoring site classification system, developed by National Institute of Atmosphere and Water (NIWA), has been used to select monitoring sites that represent “peak”, “roadside” and “urban background” concentrations of traffic-related air pollutants. The regional network also includes some NZ Transport Agency (NZTA) monitoring sites that fit the NIWA site classification system.
In 2016 the annual average concentration of nitrogen dioxide measured at peak sites was approximately three times greater than that measured at the urban background sites and about one and half times higher than the roadside sites. The monitoring method was shown to have good consistency and is therefore suitable for determining trends over time and between sites. However, nitrogen dioxide measurements by passive diffusion tubes overestimate concentrations relative to the reference method used for compliance monitoring. Therefore concentrations from the network should not be compared to the World Health Organization guideline.
Additional sites are being added to the network in 2017/18 to improve geographic coverage and site classification representativeness. A regional baseline for concentrations of harmful transport generated pollutants will be available for reporting in 2018/19.
Between 2010 and 2016, NZTA’s monitoring sites show a statistically significant downward trend in nitrogen dioxide concentrations. Most of the downward trend occurred between 2010 and 2013, with the last three year period (2014 to 2016) showing a plateauing trend. The GWRC continuous monitoring site in Upper Hutt (urban background) showed a decreasing trend. These trends do not appear to be due to meteorological effects.
It is recommended that the feasibility of measuring other transport generated pollutants such as ultrafine or fine particles, black carbon and nitrogen oxides (NOx) be investigated as suitable sensor technology becomes available. It is also recommended to develop a ‘traffic indicator’ that can be measured at key sites to assist validation and interpretation of future spatial and time series trends in traffic generated pollutants.
Contents
Executive summary i
1. Introduction 1
2. Background 2 2.1 Indicator measure for harmful transport generated pollutants 2 2.2 Vehicle emissions and harmful pollutants 2 2.3 Long term trends in harmful pollutant concentrations 3 2.3.1 Relating trends in pollutant concentrations to trends in emissions 3 2.3.2 Trends in the national emission inventory 4 2.3.3 Trends in on-road vehicle emissions 4 2.4 Future enhancements to indicator measure 5
3. Objectives 7
4. Methodology 8 4.1 Network design 8 4.1.1 Approach 8 4.1.2 Year 1 sites 9 4.1.3 Year 2 sites 10 4.2 Monitoring nitrogen dioxide using passive diffusion tubes 11 4.2.1 Sampling device 11 4.2.2 Measurement bias 12 4.2.3 Measurement precision 12 4.2.4 Monitoring protocols, operation and data reporting 13 4.3 GWRC NO2 reference monitoring sites 14 4.4 Data analysis 15 4.4.1 Calculating annual average nitrogen dioxide concentration 15 4.4.2 Time trends in pollutant concentrations 16
5. Results and discussion 17 5.1 Spatial variation in NO2 passive diffusion tube results 2016 17 5.2 Time trends at NO2 sites with long term data 18 5.2.1 Trends at selected long term NZTA passive NO2 monitoring sites 18 5.2.2 Impact of meteorology on long term NO2 trends 19
6. Recommendations 22
Acknowledgements 23
References 24
Appendix 1: RLPT (2015) outcome and measures 26
Appendix 2: Passive NO2 tube measurement bias and precision 27
Appendix 3: Passive NO2 monitoring sites 2016 28
Appendix 4: Seasonal adjustment method 29
Appendix 5: Passive NO2 monitoring results 2016 31
Appendix 6: Maps of annual average NO2 for sites in 2016 32
Appendix 7: Time trends NZTA passive NO2 sites 37
Appendix 8: Time trends GWRC continuous NO2 site 42

Traffic-related air quality monitoring in the Wellington Region
PAGE 1 OF 43
1. IntroductionA new air quality indicator has been developed to track trends in traffic-relatedair pollution across the region. The indicator has been designed to enableannual reporting on the new outcome in the Regional Land Transport Plan2015 for reduced harmful emissions from transport using a measure ofConcentrations of harmful transport generated pollutants (Appendix 1).
Previous reporting on traffic-related air pollution was not necessarilyrepresentative of regional trends as it was based on one fixed GWRC airquality monitoring site in central Wellington and more recently the NewZealand Transport Agency (NZTA) passive nitrogen dioxide monitoringnetwork which is biased towards sites influenced by state highway traffic.
The design and implementation of a monitoring network for the new air qualityindicator began in 2016/17 and the purpose of this report is to document themethodology, the monitoring network design and report on the first years’worth of results for the 2016 calendar year. Some preliminary findings onseven year trends (from 2010 to 2016) in traffic-related air pollutants atexisting NZTA monitoring sites and at one GWRC continuous monitoring siteare presented.
Traffic-related air quality monitoring in the Wellington Region
PAGE 2 OF 43
2. Background
2.1 Indicator measure for harmful transport generated pollutants Nitrogen dioxide (NO2) was chosen as the primary measure of harmful traffic generated pollutants for the RLTP indicator because at roadside locations it is:
a) Highly specific to local traffic emissions and therefore can be used as aproxy for the complex mixture of harmful traffic-related air pollution thatalso contains fine and ultrafine particles, including diesel particulate(World Health Organization 2006, p375)
b) A recognised and regulated harmful air pollutant that is linked to increasesin asthma symptoms, reduced lung development and function in childrenand reduced life expectancy (COMEAP 2015). The World HealthOrganization guideline is an annual limit of 40µg/m3 and the NES-AQ1 isa 1-hour limit of 200 µg/m3
c) Relatively inexpensive to measure using passive diffusion tubes whichhave a well-established methodology and QA/QC procedure
d) An established national environmental reporting indicator (Ministry for theEnvironment and Statistics NZ 2014) used by other regional councils andunitary authorities for regional state of the environment monitoring andlocal studies; both by diffusion tubes and reference monitoring instrument.
2.2 Vehicle emissions and harmful pollutants Emissions from the combustion of fossil fuels include particulate matter (PM2.5 and ultrafine PM0.1), carbon monoxide, hydrocarbons including volatile organic compounds (VOC), and nitrogen oxides (NOx). The greenhouse gas, carbon dioxide (CO2) is reported on under a separate measure for transport generated emissions. Black carbon emitted by vehicle exhausts is both a harmful pollutant and a short-lived climate warming pollutant.
Nitrogen dioxide (NO2) is a secondary pollutant formed when nitric oxide (NO) emitted from combustion of fuel reacts with ground-level ozone (O3) according to the simplified reaction equation:
NO + O3 → NO2 + O2
The amount of NO2 formed near the roadside where NO is emitted by passing vehicles is limited by the availability of ozone for the reaction. Once all the ozone is depleted by the reaction, no further NO2 is produced until the emitted NO is dispersed further afield where it can react with air containing higher levels of ozone. The mixture of NO and NO2 (as well as other species) in the air is collectively known as nitrogen oxides (NOx)2. Nitrogen dioxide is, therefore, a measure of the harmful impact of traffic emissions on air quality, whilst NOx is a more direct measure of vehicle emissions. Diesel engines typically produce more NOx compared to petrol engines and a greater
1 Resource Management (National Environmental Standards for Air Quality) Regulations 2004. Available at http://www.legislation.govt.nz/regulation/public/2004/0309/latest/DLM286835.html?search=ta_regulation_R_rc%40rinf%40rnif_an%40bn%40rn_25_a&p=3 2 NOx = NO + NO2
Traffic-related air quality monitoring in the Wellington Region
PAGE 3 OF 43
proportion of the NOx produced by diesel engines is directly emitted as NO2. (Carslaw et al. 2011).
PM10 is also produced by non-combustion processes associated with road transport. Particles are generated from the mechanical abrasion of vehicle tyres, brake and clutch wear and general road surface wear. Vehicle turbulence and wind causes these particles to become airborne where they contribute to measured particle levels. The settled ‘road dust’ contains transitional metals such as zinc and copper and other hydrocarbons. When it rains these contaminants enter the storm water system where they are discharged into waterbodies (Gardiner et al. 2016). PM10 and PM2.5 are also produced by non-traffic sources, such as crustal matter, dust from road works and naturally occurring marine aerosol. These sources contribute to measured levels of PM mass at roadsides and therefore PM10 is not always a useful indicator of traffic-related air pollutants. Black carbon is generated solely from combustion sources and therefore is a better marker of traffic emissions than PM10.
The degree to which vehicle emissions result in elevated levels of NO2 at the roadside depends on many factors. At the daily scale, different levels of traffic intensity throughout the day due to commuter travel patterns lead to a distinct diurnal pattern, with highest concentrations in the am peak, a lower inter-peak and a second evening peak. Typically the am peak in air pollution is higher than the pm peak due to differences in meteorology rather than traffic intensity. Morning meteorological conditions are generally more stable with lower wind speeds less favourable for dispersion of emissions. Higher emissions due to ‘cold start’ vehicle engines may also contribute to elevated air pollution levels during the early morning period.
At the seasonal scale, NO2 concentrations are typically elevated in winter relative to other times of the year. This seasonal pattern is thought to be mainly due to meteorology, with winter conditions being less favourable for dispersion of air pollutants and possibly influence of naturally occurring higher levels of background ozone (Longley et al. 2016).
Nitrogen dioxide measurements typically show strong spatial gradients in built-up urban areas. Measurements can vary markedly across quite small distances, eg, on the same street. An observational study in Auckland CBD using locally developed land use regression modelling found that distance to an intersection with traffic lights, proximity to a bus stop and street width were the most significant determinants of NO2 concentrations (Miskell et al. 2015).
2.3 Long term trends in harmful pollutant concentrations
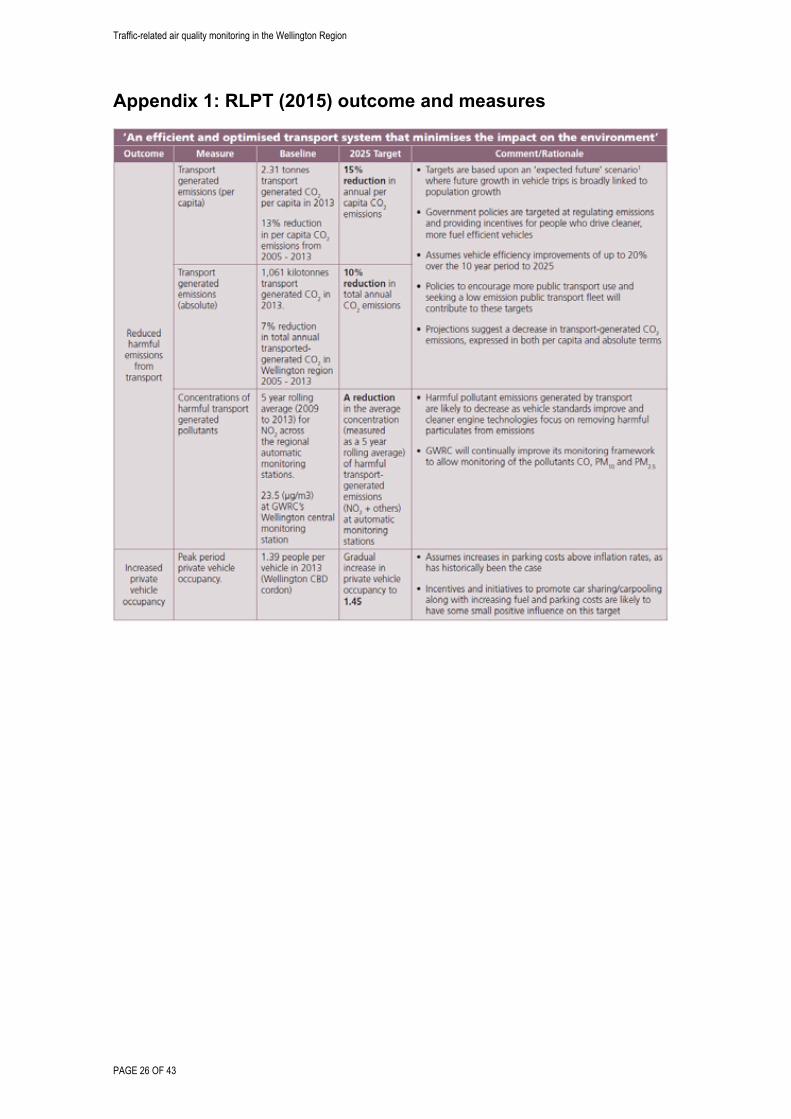
2.3.1 Relating trends in pollutant concentrations to trends in emissions The RLTP outcome expects harmful pollutant concentrations to decrease as vehicle standards improve and cleaner engine technologies that focus on removing harmful particulates from emissions penetrate the vehicle fleet. A challenge for reporting on this outcome is interpreting trends in roadside NO2 concentrations at specific monitoring locations in terms of trends in national or regional vehicle fleet emissions. Individual roadside sites may be influenced by fleet profile characteristics that differ from the national or regional average or
Traffic-related air quality monitoring in the Wellington Region
PAGE 4 OF 43
experience changes in driving conditions such as increased congestion. Therefore in designing the indicator measure selecting monitoring site locations that are broadly representative of regional trends, not just local influences or non-road emission sources is critical. Additional finer scale traffic information may be required to explain trends at particular sites particularly if this is needed to evaluate impacts of policies and interventions designed to reduce emissions.
Reconciling trends in observed NO2 concentrations with emission inventories is not straightforward, as emission inventories are typically based on NOx emissions and do not take into account the effect of photochemical reactions which mean that the relationship between NOx emissions and measured NO2 concentrations are not necessarily linear.
2.3.2 Trends in the national emission inventory A vehicle emissions prediction model VEPM (developed by Auckland Council and NZTA) is used to quantify national vehicle emissions (tonnes per square km per year) and predict how these are likely to change over time including the impact of new technology, improved fuel, fleet profile, average speeds and VKT (NZ Transport Agency, 2013A). VEPM uses emission factors from the European COmputer Programme to Calculate Emissions from Road Transport, known as COPERT. Annual emissions estimates from VEPM for CO, VOC, NOx, CO2, PM10 and PM2.5 are available through the Ministry for the Environment’s Data Service3 and are used as a ‘pressure indicator’ of on-road vehicle emissions for national environmental reporting on the air domain.
Reduced emissions of CO, NOx, VOC and PM10 from on-road vehicles between 2001 and 2012, due to improvements in vehicle fleet and fuel quality, were reported in the 2014 Air Domain Report (Ministry for the Environment & Statistics New Zealand, 2014). Data from the national emissions inventory can be disaggregated by region. In the Wellington region from 2009 to 2013, NOx was predicted to decrease by 16%. Emissions predictions for 2014 onwards were not available at the time of writing and it is not known whether this emissions inventory will be updated for future national Air Domain reports.
2.3.3 Trends in on-road vehicle emissions A recognised issue with emission inventories is emission factors used in the model do not necessarily accurately reflect on-road operating conditions. Additionally the in-service vehicle fleet may differ from the registered fleet. Remote sensing campaigns to establish the emissions profile for on-road vehicle fleet under real-world driving conditions were carried out in Auckland during 2003, 2005, 2009, 2011 and 2015 (Bluett et al. 2013, 2016) and in Wellington during 2006 (Bluett & Dey 2007).
The method uses monitoring equipment on the roadside to pass a detector beam through the exhaust plume of a passing single vehicle to measure carbon monoxide (%), carbon dioxide, hydrocarbons (ppm), nitric oxide (NO ppm) and uvSmoke (as an indicator of particulate matter). At the same time a photo of the vehicle’s license plate is taken which is later matched with data on year
3 http://www.mfe.govt.nz/more/data/mfe-data-service#air
Traffic-related air quality monitoring in the Wellington Region
PAGE 5 OF 43
of manufacture, fuel type, engine capacity, vehicle type, country of first registration, gross vehicle mass and odometer reading. A large number of vehicles are sampled at a number of testing sites over a 10 day period to provide disaggregated emissions estimates, ie, by vehicle type, vehicle age, fuel type and vehicle mileage. Approximately 125,000 Auckland vehicles were sampled, with the following trends identified:
Reduced average emissions of CO and NO from the Light Duty Vehicle(LDV) petrol fleet (downward pressure)
Increased average NO emissions from the LDV diesel fleet (upwardpressure)
Steady average emissions from the Heavy Duty Vehicle (HDV) fleet(neutral pressure)
Increasing proportion of diesel vehicles within the LDV fleet (upwardpressure)
Increasing effect of older and gross emitting LDV petrol vehicles (upwardpressure)
Steady traffic numbers (neutral pressure)
Trends in roadside air quality at two regional council continuous monitoring sites in Auckland and Christchurch were found to be consistent with the above trends in on-road emissions (Bluett et al. 2016). The significant decline in measured CO roadside concentrations at both sites matches the observed reduction in emissions of CO from the LDV and HDV fleet. NOx levels also declined at both sites, however most of the reduction was between 2006 and 2010 with concentrations stabilising after this period. The flat trend in recent years was not predicted by VEPM and has been attributed to the upward and downward pressures being balanced (Bluett et al. 2016).
Although there is no reason to suspect that like-for-like Auckland’s vehicles perform differently in their emissions than Wellington vehicles, there could be a difference in the fleet profile between the two regions. Therefore as a separate analysis it may be possible to estimate trends in Wellington’s fleet emissions using the Ministry of Transport’s Motor Vehicle Register.
2.4 Future enhancements to indicator measure The RLTP target (Appendix 1) was developed on the basis that monitored NO2 provides a proxy for the impact of other harmful pollutants from traffic. However, the aim during the course of the RLTP is to improve the reporting and monitoring framework so that levels of other pollutants might be measured, for example particles and NOx. From 2017/18 onwards various low cost particle sensors will be tested and relationships with other pollutants from traffic emissions established. Based on these trials it may be possible to include a cost-effective and meaningful indicator for traffic-generated particle emissions. Another useful indicator is black carbon which is directly emitted by vehicle exhausts. Studies of short-term health effects suggest that BC is a
Traffic-related air quality monitoring in the Wellington Region
PAGE 6 OF 43
better indicator of harmful particulate substances from combustion sources (especially traffic) than undifferentiated particulate matter (PM) mass (World Health Organization 2012). Low-cost sensors for black carbon are not yet available.
Traffic-related air quality monitoring in the Wellington Region
PAGE 7 OF 43
3. ObjectivesThe objective of the monitoring programme is to determine trends in space andtime of traffic-related air pollutants in a cost effective manner using adistributed network of nitrogen dioxide passive diffusion tubes.
This is a multi-year monitoring programme staged as follows:
Year 1 (2015/16) – Programme design and first NO2 spatial survey(Longley et al. 2016)
Year 2 (2016/17) – Commission first tranche of sites based on results ofYear 1 spatial survey to establish interim baseline and undertake secondNO2 spatial survey (Longley 2017).
Year 3 (2017/18) – Commission second tranche of sites based on results ofYear 2 NO2 spatial survey to establish full network for representativebaseline.
Year 4 (2018/19) – Baseline data available for RLPT reporting. Installparticle monitoring and more finely resolved nitrogen dioxide monitoringsensors at key sites if suitable technology available.
Year 5 (2019/20) – Review network for possible rationalisation.
Traffic-related air quality monitoring in the Wellington Region
PAGE 8 OF 43
4. Methodology
4.1 Network design
4.1.1 Approach In 2016, GWRC engaged NIWA to design a region-wide monitoring network suitable for assessing trends in traffic-related air pollution within a limited budget. The Wellington region has strong spatial gradients in nitrogen dioxide due to complex terrain, strong variations in elevation, a geographically constrained road network and higher than average winds in exposed areas. An indicator based on aggregating results from all monitoring sites would obscure valuable information about the different types of impact traffic-related air pollution is having. Therefore, the indicator has three components representing different types of impact:
Urban background
Roadside
Peak.
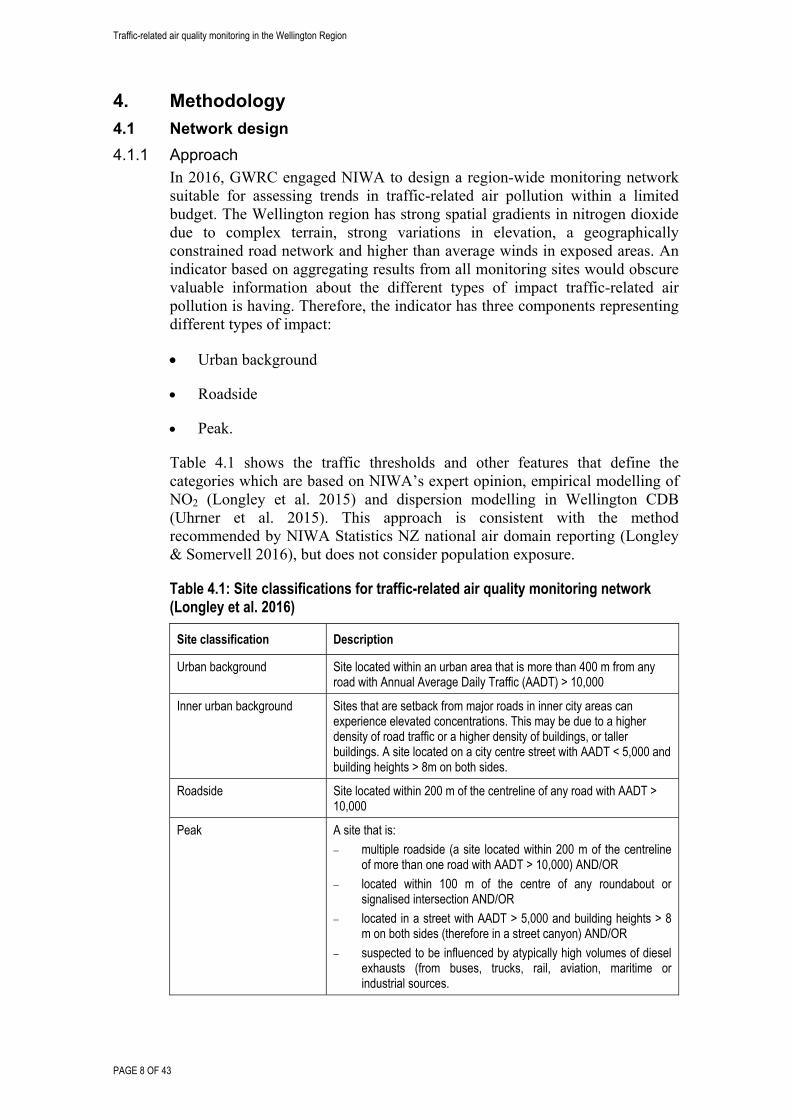
Table 4.1 shows the traffic thresholds and other features that define the categories which are based on NIWA’s expert opinion, empirical modelling of NO2 (Longley et al. 2015) and dispersion modelling in Wellington CDB (Uhrner et al. 2015). This approach is consistent with the method recommended by NIWA Statistics NZ national air domain reporting (Longley & Somervell 2016), but does not consider population exposure.
Table 4.1: Site classifications for traffic-related air quality monitoring network (Longley et al. 2016)
Site classification Description
Urban background Site located within an urban area that is more than 400 m from any road with Annual Average Daily Traffic (AADT) > 10,000
Inner urban background Sites that are setback from major roads in inner city areas can experience elevated concentrations. This may be due to a higher density of road traffic or a higher density of buildings, or taller buildings. A site located on a city centre street with AADT < 5,000 and building heights > 8m on both sides.
Roadside Site located within 200 m of the centreline of any road with AADT > 10,000
Peak A site that is:
multiple roadside (a site located within 200 m of the centreline of more than one road with AADT > 10,000) AND/OR
located within 100 m of the centre of any roundabout or signalised intersection AND/OR
located in a street with AADT > 5,000 and building heights > 8 m on both sides (therefore in a street canyon) AND/OR
suspected to be influenced by atypically high volumes of diesel exhausts (from buses, trucks, rail, aviation, maritime or industrial sources.
Traffic-related air quality monitoring in the Wellington Region
PAGE 9 OF 43
For reporting on the indicator to be unbiased it is critical that the locations selected for monitoring within each site category broadly represent what could be expected across the region and not an atypical local impact. Due to the potential for high spatial variability in NO2 concentration across the region, the methodology for site selection for the different site types included short duration initial screening surveys carried out by NIWA covering a large number of sites. The purpose of these screening surveys was to identify the variability in concentrations measured within and between site categories so that a small set of representative sites could then be selected for inclusion in the network. The geographical range of the region is also represented by splitting the region into zones to further distinguish differences or similarities in trends. NIWA also reviewed existing NZTA sites in the region to determine which ones met the siting criteria and therefore could be included into the new network.
NIWA reviewed existing regional modelled and traffic flow data to identify general long-term trends and any localised deviations from those trends. Ultimately the results of this traffic pattern analysis were not useful for identifying monitoring locations due to data limitations.
NIWA carried out two short-term screening surveys during the summer months with three tube deployments over a period of three to four months at a range of sites. The first survey was undertaken in 2015/16 focusing on characterising the spatial variability in the Wellington CBD (Longley et al. 2016). NIWA undertook the second survey during 2016/17 focussed on identifying urban background sites and peak sites in other centres, such as Upper Hutt and Masterton (Longley 2017).
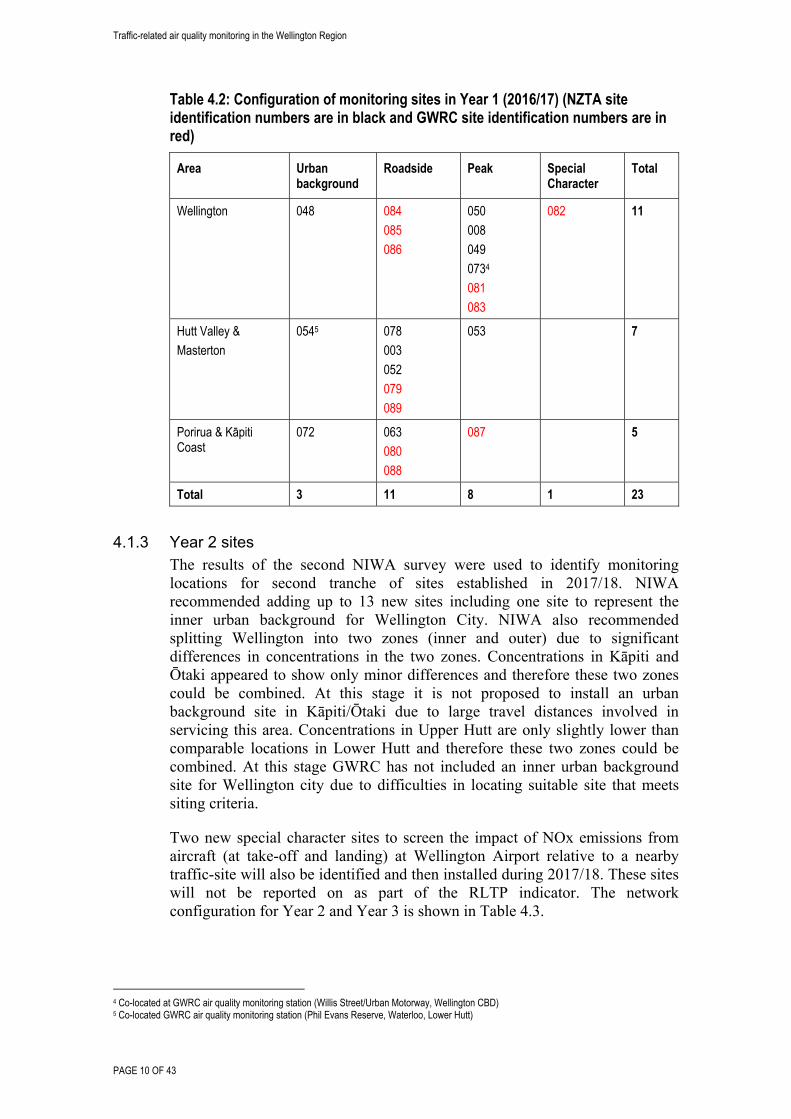
4.1.2 Year 1 sites The results of the first NIWA survey were used to identify monitoring locations for first tranche of sites established in 2016/17. For data analysis and reporting a further category of site was introduced by GWRC called “special character” to represent sites that may be reporting more localised influences or particular sources of emissions and therefore should not be included in the regional indicator, for example, the bus-only lane in Manners Street, Wellington CBD (WEL082). The network configuration for Year 1 is shown in Table 4.2.
Traffic-related air quality monitoring in the Wellington Region
PAGE 10 OF 43
Table 4.2: Configuration of monitoring sites in Year 1 (2016/17) (NZTA site identification numbers are in black and GWRC site identification numbers are in red)
Area Urban background
Roadside Peak Special Character
Total
Wellington 048 084
085
086
050
008
049
0734
081
083
082 11
Hutt Valley &
Masterton
0545 078
003
052
079
089
053 7
Porirua & Kāpiti Coast
072 063
080
088
087 5
Total 3 11 8 1 23
4.1.3 Year 2 sites The results of the second NIWA survey were used to identify monitoring locations for second tranche of sites established in 2017/18. NIWA recommended adding up to 13 new sites including one site to represent the inner urban background for Wellington City. NIWA also recommended splitting Wellington into two zones (inner and outer) due to significant differences in concentrations in the two zones. Concentrations in Kāpiti and Ōtaki appeared to show only minor differences and therefore these two zones could be combined. At this stage it is not proposed to install an urban background site in Kāpiti/Ōtaki due to large travel distances involved in servicing this area. Concentrations in Upper Hutt are only slightly lower than comparable locations in Lower Hutt and therefore these two zones could be combined. At this stage GWRC has not included an inner urban background site for Wellington city due to difficulties in locating suitable site that meets siting criteria.
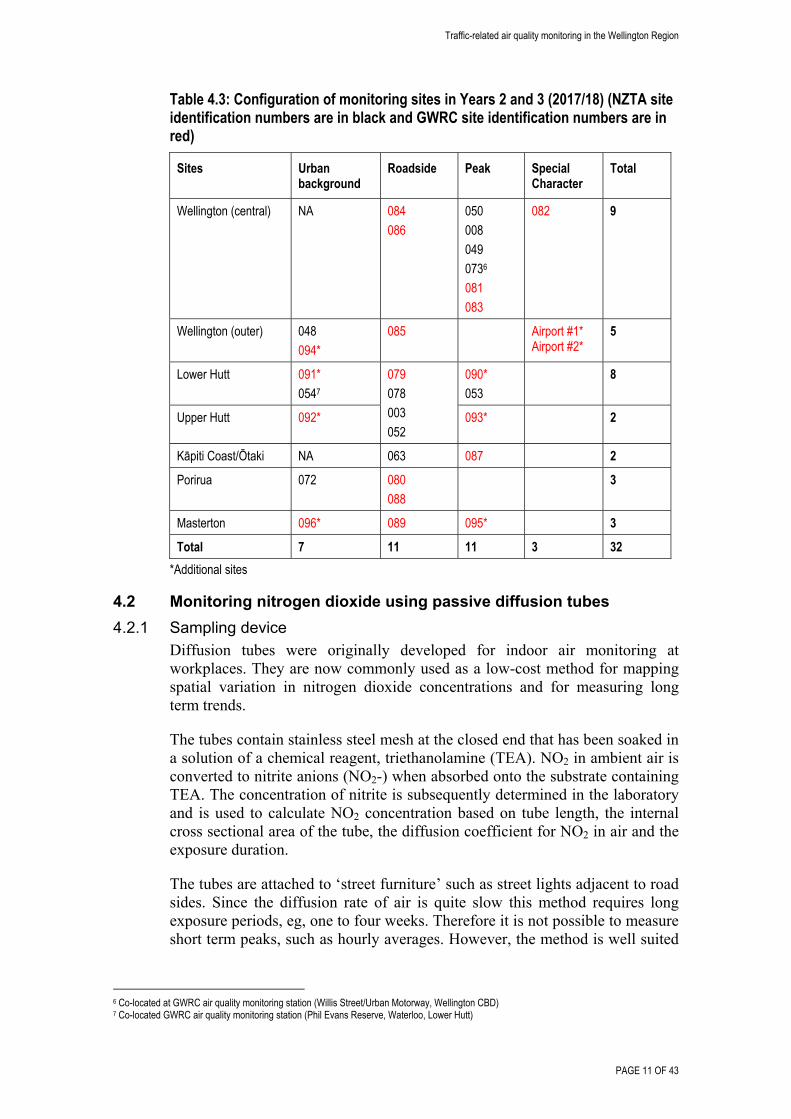
Two new special character sites to screen the impact of NOx emissions from aircraft (at take-off and landing) at Wellington Airport relative to a nearby traffic-site will also be identified and then installed during 2017/18. These sites will not be reported on as part of the RLTP indicator. The network configuration for Year 2 and Year 3 is shown in Table 4.3.
4 Co-located at GWRC air quality monitoring station (Willis Street/Urban Motorway, Wellington CBD) 5 Co-located GWRC air quality monitoring station (Phil Evans Reserve, Waterloo, Lower Hutt)
Traffic-related air quality monitoring in the Wellington Region
PAGE 11 OF 43
Table 4.3: Configuration of monitoring sites in Years 2 and 3 (2017/18) (NZTA site identification numbers are in black and GWRC site identification numbers are in red)
Sites Urban background
Roadside Peak Special Character
Total
Wellington (central) NA 084
086
050
008
049
0736
081
083
082 9
Wellington (outer) 048
094*
085 Airport #1* Airport #2*
5
Lower Hutt 091*
0547
079
078
003
052
090*
053
8
Upper Hutt 092* 093* 2
Kāpiti Coast/Ōtaki NA 063 087 2
Porirua 072 080
088
3
Masterton 096* 089 095* 3
Total 7 11 11 3 32
*Additional sites
4.2 Monitoring nitrogen dioxide using passive diffusion tubes
4.2.1 Sampling device Diffusion tubes were originally developed for indoor air monitoring at workplaces. They are now commonly used as a low-cost method for mapping spatial variation in nitrogen dioxide concentrations and for measuring long term trends.
The tubes contain stainless steel mesh at the closed end that has been soaked in a solution of a chemical reagent, triethanolamine (TEA). NO2 in ambient air is converted to nitrite anions (NO2-) when absorbed onto the substrate containing TEA. The concentration of nitrite is subsequently determined in the laboratory and is used to calculate NO2 concentration based on tube length, the internal cross sectional area of the tube, the diffusion coefficient for NO2 in air and the exposure duration.
The tubes are attached to ‘street furniture’ such as street lights adjacent to road sides. Since the diffusion rate of air is quite slow this method requires long exposure periods, eg, one to four weeks. Therefore it is not possible to measure short term peaks, such as hourly averages. However, the method is well suited
6 Co-located at GWRC air quality monitoring station (Willis Street/Urban Motorway, Wellington CBD) 7 Co-located GWRC air quality monitoring station (Phil Evans Reserve, Waterloo, Lower Hutt)
Traffic-related air quality monitoring in the Wellington Region
PAGE 12 OF 43
for assessing long-term concentration trends (eg, annual averages based on monthly averages).
4.2.2 Measurement bias Diffusion tubes are affected by several sources of interference which can cause substantial under or overestimation (referred to as "bias") compared to the NO2
chemiluminescent analyser (defined within New Zealand as the reference method by the National Environment Standards for Air Quality).
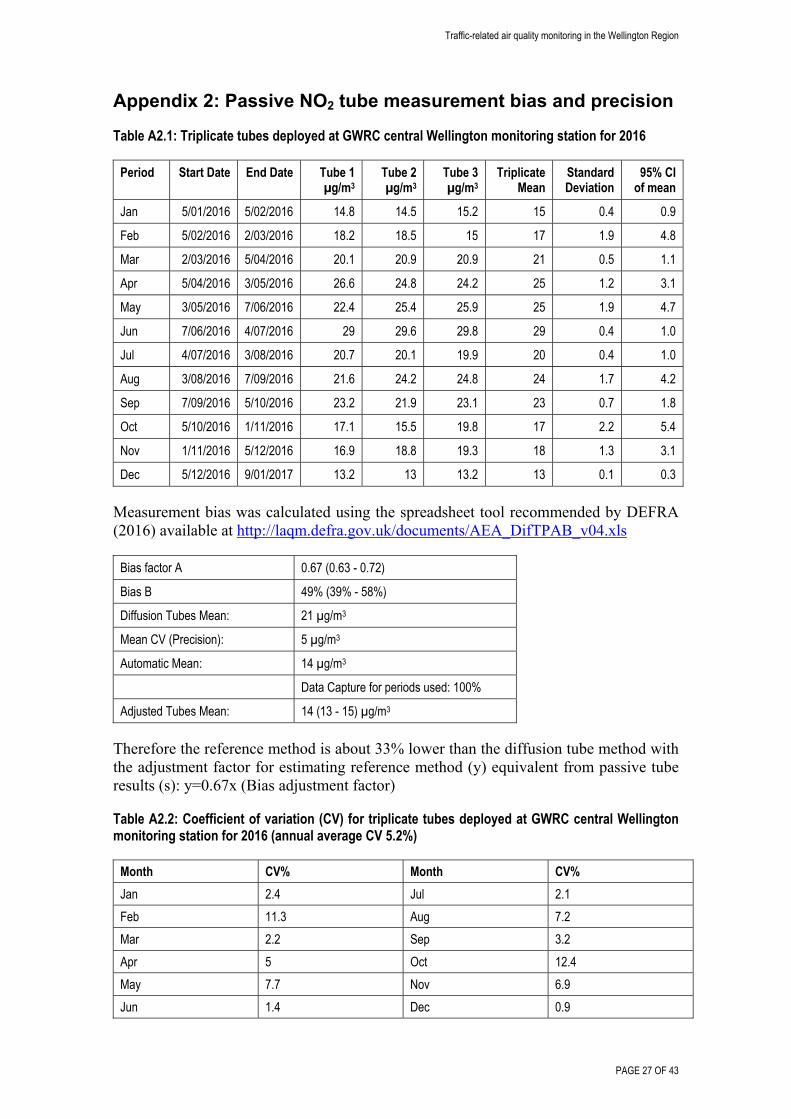
The bias calculated for co-located passive tubes (triplicate) and the chemiluminescent analyser central Wellington monitoring site during 2016 was quite high, ie, +49% (Table A2.1, Appendix 2) meaning that at this site, passive tubes over estimate relative to the chemiluminescent reference method, ie, the reference method measures on average concentrations that are about 33% lower than the passive tube method.
A bias correction will not be applied to passive tube measurements made at the other passive tube monitoring sites as the co-location relationship is site-specific and may not be applicable at other sites where relative concentrations of NO, NO2 and O3 in air may be different due to local characteristics (eg, exposure to wind, traffic intensity and profile and distance to roadside).
The high level of measurement bias at central Wellington monitoring site means that results of passive NO2 monitoring should not be directly compared with the World Health Organization guideline which is based on measurements undertaken using the reference method.
4.2.3 Measurement precision In the context of environmental monitoring, precision is the closeness of agreement between mutually independent test results obtained by repeating a measurement several times under stipulated conditions. The precision of diffusion tube measurements is typically evaluated from the results of triplicate tubes co-located at the same site exposed for the same length of time.
Good precision is important because it means that tubes located at different sites will be internally consistency and therefore we can be confident that results from the network will be useful for showing the relative differences between concentrations at all sites. The precision measure recommended for diffusion tubes is the coefficient of variation (CV) which is calculated monthly by:
CV% = standard deviation of triplicate results * 100 / mean of triplicate results
Tubes are considered to have "good" precision where the coefficient of variation (CV) of duplicate or triplicate diffusion tubes for eight or more periods during the year is less than 20%, and the average CV of all monitoring periods is less than 10%. (DEFRA, 2016).
Calculated CVs for 1-month triplicate observations at GWRC central Wellington air quality monitoring site are presented in Table A2.2, Appendix
Traffic-related air quality monitoring in the Wellington Region
PAGE 13 OF 43
A2. During 2016, the average CV was 5.2% and the CV was less than 20% for each month, indicating that the precision of the passive samplers is satisfactory.
The precision of the UK laboratory Staffordshire Scientific Services (2014-2016) where the tubes are analysed was assessed as “good”8.
4.2.4 Monitoring protocols, operation and data reporting GWRC uses the same monitoring method as the New Zealand Transport Agency (NZTA). In 2016, NZTA’s national monitoring network consists of 120 plus NO2 diffusion tube sites throughout the country which are managed and operated in accordance with an operating manual (NZ Transport Agency 2013B). The NZTA monitoring procedures follow the United Kingdom’s technical guidance document (DEFRA, 2009). NZTA contracts Watercare Services Ltd to manage their network, including engaging Scientific Services Laboratory of Staffordshire County Council, UK, to supply and analyse the passive samplers deployed in NZ.
With the approval of NZTA, Watercare Services Ltd. supplies diffusion tubes for the GWRC operated sites and arranges the UK laboratory analysis and reporting of monitoring results of these ‘project sites’ under the umbrella of NZTA’s National Network. GWRC staff or their contractor is responsible for commissioning the GWRC sites and arranging the monthly tube exchanges.
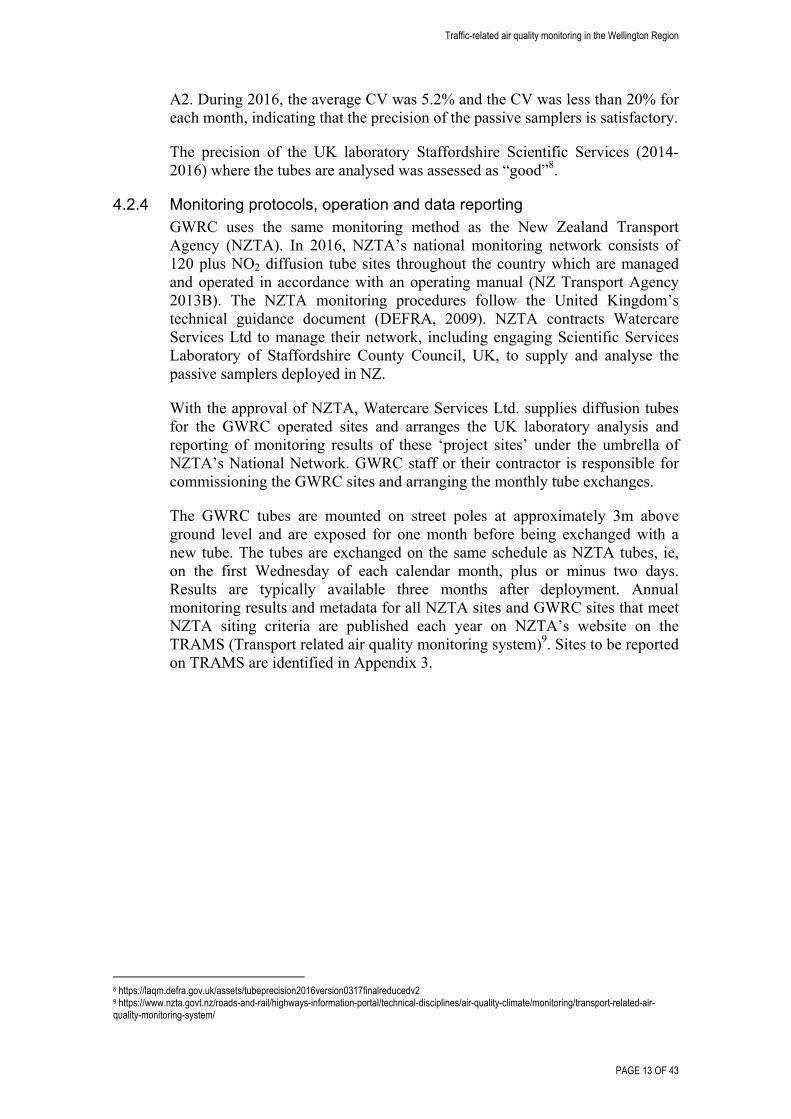
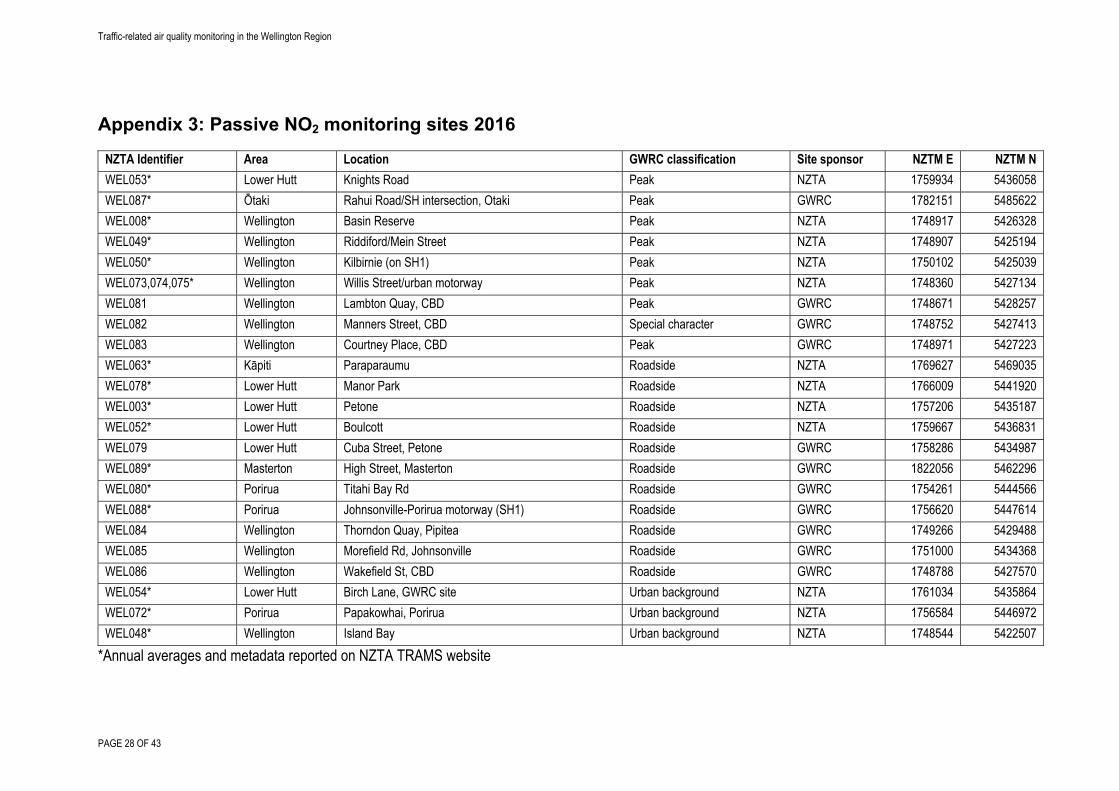
The GWRC tubes are mounted on street poles at approximately 3m above ground level and are exposed for one month before being exchanged with a new tube. The tubes are exchanged on the same schedule as NZTA tubes, ie, on the first Wednesday of each calendar month, plus or minus two days. Results are typically available three months after deployment. Annual monitoring results and metadata for all NZTA sites and GWRC sites that meet NZTA siting criteria are published each year on NZTA’s website on the TRAMS (Transport related air quality monitoring system)9. Sites to be reported on TRAMS are identified in Appendix 3.
8 https://laqm.defra.gov.uk/assets/tubeprecision2016version0317finalreducedv2 9 https://www.nzta.govt.nz/roads-and-rail/highways-information-portal/technical-disciplines/air-quality-climate/monitoring/transport-related-air-quality-monitoring-system/
Traffic-related air quality monitoring in the Wellington Region
PAGE 14 OF 43
Figure 4.1: Passive diffusion tube mounted on street pole adjacent to Titahi Bay Road, Porirua (WEL080)
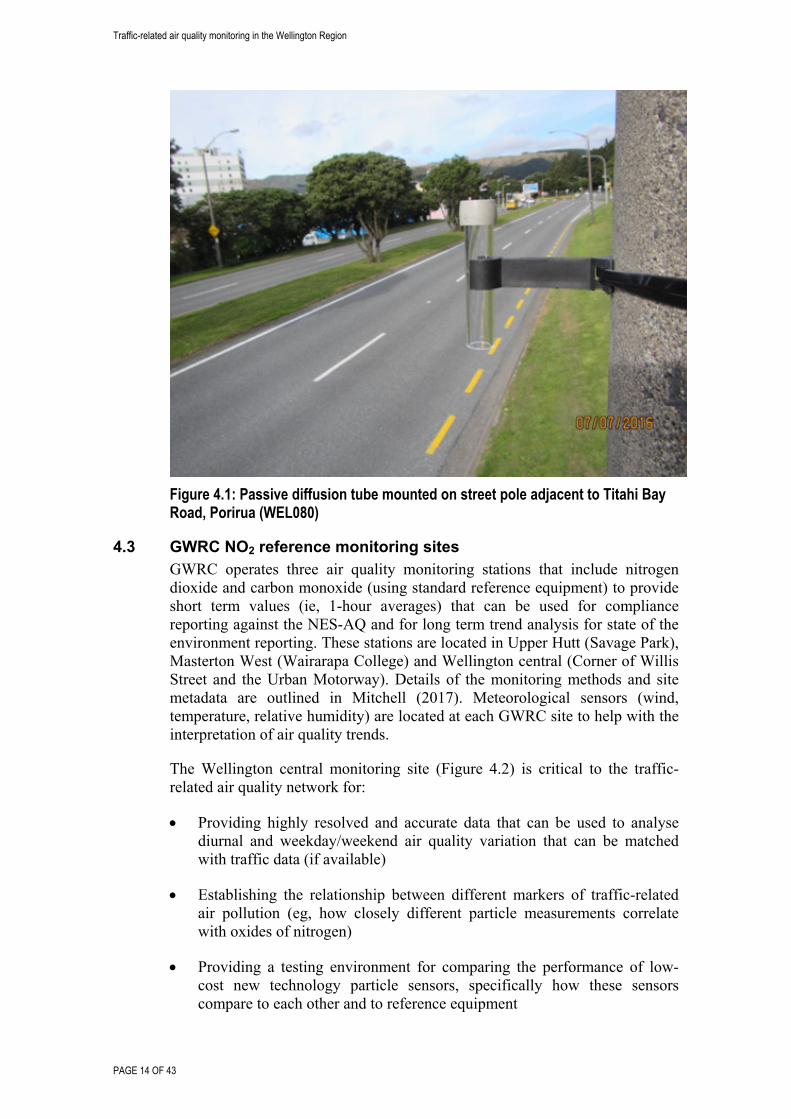
4.3 GWRC NO2 reference monitoring sites GWRC operates three air quality monitoring stations that include nitrogen dioxide and carbon monoxide (using standard reference equipment) to provide short term values (ie, 1-hour averages) that can be used for compliance reporting against the NES-AQ and for long term trend analysis for state of the environment reporting. These stations are located in Upper Hutt (Savage Park), Masterton West (Wairarapa College) and Wellington central (Corner of Willis Street and the Urban Motorway). Details of the monitoring methods and site metadata are outlined in Mitchell (2017). Meteorological sensors (wind, temperature, relative humidity) are located at each GWRC site to help with the interpretation of air quality trends.
The Wellington central monitoring site (Figure 4.2) is critical to the traffic-related air quality network for:
Providing highly resolved and accurate data that can be used to analyse diurnal and weekday/weekend air quality variation that can be matched with traffic data (if available)
Establishing the relationship between different markers of traffic-related air pollution (eg, how closely different particle measurements correlate with oxides of nitrogen)
Providing a testing environment for comparing the performance of low-cost new technology particle sensors, specifically how these sensors compare to each other and to reference equipment
Traffic-related air quality monitoring in the Wellington Region
PAGE 15 OF 43
Co-locating passive nitrogen dioxide tubes to assess the relationship between the reference method and the passive tube method to calculate the precision of the tube method.
Figure 4.2: GWRC Wellington central air quality monitoring reference site
4.4 Data analysis
4.4.1 Calculating annual average nitrogen dioxide concentration Typically air quality concentrations are reported by calendar year rather than financial year as many commonly monitored air pollutants in NZ show seasonal variation, eg, winter exceedances of PM10 in wood smoke environments, therefore reporting by calendar year includes the entire winter period enabling year-to-year comparisons. The NZTA national monitoring reports annual averages of NO2 on a calendar year basis. In order to report a valid annual average 75% data capture is required, equivalent to at least nine months in each calendar year. Because the GWRC monitoring programme commenced at the start of the financial year (June or July 2016) the 75% data capture criteria was not achieved. However, a seasonal adjustment factor was derived in order to report 2016 annual concentrations based on five to six months of results.
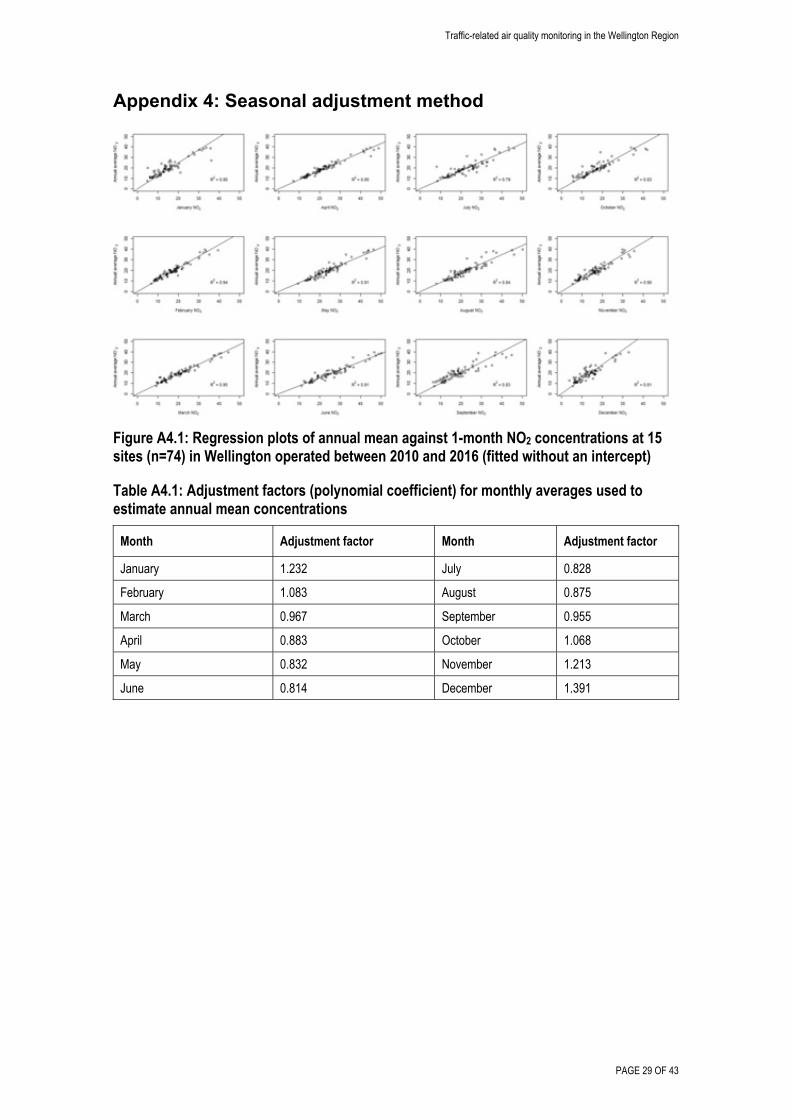
NO2 monthly concentrations measured at 15 Wellington NZTA sites from 2010 to 2016 were used to investigate the relationship between each month of the year and the corresponding annual mean. Simple linear regression plots for each calendar month and annual means are shown in Figure A4.1, Appendix 4). These regression plots were fitted without an intercept.
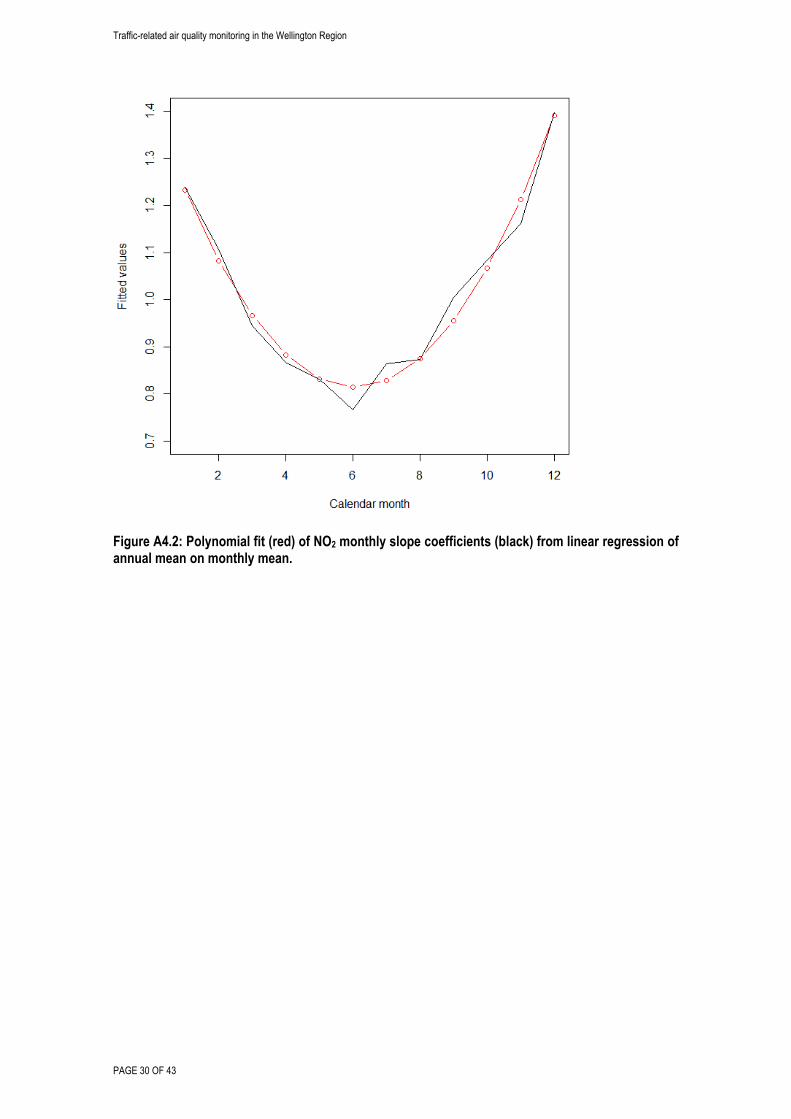
The 12 linear regression slope coefficients (one for each month of the year) were fitted with a second order orthogonal polynomial curve. The fitted values for the 12 coefficients (Table A4.1, Appendix 4) were then used to adjust each 1-month observation in the 2016 dataset for each site where up to six months
Traffic-related air quality monitoring in the Wellington Region
PAGE 16 OF 43
are missing (ie, ≥ 50% annual data capture). The adjusted monthly values were then averaged to provide an estimate of the annual mean for a site.
4.4.2 Time trends in pollutant concentrations It takes several years of data collection before time trends can be established for the regional traffic-related air pollution indicator. However, data from seven NZTA passive nitrogen dioxide monitoring sites established in 2010 (that are now also included in the GWRC network) were analysed for site-specific trends.
To calculate whether there is a statistically significant trend at these sites, the non-parametric Theil-Sen method was used as implemented by the R package openair version 2.1-0 (Carslaw & Ropkins, 2012). Given a set of n x, y pairs, the slopes between all pairs of points are calculated. The Theil-Sen estimate of the slope is the median of all these slopes. Bootstrap resampling provides the estimate of p for the slope. Prior to calculating a linear trend, these data were de-seasonalised by seasonal trend decomposition using loess and any missing data points were linearly interpolated (as implemented in openair).
Percentage change over the time series was calculated as this is useful for comparing slopes for sites with very different concentration levels and for comparison with emission inventories. The percentage change uses the concentration at the beginning and end months to express the mean slope.
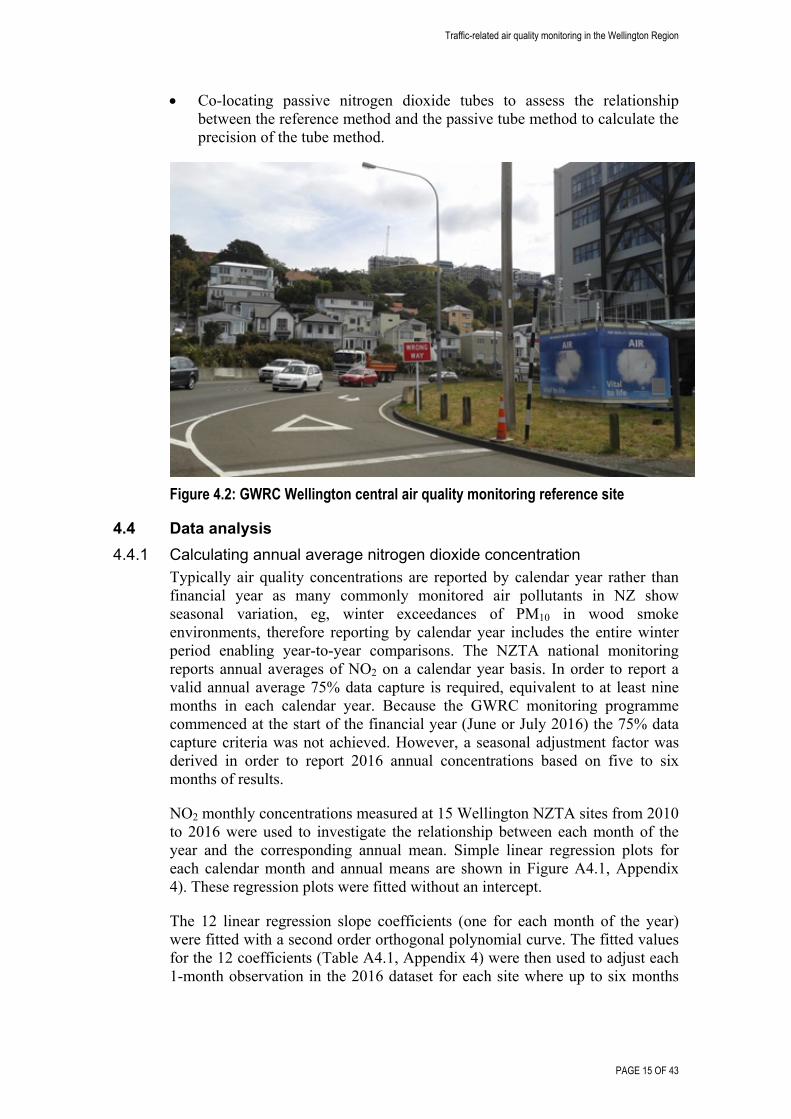
The trend, T is defined as:
where CEnd and CStart are the mean concentrations for the end and start date, respectfully. Nyears is the number of years (or fractions of) the time series spans.
A second method used to look at time trends was seasonal decomposition by moving averages as implemented by the R package stats (version 3.4.1). This is a relatively simple method that decomposes the time series into a seasonal, secular trend and random component. In this case an additive seasonal model was assumed. Any missing values in the time series were imputed using the R package imputeTS (version 2.5) using spline interpolation.
Traffic-related air quality monitoring in the Wellington Region
PAGE 17 OF 43
5. Results and discussion
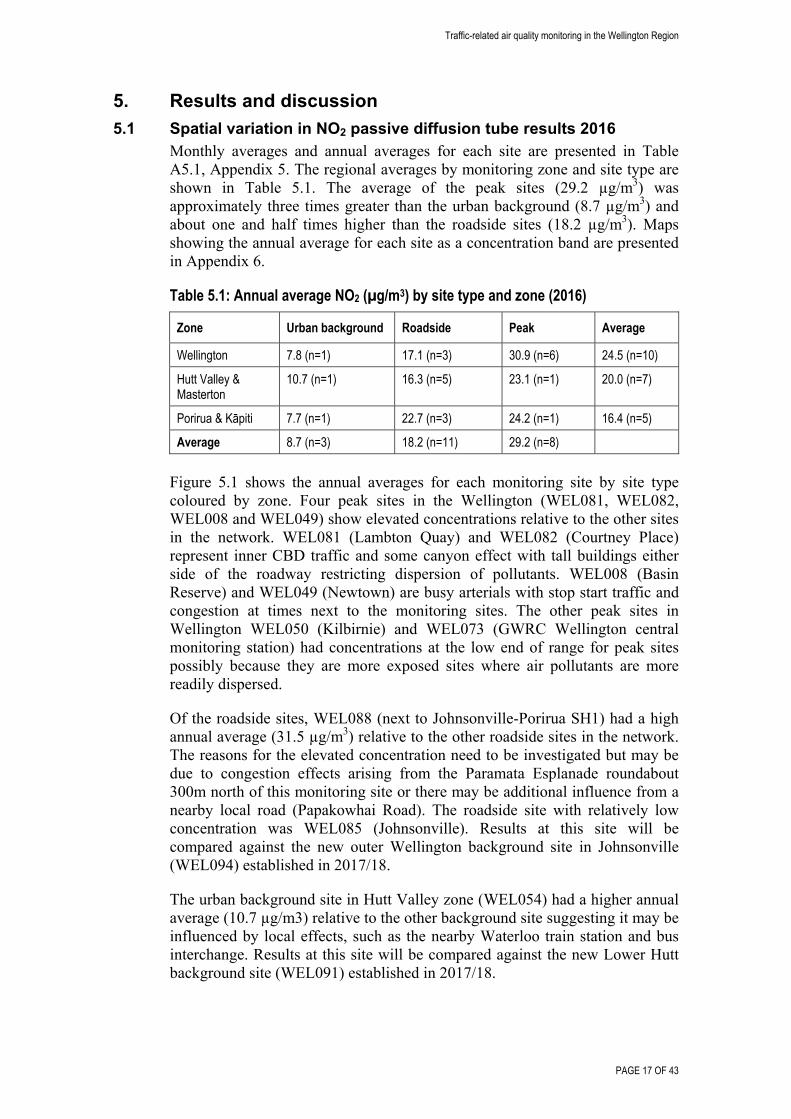
5.1 Spatial variation in NO2 passive diffusion tube results 2016 Monthly averages and annual averages for each site are presented in Table A5.1, Appendix 5. The regional averages by monitoring zone and site type are shown in Table 5.1. The average of the peak sites (29.2 µg/m3) was approximately three times greater than the urban background (8.7 µg/m3) and about one and half times higher than the roadside sites (18.2 µg/m3). Maps showing the annual average for each site as a concentration band are presented in Appendix 6.
Table 5.1: Annual average NO2 (µg/m3) by site type and zone (2016)
Zone Urban background Roadside Peak Average
Wellington 7.8 (n=1) 17.1 (n=3) 30.9 (n=6) 24.5 (n=10)
Hutt Valley & Masterton
10.7 (n=1) 16.3 (n=5) 23.1 (n=1) 20.0 (n=7)
Porirua & Kāpiti 7.7 (n=1) 22.7 (n=3) 24.2 (n=1) 16.4 (n=5)
Average 8.7 (n=3) 18.2 (n=11) 29.2 (n=8)
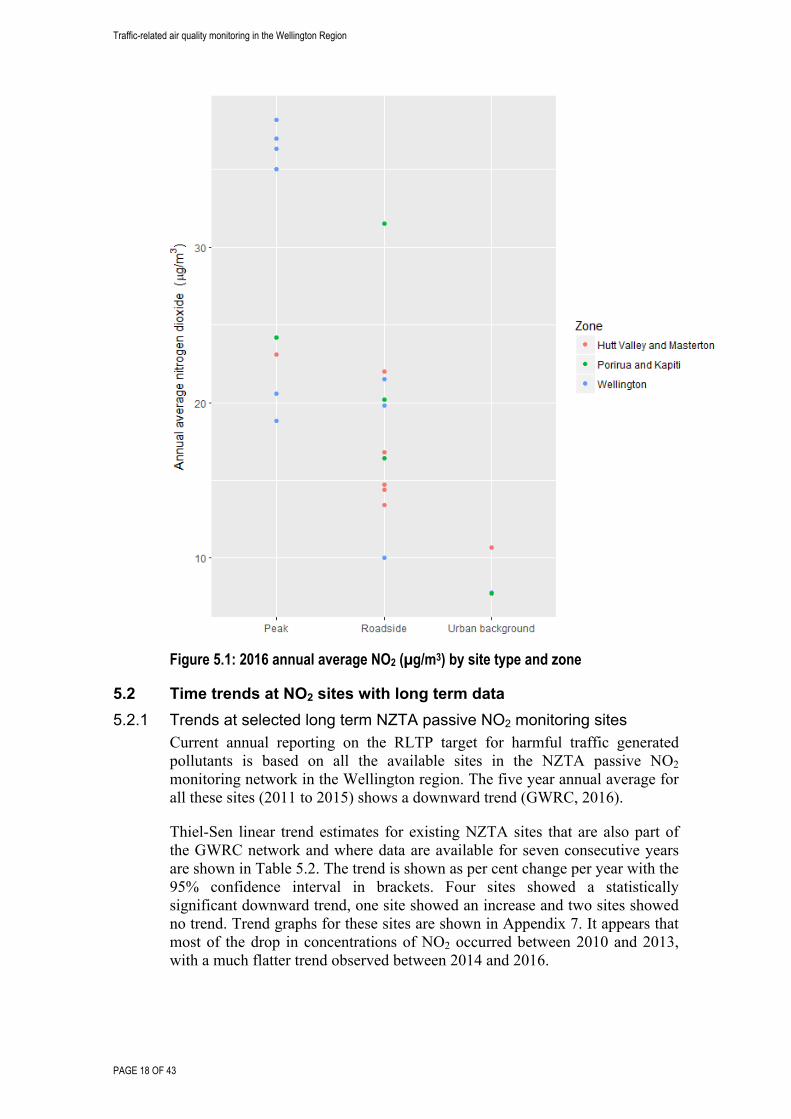
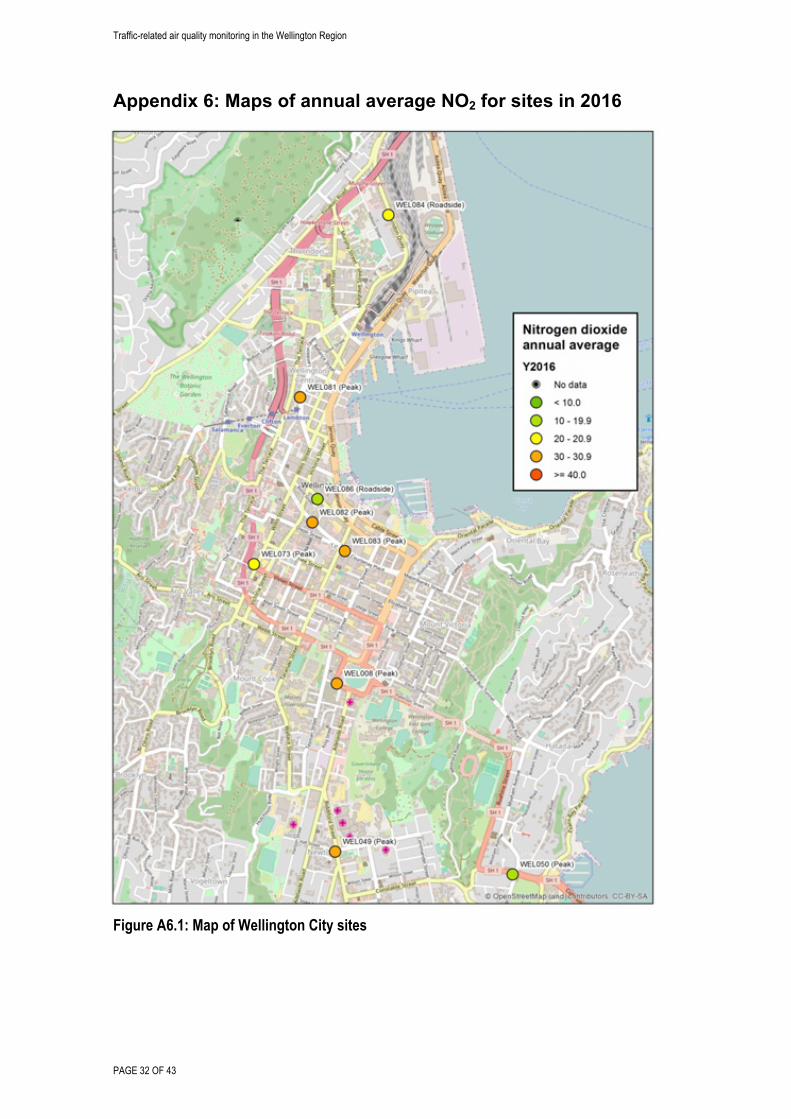
Figure 5.1 shows the annual averages for each monitoring site by site type coloured by zone. Four peak sites in the Wellington (WEL081, WEL082, WEL008 and WEL049) show elevated concentrations relative to the other sites in the network. WEL081 (Lambton Quay) and WEL082 (Courtney Place) represent inner CBD traffic and some canyon effect with tall buildings either side of the roadway restricting dispersion of pollutants. WEL008 (Basin Reserve) and WEL049 (Newtown) are busy arterials with stop start traffic and congestion at times next to the monitoring sites. The other peak sites in Wellington WEL050 (Kilbirnie) and WEL073 (GWRC Wellington central monitoring station) had concentrations at the low end of range for peak sites possibly because they are more exposed sites where air pollutants are more readily dispersed.
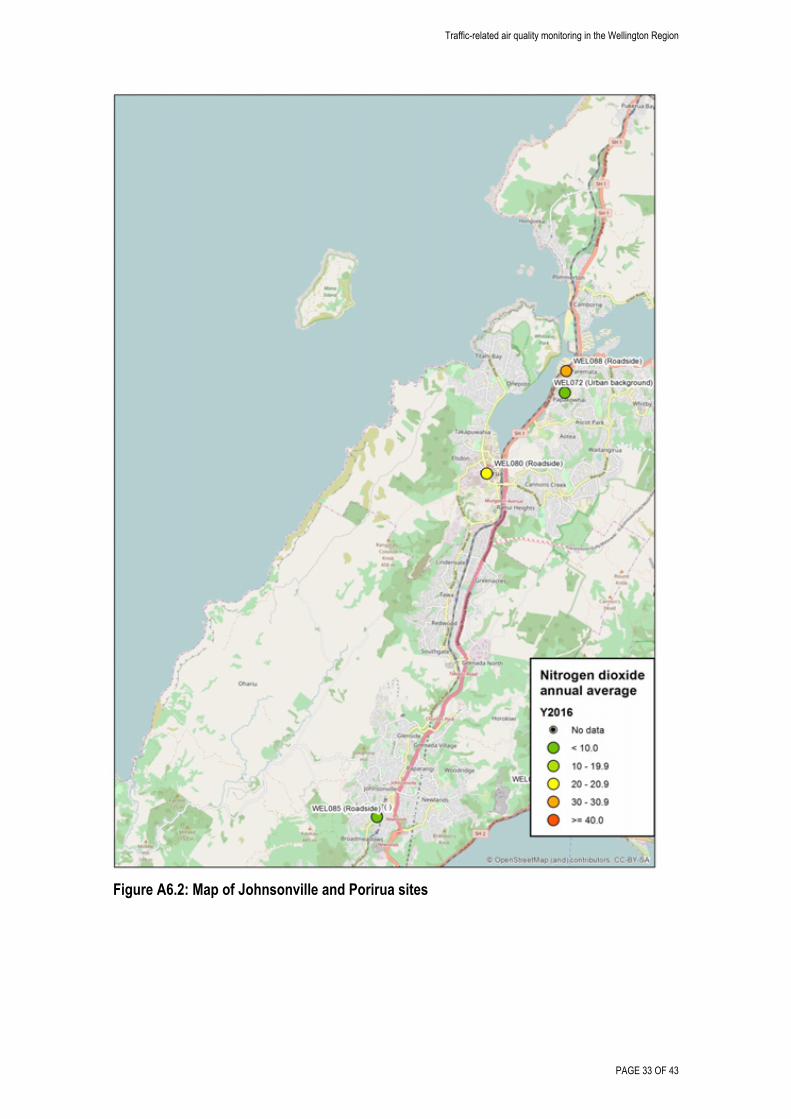
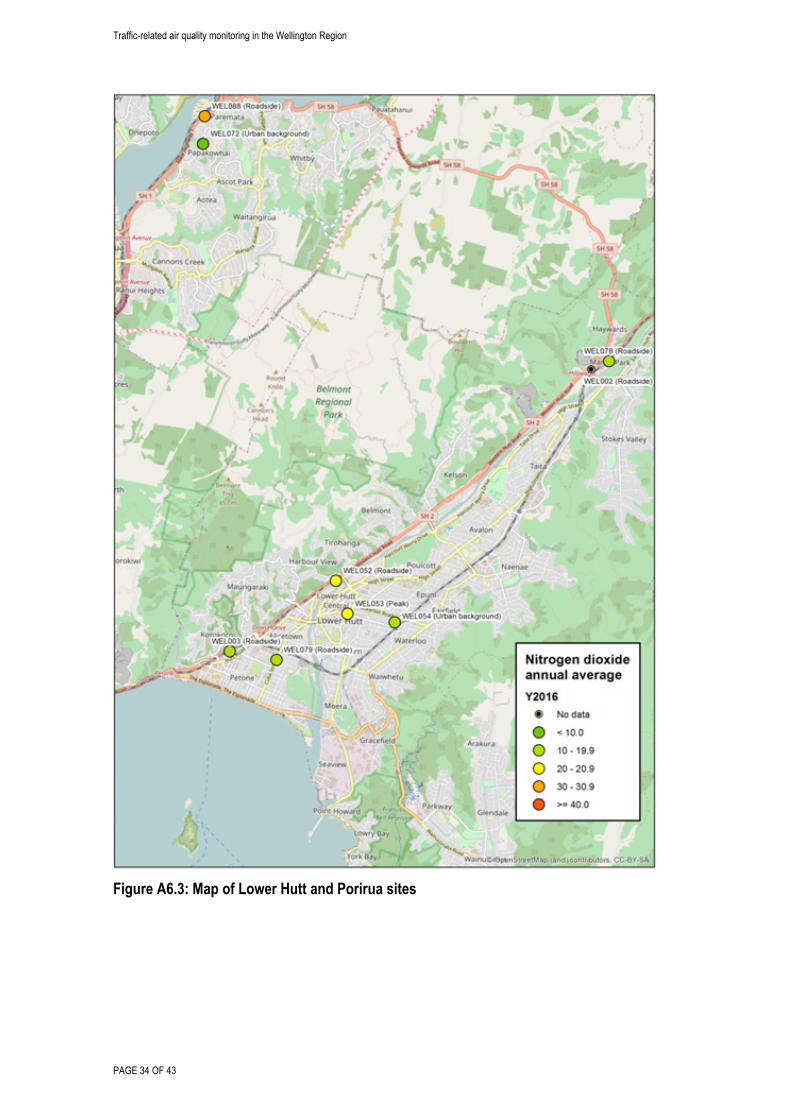
Of the roadside sites, WEL088 (next to Johnsonville-Porirua SH1) had a high annual average (31.5 µg/m3) relative to the other roadside sites in the network. The reasons for the elevated concentration need to be investigated but may be due to congestion effects arising from the Paramata Esplanade roundabout 300m north of this monitoring site or there may be additional influence from a nearby local road (Papakowhai Road). The roadside site with relatively low concentration was WEL085 (Johnsonville). Results at this site will be compared against the new outer Wellington background site in Johnsonville (WEL094) established in 2017/18.
The urban background site in Hutt Valley zone (WEL054) had a higher annual average (10.7 µg/m3) relative to the other background site suggesting it may be influenced by local effects, such as the nearby Waterloo train station and bus interchange. Results at this site will be compared against the new Lower Hutt background site (WEL091) established in 2017/18.
Traffic-related air quality monitoring in the Wellington Region
PAGE 18 OF 43
Figure 5.1: 2016 annual average NO2 (µg/m3) by site type and zone
5.2 Time trends at NO2 sites with long term data
5.2.1 Trends at selected long term NZTA passive NO2 monitoring sites Current annual reporting on the RLTP target for harmful traffic generated pollutants is based on all the available sites in the NZTA passive NO2 monitoring network in the Wellington region. The five year annual average for all these sites (2011 to 2015) shows a downward trend (GWRC, 2016).
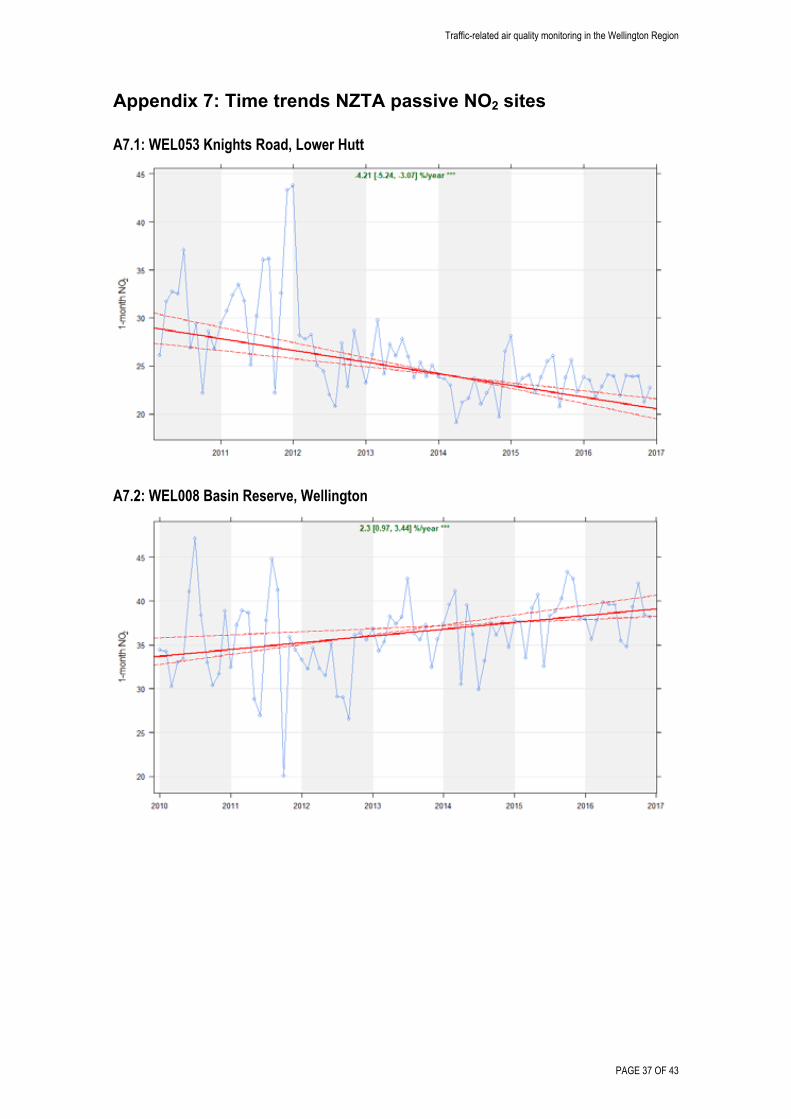
Thiel-Sen linear trend estimates for existing NZTA sites that are also part of the GWRC network and where data are available for seven consecutive years are shown in Table 5.2. The trend is shown as per cent change per year with the 95% confidence interval in brackets. Four sites showed a statistically significant downward trend, one site showed an increase and two sites showed no trend. Trend graphs for these sites are shown in Appendix 7. It appears that most of the drop in concentrations of NO2 occurred between 2010 and 2013, with a much flatter trend observed between 2014 and 2016.
Traffic-related air quality monitoring in the Wellington Region
PAGE 19 OF 43
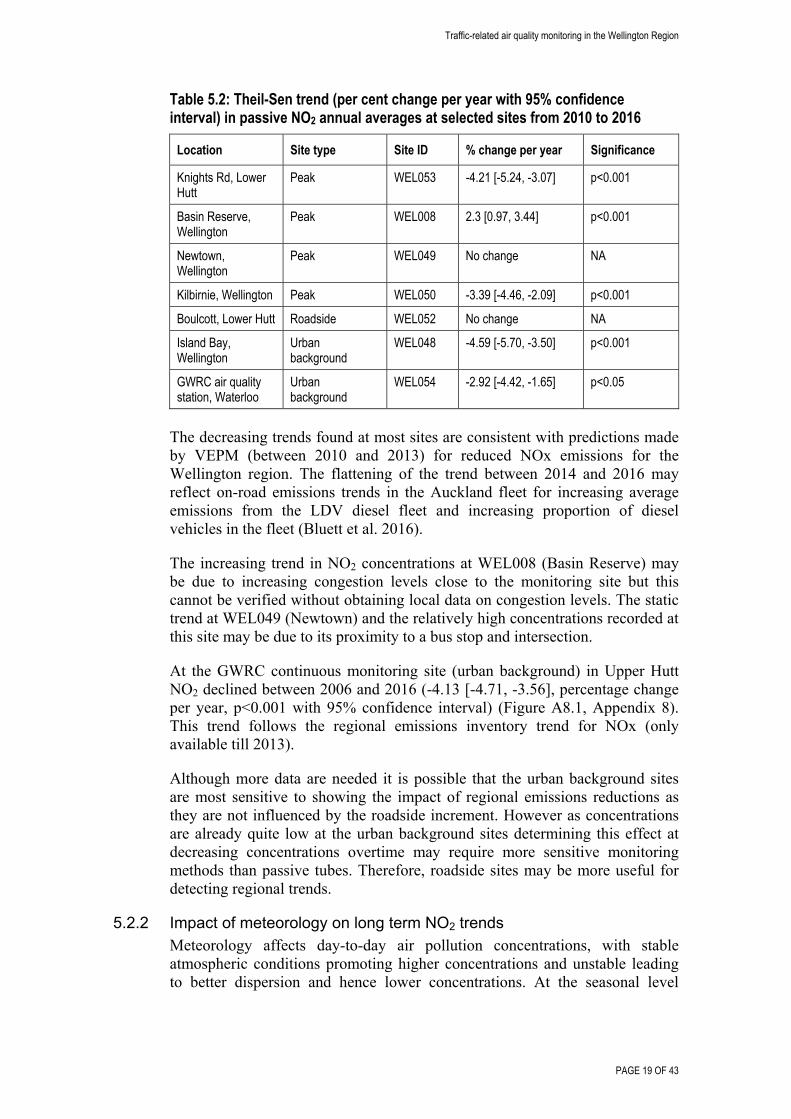
Table 5.2: Theil-Sen trend (per cent change per year with 95% confidence interval) in passive NO2 annual averages at selected sites from 2010 to 2016
Location Site type Site ID % change per year Significance
Knights Rd, Lower Hutt
Peak WEL053 -4.21 [-5.24, -3.07] p<0.001
Basin Reserve, Wellington
Peak WEL008 2.3 [0.97, 3.44] p<0.001
Newtown, Wellington
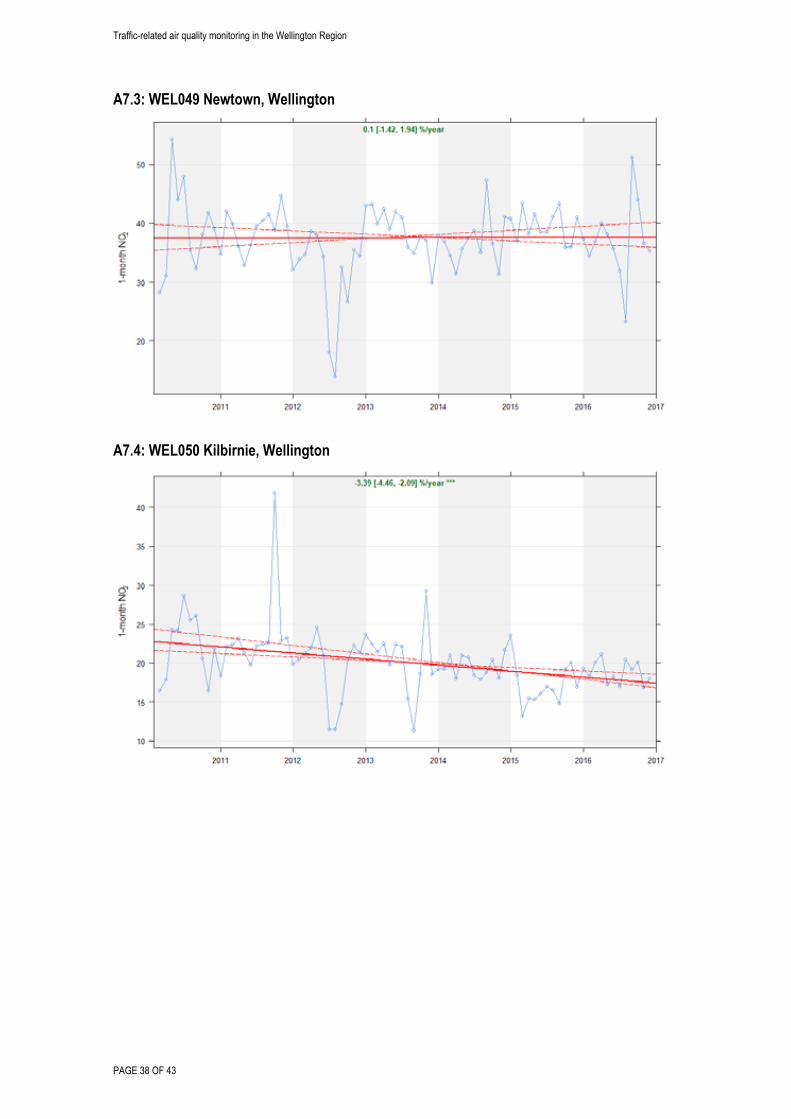
Peak WEL049 No change NA
Kilbirnie, Wellington Peak WEL050 -3.39 [-4.46, -2.09] p<0.001
Boulcott, Lower Hutt Roadside WEL052 No change NA
Island Bay, Wellington
Urban background
WEL048 -4.59 [-5.70, -3.50] p<0.001
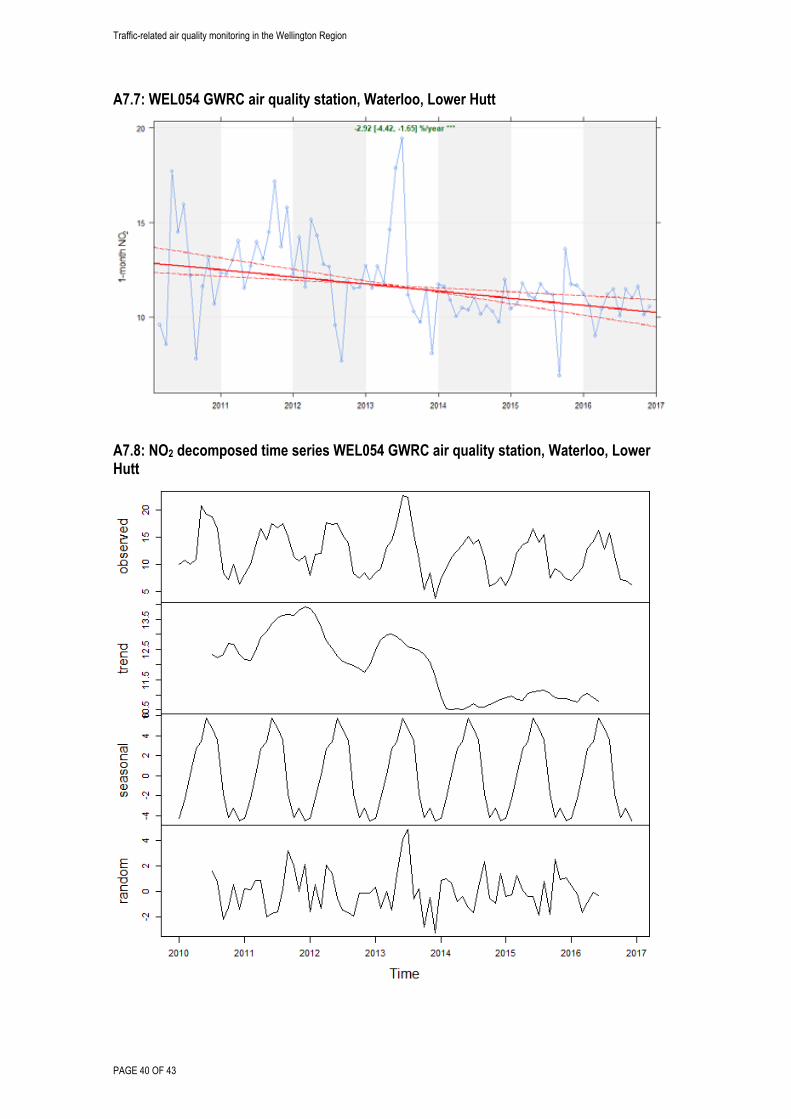
GWRC air quality station, Waterloo
Urban background
WEL054 -2.92 [-4.42, -1.65] p<0.05
The decreasing trends found at most sites are consistent with predictions made by VEPM (between 2010 and 2013) for reduced NOx emissions for the Wellington region. The flattening of the trend between 2014 and 2016 may reflect on-road emissions trends in the Auckland fleet for increasing average emissions from the LDV diesel fleet and increasing proportion of diesel vehicles in the fleet (Bluett et al. 2016).
The increasing trend in NO2 concentrations at WEL008 (Basin Reserve) may be due to increasing congestion levels close to the monitoring site but this cannot be verified without obtaining local data on congestion levels. The static trend at WEL049 (Newtown) and the relatively high concentrations recorded at this site may be due to its proximity to a bus stop and intersection.
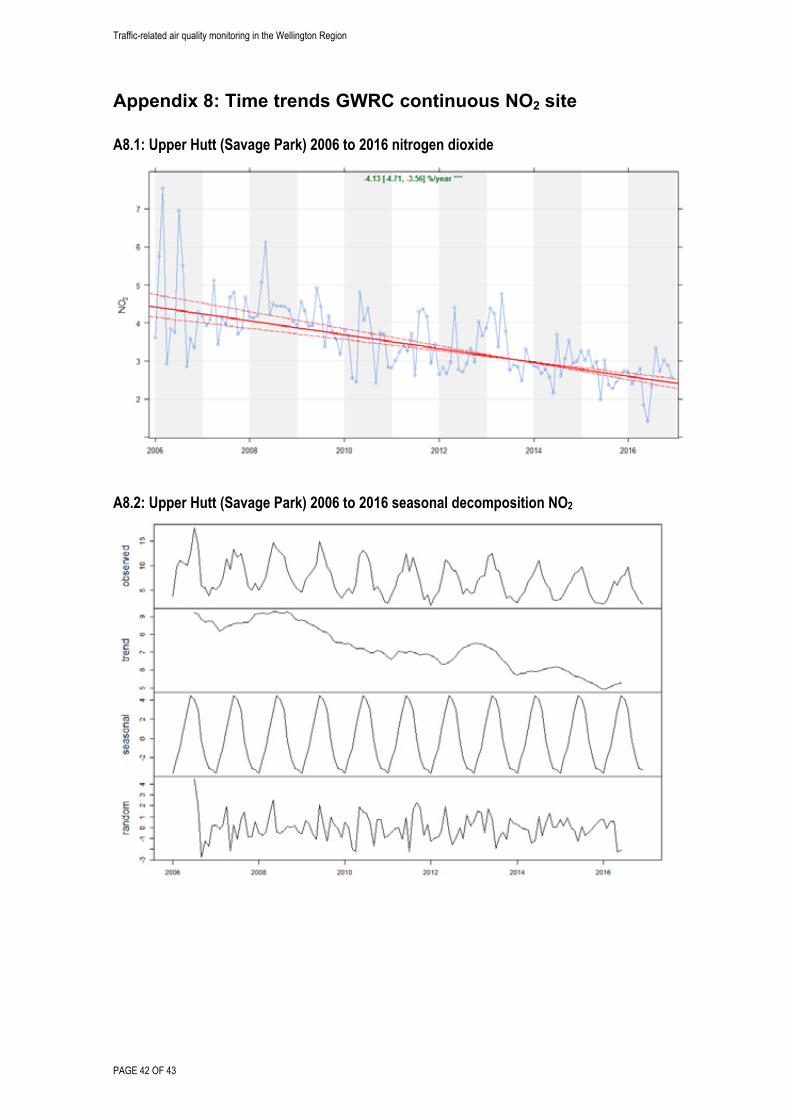
At the GWRC continuous monitoring site (urban background) in Upper Hutt NO2 declined between 2006 and 2016 (-4.13 [-4.71, -3.56], percentage change per year, p<0.001 with 95% confidence interval) (Figure A8.1, Appendix 8). This trend follows the regional emissions inventory trend for NOx (only available till 2013).
Although more data are needed it is possible that the urban background sites are most sensitive to showing the impact of regional emissions reductions as they are not influenced by the roadside increment. However as concentrations are already quite low at the urban background sites determining this effect at decreasing concentrations overtime may require more sensitive monitoring methods than passive tubes. Therefore, roadside sites may be more useful for detecting regional trends.
5.2.2 Impact of meteorology on long term NO2 trends Meteorology affects day-to-day air pollution concentrations, with stable atmospheric conditions promoting higher concentrations and unstable leading to better dispersion and hence lower concentrations. At the seasonal level
Traffic-related air quality monitoring in the Wellington Region
PAGE 20 OF 43
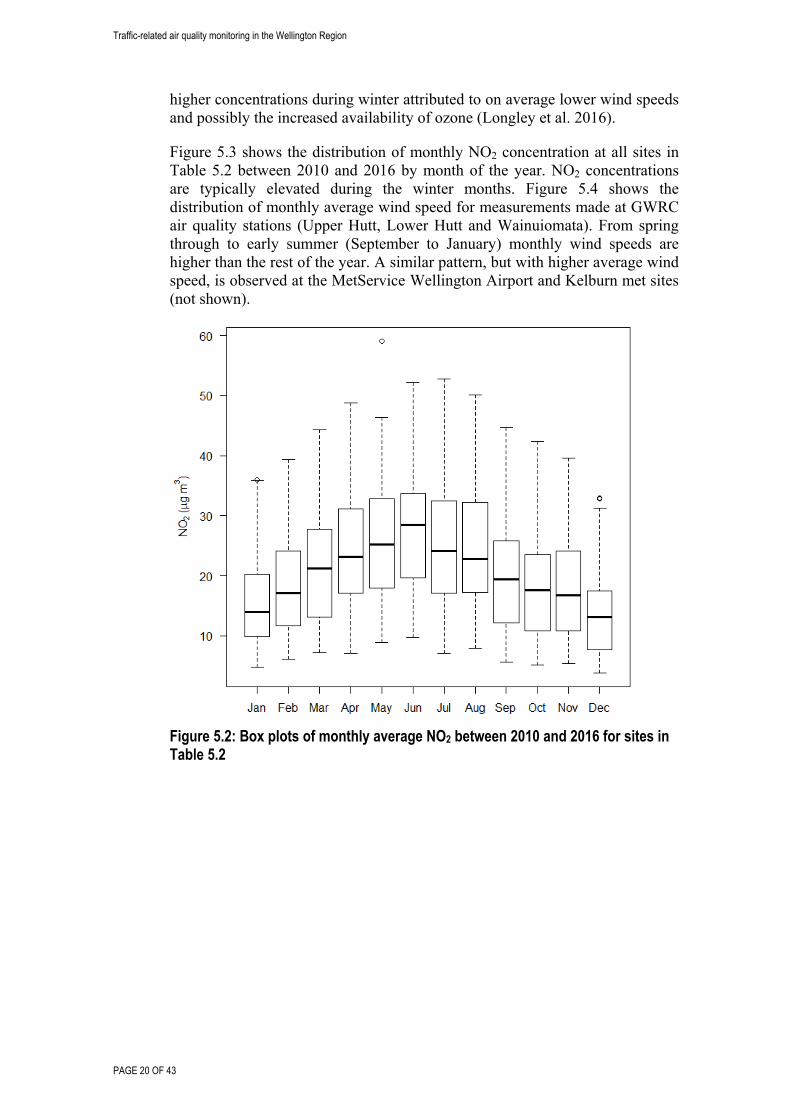
higher concentrations during winter attributed to on average lower wind speeds and possibly the increased availability of ozone (Longley et al. 2016).
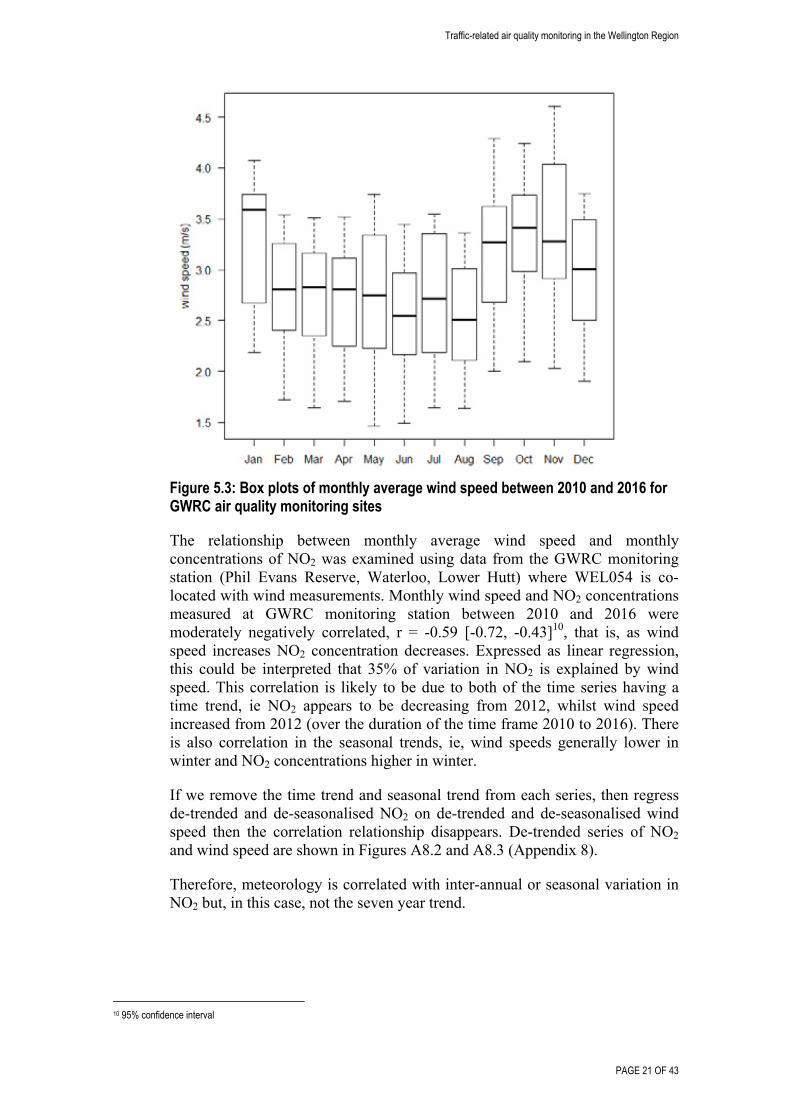
Figure 5.3 shows the distribution of monthly NO2 concentration at all sites in Table 5.2 between 2010 and 2016 by month of the year. NO2 concentrations are typically elevated during the winter months. Figure 5.4 shows the distribution of monthly average wind speed for measurements made at GWRC air quality stations (Upper Hutt, Lower Hutt and Wainuiomata). From spring through to early summer (September to January) monthly wind speeds are higher than the rest of the year. A similar pattern, but with higher average wind speed, is observed at the MetService Wellington Airport and Kelburn met sites (not shown).
Figure 5.2: Box plots of monthly average NO2 between 2010 and 2016 for sites in Table 5.2
Traffic-related air quality monitoring in the Wellington Region
PAGE 21 OF 43
Figure 5.3: Box plots of monthly average wind speed between 2010 and 2016 for GWRC air quality monitoring sites
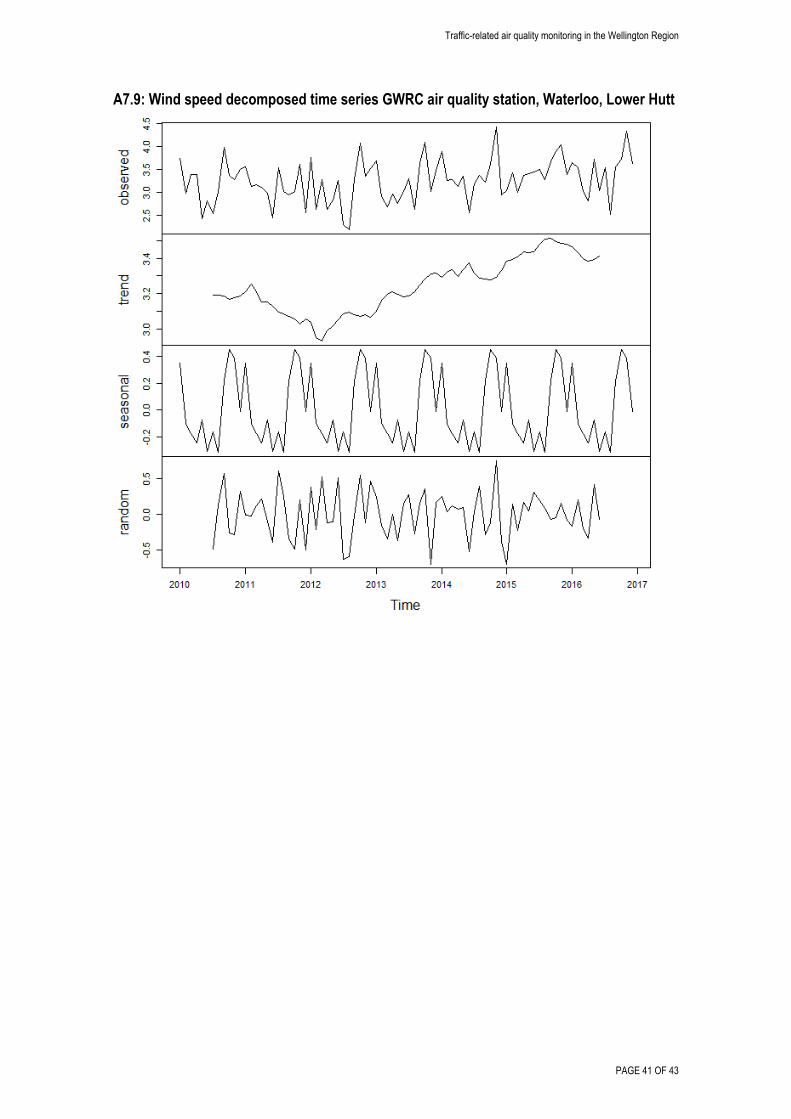
The relationship between monthly average wind speed and monthly concentrations of NO2 was examined using data from the GWRC monitoring station (Phil Evans Reserve, Waterloo, Lower Hutt) where WEL054 is co-located with wind measurements. Monthly wind speed and NO2 concentrations measured at GWRC monitoring station between 2010 and 2016 were moderately negatively correlated, r = -0.59 [-0.72, -0.43]10, that is, as wind speed increases NO2 concentration decreases. Expressed as linear regression, this could be interpreted that 35% of variation in NO2 is explained by wind speed. This correlation is likely to be due to both of the time series having a time trend, ie NO2 appears to be decreasing from 2012, whilst wind speed increased from 2012 (over the duration of the time frame 2010 to 2016). There is also correlation in the seasonal trends, ie, wind speeds generally lower in winter and NO2 concentrations higher in winter.
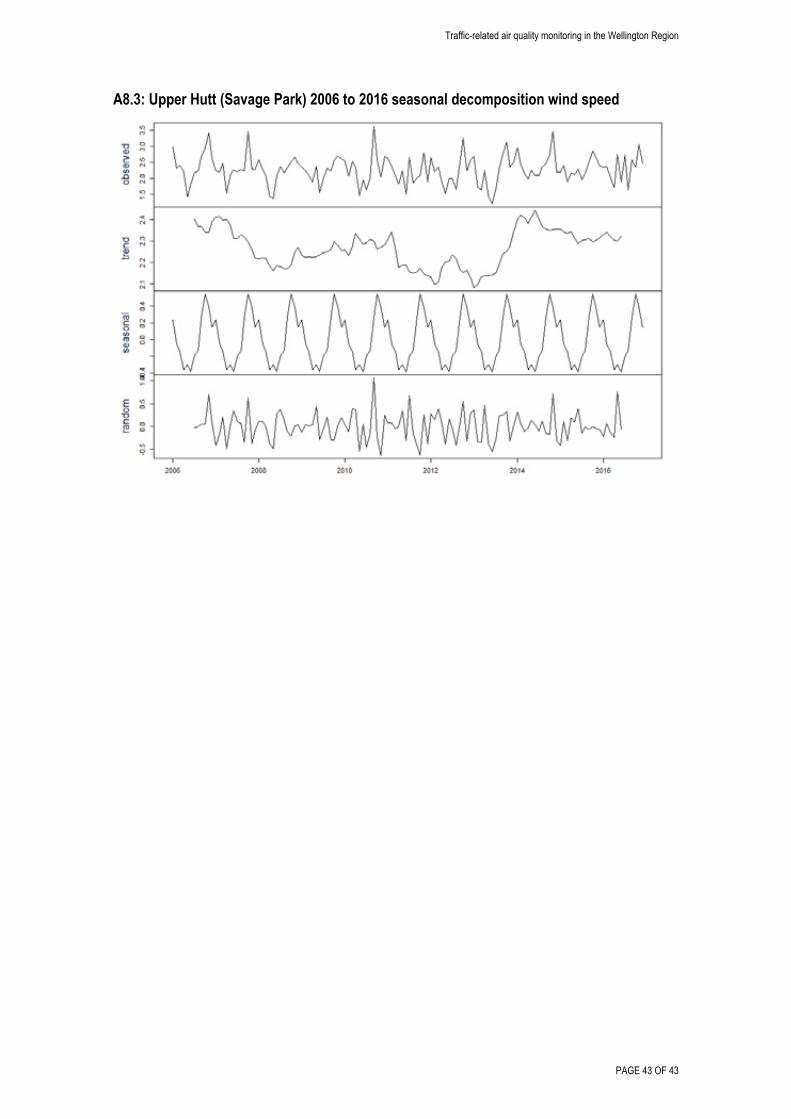
If we remove the time trend and seasonal trend from each series, then regress de-trended and de-seasonalised NO2 on de-trended and de-seasonalised wind speed then the correlation relationship disappears. De-trended series of NO2 and wind speed are shown in Figures A8.2 and A8.3 (Appendix 8).
Therefore, meteorology is correlated with inter-annual or seasonal variation in NO2 but, in this case, not the seven year trend.
10 95% confidence interval
Traffic-related air quality monitoring in the Wellington Region
PAGE 22 OF 43
6. Recommendations Investigate the usefulness and feasibility of adding a ‘traffic indicator’ to
key sites. This additional information could assist validation and interpretation of spatial and time series trends in traffic generated pollutants. This traffic indicator could include data on the main drivers of pollutant concentrations, ie, traffic intensity, fleet profile, driving conditions (congestion versus free-flowing) complemented by wind speed and direction measurements.
Evaluate other instruments and low-cost sensors designed to measure direct markers of traffic related emissions such as nitrogen oxides (NOx), black carbon and ultrafine particles.

Traffic-related air quality monitoring in the Wellington Region
PAGE 23 OF 43
Acknowledgements
Thank you to Grant Redvers for assistance with the initial site installations and Darren Li for the ongoing technical work involved in maintaining and operating the sites. Thank you to NZTA for providing data from their national network.
Traffic-related air quality monitoring in the Wellington Region
PAGE 24 OF 43
References
Bluett J, and Dey K. 2007. On-road measurement of vehicle emissions in the Wellington Region. NIWA Client Report CHC2007-123. October 2007. Christchurch. Bluett J, Kuschel G, Xie S, Unwin M and Metcalfe J. 2013. The development, use and value of a long-term on-road vehicle emission database in New Zealand. Air Quality and Climate Change Volume 47 No. 3. August 2013.
Bluett J, Aguiar M and Smit R. 2016. Understanding trends in roadside air quality. NZ Transport Agency research report 596. 171 pp. Carslaw DC, Beevers SD, Tate JE, Westmoreland EJ, and Williams, ML. 2011. Recent evidence concerning higher NOx emissions from passenger cars and light duty vehicles. Atmospheric Environment (45) 7053-7063. Carslaw DC and Ropkins K. 2012. Openair — an R package for air quality data analysis. Environmental Modelling & Software 27-28, 52-61. COMEAP. 2015. Statement: the evidence for the effects of nitrogen dioxide on health. Committee on the Medical Effects of Air Pollutants. https://www.gov.uk/government/publications/nitrogen-dioxide-health-effects-of-exposure DEFRA. 2009. Local air quality management, technical guidance (LAQM TG 09). Prepared by the Department for Environment, Food and Rural Affairs. February 2009, United Kingdom. DEFRA. 2016. Local air quality management, technical guidance (TG16). Prepared by the Department for Environment, Food and Rural Affairs. April 2016, United Kingdom. https://laqm.defra.gov.uk/ Gardiner LR, Moores J, Osborne A and Semadeni-Davies A. 2016. Risk assessment of road stormwater runoff. NZ Transport Agency research report 585. 146pp.
GWRC 2016. 2015/16 Annual monitoring report on the Regional Land Transport Plan. GW-TAP-G-17/5. November 2016, Wellington.
Longley I. 2015. Impacts of road traffic on air quality in Hamilton: Screening model. Prepared for Waikato Regional Council. NIWA Report AKL-2016-002. Auckland. Longley I, and Somervell E. 2016. Nitrogen dioxide indicators of state and impact: Scoping Report. NIWA Report AKL-2016-002, January 2016, Auckland. Longley, I, Somervell, E, Edwards and Gray, S. 2016. Designing a network to monitor the impact of road traffic on air quality in Greater Wellington. NIWA Client Report No. AKL2016-014. June 2016, Auckland. Longley I. 2017. Spatial monitoring survey of NO2 in Greater Wellington. NIWA Report 2017176AK. June 2017, Auckland.
Traffic-related air quality monitoring in the Wellington Region
PAGE 25 OF 43
Ministry for the Environment and Statistics New Zealand. 2014. New Zealand’s Environmental Reporting Series: 2014 Air domain report. Miskell G, Salmond J, Longley I and Dirks KN. 2015. A novel approach in quantifying the effect of urban design features on local-scale air pollution in central urban areas. Environmental Science & Technology 49, 9004-9011. Mitchell T. 2017. Air Quality State of the Environment monitoring programme: Annual data report, 2016. Greater Wellington Regional Council, Publication No. GW/ESCI-T-17/50, Wellington. NZ Transport Agency. 2013A. Vehicle emissions prediction model (VEPM 5.1) user guide V1.0. NZTA Wellington. NZ Transport Agency. 2013B. Ambient air quality (nitrogen dioxide) monitoring programme: Operating manual 2013/14. https://www.nzta.govt.nz/assets/resources/air-quality-monitoring/docs/no2-operating-manual%202013-14.pdf R Core Team. 2015. R: A language and environment for statistical computing. R Foundation for Statistical Computing, Vienna, Austria. www.R-project.org Uhrner, U, Randal, E, Ford, A, Mitchel, T, Howden-Chapman, P, 2015. Air Pollution in Windy Wellington and Impact on Urban Planning. 12th Urban Environment Symposium, Oslo, Norway, June 2015. World Health Organization. 2006. WHO air quality guidelines for particulate matter, ozone, nitrogen dioxide and sulfur dioxide – global update 2005. World Health Organization. 2012. Health effects of black carbon. WHO regional office for Europe, Denmark. www.euro.who.int/__data/assets/pdf_file/0004/162535/e96541.pdf
Traffic-related air quality monitoring in the Wellington Region
PAGE 26 OF 43
Appendix 1: RLPT (2015) outcome and measures
Traffic-related air quality monitoring in the Wellington Region
PAGE 27 OF 43
Appendix 2: Passive NO2 tube measurement bias and precision
Table A2.1: Triplicate tubes deployed at GWRC central Wellington monitoring station for 2016
Period Start Date End Date Tube 1 µg/m3
Tube 2 µg/m3
Tube 3 µg/m3
Triplicate Mean
Standard Deviation
95% CI of mean
Jan 5/01/2016 5/02/2016 14.8 14.5 15.2 15 0.4 0.9
Feb 5/02/2016 2/03/2016 18.2 18.5 15 17 1.9 4.8
Mar 2/03/2016 5/04/2016 20.1 20.9 20.9 21 0.5 1.1
Apr 5/04/2016 3/05/2016 26.6 24.8 24.2 25 1.2 3.1
May 3/05/2016 7/06/2016 22.4 25.4 25.9 25 1.9 4.7
Jun 7/06/2016 4/07/2016 29 29.6 29.8 29 0.4 1.0
Jul 4/07/2016 3/08/2016 20.7 20.1 19.9 20 0.4 1.0
Aug 3/08/2016 7/09/2016 21.6 24.2 24.8 24 1.7 4.2
Sep 7/09/2016 5/10/2016 23.2 21.9 23.1 23 0.7 1.8
Oct 5/10/2016 1/11/2016 17.1 15.5 19.8 17 2.2 5.4
Nov 1/11/2016 5/12/2016 16.9 18.8 19.3 18 1.3 3.1
Dec 5/12/2016 9/01/2017 13.2 13 13.2 13 0.1 0.3
Measurement bias was calculated using the spreadsheet tool recommended by DEFRA (2016) available at http://laqm.defra.gov.uk/documents/AEA_DifTPAB_v04.xls
Bias factor A 0.67 (0.63 - 0.72)
Bias B 49% (39% - 58%)
Diffusion Tubes Mean: 21 µg/m3
Mean CV (Precision): 5 µg/m3
Automatic Mean: 14 µg/m3
Data Capture for periods used: 100%
Adjusted Tubes Mean: 14 (13 - 15) µg/m3
Therefore the reference method is about 33% lower than the diffusion tube method with the adjustment factor for estimating reference method (y) equivalent from passive tube results (s): y=0.67x (Bias adjustment factor)
Table A2.2: Coefficient of variation (CV) for triplicate tubes deployed at GWRC central Wellington monitoring station for 2016 (annual average CV 5.2%)
Month CV% Month CV%
Jan 2.4 Jul 2.1
Feb 11.3 Aug 7.2
Mar 2.2 Sep 3.2
Apr 5 Oct 12.4
May 7.7 Nov 6.9
Jun 1.4 Dec 0.9
Traffic-related air quality monitoring in the Wellington Region
PAGE 28 OF 43
Appendix 3: Passive NO2 monitoring sites 2016
NZTA Identifier Area Location GWRC classification Site sponsor NZTM E NZTM N
WEL053* Lower Hutt Knights Road Peak NZTA 1759934 5436058
WEL087* Ōtaki Rahui Road/SH intersection, Otaki Peak GWRC 1782151 5485622
WEL008* Wellington Basin Reserve Peak NZTA 1748917 5426328
WEL049* Wellington Riddiford/Mein Street Peak NZTA 1748907 5425194
WEL050* Wellington Kilbirnie (on SH1) Peak NZTA 1750102 5425039
WEL073,074,075* Wellington Willis Street/urban motorway Peak NZTA 1748360 5427134
WEL081 Wellington Lambton Quay, CBD Peak GWRC 1748671 5428257
WEL082 Wellington Manners Street, CBD Special character GWRC 1748752 5427413
WEL083 Wellington Courtney Place, CBD Peak GWRC 1748971 5427223
WEL063* Kāpiti Paraparaumu Roadside NZTA 1769627 5469035
WEL078* Lower Hutt Manor Park Roadside NZTA 1766009 5441920
WEL003* Lower Hutt Petone Roadside NZTA 1757206 5435187
WEL052* Lower Hutt Boulcott Roadside NZTA 1759667 5436831
WEL079 Lower Hutt Cuba Street, Petone Roadside GWRC 1758286 5434987
WEL089* Masterton High Street, Masterton Roadside GWRC 1822056 5462296
WEL080* Porirua Titahi Bay Rd Roadside GWRC 1754261 5444566
WEL088* Porirua Johnsonville-Porirua motorway (SH1) Roadside GWRC 1756620 5447614
WEL084 Wellington Thorndon Quay, Pipitea Roadside GWRC 1749266 5429488
WEL085 Wellington Morefield Rd, Johnsonville Roadside GWRC 1751000 5434368
WEL086 Wellington Wakefield St, CBD Roadside GWRC 1748788 5427570
WEL054* Lower Hutt Birch Lane, GWRC site Urban background NZTA 1761034 5435864
WEL072* Porirua Papakowhai, Porirua Urban background NZTA 1756584 5446972
WEL048* Wellington Island Bay Urban background NZTA 1748544 5422507
*Annual averages and metadata reported on NZTA TRAMS website
Traffic-related air quality monitoring in the Wellington Region
PAGE 29 OF 43
Appendix 4: Seasonal adjustment method
Figure A4.1: Regression plots of annual mean against 1-month NO2 concentrations at 15 sites (n=74) in Wellington operated between 2010 and 2016 (fitted without an intercept)
Table A4.1: Adjustment factors (polynomial coefficient) for monthly averages used to estimate annual mean concentrations
Month Adjustment factor Month Adjustment factor
January 1.232 July 0.828
February 1.083 August 0.875
March 0.967 September 0.955
April 0.883 October 1.068
May 0.832 November 1.213
June 0.814 December 1.391
Traffic-related air quality monitoring in the Wellington Region
PAGE 30 OF 43
Figure A4.2: Polynomial fit (red) of NO2 monthly slope coefficients (black) from linear regression of annual mean on monthly mean.
Traffic-related air quality monitoring in the Wellington Region
PAGE 31 OF 45
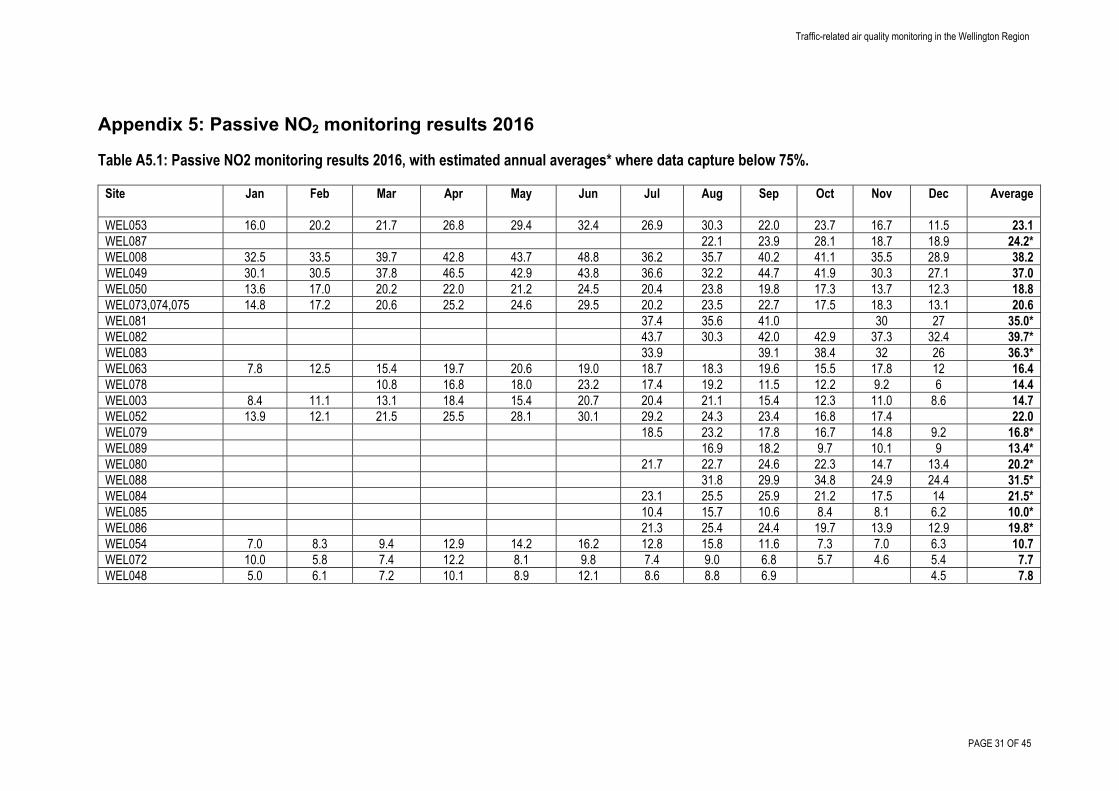
Appendix 5: Passive NO2 monitoring results 2016
Table A5.1: Passive NO2 monitoring results 2016, with estimated annual averages* where data capture below 75%.
Site Jan Feb Mar Apr May Jun Jul Aug Sep Oct Nov Dec Average
WEL053 16.0 20.2 21.7 26.8 29.4 32.4 26.9 30.3 22.0 23.7 16.7 11.5 23.1 WEL087 22.1 23.9 28.1 18.7 18.9 24.2* WEL008 32.5 33.5 39.7 42.8 43.7 48.8 36.2 35.7 40.2 41.1 35.5 28.9 38.2 WEL049 30.1 30.5 37.8 46.5 42.9 43.8 36.6 32.2 44.7 41.9 30.3 27.1 37.0 WEL050 13.6 17.0 20.2 22.0 21.2 24.5 20.4 23.8 19.8 17.3 13.7 12.3 18.8 WEL073,074,075 14.8 17.2 20.6 25.2 24.6 29.5 20.2 23.5 22.7 17.5 18.3 13.1 20.6 WEL081 37.4 35.6 41.0 30 27 35.0* WEL082 43.7 30.3 42.0 42.9 37.3 32.4 39.7* WEL083 33.9 39.1 38.4 32 26 36.3* WEL063 7.8 12.5 15.4 19.7 20.6 19.0 18.7 18.3 19.6 15.5 17.8 12 16.4 WEL078 10.8 16.8 18.0 23.2 17.4 19.2 11.5 12.2 9.2 6 14.4 WEL003 8.4 11.1 13.1 18.4 15.4 20.7 20.4 21.1 15.4 12.3 11.0 8.6 14.7 WEL052 13.9 12.1 21.5 25.5 28.1 30.1 29.2 24.3 23.4 16.8 17.4 22.0 WEL079 18.5 23.2 17.8 16.7 14.8 9.2 16.8* WEL089 16.9 18.2 9.7 10.1 9 13.4* WEL080 21.7 22.7 24.6 22.3 14.7 13.4 20.2* WEL088 31.8 29.9 34.8 24.9 24.4 31.5* WEL084 23.1 25.5 25.9 21.2 17.5 14 21.5* WEL085 10.4 15.7 10.6 8.4 8.1 6.2 10.0* WEL086 21.3 25.4 24.4 19.7 13.9 12.9 19.8* WEL054 7.0 8.3 9.4 12.9 14.2 16.2 12.8 15.8 11.6 7.3 7.0 6.3 10.7 WEL072 10.0 5.8 7.4 12.2 8.1 9.8 7.4 9.0 6.8 5.7 4.6 5.4 7.7 WEL048 5.0 6.1 7.2 10.1 8.9 12.1 8.6 8.8 6.9 4.5 7.8
Traffic-related air quality monitoring in the Wellington Region
PAGE 32 OF 43
Appendix 6: Maps of annual average NO2 for sites in 2016
Figure A6.1: Map of Wellington City sites
Traffic-related air quality monitoring in the Wellington Region
PAGE 33 OF 43
Figure A6.2: Map of Johnsonville and Porirua sites
Traffic-related air quality monitoring in the Wellington Region
PAGE 34 OF 43
Figure A6.3: Map of Lower Hutt and Porirua sites
Traffic-related air quality monitoring in the Wellington Region
PAGE 35 OF 43
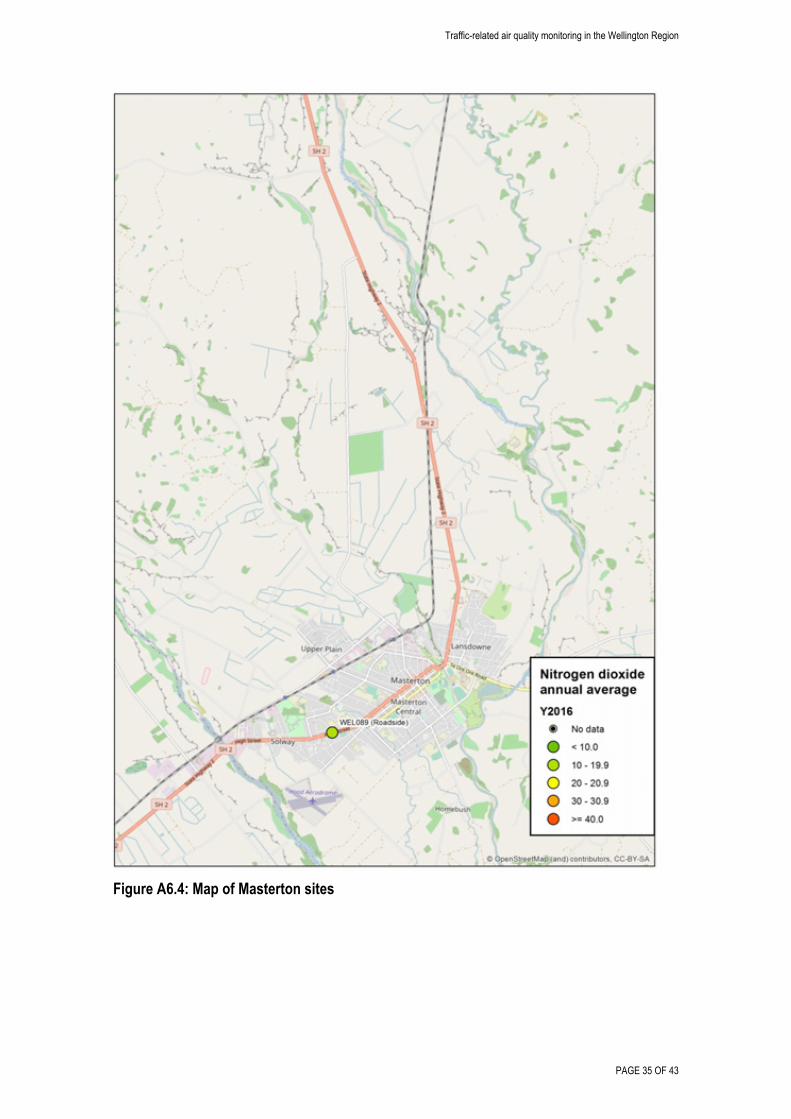
Figure A6.4: Map of Masterton sites
Traffic-related air quality monitoring in the Wellington Region
PAGE 36 OF 43
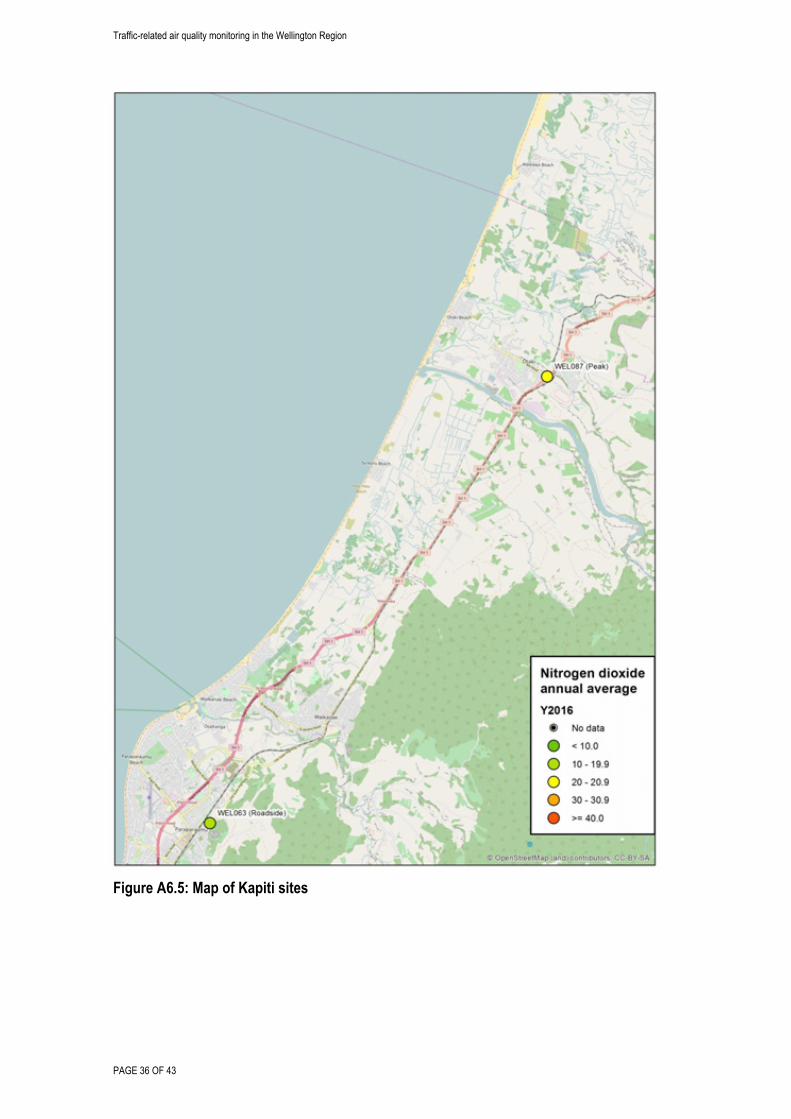
Figure A6.5: Map of Kapiti sites
Traffic-related air quality monitoring in the Wellington Region
PAGE 37 OF 43
Appendix 7: Time trends NZTA passive NO2 sites
A7.1: WEL053 Knights Road, Lower Hutt
A7.2: WEL008 Basin Reserve, Wellington
Traffic-related air quality monitoring in the Wellington Region
PAGE 38 OF 43
A7.3: WEL049 Newtown, Wellington
A7.4: WEL050 Kilbirnie, Wellington

Traffic-related air quality monitoring in the Wellington Region
PAGE 39 OF 43
A7.5: WEL052 Boulcott, Lower Hutt
A7.6: WEL048 Island Bay, Wellington
Traffic-related air quality monitoring in the Wellington Region
PAGE 40 OF 43
A7.7: WEL054 GWRC air quality station, Waterloo, Lower Hutt
A7.8: NO2 decomposed time series WEL054 GWRC air quality station, Waterloo, Lower Hutt
Traffic-related air quality monitoring in the Wellington Region
PAGE 41 OF 43
A7.9: Wind speed decomposed time series GWRC air quality station, Waterloo, Lower Hutt
Traffic-related air quality monitoring in the Wellington Region
PAGE 42 OF 43
Appendix 8: Time trends GWRC continuous NO2 site
A8.1: Upper Hutt (Savage Park) 2006 to 2016 nitrogen dioxide
A8.2: Upper Hutt (Savage Park) 2006 to 2016 seasonal decomposition NO2
Traffic-related air quality monitoring in the Wellington Region
PAGE 43 OF 43
A8.3: Upper Hutt (Savage Park) 2006 to 2016 seasonal decomposition wind speed