TRAFFIC ENGINEERING DESIGN - Home | KYTC Traffic Engineering Design and Modeling Determine if a firm...
62
TRAFFIC ENGINEERING DESIGN Jeff Jasper, KYTC Adam Kirk KTC
Transcript of TRAFFIC ENGINEERING DESIGN - Home | KYTC Traffic Engineering Design and Modeling Determine if a firm...

TRAFFIC ENGINEERING DESIGNJeff Jasper, KYTCAdam Kirk KTC

INTRODUCTIONJeff Jasper

Agenda• Background/Overview• Prequalification• Resources

Traffic Engineering• What is Traffic Engineering Design?
• Size Roadways, Intersections, Interchanges
• Develop Innovative Solutions

Purpose of Traffic Engineering• Intended Use
• Purpose and Need identifies Capacity and/or safety concerns
• May be used in other instances
• One of many inputs to decision making process
Inform & Document Decision Making Process

Kentucky’s Roadway System• 4-Lane Roadways < 10,000 ADT
• 741 miles
• 4-Lane Roadways < 5,000 ADT• 116 miles

Traffic Engineering Costs• Typical Traffic Engineering Cost
• $5,000-$10,000 per Intersection
• Approximate Cost for 1 Turn Lane• $25,000-$50,000
• 2-Lane Facility $7M; 4-Lane Facility $22M

Policies• Design Memos
• Design 03-11; Traffic Engineering Analysis
• Design, Permits, Traffic 03-09; Auxiliary Turn Lane Policy
• Design 03-10; Roundabout Analysis

PrequalificationAdvanced Traffic Engineering Design and ModelingDetermine if a firm has the capability to perform advanced traffic engineering analysis for roadway design projects, including microsimulation and corridor signal analysis.
• The firm must have at least one full-time staff member registered as a Professional Traffic Operations Engineer (PTOE) or equivalent experience.
• Demonstrate experience in:• Signal Systems Operations • Microsimulation Modeling

TRAFFIC ENGINEERING DESIGN PROCESSAdam Kirk

Determine Basic Number of Lanes
Determine Auxiliary Lanes
Intersection Type/Size (Signal, Stop, Roundabout)
Analyze/ Evaluate
Design Process

Determine Basic Number of Lanes
Determine Auxiliary Lanes
Intersection Type/Size (Signal, Stop, Roundabout)
Analyze/ Evaluate
Design Process

Basic Number of LanesCalculate Volume to Capacity Ratio (V/C)• Targeted V/C
• 1.0 Urban Areas• 0.9 Rural Areas
• Document if V/C less than• 0.8 Urban Areas• 0.7 Rural Areas

Why V/C Ratio?

Basic Number of LanesDetermined by Roadway Capacity • 2-Lane Facility:
• 1700 vphpl; 3200 vphpl(both directions)
• Multi-lane Facility• 2000 vphpl
• Interstate• 2300 vphpl
• Signalized Intersection • 1900 vphplphg

Analysis Scenarios• Design Year Analysis (20 Year)
• Current Year analysis can be used to calibrate models• Interim Analysis may be useful (Incremental Improvements)
• AM and PM Peak Hours
• Requires Traffic Forecasting (Division of Planning)

Example• Suburban Roadway Project • 30,000 AADT Design Year Volume • Peak Hour Factor (K) = 0.09• Directional Factor (D) = 0.6• PHF = 0.95
• How many lanes??

Example• 30,000 ADT• Peak Hour Factor (K) = 0.09• Peak Hour Volume = 2700 vph• Directional Factor (D) = 0.6• Directional Volume = 1620/0.95 = 1705 • V/C (2-Lane) = 1705/1700 = 1.01
• V/C (4-Lane) = 1700/4000 =0.425

AUXILIARY LANES

Determine Basic Number of Lanes
Determine Auxiliary Lanes
Intersection Type/Size (Signal, Stop, Roundabout)
Analyze/ Evaluate
Design Process

LEFT-TURN LANE WARRANTS• Uncontrolled Approaches
• Left-turn lanes shall be provided at median openings on divided roadways
• Left-turn lanes shall be provided if traffic volumes at the intersection meet the thresholds identified in Figures 1 and 2.
• Left-turn lanes should be considered as a safety countermeasure, e.g. where sight distance of approaching traffic is limited.

LEFT-TURN LANE WARRANTS
• 2 Graphs measure probability of stopped vehicle blocking lane • ≤ 45 MPH
(P = 0.02)• >45 MPH
(P = 0.01)
0
100
200
300
400
500
600
700
800
0 100 200 300 400 500 600 700 800 900 1000 1100 1200
Advancing Volume
Opp
osin
g Vo
lum
e
L= 1%
L= 5%
L= 10%
L= 15%
L= 20%
L= 25%
Left Turn Lane Not Required
Left Turn Lane Required

LEFT-TURN LANE WARRANTS• Inputs
• L = Percent Left-Turns• Advancing Volume = Through + Left + Right-Turn Traffic• Opposing Volume = Through + Left + Right-Turn Opposing Traffic

LEFT-TURN LANE WARRANTS
RoadM
inor
Stre
et
4037232
71500
40
L = Percent Left-Turns
= 32 (32+372+40)= 0.07
Advancing Traffic=32+372+40=444
Opposing Traffic=40+500+71=611

LEFT-TURN LANE WARRANTS
0
100
200
300
400
500
600
700
800
0 100 200 300 400 500 600 700 800 900 1000 1100 1200
Advancing Volume
Opp
osin
g Vo
lum
e
L= 1%
L= 5%
L= 10%
L= 15%
L= 20%
L= 25%
Left Turn Lane Not Required
Left Turn Lane Required
L= 7%
(444,611)

LEFT-TURN LANE DESIGN• Turn Lane Length
• Deceleration Length • Storage Length

LEFT-TURN LANE DESIGN
• Turn Lane Length

LEFT-TURN LANE DESIGN
• Turn Lane Length

RIGHT-TURN LANE WARRANTS
• 1 Graph measures probability of turning vehicle blocking lane • ≤ 45 MPH
(P = 0.02)• >45 MPH
(P = 0.01)
0
200
400
600
800
1000
1200
0.00 0.05 0.10 0.15 0.20 0.25 0.30 0.35 0.40 0.45 0.50
Percent Right Turns
Adv
anci
ng T
raffi
c
V ≤ 45
V > 45 mph
Right-Turn Lane Not Required
Right-Turn Lane Required

RIGHT-TURN LANE WARRANTS
Road
Min
or S
treet
71500
40
Advancing Traffic=40+500+71=611
Percent Right Turns=40 / 611=0.07

RIGHT-TURN LANE WARRANTS
0
200
400
600
800
1000
1200
0.00 0.05 0.10 0.15 0.20 0.25 0.30 0.35 0.40 0.45 0.50
Percent Right Turns
Adv
anci
ng T
raffi
c
V ≤ 45 mph
V > 45 mph
Right-Turn Lane Not Required
Right-Turn Lane Required
(0.07, 611)

RIGHT-TURN LANE DESIGN• Turn Lane Length
• Deceleration Length • Storage Length

RIGHT-TURN LANE DESIGN
• Turn Lane Length

INTERSECTION TYPE & SIZE

Determine Basic Number of Lanes
Determine Auxiliary Lanes
Intersection Type/Size (Signal, Stop, Roundabout)
Analyze/ Evaluate
Design Process

Determine Intersection Type• Warrant Analysis – MUTCD
• Alternative Analysis

Warrants• Traffic Signal Control• 4-Way Stop Control• Roundabout

HCS SignalsInput Screen

HCS SignalsPhasing Design

HCS SignalsOutput

Output: Conceptual Layout

Innovative Designs

Innovative Designs• Cost Savings:
• $4.5M
• LOS B • Target LOS D/E

ANALYZE / EVALUATE

Determine Basic Number of Lanes
Determine Auxiliary Lanes
Intersection Type/Size (Signal, Stop, Roundabout)
Analyze/ Evaluate
Design Process

Measures of Effectiveness• V/C• Level of Service (LOS)• Queuing• Travel Time • Delay
Other MOEs. Additional MOEs required by project type, such as interchange justification studies, or defined by the project Purpose and Need Statement, e.g., emissions, queues, etc. for CMAQ projects, may be analyzed, and documented as needed.
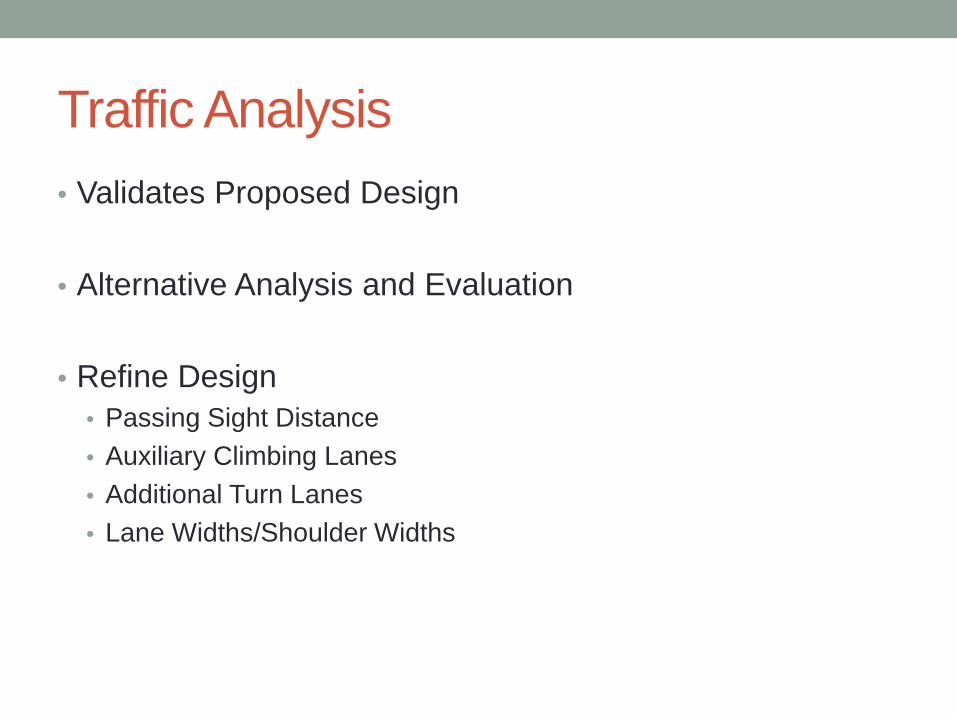
Traffic Analysis • Validates Proposed Design
• Alternative Analysis and Evaluation
• Refine Design• Passing Sight Distance• Auxiliary Climbing Lanes• Additional Turn Lanes• Lane Widths/Shoulder Widths

Innovative Approach

Current Design Guidelines
Criteria Standard
Typical Section No Cable Barrier. Rumble Stripsin 4’ striped median. 4-6ft shoulders, with or without shoulder rumbles
Length of Passing Lanes 0.5 – 1.5 mile spacing (1-2.5km, and 0.8-1.1 mi)
Widen Direction Symmetrical, Asymmetrical,Non-Continuous
LOS Capacity (C) Up to 2800pc/hr if one directional1700pc/hr max.

Traffic Analysis• Highway Capacity Manual/Software (HCM/HCS)
• Microsimulation• TSIS/CORSIM• VISSIM• HCM 2010 Urban Streets??

Micro Simulation

Micro-Simulation

Micro SimulationMicro-simulation may be considered on corridors that:• Operate within coordinated signal systems,
• Have multiple signalized intersections where queuing may impact adjacent intersections,
• Operate interdependently, such as at interchanges, or
• When deemed necessary by the project team for operational or other reasons such as for use in public involvement activities.

DESIGN CONSIDERATIONS

Example 1


Design ConsiderationsCritical issues to the proper operation of a facility may be identified and documented in a technical memorandum if deemed necessary by the project team• Alignment of opposing
left turn lanes• Number of receiving
lanes• Turn restrictions• Passing sight
distance

REVIEW AND APPROVAL

Review and Approval• Scoping Meeting
• assumptions• description of alternatives• modeling limits• analysis time periods (AM, PM peak periods)• design year• calibration factors• micro-simulation program

Review and Approval• Coordination
• Planning: Traffic Forecast
• Traffic Operations: Proposed traffic signal or lighting
• Location Engineers: DES Approval; Other Resources

Documentation• Documentation• provide sufficient information to allow a thorough review of
the analysis and analytical results, • document reasoning behind operational assumptions and • provide enough information to duplicate the results. • At a minimum this includes:
• assumptions (input)• calibration method and results• conceptual layout• MOE summary• design considerations• output• electronic input and output files