Traffic capacity week 04 - altafrehman
43
HIGHWAY CAPACITY Dr Rawid
Transcript of Traffic capacity week 04 - altafrehman

HIGHWAY CAPACITY
Dr Rawid

Capacity
• Capacity: It is the ability of a road toaccommodate traffic volume. It is the maximumhourly rate at which vehicles can reasonably beexpected to cross a point on a roadway during agiven time period under prevailing trafficroadway and control condition. For multi lanehighway it is 2000pcphpl, and for 2-lane highwayis 2800pcph (passenger car per hour).
• Units : vph (vehicle per hour or vphpl (vehicle Perhour per lane)

Capacity
• Basic capacity: the maximum volume of vehicles perhour that can pass a certain point or section of a roadin a given time under the ideal condition (most idealroad way, traffic and control conditions that canpossibly be attained). It assume that all the vehicles aretravelling at the same speed and minimum spacing isallowed.
• Possible capacity: the maximum number of vehiclesthat can pass a given section during a given period oftime under prevailing (most frequent/usual) roadway,traffic and control condition.


Capacity
• Practical/design capacity: Capacity without thetraffic density being so great as to causeunreasonable delays, hazard or restriction to thedrivers freedom under the prevailing condition ofroad way, traffic and control.
• Basic capacity>possible capacity>design capacity
• Volume: Number of vehicles crossing a point onthe road during a specific time period. It is carriedout for :
• Design and extension of existence road,

Volume
• Traffic trend and pattern,
• Geometric and structural design of new road,
• Design of footpath, cross wall,
• Pedestrian signals,
• Plan of one way traffic
• Other regulatory measures on the road


Effect of speed
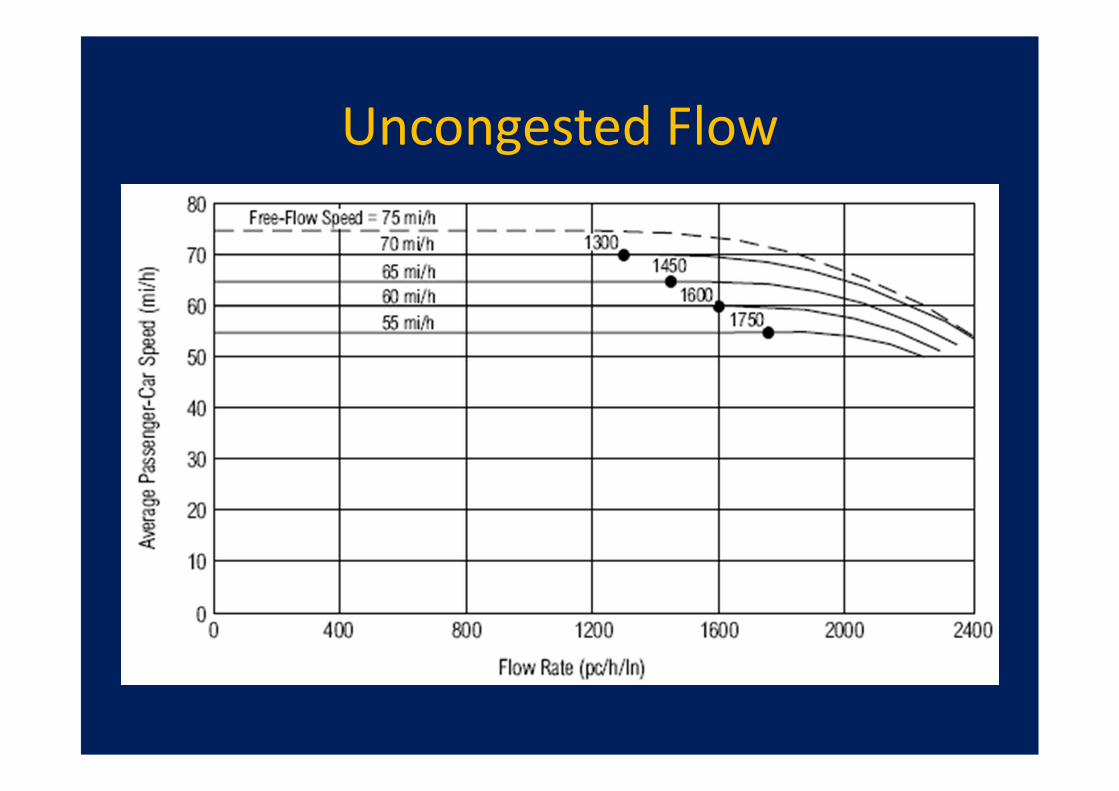
Uncongested Flow

PCU
• Passenger car unit: It is a vehicle unit used forexpressing highway capacity. One car isconsidered as a single unit, cycle, motorcycleis considered as half car unit.
• Bus , truck causes a lot of inconveniencebecause of its large size and is consideredequivalent to 3 cars or 3 PCU.

PCU
Type of vehicle PCU
Car, taxi, pick up 1.0
Cycle, motor cycle 0.5
Bus, truck, 3.0 (4.o in some cases)
Horse drawn cart 4.0
Bullock cart 6.0
Bullock cart (Large) 8.0

Factors affecting capacity
• Lane width
• Width of shoulder
• Lateral clearance
• Commercial vehicles
• Road alignment and geometry (curves,
Superelevation etc)
• Existence of intersections.
• One way or two way traffic and number of lanes

Factors affecting capacity
• Drivers and vehicular characteristics
• Single type or mixed traffic
• Flow speed
• Weather condition
• Parking
• Presence of pedestrians

Level of service
• Level of service (LOS): LOS is a scale whichdefines the operating conditions on highway.It is a measure of the restrictive effects of theincreased volume, level of service as proposedby manual ranges from A to F, A is ideal leveland F is worst level of service.

Multilane Highway LOS

LOS
LOS Max. Density (PC/min/lane)
A 12
B 20
C 30
D 42
E 67
F >67
l

Freeway LOS

LOS
• LOS A: density is low enough that closeness ofvehicle do not effect vehicle movement
• LOS E: No usable gap between vehicles, speedis slow,, condition can easily cross over intoLOS F region.
• LOS F: Breakdown condition, number ofvehicles arriving > number of vehicles leaving,speed is zero

LOS F

Levels of Service
• LOS A
• LOS C

Levels of Service
• LOS D
• LOS E

LOS
• Elements to evaluate LOS:• Travel speed and travel time• Volume to capacity ration (V/C) ratio• Density (number of vehicles per unit length on highway,
D=F/S, where S is speed and F is flow in pcph)• Delay (at intersection, signals)
If V/C =1 (level E)V/C >1 level of service is low
• Service flow=SF=V/PHF=Peak hour volume/PHF• Peak hour factor (PHF): The ratio between flow for entire
peak hr and the maximum hourly rate of the flow during 15minute of that hour

LOS
Where = correction factor for road width
• = correction factor for heavy vehicle
• =correction factor for driver population
PHVWJ fffNCVCSF ****)/(
Wf
HVf
))1()1()1(1/((1 RRbbtt
HV
EPEPEP
f
pf

LOS
Rbt EEE ,, Passenger car equivalent for truck,bus and recreational vehicles
Rbt PPP ,, Proportion of respective classvehicles
N is the number of lanes in one direction
CJ is the capacity per lane (pcphpl)

Example
• Find service flow rate (capacity), level ofservice (LOS), for an existing facility of 6 lanes,peak hr traffic=3000vph (10% trucks, 3%buses), PHF=0.9
• Solution: As PHF=peak hr volume/service flow
• SF=peak hr volume/PHF=3000/0.9=3333vph
• Cj=2000pcphpl, fw=0.93,fp=1
PHVWJ fffNCVCSF ****)/(

Example
))1()1()1(1/((1 RRbbtt
HV
EPEPEP
f
Et=4, Eb=4, Pt=0.1, Pb=0.03
fHV=1/(1+0.1(4-1)+0.03(4-1))=0.74
V/C=3333/(2000*3*0.93*1.0*0.74)=0.81
From table, B=0.54,C=0.77, D=0.93, so LOS is D
Density =31 pc/mile/lane, speed is 52mph

Example
• 31=0.1*4*D+0.03*3*D+0.87*1*D
• D=23 veh/mile/lane
• F=S*D
• S=3333/(23*3)=48mph

Example 2 (Design)
• A rural freeway is being designed, the verticalprofile design indicate a 3 mile segment of levelterrain followed by a continuous 2 mile at 4%upgrade. The peak hr demand is 2500vph in onedirection. There are 15% trucks and 10% buses.The PHF is 0.85. level of service C is desired, howmany lanes will be needed to provide for this.
• Solution::Assume lane width is 12 feet,fw=1.0,fp=1.0, fHV=?

Example 2
• PB=0.1, PT=0.15
• Part (1) zero grade:
• ET=1.7, EB=1.5
• FHV=1/(1+0.15(1.7-1)+0.1(1.5-1))=0.87
• SF=2500/0.85=2000*0.65*1.0*1.0*N*0.87
• V/C for 70mph is 0.54-0.77 for LOS C, let takeV/C=0.65
• N=2.6, say 3.0, and with N=3, V/C=0.56

Example 2
• Part (2), 4% up grade:
• For up grade, trucks are extremely heavy soEt=8, Eb=1.6,
• FHV=1/((1+0.15(8-1)+0.10(1.6-1))
• =0.47 (up grade), Now N=?
• SF=2500/0.85=2000*0.65*1.0*1.0*N*0.47
• Or N=4.0 Lanes

Problem 3
• A four lanes freeway runs through an area oflevel terrain. The freeway has 12 feet lanes, 8foot clear shoulders and a 70 mph designspeed. Traffic consists of 10% trucks and hasPHF of 0.91. Compute the service flow ratesfor each level of service for this facility.
• Solution:
PHVWJ fffNCVCSF ****)/(

Solution
• Cj=2000pcphpl (for design speed of 70 mph)• N=2 lanes per direction• Fw=1.00 (ideal condition)• Fp=1.00 (regular user)• V/C ratio different for each level of service• LOS A=0.35• LOS B=0.54• LOS C=0.77• LOS D=0.93• LOS E=1.00

Solution
• The heavy vehicles factor is determined from
• =0.93
• Service flow rate for each level of service maynow be computed as:
• SF(A)=2000*2*0.35*1.0*1.0*0.93=1308 vph
• SF (B)=2000*2*0.54*1.0*1.0*0.93=2019 vph
))1()1()1(1/((1 RRbbtt
HV
EPEPEP
f

Solution
• SF (C)=2000*2*0.77*1.0*1.0*0.93=2879 vph• SF (D)=2000*2*0.93*1.0*1.0*0.93=3477 vph• SF (E)=2000*2*1.0*1.0*1.0*0.93=3738 vph• these are service flow values during 15 minutes of peak hour.
• The service volumes during peak hour will be:• SV(A)=1308*0.91 (PHF)=1191 vph• SV (B)=2019*0.91=1837 vph• SV (C)=2879*0.91=2619 vph• SV (D)=3477*0.91=3164 vph• SV (E)=3738*0.91=3402 vph.

Problem 4
• A long viaduct on a freeway is currentlyoperating with three 12 feet lanes and 6 ftlateral clearances on both sides. Due to somecongestion, two alternatives are suggested,four 10 ft lanes with 4 ft clearance on the leftand right and four 12 ft lanes with no lateralclearance on either side. Compare thecapacity of existing facility and the twoproposed improvements. f (HV)= 0.74

Problem 4
• Solution: Capacity is the service flow rate at LOSE, by definition. The capacity for each of threecases can be determined from:
• V/C is 1.0 for LOS E, Cj is 2000 pcphpl, Fp=1.0,N=3 or 4 depend on case. The lateral width factorfw for 12 ft lanes, 6 ft clearances= 1.0
• for 10 ft lanes, 4 ft clearances=0.87• For 12 ft lanes, 0 ft clearances =0.91
PHVWJ fffNCSF ****

Problem 4
• SF(E) for 3 12 ft lanes=2000*3*1.0*1.0*0.74• =4412 vph• SF (E) for 4 10 ft lanes and 4 ft clearance on both
sides=2000*4*0.87*1.0*0.74• =5118 vph• SF (E) for 4 12 ft lanes and no
clearance=2000*4*0.91*1.0*0.74• =5353 vph• The 4 lanes increase the capacity , though the
clearance is not ideal

Problem 5
• A 10 miles section of a freeway undergoingdesign analysis. It is desired to provide LOS Dalong the entire length of the road.
• Solution: using same technique of serviceflow and service volume as
• and SV=SF*PHF, Cj=2000 pcphpl, N=2,3,4
• V/C ratio for the given LOS, fw=1.0,fp=1.0
PHVWJ fffNCVCSF ****)/(

Problem 5
Segment 01
Segment 02Segment 03
Segment 04Segment 05 Segment 06

Problem 5
• Pt=0.10 (given), Et from table for theequivalent composite grade and length of thegrade.
• Service volume for LOS D
)1(1/((1 ttHV EPf
No oflanes
Seg. 1 Seg. 2 Seg. 3 Seg. 4 Seg. 5 Seg. 6
2 2575 1969 1779 1779 1779 2016
3 3863 3348 3348 2835 2835 3240
4 5151 4464 4464 3780 3780 4320

Service volume for various LOS
LOS Seg. 13 lanes
Seg. 24 lanes
Seg. 34 lanes
Seg. 44 lanes
Seg. 54 lanes
Seg. 64 lanes
A 1454 1680 1680 0 0 0
B 2243 2592 2592 2205 2205 2520
C 3198 3696 3696 3105 3105 3549
D 3863 4464 4464 3780 3780 4320
E 4154 4800 4800 4500 4500 5143

• The proposed design is therefore adequate