
Traffic Assessment Report - City of Salisbury · Unauthorised use of this document in any form ......
61
Traffic Assessment Report Salisbury Main Roads DPA URPS June 2015 Ref No. 20150207FR01B
Transcript of Traffic Assessment Report - City of Salisbury · Unauthorised use of this document in any form ......

Traffic Assessment Report
Salisbury Main Roads DPA
URPS
June 2015
Ref No. 20150207FR01B

Ref No. 20150207FR01B Traffic Assessment Report Salisbury Main Roads DPA
© Tonkin Consulting 2015
This document is, and shall remain, the property of Tonkin Consulting. The document may only be used for the purposes for which it was commissioned
and in accordance with the Terms of Engagement for the commission. Unauthorised use of this document in any form whatsoever is prohibited.
Document History and Status Rev Description Author Reviewed Approved Date
A For Client Comment RCB PCS 22 June 2015
B Final RCB PCS RCB 29 June 2015

Ref No. 20150207FR01B Traffic Assessment Report Salisbury Main Roads DPA
Contents
1 Introduction 1
2 Existing Conditions 2
2.1 Site 1 – Salisbury Plain 2 2.1.1 Traffic Volumes 2 2.1.2 Traffic Operation 3
2.2 Site 2 – Para Hills West 3 2.2.1 Traffic Volumes 4 2.2.2 Traffic Operation 4
2.3 Site 3 – Greenfields 4 2.3.1 Traffic Volumes 5 2.3.2 Traffic Operation 5
3 Future Conditions 6
3.1 Site 1 – Salisbury Plain 6 3.1.1 Traffic Volumes 6 3.1.2 Traffic Operation 6
3.2 Site 2 – Para Hills West 6 3.2.1 Traffic Volumes 7 3.2.2 Traffic Operation 7
3.3 Site 3 – Greenfields 8 3.3.1 Traffic Volumes 8 3.3.2 Traffic Operation 8
4 Traffic Assessment 9
4.1 Introduction 9
4.2 Key Assumptions 9
4.3 Site 1 – Salisbury Plain 10 4.3.1 Proposed Development and Access 10 4.3.2 Traffic Volumes 11 4.3.3 SIDRA assessment 12 4.3.4 Infrastructure Requirement 13
4.4 Site 2 – Para Hills West 13 4.4.1 Proposed Development and Access 13 4.4.2 Traffic Volumes 14 4.4.3 SIDRA assessment 15 4.4.4 Infrastructure Requirement 16
4.5 Site 3 – Greenfields 16 4.5.1 Proposed Development and Access 16 4.5.2 Traffic Volumes 18 4.5.3 SIDRA assessment 19 4.5.4 Infrastructure Requirement 19
5 Summary 21

Ref No. 20150207FR01B Traffic Assessment Report Salisbury Main Roads DPA
Tables Table 4.1 Site 1 – 2036 Expected Traffic Volumes 12 Table 4.2 Site 2 – 2036 Expected Traffic Volumes 15 Table 4.3 Site 3 – 2036 Expected Traffic Volumes 19
Figures Figure 1.1 Locality Plan 1 Figure 2.1 Site 1 – area of investigation 2 Figure 2.2 Site 2 – area of investigation 3 Figure 2.3 Site 3 – area of investigation 5 Figure 4.1 Site 1 – Proposed area of Rezoning 10 Figure 4.2 Site 1 – Proposed access arrangement 11 Figure 4.3 Site 2 – Proposed Rezoning 14 Figure 4.4 Site 3 – Proposed Rezoning 17 Figure 4.5 Site 3 – Possible access arrangement 18
Appendices Appendix A Existing Traffic Data Appendix B DPTI Future Traffic Data Appendix C SIDRA Outputs No Development Appendix D SIDRA Outputs With Development

Ref No. 20150207FR01B Traffic Assessment Report Salisbury Main Roads DPA 1
1 Introduction Tonkin Consulting has been engaged by URPS and the City of Salisbury to undertake a traffic assessment of the proposed rezoning of three areas within the City of Salisbury. The proposed rezoning is to allow commercial / bulky goods type development in areas which are currently zoned light industry.
The three locations are indicated in Figure 1.1 below and include:
Site 1 – Main North Road at Salisbury Plain between Saints Road and Stanbel Road;
Site 2 – Main North Road at Para Hills West between McIntyre Road and Kesters Road;
Site 3 – Salisbury Highway at Greenfields between Ryans Road and Elder Smith Road.
Figure 1.1 Locality Plan
The scope of the traffic assessment has involved the following:
Review of existing traffic conditions and operation of each site;
Review of access conditions to assist with future development of the locations;
Estimation of future traffic demands;
Assessment of traffic impacts using SIDRA; and
Identification of infrastructure required to support the sites as well to ensure operation of the road network.
The following sections detail the assessment undertaken for each of the sites.
Salisbury Highway
Salisbury Town Centre
Main North Road
Parafield Airport
Site 1
Site 2 Site 3

Ref No. 20150207FR01B Traffic Assessment Report Salisbury Main Roads DPA 2
2 Existing Conditions This section provides a summary of the existing traffic conditions at each of the three sites. Existing traffic data for the three sites is provided in Appendix A.
2.1 Site 1 – Salisbury Plain
The area covered by the proposed DPA is indicated in Figure 2.1 below. The area is generally described as those allotments having a frontage to the west of Main North Road (to a depth of about 230 metres), between Saints Road and Stanbel Road. Excluding the Neighbourhood Centre Zone and including lots that do not have a direct frontage to Main North Road (to the north), there is approximately 14.5 hectares of land within the area.
Figure 2.1 Site 1 – area of investigation
The majority of the site is characterised by typical industrial land uses. It includes retail and service trade premises in the form of car yards, auction yard and builders supplies.
There is no direct access to Main North Road from the abutting properties as they all use the service road. The service road has access to Stanbel Road and a left in/out junction at the northern end to provide access to Main North Road. It is considered that the layout for the Stanbel Road junction with the service road is not ideal and can be confusing for drivers.
2.1.1 Traffic Volumes
This section of Main North Road is classified as major traffic, Peak hour, Cycling and Freight route within DPTI’s functional road hierarchy. On this basis Main North Road has a significant priority in the road network.
Existing traffic data indicates that the daily traffic volume on Main North Road is 46,000 vehicles per day (vpd) with Stanbel Road having a volume of 3,700vpd. No data is provided for traffic along the service road north of Stanbel Road.
Peak hour volumes on Main North Road vary during the peak periods as indicated below:
Main North Road
Stanbel Road
Saints Road
Service Road
Grove Way
Area added to site after study started

Ref No. 20150207FR01B Traffic Assessment Report Salisbury Main Roads DPA 3
AM Peak 1,680 to 1,720 Northbound 2,510 to 2,570 Southbound PM Peak 2,220 to 2,450 Northbound 1,730 to 1,860 Southbound It is estimated that the two-way peak volume on Stanbel Road would be in the order of 370 vehicles per hour (based on a peak volume of 10% of daily traffic).
2.1.2 Traffic Operation
Traffic operation is considered satisfactory outside of peak times, although at times there can be some congestion at the junction with Stanbel Road. During peak periods congestion is considered significant with long queues and delays along Main North Road at both the Park Terrace and Saints Road intersections.
SIDRA assessment indicates that the saturation flows have to be significantly increased from 1950 (the default value in SIDRA) to 2200vph to cater for the traffic demands travelling through the intersection. This is in essence a form of calibration of the SIDRA model. These values are then carried forward to the future traffic assessment.
2.2 Site 2 – Para Hills West
The area covered by the proposed DPA is indicated in Figure 2.2 below. The area is generally described as those allotments having a frontage to the east of Main North Road (to a depth of about 330 metres), between Ayfield Road and Kesters Road, Para Hills West. The original area extended further south to Research Road, but was removed as it was considered that the larger lots such as Leibher would not be redeveloped.
Figure 2.2 Site 2 – area of investigation
Excluding the Neighbourhood Centre Zone and including lots that do not have a direct frontage to Main North Road, there is approximately 13.5 hectares of land within the area. In general, the
Parafield Airport
Kesters Road
Main North Road
Ayfield Road
McIntyre Road
Kings Road

Ref No. 20150207FR01B Traffic Assessment Report Salisbury Main Roads DPA 4
area can still be characterised as an industrial area, with small pockets of trade services premises.
This section of Main North Road is classified as major traffic, Peak hour, Cycling and Freight route within DPTI’s functional road hierarchy. On this basis Main North Road has a significant priority in the road network.
Most properties fronting Main North Road are accessed via a service road. The service road provides an entry at the northern end (by Ayfield Road) and then connects through to Kesters Road.
2.2.1 Traffic Volumes
Existing traffic data indicates that the daily traffic volume on Main North Road varies between 45,800 and 55,300vpd. The local roads generally have traffic volumes ranging between 500 and 2,000vpd. This increases to 6,100vpd for Kesters Road.
Peak hour volumes on Main North Road vary during the peak periods as indicated below:
AM Peak 1,600 to 1,900 Northbound 2,650 to 2,870 Southbound PM Peak 3,100 to 3,560 Northbound 1,600 to 1,900 Southbound
Peak hour volumes on Kesters Road are indicated below:
AM Peak 240 Eastbound 260 Westbound PM Peak 610 Eastbound 210 Westbound It is estimated that the two-way peak volume on the service road would be in the order of 200 vehicles per hour (based on a peak volume of 10% of daily traffic).
2.2.2 Traffic Operation
Traffic operation is considered satisfactory outside of peak times, although at times there can be some congestion at the junction with Kesters Road (right turn in). During peak periods congestion is considered significant with long queues and delays along Main North Road at the signalised intersections with Maxwell Road / Elder Smith Road and McIntyre Road / Kings Road.
The SIDRA assessment indicates that the saturation flows have to be significantly increased from the default value in SIDRA of 1950 to 2100vph to cater for the traffic demands travelling through the intersection.
2.3 Site 3 – Greenfields
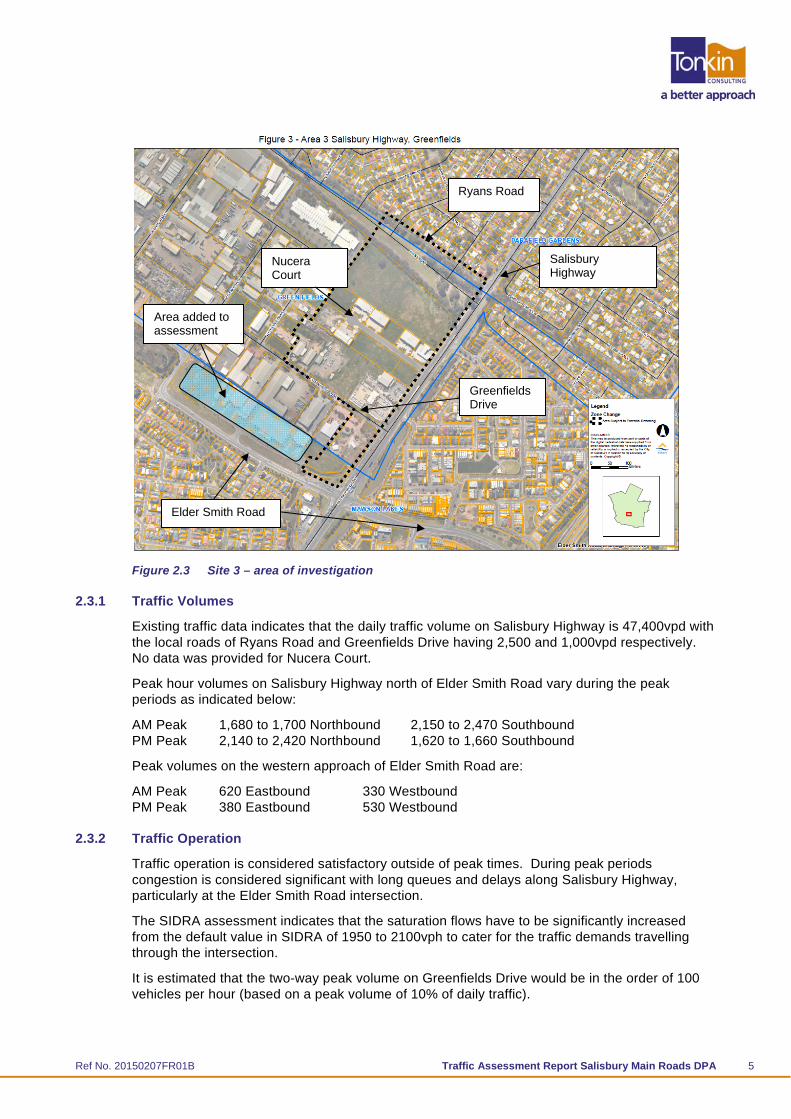
The area covered by the proposed DPA is indicated in Figure 2.3 below. The area is generally described as those allotments having a frontage to the west of Salisbury Highway, between Ryans Road and Elder Smith Drive. Including land (as opposed to all of the allotment) having a depth of about 65 metres from the allotment frontage, there is approximately 3 hectares of land within the area. Note that the area was increased to consider properties along the frontage of Elder Smith Road west of Salisbury Highway.
The majority of the site is characterised by typical industrial land uses and vacant land. Part of the land area was designated as road corridor by DPTI, however, it is now surplus to requirements.
This section of Salisbury Highway is classified as a peak hour and public transport route within DPTI’s functional road hierarchy. Direct access is provided from Salisbury Highway.
Ryans Road adjacent to the site is a local road but with an emphasis on non commercial traffic except for a bus route. Greenfields Road is also a local road but provides for commercial vehicle movement to the surrounding commercial premises.
Ref No. 20150207FR01B Traffic Assessment Report Salisbury Main Roads DPA 5
Figure 2.3 Site 3 – area of investigation
2.3.1 Traffic Volumes
Existing traffic data indicates that the daily traffic volume on Salisbury Highway is 47,400vpd with the local roads of Ryans Road and Greenfields Drive having 2,500 and 1,000vpd respectively. No data was provided for Nucera Court.
Peak hour volumes on Salisbury Highway north of Elder Smith Road vary during the peak periods as indicated below:
AM Peak 1,680 to 1,700 Northbound 2,150 to 2,470 Southbound PM Peak 2,140 to 2,420 Northbound 1,620 to 1,660 Southbound
Peak volumes on the western approach of Elder Smith Road are:
AM Peak 620 Eastbound 330 Westbound PM Peak 380 Eastbound 530 Westbound
2.3.2 Traffic Operation
Traffic operation is considered satisfactory outside of peak times. During peak periods congestion is considered significant with long queues and delays along Salisbury Highway, particularly at the Elder Smith Road intersection.
The SIDRA assessment indicates that the saturation flows have to be significantly increased from the default value in SIDRA of 1950 to 2100vph to cater for the traffic demands travelling through the intersection.
It is estimated that the two-way peak volume on Greenfields Drive would be in the order of 100 vehicles per hour (based on a peak volume of 10% of daily traffic).
Salisbury Highway
Ryans Road
Greenfields Drive
Elder Smith Road
Nucera Court
Area added to assessment

Ref No. 20150207FR01B Traffic Assessment Report Salisbury Main Roads DPA 6
3 Future Conditions This section briefly describes the future operation of the road network without the proposed development. For this assessment the base year is 2036.The traffic data used for the assessment was provided by DPTI and is contained in Appendix B. The SIDRA output data is provided in Appendix C.
3.1 Site 1 – Salisbury Plain
DPTI have indicated there is no change in the road network within the area other than possible intersection treatments.
3.1.1 Traffic Volumes
Daily traffic on the section of Main North Road between Saints Road and Park Terrace are expected to increase to between 58,400 to 60,400vpd.
Peak hour volumes on Main North Road are also expected to increase during the peak periods as indicated below:
AM Peak 2,490 to 2,550 Northbound 3,180 to 3,190 Southbound PM Peak 3,010 to 3,230 Northbound 2,280 to 2,330 Southbound
A four lane divided road can cater for these traffic volumes.
3.1.2 Traffic Operation
The Degree of Saturation and overall average delay (seconds) per vehicle are provided below for the Saints Road / Grove Way and Park Terrace / Smith Road intersections.
Grove Way / Saints Road
2036 No development AM peak – Degree of Sat = 1.47, Ave Delay = 186 PM peak – Degree of Sat = 1.14, Ave Delay = 95.2
Park Terrace / Smith Road
2036 No development AM peak – Degree of Sat = 1.47, Ave Delay = 186 PM peak – Degree of Sat = 1.39, Ave Delay = 438 The SIDRA assessment indicates that the intersections will exceed capacity with the proposed increase in traffic demands. This is expected to result in significant queues/congestion along Main North Road and impact on the traffic operation of the midblock sections as well as adjoining roads. In particular it could impact on access to Main North Road from the local roads and result in diversion of traffic through the local road network to alternative routes. It is noted that with the increased traffic volumes on Main North Road the operation of the Stanbel Road junction is likely to worsen. In particular, right turn movements to / from Main North Road will become increasingly difficult.
3.2 Site 2 – Para Hills West
DPTI have indicated there is likely to be a change in the road network within the area due to continuing development of Parafield Airport. It is proposed that a new access is provided opposite Kesters Road that will require the signalisation of the junction with Kesters Road. They have advised that all movements at the new intersection will be provided for including the right turn exit from Kesters Road.
The draft Integrated Transport and Land Use Plan (ITLUP) indicates that Elder Smith Road would be duplicated. These improvements are included in this assessment.

Ref No. 20150207FR01B Traffic Assessment Report Salisbury Main Roads DPA 7
3.2.1 Traffic Volumes
Daily traffic on the section of Main North Road between Elder Smith Road and Kings Road are expected to increase to between 54,500 to 55,900vpd. Traffic on Kesters Road is likely to increase to 11,100vpd.
Peak volumes on Main North Road are also expected to increase during the peak periods as indicated below:
AM Peak 2,180 to 2,300 Northbound 3,260 to 3,370 Southbound PM Peak 2,850 to 3,230 Northbound 2,320 to 2,440 Southbound
A four lane divided road can cater for these traffic volumes.
Peak traffic volumes on Kesters Road are expected to increase to 350 vehicles an hour in the AM peak but remain similar to existing for the PM peak period.
3.2.2 Traffic Operation
The Degree of Saturation and overall average delay per vehicle are provided below for the McIntyre Road / Kings Road, Kesters Road/ Parafield Access and Maxwell Road / Elder Smith Road intersections.
McIntyre Road / Kings Road
2036 No development AM peak – Degree of Sat = 1.37, Ave Delay = 205 PM peak – Degree of Sat = 1.34, Ave Delay = 293
Kesters Road / Parafield Access
2036 No development AM peak – Degree of Sat = 0.90, Ave Delay = 36 PM peak – Degree of Sat = 0.88, Ave Delay = 33
Maxwell Road / Elder Smith
2036 No development AM peak – Degree of Sat = 1.08, Ave Delay = 107 PM peak – Degree of Sat = 0.94, Ave Delay = 46
The SIDRA assessment indicates that the McIntyre Road / Kings Road intersection will exceed capacity with the proposed increase in traffic demands. This is expected to result in significant queues / congestion along Main North Road and impact on the traffic operation of the midblock sections as well as adjoining roads. In particular it could impact on access to Main North Road from the local roads and result in diversion of traffic through the local road network to alternative routes.
The other two intersections have sufficient capacity to cater for the predicted 2036 traffic demands albeit with limited growth.
Additional traffic is expected to be attracted to Kesters Road due to the change in access with the new Kesters Road signalised intersection. This is expected to impact on the operation of the service road junction located to the east of the service station. It is expected that right turn movements from the service road may be difficult and traffic could deviate to other local roads.

Ref No. 20150207FR01B Traffic Assessment Report Salisbury Main Roads DPA 8
3.3 Site 3 – Greenfields
DPTI have indicated there is likely to be a change in the road network within the area. The draft Integrated Transport and Land Use Plan (ITLUP) indicates that Elder Smith Road be duplicated and extended through to Port Wakefield Road. This would significantly improve road and freight accessibility to this area. These improvements are included in this assessment.
3.3.1 Traffic Volumes
Daily traffic on the section of Salisbury Highway between Elder Smith Road and Ryans Road are expected to increase to between 40,500 to 45,200vpd. Traffic on Elder Smith Road is likely to increase to 14,300vpd.
Peak volumes on Salisbury Highway are also expected to increase during the peak periods as indicated below:
AM Peak 1,230 to 1,630 Northbound 2,520 to 2,560 Southbound PM Peak 2,560 to 2,580 Northbound 1,260 to 1,570 Southbound
A four lane divided road can cater for these traffic volumes.
3.3.2 Traffic Operation
The Degree of Saturation and overall average delay per vehicle are provided below for the Salisbury Highway / Elder Smith Road intersection is indicated below.
2036 No development AM peak – Degree of Sat = 1.29, Ave Delay = 161 PM peak – Degree of Sat = 1.06, Ave Delay = 92
This assessment indicates that the Salisbury Highway / Elder Smith Road intersection will exceed capacity with the proposed increase in traffic demands. This is expected to result in significant queues / congestion along Salisbury Highway and impact on the traffic operation of the midblock sections as well as adjoining roads. In particular it could impact on access to Salisbury Highway from the local roads (Ryans and Greenfields Roads) and result in diversion of traffic through the local road network to alternative route such as Belfree Drive and George Street.

Ref No. 20150207FR01B Traffic Assessment Report Salisbury Main Roads DPA 9
4 Traffic Assessment 4.1 Introduction
This assessment has determined the impacts of the changes in land use on the traffic operation of the road network in the immediate area of the development. The process involved:
Determination of traffic volumes generated by the proposed change in use;
Undertake an existing SIDRA assessment of the key intersections (Refer Section 2);
DPTI has provided base 2036 data for the assessment at the specific intersections. Essentially the process involved estimating the change in traffic volumes due to the change in land use and then add these to the base 2036 traffic data;
A SIDRA assessment was then undertaken of the operation of the locations without (Section 3) and with the proposed land used changes to determine the impact. 2036 was considered the base year for the assessment; and
Infrastructure was then identified to ensure that the operation with the development is no worse than without.
4.2 Key Assumptions
Key assumptions used in the assessment included:
A worst case of 75% conversion of existing properties (land uses) within the study areas. Vacant sites in the areas are assumed to be 100% utilised;
Traffic generation for vacant sites was assumed to be 2.5 peak hour trips per 100m2 of developable area;
For sites with existing use it was assumed the change from industry /. Warehouse to bulky goods / commercial increases traffic by 1.9 trips peak hour per 100m2 of developable area;
For all sites the percentage of developable area was assumed to be 40% of the site area;
A 20% reduction in traffic was assumed for shared uses and that some of the traffic generated is diverted traffic;
The assessment assumed the PM peak was the worst hour to be assessed. The AM peak was checked but at a lower rate (25%) as typically there are very few customers at this time; and
Traffic distribution was assessed per location but typically spread evenly over the four directions.
The assessments with the proposed developments are provided in the following sections. Appendix D contains the SIDRA outputs for the With Development case.

Ref No. 20150207FR01B Traffic Assessment Report Salisbury Main Roads DPA 10
4.3 Site 1 – Salisbury Plain
4.3.1 Proposed Development and Access
The proposed land use change is to modify the area to provide for a Bulky Goods Zone with limited supplementary uses.
Figure 4.1 Site 1 – Proposed area of Rezoning
The Pickles Auction site comprises a significant proportion of the area that could be rezoned. On this basis there is a good likelihood that the land parcels could be aggregated to form one large land holding. If this was the case then access arrangements to the area could be significantly improved.
The changes in land use are expected to add significant traffic to the area. It would be expected that the existing access points would not be able to cater for the additional traffic demands and there could also be a corresponding increase in safety risk, particularly at the Stanbel Road junction.
A number of alternative access arrangements to cater for the demands were assessed with the preferred treatment indicated in the figure below including:
Provision of a new access road to Stanbel Road;
Extending the service road;
Proposed Area for Rezoning

Ref No. 20150207FR01B Traffic Assessment Report Salisbury Main Roads DPA 11
A new junction at the northern end; and
Providing a new road linking through to Barndioota Road.
Figure 4.2 Site 1 – Proposed access arrangement
The new junction at the northern end to Main North Road need only allow for right turns into and left turns out of the new or extended road (ie access to/from the north). The provision of the new access to Stanbel Road would allow for the existing access to the service road to be closed. DPTI may not allow the proposed junction onto Main North Road and hence the provision of an alternative access to Barndioota Road is considered appropriate. The new internal road may not be provided if the lot sizes are likely to be large. However, if they are to be smaller and under separate ownership, the internal road may be more appropriate.
4.3.2 Traffic Volumes
In determining the traffic volumes the following assumptions were made with regard to this site:
Area of Land Use change – Vacant 3.5Ha Developed 10.4 Ha
From the assumptions indicated in Section 4.2 the total traffic generated by the proposed change of land use is estimated to be in the order of:
Total Daily Traffic – 4,100 trips per day two-way with discount (5,200 no discount)
Peak Hour Traffic AM – 180 trips per hour, PM - 720 trips per hour
Traffic was then distributed to the road network based on the following percentages:
North and South 30% each to Main North Road
East - 25% with 15 to Grove Way and 10% to Smith Road
West 15% with 5% Park Terrace and 10% to Stanbel Road
New connection if access to Main North Road cannot be provided
Close access to Stanbel Road but retain left slip in
New junction
Extend service Road
New access to Stanbel Road

Ref No. 20150207FR01B Traffic Assessment Report Salisbury Main Roads DPA 12
With the current road layout it is not expected that traffic would use Saints Road if the proposed access provisions are provided.
Based on these percentages the traffic increases on each of the road sections within the vicinity of the locations is highlighted in Table 4.1.
Table 4.1 Site 1 – 2036 Expected Traffic Volumes
Road Daily traffic increase
PM Peak traffic increase
North South
Main North Road
North of Saints Road 1,230 110 110
Stanbel Road to Saints Road 1,850 165 165
Park Terrace to Stanbel Road 1,640 160 160
South of Park Terrace 1,230 110 110
East West
The Grove Way 620 55 55
Park Terrace 210 20 20
Smith Road 200 35 35
Stanbel Road 650 80 145
4.3.3 SIDRA assessment
Intersections assessed include Main North Road with Grove Way / Saints Road and Park Terrace / Smith Road.
Grove Way / Saints Road
2036 No development AM peak – Degree of Sat = 1.47, Ave Delay = 186 PM peak – Degree of Sat = 1.14, Ave Delay = 95.2 2036 With development AM peak – Degree of Sat = 1.47, Ave Delay = 190 PM peak – Degree of Sat = 1.30, Ave Delay = 120.0
There is minimal change in operation for the AM peak. However in the PM Peak the change in operation is considered significant and would require improvement. A review of the intersection layout indicates that the only real alternative is to provide a northbound through lane. Consideration was given to improving the Grove Way approach but improvement was minimal.
Assessment of the improvement indicates change to better than without. However the concept to do this may be difficult with impact on left turn from Saints Road.
2036 with improvement PM peak – Degree of Sat = 1.03, Ave Delay = 60
Park Terrace / Smith Road
2036 No development AM peak – Degree of Sat = 1.47, Ave Delay = 186 PM peak – Degree of Sat = 1.39, Ave Delay = 438 2036 With development AM peak – Degree of Sat = 1.47, Ave Delay = 190 PM peak – Degree of Sat = 1.40, Ave Delay = 550
There is little change in operation for the AM peak. However for the PM peak the change in operation is considered significant and would require improvement.

Ref No. 20150207FR01B Traffic Assessment Report Salisbury Main Roads DPA 13
A review of the intersection layout indicates that the operation can be improved by providing a second right turn lane on the northern Main North Road approach.
2036 with improvement PM peak – Degree of Sat = 1.82, Ave Delay = 450
The impact on Stanbel Road is difficult to determine. The closure of the accesses and relocating the left turn slip north will improve operation but the increase in traffic volumes of 80 vehicles in the westerly direction is likely to result in congestion and traffic is expected to divert to Park Terrace, particularly for the right turn out.
4.3.4 Infrastructure Requirement
To provide for safe and efficient access to for the development of the area the following works are recommended:
Provide a new junction with Main North Road with left in /out as well as right turn entry with appropriate storage lanes;
Extend the service road north to match the location of the new access into the area;
Provide a new road connection from the service road to Stanbel Road; and
Close the existing service road connections at Stanbel Road but retain left turn entry from Main North Road.
The proposed change of land use is expected to add significant traffic to the road network and the following improvements may be required to maintain traffic operation compared to the no development scenario:
Intersection works:
At the Main North Road intersection with Park Terrace / Smith Road provide a second right turn lane from the northern approach to the intersection; and
At the Main North Road intersection with Grove Way / Saints Road provide a fourth northbound through lane to cater for PM peak flows.
DPTI may not allow the proposed junction onto Main North Road and hence to provide an alternative access the provision of a connection to Barndioota Road is considered appropriate. This will require acquiring land from an undeveloped business. This connection could change the traffic distribution with a transfer to Saints Road of some traffic destined to the north and east along Main North Road and the Grove Way respectively.
4.4 Site 2 – Para Hills West
4.4.1 Proposed Development and Access
The area covered by the proposed DPA is indicated in Figure 4.3 below.
The Bulky Goods, Commercial, Mixed Use, Urban Employment and Industry Zones of the SAPPL have been considered for this area. Subject to further investigations, Council should consider updating sections of the existing Industry zone (eg sites south of McIntyre Road) to recognise existing non-industrial activities and promote redevelopment of localities. Council should consider introducing a SAPPL Commercial Zone over parts of the non-core Industry Zone sites. It is noted that the SAPPL Commercial Zone envisages land uses such as light industry, bulky goods outlets, and service trade premises. At this stage, much of the Industry Zone is appropriate for the existing larger sites and established industrial operations.

Ref No. 20150207FR01B Traffic Assessment Report Salisbury Main Roads DPA 14
Figure 4.3 Site 2 – Proposed Rezoning
The changes in land use are expected to add traffic to the area. The quantum of the increase is hard to determine as it assumed the large parcels would still remain. Hence the impact on traffic operation is difficult to determine
Access arrangements for the properties north of Maxwell Road should remain as is, unless significant safety issues are identified in the future.
4.4.2 Traffic Volumes
In determining the traffic volumes the following assumptions were made with regard to this site:
Area of Land Use change – Vacant 0.0Ha Developed 12.54 Ha
From the assumptions indicated in Section 4.2 the total traffic generated by the proposed change of land use is estimated to be in the order of:
Total Daily Traffic – 3,050 trips per day two-way with discount (3,800 no discount)
Peak Hour Traffic AM – 150 trips per hour, PM - 600 trips per hour
New signalised intersection with access to Parafield Airport Development Proposed Area for
Rezoning

Ref No. 20150207FR01B Traffic Assessment Report Salisbury Main Roads DPA 15
Traffic was then distributed to the road network based on the following percentages:
North and South 30% each to Main North Road;
East 20% with 10% each to Kesters and McIntyre Roads;
West 20% with 10% each to Elder Smith and Kings Roads.
Based on these percentages the daily and PM Peak hour traffic increases on each of the road sections within the vicinity of the locations is highlighted in Table 4.2.
Table 4.2 Site 2 – 2036 Expected Traffic Volumes
Road Daily traffic increase PM Peak traffic increase
North South
Main North Road
North of McIntyre Road 900 90 90
McIntyre Road to Kesters 1,500 120 135
Kesters Road to Elder Smith Road
1,500 125 125
South of Elder Smith Road 900 90 90
East West
Kings Road 300 30 30
McIntyre Road 300 20 20
Elder Smith Road 300 35 35
Kesters Road (east) 300 30 30
North South
Service Road 1,800 120 160
4.4.3 SIDRA assessment
Intersections assessed include Main North Road with Kings Road / McIntyre Road / Saints Road and Park Terrace / Smith Road.
McIntyre Road / Kings Road
2036 No development AM peak – Degree of Sat = 1.37, Ave Delay = 205 PM peak – Degree of Sat = 1.34, Ave Delay = 293 2036 With development AM peak – Degree of Sat = 1.37, Ave Delay = 235 PM peak – Degree of Sat = 1.34, Ave Delay = 323
This change in operation is considered minor to moderate and could require improvement. A review of the intersection layout indicates that improved operations can be made by providing a second right turn lane on both Main North Road approaches.
2036 with improvement AM peak – Degree of Sat = 1.37, Ave Delay = 227 PM peak – Degree of Sat = 1.28, Ave Delay = 133
Kesters Road / Parafield Access
2036 No development AM peak – Degree of Sat = 0.90, Ave Delay = 36 PM peak – Degree of Sat = 0.88, Ave Delay = 33 2036 With development AM peak – Degree of Sat = 0.91, Ave Delay = 42 PM peak – Degree of Sat = 0.90, Ave Delay = 44

Ref No. 20150207FR01B Traffic Assessment Report Salisbury Main Roads DPA 16
This change in operation is considered minor particularly as Level of Services is D for the with development case. Hence no improvements are required.
Maxwell Road / Elder Smith
2036 No development AM peak – Degree of Sat = 1.08, Ave Delay = 107 PM peak – Degree of Sat = 0.94, Ave Delay = 46 2036 With development AM peak – Degree of Sat = 1.08, Ave Delay = 109 PM peak – Degree of Sat = 0.97, Ave Delay = 52.5
This change in operation is considered minor particularly as Level of Services is D for the with development case. Hence no improvements are required.
The increase in traffic on the service road can be catered for by the existing road layout. However there may be delays and congestion with the increased traffic at the junction of the service road with Kesters Road. This could increase the risk of crashes and the operation should be monitored. If the congestion is considered significant then drivers may use the local road network to access the arterial road network. If this is the case the preference is to direct traffic towards Ayfield Road and then Peacock Road. Traffic should not be directed towards Beafield Road due to its residential nature.
4.4.4 Infrastructure Requirement
To provide for safe and efficient access to for the development of the area the following works are recommended.
Access works – No major works required to support the rezoning.
There may be a need to monitor junction of service road with Kesters Road to review congestion levels and crash history with the additional traffic.
The proposed change of land use is expected to add traffic to the road network and the following improvements may be required to maintain traffic operation compared to the no development scenario:
Intersection works:
At the Main North Road intersection with McIntyre Road / Kings Road provide a second right turn lane from the southern approach to the intersection.
4.5 Site 3 – Greenfields
4.5.1 Proposed Development and Access
The area covered by the proposed DPA is indicated in Figure 4.4 below. The initial area was increased to consider the land to the north of Elder Smith Road west of Salisbury Highway.
Commercial land uses, such as small to medium scale service trade premises, bulky goods outlets and large format retailing (such as liquor stores) and petrol filling stations, are unlikely to have a significant impact on nearby Centres and therefore should “in-principle” be considered.
The changes in land use will increase traffic volumes in the area. The key is to ensure that the section of Ryans Road is not significantly affected by the impacts of the development, in particular mixing of commercial / residential traffic.

Ref No. 20150207FR01B Traffic Assessment Report Salisbury Main Roads DPA 17
Figure 4.4 Site 3 – Proposed Rezoning
A number of alternative access arrangements have been identified to cater for the traffic demands. The preferred access arrangement will be dependent on what happens with the larger vacant area and whether it can be consolidated with the no longer required road reserve. The preferred treatments are indicated below and shown in Figure 4.5:
Allow direct access from Salisbury Highway (left in /out with possibility of right turn in) to the northern section of the site;
Provision of a new access road connected to Nucera Court or between Nucera Court and Greenfields Drive; and
A new link connection to Watervale Drive (note will require land acquisition from property outside of area).
Proposed Area for Rezoning

Ref No. 20150207FR01B Traffic Assessment Report Salisbury Main Roads DPA 18
Figure 4.5 Site 3 – Possible access arrangement
4.5.2 Traffic Volumes
In determining the traffic volumes the following assumptions were made with regard to this site:
Area of Land Use change – Vacant 13.0 Ha Developed 6.8 Ha
From the assumptions indicated in Section 4.2 the total traffic generated by the proposed change of land use is estimated to be in the order of:
Total Daily Traffic – 7,200 trips per day two-way with discount (9,000 no discount)
Peak Hour Traffic AM – 270 trips per hour, PM – 1,070 trips per hour
Traffic was then distributed to the road network based on the following percentages:
North and South 30% each to Salisbury Highway;
East 25% to Elder Smith Road;
West 15% via Elder Smith Roads (7%) and Greenfields / Watervale Drives (8%).
Based on these percentages the daily and PM Peak hour traffic increases on each of the road sections within the vicinity of the locations is highlighted in Table 4.3.
Elder Smith Drive
Watervale Dr
Nucera Court
Salisbury Highway
Ryans Road
New link to Watervale Dr
New junction with left turn in / out and a right turn in
Possible Link Road

Ref No. 20150207FR01B Traffic Assessment Report Salisbury Main Roads DPA 19
Table 4.3 Site 3 – 2036 Expected Traffic Volumes
Road Daily traffic increase
PM Peak traffic increase
North South
Salisbury Highway
North of Ryans Road 1,460 175 175
Nucera Court to Ryans Road 1,900 120 135
Greenfields Drive to Nucera Ct 2,100 215 45
Greenfields Dr to Elder Smith Road
3,000 305 150
South of Elder Smith Road 1,460 175 175
East West
Elder Smith Road East 1,800 145 145
Elder Smith Road West 800 190 30
Greenfields Drive 500 30 30
4.5.3 SIDRA assessment
Only the Salisbury Highway / Elder Smith Road signalised intersection was assessed.
Salisbury Highway / Elder Smith Road
2036 No development AM peak – Degree of Sat = 1.29, Ave Delay = 161 PM peak – Degree of Sat = 1.06, Ave Delay = 92 2036 With development AM peak – Degree of Sat = 1.32, Ave Delay = 165 PM peak – Degree of Sat = 1.39, Ave Delay = 212
This change in operation is considered significant in the PM peak period and would require improvement. A review of the intersection layout indicates that can improve operation by providing a third northbound through lane.
2036 with improvement PM peak – Degree of Sat = 0.92, Ave Delay = 48
It is noted that the provision of the northbound lane may impact on access to Greenfields Drive. More detailed concept development would be required.
The additional traffic on Greenfields Drive can be catered for by the existing layout. However, during peak periods traffic is likely to be diverted towards Belfree Drive and then to Elder Smith Road.
4.5.4 Infrastructure Requirement
To provide for safe and efficient access to for the development of the area the following works are recommended:
Provide a new junction with Salisbury Highway to the north of Nucera Court with left out and right in access with appropriate storage lanes; and
Provide a connection between Nucera Court and Greenfields Drive and from the northern vacant parcel to Watervale Road.
The proposed change of land use is expected to add significant traffic to the road network and the following improvements may be required to maintain traffic operation compared to the no development scenario:
Intersection works:
Ref No. 20150207FR01B Traffic Assessment Report Salisbury Main Roads DPA 20
At the Salisbury Highway intersection with Elder Smith Road provide a third northbound through lane on the southern Salisbury Highway approach to the intersection.
The extra traffic on Greenfields Drive and its connection to Elder Smith Road (west) could impact on local traffic movements. The future junction with Elder Smith Road should be designed to cater for all movements.
DPTI may not allow the proposed junction onto Salisbury Highway and hence to provide an alternative access the provision of a connection to Watervale Drive is considered appropriate. This will require acquiring land from an undeveloped business.

Ref No. 20150207FR01B Traffic Assessment Report Salisbury Main Roads DPA 21
5 Summary This traffic assessment has reviewed the proposed redevelopment of three locations within the City of Salisbury that Council is wishing to rezone to provide a greater mixture of land uses to match existing uses. The three sites are:
Site 1 – Main North Road at Salisbury Plain between Saints Road and Stanbel Road; Site 2 – Main North Road at Para Hills West between McIntyre Road and Kesters Road; and Site 3 – Salisbury Highway at Greenfields between Ryans Road and Elder Smith Road.
The scope of the assessment has included a review of existing and future traffic operation with and without the proposed changes. This indicates that the existing operations are very close to capacity and that future operations will exceeds capacity, particularly at the signalised intersections.
The future traffic operation around each of the sites with the proposed developments was determined assuming all vacant land and a proportion of the existing uses change to the new use. The traffic generated was then assigned to the road network and the operations determined using SIDRA based on an assumed access arrangement for each site. This indicated that there are various locations where infrastructure is required to maintain future operations. The access infrastructure and intersection upgrades for each site are listed below.
Site 1 – Main North Road at Salisbury Plain
Access Works
Provide a new junction with Main North Road with left in /out as well as right turn entry with appropriate storage lanes;
Extend the service road north to match location of the new access into the area; Provide a new road connection from the service road to Stanbel Road; and Close the existing service road connections at Stanbel Road but retain left turn entry from
Main North Road.
Intersection works
At the Main North Road intersection with Park Terrace / Smith Road provide a second right turn lane from the northern approach to the intersection; and
At the Main North Road intersection with Grove Way / Saints Road provide a fourth northbound through lane to cater for PM peak flows.
Site 2 – Main North Road at Para Hills West.
Access works – No major works required to support the rezoning but may need to monitor junction of service road with Kesters Road to check crash history with additional traffic.
Intersection works
At the Main North Road intersection with McIntyre Road / Kings Road provide a second right turn lane from the southern approach to the intersection.
Site 3 – Salisbury Highway at Greenfields
Access Works
Provide a new junction with Salisbury Highway to the north of Nucera Court with left out and right in access with appropriate storage lanes; and
Provide a connection between Nucera Court and Greenfields Drive and from the northern vacant parcel to Watervale Road.
Intersection works
At the Salisbury Highway intersection with Elder Smith Road provide a third northbound through lane on the southern Salisbury Highway approach to the intersection.

Ref No. 20150207FR01B Traffic Assessment Report Salisbury Main Roads DPA
Appendix A Existing Traffic Data

BRIE
NS
RD
MONTACUTE RD
MULLER RD
MCINTYRE RD
BRIDGE
RD
MONTAGUE RD
HA
MPST
EA
D R
D
MORIALTA RD
PAYNEH
AM R
D
POR
TR
USH
RD
GL
YN
BU
RN
RD
STEPHENTCE
ST B
ER
NA
RD
’S RD
MOULES RD
PAYNEHAM RD
NE
WT
ON
RD
LOW
ER N
ORT
H E
AST
RD
OG
RDASCOT AV
LOWER
PORTRUSHRD
HA
MPST
EA
D R
D
FOST
ER
S RD
FOST
ER
S RD
GRAND JUNCTION RD
GRAND JUNCTION RD
SUDHOLZ RD
SUD
HO
LZ
RD
DA
RLEY RD
GORGE RD
NORTH EAST RD
NORTH EAST RD
NO
RTH
EASTRD
WA
LK
LE
YS R
D
NE
LSO
N R
D
AW
OO
NG
A R
D
LOWER NORTHE AST RD
RE
SER
VO
IR R
D
SMART RD
HA
NC
OC
K R
D
NORTH EAST RD
NORTH EAST RD
GO
LDEN
GRO
VE
RD
GO
LDEN
GROV
ER
D
HA
NC
OC
K R
DH
AN
CO
CK
RD
GRENFELL RD
TH
EG
OLDEN WY
THE GOLDEN
WY
THE GROVE WY
THE GROVE WYPARK TCE
MAIN
NORTH
RD
MAIN
NORTH
RD
SALI
SBURY H
WY
KINGS RD
KINGS RD
BRIDGE
RD
BRIDGE
RD
MC
INT
YR
ER
D
MORIALTAFALLS RD
THE GROVE WY
SA
LIS
BU
R
LOWER N ORTH EASTRD
GORGE RD
MONTACUT E R D
RN
5615
RN
5054
RN5403
RN5403
RN5406
RN5063
RN7200
RN5201
RN5400
RN5201
RN5405
RN7200 RN54
00
RN5409
RN5400
RN54
00
RN5218
RN
5412
RN5409
RN
5404
RN5218
RN
4489
RN5409
RN
5212
RN5218
RN
5206
RN4489
RN5215
RN52
00 RN
5206
RN5204
RN5201
RN
5206
RN52 00
RN5202
RN
5202
RN
5405
RN
5603
RN
5600R
N5600
RN
6012
RN6012
RN4489
RN6012
RN5221
RN
5227
RN6009
RN
6012
RN52
21
RN
6012
RN60000
RN
6015
RN60 006
RN
6033
RN6140
RN6033
RN6033
RN52
21
RN5221
RN4489
RN
5603
RN5606
RN
5609
RN72
00
RN6009
RN6000
RN 5221
RN6000
MARTIN
SR
D
WINZOR ST
WILTSHIRE ST
FEN
DEN
RD
SAINTS RD
CROSS
KEY
SRD
WYNN VALE DR
HIL
LEN
DA
LE DR
LA
DY
WO
OD
RD
RIC
HARDSON D R
AV
AL
OND
R
SUR REY FARM D R
ATLAN
TIS
DR
BICENTENIAL DR
JOHN
RD
T A RGET HILLRD
ONE TREE HILL RD
GRENFELL RD
MILNE RD MILNE RDMILNE RD
LA
DY
WO
OD
RD
MILNE RD
NE
LSO
NR
D
MAXWELL RD
KESTERS RD
KE
LL
Y R
D
RDWRIGHT RD
SOUTH TCE
BVD
SIR ROSS SMITH
WA
ND
AN
AA
V
VA
LIA
NT
RD
TAR
TO
NR
D LYONS RD
VA
LL
EY
RD
MA
RY
VA
LE
RD
STR
AD
BR
OK
E R
D
REID AV
MARIAN RD
AV
EN
UE
RD
LAN
SDO
WN
E TCE
WALKERVIL
LE TCE
MARIAN RD
ARTHUR ST
LYONS RD
WRIGHT
MARTI
NS RD
WHIT
ES R
D
GREEN VALLEY DR
ELYSIU
MD
R
FROST RD
CLAYSON RD
GOLDEN GROVERD
GRENFELL RD
HA
INE
S RD
PER
SEV
ER
AN
CE
RD
HA
LL
S R
D
LOWER ATHELSTONE RD
GEORGE ST
SIL
KE
S R
D
CLAIRVILLE RD
VIC
TOR
RD
WIN
DSO
R G
R
FOURTH AV
FOLLAND AV
MAXWELL RD
WRIGHT RD
SPAINS RD
BR
OW
NT
CE
NE
LS
ON
RD
TO
LL
EY
RD
SE
YM
OU
R A
V
BL
AC
KS R
D
BA
LM
OR
AL
RD
ANN ST
SIXTH
AV
SIXTH
AV
STR
AD
BR
OK
E R
D
FIRST AV
THIRD AV
SHELLEY ST
CH
UR
CH
S T
GLO
UCE STERAV
TORRENS RD
FOR
EST
AV
FOR
EST
AV
TENTH
AV HECTORVIL
LE RD
GA
LW
AY
AV
PITMA
N R
D

TV0670 - 10.03 06/08/2014 09:41Vehicle Turning Movement Survey
Department of Planning, Transport and InfrastructureMICHELMO Page 1 of 1
11 hour totals
AM Peak hour (07:30)
PM Peak hour (16:00)
Cars
CV
Cars
CV
Cars
CV
1 2 3 4Arm
2 (L) 3 4 (R) 3 (L) 4 1 (R) 4 (L) 1 2 (R) 1 (L) 2 3 (R)Exit Arm
3319 11580 411 4982 2387 3350 813 12401 5726 649 2161 1125
360 1676 31 843 191 334 66 1245 533 68 355 178
440 1128 45 473 358 360 97 1724 893 74 197 106
3248 10529 396 4639 2241 3255 642 11412 5344 630 2048 890
71 1051 15 343 146 95 171 989 382 19 113 235
349 1562 27 802 175 329 50 1135 502 68 337 139
11 114 4 41 16 5 16 110 31 0 18 39
434 1091 45 446 346 351 89 1678 873 74 192 98
6 37 0 27 12 9 8 46 20 0 5 8
Total
Total
Total
One-way Flows
11 Hour Totals
AM Peak Hour
PM Peak Hour
1 2 3 4
(IN) 15310 (OUT) 16400 (IN) 10719 (OUT) 11206 (IN) 18940 (OUT) 17687 (IN) 3935 (OUT) 3611
07:00 2158 07:45 1685 07:45 1415 08:00 1382 07:45 1899 07:00 2893 07:45 617 08:15 313
15:45 1624 16:15 2179 16:30 1272 16:00 1530 16:00 2714 16:15 1728 17:30 382 17:15 535
Two-way Flows
AM Peak Hour
PM Peak Hour
07:15 3756 07:45 2772 07:15 4663 07:45 919
16:00 3771 16:00 2721 16:00 4421 17:15 901
All Vehicles
11 Hour Totals
Estimated AADT
31710 7.1% CV 21925 5.2% CV 36627 8.7% CV 7546 9.3% CV
40600 SF( 1.00) ZF( 1.28) 28100 SF( 1.00) ZF( 1.28) 46900 SF( 1.00) ZF( 1.28) 9700 SF( 1.00) ZF( 1.28)
1
2
3
4
Arm
5406 - SALISBURY HIGHWAY
5402 - ELDER SMITH ROAD
5406 - SALISBURY HIGHWAY
ELDER SMITH ROAD
Road Number - Name
TG809462
MAWSON LAKES
31/07/2014Dry SIGNALS
AMG Reference:
Locality:
Date of Count:Weather: Control:
Day: Thursday
Intersection of: SALISBURY HIGHWAY / ELDER SMITH ROAD
AADT - Annual Average Daily Traffic SF - Seasonal Factor ZF - Zone Factor CV - Commercial Vehicl
Survey Status:

TV0670 - v10.04 02/12/2009 15:40Vehicle Turning Movement Survey
Department for Transport, Energy and InfrastructureMICHELMO Page 1 of 1
11 hour totals
AM Peak hour (07:15)
PM Peak hour (16:15)
Cars
CV
Cars
CV
Cars
CV
1 2 3Arm
2 3 (R) 3 (L) 1 1 (L) 2 (R)Exit Arm
16021 372 898 15727 405 424
2314 46 43 1468 25 58
1570 31 175 2185 39 25
14444 344 862 14249 381 417
1577 28 36 1478 24 7
2148 39 39 1313 24 57
166 7 4 155 1 1
1505 31 172 2093 39 25
65 0 3 92 0 0
Total
Total
Total
One-way Flows
11 Hour Totals
AM Peak Hour
PM Peak Hour
1 2 3
(IN) 16393 (OUT) 16132 (IN) 16625 (OUT) 16445 (IN) 829 (OUT) 1270
07:00 2451 07:45 1656 07:45 1675 07:00 2467 07:30 85 07:45 92
16:30 1652 16:15 2224 15:45 2418 16:30 1659 17:15 120 15:45 269
Two-way Flows
AM Peak Hour
PM Peak Hour
07:15 3853 07:15 3883 07:30 176
16:15 3825 16:15 3955 15:45 332
All Vehicles
11 Hour Totals
Estimated AADT
32525 9.6% CV 33070 9.4% CV 2099 4.5% CV
40300 SF( 1.00) ZF( 1.24) 41000 SF( 1.00) ZF( 1.24) 2600 SF( 1.00) ZF( 1.24)
1
2
3
Arm
5406 - SALISBURY HIGHWAY
5406 - SALISBURY HIGHWAY
Ryans Road
Road Number - Name
TG813468
Parafield Gardens
25/11/2009Dry
AMG Reference:
Locality:
Date of Count:Weather: Control:
Day: Wednesday
Intersection of: Salisbury Highway / Ryans Road
AADT - Annual Average Daily Traffic SF - Seasonal Factor ZF - Zone Factor CV - Commercial Vehicles
Survey Status:

TV0670 - 10.03 06/08/2014 09:49Vehicle Turning Movement Survey
Department of Planning, Transport and InfrastructureMICHELMO Page 1 of 1
11 hour totals
AM Peak hour (07:45)
PM Peak hour (16:45)
Cars
CV
Cars
CV
Cars
CV
1 2 3 4Arm
2 (L) 3 4 (R) 3 (L) 4 1 (R) 4 (L) 1 2 (R) 1 (L) 2 3 (R)Exit Arm
926 15702 4486 966 2827 1811 1024 15640 654 4418 2216 1706
67 2160 686 179 447 306 60 1228 37 391 211 240
78 1448 372 66 315 187 147 2096 103 793 302 180
868 14981 4269 889 2663 1725 884 14819 585 4197 2071 1571
58 721 217 77 164 86 140 821 69 221 145 135
62 2071 668 165 425 297 40 1140 31 381 202 217
5 89 18 14 22 9 20 88 6 10 9 23
74 1424 367 63 307 178 144 2060 101 782 295 174
4 24 5 3 8 9 3 36 2 11 7 6
Total
Total
Total
One-way Flows
11 Hour Totals
AM Peak Hour
PM Peak Hour
1 2 3 4
(IN) 21114 (OUT) 21869 (IN) 5604 (OUT) 3796 (IN) 17318 (OUT) 18374 (IN) 8340 (OUT) 8337
07:15 3055 07:45 1925 07:45 932 08:15 320 11:30 1437 07:15 2636 08:00 850 07:30 1224
14:45 1921 16:30 3108 15:30 616 15:15 487 16:30 2395 15:30 1707 16:45 1275 16:15 859
Two-way Flows
AM Peak Hour
PM Peak Hour
07:30 4895 07:45 1247 07:30 3914 07:45 2035
16:45 4974 15:30 1084 16:15 4057 16:45 2109
All Vehicles
11 Hour Totals
Estimated AADT
42983 4.9% CV 9400 6.4% CV 35692 5.5% CV 16677 6.1% CV
56300 SF( 1.00) ZF( 1.31) 12300 SF( 1.00) ZF( 1.31) 46800 SF( 1.00) ZF( 1.31) 21800 SF( 1.00) ZF( 1.31)
1
2
3
4
Arm
7200 - MAIN NORTH ROAD
54123 - MAXWELL ROAD
7200 - MAIN NORTH ROAD
5402 - ELDER SMITH ROAD
Road Number - Name
TG832454
PARA HILLS WEST
30/07/2014Dry SIGNALS
AMG Reference:
Locality:
Date of Count:Weather: Control:
Day: Wednesday
Intersection of: MAIN NORTH ROAD / ELDER SMITH ROAD / MAXWELL ROAD
AADT - Annual Average Daily Traffic SF - Seasonal Factor ZF - Zone Factor CV - Commercial Vehicl
Survey Status:

TV0670 - 10.03 20/02/2013 10:42Vehicle Turning Movement Survey
Department of Planning, Transport and InfrastructureMICHELMO Page 1 of 1
11 hour totals
AM Peak hour (07:45)
PM Peak hour (16:00)
Cars
CV
Cars
CV
Cars
CV
1 2 3Arm
2 (L) 3 3 (L) 1 (R) 1 2 (R)Exit Arm
1055 18505 1974 0 20881 2296
94 2371 251 0 1677 140
137 1712 190 0 3095 469
1018 17709 1809 0 19893 2126
37 796 165 0 988 170
91 2299 229 0 1575 127
3 72 22 0 102 13
131 1651 176 0 3024 448
6 61 14 0 71 21
Total
Total
Total
One-way Flows
11 Hour Totals
AM Peak Hour
PM Peak Hour
1 2 3
(IN) 19560 (OUT) 20881 (IN) 1974 (OUT) 3351 (IN) 23177 (OUT) 20479
07:00 2697 07:45 1677 07:15 256 08:15 242 07:45 1817 07:00 2864
16:45 1908 16:00 3095 16:15 204 16:00 606 16:00 3564 16:45 1942
Two-way Flows
AM Peak Hour
PM Peak Hour
07:15 4157 07:45 485 07:45 4439
16:00 4944 16:00 796 16:00 5466
All Vehicles
11 Hour Totals
Estimated AADT
40441 4.5% CV 5325 7.0% CV 43656 4.9% CV
52200 SF( 1.00) ZF( 1.29) 6900 SF( 1.00) ZF( 1.29) 56300 SF( 1.00) ZF( 1.29)
1
2
3
Arm
7200 - MAIN NORTH ROAD
KESTERS ROAD
7200 - MAIN NORTH ROAD
Road Number - Name
TG839463
PARA HILLS WEST
14/02/2013Dry
AMG Reference:
Locality:
Date of Count:Weather: Control:
Day: Thursday
Intersection of: MAIN NORTH ROAD / KESTERS ROAD
AADT - Annual Average Daily Traffic SF - Seasonal Factor ZF - Zone Factor CV - Commercial Vehicl
Survey Status:

TV0670 - v10.04 30/05/2011 14:52Vehicle Turning Movement Survey
Department for Transport, Energy and InfrastructureMICHELMO Page 1 of 1
11 hour totals
AM Peak hour (07:45)
PM Peak hour (16:30)
Cars
CV
Cars
CV
Cars
CV
1 2 3 4Arm
2 (L) 3 4 (R) 3 (L) 4 1 (R) 4 (L) 1 2 (R) 1 (L) 2 3 (R)Exit Arm
2714 13659 1252 2368 6626 3825 2419 12746 2239 1298 6239 3834
246 1779 119 486 844 561 214 1228 160 104 655 366
402 1385 115 170 695 408 261 1814 438 161 810 438
2638 13120 1202 2252 6384 3704 2272 12139 2133 1229 6024 3637
76 539 50 116 242 121 147 607 106 69 215 197
237 1731 116 475 825 550 205 1167 142 94 631 351
9 48 3 11 19 11 9 61 18 10 24 15
397 1359 109 167 676 400 250 1782 434 159 806 432
5 26 6 3 19 8 11 32 4 2 4 6
Total
Total
Total
One-way Flows
11 Hour Totals
AM Peak Hour
PM Peak Hour
1 2 3 4
(IN) 17625 (OUT) 17869 (IN) 12819 (OUT) 11192 (IN) 17404 (OUT) 19861 (IN) 11371 (OUT) 10297
07:00 2369 07:45 1893 07:45 1891 08:00 1110 07:45 1602 07:30 2792 08:00 1187 07:45 1177
16:30 1902 16:30 2383 16:45 1334 16:45 1658 16:00 2529 16:30 1993 15:30 1482 15:45 1165
Two-way Flows
AM Peak Hour
PM Peak Hour
07:30 4159 08:00 2981 07:30 4378 08:00 2343
16:30 4285 16:45 2992 16:30 4506 15:30 2624
All Vehicles
11 Hour Totals
Estimated AADT
35494 4.1% CV 24011 3.6% CV 37265 4.6% CV 21668 4.2% CV
45100 SF( 1.00) ZF( 1.27) 30500 SF( 1.00) ZF( 1.27) 47300 SF( 1.00) ZF( 1.27) 27500 SF( 1.00) ZF( 1.27)
1
2
3
4
Arm
7200 - MAIN NORTH ROAD
5405 - MCINTYRE ROAD
7200 - MAIN NORTH ROAD
5403 - KINGS ROAD
Road Number - Name
TG846473
PARAFIELD
25/05/2011Dry SIGNALS
AMG Reference:
Locality:
Date of Count:Weather: Control:
Day: Wednesday
Intersection of: MAIN NORTH RD / KINGS RD / McINTYRE RD
AADT - Annual Average Daily Traffic SF - Seasonal Factor ZF - Zone Factor CV - Commercial Vehicles
Survey Status:

TV0670 - v10.05 29/02/2012 15:56Vehicle Turning Movement Survey
Department of Planning, Transport and InfrastructureMICHELMO Page 1 of 1
11 hour totals
AM Peak hour (08:00)
PM Peak hour (16:45)
Cars
CV
Cars
CV
Cars
CV
1 2 3 4Arm
2 (L) 3 4 (R) 3 (L) 4 1 (R) 4 (L) 1 2 (R) 1 (L) 2 3 (R)Exit Arm
972 16138 1153 481 2449 1280 2184 14960 736 928 2616 2387
127 1930 149 57 386 159 399 1458 92 53 254 162
142 1633 85 31 176 118 120 1987 98 84 313 316
950 15426 1107 471 2323 1229 2111 14237 719 888 2498 2298
22 712 46 10 126 51 73 723 17 40 118 89
126 1881 145 55 376 157 390 1368 89 47 242 148
1 49 4 2 10 2 9 90 3 6 12 14
142 1597 85 31 165 117 118 1947 97 84 304 311
0 36 0 0 11 1 2 40 1 0 9 5
Total
Total
Total
One-way Flows
11 Hour Totals
AM Peak Hour
PM Peak Hour
1 2 3 4
(IN) 18263 (OUT) 17168 (IN) 4210 (OUT) 4324 (IN) 17880 (OUT) 19006 (IN) 5931 (OUT) 5786
07:00 2513 07:45 1684 08:15 659 07:45 501 08:00 1949 07:00 2553 10:30 547 08:15 1005
16:45 1860 15:45 2219 15:15 481 14:45 673 15:45 2254 16:30 2003 15:00 830 14:45 614
Two-way Flows
AM Peak Hour
PM Peak Hour
07:30 4012 08:00 1075 07:30 4178 08:15 1477
16:45 4049 14:45 1138 16:45 4185 15:00 1420
All Vehicles
11 Hour Totals
Estimated AADT
35431 4.5% CV 8534 4.0% CV 36886 4.4% CV 11717 4.2% CV
45700 SF( 1.00) ZF( 1.29) 11000 SF( 1.00) ZF( 1.29) 47600 SF( 1.00) ZF( 1.29) 15100 SF( 1.00) ZF( 1.29)
1
2
3
4
Arm
7200 - MAIN NORTH ROAD
5063 - SMITH ROAD
7200 - MAIN NORTH ROAD
5063 - PARK TERRACE
Road Number - Name
TG859493
SALISBURY EAST
22/02/2012Dry SIGNALS
AMG Reference:
Locality:
Date of Count:Weather: Control:
Day: Wednesday
Intersection of: MAIN NORTH ROAD / PARK TERRACE / SMITH ROAD
AADT - Annual Average Daily Traffic SF - Seasonal Factor ZF - Zone Factor CV - Commercial Vehicles
Northern Expressway opened 13/09/2010Survey Status:
TV0670 - 10.03 09/04/2015 13:33Vehicle Turning Movement Survey
Department of Planning, Transport and InfrastructureMICHELMO Page 1 of 1
11 hour totals
AM Peak hour (07:45)
PM Peak hour (16:30)
Cars
CV
Cars
CV
Cars
CV
1 2 3 4Arm
2 (L) 3 4 (R) 3 (L) 4 1 (R) 4 (L) 1 2 (R) 1 (L) 2 3 (R)Exit Arm
7224 15529 1403 2138 2321 8736 781 14002 2571 1465 2697 740
803 1937 232 395 437 1482 68 1518 138 79 190 114
1103 1456 126 135 168 932 80 1835 511 249 558 58
6967 14961 1345 2073 2252 8472 736 13376 2472 1402 2617 710
257 568 58 65 69 264 45 626 99 63 80 30
773 1887 228 389 428 1449 63 1452 129 71 180 114
30 50 4 6 9 33 5 66 9 8 10 0
1083 1426 121 134 164 922 78 1802 503 245 547 58
20 30 5 1 4 10 2 33 8 4 11 0
Total
Total
Total
One-way Flows
11 Hour Totals
AM Peak Hour
PM Peak Hour
1 2 3 4
(IN) 24156 (OUT) 24203 (IN) 13195 (OUT) 12492 (IN) 17354 (OUT) 18407 (IN) 4902 (OUT) 4505
07:30 3031 07:45 3079 08:00 2326 07:45 1131 07:45 1724 07:00 2565 08:00 405 08:00 786
16:45 2698 16:15 3060 16:00 1305 17:00 2196 16:15 2450 15:00 1734 16:30 865 15:30 444
Two-way Flows
AM Peak Hour
PM Peak Hour
07:45 6051 08:00 3456 07:45 4170 08:00 1191
16:30 5701 16:30 3407 16:15 4081 16:30 1239
All Vehicles
11 Hour Totals
Estimated AADT
48359 3.8% CV 25687 3.2% CV 35761 4.0% CV 9407 3.7% CV
61400 SF( 1.00) ZF( 1.27) 32600 SF( 1.00) ZF( 1.27) 45400 SF( 1.00) ZF( 1.27) 11900 SF( 1.00) ZF( 1.27)
1
2
3
4
Arm
7200 - MAIN NORTH ROAD
5201 - THE GROVE WAY
7200 - MAIN NORTH ROAD
50630 - SAINTS ROAD
Road Number - Name
TG866502
SALISBURY HEIGHTS
17/10/2012Dry SIGNALS
AMG Reference:
Locality:
Date of Count:Weather: Control:
Day: Wednesday
Intersection of: MAIN NORTH RD / THE GROVE WAY / SAINTS RD
AADT - Annual Average Daily Traffic SF - Seasonal Factor ZF - Zone Factor CV - Commercial Vehicl
Survey Status:

Ref No. 20150207FR01B Traffic Assessment Report Salisbury Main Roads DPA
Appendix B DPTI Future Traffic Data

TS252 - Main North Road / The Grove Way / Saints Road
Estimated De-Seasonalised Turning Movement Count - Existing Network Demand
2006
AADT TotalTrucksBuses
Departing Entering Departing Entering Departing Entering Departing EnteringDaily Total 32,200 29,900 15,600 19,700 21,700 21,200 8,900 7,600
Trucks 1,240 1,040 390 530 860 950 270 240Buses 220 250 100 110 150 120 60 50
a m Total 3,470 3,000 1,010 3,200 2,440 1,610 1,340 450Trucks 75 65 20 25 55 60 10 10Buses 15 15 5 10 10 10 5 0
p m Total 2,770 2,560 2,030 1,110 1,630 2,210 450 1,000Trucks 45 35 25 10 20 40 5 10Buses 15 15 10 5 10 10 0 5
L T R L T R L T R L T RDaily Total 8,600 18,500 2,800 2,400 5,200 12,100 900 17,700 2,600 2,400 4,400 800
Trucks 240 720 80 90 120 320 70 800 80 120 70 50Buses 80 150 20 0 30 80 10 110 0 30 20 0
a m Total 700 1,990 310 340 980 1,880 50 1,450 110 140 200 110Trucks 10 50 5 5 5 15 0 55 5 5 5 0Buses 5 10 0 0 5 5 0 10 0 0 0 0
p m Total 940 1,470 150 90 220 800 80 1,720 410 250 680 70Trucks 15 20 0 0 5 5 0 35 5 5 5 0Buses 5 10 0 0 0 5 0 10 0 0 5 0
2011
AADT TotalTrucksBuses
Departing Entering Departing Entering Departing Entering Departing EnteringDaily Total 31,200 29,000 15,600 16,500 21,800 22,700 5,700 6,100
Trucks 1,120 950 440 450 740 880 230 250Buses 220 250 100 110 150 120 60 50
a m Total 3,140 2,930 1,120 2,280 2,410 1,810 730 380Trucks 60 55 20 20 45 50 10 10Buses 15 15 5 10 10 10 5 0
p m Total 3,080 2,640 2,140 1,220 1,620 2,490 370 860Trucks 40 35 25 10 20 35 5 10Buses 15 15 10 5 10 10 0 5
L T R L T R L T R L T RDaily Total 9,000 18,200 1,800 2,700 2,900 10,900 1,000 18,500 3,200 1,800 3,400 900
Trucks 270 600 80 90 70 290 80 710 90 120 80 50Buses 80 150 20 0 30 80 10 110 0 30 20 0
a m Total 790 1,910 230 390 430 1,460 70 1,600 140 80 190 110Trucks 10 40 5 5 5 10 0 45 5 5 5 0Buses 5 10 0 0 5 5 0 10 0 0 0 0
p m Total 1,090 1,430 120 130 170 920 80 1,910 500 250 550 60Trucks 15 20 0 0 5 5 0 30 5 5 5 0Buses 5 10 0 0 0 5 0 10 0 0 5 0
Adjusted Projected Turning Movements - MASTEM ITLUP Foundation Network - Scenario G
2036
AADT TotalTrucksBuses
Departing Entering Departing Entering Departing Entering Departing EnteringDaily Total 38,200 37,900 16,800 16,500 29,800 30,600 7,400 7,200
Trucks 2,410 2,430 1,030 960 1,880 1,900 310 340Buses 240 240 160 130 80 80 130 160
a m Total 3,710 3,800 1,220 2,240 3,180 2,550 960 480Trucks 200 200 75 75 155 155 10 10Buses 15 15 10 10 5 5 10 10
p m Total 3,810 3,490 2,290 1,250 2,330 3,230 510 970Trucks 170 170 75 60 125 135 5 10Buses 20 15 10 15 5 5 10 10
L T R L T R L T R L T RDaily Total 10,300 25,100 2,500 3,400 3,400 9,700 1,500 25,800 3,300 2,700 3,200 1,300
Trucks 720 1,590 120 220 70 670 120 1,580 200 160 110 70Buses 80 80 80 0 50 80 0 80 0 80 80 0
a m Total 870 2,560 370 460 490 1,290 100 2,290 160 130 190 160Trucks 55 140 5 15 5 55 0 140 15 5 5 0Buses 5 5 5 0 5 5 0 5 0 5 5 0
p m Total 1,280 2,040 170 200 220 830 120 2,610 500 370 510 90Trucks 55 115 0 10 5 45 0 120 15 5 5 0Buses 5 5 5 0 5 10 0 5 0 5 5 0
Turning Movement
480 290 160 290
One Way Flows
76,100 33,300 60,400 14,6004,840 1,990 3,780 650
Approach Main North Road [NE] The Grove Way [SE] Main North Road [SW] Saints Road [NW]
Turning Movement
470 210 270 110
One Way Flows
60,200 32,100 44,500 11,8002,070 890 1,620 480
One Way Flows
Turning Movement
Approach Main North Road [NE] The Grove Way [SE] Main North Road [SW] Saints Road [NW]
2,280 920 1,810 510470 210 270 110
Approach Main North Road [NE] The Grove Way [SE] Main North Road [SW] Saints Road [NW]62,100 35,300 42,900 16,500

TG?????? - Main North Road / Stanbell Road
Estimated De-Seasonalised Turning Movement Count - Existing Network Demand
2006
AADT TotalTrucksBuses
Departing Entering Departing Entering Departing Entering Departing EnteringDaily Total 20,600 22,600 21,500 20,400 2,300 1,400
Trucks 950 860 820 920 70 60Buses 120 150 150 120 0 0
a m Total 1,570 2,580 2,410 1,600 320 120Trucks 60 55 50 55 5 5Buses 10 10 10 10 0 0
p m Total 2,130 1,670 1,620 2,060 140 160Trucks 40 20 15 35 5 5Buses 10 10 10 10 0 0
T R L T L RDaily Total 21,200 1,400 900 19,500 1,100 300
Trucks 810 50 20 900 50 10Buses 150 0 0 120 0 0
a m Total 2,370 210 110 1,490 80 40Trucks 50 5 0 55 5 0Buses 10 0 0 10 0 0
p m Total 1,600 70 70 1,990 140 20Trucks 15 5 0 35 5 0Buses 10 0 0 10 0 0
2011
AADT TotalTrucksBuses
Departing Entering Departing Entering Departing Entering Departing EnteringDaily Total 22,100 22,700 21,600 21,900 2,300 1,400
Trucks 880 740 700 850 70 60Buses 120 150 150 120 0 0
a m Total 1,770 2,550 2,380 1,800 320 120Trucks 50 45 40 45 5 5Buses 10 10 10 10 0 0
p m Total 2,410 1,660 1,610 2,340 140 160Trucks 35 20 15 30 5 5Buses 10 10 10 10 0 0
T R L T L RDaily Total 21,300 1,400 900 21,000 1,100 300
Trucks 690 50 20 830 50 10Buses 150 0 0 120 0 0
a m Total 2,340 210 110 1,690 80 40Trucks 40 5 0 45 5 0Buses 10 0 0 10 0 0
p m Total 1,590 70 70 2,270 140 20Trucks 15 5 0 30 5 0Buses 10 0 0 10 0 0
Adjusted Projected Turning Movements - MASTEM ITLUP Foundation Network - Scenario G
2036
AADT TotalTrucksBuses
Departing Entering Departing Entering Departing Entering Departing EnteringDaily Total 30,000 30,700 29,300 29,200 2,700 2,100
Trucks 1,900 1,880 1,920 1,950 190 180Buses 80 80 80 80 0 0
a m Total 2,510 3,320 3,140 2,490 340 180Trucks 155 155 160 160 15 15Buses 5 5 5 5 0 0
p m Total 3,150 2,370 2,280 3,010 180 230Trucks 135 125 130 140 15 15Buses 5 5 5 5 0 0
T R L T L RDaily Total 28,800 1,900 800 28,400 1,600 500
Trucks 1,810 70 120 1,830 70 110Buses 80 0 0 80 0 0
a m Total 3,070 250 90 2,400 110 70Trucks 150 5 10 150 5 10Buses 5 0 0 5 0 0
p m Total 2,250 120 60 2,950 200 30Trucks 120 5 10 130 5 10Buses 5 0 0 5 0 0
Turning Movement
160 160 0
One Way Flows
60,700 58,500 4,8003,780 3,870 370
Approach Main North Road (N) Main North Road (S) Stanbel Road
Turning Movement
270 270 0
One Way Flows
44,800 43,500 3,7001,620 1,550 130
One Way Flows
Turning Movement
Approach Main North Road (N) Main North Road (S) Stanbel Road
1,810 1,740 130270 270 0
Approach Main North Road (N) Main North Road (S) Stanbel Road43,200 41,900 3,700
TS238 - Main North Road / Smith Road / Park Terrace
Estimated De-Seasonalised Turning Movement Count - Existing Network Demand
2006
AADT TotalTrucksBuses
Departing Entering Departing Entering Departing Entering Departing EnteringDaily Total 20,400 21,500 6,100 5,900 22,600 20,900 7,500 8,300
Trucks 920 820 90 130 860 910 170 180Buses 120 150 110 100 130 130 120 100
a m Total 1,600 2,410 550 780 2,340 1,650 850 500Trucks 55 50 5 10 55 55 15 15Buses 10 10 5 5 10 10 5 5
p m Total 2,060 1,620 700 360 1,820 2,140 470 930Trucks 35 15 5 0 15 40 0 0Buses 10 10 5 5 10 10 5 5
L T R L T R L T R L T RDaily Total 1,500 18,900 1,100 600 3,600 1,700 2,800 17,400 700 1,300 3,900 3,100
Trucks 20 770 30 10 80 40 60 840 10 40 60 80Buses 10 130 10 0 100 0 10 120 0 0 100 0
a m Total 180 2,130 100 80 440 260 310 1,280 60 60 310 130Trucks 0 45 5 0 5 5 5 50 0 0 5 10Buses 0 10 0 0 5 0 0 10 0 0 5 0
p m Total 140 1,420 60 40 200 120 210 1,840 90 100 470 360Trucks 0 15 0 0 0 0 0 35 5 0 0 0Buses 0 10 0 0 5 0 0 10 0 0 5 0
2011
AADT TotalTrucksBuses
Departing Entering Departing Entering Departing Entering Departing EnteringDaily Total 21,900 21,600 5,700 5,500 22,500 22,800 7,500 7,700
Trucks 850 700 90 120 780 830 160 230Buses 120 150 100 100 150 130 110 100
a m Total 1,800 2,380 470 600 2,290 1,990 840 430Trucks 45 40 5 10 50 50 20 20Buses 10 10 5 5 10 10 5 5
p m Total 2,340 1,610 550 320 1,780 2,450 460 750Trucks 30 15 5 0 15 35 0 0Buses 10 10 5 5 10 10 5 5
L T R L T R L T R L T RDaily Total 1,300 18,800 1,500 600 3,200 1,700 2,800 19,000 1,000 1,200 3,400 3,100
Trucks 20 650 30 10 70 40 60 760 10 50 60 120Buses 10 130 10 10 90 0 10 120 0 0 90 10
a m Total 130 2,100 150 60 380 160 310 1,590 90 50 250 130Trucks 0 35 5 0 5 5 10 40 0 0 5 15Buses 0 10 0 0 5 0 0 10 0 0 5 0
p m Total 140 1,390 80 30 170 120 210 2,140 100 80 310 360Trucks 0 15 0 0 0 0 0 30 5 0 0 0Buses 0 10 0 0 5 0 0 10 0 0 5 0
Adjusted Projected Turning Movements - MASTEM ITLUP Foundation Network - Scenario G
2036
AADT TotalTrucksBuses
Departing Entering Departing Entering Departing Entering Departing EnteringDaily Total 29,200 29,300 6,800 9,600 30,800 27,600 10,200 10,500
Trucks 1,950 1,920 190 450 2,270 2,030 620 630Buses 80 80 70 90 70 80 100 70
a m Total 2,490 3,140 580 880 3,160 2,540 990 660Trucks 160 160 15 30 205 185 55 60Buses 5 5 5 5 5 5 5 5
p m Total 3,010 2,280 630 690 2,420 2,960 750 880Trucks 140 130 15 25 160 165 45 40Buses 5 5 5 5 5 5 5 5
L T R L T R L T R L T RDaily Total 1,300 25,000 3,000 2,900 4,200 2,500 3,000 23,600 1,000 3,100 4,500 2,900
Trucks 30 1,780 110 160 220 70 290 1,700 40 180 120 330Buses 0 70 10 0 90 0 0 80 0 0 70 0
a m Total 130 2,790 220 230 460 190 310 2,150 80 150 370 140Trucks 0 155 5 10 15 5 35 145 5 10 10 40Buses 0 5 0 0 5 0 0 5 0 0 5 0
p m Total 150 1,890 240 210 260 220 250 2,600 110 190 370 320Trucks 0 125 5 10 15 0 25 130 10 10 5 25Buses 0 5 0 0 5 0 0 5 0 0 5 0
Turning Movement
160 160 150 170
One Way Flows
58,500 16,400 58,400 20,7003,870 640 4,300 1,250
Approach Main North Road [NE] Smith Road [SE] Main North Road [SW] Park Terrace [NW]
Turning Movement
270 200 280 210
One Way Flows
43,500 11,200 45,300 15,2001,550 210 1,610 390
One Way Flows
Turning Movement
Approach Main North Road [NE] Smith Road [SE] Main North Road [SW] Park Terrace [NW]
1,740 220 1,770 350270 210 260 220
Approach Main North Road [NE] Smith Road [SE] Main North Road [SW] Park Terrace [NW]41,900 12,000 43,500 15,800

TS271 - Main North Road / Frost Road / Clayson Road
Estimated De-Seasonalised Turning Movement Count - Existing Network Demand
2006
AADT TotalTrucksBuses
Departing Entering Departing Entering Departing Entering Departing EnteringDaily Total 20,900 22,600 4,000 4,200 22,700 20,600 3,900 4,100
Trucks 910 860 50 70 840 920 140 90Buses 130 130 30 30 130 130 30 30
a m Total 1,650 2,340 130 490 2,430 1,520 350 210Trucks 55 55 0 5 55 55 10 5Buses 10 10 5 5 10 10 5 5
p m Total 2,140 1,820 610 290 1,900 2,140 290 690Trucks 40 15 0 0 15 40 5 5Buses 10 10 5 5 10 10 5 5
L T R L T R L T R L T RDaily Total 1,300 20,500 800 800 1,900 1,500 1,200 18,700 700 700 2,000 1,400
Trucks 20 780 60 20 30 20 50 860 10 30 20 40Buses 0 130 0 0 30 0 0 130 0 0 30 0
a m Total 40 2,210 90 120 190 180 70 1,440 10 30 80 100Trucks 0 50 5 0 0 5 5 50 0 0 0 5Buses 0 10 0 0 5 0 0 10 0 0 5 0
p m Total 140 1,650 30 50 140 100 120 1,910 110 130 360 200Trucks 0 10 5 0 0 0 0 40 0 0 0 5Buses 0 10 0 0 5 0 0 10 0 0 5 0
2011
AADT TotalTrucksBuses
Departing Entering Departing Entering Departing Entering Departing EnteringDaily Total 22,800 22,500 4,300 4,200 23,000 22,900 3,800 4,300
Trucks 830 780 60 70 750 850 160 100Buses 130 150 40 40 140 140 60 40
a m Total 1,990 2,290 230 460 2,370 1,880 350 310Trucks 50 50 0 5 50 50 10 5Buses 10 10 5 5 10 10 5 5
p m Total 2,450 1,780 510 290 1,880 2,560 340 550Trucks 35 15 0 0 15 35 5 5Buses 10 10 5 5 10 10 5 5
L T R L T R L T R L T RDaily Total 1,400 20,300 800 1,100 1,600 1,500 1,400 20,600 900 700 2,000 1,600
Trucks 20 680 80 20 30 20 50 780 20 30 20 50Buses 0 140 10 0 40 0 10 130 0 0 40 0
a m Total 80 2,110 100 120 160 180 90 1,760 30 50 120 140Trucks 0 45 5 0 0 5 5 45 0 0 0 5Buses 0 10 0 0 5 0 0 10 0 0 5 0
p m Total 140 1,590 50 70 130 90 160 2,270 130 90 240 220Trucks 0 10 5 0 0 0 0 35 0 0 0 5Buses 0 10 0 0 5 0 0 10 0 0 5 0
Adjusted Projected Turning Movements - MASTEM ITLUP Foundation Network - Scenario G
2036
AADT TotalTrucksBuses
Departing Entering Departing Entering Departing Entering Departing EnteringDaily Total 27,600 30,800 5,300 4,900 30,100 27,000 5,100 5,400
Trucks 2,030 2,270 90 100 2,290 2,130 300 210Buses 80 70 40 40 60 80 50 40
a m Total 2,540 3,160 310 480 3,110 2,380 450 390Trucks 185 205 0 5 210 190 15 10Buses 5 5 5 5 5 5 5 5
p m Total 2,960 2,420 600 400 2,450 2,980 470 680Trucks 165 160 0 0 165 175 15 10Buses 5 5 5 5 5 5 5 5
L T R L T R L T R L T RDaily Total 2,000 27,600 1,200 800 2,100 2,000 1,800 24,600 600 1,000 2,700 1,700
Trucks 30 2,120 120 30 40 30 140 1,960 30 40 30 140Buses 0 60 10 0 40 0 0 80 0 0 40 0
a m Total 120 2,890 150 60 220 200 80 2,270 30 70 160 160Trucks 0 200 5 0 0 5 10 180 0 0 0 10Buses 0 5 0 0 5 0 0 5 0 0 5 0
p m Total 200 2,150 70 80 160 160 240 2,670 70 130 330 220Trucks 0 155 5 0 0 0 10 165 0 0 0 10Buses 0 5 0 0 5 0 0 5 0 0 5 0
Turning Movement
150 80 140 90
One Way Flows
58,400 10,200 57,100 10,5004,300 190 4,420 510
Approach Main North Road [NE] Clayson Road [SE] Main North Road [SW] Frost Road [NW]
Turning Movement
280 80 280 100
One Way Flows
45,300 8,500 45,900 8,1001,610 130 1,600 260
One Way Flows
Turning Movement
Approach Main North Road [NE] Clayson Road [SE] Main North Road [SW] Frost Road [NW]
1,770 120 1,760 230260 60 260 60
Approach Main North Road [NE] Clayson Road [SE] Main North Road [SW] Frost Road [NW]43,500 8,200 43,300 8,000

TS272 - Main North Road / McIntyre Road / Kings Road
Estimated De-Seasonalised Turning Movement Count - Existing Network Demand
2006
AADT TotalTrucksBuses
Departing Entering Departing Entering Departing Entering Departing EnteringDaily Total 20,600 22,700 12,900 16,500 24,700 20,000 15,400 14,400
Trucks 920 840 520 690 1,080 890 650 750Buses 130 130 30 30 130 150 40 20
a m Total 1,520 2,430 850 1,770 2,740 1,410 1,510 1,010Trucks 55 55 40 60 80 65 55 50Buses 10 10 0 0 10 10 0 0
p m Total 2,140 1,900 1,450 1,440 1,950 2,180 1,370 1,390Trucks 40 15 15 25 20 45 30 20Buses 10 10 0 0 10 10 0 0
L T R L T R L T R L T RDaily Total 2,800 18,200 1,700 1,800 10,600 4,100 3,100 14,600 2,300 1,900 7,800 4,700
Trucks 80 680 80 120 390 180 180 600 110 140 330 280Buses 10 120 0 0 30 0 10 130 10 0 10 10
a m Total 160 2,140 130 270 1,160 340 220 1,080 110 100 580 330Trucks 5 50 0 10 40 10 15 40 10 5 25 20Buses 0 10 0 0 0 0 0 10 0 0 0 0
p m Total 290 1,490 120 70 990 380 260 1,530 390 230 770 390Trucks 0 10 5 5 15 5 10 30 5 5 10 5Buses 0 10 0 0 0 0 0 10 0 0 0 0
2011
AADT TotalTrucksBuses
Departing Entering Departing Entering Departing Entering Departing EnteringDaily Total 22,900 23,000 14,700 16,500 25,600 22,300 13,200 14,600
Trucks 850 750 440 610 990 820 570 670Buses 140 140 60 50 150 150 30 40
a m Total 1,880 2,370 1,070 1,780 2,860 1,700 1,170 1,130Trucks 50 50 35 50 75 60 45 45Buses 10 10 5 0 10 10 0 5
p m Total 2,560 1,880 1,650 1,360 1,970 2,610 1,080 1,410Trucks 35 15 10 20 20 40 25 15Buses 10 10 0 5 10 10 5 0
L T R L T R L T R L T RDaily Total 3,800 17,600 1,600 3,100 8,500 4,900 3,100 16,300 2,900 1,700 8,000 4,900
Trucks 80 590 80 120 310 180 180 530 110 140 250 280Buses 10 130 0 10 30 10 0 130 20 0 30 10
a m Total 250 2,000 120 490 840 450 210 1,330 160 100 660 370Trucks 5 45 0 10 30 10 15 35 10 5 20 20Buses 0 10 0 0 0 0 0 10 0 0 5 0
p m Total 400 1,360 120 170 700 490 260 1,910 440 160 810 440Trucks 0 10 5 5 10 5 10 25 5 5 5 5Buses 0 10 0 0 5 0 0 10 0 0 0 0
Adjusted Projected Turning Movements - MASTEM ITLUP Foundation Network - Scenario G
2036
AADT TotalTrucksBuses
Departing Entering Departing Entering Departing Entering Departing EnteringDaily Total 27,000 30,100 17,500 18,400 30,800 24,100 12,800 15,500
Trucks 2,130 2,290 870 1,020 2,340 1,960 840 910Buses 80 60 40 40 50 70 30 30
a m Total 2,380 3,110 1,440 1,690 3,370 2,180 1,070 1,280Trucks 190 210 70 80 210 180 55 55Buses 5 5 5 0 5 5 0 5
p m Total 2,980 2,450 1,790 1,620 2,440 2,840 1,110 1,410Trucks 175 165 50 65 150 155 45 35Buses 5 5 0 5 5 5 5 0
L T R L T R L T R L T RDaily Total 5,600 22,600 1,900 3,100 8,300 7,000 2,600 18,100 3,400 1,900 8,500 5,100
Trucks 320 1,870 100 120 500 400 240 1,580 140 150 410 350Buses 10 50 0 0 30 10 0 70 0 0 30 0
a m Total 550 2,430 130 500 770 420 170 1,840 170 120 720 440Trucks 30 180 0 10 35 35 20 150 10 5 30 20Buses 0 5 0 0 0 0 0 5 0 0 5 0
p m Total 410 1,890 150 150 730 740 230 2,070 540 170 840 400Trucks 25 135 5 5 30 30 10 140 5 5 20 10Buses 0 5 0 0 5 0 0 5 0 0 0 0
Turning Movement
140 80 120 60
One Way Flows
57,100 35,900 54,900 28,3004,420 1,890 4,300 1,750
Approach Main North Road [NE] McIntyre Road [SE] Main North Road [SW] Kings Road [NW]
Turning Movement
280 110 300 70
One Way Flows
45,900 31,200 47,900 27,8001,600 1,050 1,810 1,240
One Way Flows
Turning Movement
Approach Main North Road [NE] McIntyre Road [SE] Main North Road [SW] Kings Road [NW]
1,760 1,210 1,970 1,400260 60 280 60
Approach Main North Road [NE] McIntyre Road [SE] Main North Road [SW] Kings Road [NW]43,300 29,400 44,700 29,800

TG839463 - Main North Road / Kesters Road Junction
Estimated De-Seasonalised Turning Movement Count - Existing Network Demand
2006
AADT TotalTrucksBuses
Departing Entering Departing Entering Departing Entering Departing EnteringDaily Total 21,600 24,100 3,900 2,800 25,400 24,000
Trucks 940 1,030 280 240 1,190 1,140Buses 150 130 40 40 170 190
a m Total 1,470 2,650 190 290 2,850 1,570Trucks 70 75 15 20 90 80Buses 10 10 5 5 15 15
p m Total 2,440 1,920 480 140 1,950 2,810Trucks 50 15 5 5 20 55Buses 10 10 5 5 15 15
L T L T R Daily Total 1,500 22,600 2,800 21,600 2,400
Trucks 80 950 240 940 200Buses 0 130 40 150 40
a m Total 90 2,560 290 1,470 100Trucks 5 70 20 70 10Buses 0 10 5 10 5
p m Total 110 1,810 140 2,440 370Trucks 0 15 5 50 5Buses 0 10 5 10 5
2011
AADT TotalTrucksBuses
Departing Entering Departing Entering Departing Entering Departing EnteringDaily Total 23,900 25,000 4,100 2,900 26,300 26,400
Trucks 870 940 300 250 1,110 1,090Buses 150 150 40 40 190 190
a m Total 1,760 2,770 220 270 2,950 1,890Trucks 65 70 15 20 85 75Buses 10 10 5 5 15 15
p m Total 2,870 1,940 510 170 1,980 3,250Trucks 45 15 5 5 20 50Buses 10 10 5 5 15 15
L T L T R Daily Total 1,600 23,400 2,900 23,900 2,500
Trucks 80 860 250 870 220Buses 0 150 40 150 40
a m Total 90 2,680 270 1,760 130Trucks 5 65 20 65 10Buses 0 10 5 10 5
p m Total 130 1,810 170 2,870 380Trucks 0 15 5 45 5Buses 0 10 5 10 5
Adjusted Projected Turning Movements - MASTEM ITLUP Foundation Network - Scenario G
2036
AADT TotalTrucksBuses
Departing Entering Departing Entering Departing Entering Departing EnteringDaily Total 25,700 30,200 5,300 5,800 29,900 25,000 2,800 2,700
Trucks 2,010 2,290 450 460 2,460 2,200 30 0Buses 70 50 30 30 80 100 0 0
a m Total 2,240 3,280 300 350 3,260 2,300 210 80Trucks 185 205 35 40 215 200 10 0Buses 5 5 0 5 10 5 0 0
p m Total 3,100 2,350 620 370 2,320 3,230 400 490Trucks 160 145 20 20 150 165 0 0Buses 5 5 5 0 5 10 0 0
L T R L T R L T R L T RDaily Total 2,600 26,600 1,000 2,500 400 2,900 1,400 21,300 2,300 1,500 400 800
Trucks 150 2,140 0 320 0 140 30 1,870 300 0 0 0Buses 0 50 0 30 0 0 0 70 30 0 0 0
a m Total 160 3,040 80 200 40 110 90 2,080 130 50 10 20Trucks 15 190 0 25 0 15 10 170 20 0 0 0Buses 0 5 0 5 0 0 0 5 0 0 0 0
p m Total 200 2,010 140 160 40 170 220 2,650 360 280 60 150Trucks 5 140 0 10 0 10 0 150 15 0 0 0Buses 0 5 0 0 0 0 0 5 5 0 0 0
Turning Movement
120 60 180 0
One Way Flows
55,900 11,100 54,900 5,5004,300 910 4,660 30
Approach Main North Rd (NE) Kesters Rd (SE) Main North Rd (SW) Parafield Development Access
Turning Movement
300 80 380
One Way Flows
48,900 7,000 52,7001,810 550 2,200
One Way Flows
Turning Movement
Approach Main North Rd (NE) Kesters Rd (SE) Main North Rd (SW)
1,970 520 2,330280 80 360
Approach Main North Rd (NE) Kesters Rd (SE) Main North Rd (SW)45,700 6,700 49,400

TS331 - Main North Road / Maxwell Road / Elder Smith Road
Estimated De-Seasonalised Turning Movement Count - Existing Network Demand
2006
AADT TotalTrucksBuses
Departing Entering Departing Entering Departing Entering Departing EnteringDaily Total 24,000 25,400 2,200 1,800 25,100 24,100
Trucks 1,140 1,190 180 180 1,250 1,200Buses 190 170 10 0 160 190
a m Total 1,570 2,850 150 80 2,800 1,590Trucks 80 90 10 15 100 85Buses 15 15 0 0 15 15
p m Total 2,810 1,950 180 160 1,940 2,820Trucks 55 20 10 10 20 55Buses 15 15 0 0 15 15
L T L R T RDaily Total 1,300 24,100 1,000 800 23,200 900
Trucks 70 1,120 130 50 1,090 110Buses 10 160 0 0 190 0
a m Total 110 2,740 60 20 1,550 40Trucks 5 85 15 0 80 5Buses 0 15 0 0 15 0
p m Total 90 1,860 80 80 2,730 90Trucks 5 15 5 5 50 5Buses 0 15 0 0 15 0
2011
AADT TotalTrucksBuses
Departing Entering Departing Entering Departing Entering Departing EnteringDaily Total 26,400 26,300 4,900 6,500 23,900 21,800 8,600 9,200
Trucks 1,090 1,110 420 520 1,110 970 620 640Buses 190 190 10 0 200 210 60 60
a m Total 1,890 2,950 340 770 2,680 1,500 1,060 750Trucks 75 85 25 40 95 70 50 50Buses 15 15 0 0 15 15 0 0
p m Total 3,250 1,980 500 480 1,830 2,610 630 1,140Trucks 50 20 10 5 15 50 15 15Buses 15 15 0 0 25 15 0 10
L T R L T R L T R L T RDaily Total 1,300 20,700 4,300 1,300 3,300 1,900 1,000 20,000 800 4,500 2,800 1,900
Trucks 70 830 210 110 300 110 110 750 110 230 240 170Buses 0 170 20 0 0 0 40 170 0 20 10 30
a m Total 110 2,290 550 180 450 140 60 1,400 40 350 190 210Trucks 5 65 15 10 20 10 15 50 5 15 15 20Buses 0 15 0 0 0 0 0 15 0 0 0 0
p m Total 90 1,580 310 80 240 160 80 2,450 80 640 330 170Trucks 5 10 5 0 5 0 5 45 0 5 5 5Buses 0 15 0 0 0 0 0 15 0 0 0 10
Adjusted Projected Turning Movements - MASTEM ITLUP Foundation Network - Scenario G
2036
AADT TotalTrucksBuses
Departing Entering Departing Entering Departing Entering Departing EnteringDaily Total 25,000 29,900 6,600 7,700 26,000 19,300 10,800 11,500
Trucks 2,200 2,460 800 780 2,160 1,930 840 830Buses 100 80 10 0 80 80 0 30
a m Total 2,300 3,260 550 780 2,850 1,770 1,180 1,070Trucks 200 215 55 60 185 175 70 60Buses 5 10 0 0 10 5 0 0
p m Total 3,230 2,320 590 700 2,040 2,500 930 1,270Trucks 165 150 45 40 120 145 35 30Buses 10 5 0 0 5 10 0 0
L T R L T R L T R L T RDaily Total 1,900 22,600 5,400 1,400 4,000 2,300 1,400 17,400 500 5,300 4,200 2,000
Trucks 320 1,800 340 160 370 250 130 1,640 160 310 320 200Buses 0 80 0 0 0 0 0 80 0 20 10 0
a m Total 160 2,460 640 160 450 170 90 1,640 40 490 350 230Trucks 30 160 25 5 25 30 20 150 5 20 20 20Buses 0 10 0 0 0 0 0 5 0 0 0 0
p m Total 130 1,750 440 120 380 200 110 2,350 40 680 420 170Trucks 30 105 15 5 10 25 10 130 5 10 10 10Buses 0 5 0 0 0 0 0 10 0 0 0 0
Turning Movement
180 10 160 30
One Way Flows
54,900 14,300 45,300 22,3004,660 1,580 4,090 1,670
Approach Main North Road [NE] Maxwell Road [SE] Main North Road [SW] Elder Smith Road [NW]
Turning Movement
380 10 410 120
One Way Flows
52,700 11,400 45,700 17,8002,200 940 2,080 1,260
One Way Flows
Turning Movement
Approach Main North Road [NE] Maxwell Road [SE] Main North Road [SW] Elder Smith Road [NW]
2,330 360 2,450360 10 350
Approach Main North Road [NE] Maxwell Road [SE] Main North Road [SW]49,400 4,000 49,200

TG813468 - Salisbury Highway / Ryans Road Junction
Estimated De-Seasonalised Turning Movement Count - Existing Network Demand
2006
AADT TotalTrucksBuses
Departing Entering Departing Entering Departing Entering Departing EnteringDaily Total 18,500 18,000 17,600 18,600 1,500 1,000
Trucks 1,800 1,940 1,900 1,800 90 50Buses 100 140 100 100 40 0
a m Total 1,120 2,640 2,630 1,140 120 90Trucks 125 180 175 130 10 0Buses 10 10 10 10 0 0
p m Total 2,360 1,250 1,220 2,400 170 100Trucks 45 25 25 50 5 0Buses 10 10 10 10 0 0
T R L T L RDaily Total 17,300 700 800 17,800 700 300
Trucks 1,890 50 40 1,760 40 10Buses 100 40 0 100 0 0
a m Total 2,580 60 60 1,080 40 50Trucks 175 5 5 125 0 0Buses 10 0 0 10 0 0
p m Total 1,200 50 120 2,280 80 20Trucks 25 0 5 45 0 0Buses 10 0 0 10 0 0
2011
AADT TotalTrucksBuses
Departing Entering Departing Entering Departing Entering Departing EnteringDaily Total 18,600 17,400 17,300 19,100 1,400 800
Trucks 1,460 1,440 1,400 1,460 90 50Buses 60 70 70 60 0 0
a m Total 1,160 2,370 2,380 1,170 90 90Trucks 125 155 150 130 10 0Buses 5 5 5 5 0 0
p m Total 2,220 940 940 2,360 210 70Trucks 35 25 25 40 5 0Buses 5 5 5 5 0 0
T R L T L RDaily Total 16,900 500 900 18,200 400 400
Trucks 1,390 50 40 1,420 40 10Buses 70 0 0 60 0 0
a m Total 2,320 50 40 1,130 30 60Trucks 150 5 5 125 0 0Buses 5 0 0 5 0 0
p m Total 910 30 180 2,180 40 30Trucks 25 0 5 35 0 0Buses 5 0 0 5 0 0
Adjusted Projected Turning Movements - MASTEM ITLUP Foundation Network - Scenario G
2036
AADT TotalTrucksBuses
Departing Entering Departing Entering Departing Entering Departing EnteringDaily Total 20,400 19,700 19,800 20,600 1,100 1,000
Trucks 1,840 1,760 1,940 1,990 240 270Buses 60 70 230 220 160 160
a m Total 1,220 2,540 2,550 1,230 90 90Trucks 155 175 195 180 30 25Buses 5 5 20 20 15 15
p m Total 2,470 1,160 1,200 2,560 160 110Trucks 80 70 90 100 20 20Buses 5 5 15 15 10 10
T R L T L RDaily Total 19,200 500 600 20,000 400 600
Trucks 1,710 50 190 1,800 40 230Buses 70 0 160 60 0 160
a m Total 2,490 50 40 1,190 30 60Trucks 170 5 25 155 0 25Buses 5 0 15 5 0 15
p m Total 1,130 30 130 2,430 40 70Trucks 70 0 20 80 0 20Buses 5 0 10 5 0 10
Turning Movement
130 450 320
One Way Flows
40,100 40,400 2,1003,600 3,930 510
Approach Salisbury Highway (NE) Salisbury Highway (SW) Ryans Road
Turning Movement
130 130 0
One Way Flows
36,000 36,400 2,2002,900 2,860 140
One Way Flows
Turning Movement
Approach Salisbury Highway (NE) Salisbury Highway (SW) Ryans Road
3,740 3,700 140240 200 40
Approach Salisbury Highway (NE) Salisbury Highway (SW) Ryans Road36,500 36,200 2,500

TS008 - Salisbury Highway / Elder Smith Road
Estimated De-Seasonalised Turning Movement Count - Existing Network Demand
2006
AADT TotalTrucksBuses
Departing Entering Departing Entering Departing Entering Departing EnteringDaily Total 21,000 20,000 4,500 4,300 19,600 20,600 1,100 1,300
Trucks 2,000 2,100 210 230 2,180 2,070 70 60Buses 100 100 50 40 60 70 0 0
a m Total 1,540 2,580 360 350 2,660 1,550 80 160Trucks 150 195 20 15 190 155 10 5Buses 10 10 5 5 5 5 0 0
p m Total 2,390 1,590 510 510 1,500 2,390 170 80Trucks 70 45 0 5 45 65 0 0Buses 10 10 5 5 5 5 0 0
L T R L T R L T R L T RDaily Total 2,100 17,600 300 1,600 400 2,300 400 18,200 2,000 500 400 400
Trucks 70 2,020 10 130 20 80 40 1,910 120 10 20 30Buses 40 60 0 0 0 40 0 60 10 0 0 0
a m Total 170 2,390 20 200 20 130 40 1,370 140 40 50 70Trucks 10 185 0 5 0 10 10 140 5 0 5 0Buses 5 5 0 0 0 5 0 5 0 0 0 0
p m Total 220 1,330 40 160 70 280 60 2,070 260 40 30 10Trucks 0 45 0 0 0 5 0 65 0 0 0 0Buses 5 5 0 0 0 5 0 5 0 0 0 0
2011
AADT TotalTrucksBuses
Departing Entering Departing Entering Departing Entering Departing EnteringDaily Total 21,500 19,700 11,900 12,300 23,600 24,500 3,800 4,300
Trucks 1,660 1,600 720 730 2,370 2,330 440 530Buses 60 70 120 140 70 40 60 60
a m Total 1,570 2,330 1,100 1,350 3,040 1,720 220 530Trucks 150 170 55 50 230 190 25 50Buses 5 5 10 10 0 0 5 5
p m Total 2,350 1,310 1,300 1,040 1,540 2,970 460 330Trucks 60 45 25 30 70 80 15 15Buses 5 5 10 10 0 0 5 5
L T R L T R L T R L T RDaily Total 3,400 15,900 400 6,300 2,400 3,600 1,000 17,000 6,500 900 2,000 1,400
Trucks 60 1,520 20 500 140 90 280 1,520 530 50 130 350Buses 40 30 0 40 60 40 0 20 20 0 60 0
a m Total 370 1,940 20 940 140 270 60 1,230 430 70 300 160Trucks 10 160 0 40 5 5 20 140 30 5 15 30Buses 5 0 0 0 5 5 0 0 0 0 5 0
p m Total 260 1,010 40 460 310 270 110 1,980 880 100 160 70Trucks 0 45 0 20 5 5 10 50 20 5 5 5Buses 5 0 0 0 5 5 0 0 0 0 5 0
Adjusted Projected Turning Movements - MASTEM ITLUP Foundation Network - Scenario G
2036
AADT TotalTrucksBuses
Departing Entering Departing Entering Departing Entering Departing EnteringDaily Total 23,000 22,200 14,600 14,900 26,100 27,300 7,500 6,800
Trucks 2,190 2,140 880 980 3,040 3,050 630 570Buses 220 230 310 310 130 120 10 10
a m Total 1,630 2,500 1,410 1,590 3,240 1,870 510 830Trucks 200 215 75 70 290 265 35 50Buses 20 20 25 25 5 5 0 0
p m Total 2,580 1,570 1,560 1,300 1,810 3,330 830 580Trucks 120 110 50 55 150 160 25 20Buses 15 15 25 25 10 10 0 0
L T R L T R L T R L T RDaily Total 3,800 17,900 500 6,500 4,700 3,700 2,300 18,300 6,700 1,000 4,100 1,700
Trucks 110 2,010 20 660 200 120 410 2,010 630 60 140 370Buses 200 30 0 100 10 200 0 20 100 0 10 0
a m Total 390 2,080 30 970 340 280 140 1,270 460 80 560 190Trucks 10 205 0 55 5 10 30 185 50 5 15 30Buses 20 0 0 5 0 20 0 0 5 0 0 0
p m Total 290 1,240 40 480 540 280 250 2,190 890 110 380 90Trucks 10 100 0 40 5 10 20 105 35 5 5 10Buses 15 0 0 10 0 15 0 0 10 0 0 0
Turning Movement
450 620 250 20
One Way Flows
45,200 29,500 53,400 14,3004,330 1,860 6,090 1,200
Approach Salisbury Highway [NE] Elder Smith Road [SE] Salisbury Highway [SW] Elder Smith Road [NW]
Turning Movement
130 260 110 120
One Way Flows
41,200 24,200 48,100 8,1003,260 1,450 4,700 970
One Way Flows
Turning Movement
Approach Salisbury Highway [NE] Elder Smith Road [SE] Salisbury Highway [SW] Elder Smith Road [NW]
4,100 440 4,250 130200 90 130 0
Approach Salisbury Highway [NE] Elder Smith Road [SE] Salisbury Highway [SW] Elder Smith Road [NW]41,000 8,800 40,200 2,400

Ref No. 20150207FR01B Traffic Assessment Report Salisbury Main Roads DPA
Appendix C SIDRA Outputs No Development

Ref No. 20150207FR01B Traffic Assessment Report Salisbury Main Roads DPA 2
MOVEMENT SUMMARY Site: MNR-Saints_2036 am - nodev
Main North Road / Saints Rd / Grove Way - 2036 AM Peak - no dev Signals - Fixed Time Coordinated ycle Time = 150 seconds (User-Given Cycle Time) Movement Performance - Vehicles Mov ID ODMo
v Demand Flows Deg. Satn Average
Delay Level of Service
95% Back of Queue Prop. Queued
Effective Stop Rate
Average Speed Total HV Vehicles Distance
veh/h % v/c sec veh m per veh km/hSouth: MNR 1 L2 100 5.0 0.112 20.6 LOS C 2.6 18.6 0.40 0.64 44.32 T1 2290 6.3 1.053 180.2 LOS F 106.4 784.9 1.00 1.62 15.33 R2 160 9.4 0.853 91.0 LOS F 6.4 48.4 1.00 0.90 24.2Approach 2550 6.5 1.053 168.4 LOS F 106.4 784.9 0.98 1.54 16.1East: Grove Way 4 L2 460 3.3 0.653 32.1 LOS C 24.8 178.7 0.86 0.87 39.05 T1 490 2.0 1.178 423.3 LOS F 101.4 730.3 1.00 2.12 7.76 R2 1290 4.7 1.178 415.8 LOS F 111.1 808.6 1.00 2.01 7.8Approach 2240 3.8 1.178 338.6 LOS F 111.1 808.6 0.97 1.80 9.3North: MNR 7 L2 870 6.9 0.486 5.8 LOS A 0.0 0.0 0.00 0.52 54.68 T1 2560 5.7 0.888 30.6 LOS C 57.5 422.0 0.83 0.78 40.29 R2 370 2.7 1.077 237.6 LOS F 54.9 393.2 1.00 1.49 12.4Approach 3800 5.7 1.077 45.1 LOS D 57.5 422.0 0.66 0.79 34.7West: Saints Rd 10 L2 130 7.7 0.073 5.7 LOS A 0.0 0.0 0.00 0.52 54.711 T1 190 5.3 1.473 941.4 LOS F 41.9 306.9 1.00 2.40 3.712 R2 160 0.0 1.473 947.6 LOS F 40.3 289.2 1.00 2.33 3.7Approach 480 4.2 1.473 690.0 LOS F 41.9 306.9 0.73 1.87 5.0All Vehicles 9070 5.3 1.473 186.4 LOS F 111.1 808.6 0.83 1.31 15.0
MOVEMENT SUMMARY
Site: MNR-Saints_2036 pm nodev Main North Road / Saints Rd / Grove Way - 2036 PM Peak nodev Signals - Fixed Time Coordinated Cycle Time = 150 seconds (User-Given Cycle Time) Movement Performance - Vehicles Mov ID ODMo
v Demand Flows Deg. Satn Average
Delay Level of Service
95% Back of Queue Prop. Queued
Effective Stop Rate
Average Speed Total HV Vehicles Distance
veh/h % v/c sec veh m per veh km/hSouth: MNR 1 L2 120 1.7 0.094 7.6 LOS A 0.7 4.9 0.10 0.57 52.72 T1 2610 4.8 0.992 88.5 LOS F 93.8 683.7 0.98 1.20 24.73 R2 500 3.0 1.021 155.8 LOS F 28.6 205.5 1.00 1.27 17.0Approach 3230 4.4 1.021 95.9 LOS F 93.8 683.7 0.95 1.19 23.5East: Grove Way 4 L2 200 5.0 0.258 16.8 LOS B 5.9 43.4 0.49 0.70 46.55 T1 220 4.5 1.140 319.2 LOS F 52.4 387.8 1.00 1.76 9.86 R2 830 6.6 1.140 351.6 LOS F 52.4 387.8 1.00 1.81 9.0Approach 1250 6.0 1.140 292.3 LOS F 52.4 387.8 0.92 1.62 10.5North: MNR 7 L2 1280 4.7 0.705 5.8 LOS A 0.0 0.0 0.00 0.52 54.58 T1 2040 5.9 0.760 32.9 LOS C 38.4 282.3 0.80 0.73 39.29 R2 170 2.9 0.694 74.4 LOS E 12.0 86.2 0.99 0.83 27.2Approach 3490 5.3 0.760 25.0 LOS C 38.4 282.3 0.52 0.66 42.7West: Saints Rd 10 L2 370 2.7 0.201 5.7 LOS A 0.0 0.0 0.00 0.53 54.811 T1 510 2.2 1.022 157.7 LOS F 30.5 217.3 1.00 1.43 17.012 R2 90 0.0 0.400 72.5 LOS E 6.2 43.4 0.97 0.78 27.7Approach 970 2.2 1.022 91.8 LOS F 30.5 217.3 0.62 1.03 24.2All Vehicles 8940 4.7 1.140 95.2 LOS F 93.8 683.7 0.74 1.02 23.6

Ref No. 20150207FR01B Traffic Assessment Report Salisbury Main Roads DPA 3
MOVEMENT SUMMARY Site: MNR-parks_2036 pm - nodev
Main North Road / Smith Rd / Park Tce - 2036 PM Peak - no dev Signals - Fixed Time Coordinated Cycle Time = 150 seconds (User-Given Cycle Time) Movement Performance - Vehicles Mov ID ODMo
v Demand Flows Deg. Satn Average
Delay Level of Service
95% Back of Queue Prop. Queued
Effective Stop Rate
Average Speed Total HV Vehicles Distance
veh/h % v/c sec veh m per veh km/hSouth: MNR 1 L2 250 10.0 0.184 6.0 LOS A 0.4 2.7 0.03 0.55 53.72 T1 2600 5.0 1.372 727.8 LOS F 408.9 2984.8 0.99 3.59 4.73 R2 110 9.1 0.669 79.6 LOS E 8.0 60.6 1.00 0.81 25.8Approach 2960 5.6 1.372 642.8 LOS F 408.9 2984.8 0.91 3.23 5.2East: smith rd 4 L2 210 4.8 1.318 638.5 LOS F 73.9 542.2 1.00 2.31 5.25 T1 260 7.7 1.318 654.0 LOS F 73.9 542.2 1.00 2.43 5.16 R2 220 0.5 1.318 668.6 LOS F 58.0 429.9 1.00 2.35 5.1Approach 690 4.5 1.318 653.9 LOS F 73.9 542.2 1.00 2.37 5.1North: MNR 7 L2 150 0.0 0.110 6.0 LOS A 0.2 1.5 0.02 0.56 54.08 T1 1890 6.9 1.000 94.3 LOS F 101.7 753.9 1.00 1.26 23.79 R2 240 2.1 1.391 794.8 LOS F 74.3 529.3 1.00 2.45 4.3Approach 2280 5.9 1.391 162.2 LOS F 101.7 753.9 0.94 1.34 16.5West: park tce 10 L2 190 5.3 1.104 289.6 LOS F 60.1 435.5 1.00 1.78 10.511 T1 370 2.7 1.104 292.7 LOS F 60.1 435.5 1.00 1.81 10.312 R2 320 7.8 1.104 304.2 LOS F 45.2 327.2 1.00 1.66 10.1Approach 880 5.1 1.104 296.2 LOS F 60.1 435.5 1.00 1.75 10.3All Vehicles 6810 5.5 1.391 438.2 LOS F 408.9 2984.8 0.94 2.32 7.4
MOVEMENT SUMMARY Site: MNR-parks_2036 am - no dev
Main North Road / Smith Rd / Park Tce - 2036 AM Peak - no dev Signals - Fixed Time Coordinated Cycle Time = 150 seconds (User-Given Cycle Time) Movement Performance - Vehicles Mov ID ODMo
v Demand Flows Deg. Satn Average
Delay Level of Service
95% Back of Queue Prop. Queued
Effective Stop Rate
Average Speed Total HV Vehicles Distance
veh/h % v/c sec veh m per veh km/hSouth: MNR 1 L2 310 11.3 0.254 7.5 LOS A 1.7 13.3 0.09 0.57 52.52 T1 2150 7.0 1.233 481.0 LOS F 274.7 2037.9 0.98 2.82 6.83 R2 80 6.3 1.113 304.5 LOS F 13.4 98.9 1.00 1.42 10.0Approach 2540 7.5 1.233 417.6 LOS F 274.7 2037.9 0.87 2.50 7.7East: smith rd 4 L2 230 4.3 1.316 642.1 LOS F 100.6 730.7 1.00 2.42 5.25 T1 460 4.3 1.316 657.4 LOS F 100.6 730.7 1.00 2.65 5.16 R2 190 5.3 0.767 76.5 LOS E 14.1 102.9 1.00 0.87 26.6Approach 880 4.5 1.316 528.0 LOS F 100.6 730.7 1.00 2.21 6.2North: MNR 7 L2 130 0.8 0.091 6.0 LOS A 0.2 1.2 0.02 0.55 54.08 T1 2790 5.7 1.335 654.3 LOS F 401.8 2950.7 1.00 3.41 5.19 R2 220 2.3 1.277 590.3 LOS F 56.7 404.9 1.00 2.11 5.6Approach 3140 5.3 1.335 623.0 LOS F 401.8 2950.7 0.96 3.21 5.4West: park tce 10 L2 150 6.7 1.196 450.9 LOS F 60.9 446.5 1.00 2.21 7.211 T1 370 4.1 1.196 446.0 LOS F 60.9 446.5 1.00 2.18 7.312 R2 140 28.6 0.842 86.7 LOS F 11.2 97.4 1.00 0.95 24.6Approach 660 9.8 1.196 370.9 LOS F 60.9 446.5 1.00 1.93 8.5All Vehicles 7220 6.4 1.335 516.1 LOS F 401.8 2950.7 0.94 2.72 6.4

Ref No. 20150207FR01B Traffic Assessment Report Salisbury Main Roads DPA 4
MOVEMENT SUMMARY Site: MNR-mcintyre_2036 am - no dev
Main North Road / Mcintyre Rd Kings - 2036 AM Peak no dev Signals - Fixed Time Coordinated Cycle Time = 150 seconds (User-Given Cycle Time) Movement Performance - Vehicles Mov ID ODMo
v Demand Flows Deg. Satn Average
Delay Level of Service
95% Back of Queue Prop. Queued
Effective Stop Rate
Average Speed Total HV Vehicles Distance
veh/h % v/c sec veh m per veh km/hSouth: MNR 1 L2 170 11.8 0.140 7.3 LOS A 0.8 6.5 0.08 0.57 52.62 T1 1840 8.4 0.716 24.6 LOS C 33.4 250.6 0.66 0.59 42.93 R2 170 5.9 1.011 145.2 LOS F 18.4 135.2 1.00 1.25 17.9Approach 2180 8.5 1.011 32.6 LOS C 33.4 250.6 0.64 0.64 39.2East: mcintyre 4 L2 500 2.0 1.046 201.0 LOS F 69.3 493.3 1.00 1.30 13.95 T1 770 4.5 1.367 747.2 LOS F 116.0 843.4 1.00 3.12 4.66 R2 420 8.3 1.186 433.1 LOS F 44.7 335.1 1.00 1.96 7.5Approach 1690 4.7 1.367 507.6 LOS F 116.0 843.4 1.00 2.29 6.5North: MNR 7 L2 550 5.5 0.449 9.8 LOS A 5.3 38.7 0.18 0.67 51.08 T1 2430 7.6 0.970 65.3 LOS E 76.0 566.7 0.85 1.01 29.29 R2 130 3.8 0.763 81.6 LOS F 9.7 70.4 1.00 0.86 25.8Approach 3110 7.1 0.970 56.2 LOS E 76.0 566.7 0.74 0.94 31.4West: kings 10 L2 120 4.2 0.227 49.8 LOS D 6.7 48.4 0.81 0.77 32.511 T1 720 4.9 1.258 552.6 LOS F 91.9 669.9 1.00 2.66 6.112 R2 440 4.5 1.210 476.4 LOS F 49.7 361.7 1.00 2.05 6.9Approach 1280 4.7 1.258 479.3 LOS F 91.9 669.9 0.98 2.27 6.9All Vehicles 8260 6.6 1.367 207.9 LOS F 116.0 843.4 0.80 1.35 13.7
MOVEMENT SUMMARY Site: MNR-mcintyre_2036 pm - nodev
Main North Road / Mcintyre Rd Kings - 2036 PM Peak - no dev Signals - Fixed Time Coordinated Cycle Time = 150 seconds (User-Given Cycle Time) Movement Performance - Vehicles Mov ID ODMo
v Demand Flows Deg. Satn Average
Delay Level of Service
95% Back of Queue Prop. Queued
Effective Stop Rate
Average Speed Total HV Vehicles Distance
veh/h % v/c sec veh m per veh km/hSouth: MNR 1 L2 230 4.3 0.188 8.6 LOS A 1.9 14.0 0.14 0.59 51.82 T1 2070 7.0 0.891 41.3 LOS D 56.3 417.5 0.84 0.82 36.03 R2 530 0.9 1.243 541.5 LOS F 127.6 900.5 1.00 2.15 6.1Approach 2830 5.7 1.243 132.3 LOS F 127.6 900.5 0.81 1.05 19.1East: mcintyre 4 L2 150 3.3 0.181 19.2 LOS B 3.9 27.8 0.63 0.73 44.65 T1 740 4.7 1.029 166.0 LOS F 45.6 332.2 1.00 1.54 16.36 R2 740 4.1 1.130 333.9 LOS F 67.6 489.8 1.00 1.73 9.4Approach 1630 4.3 1.130 228.7 LOS F 67.6 489.8 0.97 1.55 12.8North: MNR 7 L2 410 6.1 0.456 26.1 LOS C 12.5 92.4 0.52 0.82 41.68 T1 1890 7.1 1.261 553.4 LOS F 171.9 1276.7 1.00 2.98 6.09 R2 150 3.3 0.877 87.6 LOS F 11.9 85.4 1.00 0.94 24.8Approach 2450 6.7 1.261 436.7 LOS F 171.9 1276.7 0.92 2.49 7.4West: kings 10 L2 170 2.9 0.335 52.9 LOS D 9.9 71.4 0.85 0.79 31.611 T1 840 2.4 1.338 695.0 LOS F 121.6 868.5 1.00 3.07 4.912 R2 400 2.5 0.738 75.5 LOS E 14.6 104.2 1.00 0.85 26.9Approach 1410 2.5 1.338 441.8 LOS F 121.6 868.5 0.98 2.17 7.4All Vehicles 8320 5.2 1.338 293.3 LOS F 171.9 1276.7 0.90 1.76 10.4

Ref No. 20150207FR01B Traffic Assessment Report Salisbury Main Roads DPA 5
MOVEMENT SUMMARY Site: MNR-Kesters pm 2036 - no dev
Main North Road Kesters - with para access signals - 2036 PM Peak Signals - Fixed Time Isolated Cycle Time = 100 seconds (Practical Cycle Time) Movement Performance - Vehicles Mov ID ODMo
v Demand Flows Deg. Satn Average
Delay Level of Service
95% Back of Queue Prop. Queued
Effective Stop Rate
Average Speed Total HV Vehicles Distance
veh/h % v/c sec veh m per veh km/hSouth: MNR 1 L2 220 0.0 0.153 7.1 LOS A 1.7 11.8 0.25 0.62 53.12 T1 2650 5.7 0.884 31.1 LOS C 45.8 336.5 0.93 0.96 39.83 R2 360 5.6 0.679 47.2 LOS D 16.5 121.3 0.99 0.83 33.6Approach 3230 5.3 0.884 31.3 LOS C 45.8 336.5 0.89 0.93 39.7East: Kesters 4 L2 160 6.3 0.089 5.7 LOS A 0.0 0.0 0.00 0.53 54.65 T1 40 0.0 0.816 53.9 LOS D 5.6 40.3 1.00 0.94 31.26 R2 170 5.9 0.816 59.7 LOS E 5.6 40.3 1.00 0.94 30.6Approach 370 5.4 0.816 35.7 LOS D 5.6 40.3 0.57 0.76 37.9North: MNR 7 L2 200 3.0 0.142 8.3 LOS A 2.2 15.8 0.31 0.64 52.18 T1 2010 7.2 0.864 36.6 LOS D 34.4 255.6 0.98 1.00 37.69 R2 140 0.0 0.354 43.7 LOS D 3.2 22.4 0.94 0.78 34.9Approach 2350 6.4 0.864 34.6 LOS C 34.4 255.6 0.92 0.95 38.3West: para access 10 L2 280 0.0 0.151 5.6 LOS A 0.0 0.0 0.00 0.53 54.911 T1 60 0.0 0.513 52.7 LOS D 3.1 21.4 1.00 0.75 32.512 R2 150 0.0 0.673 60.1 LOS E 3.9 27.5 1.00 0.82 30.2Approach 490 0.0 0.673 28.1 LOS C 3.9 27.5 0.43 0.64 41.2All Vehicles 6440 5.3 0.884 32.5 LOS C 45.8 336.5 0.85 0.90 39.2
MOVEMENT SUMMARY Site: MNR-Kesters am 2036 - no dev
Main North Road Kesters - with para access signals - 2036 AM Peak no dev Signals - Fixed Time Isolated Cycle Time = 120 seconds (Practical Cycle Time) Movement Performance - Vehicles Mov ID ODMo
v Demand Flows Deg. Satn Average
Delay Level of Service
95% Back of Queue Prop. Queued
Effective Stop Rate
Average Speed Total HV Vehicles Distance
veh/h % v/c sec veh m per veh km/hSouth: MNR 1 L2 90 11.1 0.064 6.4 LOS A 0.4 3.1 0.16 0.59 53.32 T1 2080 8.4 0.887 44.8 LOS D 44.0 330.0 0.99 1.01 34.73 R2 130 15.4 0.808 71.3 LOS E 8.1 64.4 1.00 0.89 27.5Approach 2300 8.9 0.887 44.8 LOS D 44.0 330.0 0.96 0.99 34.7East: Kesters 4 L2 200 15.0 0.118 5.8 LOS A 0.0 0.0 0.00 0.52 54.25 T1 40 0.0 0.864 70.0 LOS E 5.1 37.4 1.00 0.97 27.76 R2 110 13.6 0.864 76.2 LOS E 5.1 37.4 1.00 0.97 26.9Approach 350 12.9 0.864 35.2 LOS D 5.1 37.4 0.43 0.71 38.0North: MNR 7 L2 160 9.4 0.099 6.5 LOS A 0.9 7.2 0.16 0.59 53.38 T1 3040 6.4 0.901 30.3 LOS C 60.5 447.0 0.90 0.92 40.29 R2 80 0.0 0.072 33.3 LOS C 1.6 11.5 0.72 0.70 38.7Approach 3280 6.4 0.901 29.2 LOS C 60.5 447.0 0.86 0.89 40.6West: para access 10 L2 50 0.0 0.027 5.6 LOS A 0.0 0.0 0.00 0.53 54.911 T1 10 0.0 0.103 61.6 LOS E 0.6 4.1 0.98 0.66 30.212 R2 20 0.0 0.108 67.4 LOS E 0.6 4.1 0.98 0.67 28.5Approach 80 0.0 0.108 28.1 LOS C 0.6 4.1 0.37 0.58 41.2All Vehicles 6010 7.7 0.901 35.5 LOS D 60.5 447.0 0.86 0.92 38.0

Ref No. 20150207FR01B Traffic Assessment Report Salisbury Main Roads DPA 6
MOVEMENT SUMMARY Site: MNR-eldersmith_2036 am - no dev
Main North Road /eldersmith / Maxwell - 2036 AM Peak - no development Signals - Fixed Time Coordinated Cycle Time = 150 seconds (User-Given Cycle Time) Movement Performance - Vehicles Mov ID ODMo
v Demand Flows Deg. Satn Average
Delay Level of Service
95% Back of Queue Prop. Queued
Effective Stop Rate
Average Speed Total HV Vehicles Distance
veh/h % v/c sec veh m per veh km/hSouth: MNR 1 L2 90 22.2 0.091 10.2 LOS B 1.0 8.1 0.18 0.59 50.22 T1 1640 9.1 0.827 44.7 LOS D 37.6 284.2 0.89 0.82 34.83 R2 160 25.0 1.076 242.2 LOS F 23.4 199.1 1.00 1.48 12.1Approach 1890 11.1 1.076 59.8 LOS E 37.6 284.2 0.87 0.86 30.4East: maxwell 4 L2 160 3.1 0.273 44.2 LOS D 8.6 61.9 0.78 0.74 34.65 T1 450 5.6 1.018 154.0 LOS F 26.1 191.3 1.00 1.41 17.36 R2 170 17.6 0.850 85.3 LOS F 13.5 109.0 1.00 0.96 25.2Approach 780 7.7 1.018 116.5 LOS F 26.1 191.3 0.96 1.17 20.9North: MNR 7 L2 160 18.8 0.134 6.4 LOS A 0.4 2.9 0.04 0.55 53.18 T1 2460 6.9 1.081 224.8 LOS F 136.4 1011.7 0.96 1.79 12.99 R2 640 3.9 0.822 70.3 LOS E 23.0 166.4 0.99 0.90 28.1Approach 3260 6.9 1.081 183.7 LOS F 136.4 1011.7 0.92 1.55 15.1West: elder smith 10 L2 490 4.1 0.259 5.7 LOS A 0.0 0.0 0.00 0.53 54.811 T1 350 5.7 0.778 74.1 LOS E 13.4 98.2 1.00 0.89 27.512 R2 230 8.7 1.085 260.3 LOS F 35.7 268.2 1.00 1.57 11.5Approach 1070 5.6 1.085 82.8 LOS F 35.7 268.2 0.54 0.87 25.7All Vehicles 7000 7.9 1.085 127.3 LOS F 136.4 1011.7 0.85 1.22 19.6
MOVEMENT SUMMARY Site: MNR-eldersmith_2036 pm - no dev
Main North Road /eldersmith / Maxwell - 2036 PM Peak no development Signals - Fixed Time Coordinated Cycle Time = 150 seconds (User-Given Cycle Time) Movement Performance - Vehicles Mov ID ODMo
v Demand Flows Deg. Satn Average
Delay Level of Service
95% Back of Queue Prop. Queued
Effective Stop Rate
Average Speed Total HV Vehicles Distance
veh/h % v/c sec veh m per veh km/hSouth: MNR 1 L2 110 9.1 0.091 7.3 LOS A 0.5 4.1 0.09 0.57 52.72 T1 2350 6.0 0.939 54.1 LOS D 62.8 462.1 0.92 0.97 31.93 R2 40 12.5 0.580 88.2 LOS F 3.1 24.0 1.00 0.75 24.5Approach 2500 6.2 0.939 52.6 LOS D 62.8 462.1 0.89 0.95 32.3East: maxwell 4 L2 120 4.2 0.168 13.5 LOS B 3.0 21.7 0.41 0.67 48.55 T1 380 2.6 0.844 78.1 LOS E 14.8 106.3 1.00 0.95 26.76 R2 200 12.5 0.916 94.8 LOS F 17.2 133.2 1.00 1.05 23.6Approach 700 5.7 0.916 71.8 LOS E 17.2 133.2 0.90 0.93 27.8North: MNR 7 L2 130 23.1 0.103 6.2 LOS A 0.2 1.4 0.02 0.55 53.28 T1 1750 6.3 0.538 19.3 LOS B 20.9 153.9 0.54 0.48 45.79 R2 440 3.4 0.901 86.6 LOS F 17.7 127.8 1.00 0.97 24.9Approach 2320 6.7 0.901 31.3 LOS C 20.9 153.9 0.60 0.58 39.7West: elder smith 10 L2 680 1.5 0.353 5.7 LOS A 0.0 0.0 0.00 0.53 54.811 T1 420 2.4 0.931 91.9 LOS F 18.2 130.3 1.00 1.11 24.312 R2 170 5.9 0.745 77.4 LOS E 12.6 92.5 1.00 0.86 26.5Approach 1270 2.4 0.931 43.8 LOS D 18.2 130.3 0.46 0.77 35.1All Vehicles 6790 5.6 0.939 45.6 LOS D 62.8 462.1 0.71 0.79 34.4

Ref No. 20150207FR01B Traffic Assessment Report Salisbury Main Roads DPA 7
MOVEMENT SUMMARY Site: salisbury-eldersmith_2036 am - no dev
Salisbury Hwy /eldersmith - 2036 AM Peak no dev Signals - Fixed Time Coordinated Cycle Time = 150 seconds (User-Given Cycle Time) Movement Performance - Vehicles Mov ID ODMo
v Demand Flows Deg. Satn Average
Delay Level of Service
95% Back of Queue Prop. Queued
Effective Stop Rate
Average Speed Total HV Vehicles Distance
veh/h % v/c sec veh m per veh km/hSouth: salisbury 1 L2 140 21.4 0.104 6.1 LOS A 0.2 1.5 0.02 0.55 53.32 T1 1270 14.6 0.662 16.8 LOS B 26.0 204.9 0.53 0.48 47.13 R2 460 10.9 0.991 124.4 LOS F 23.3 177.9 1.00 1.17 19.8Approach 1870 14.2 0.991 42.5 LOS D 26.0 204.9 0.61 0.66 35.5East: eldersmith 4 L2 970 6.2 1.293 598.9 LOS F 258.2 1903.0 1.00 2.26 5.65 T1 340 1.5 0.910 88.1 LOS F 14.2 100.8 1.00 1.05 24.86 R2 280 10.7 0.860 88.6 LOS F 11.3 86.1 1.00 0.97 24.7Approach 1590 6.0 1.293 399.8 LOS F 258.2 1903.0 1.00 1.78 8.0North: salisbury hwy 7 L2 390 7.7 0.347 10.3 LOS B 5.1 37.7 0.21 0.62 50.58 T1 2080 9.9 0.959 57.0 LOS E 71.9 545.7 0.85 0.95 31.29 R2 30 16.7 0.224 85.9 LOS F 1.1 9.0 0.99 0.69 24.9Approach 2500 9.6 0.959 50.1 LOS D 71.9 545.7 0.75 0.89 33.1West: elder smith 10 L2 80 6.3 0.122 14.7 LOS B 2.0 15.0 0.42 0.66 47.711 T1 560 2.7 1.177 421.2 LOS F 65.0 465.5 1.00 2.17 7.712 R2 190 15.8 0.422 71.3 LOS E 6.5 51.8 0.96 0.78 27.7Approach 830 6.0 1.177 302.0 LOS F 65.0 465.5 0.94 1.70 10.2All Vehicles 6790 9.6 1.293 160.7 LOS F 258.2 1903.0 0.79 1.13 16.6
MOVEMENT SUMMARY Site: salisbury-eldersmith_2036 pm - no dev
Salisbury Hwy /elder smith - 2036 PM Peak - nodev Signals - Fixed Time Coordinated Cycle Time = 150 seconds (User-Given Cycle Time) Movement Performance - Vehicles Mov ID ODMo
v Demand Flows Deg. Satn Average
Delay Level of Service
95% Back of Queue Prop. Queued
Effective Stop Rate
Average Speed Total HV Vehicles Distance
veh/h % v/c sec veh m per veh km/hSouth: salisbury 1 L2 250 8.0 0.181 6.0 LOS A 0.4 2.7 0.03 0.55 53.72 T1 2190 4.8 1.050 154.1 LOS F 133.8 975.4 0.81 1.40 17.23 R2 890 5.1 0.723 49.8 LOS D 26.3 192.0 0.87 0.84 33.1Approach 3330 5.1 1.050 115.1 LOS F 133.8 975.4 0.77 1.18 20.9East: eldersmith 4 L2 480 10.4 0.384 12.3 LOS B 11.5 87.4 0.43 0.69 49.15 T1 540 0.9 0.893 80.3 LOS F 21.9 154.3 1.00 1.03 26.26 R2 280 8.9 0.916 97.0 LOS F 11.9 90.0 1.00 1.07 23.4Approach 1300 6.2 0.916 58.8 LOS E 21.9 154.3 0.79 0.91 30.6North: salisbury hwy 7 L2 290 8.6 0.280 11.4 LOS B 4.1 31.0 0.23 0.62 49.88 T1 1240 8.1 0.720 48.1 LOS D 28.2 211.3 0.87 0.76 33.79 R2 40 0.0 0.228 83.7 LOS F 1.5 10.3 0.98 0.70 25.4Approach 1570 8.0 0.720 42.2 LOS D 28.2 211.3 0.76 0.73 35.5West: elder smith 10 L2 110 4.5 0.395 58.4 LOS E 7.3 53.4 0.95 0.81 30.511 T1 380 1.3 1.055 215.4 LOS F 28.5 201.7 1.00 1.50 13.412 R2 90 11.1 0.647 89.0 LOS F 3.5 27.1 1.00 0.78 24.5Approach 580 3.4 1.055 166.0 LOS F 28.5 201.7 0.99 1.26 16.3All Vehicles 6780 5.8 1.055 91.8 LOS F 133.8 975.4 0.79 1.03 24.1

Ref No. 20150207FR01B Traffic Assessment Report Salisbury Main Roads DPA
Appendix D SIDRA Outputs With Development

Ref No. 20150207FR01B Traffic Assessment Report Salisbury Main Roads DPA 2
MOVEMENT SUMMARY Site: MNR-Saints_2036 am - with dev
Main North Road / Saints Rd / Grove Way - 2036 AM Peak - withdev Signals - Fixed Time Coordinated Cycle Time = 150 seconds (User-Given Cycle Time) Movement Performance - Vehicles Mov ID ODMo
v Demand Flows Deg. Satn Average
Delay Level of Service
95% Back of Queue Prop. Queued
Effective Stop Rate
Average Speed Total HV Vehicles Distance
veh/h % v/c sec veh m per veh km/hSouth: MNR 1 L2 100 5.0 0.112 20.6 LOS C 2.6 18.6 0.40 0.64 44.32 T1 2320 6.3 1.067 202.4 LOS F 114.5 844.3 1.00 1.72 14.13 R2 175 8.6 0.928 98.1 LOS F 7.4 55.4 1.00 1.00 23.1Approach 2595 6.4 1.067 188.3 LOS F 114.5 844.3 0.98 1.63 14.8East: Grove Way 4 L2 475 3.2 0.689 36.5 LOS D 25.7 184.7 0.88 0.90 37.35 T1 490 2.0 1.176 418.5 LOS F 100.5 723.5 1.00 2.11 7.76 R2 1290 4.7 1.176 412.0 LOS F 110.3 802.6 1.00 2.00 7.8Approach 2255 3.8 1.176 334.3 LOS F 110.3 802.6 0.97 1.79 9.4North: MNR 7 L2 870 6.9 0.486 5.8 LOS A 0.0 0.0 0.00 0.52 54.68 T1 2590 5.6 0.865 28.6 LOS C 52.2 383.1 0.84 0.78 41.19 R2 370 2.7 1.077 237.6 LOS F 54.9 393.2 1.00 1.49 12.4Approach 3830 5.6 1.077 43.6 LOS D 54.9 393.2 0.66 0.79 35.2West: Saints Rd 10 L2 130 7.7 0.073 5.7 LOS A 0.0 0.0 0.00 0.52 54.711 T1 190 5.3 1.473 941.4 LOS F 41.9 306.9 1.00 2.40 3.712 R2 160 0.0 1.473 947.6 LOS F 40.3 289.2 1.00 2.33 3.7Approach 480 4.2 1.473 690.0 LOS F 41.9 306.9 0.73 1.87 5.0All Vehicles 9160 5.3 1.473 190.0 LOS F 114.5 844.3 0.83 1.33 14.7
MOVEMENT SUMMARY Site: MNR-Saints_2036 pm withdev
Main North Road / Saints Rd / Grove Way - 2036 PM Peak with dev Signals - Fixed Time Coordinated Cycle Time = 150 seconds (User-Given Cycle Time) Movement Performance - Vehicles Mov ID ODMo
v Demand Flows Deg. Satn Average
Delay Level of Service
95% Back of Queue Prop. Queued
Effective Stop Rate
Average Speed Total HV Vehicles Distance
veh/h % v/c sec veh m per veh km/hSouth: MNR 1 L2 120 1.7 0.095 7.3 LOS A 0.6 4.4 0.09 0.57 52.92 T1 2715 4.6 1.056 178.5 LOS F 130.5 949.7 1.00 1.63 15.53 R2 555 2.7 1.077 239.3 LOS F 40.8 292.2 1.00 1.48 12.3Approach 3390 4.2 1.077 182.4 LOS F 130.5 949.7 0.97 1.57 15.2East: Grove Way 4 L2 255 3.9 0.326 19.2 LOS B 8.6 61.9 0.55 0.73 45.15 T1 220 4.5 1.146 332.6 LOS F 53.8 397.4 1.00 1.78 9.56 R2 830 6.6 1.146 362.0 LOS F 53.8 397.4 1.00 1.83 8.8Approach 1305 5.7 1.146 290.1 LOS F 53.8 397.4 0.91 1.61 10.5North: MNR 7 L2 1280 4.7 0.705 5.8 LOS A 0.0 0.0 0.00 0.52 54.58 T1 2150 5.6 0.812 34.8 LOS C 43.0 315.6 0.85 0.77 38.49 R2 170 2.9 0.661 72.8 LOS E 11.8 84.6 0.98 0.82 27.5Approach 3600 5.1 0.812 26.3 LOS C 43.0 315.6 0.55 0.69 42.0West: Saints Rd 10 L2 370 2.7 0.201 5.7 LOS A 0.0 0.0 0.00 0.53 54.811 T1 510 2.2 1.022 157.7 LOS F 30.5 217.3 1.00 1.43 17.012 R2 90 0.0 0.400 72.5 LOS E 6.2 43.4 0.97 0.78 27.7Approach 970 2.2 1.022 91.8 LOS F 30.5 217.3 0.62 1.03 24.2All Vehicles 9265 4.6 1.146 127.4 LOS F 130.5 949.7 0.76 1.17 19.6

Ref No. 20150207FR01B Traffic Assessment Report Salisbury Main Roads DPA 3
MOVEMENT SUMMARY Site: MNR-Saints_2036 pm withdev - imp
Main North Road / Saints Rd / Grove Way - 2036 PM Peak with dev - with improvement Signals - Fixed Time Coordinated Cycle Time = 150 seconds (User-Given Cycle Time) Movement Performance - Vehicles Mov ID ODMo
v Demand Flows Deg. Satn Average
Delay Level of Service
95% Back of Queue Prop. Queued
Effective Stop Rate
Average Speed Total HV Vehicles Distance
veh/h % v/c sec veh m per veh km/hSouth: MNR 1 L2 120 1.7 0.093 6.4 LOS A 0.3 2.3 0.05 0.56 53.62 T1 2715 4.6 0.900 48.0 LOS D 52.0 378.1 0.94 0.90 33.83 R2 555 2.7 0.904 84.2 LOS F 22.4 160.1 1.00 0.97 25.3Approach 3390 4.2 0.904 52.4 LOS D 52.0 378.1 0.92 0.90 32.5East: Grove Way 4 L2 255 3.9 0.419 60.5 LOS E 15.0 108.4 0.82 0.91 30.45 T1 220 4.5 0.419 59.5 LOS E 15.0 108.4 0.89 0.83 30.26 R2 830 6.6 1.026 171.7 LOS F 33.9 251.1 1.00 1.35 15.9Approach 1305 5.7 1.026 131.1 LOS F 33.9 251.1 0.95 1.18 19.2North: MNR 7 L2 1280 4.7 0.705 5.8 LOS A 0.0 0.0 0.00 0.52 54.58 T1 2150 5.6 0.868 45.4 LOS D 47.8 350.7 0.95 0.89 34.69 R2 170 2.9 0.555 68.1 LOS E 11.2 80.1 0.94 0.80 28.5Approach 3600 5.1 0.868 32.4 LOS C 47.8 350.7 0.61 0.76 39.3West: Saints Rd 10 L2 370 2.7 0.201 5.7 LOS A 0.0 0.0 0.00 0.53 54.811 T1 510 2.2 1.022 157.7 LOS F 30.5 217.3 1.00 1.43 17.012 R2 90 0.0 0.400 72.5 LOS E 6.2 43.4 0.97 0.78 27.7Approach 970 2.2 1.022 91.8 LOS F 30.5 217.3 0.62 1.03 24.2All Vehicles 9265 4.6 1.026 59.8 LOS E 52.0 378.1 0.77 0.90 30.5
MOVEMENT SUMMARY Site: MNR-parks_2036 am - with dev
Main North Road / Smith Rd / Park Tce - 2036 AM Peak - with dev Signals - Fixed Time Coordinated Cycle Time = 150 seconds (User-Given Cycle Time) Movement Performance - Vehicles Mov ID ODMo
v Demand Flows Deg. Satn Average
Delay Level of Service
95% Back of Queue Prop. Queued
Effective Stop Rate
Average Speed Total HV Vehicles Distance
veh/h % v/c sec veh m per veh km/hSouth: MNR 1 L2 315 11.1 0.258 7.5 LOS A 1.8 13.5 0.09 0.57 52.52 T1 2190 6.8 1.254 518.5 LOS F 292.5 2167.9 0.98 2.94 6.33 R2 80 6.3 1.113 304.5 LOS F 13.4 98.9 1.00 1.42 10.0Approach 2585 7.4 1.254 449.6 LOS F 292.5 2167.9 0.87 2.61 7.2East: smith rd 4 L2 230 4.3 1.319 647.4 LOS F 101.3 735.9 1.00 2.43 5.25 T1 460 4.3 1.319 662.9 LOS F 101.3 735.9 1.00 2.66 5.16 R2 200 5.0 0.878 85.4 LOS F 16.0 117.1 1.00 0.97 25.0Approach 890 4.5 1.319 529.1 LOS F 101.3 735.9 1.00 2.22 6.2North: MNR 7 L2 145 0.7 0.101 6.0 LOS A 0.2 1.4 0.02 0.55 54.08 T1 2800 5.7 1.342 668.2 LOS F 409.1 3003.7 1.00 3.45 5.09 R2 220 2.3 1.277 590.3 LOS F 56.7 404.9 1.00 2.11 5.6Approach 3165 5.2 1.342 632.5 LOS F 409.1 3003.7 0.96 3.23 5.3West: park tce 10 L2 155 6.5 1.204 464.7 LOS F 62.9 460.3 1.00 2.24 7.011 T1 370 4.1 1.204 459.8 LOS F 62.9 460.3 1.00 2.21 7.112 R2 140 28.6 0.842 86.7 LOS F 11.2 97.4 1.00 0.95 24.6Approach 665 9.8 1.204 382.4 LOS F 62.9 460.3 1.00 1.95 8.3All Vehicles 7305 6.3 1.342 532.4 LOS F 409.1 3003.7 0.94 2.77 6.2

Ref No. 20150207FR01B Traffic Assessment Report Salisbury Main Roads DPA 4
MOVEMENT SUMMARY Site: MNR-parks_2036 pm - withdev
Main North Road / Smith Rd / Park Tce - 2036 PM Peak - with dev Signals - Fixed Time Coordinated Cycle Time = 150 seconds (User-Given Cycle Time) Movement Performance - Vehicles Mov ID ODMo
v Demand Flows Deg. Satn Average
Delay Level of Service
95% Back of Queue Prop. Queued
Effective Stop Rate
Average Speed Total HV Vehicles Distance
veh/h % v/c sec veh m per veh km/hSouth: MNR 1 L2 250 10.0 0.184 6.0 LOS A 0.4 2.7 0.03 0.55 53.72 T1 2700 4.8 1.437 845.2 LOS F 461.2 3361.6 0.99 3.90 4.13 R2 110 9.1 0.624 77.9 LOS E 7.9 59.5 0.99 0.80 26.1Approach 3060 5.4 1.437 749.1 LOS F 461.2 3361.6 0.91 3.52 4.5East: smith rd 4 L2 210 4.8 1.388 763.7 LOS F 85.1 624.2 1.00 2.51 4.45 T1 260 7.7 1.388 777.8 LOS F 85.1 624.2 1.00 2.64 4.46 R2 250 0.4 1.388 793.1 LOS F 67.7 499.4 1.00 2.57 4.3Approach 720 4.3 1.388 779.0 LOS F 85.1 624.2 1.00 2.58 4.4North: MNR 7 L2 185 0.0 0.140 6.3 LOS A 0.4 3.0 0.04 0.56 53.88 T1 1990 6.5 1.073 200.4 LOS F 151.2 1117.3 1.00 1.75 14.19 R2 270 1.9 1.458 915.0 LOS F 90.8 645.6 1.00 2.63 3.8Approach 2445 5.5 1.458 264.6 LOS F 151.2 1117.3 0.93 1.76 11.3West: park tce 10 L2 320 3.1 1.209 470.8 LOS F 99.2 712.6 1.00 2.09 6.911 T1 370 2.7 1.209 476.6 LOS F 99.2 712.6 1.00 2.26 6.812 R2 320 7.8 1.209 485.5 LOS F 67.5 486.3 1.00 2.04 6.7Approach 1010 4.5 1.209 477.6 LOS F 99.2 712.6 1.00 2.13 6.8All Vehicles 7235 5.2 1.458 550.4 LOS F 461.2 3361.6 0.94 2.64 6.0
MOVEMENT SUMMARY Site: MNR-parks_2036 pm - withdev - imp
Main North Road / Smith Rd / Park Tce - 2036 PM Peak - with dev - improvement Signals - Fixed Time Coordinated Cycle Time = 150 seconds (User-Given Cycle Time) Movement Performance - Vehicles Mov ID ODMo
v Demand Flows Deg. Satn Average
Delay Level of Service
95% Back of Queue Prop. Queued
Effective Stop Rate
Average Speed Total HV Vehicles Distance
veh/h % v/c sec veh m per veh km/hSouth: MNR 1 L2 250 10.0 0.172 5.9 LOS A 0.3 2.4 0.03 0.55 53.72 T1 2700 4.8 1.286 567.1 LOS F 368.5 2685.6 0.97 3.12 5.93 R2 110 9.1 1.561 1104.3 LOS F 41.2 310.8 1.00 2.47 3.1Approach 3060 5.4 1.561 540.6 LOS F 368.5 2685.6 0.89 2.88 6.1East: smith rd 4 L2 210 4.8 1.419 821.8 LOS F 86.0 630.4 1.00 2.56 4.25 T1 260 7.7 1.419 835.9 LOS F 86.0 630.4 1.00 2.73 4.16 R2 250 0.4 1.419 849.8 LOS F 72.1 533.0 1.00 2.71 4.1Approach 720 4.3 1.419 836.6 LOS F 86.0 630.4 1.00 2.68 4.1North: MNR 7 L2 185 0.0 0.133 6.0 LOS A 0.3 1.9 0.02 0.56 54.08 T1 1990 6.5 0.951 42.3 LOS D 75.8 560.4 0.84 0.90 35.59 R2 270 1.9 1.822 1575.2 LOS F 60.6 431.1 1.00 2.86 2.2Approach 2445 5.5 1.822 208.8 LOS F 75.8 560.4 0.79 1.09 13.6West: park tce 10 L2 320 3.1 1.216 482.0 LOS F 100.0 718.1 1.00 2.11 6.811 T1 370 2.7 1.216 487.7 LOS F 100.0 718.1 1.00 2.28 6.712 R2 320 7.8 1.216 496.4 LOS F 68.8 495.9 1.00 2.06 6.6Approach 1010 4.5 1.216 488.7 LOS F 100.0 718.1 1.00 2.16 6.7All Vehicles 7235 5.2 1.822 450.7 LOS F 368.5 2685.6 0.88 2.15 7.2
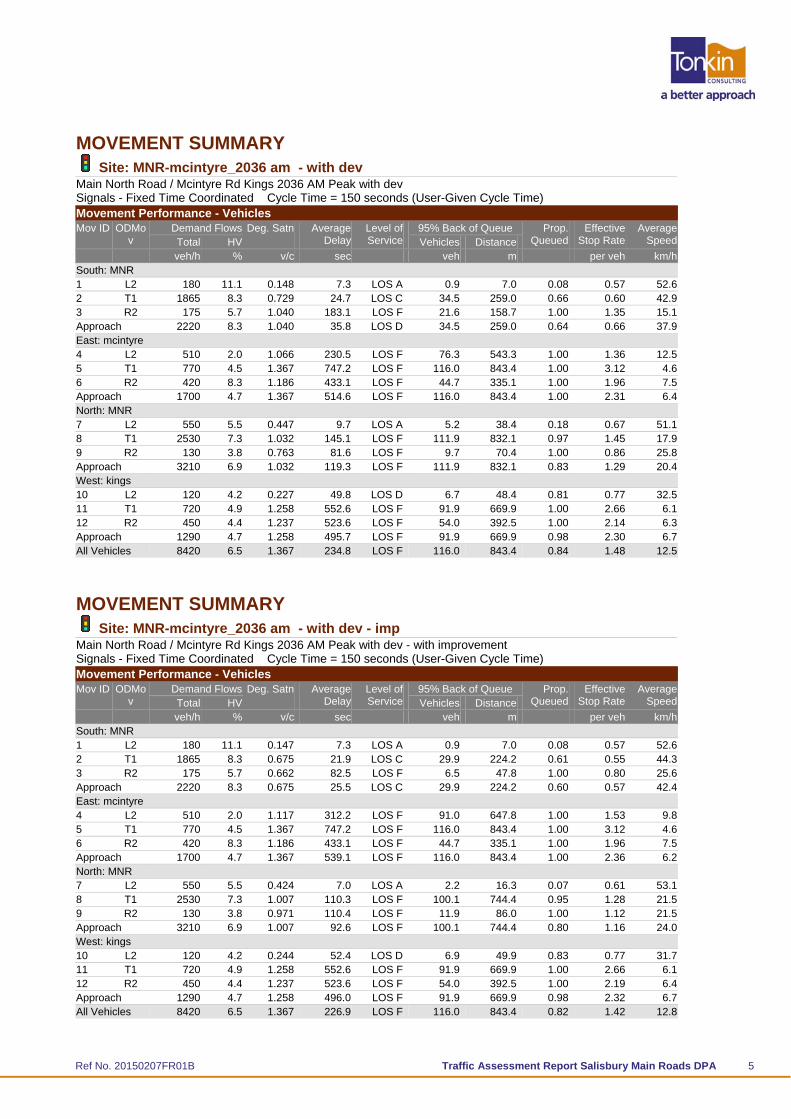
Ref No. 20150207FR01B Traffic Assessment Report Salisbury Main Roads DPA 5
MOVEMENT SUMMARY Site: MNR-mcintyre_2036 am - with dev
Main North Road / Mcintyre Rd Kings 2036 AM Peak with dev Signals - Fixed Time Coordinated Cycle Time = 150 seconds (User-Given Cycle Time) Movement Performance - Vehicles Mov ID ODMo
v Demand Flows Deg. Satn Average
Delay Level of Service
95% Back of Queue Prop. Queued
Effective Stop Rate
Average Speed Total HV Vehicles Distance
veh/h % v/c sec veh m per veh km/hSouth: MNR 1 L2 180 11.1 0.148 7.3 LOS A 0.9 7.0 0.08 0.57 52.62 T1 1865 8.3 0.729 24.7 LOS C 34.5 259.0 0.66 0.60 42.93 R2 175 5.7 1.040 183.1 LOS F 21.6 158.7 1.00 1.35 15.1Approach 2220 8.3 1.040 35.8 LOS D 34.5 259.0 0.64 0.66 37.9East: mcintyre 4 L2 510 2.0 1.066 230.5 LOS F 76.3 543.3 1.00 1.36 12.55 T1 770 4.5 1.367 747.2 LOS F 116.0 843.4 1.00 3.12 4.66 R2 420 8.3 1.186 433.1 LOS F 44.7 335.1 1.00 1.96 7.5Approach 1700 4.7 1.367 514.6 LOS F 116.0 843.4 1.00 2.31 6.4North: MNR 7 L2 550 5.5 0.447 9.7 LOS A 5.2 38.4 0.18 0.67 51.18 T1 2530 7.3 1.032 145.1 LOS F 111.9 832.1 0.97 1.45 17.99 R2 130 3.8 0.763 81.6 LOS F 9.7 70.4 1.00 0.86 25.8Approach 3210 6.9 1.032 119.3 LOS F 111.9 832.1 0.83 1.29 20.4West: kings 10 L2 120 4.2 0.227 49.8 LOS D 6.7 48.4 0.81 0.77 32.511 T1 720 4.9 1.258 552.6 LOS F 91.9 669.9 1.00 2.66 6.112 R2 450 4.4 1.237 523.6 LOS F 54.0 392.5 1.00 2.14 6.3Approach 1290 4.7 1.258 495.7 LOS F 91.9 669.9 0.98 2.30 6.7All Vehicles 8420 6.5 1.367 234.8 LOS F 116.0 843.4 0.84 1.48 12.5
MOVEMENT SUMMARY Site: MNR-mcintyre_2036 am - with dev - imp
Main North Road / Mcintyre Rd Kings 2036 AM Peak with dev - with improvement Signals - Fixed Time Coordinated Cycle Time = 150 seconds (User-Given Cycle Time) Movement Performance - Vehicles Mov ID ODMo
v Demand Flows Deg. Satn Average
Delay Level of Service
95% Back of Queue Prop. Queued
Effective Stop Rate
Average Speed Total HV Vehicles Distance
veh/h % v/c sec veh m per veh km/hSouth: MNR 1 L2 180 11.1 0.147 7.3 LOS A 0.9 7.0 0.08 0.57 52.62 T1 1865 8.3 0.675 21.9 LOS C 29.9 224.2 0.61 0.55 44.33 R2 175 5.7 0.662 82.5 LOS F 6.5 47.8 1.00 0.80 25.6Approach 2220 8.3 0.675 25.5 LOS C 29.9 224.2 0.60 0.57 42.4East: mcintyre 4 L2 510 2.0 1.117 312.2 LOS F 91.0 647.8 1.00 1.53 9.85 T1 770 4.5 1.367 747.2 LOS F 116.0 843.4 1.00 3.12 4.66 R2 420 8.3 1.186 433.1 LOS F 44.7 335.1 1.00 1.96 7.5Approach 1700 4.7 1.367 539.1 LOS F 116.0 843.4 1.00 2.36 6.2North: MNR 7 L2 550 5.5 0.424 7.0 LOS A 2.2 16.3 0.07 0.61 53.18 T1 2530 7.3 1.007 110.3 LOS F 100.1 744.4 0.95 1.28 21.59 R2 130 3.8 0.971 110.4 LOS F 11.9 86.0 1.00 1.12 21.5Approach 3210 6.9 1.007 92.6 LOS F 100.1 744.4 0.80 1.16 24.0West: kings 10 L2 120 4.2 0.244 52.4 LOS D 6.9 49.9 0.83 0.77 31.711 T1 720 4.9 1.258 552.6 LOS F 91.9 669.9 1.00 2.66 6.112 R2 450 4.4 1.237 523.6 LOS F 54.0 392.5 1.00 2.19 6.4Approach 1290 4.7 1.258 496.0 LOS F 91.9 669.9 0.98 2.32 6.7All Vehicles 8420 6.5 1.367 226.9 LOS F 116.0 843.4 0.82 1.42 12.8

Ref No. 20150207FR01B Traffic Assessment Report Salisbury Main Roads DPA 6
MOVEMENT SUMMARY Site: MNR-mcintyre_2036 pm - withdev
Main North Road / Mcintyre Rd Kings - 2036 PM Peak - with dev Signals - Fixed Time Coordinated Cycle Time = 150 seconds (User-Given Cycle Time) Movement Performance - Vehicles Mov ID ODMo
v Demand Flows Deg. Satn Average
Delay Level of Service
95% Back of Queue Prop. Queued
Effective Stop Rate
Average Speed Total HV Vehicles Distance
veh/h % v/c sec veh m per veh km/hSouth: MNR 1 L2 260 3.8 0.211 8.7 LOS A 2.2 16.2 0.15 0.59 51.82 T1 2160 6.7 0.934 51.0 LOS D 64.0 474.0 0.85 0.90 32.93 R2 550 0.9 1.295 635.7 LOS F 146.6 1033.9 1.00 2.34 5.3Approach 2970 5.4 1.295 155.6 LOS F 146.6 1033.9 0.81 1.14 17.0East: mcintyre 4 L2 170 2.9 0.204 19.3 LOS B 4.4 31.8 0.64 0.73 44.55 T1 740 4.7 1.029 166.0 LOS F 45.6 332.2 1.00 1.54 16.36 R2 740 4.1 1.130 333.9 LOS F 67.6 489.8 1.00 1.73 9.4Approach 1650 4.2 1.130 226.2 LOS F 67.6 489.8 0.96 1.54 12.9North: MNR 7 L2 410 6.1 0.456 26.1 LOS C 12.5 92.4 0.52 0.82 41.68 T1 1980 6.8 1.315 649.4 LOS F 198.1 1467.5 1.00 3.28 5.29 R2 150 3.3 0.950 100.6 LOS F 13.0 93.5 1.00 1.07 22.8Approach 2540 6.5 1.315 516.4 LOS F 198.1 1467.5 0.92 2.75 6.4West: kings 10 L2 170 2.9 0.343 53.8 LOS D 10.0 72.1 0.86 0.79 31.411 T1 840 2.4 1.338 695.0 LOS F 121.6 868.5 1.00 3.07 4.912 R2 430 2.3 0.792 77.8 LOS E 16.1 114.8 1.00 0.89 26.5Approach 1440 2.4 1.338 435.0 LOS F 121.6 868.5 0.98 2.15 7.5All Vehicles 8600 5.0 1.338 322.5 LOS F 198.1 1467.5 0.90 1.86 9.6
MOVEMENT SUMMARY Site: MNR-mcintyre_2036 pm - withdev - imp
Main North Road / Mcintyre Rd Kings 2036 PM Peak - with dev – with improvement Signals - Fixed Time Coordinated Cycle Time = 150 seconds (User-Given Cycle Time)Variable Movement Performance - Vehicles Mov ID ODMo
v Demand Flows Deg. Satn Average
Delay Level of Service
95% Back of Queue Prop. Queued
Effective Stop Rate
Average Speed Total HV Vehicles Distance
veh/h % v/c sec veh m per veh km/hSouth: MNR 1 L2 260 3.8 0.213 8.7 LOS A 2.2 16.2 0.15 0.59 51.82 T1 2160 6.7 0.882 40.4 LOS D 53.9 399.2 0.85 0.82 36.33 R2 550 0.9 0.893 82.7 LOS F 21.7 153.0 1.00 0.95 25.6Approach 2970 5.4 0.893 45.4 LOS D 53.9 399.2 0.82 0.82 34.5East: mcintyre 4 L2 170 2.9 0.283 28.1 LOS C 6.2 44.4 0.78 0.77 40.25 T1 740 4.7 0.990 120.4 LOS F 38.6 281.4 1.00 1.34 20.56 R2 740 4.1 1.130 333.9 LOS F 67.6 489.8 1.00 1.73 9.4Approach 1650 4.2 1.130 206.6 LOS F 67.6 489.8 0.98 1.46 13.8North: MNR 7 L2 410 6.1 0.357 11.3 LOS B 5.6 41.3 0.23 0.65 50.08 T1 1980 6.8 0.908 53.4 LOS D 54.6 404.2 0.91 0.91 32.29 R2 150 3.3 0.877 87.6 LOS F 11.9 85.4 1.00 0.94 24.8Approach 2540 6.5 0.908 48.6 LOS D 54.6 404.2 0.81 0.87 33.5West: kings 10 L2 170 2.9 0.327 52.0 LOS D 9.8 70.7 0.84 0.79 31.911 T1 840 2.4 1.284 599.5 LOS F 110.6 789.8 1.00 2.86 5.612 R2 430 2.3 0.792 77.8 LOS E 16.1 114.8 1.00 0.89 26.6Approach 1440 2.4 1.284 379.1 LOS F 110.6 789.8 0.98 2.03 8.4All Vehicles 8600 5.0 1.284 133.2 LOS F 110.6 789.8 0.87 1.16 19.0

Ref No. 20150207FR01B Traffic Assessment Report Salisbury Main Roads DPA 7
MOVEMENT SUMMARY Site: MNR-Kesters am 2036 - with dev
Main North Road Kesters - with para access signals - 2036 AM Peak with dev Signals - Fixed Time Isolated Cycle Time = 150 seconds (Practical Cycle Time) Movement Performance - Vehicles Mov ID ODMo
v Demand Flows Deg. Satn Average
Delay Level of Service
95% Back of Queue Prop. Queued
Effective Stop Rate
Average Speed Total HV Vehicles Distance
veh/h % v/c sec veh m per veh km/hSouth: MNR 1 L2 90 11.1 0.064 6.3 LOS A 0.5 3.5 0.13 0.58 53.42 T1 2080 8.4 0.901 54.2 LOS D 55.3 414.7 0.98 0.99 31.93 R2 180 11.1 0.866 87.1 LOS F 14.1 107.9 1.00 0.92 24.6Approach 2350 8.7 0.901 54.9 LOS D 55.3 414.7 0.95 0.97 31.6East: Kesters 4 L2 230 13.0 0.134 5.8 LOS A 0.0 0.0 0.00 0.52 54.35 T1 40 0.0 0.895 86.7 LOS F 8.3 60.9 1.00 1.02 24.56 R2 160 9.4 0.895 92.7 LOS F 8.3 60.9 1.00 1.03 24.0Approach 430 10.5 0.895 45.6 LOS D 8.3 60.9 0.46 0.76 34.3North: MNR 7 L2 170 8.8 0.105 6.7 LOS A 1.4 10.3 0.16 0.59 53.28 T1 3040 6.4 0.908 32.8 LOS C 72.3 534.2 0.90 0.89 39.19 R2 80 0.0 0.071 40.9 LOS D 2.1 14.5 0.71 0.70 35.9Approach 3290 6.4 0.908 31.6 LOS C 72.3 534.2 0.85 0.87 39.6West: para access 10 L2 50 0.0 0.027 5.6 LOS A 0.0 0.0 0.00 0.53 54.911 T1 10 0.0 0.128 78.6 LOS E 0.7 5.2 0.99 0.67 26.512 R2 20 0.0 0.135 84.5 LOS F 0.7 5.2 0.99 0.67 25.2Approach 80 0.0 0.135 34.5 LOS C 0.7 5.2 0.37 0.58 38.5All Vehicles 6150 7.5 0.908 41.6 LOS D 72.3 534.2 0.86 0.90 35.7
MOVEMENT SUMMARY Site: MNR-Kesters pm 2036 - withdev
Main North Road Kesters - with para access signals - 2036 PM Peak with dev Signals - Fixed Time Isolated Cycle Time = 140 seconds (Practical Cycle Time) Movement Performance - Vehicles Mov ID ODMo
v Demand Flows Deg. Satn Average
Delay Level of Service
95% Back of Queue Prop. Queued
Effective Stop Rate
Average Speed Total HV Vehicles Distance
veh/h % v/c sec veh m per veh km/hSouth: MNR 1 L2 220 0.0 0.155 8.1 LOS A 2.7 19.1 0.27 0.63 52.32 T1 2650 5.7 0.896 35.9 LOS D 63.0 462.4 0.89 0.89 37.93 R2 480 4.2 0.904 76.0 LOS E 35.7 258.7 1.00 0.96 26.6Approach 3350 5.1 0.904 39.8 LOS D 63.0 462.4 0.87 0.88 36.3East: Kesters 4 L2 290 3.4 0.158 5.7 LOS A 0.0 0.0 0.00 0.53 54.85 T1 40 0.0 0.904 78.5 LOS E 12.7 91.0 0.96 1.06 25.76 R2 290 3.4 0.904 84.3 LOS F 12.7 91.0 0.96 1.05 25.4Approach 620 3.2 0.904 47.1 LOS D 12.7 91.0 0.51 0.81 34.0North: MNR 7 L2 225 2.7 0.158 10.2 LOS B 4.0 28.3 0.33 0.64 50.78 T1 2010 7.2 0.902 52.6 LOS D 52.7 391.6 0.97 1.00 32.39 R2 140 0.0 0.490 67.2 LOS E 4.9 34.3 1.00 0.81 28.6Approach 2375 6.4 0.902 49.5 LOS D 52.7 391.6 0.91 0.95 33.2West: para access 10 L2 280 0.0 0.151 5.6 LOS A 0.0 0.0 0.00 0.53 54.911 T1 60 0.0 0.615 75.0 LOS E 4.3 30.1 1.00 0.78 27.212 R2 150 0.0 0.808 84.9 LOS F 5.6 39.2 1.00 0.89 25.1Approach 490 0.0 0.808 38.4 LOS D 5.6 39.2 0.43 0.67 36.9All Vehicles 6835 5.0 0.904 43.7 LOS D 63.0 462.4 0.82 0.89 35.0

Ref No. 20150207FR01B Traffic Assessment Report Salisbury Main Roads DPA 8
MOVEMENT SUMMARY Site: MNR-eldersmith_2036 am - with dev
Main North Road /eldersmith / Maxwell - 2036 AM Peak - with development Signals - Fixed Time Coordinated Cycle Time = 150 seconds (User-Given Cycle Time) Movement Performance - Vehicles Mov ID ODMo
v Demand Flows Deg. Satn Average
Delay Level of Service
95% Back of Queue Prop. Queued
Effective Stop Rate
Average Speed Total HV Vehicles Distance
veh/h % v/c sec veh m per veh km/hSouth: MNR 1 L2 90 22.2 0.092 10.2 LOS B 1.0 8.1 0.18 0.59 50.22 T1 1670 9.0 0.819 44.6 LOS D 38.1 287.2 0.89 0.81 34.83 R2 160 25.0 1.076 242.2 LOS F 23.4 199.1 1.00 1.48 12.1Approach 1920 10.9 1.076 59.5 LOS E 38.1 287.2 0.87 0.86 30.5East: maxwell 4 L2 160 3.1 0.273 44.2 LOS D 8.6 61.9 0.78 0.74 34.65 T1 450 5.6 1.018 154.0 LOS F 26.1 191.3 1.00 1.41 17.36 R2 170 17.6 0.850 85.3 LOS F 13.5 109.0 1.00 0.96 25.2Approach 780 7.7 1.018 116.5 LOS F 26.1 191.3 0.96 1.17 20.9North: MNR 7 L2 160 18.8 0.134 6.4 LOS A 0.4 2.9 0.04 0.55 53.18 T1 2470 6.9 1.050 175.2 LOS F 119.1 883.0 0.95 1.56 15.69 R2 650 3.8 0.809 68.7 LOS E 23.0 166.2 0.99 0.89 28.4Approach 3280 6.9 1.050 145.9 LOS F 119.1 883.0 0.91 1.38 17.8West: elder smith 10 L2 500 4.0 0.265 5.7 LOS A 0.0 0.0 0.00 0.53 54.811 T1 350 5.7 0.778 74.1 LOS E 13.4 98.2 1.00 0.89 27.512 R2 230 8.7 1.085 260.3 LOS F 35.7 268.2 1.00 1.57 11.5Approach 1080 5.6 1.085 82.1 LOS F 35.7 268.2 0.54 0.87 25.8All Vehicles 7060 7.9 1.085 109.4 LOS F 119.1 883.0 0.85 1.13 21.6
MOVEMENT SUMMARY Site: MNR-eldersmith_2036 pm - with dev
Main North Road /eldersmith / Maxwell - 2036 PM Peak with development Signals - Fixed Time Coordinated Cycle Time = 150 seconds (User-Given Cycle Time) Movement Performance - Vehicles Mov ID ODMo
v Demand Flows Deg. Satn Average
Delay Level of Service
95% Back of Queue Prop. Queued
Effective Stop Rate
Average Speed Total HV Vehicles Distance
veh/h % v/c sec veh m per veh km/hSouth: MNR 1 L2 110 9.1 0.092 7.8 LOS A 0.7 5.1 0.11 0.57 52.32 T1 2440 5.7 0.973 72.2 LOS E 75.9 557.3 0.96 1.11 27.63 R2 40 12.5 0.580 88.2 LOS F 3.1 24.0 1.00 0.75 24.5Approach 2590 6.0 0.973 69.7 LOS E 75.9 557.3 0.92 1.08 28.1East: maxwell 4 L2 120 4.2 0.174 14.0 LOS B 3.1 22.5 0.42 0.67 48.25 T1 380 2.6 0.844 78.1 LOS E 14.8 106.3 1.00 0.95 26.76 R2 200 12.5 0.967 115.7 LOS F 19.4 150.2 1.00 1.18 20.9Approach 700 5.7 0.967 77.8 LOS E 19.4 150.2 0.90 0.97 26.6North: MNR 7 L2 130 23.1 0.103 6.2 LOS A 0.2 1.4 0.02 0.55 53.28 T1 1845 6.0 0.559 18.8 LOS B 22.0 162.2 0.54 0.49 45.99 R2 475 3.2 0.924 90.6 LOS F 19.8 142.6 1.00 1.01 24.2Approach 2450 6.3 0.924 32.1 LOS C 22.0 162.2 0.60 0.59 39.4West: elder smith 10 L2 715 1.4 0.371 5.7 LOS A 0.0 0.0 0.00 0.53 54.811 T1 420 2.4 0.931 91.9 LOS F 18.2 130.3 1.00 1.11 24.312 R2 170 5.9 0.787 80.0 LOS F 12.9 94.7 1.00 0.89 26.0Approach 1305 2.3 0.931 43.1 LOS D 18.2 130.3 0.45 0.76 35.4All Vehicles 7045 5.4 0.973 52.5 LOS D 75.9 557.3 0.72 0.84 32.4

Ref No. 20150207FR01B Traffic Assessment Report Salisbury Main Roads DPA 9
MOVEMENT SUMMARY Site: salisbury-eldersmith_2036 am - with dev
Salisbury Hwy /eldersmith - 2036 AM Peak with dev Signals - Fixed Time Coordinated Cycle Time = 150 seconds (User-Given Cycle Time) Movement Performance - Vehicles Mov ID ODMo
v Demand Flows Deg. Satn Average
Delay Level of Service
95% Back of Queue Prop. Queued
Effective Stop Rate
Average Speed Total HV Vehicles Distance
veh/h % v/c sec veh m per veh km/hSouth: salisbury 1 L2 150 20.0 0.112 6.1 LOS A 0.2 1.6 0.02 0.55 53.32 T1 1320 14.0 0.686 17.2 LOS B 28.0 219.5 0.55 0.50 47.03 R2 460 10.9 0.991 124.4 LOS F 23.3 177.9 1.00 1.17 19.8Approach 1930 13.7 0.991 41.9 LOS D 28.0 219.5 0.62 0.66 35.7East: eldersmith 4 L2 970 6.2 1.317 642.9 LOS F 268.8 1981.3 1.00 2.34 5.25 T1 350 1.4 0.936 94.5 LOS F 15.3 108.3 1.00 1.11 23.86 R2 330 9.1 1.003 144.6 LOS F 17.9 135.3 1.00 1.30 18.0Approach 1650 5.8 1.317 426.9 LOS F 268.8 1981.3 1.00 1.87 7.6North: salisbury hwy 7 L2 410 7.3 0.364 10.4 LOS B 5.4 40.4 0.22 0.62 50.58 T1 2100 9.8 0.976 67.3 LOS E 79.3 601.6 0.85 1.01 28.79 R2 40 12.5 0.290 86.2 LOS F 1.5 11.7 0.99 0.70 24.9Approach 2550 9.4 0.976 58.5 LOS E 79.3 601.6 0.75 0.94 30.8West: elder smith 10 L2 80 6.3 0.078 15.5 LOS B 2.0 15.1 0.43 0.66 47.211 T1 570 2.6 1.138 348.0 LOS F 56.1 401.3 1.00 2.00 9.112 R2 190 15.8 0.422 71.3 LOS E 6.5 51.8 0.96 0.78 27.7Approach 840 6.0 1.138 253.8 LOS F 56.1 401.3 0.94 1.60 11.8All Vehicles 6970 9.3 1.317 164.6 LOS F 268.8 1981.3 0.80 1.16 16.3
MOVEMENT SUMMARY Site: salisbury-eldersmith_2036 pm - with dev
Salisbury Hwy /eldersmith - 2036 PM Peak - with dev Signals - Fixed Time Coordinated Cycle Time = 150 seconds (User-Given Cycle Time) Movement Performance - Vehicles Mov ID ODMo
v Demand Flows Deg. Satn Average
Delay Level of Service
95% Back of Queue Prop. Queued
Effective Stop Rate
Average Speed Total HV Vehicles Distance
veh/h % v/c sec veh m per veh km/hSouth: salisbury 1 L2 260 7.7 0.183 6.0 LOS A 0.4 2.8 0.03 0.55 53.82 T1 2355 4.5 1.108 248.5 LOS F 184.4 1339.9 0.80 1.81 11.93 R2 890 5.1 0.752 52.2 LOS D 27.2 198.5 0.90 0.85 32.4Approach 3505 4.9 1.108 180.7 LOS F 184.4 1339.9 0.77 1.47 15.3East: eldersmith 4 L2 480 10.4 0.412 14.6 LOS B 13.4 102.4 0.49 0.71 47.75 T1 555 0.9 1.285 601.3 LOS F 72.9 514.6 1.00 2.54 5.66 R2 410 6.1 1.140 353.3 LOS F 38.3 282.0 1.00 1.82 9.0Approach 1445 5.5 1.285 336.1 LOS F 72.9 514.6 0.83 1.73 9.3North: salisbury hwy 7 L2 350 7.1 0.330 11.2 LOS B 5.0 37.3 0.23 0.62 50.08 T1 1320 7.6 0.743 46.6 LOS D 30.5 227.7 0.87 0.76 34.29 R2 50 0.0 0.333 86.0 LOS F 1.9 13.2 1.00 0.71 25.0Approach 1720 7.3 0.743 40.5 LOS D 30.5 227.7 0.74 0.73 36.1West: elder smith 10 L2 120 4.2 0.325 55.3 LOS E 7.2 52.3 0.90 0.77 31.3

Ref No. 20150207FR01B Traffic Assessment Report Salisbury Main Roads DPA 10
11 T1 465 1.1 1.393 799.5 LOS F 74.7 528.0 1.00 2.72 4.312 R2 185 5.4 0.640 81.2 LOS F 6.9 50.4 1.00 0.80 25.8Approach 770 2.6 1.393 511.0 LOS F 74.7 528.0 0.98 1.96 6.5All Vehicles 7440 5.3 1.393 212.6 LOS F 184.4 1339.9 0.80 1.40 13.5
MOVEMENT SUMMARY Site: salisbury-eldersmith_2036 pm - with dev - imp
Salisbury Hwy /eldersmith - 2036 PM Peak - with dev with improvement Signals - Fixed Time Coordinated Cycle Time = 150 seconds (User-Given Cycle Time) Movement Performance - Vehicles Mov ID ODMo
v Demand Flows Deg. Satn Average
Delay Level of Service
95% Back of Queue Prop. Queued
Effective Stop Rate
Average Speed Total HV Vehicles Distance
veh/h % v/c sec veh m per veh km/hSouth: salisbury 1 L2 260 7.7 0.189 6.0 LOS A 0.4 2.9 0.03 0.55 53.72 T1 2355 4.5 0.849 23.3 LOS C 49.7 361.3 0.70 0.65 43.63 R2 890 5.1 0.923 78.1 LOS E 35.9 261.8 1.00 0.99 26.4Approach 3505 4.9 0.923 35.9 LOS D 49.7 361.3 0.73 0.73 37.9East: eldersmith 4 L2 480 10.4 0.411 16.6 LOS B 14.8 112.7 0.53 0.73 46.45 T1 555 0.9 0.688 61.5 LOS E 19.0 134.1 0.99 0.83 30.26 R2 410 6.1 0.900 90.6 LOS F 17.1 125.9 1.00 1.01 24.3Approach 1445 5.5 0.900 54.8 LOS D 19.0 134.1 0.84 0.85 31.7North: salisbury hwy 7 L2 350 7.1 0.370 16.3 LOS B 8.1 59.9 0.37 0.67 46.78 T1 1320 7.6 0.899 63.5 LOS E 37.5 279.5 0.96 0.95 29.69 R2 50 0.0 0.333 86.0 LOS F 1.9 13.2 1.00 0.71 25.1Approach 1720 7.3 0.899 54.5 LOS D 37.5 279.5 0.84 0.89 31.8West: elder smith 10 L2 120 4.2 0.181 23.5 LOS C 4.4 31.6 0.58 0.71 42.911 T1 465 1.1 0.922 86.5 LOS F 22.6 159.4 1.00 1.09 25.112 R2 185 5.4 0.640 81.2 LOS F 6.9 50.4 1.00 0.80 25.9Approach 770 2.6 0.922 75.4 LOS E 22.6 159.4 0.93 0.96 27.0All Vehicles 7440 5.3 0.923 48.0 LOS D 49.7 361.3 0.80 0.81 33.7