Tradedoubler Annual Report 2015
49
Helping digital marketers succeed by creating smarter results Annual report 2015 www.tradedoubler.com
Transcript of Tradedoubler Annual Report 2015

Helping digital marketers succeedby creating smarter results
Annual report 2015
www.tradedoubler.com

Dear reader,
Contents
BOARD OF DIRECTORS’ REPORT 4
RISKS AND UNCERTAINTY FACTORS 8
CORPORATE GOVERNANCE 9
FINANCIAL INFORMATION
CONSOLIDATED ACCOUNTS 15
NOTES TO THE CONSOLIDATED ACCOUNTS 19
PARENT COMPANY ACCOUNTS 35
NOTES TO THE PARENT COMPANY ACCOUNTS 39
BOARD AND CEO’S SIGNATURES 44
AUDITOR´S REPORT 45
BOARD OF DIRECTORS 46
COMPANY MANAGEMENT 47
DEFINITIONS 48
A print version of the annual report may be ordered from:
Tradedoubler ABBirger Jarlsgatan 57A
113 56 StockholmTel. +46 8 40 50 800
E-mail: [email protected]
Tradedoubler’s business is online and therefore we think the website is the natural focus for our financial communication. Our ambition is to offer shareholders and other investors an effective and easily accessible way of reading up-to-date and relevant information on: www.tradedoubler.com.
The information in the annual report
TradeDoubler AB (publ), 556575-7423, is a Swedish public limited liability company with its registered office in Stockholm. The company is subject to Swedish laws and as a listed company is obliged to comply with NASDAQ Stockholm’s rules and regulations which govern information disclosure to the market.
All values are stated in Swedish kronor. Kronor expressed in millions is abbreviated to SEK M and kronor expressed in thousands is abbreviated to SEK ’000. Numerical data in brackets refers to 2014 unless otherwise stated. Infor-mation about markets and the competitive situation is Tradedoubler’s own assessment, unless a specific source is provided. You can subscribe to press releases and financial reports on Tradedoubler’s website.
The Annual Report is prepared in Swedish and translated into English. Should differences occur between the Swedish Annual Report and the English translation, the Swedish version shall prevail.
Financial calendar
Interim report January-March 2016 3 May 2016
Annual general meeting 3 May 2016
Interim report January-June 2016 22 July 2016
Interim report January-September 2016 11 November 2016
Year-end report 2016 3 February 2017
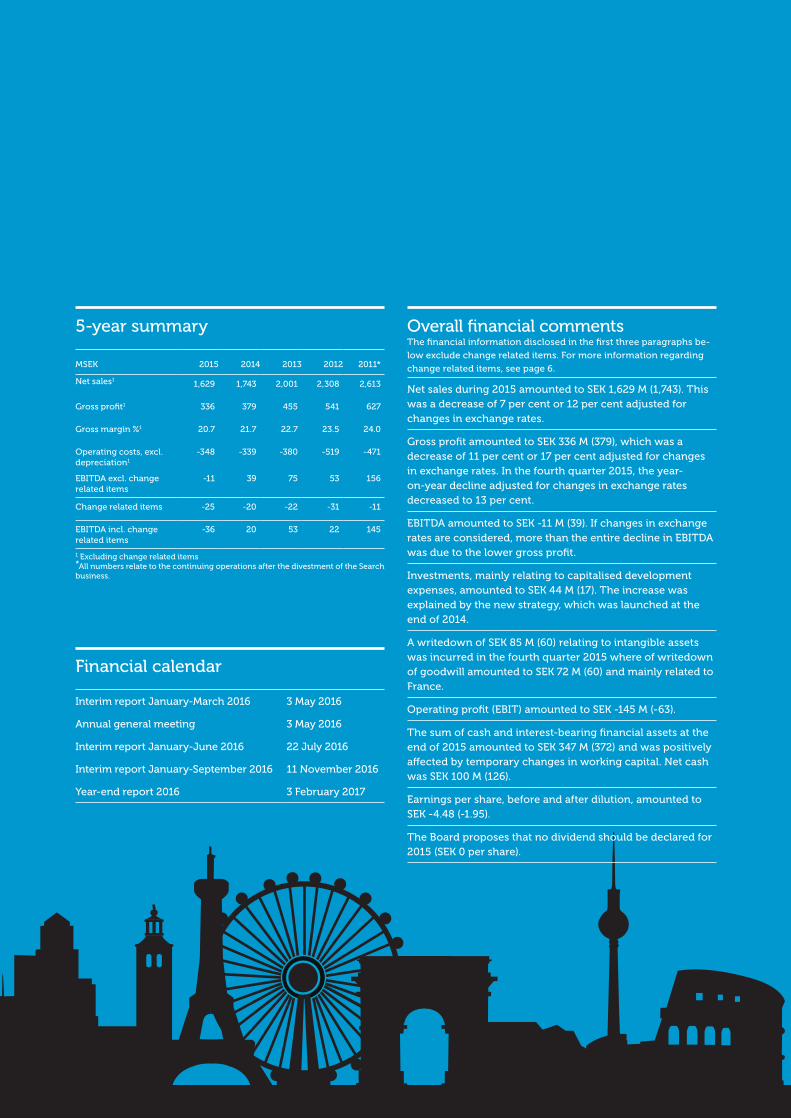
5-year summary
MSEK 2015 2014 2013 2012 2011*
Net sales11,629 1,743 2,001 2,308 2,613
Gross profit1 336 379 455 541 627
Gross margin %1 20.7 21.7 22.7 23.5 24.0
Operating costs, excl. depreciation1
-348 -339 -380 -519 -471
EBITDA excl. change related items
-11 39 75 53 156
Change related items -25 -20 -22 -31 -11
EBITDA incl. change related items
-36 20 53 22 145
1 Excluding change related items*All numbers relate to the continuing operations after the divestment of the Search business.
Overall financial comments The financial information disclosed in the first three paragraphs be-
low exclude change related items. For more information regarding
change related items, see page 6.
Net sales during 2015 amounted to SEK 1,629 M (1,743). This was a decrease of 7 per cent or 12 per cent adjusted for changes in exchange rates.
Gross profit amounted to SEK 336 M (379), which was a decrease of 11 per cent or 17 per cent adjusted for changes in exchange rates. In the fourth quarter 2015, the year-on-year decline adjusted for changes in exchange rates decreased to 13 per cent.
EBITDA amounted to SEK -11 M (39). If changes in exchange rates are considered, more than the entire decline in EBITDA was due to the lower gross profit.
Investments, mainly relating to capitalised development expenses, amounted to SEK 44 M (17). The increase was explained by the new strategy, which was launched at the end of 2014.
A writedown of SEK 85 M (60) relating to intangible assets was incurred in the fourth quarter 2015 where of writedown of goodwill amounted to SEK 72 M (60) and mainly related to France.
Operating profit (EBIT) amounted to SEK -145 M (-63).
The sum of cash and interest-bearing financial assets at the end of 2015 amounted to SEK 347 M (372) and was positively affected by temporary changes in working capital. Net cash was SEK 100 M (126).
Earnings per share, before and after dilution, amounted to SEK -4.48 (-1.95).
The Board proposes that no dividend should be declared for 2015 (SEK 0 per share).

Tradedoubler Annual Report 20154
Tradedoublers operations Tradedoubler is an international performance marketing company, creating smarter results for its clients through traffic, technology and expertise. It works with more than 2,000 advertisers through its network of around 180,000 publishers in over 60 countries. In 2015 it generated SEK 21bn incremental revenue for its clients through e-commerce and m-commerce.
Tradedoubler’s business strategy
Tradedoubler operates within the dynamic environment of digital and mobile commerce, which is characterised by positive trends in both consumer and advertising expenditure. The digital marketing sector in Europe is changing rapidly. Channels such as social media, video and mobile are expan-ding their market share and advertising is increasingly traded on an automated basis. At the same time, growth within tradi-tional affiliate marketing is declining.
Tradedoubler’s aim is to address a larger part of the digital marketplace with a significantly expanded and integrated Per-formance Marketing offering across all major digital channels.
During the second half of 2015 Tradedoubler launched a beta version of its broader offering in selected markets. This new solution uses data-driven insight to deliver targeted, personali-sed advertising to the customers of Tradedoubler’s clients.
Tradedoubler estimates that, from a gross profit potential, its addressable market, including private networks, will increase more than five-fold from some 3 billion SEK per year. This larger addressable market includes the current affiliate marketing busi-ness and additional branding and performance display marke-ting budgets. Tradedoubler already handles significant amounts of data through its advanced technology platform and works closely with many leading advertisers and publishers in Europe. Hence, the company is well positioned to take a significantly larger share of existing customers’ advertising expenditure.
Tradedoubler’s ultimate aim is to help digital marketers succeed by creating smarter results through traffic, techno-logy and expertise.
What Tradedoubler doesTradedoubler helps digital marketers succeed and is expan-ding its range of solutions that allow its clients to optimise their digital marketing activity.
Tradedoubler’s affiliate marketing offering is a risk-free solu-tion for its customers where payment is based on the delivery of agreed results, usually sales or leads.
Tradedoubler’s white label technology offering allows adver-tisers and agencies to track and manage all digital marketing activity in house.
Tradedoubler’s new expanded performance marketing offering uses a powerful combination of data and artificial intelligence to find new customers for its clients businesses. Tradedoubler began testing this offering in Germany and the UK with positive results.
During the second quarter of 2016 Tradedoubler will re-launch its affiliate and technology solutions and will offici-ally launch its new customer solution.
Tradedoubler is expanding its portfolio of solutions and is committed to invest in the development of new products that meet the needs of its clients. This means is well positio-ned to take a significantly larger share of existing customers’ advertising expenditure.
Significant events during the yearIn January 2015 Tradedoubler acquired the German techno-logy company Adnologies and finalised its Nordic regional structure closing its office in Norway. Both these events had limited effect on results and cash flow.
In March 2015 the media company Reworld Media S.A., headquartered in Paris (France) acquired 19.1% of Tradedoubler’s shares. In December 2015 Reworld Media S.A. agreed to acquire additional shares from Henrik Kvick AB and following this aquisition Reworld owns 29.95% of Tradedoubler.
In the second half of 2015, Tradedoubler launched a number of new offerings including User Journey Reporting, Finger-print Tracking and Cookieless Tracking. In addition Trade-doubler also launched the first version of its new extended performance-based marketing offer in Germany and the UK.
The decrease in gross profit declined during the fourth quarter. Excluding a major international client, that left Tradedoubler during 2015, the underlying gross profit within Tradedoubler’s core business increased in several markets.
In December 2015 Tradedoubler announced that, as a part of ongoing efficiency improvements, it would reduce per-manent staff by around 10 employees. The one off cost of approximately 10 MSEK related to this restructure was taken in the fourth quarter.
Tomas Ljunglöf, CFO of Tradedoubler, resigned in Decem-ber 2015 and will leave the company after the AGM in May. Viktor Wågström, presently accounting and group accoun-ting manager, will be interim CFO.
At the end of 2015 Tradedoubler’s staff corresponded to 408 (377) full-time equivalents. The increase was primarily due to the hiring of more developers in line with strategy.
Board of Directors’ ReportThe board of directors and the chief executive officer of TradeDoubler AB (publ), corporate registration number 556575-7423, hereby submit the annual accounts for the operations in the parent company and the group for the financial year 2015.
Board of Directors’ Report

Tradedoubler Annual Report 2015 5
Board of Directors’ Report
Tradedoubler’s current positionTradedoubler made significant progress during 2015. Orga-nisational changes included greater central control and the development of best practices in account management and sales. In January 2016, as part of a focus on efficiency, the structure and responsibilities of the group management team were revised and around ten employees, mainly from middle management and other administrative roles, as com-municated in December 2015, left the company.
Group resultsIf not explicitly stated, the disclosed financial information refers to
reported numbers not adjusted for change related items nor changes
in exchange rates. For comparability reasons and to indicate the
underlying performance, Tradedoubler adjust for change related
items. For more information see page 6.
Consolidated net sales during 2015 were SEK 1,624 M (1,733). Excluding change related items net sales amounted to SEK 1,629 M (1,743), which was a decline of 7 per cent or 12 per cent adjusted for changes in exchange rates.
Gross profit during 2015 was SEK 332 M (377). Excluding change related items, gross profit amounted to SEK 336 M (379). This was a decline of 11 per cent or 17 per cent adjusted for changes in exchange rates. In the fourth quarter 2015, the currency adjusted decrease, compared to the same period last year, declined to 13 per cent. Excluding a major international client, that during 2015 left Tradedoubler, the underlying gross profit within Tradedoubler’s core business increased in several markets.
Gross margin, excluding change related items, was 20.7 per cent (21.7) during 2015. The decrease was mainly due to price pressure within affiliate. During the fourth quarter the gross margin, excluding change related items, was 21.2 per cent (20.8) and the increase was mainly explained by a reduction of low margin revenues.
Operating costs, excluding depreciation, amounted to SEK 368 M (357) in 2015. Change related costs were SEK 20 M (18),
for more information see Note C25. Excluding change related items and depreciation, operating costs were SEK 348 M (339). This was an increase of 3 per cent or an increase with 2 per cent adjusted for changes in exchange rates. While costs in local markets have been reduced, in other areas they have increased. This includes running costs following the acquisi-tion of Adnologies and increased costs for Products & IT.
Operating profit before depreciation and amortisation (EBITDA) during 2015 was SEK -36 M (20). Adjusted for change related items, EBITDA was SEK -11 M (39). If changes in exchange rates are considered, more than the entire decline in EBITDA was due to the lower gross profit.
Depreciation and amortisation was SEK 109 M (83) during 2015 and included writedowns of goodwill of SEK 72 M (60) and other intangible assets of SEK 13 M (0). The goodwill writedown predominately related to the cash generating unit France & Benelux. The writedown can mainly be explai-ned by the poor developments in this segment during 2015, a related revised future growth potential in current business and thus a reduction of potential upsell opportunity with regards to new offers. After this writedown goodwill amoun-ted to SEK 246 M (324) at year-end 2015. The writedown of other intangible assets related to capitalised development from 2014 or earlier. For further information see paragraph Risks and uncertainty factors, Note C2 and Note C13.
Operating profit (EBIT) amounted to SEK -145 M (-63) during 2015. Net financial items were SEK -19 M (-19). Financial income and expenses amounted to SEK -13 M (-10). Finan-cial income and expenses were mainly affected by interest income, revaluations of the short term investments and interest expense related to the bond issue. Exchange rate effects in 2015 were SEK 6 M (-9). Corporate income tax amounted to SEK -26 M (0.3) and was affected by revised assumptions of the possibility to use loss carried forwards. For further information see Note C11. Profit after tax was SEK -190 M (-82).
Net sales (SEK M)Gross margin (%),Excluding change related items
EBITDA (SEK M)EBITDA/Gross profit (%), Excluding change related items
2,613
2,308
2,001
1,7431,629
53
75
39
2011 2012 2013 2014 2015 2011 2012 2013 20140
500
1 000
1 500
2 000
2 500
3 000
0
20
40
60
80
100
120
140
160
180
21.7%
9.8%10.5%
20.7%22.7%23.5%24.0%
2015
156
-11-3.3%
16.6%
24.8%

Tradedoubler Annual Report 20156
Board of Directors’ Report
The picture above shows the countries Tradedoubler has marketing offices. At the head office in Stockholm are also IT and Development and the Finance function. Marketing are located in London and in Telford, just outside of Birmingham, are the Client Support Team.
Cash flow and financial positionCash flow from operating activities before changes in working capital was SEK -38 M (5) in 2015 and related to EBITDA reduced with paid taxes, paid interest and non-cash items.
Changes in working capital were SEK 57 M (-115). The nega-tive working capital during 2014 was mainly due to tem-porary effects around year-end 2013. The positive change during 2015 was mainly due to temporary effects around year-end 2015 as well as an increase in prepayments recei-ved from customers during the fourth quarter 2015. Working capital at year-end 2015 was SEK -199 M (-131). Cash flow from operating activities was SEK 19 M (-110).
Tradedoubler has invested the proceeds from the bond issue finalised in December 2013 in interest bearing financial instruments. At the end of 2015, a total of SEK 94 M (255 M) was placed in interest bearing financial instruments and SEK 0 M (27) in commercial papers.
Net investments in non-financial assets during 2015 increased to SEK -44 M (-17) and was due to increased product development in line with the new strategy that was launched in November 2014.
Cash flow from short term financial investments was SEK 168 (-53). The increase can be explained by a revised Finan-cial Policy that prohibits investments in high yield bonds. Previously held high yield bonds have therefore been sold during 2015. Paid dividends during 2015 were SEK 0 M (-11) and cash flow amounted to SEK 140 M (-194).
Cash and cash equivalents at the end of 2015 amounted to SEK 253 (117) M and were affected by translation differences of SEK -4 M (6). In addition, SEK 94 M (255) was invested in interest-bearing financial instruments. The sum of cash and cash equivalents and interest-bearing financial instruments was therefore SEK 347 M (372). Interest-bearing liabilities amounted to SEK 247 M (246) and related to the full five-year unsecured bond issue raised in the fourth quarter in 2013. Net cash hence amounted to SEK 100 M (126) at the end of 2015.
Consolidated shareholders’ equity amounted to SEK 248 M (441) at the end of 2015. The return on equity during 2015 and 2014 was negative and the equity/asset ratio was 23 per cent (35).
EmployeesAt year-end 2015, Tradedoubler’s staff corresponded to 408 (377) full-time equivalents and included permanent and temporary employees as well as consultants. Products & IT has increased by 26 FTE since December of last year to a total of 61 FTE at the end of 2015. Of the total headcount in December 2015, the equivalent of 45 (22) FTE ’s salary costs were capitalised as product development and hence not accounted for as operating costs.
In December 2015, as part of ongoing efficiency improve-ments, Tradedoubler announced a reduction of permanent staff by around ten employees, mainly within middle mana-gement and other administration.
Change related itemsFor comparability reasons and to indicate the underlying performance, Tradedoubler adjust for change related items.
Total change related items during 2015 were SEK -25 (-20) M. Revenue change related items included badwill refer-ring to the acquisition of Adnologies of SEK 0.8 M and an adjustment of SEK -5 M for errors in recurring invoicing since mid-2013 for one large customer within Technology. Since it was not possible to determine the age distribution of this correction, it was fully charged to the second quarter 2015. Change related costs included severance payments of SEK -4.5 M, evenly spread between South, DACH and Group management (including prior CTO Bertil Lundell that left the company in June), and additional severance payments related to the announced efficiency improvements in December 2015 of SEK -11 M mainly affecting the Group management, costs related to an office move in the UK, expenditures for closing down the office in Norway, costs related to the acquisition of Adnologies and a reassessment of provision for doubtful debts reducing costs by SEK 5 M.
During 2014, change related items included severance payments of SEK -9 M, primarily relating to the former CEO, Chief Strategy Officer and CTO, costs referring to the admi-nistrative closure of offices amounting to SEK -6 M (South), costs referring to the strategy launch, a reassessment of future cash flows referring to the affiliate debt lowering cost of goods sold and thereby improving gross profit by SEK 8 M (Group management) and a correction of the prepaid balance of SEK -10 M affecting net sales in segment DACH (-1), France & Benelux (-3), North (4), South (-2), UK & Ireland (2), Technology (-1) and Other (-8). For more information see Note C25.
Significant events after the balance sheet dateOn a extraordinary general meeting on February 11, 2016 it was resolved, in accordance with Reworld Media’s propo-sal, that the remuneration to the board of directors shall remain unchanged in accordance with the decision made at

Tradedoubler Annual Report 2015 7
Board of Directors’ Report
the Annual General Meeting 2015. Pascal Chevalier, Gautier Normand, Nils Carlsson, Jérémy Parola and Erik Siekmann were elected regular board members. Pascal Chevalier was elected as chairman of the board of directors. For the full details of each proposal adopted by the extraordinary general meeting, please refer to www.tradedoubler.com.
Tomas Ljunglöf, CFO of Tradedoubler, resigned in Decem-ber 2015 and will leave the company after the AGM in May. Viktor Wågström, presently accounting and group accoun-ting manager, will be interim CFO.
The parent companyThe parent company’s net sales amounted to SEK 89 M (113) during 2015. Revenue primarily consisted of licensing revenue and remuneration from subsidiaries for centrally performed services.
Operating profit (EBIT) amounted to SEK -69 M (-29) during 2015 and financial income and expenses were SEK 39 M (-0.5). Dividends from group companies were SEK 66 M (23) and changes in exchange rates have impacted pre-tax profit in 2015 with SEK –2.1 M ( 7). Profit after tax amounted SEK -54 M (-20) during 2015.
The parent company’s receivables from group companies amounted to SEK 58 M (87) at end of 2015, of which none (0) were non-current. The parent company’s liabilities to group companies were SEK 117 M (130), of which none (0) were non-current. Cash and cash equivalents amounted to SEK 182 M (59) at the end of 2015.
During the fourth quarter 2013 the parent company issued a bond loan with a nominal value of SEK 250 M. The proceeds from the bond loan and excess cash have been invested in short term investments and commercial papers. Short term commercial papers are disclosed in cash and cash equiva-lents in the balance sheet.
Deferred tax assets amounted to SEK 14 M (38) at the end of 2015 and the decrease mainly related to revised assumptions of the possibility to use loss carried forward, which resulted in a writedown of 23 MSEK. As per December 31, deferred tax assets of SEK 14 M mainly related to previous Group loans. For more information see Note C2 and Note M10.
The share and ownershipTradedoubler’s share is listed on NASDAQ Stockholm since 2005 and is traded on the list for Small Cap companies. The share is classified as Information Technology. The share capital on 31 December 2015 amounted to SEK 18.4 M (17.1) distributed among 45,927,449 (42,807,449) shares, each with a quota value of SEK 0.40. Tradedoubler issued new shares in 2015 regarding a share-based incentive programme for company management and other key employees. This increased the number of shares by 3,120,000 C-shares and the share capital by SEK 1.2 M. For more information see the Corporate Governance section Annual General Meeting 2015. All shares carry equal rights to share in the company’s assets and profits. Each share carries one vote. At the general meeting, each shareholder is entitled to vote for all shares he/she holds and represents without restriction as to the number of votes cast. Tradedoubler has 3,595,000 (475,000) shares in its own custody after repurchase of the 3,120,000
C-shares that was issued in 2015 related to the long-term incentive programme for the company management.
Tradedoubler’s share price decreased during the year by 45.9 per cent from SEK 10.25 to SEK 5.55 on 31 December 2015. The highest price recorded during 2015 was SEK 11.70 and the lowest price was SEK 5.10. The market capitalisation on 31 December 2015 amounted to SEK 235 M.
At year-end 2015 Tradedoubler had 2,391 (3,006) share-holders. The company’s largest shareholder was Reworld Media S.A with 17.8 (0) per cent of the capital and votes. The five largest shareholders jointly owned 49.7 (41.6) per cent of the shares. Swedish financial and institutional players owned 17.2 per cent (24.6) of the shares and Swedish private individuals owned 12.2 per cent (13.9) of the shares. Other and non-categorised legal entities have decreased to 28.3 per cent from 39.4 per cent last year. Foreign ownership increased during 2015 to 39.4 per cent (18.4). The board of directors and group management jointly owned approxima-tely 14 per cent (1.4) of the votes and capital at the end of 2015, which included the shares that Henrik Kvick AB sold to Reworld Media in the beginning of 2016.
For more information regarding the share, see Tradedoubler’s investor site: http:// financials.tradedoubler.com.
Guidelines for remuneration to company managementThe guidelines for remuneration to the company manage-ment is provided in Note C5. The Board will propose to AGM to adopt these guidelines in 2016.
Long term financial targetsTradedoubler’s long term financial targets are to grow net sales in excess of 5 per cent annually in local currency and deliver an EBITDA/Gross profit-ratio in excess of 20 per cent over a business cycle.
Proposed distribution of earningsAt the disposal of the Annual General Meeting of the parent company:
SEK
Share premium reserve 352,540,285
Retained earnings -274,042,795
Net profit for the year -54,146,850
Total non-restricted equity to be carried forward 24,350,640
In addition to the non-restricted equity, the Parent company had SEK 107,393,176 in restricted equity as per end of 31 December 2015.
The Board of Directors proposes to declare no dividend for 2015. No dividend was declared for 2014. Tradedoubler has a policy of distributing at least 50 per cent of its profit after tax provided that a suitable capital structure is maintained. The distribution may occur through share dividends, share redemption and share buybacks. For more information, see bond conditions regarding dividends in note C18.
Tradedoubler Annual Report 20158
Board of Directors’ Report
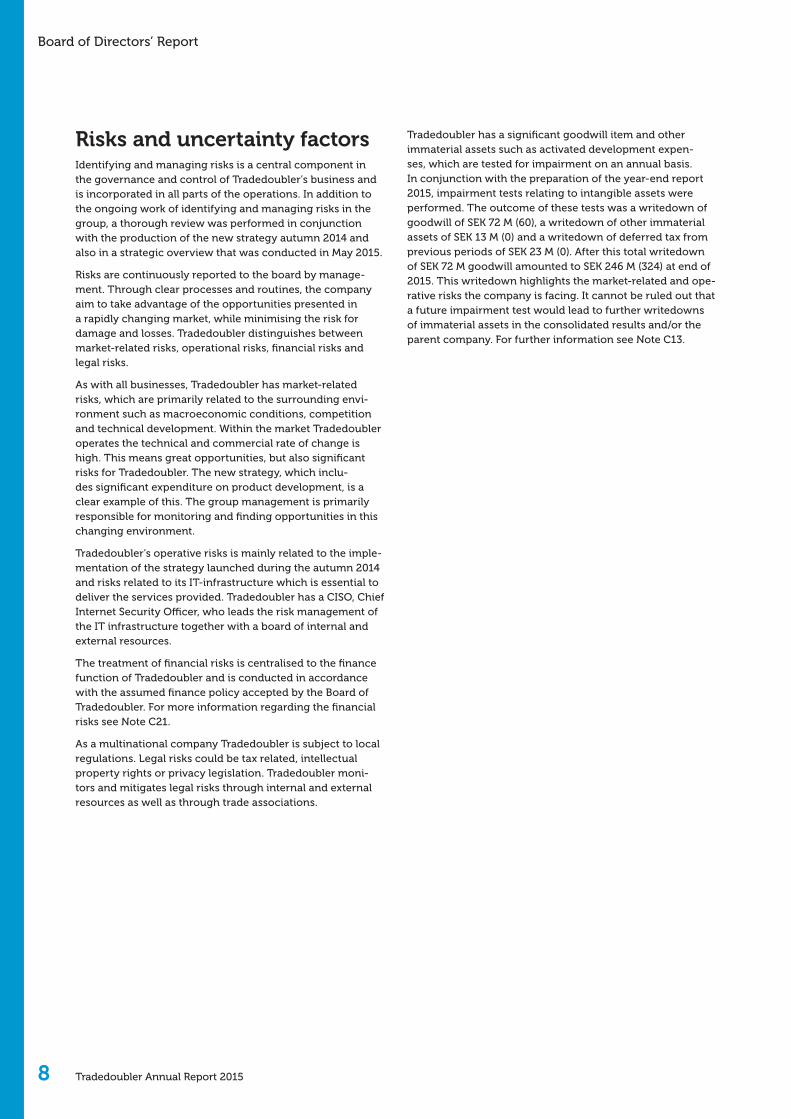
Risks and uncertainty factorsIdentifying and managing risks is a central component in the governance and control of Tradedoubler’s business and is incorporated in all parts of the operations. In addition to the ongoing work of identifying and managing risks in the group, a thorough review was performed in conjunction with the production of the new strategy autumn 2014 and also in a strategic overview that was conducted in May 2015.
Risks are continuously reported to the board by manage-ment. Through clear processes and routines, the company aim to take advantage of the opportunities presented in a rapidly changing market, while minimising the risk for damage and losses. Tradedoubler distinguishes between market-related risks, operational risks, financial risks and legal risks.
As with all businesses, Tradedoubler has market-related risks, which are primarily related to the surrounding envi-ronment such as macroeconomic conditions, competition and technical development. Within the market Tradedoubler operates the technical and commercial rate of change is high. This means great opportunities, but also significant risks for Tradedoubler. The new strategy, which inclu-des significant expenditure on product development, is a clear example of this. The group management is primarily responsible for monitoring and finding opportunities in this changing environment.
Tradedoubler’s operative risks is mainly related to the imple-mentation of the strategy launched during the autumn 2014 and risks related to its IT-infrastructure which is essential to deliver the services provided. Tradedoubler has a CISO, Chief Internet Security Officer, who leads the risk management of the IT infrastructure together with a board of internal and external resources.
The treatment of financial risks is centralised to the finance function of Tradedoubler and is conducted in accordance with the assumed finance policy accepted by the Board of Tradedoubler. For more information regarding the financial risks see Note C21.
As a multinational company Tradedoubler is subject to local regulations. Legal risks could be tax related, intellectual property rights or privacy legislation. Tradedoubler moni-tors and mitigates legal risks through internal and external resources as well as through trade associations.
Tradedoubler has a significant goodwill item and other immaterial assets such as activated development expen-ses, which are tested for impairment on an annual basis. In conjunction with the preparation of the year-end report 2015, impairment tests relating to intangible assets were performed. The outcome of these tests was a writedown of goodwill of SEK 72 M (60), a writedown of other immaterial assets of SEK 13 M (0) and a writedown of deferred tax from previous periods of SEK 23 M (0). After this total writedown of SEK 72 M goodwill amounted to SEK 246 M (324) at end of 2015. This writedown highlights the market-related and ope-rative risks the company is facing. It cannot be ruled out that a future impairment test would lead to further writedowns of immaterial assets in the consolidated results and/or the parent company. For further information see Note C13.

Tradedoubler Annual Report 2015 9
Board of Directors’ Report
Corporate governanceTradedoubler is a Swedish public limited liability company with its registered office in Stockholm. Tradedoubler’s share has been quoted on NASDAQ Stockholm since 2005. This section describes Tradedoubler’s corporate governance, management and administration and well as the internal control.
The governance of Tradedoubler is divided among the follo-wing parties; the shareholders at the annual general meeting (AGM), the board of directors, the CEO and the group mana-gement in accordance with the Swedish Companies Act, the articles of association and the Swedish Code of Corporate Governance (the Code). The board of directors has chosen to jointly handle the duties pertaining to the audit commit-tee according to the Code and the Swedish Companies Act, but which also may be handled by the board as a whole – see more information under “Audit Committee”. In other respects, Tradedoubler has applied the Code without devia-tion during 2015.
Tradedoubler’s articles of association and other information regarding corporate governance in the company is available on Tradedoubler’s website at www.tradedoubler.com/en/about/investors/ under the corporate governance heading.
General meeting of shareholdersThe annual general meeting is Tradedoubler’s highest decision-making body in which shareholders exercise their rights to decide on the affairs of the company and where each share carries one vote. Shareholders are informed via Tradedoubler’s website of their entitlement to have an item addressed at the AGM. Shareholders who are registered in the share register on the record day, (five weekdays prior to the date of the AGM) and who have provided notification of their intention to attend in accordance with what is stated in the convening notice, are entitled to participate in the AGM, either in person or by proxy.
Minutes from the annual general meeting 2015 and pre-vious general meetings of shareholders are available on Tradedoubler’s website (www.tradedoubler.com/en/about/investors/corporate-governance/annual-general-meeting/).
Annual General Meeting 2015
The AGM was held on 5 May 2015 in Stockholm. 43.50 per cent of the shares were represented at the AGM. The AGM passed resolutions on election of board members and to adopt the board’s proposal for the share price related incentive pro-gramme to senior executive and other key employees within the Tradedoubler group. The decision included amendment of the Articles of Association and the introduction of a new shares class, C-shares, authorisation for the Board of Directors to resolve to issue and to repurchase C-shares, reclassification of C-shares to ordinary shares, transfer of ordinary shares for delivery under the incentive programme and authorisation for the Board of Directors to resolve on the transfer of own shares due to the incentive programme. Conditions for transfer of ordinary shares and own shares in the incentive programmes has been resolved by the AGM.
Class C-shares may be issued up to a maximum number of shares representing the total share capital of the Company
and will not provide entitlement to any dividend payment. A C-share have the same voting rights as ordinary shares.
Extraordinary General Meeting 2016
An extraordinary general meeting was held on 5 May 2016 on Rewold Media’s initiative. 35.30 per cent of the shares were represented. In accordance with Reworld Media’s proposal Pascal Chevalier, Gautier Normand, Nils Carlsson, Jérémy Perola and Erik Siekmann were elected regular board members. The current Board is presented on page 46.
Nomination Committee
Tradedoubler’s AGM passes resolutions regarding a nomina-tion committee before the next AGM. The nomination com-mittee shall consist of four members and shall be composed of one representative of each of the three largest sharehol-ders in terms of the number of votes, as of the last banking day in August, who wish to appoint such a representative, as well as the chairman of the board.
The composition of the nomination committee ahead of the AGM 2016 was announced on 19 October 2015. The nomina-tion committee was composed of Cédric Vincent, appointed by Reworld Media S.A (chairman), Felix Kvick, appointed by Henrik Kvick AB, Thomas Ehlin, appointed by Fjärde AP-fon-den and Pascal Chevalier, chairman of the board. At the end of August 2015, the holding by Reworld Media S.A amounted to 19.1 per cent, Henrik Kvick AB 13.3 per cent and Fjärde AP-fonden 4.6 per cent. An internal evaluation of the board and its work was carried out during the year. The nomination committee interviewed various candidates for the board. Thomas Ehlin resigned from the nomination committee in December 2015 and Felix Kvick in January 2016.
In March 2016 Yi Shi, representing approximately 4 per cent of the shares in Tradedoubler, was appointed as a member of the nomination committee, which thereafter consists of Cédric Vincent (chairmain), representing Reworld Media S.A., Yi Shi and Pascal Chevalier, chairman of the Board of Directors. The nomination committee’s proposals to the AGM 2016 regarding board members, fees and other remuneration etc. are planned to be presented in the notice convening for the AGM 2016 and will also be available on the company’s website.
The members of the nomination committee receive no remuneration from Tradedoubler. However, the chairman of the board receives remuneration from Tradedoubler in the form of ordinary directors’ fees.
The Board of Directors and its committeesAccording to Tradedoubler’s articles of association, the board shall be composed of between five and nine members. The CEO is not a member of the board, but attends board meetings. Other employees in Tradedoubler participate in board meetings when required, for instance to present reports. The company’s chief financial officer has during 2015 served as the secretary to the board.
During 2015, Tradedoubler’s board of directors was compo-sed until the AGM on 5 May 2015 of Peter Larsson (chair-man), Martin Ahrend, Martin Henricson, Thomas Bill and Mernosh Saatchi.

Tradedoubler Annual Report 201510
Board of Directors’ Report
At the AGM, Peter Larsson, Martin Ahrend, Thomas Bill and Martin Henricson declined re-election. Pascal Cheva-lier (chairman), Henrik Kvick, Mikael Nachemson, Gautier Normand and Peter Åström were elected as directors and Mernosh Saatchi was re-elected. Hence the board was during the rest of 2015 and until the extraordinary general meeting conducted by Pascal Chevalier (chairman), Henrik Kvick, Mikael Nachemson, Gautier Normand, Mernosh Saatchi and Peter Åström. On the extraordinary general meeting Nils Carlsson, Jérémy Parola and Erik Siekmann were elected as new directors and Pascal Chevalier and Gautier Normand were re-elected.
The nomination committee for AGM 2015 considered Pascal Chevalier and Gautier Normand in their capacity as founder and senior executives of Reworld Media S.A dependent in relation to the company’s major owners, but independent in relation to the company and the company management. The nomination committee also considered that Henrik Kvick in his capacity as owner of Henrik Kvick AB was dependent in relation to the company’s major owners, but independent in relation to the company and the company management. The nomination committee also considered Thomas Bill and Peter Larsson in their capacity as Managing Partners of Mon-terro 1A AB dependent in relation to the company’s major owners, but independent in relation to the company and the company management. Other board members who held positions during 2015 were independent during their term of office in relation to the company and the company mana-gement and in relation to the company’s major owners. The composition of board members during 2015 has therefore met the requirements imposed in relation to independence.
For the extraordinary general meeting on 11 February 2016 Reworld Media S.A considered that Pascal Chevalier, Gautier Normand and Jérémy Perola in their capacity as founder and senior executives of Reworld Media S.A are dependent in relation to the company’s major owners, but independent in relation to the company and the company management and that Nils Carlsson and Erik Siekmann are independent in the relation to the company and the company management and in relation to the company’s major owners.
Under the Code, the company shall aim for a uniform gender distribution in the board. Tradedoubler’s board of directors during 2015 was overwhelmingly composed of men. The nomination committee aims for a uniform gender distribu-tion and had this balance in consideration in its work on a proposal for a new board of directors.
Rules of procedureThe work of the board is guided by Rules of procedure for the board that is adopted each year, usually at the statutory board meeting. These rules sets out the responsibilities of the board and CEO and regulates the board, its com-mittees and its members’ internal division of work, the decision-making order within the board, notifications of board meetings, agendas and minutes, and the board’s work on internal control, risk management and the financial reporting. The current rules of procedure were approved by the board of directors on 11 February 2016.
Chairman of the boardAccording to the current rules of procedure, the chairman of the board shall ensure that the board work is conducted effectively and that the board fulfills its duties. In particular, the chairman shall:
• organise and lead the work of the board,
• ensure that new board members undergo requisite introductory training and training in other respects that the chairman and the member collectively find suitable,
• ensure that the board continually updates and advan-ces its knowledge about the company,
• take responsibility for contacts with the owners regar-ding ownership questions and for communicating viewpoints from the owners to the board,
• ensure that the board receives sufficient information and decision data for its work,
• in consultation with the CEO, adopt proposals for the agenda of board meetings,
• ensure that the board’s decisions are executed and ensure that the work of the board is evaluated on an annual basis
Work during the year
The board held 16 recorded board meetings during 2015, of which two took place by telephone. The individual members’ attendance at board and committee meetings is shown in the table on page 13.
During the year, the board’s work mainly focused on the execution of the strategy balancing expenditures towards necessary investments, budget and business plan for 2015-2017 and other analysis of the business and trends in the industry.
Committees
Audit Committee
The Code and the Swedish Companies Act (2005:551) contain provisions regarding the establishment of an audit committee. The entire board of directors may fulfill the committee’s duties in accordance with what is prescribed in Chapter 8 Sections 49 a-b second paragraph of the Com-panies Act. Since the autumn of 2013 the duties of the audit committee have been handled by the entire board and no separate meetings have been held during 2015.
The committee’s work focused on assessment of immaterial assets and internal control. For more information about the internal control and risk management, see page 12.
Remuneration Committee
The board has appointed a remuneration committee, which during the year was composed of two board members, one of whom was chairman. The remuneration commit-tee shall hold meetings when necessary. When considered appropriate, the remuneration committee may invite the CEO, the company’s CFO, the company’s auditor or others to participate in the committee’s meetings. Minutes are taken of the remuneration committee’s meetings and a copy of the minutes is distributed to all board members.
Tradedoubler Annual Report 2015 11
Board of Directors’ Report
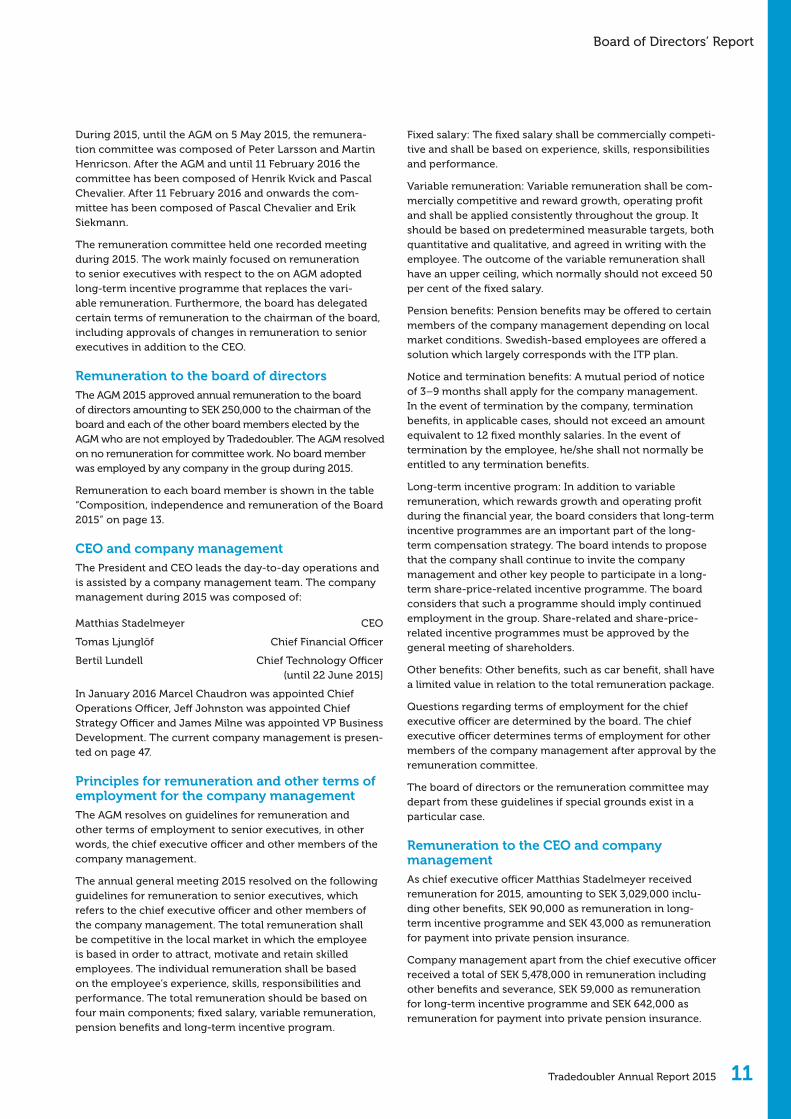
During 2015, until the AGM on 5 May 2015, the remunera-tion committee was composed of Peter Larsson and Martin Henricson. After the AGM and until 11 February 2016 the committee has been composed of Henrik Kvick and Pascal Chevalier. After 11 February 2016 and onwards the com-mittee has been composed of Pascal Chevalier and Erik Siekmann.
The remuneration committee held one recorded meeting during 2015. The work mainly focused on remuneration to senior executives with respect to the on AGM adopted long-term incentive programme that replaces the vari-able remuneration. Furthermore, the board has delegated certain terms of remuneration to the chairman of the board, including approvals of changes in remuneration to senior executives in addition to the CEO.
Remuneration to the board of directorsThe AGM 2015 approved annual remuneration to the board of directors amounting to SEK 250,000 to the chairman of the board and each of the other board members elected by the AGM who are not employed by Tradedoubler. The AGM resolved on no remuneration for committee work. No board member was employed by any company in the group during 2015.
Remuneration to each board member is shown in the table “Composition, independence and remuneration of the Board 2015” on page 13.
CEO and company managementThe President and CEO leads the day-to-day operations and is assisted by a company management team. The company management during 2015 was composed of:
Matthias Stadelmeyer CEO
Tomas Ljunglöf Chief Financial Officer
Bertil Lundell Chief Technology Officer (until 22 June 2015]
In January 2016 Marcel Chaudron was appointed Chief Operations Officer, Jeff Johnston was appointed Chief Strategy Officer and James Milne was appointed VP Business Development. The current company management is presen-ted on page 47.
Principles for remuneration and other terms of employment for the company managementThe AGM resolves on guidelines for remuneration and other terms of employment to senior executives, in other words, the chief executive officer and other members of the company management.
The annual general meeting 2015 resolved on the following guidelines for remuneration to senior executives, which refers to the chief executive officer and other members of the company management. The total remuneration shall be competitive in the local market in which the employee is based in order to attract, motivate and retain skilled employees. The individual remuneration shall be based on the employee’s experience, skills, responsibilities and performance. The total remuneration should be based on four main components; fixed salary, variable remuneration, pension benefits and long-term incentive program.
Fixed salary: The fixed salary shall be commercially competi-tive and shall be based on experience, skills, responsibilities and performance.
Variable remuneration: Variable remuneration shall be com-mercially competitive and reward growth, operating profit and shall be applied consistently throughout the group. It should be based on predetermined measurable targets, both quantitative and qualitative, and agreed in writing with the employee. The outcome of the variable remuneration shall have an upper ceiling, which normally should not exceed 50 per cent of the fixed salary.
Pension benefits: Pension benefits may be offered to certain members of the company management depending on local market conditions. Swedish-based employees are offered a solution which largely corresponds with the ITP plan.
Notice and termination benefits: A mutual period of notice of 3–9 months shall apply for the company management. In the event of termination by the company, termination benefits, in applicable cases, should not exceed an amount equivalent to 12 fixed monthly salaries. In the event of termination by the employee, he/she shall not normally be entitled to any termination benefits.
Long-term incentive program: In addition to variable remuneration, which rewards growth and operating profit during the financial year, the board considers that long-term incentive programmes are an important part of the long-term compensation strategy. The board intends to propose that the company shall continue to invite the company management and other key people to participate in a long-term share-price-related incentive programme. The board considers that such a programme should imply continued employment in the group. Share-related and share-price-related incentive programmes must be approved by the general meeting of shareholders.
Other benefits: Other benefits, such as car benefit, shall have a limited value in relation to the total remuneration package.
Questions regarding terms of employment for the chief executive officer are determined by the board. The chief executive officer determines terms of employment for other members of the company management after approval by the remuneration committee.
The board of directors or the remuneration committee may depart from these guidelines if special grounds exist in a particular case.
Remuneration to the CEO and company managementAs chief executive officer Matthias Stadelmeyer received remuneration for 2015, amounting to SEK 3,029,000 inclu-ding other benefits, SEK 90,000 as remuneration in long-term incentive programme and SEK 43,000 as remuneration for payment into private pension insurance.
Company management apart from the chief executive officer received a total of SEK 5,478,000 in remuneration including other benefits and severance, SEK 59,000 as remuneration for long-term incentive programme and SEK 642,000 as remuneration for payment into private pension insurance.

Tradedoubler Annual Report 201512
1. Published by the Committee of Sponsoring Organizations of the Treadway Commission (COSO), (www.coso.org)
Board of Directors’ Report
AuditorsEY was elected as auditor at the AGM 2015 for the period until the AGM 2016, with the authorised public accountant Erik Sandström as auditor-in-charge.
During 2015, the auditor reviewed the annual accounts, the consolidated accounts and accounting records as well as the administration of the board of directors and the CEO. In addition, the auditor reviewed the corporate governance report. The auditor has also reviewed the interim report for the period January-September 2015 and has been retained for certain advice, most of which pertained to audit-related consultations regarding accounting and tax matters.
Total remuneration of SEK 5,260,000 was paid during 2015, of which SEK 4,985,000 was paid to EY and SEK 275,000 to other auditing companies.
Long-term incentive programmes and bonus programmeThe AGM 2015 resolved to adopt a share-price-related incen-tive programme for senior executive and other key employees within the Tradedoubler group including amendment of the Articles of Association and the introduction of a new shares class, C-shares, authorisation for the Board of Directors to resolve to issue and to repurchase C-shares, transfer of ordinary shares for delivery under the incentive programme and authorisation for the Board of Directors to resolve on the transfer of own shares due to the incentive programme.
The objective of the proposed programme is to create conditions for recruiting and retaining competent employees in the group. The programme has been designed based on the view that it is desirable that senior executives and other key employees within the group are shareholders in the company. By linking the employee’s remuneration to Tradedoubler’s share price develop-ment continued loyalty will be promoted and thereby long-term growth in the company. In the light of this, the board of directors is of the opinion that the adoption of the programme will have a positive effect on Tradedoubler’s future development and thus be beneficial for both the company and its shareholders. Partici-pants in the programme waives variable renumeration.
More details regarding the incentive programme can be found at www.tradedoubler.com/en/about/investors/corpo-rate-governance/annual-general-meeting/.
The group also operates an annual performance- and results-based variable remuneration programme for all other employees within the group. In the 2015 programme, various quantitative and qualitative performance- and earnings targets were set for different occupational categories, based on company-wide, and regional targets for employees.
Internal controlThe board’s responsibility for internal control and risk management is governed by the Companies Act and by the Code. Internal control and risk management in respect of the financial reporting constitute a part of the total internal control and risk management within Tradedoubler, which is based on the COSO framework1 and represents an essential part of Tradedoubler’s corporate governance.
COSO describes the internal control as divided into five components as follows; control environment, risk manage-ment, control activities, information and communication, monitoring.
Risk assessment
The area of internal control and risk management in respect of the financial reporting is part of the board’s and group management’s overall work on identifying and managing risks. This work aims to identify and evaluate the most critical risks affecting the internal control and the financial reporting in the group’s companies, as a basis for how to handle risks through different control structures. The most significant risks for the group are described under “Risks and uncertainty factors” on page 8. See also Note C2 and C21 in Notes to the consolidated accounts.
Control environment
The board has the overall responsibility for the internal control and risk management in respect of the financial reporting. The board has adopted Rules of procedure. This is an internal control instrument setting out the responsibili-ties of the board, CEO and company management regulating the board, its committees and members’ internal division of work. The board also works with the duties that under the Code shall be handled by the audit committee. This is primarily control of the financial reporting and moni-toring the effectiveness of the company’s internal control and risk management in respect of the financial reporting. Furthermore, the board in 2015 decided on revisions to the company’s Finance policy, Insider policy and External infor-mation and investor relations policy.
In addition, the CEO and company management control the day-to-day work through a variety of policies and internal control documents. The most important of these include the company’s Authorisation manual, Payment policy and IT Security policy. The CEO in conjunction with the rest of the group management is responsible for ensuring that the above-mentioned internal control instruments are complied with and updated if necessary.
Control activities
Control structures are concerned with what controls are chosen to manage identified risks in the group’s companies. The controls may be general or detailed, preventative or discovery-based and automated or manual in character.
Information and communication
The internal control instruments are available for the rele-vant employees on Tradedoubler’s Intranet.
The CEO and the company’s CFO report the on-going work on develop and monitor the company’s internal control and risk management to the board.
Monitoring
Follow up in order to ensure the effectiveness of the internal control and risk management in respect of the financial reporting is conducted by the board, the CEO and the rest of the group management, including the company’s CFO. Follow up includes review of monthly income statements and cash flow statements against the budget and latest

Tradedoubler Annual Report 2015 13
Board of Directors’ Report
Name Board of directorsAttendance, board meetings*
The remuneration committee
Attendance Remuneration committee****
Peter Larsson Chairman (**) 5/5 Chairman –
Thomas Bill Member (**) 5/5 – –
Martin Henricson Member (**) 5/5 Member –
Mernosh Saatchi Member 15/16 – –
Martin Ahrend Member (**) 4/5 – –
Pascal Chevalier Chairman 9/11 Chairman 1/1
Mikael Nachemsson Vice Chairman 11/11 – –
Gautier Normand Member 11/11 – –
Henrik Kvick Member 8/11 Member 1/1
Peter Åström Member 9/11 – –
*Out of the meetings that took place during the person’s terms of office in 2015** Member of the Board during 1 January to 5 May 2015.
Name Born Nationality ElectedThe Board of directors
The Remunera-tion Committee
Independant in rela-tion to the company, the company management and the company s major shareholders*
Fee in SEK (incl. commit-
tee work)**
Own or related
party share holdings***
Peter Larsson 1964 Swedish 2013Prev. Chairman (to 5 May 2015)
Prev. Chairman (to 5 May 2015) No* 85,616 0
Thomas Bill 1965 Swedish 2013Prev. Member (to 5 May 2015) – No* 85,616 0
Martin Henricson 1961 Swedish 2001Prev. Member (to 5 May 2015)
Prev. Member (to 5 May 2015) Yes 85,616 15,000
Mernosh Saatchi 1979 Swedish 2014 Member – Yes 250,000 0
Martin Ahrend 1968 Swedish 2014 Prev. Member (to 5 May 2015) – Yes 85,616 0
Pascal Chevalier 1968 French 2015 Chairman Chairman No* 164,384 0
Mikael Nachemson 1959 Swedish 2015 Vice Chairman – Yes 164,384 300,000
Gautier Normand 1978 French 2015 Member – No* 164,384 0
Henrik Kvick 1977 Swedish 2015 Member Member No* 164,384 120,000
Peter Åström 1966 Swedish 2015 Member – Yes 164,384 0
SUM 1,414,384
* Pascal Chevalier and Gautier Normand are independent to the company and company management but dependent in relation to the company s major owners, since they are both active in Reworld Media, Tradedoubler’s major owner. The arms lenght priniple have been applied in all transactions between Tradedoubler and Reworld Media, for more information see Note C23. Peter Larsson, Thomas Bill and Henrik Kvick was independent to the company and company management but dependent in relation to the company’s major owners. ** The annual general meeting 2015 approved the nomination committee’s proposal for the compensation to the Chairman of the board and the other Board members corresponding to SEK 250,000. No compensation is payable for committee work. Compensation relates to the annual payable amount.*** Holdings of shares or other equal financial instruments by private or related persons or legal entities in Tradedoubler according to the latest available information to Tradedoubler.
Composition, independence and remuneration of the Board 2015
Attendance at board and committee meetings and independence 2015
financial forecast and current controls that exceptions to policies has been approved by authorised personnel. This means, inter alia exemption from the credit policy and the policy of publishers only getting paid after the customer has paid its invoice to Tradedoubler.
The IT security work is continually ongoing with follow up meetings with the CISO (Chief Internet Security Officer) and group managers for development and operations in attendance. Any IT security-related incidents are reported at these meetings and follow up takes place of IT security-related projects and activities. When required, the CISO
reports to the CEO and other members of the group mana-gement including the company’s CFO. The company have agreements with external security experts in order to receive advice and support regarding implementation, assessments, and priorities on IT security-related issues.
Internal audit
At present, the company does not have any special audit function. The question of formally establishing a special audit function is reviewed continually.

Financial Statements
FINANCIAL INFORMATION
CONSOLIDATED ACCOUNTS 15
NOTES TO THE CONSOLIDATED ACCOUNTS 19
PARENT COMPANY ACCOUNTS 35
NOTES TO THE PARENT COMPANY ACCOUNTS 39
BOARD AND CEO’S SIGNATURES 44
AUDITOR´S REPORT 45
BOARD OF DIRECTORS 46
GROUP MANAGEMENT 47
DEFINITIONS 48

15 Tradedoubler Annual Report 2015
Financial information
Consolidated income statement
SEK ‘000 Note 2015 2014
Net sales C3, C4 1,624,264 1,732,649
Cost of goods sold C8 -1,292,420 -1,355,589
Gross profit 331,844 377,060
Selling expenses -218,951 -217,119
Administrative expenses -118,313 -119,221
Research & development expenses -68,242 -44,075
Impairment goodwill C13 -71,725 -59,993
Operating profit C4, C5, C6, C7, C8, C9 -145,387 -63,348
Financial income 10,122 12,413
Financial expenses -28,785 -31,745
Net financial items C10 -18,663 -19,332
Profit before tax -164,049 -82,679
Tax C11 -25,776 335
Net profit for the year -189,826 -82,344
Statement of comprehensive income
Profit for the year -189,826 -82,344
Other comprehensive income
Other comprehensive income to be reclassified to profit or loss in subsequent periods
Translation differences, net after tax -3,114 26,992
Total other comprehensive income to be reclassified to profit or loss in subsequent periods -3,114 26,992
Total comprehensive income for the year -192,940 -55,352
Total comprehensive income for the year attributable to:
The parent company's shareholders -189,826 -82,344
Comprehensive income attributable to:
The parent company's shareholders -192,940 -55,352
Earnings per share C17
Earnings per share before and after dilution -4.48 -1.95

16Tradedoubler Annual Report 2015
Financial information
Consolidated statement of financial positionSEK ‘000 Note Dec 31, 2015 Dec 31, 2014
Assets
Non-current assets
Goodwill C13 246,140 323,682
Other intangible assets C13 61,170 57,603
Equipment, tools, fixtures and fittings C14 6,231 3,667
Other non-current receivables 5,341 5,510
Deferred tax receivables C11 21,558 48,186
Total non-current assets 340,441 438,647
Current assets C12
Trade receivables C21 335,538 421,753
Tax receivables C11 11,843 19,030
Other receivables 16,323 18,214
Prepaid expenses and accrued income C15 11,736 15,607
Short term investments 93,641 255,259
Cash and cash equivalents 252,886 116,747
Total current assets 721,967 846,610
Total assets 1,062,408 1,285,257
Equity and liabilities
Shareholders' equity C16
Share capital 18,371 17,123
Share premium 441,600 441,600
Translation reserve 26,683 29,797
Retained earnings including net profit for the year -238,723 -47,179
Total equity 247,931 441,341
Non-current liabilities C12, C21
Deferred tax liabilities 1,281 6,974
Provisions: non-current 1,179 1,138
Bond loan C18 246,766 245,676
Total non-current liabilities 249,226 253,788
Current liabilities C12, C21
Trade payables 14,466 12,142
Current liabilities to publishers C12 302,350 371,925
Tax liabilities C11 2,303 3,727
Other liabilities C19 187,951 161,321
Accrued expenses and deferred income C20 58,181 41,013
Total current liabilities 565,251 590,128
Total equity and liabilities 1,062,408 1,285,257
Pledged assets C22 6,609 7,569
Contingent liabilities C22 None None

17 Tradedoubler Annual Report 2015
Financial information
Consolidated statement of changes in equity
SEK ‘000Share
capitalShare
premiumTranslation
reserve
Retained earnings incl. Net profit for
the yearTotal
equity
Opening balance at Januari 1, 2014 17,123 441,600 2,805 45,007 506,535
Comprehensive income
Net profit for the year -82,344 -82,344
Other comprehensive income
Translation differences, net after tax - - 26,992 - 26,992
Total other comprehensive income - - 26,992 - 26,992
Total comprehensive income - - 26,992 -82,344 -55,352
Transactions with shareholders
Dividend -10,583 -10,583
Equity-settled share-based payments - - - 741 741
Total transactions with shareholders - - - -9,842 -9,842
Closing balance at December 31, 2014 17,123 441,600 29,797 -47,179 441,341
Opening balance at Januari 1, 2015 17,123 441,600 29,797 -47,179 441,341
Comprehensive income
Net profit for the year -189,826 -189,826
Other comprehensive income
Translation differences, net after tax - - -3,114 - -3,114
Total other comprehensive income - - -3,114 - -3,114
Total comprehensive income - - -3,114 -189,826 -192,940
Transactions with shareholders
New share issue 1,248 - - - 1,248
Repurchase of own shares - - - -1,248 -1,248
Equity-settled share-based payments - - - -470 -470
Total transactions with shareholders 1,248 - - -1,718 -470
Closing balance at December 31, 2015 18,371 441,600 26,683 -238,723 247,931
All equity is tributed to the shareholders of the Parent Company.

18Tradedoubler Annual Report 2015
Financial information
Consolidated cash flow statement
SEK '000 Note 2015 2014
Operating activities C24
Profit before tax -164,049 -82,679
Adjustment for items not included in the cash flow 130,258 99,637
Taxes paid -3,880 -11,851
Cash flow from operating activities before changes in working capital -37,671 5,107
Cash flow from changes in working capital
Increase (-)/Decrease (+) in operating receivables 92,542 51,498
Increase (-)/Decrease (+) in operating liabilities -35,792 -166,902
Cash flow from operating activities 19,079 -110,297
Investing activities
Investments in intangible assets -37,936 -16,642
Investments in property, plant and equipment -6,122 -692
Investments in financial assets 193 -899
Investments in stocks and subsidiaries C26 -2,843 -1,521
Short-term investments -31,518 -124,437
Sale of short-term investments 199,356 71,232
Cash flow from investing activities 121,130 -72,959
Financing activities
New share issue 1,248 -
Repurchase of own shares -1,248 -
Dividend - -10,583
Cash flow from financing activities - -10,583
Cash flow for the year from continuing operations 140,208 -193,839
Cash flow for the year 140,208 -193,839
Cash and cash equivalents at the beginning of the year 116,747 304,662
Exchange difference in cash and cash equivalents -4,070 5,924
Cash and cash equivalents at the end of the year 252,886 116,747

19 Tradedoubler Annual Report 2015
Notes
C1. Accounting policies
General informationTradedoubler AB (the parent company) and its subsidiaries together make up the Tradedoubler group.
TradeDoubler AB (publ), corporate registration number 556575-7423, is a Swedish registered limited liability company with its regis-tered office in Stockholm. The address of the head office is Birger Jarlsgatan 57A, 113 56 Stockholm. The parent company’s shares are listed on NASDAQ Stockholm. The board of directors approved these annual accounts for publication on 6 April 2015. The annual accounts will be considered for adoption by the annual general meeting.
Summary of significant accounting policiesThe consolidated accounts were prepared in accordance with the International Financial Reporting Standards (IFRS) issued by the International Accounting Standards Board (IASB) as well as interpre-tations from the International Financial Reporting Interpretations Committee (IFRIC), as adopted by the European Commission for application within the EU. In addition, the Swedish Financial Report-ing Board’s recommendation RFR 1, Supplementary Accounting Rules for Groups is applied.
The parent company applies the same accounting policies as the group except in the instances described below in the section “Parent Company’s accounting policies”. Discrepancies between the princi-ples applied by the parent company and the group arise due to restrictions on the ability to apply IFRS within the parent company imposed by the Swedish Annual Accounts Act, the Pension Obliga-tions Vesting Act (“tryggandelagen”) and, in some cases, by tax con-siderations.
Assets and liabilities are recognised at historical cost unless other-wise stated below.
The parent company’s functional currency is the Swedish krona (SEK), which is also the presentation currency for the parent com-pany and the group. This means that the financial statements are presented in SEK. All amounts are rounded off to the nearest thou-sand, unless otherwise stated.
Assessments and estimates in the financial statements.Preparing the financial statements in conformity with IFRS requires the group management to make judgements and estimates as well as assumptions that affect the application of the accounting policies and the recognised amounts of assets, liabilities, revenue and expenses. The actual outcome may deviate from these estimates and judgements.
Estimates and assumptions are reviewed regularly. Changes in estimates are recognised in the period in which they arise if the change affects that period alone or, alternatively, in the period in which they arise and during future periods if the change affects both the period in question and future periods.
Judgements made by the group management in the application of IFRS, which have a material impact on the financial statements and estimates made, which may give rise to significant adjustments in future financial statements are described in more detail in the notes to the consolidated accounts C2, Critical estimates and judgements.
Amended accounting policies and disclosure requirements 2015None of the amended policies and disclosure requirements to exist-ing standards that are applicable from the financial year that began on January 2015 has any material impact on the Group or parent company’s financial statements.
New accounting standards in 2016 and onwardsA number of new and revised IFRS has not yet entered into force and have not been applied in preparing the consolidated and parent com-pany financial statements. None of the new standards, amendments to standards and IFRIC interpretations published December 31, 2015 are expected to have any impact on the Group’s or parent company’s financial statements.
New accounting standards from January 1st, 2016 relates to IFRS 9 Financial Instruments, IFRS 15 Revenue from Contracts with Customers, IFRS 16 Leases, IAS 19 Employee benefits (amendment), IFRS 11 Joint
Arrangements (amendment), IAS 16 Property, Plant and Equipment and IAS 38 Intangible Assets (amendment), IAS 27 Consolidated and Sepa-rate Financial Statements (amendment), IAS 1 Disclosure Initiative, IFRS 10, IFRS 12, IAS 28 Investment Entities, IFRS 10 Consolidated State-ments and IAS 28 Investment Entities and joint ventures (amendment).
ClassificationNon-current assets and non-current liabilities in the parent company and the group largely consist of amounts that are expected to be recovered or paid after more than twelve months, calculated from the end of the reporting period. Current assets and current liabilities in the parent company and the group largely consist of amounts that are expected to be recovered or paid within twelve months, calcu-lated from the end of the reporting period.
Segment reportingIdentification of segments is made based on the internal reporting to the chief operating decision-maker, which as far as Tradedoubler is concerned is deemed to be the CEO.
From January 1, 2014 Tradedoubler reports the geographical seg-ments within Affiliate, Technology and Other. Other primarily repre-sents the non-strategic campaigns business. The geographical seg-ments within Affiliate and Technology sum up to the core business, Performance Marketing.
Basis of consolidationSubsidiariesThe group’s accounts comprise the financial statements of the parent company and all of its subsidiaries. Subsidiaries are the companies over which the parent company exercises control. Control means, directly or indirectly, a right to set the company’s financial and opera-tional strategies with the aim of obtaining economic benefits. When determining whether control exists, potential voting shares that can be called upon or converted without delay should be considered.
All subsidiaries are consolidated using the purchase method. This method means that acquisition of a subsidiary is treated as a trans-action by which the group indirectly acquires the subsidiary’s assets and assumes its liabilities and contingent liabilities. The consolidated historical cost is determined through a purchase price allocation in connection with the acquisition. The analysis establishes the cost of the shares or entity, as well as the fair value on the date of acquisi-tion of the identifiable assets acquired and liabilities and contingent liabilities assumed. The cost of the subsidiary’s shares or entity con-sists of the fair values of the assets on the date of exchange, liabilities incurred or assumed and equity instruments issued as consideration in exchange for the acquired net assets. In business combinations where the cost of acquisition exceeds the net value of acquired assets, and liabilities and contingent liabilities assumed, the differ-ence is recognised as goodwill. When the difference is negative, this is recognised directly in the income statement.
The subsidiaries’ financial statements are included in the consoli-dated financial statements from the date of acquisition until the date when control ceases.
Transactions eliminated on consolidationIntra-group receivables and liabilities, revenue or expenses, and unrealised gains or losses arising from transactions between group companies, are eliminated in full on preparation of the consolidated financial statements.
Foreign currencyTransactions in foreign currenciesTransactions in foreign currencies are translated to the functional currency at the exchange rate prevailing on the transaction date. The functional currency is the currency which applies in the primary economic environments in which the companies conduct their oper-ations. Monetary assets and liabilities denominated in foreign cur-rencies are translated to the functional currency at the prevailing year-end exchange rate. Exchange differences arising on translation are recognised in the income statement, as financial income and expenses, with the exception of exchange differences in respect of intra-group loans which are treated as a net investment in a foreign operation (increased/reduced net investment) where exchange dif-ferences are recognised in other comprehensive income in the same way as translation differences.

20Tradedoubler Annual Report 2015
Notes
Financial statements of foreign operationsThe group’s presentation currency is the Swedish krona (SEK). Assets and liabilities in foreign operations, including goodwill and other goodwill/negative goodwill arising on consolidation, are translated from the foreign operation’s functional currency to the group’s pres-entation currency, Swedish krona, at the exchange rate prevailing at the end of the reporting period. Income and expenses in a foreign operation are translated to Swedish kronor at an average rate that represents an approximation of the prevailing exchange rates on the date of each transaction. Translation differences arising on such translation are recognised in other comprehensive income.
The exchange rates used in translation of the financial statements for consolidation purposes are as follows:
Closing day rate Average rate
2015 2014 2015 2014
EUR 9.14 9.52 9.36 9.10
GBP 12.38 12.14 12.90 11.29
NOK 0.96 1.05 1.05 1.09
DKK 1.22 1.28 1.25 1.22
PLN 2.15 2.21 2.24 2.17
CHF 8.43 7.91 8.77 7.49
BRL 2.16 2.89 2.57 2.92
The company does not currently hedge foreign exchange exposure. In connection with the disposal of a foreign operation, the accumu-lated translation differences attributable to the operation are recog-nised in the consolidated income statement.
RevenueSales revenue, which is synonymous with net sales, is recognised at the fair value of the consideration received, or which shall be received, taking into account any discounts and rebates. Revenue recognition takes place in the income statement when it is probable that the future economic benefits will accrue to the group and these benefits can be measured in a reliable manner. Revenue includes only the gross inflow of economic benefits that the company receives or can receive for its own benefit. Revenue from rendering services is recognised when the economic benefits for the services performed can be measured reliably and the economic benefits accrue to the group.
Group revenue consists of payments from the companies and organisations that advertise and market their products and services via the group. Revenue consists of variable transaction and consult-ing revenue (called Transaction revenue) and of fixed start-up and monthly fees (called Other revenue).
For the parent company, revenue mainly consists of licensing fees charged to subsidiaries. The parent company’s license fees are based on the current rules for transfer pricing and calculated so that a mar-ket margin remains in the subsidiary with respect to the services the subsidiary perform and the risks that the business causes.
Transaction revenueMost of the company’s revenue consists of transaction revenues. These are mainly variable and may be compared with the economic benefit from rendering a service without any specific time con-straints. Within the terms of rendering a service, revenue is continu-ously calculated based on transaction volume and price per transac-tion. The criteria for recognition of this revenue are applied to each individual transaction or summation of transactions.
Other revenueMost of the company’s other revenue consists of fixed start-up and monthly fees. These revenues are connected to rendering services in which the company gives the customer the right to use the compa-ny’s technology, among other things. The right of use is mainly gov-erned via a rendering of services. The criteria for recognition of these revenues are applied to each rendering of a service.
Operating expenses and financial income and expensesCost of goods soldCost of goods sold consists of payments to publishers and is recog-nised as revenue when recognition takes place. The valuation of the
liabilities to publishers is based on IAS 39 VT8. In accordance with IAS 39 made estimates of expected payments and when they take place in time. The liability is adjusted periodically to reflect the revised estimated future cash flows.
Financial income and expensesInterest income is primarily interest on bank deposits and is recog-nised in the income statement as it arises by application of the effec-tive interest method. Dividend income is recognised in the income statement when the group secures the right to receive payments. Financial expenses consist of interest costs on borrowings, the effect of dissolution of present value computation of provisions, loss on changes in value of financial assets measured at fair value via the income statement, impairment of financial assets and such losses on hedging instruments that are recognised in the income statement. Exchange gains and exchange losses are recognised net.
Financial instrumentsFinancial instruments on the asset side that are recognised in the balance sheet include cash and cash equivalents, short-term investments, trade and financial receivables. Liabilities include trade payables, liabilities to publishers, bond loan and liabilities to credit institutions.
Recognition and derecognition in the balance sheetA financial asset or financial liability is carried in the balance sheet when the company or one of its subsidiaries becomes a party under the commercial terms of the instrument. Trade receivables are car-ried in the balance sheet when the invoice has been sent. Liabilities are carried when the counterparty has performed and there is a con-tractual obligation to pay, even if the invoice has not yet been received. Trade payables are recognised upon receipt of invoice.
A financial asset is derecognised when the contractual rights to the asset are realised, extinguished or the company loses control over them. The same rule applies for part of a financial asset. A financial liability is derecognised when the contractual obligation has been discharged or in some other manner has been extin-guished. The same rule applies for part of a financial liability.
Acquisition and disposal of financial assets are recognised on the transaction date, which represents the day when the company com-mitted to acquire or dispose of the asset.
The fair value of investments in securities and derivative instru-ments is determined using official market quotations at the end of the reporting period. In cases where these are not available, meas-urement occurs using generally accepted methods such as discount-ing of future cash flows at quoted market rates of interest for each maturity. Translation to Swedish kronor takes place using the Riks-bank’s rates at the end of the reporting period.
Classification and measurementFinancial instruments that are not derivatives are initially recognised at the cost of acquisition corresponding to the fair value of the instrument plus transaction costs for all financial instruments, apart from those classified as financial assets recognised at fair value via the income statement, which are recognised at fair value excluding transaction costs. A financial instrument is classified on initial recog-nition based on the purpose for which the instrument was acquired. The classification determines how the financial instrument is meas-ured after the initial reporting date, as described below.
Loan receivables and trade receivablesLoans and receivables are financial assets that are not derivative instruments, which have fixed or determinable payments and which are not quoted on an active market. These assets are measured at amortised cost according to the effective interest method.
Trade receivables are recognised at the amount that is expected to be received less doubtful debts, which are assessed individually. Trade receivables have short expected maturities, which is why the value of each receivable is carried at its nominal amount without dis-counting. Impairment losses on trade receivables are recognised in operating expenses.
Receivables with expected maturities of more than one year are classified as non-current receivables and those with shorter maturi-ties are classified as other receivables.

21 Tradedoubler Annual Report 2015
Notes
Financial assets measured at fair value through profit or loss Financial assets measured at fair value through profit or loss are divided into two subcategories: Financial assets held for trading as well as financial assets identified at initial recognition as belonging to this category. Financial assets held for trading are defined as financial assets acquired principally for the purpose of selling or repurchasing in the short-term. The group’s investments in corporate bonds and related derivatives for hedging of foreign currency bonds have been classified in the category of financial assets held for trading.
Assets in this category are measured initially and in subsequent financial statements at fair value. All changes in value arising are rec-ognised in profit or loss.
Financial liabilitiesFinancial liabilities are measured at amortised cost. Accrued cost is determined on the basis of the effective interest rate measured when the liability was carried. This means that surplus and deficit values, as well as direct issue expenses, are allocated over the term of the liability.
Trade payables have short expected maturities and are measured at their nominal value without discounting.
Cash and cash equivalentsCash and cash equivalents consist of cash in hand and directly accessible balances at banks and similar institutions as well as short-term highly liquid investments with original maturities of less than three months which are only subject to an insignificant risk of fluctu-ation in value.
Property, plant and equipmentOwned assetsProperty, plant and equipment is recognised as an asset in the bal-ance sheet if it is probable that the future economic benefits will accrue to Tradedoubler and the cost of the asset can be reliably measured. The cost of acquisition is defined as the purchase price and the costs of putting the asset in place.
Property, plant and equipment is recognised in the group at cost less accumulated depreciation and any impairment losses. Addi-tional expenditure is added at cost only if it is probable that the future economic benefit associated with the asset will increase. All other expenditure is expensed.
Property, plant and equipment consisting of units with different useful lives are treated as separate items of property, plant and equipment.
The carrying amount of an item of property, plant and equipment is derecognised on retirement or disposal or when no future eco-nomic benefits can be expected from its use. Gains or losses arising from disposal or retirement of an asset consist of the difference between the selling price and the asset’s carrying amount less directly related selling expenses. Gains and losses are recognised as other operating income/expenses.
Leased assetsThe leases in the group have been classified as operating leases, which means that the lessor retains the absolute majority of the risks and the benefits of ownership of an asset. Operating leases mean that leasing fees are expensed on a straight-line basis over the term of the lease, which may differ in practice from the amount of leasing fees paid during the year.
Depreciation methodsDepreciation takes place on a straight-line basis over the estimated useful life of the asset.
Equipment Three to five years
An assessment is made of an asset’s residual value and useful life every year.
Intangible non-current assets Goodwill Goodwill is measured at cost less any accumulated impairment losses. Goodwill is distributed to cash-generating units and is tested at least once annually for any impairment need. Impairment testing is carried out more frequently if there are indications that the unit may need to be impaired. If the recoverable amount of the cash-gen-erating unit is less than the unit’s carrying amount, the impairment
loss is allocated first to reduce any goodwill carrying amount allo-cated to the unit and is then allocated proportionately to the unit’s other assets based on the carrying amount of each asset in the unit.
In business combinations where the cost of acquisition is less than the net value of acquired assets, and liabilities and contingent liabilities assumed, the difference is recognised directly in net profit.
DevelopmentExpenses for new or substantially improved products or processes are carried as assets in the balance sheet only if the product or pro-cess is technologically or commercially viable and the group has suf-ficient resources to complete development. Capitalisation may occur when a new platform or functionality is developed and includes costs of materials, direct work and a reasonable share of the indirect costs. System maintenance costs are expensed as they arise. Capital-ised development expenses are recognised at cost less accumulated depreciation and impairment losses.
Administration and supportThis category includes system tools for customer management and finance among other things. These intangible assets are deemed to have a longer useful life than those within the Development cate-gory, mainly due to a longer product lifecycle in the market. In this category, capitalised expenditure is also recognised at cost less accumulated amortisation and impairment losses.
Other intangible assetsOther intangible assets acquired by the group consist of client rela-tions, technology platforms and trademarks, and are recognised at cost less accumulated amortisation (see below) and impairment losses.
Additional expenditureAdditional costs for capitalised intangible assets are recognised as an asset in the balance sheet only when they increase the future economic benefits of the specific asset to which they relate to. All other costs are expensed as they arise.
Amortisation methodsAmortisation is recognised in the income statement on a straight-line basis over the estimated useful lives of the intangible assets, provided such useful lives are determinable. Goodwill and intangible assets with an indeterminable useful life are tested for impairment on an annual basis and as soon as there are indications suggesting that the asset in question has decreased in value. Intangible assets that may be amortised are amortised from the date from which they are available for use. The estimated useful lives are:
Client relations Seven years
Technology platforms Three years
Trademarks Five years
Development Three years
Administration and support Five years
Impairment lossesThe carrying amounts of the group’s assets are tested on each balance sheet date in order to determine if there is any indication of an impair-ment need. IAS 36 is applied for testing impairment needs of assets other than financial assets, which are tested in accordance with IAS 39, assets for sale and disposal groups, which are tested in line with IFRS 5, and deferred tax receivables. For exempted assets, as above, the carrying amount is tested in accordance with each standard.
Impairment testing of property, plant and equipment and intangi-ble assets and participations in subsidiaries.At the end of each reporting period the Group’s assets are tested for impairment. If there is an indication of impairment, the asset’s recov-erable amount is calculated using IAS 36 (see below). Goodwill has been allocated to cash-generating units and, together with intangi-ble assets with an indeterminate period of use and intangible assets not in use, is subject annual impairment testing even if there is no indication of diminished value. If it is impossible to determine signifi-cant independent cash flows to a single asset, the assets should be grouped, in conjunction with impairment testing, at the lowest level at which it is possible to identify significant independent cash flows - a so-called cash-generating unit.

22Tradedoubler Annual Report 2015
Notes
An impairment loss is recognised when the carrying amount of an asset or cash-generating unit (group of units) exceeds its recoverable amount. An impairment loss is charged to the income statement. The recoverable amount is the higher of the fair value less selling expenses and value in use. In calculating value in use, future cash flows are discounted using a discounting factor that takes into account the risk-free rate of interest and the risk relating to the spe-cific asset.
Impairment testing of goodwill Goodwill consists of the amount by which the acquisition cost exceeds the fair value of the net assets acquired by the group in con-junction with a company acquisition or acquisition of assets and lia-bilities Goodwill arising from the acquisition of an associated com-pany is included in the carrying amount for the associated company.Goodwill is allocated to cash-generating units upon acquisition and is not amortised, but is tested annually to identify any impairment needs. Goodwill is measured at acquisition cost less any accumu-lated impairment losses. Impairments of goodwill are not reversed. The recognised revenue from the disposal of a group company includes the remaining carrying amount of the goodwill attributable to the divested unit.
Impairment testing of financial assetsIn connection with quarterly financial reporting, Tradedoubler assesses whether there is objective evidence that a financial asset or group of assets requires impairment. Objective evidence consists partly of observable circumstances that occurred and which have a negative impact on the possibility to recover the cost of acquisition.
The recoverable amount of assets belonging to the categories of loan receivables and trade receivables, which are recognised at amortised cost, is measured as the present value of future cash flows discounted by the effective rate that applied upon initial recognition of the asset. Assets with short maturities are not discounted. An impairment loss is charged to the income statement.
Reversal of impairment lossesAn impairment loss is reversed if there is an indication that an impairment need no longer exists and a change has occurred in the assumptions that provided the basis for the measurement of the recoverable amount. A reversal is only made to the extent that the carrying amount of the asset after reversal does not exceed the car-rying amount that would have been recognised, less amortisation where appropriate, if no impairment had been made. Impairment of goodwill is never reversed.
Impairments of loan receivables and trade receivables recognised at amortised cost are reversed if a later increase in the recoverable amount can be objectively attributed to an event that occurred after the impairment was made.
Earnings per shareThe calculation of earnings per share is based on the group’s net profit for the year attributable to the parent company’s shareholders and on the weighted average number of shares in issue during the year. In the calculation of earnings per share after dilution, the profit and the average number of shares are adjusted to take account of the effects of dilutive potential ordinary shares, which consisted of options issued to employees during the presented periods.
Employee benefitsDefined-contribution plansThe group mainly operates defined contribution pension plans. In defined contribution plans, Tradedoubler pays fixed fees to an insur-ance company and has no obligation to pay further amounts.
Obligations in respect of charges for defined contribution plans are recognised as an expense in the income statement as they arise.
Compensation on termination of employmentA provision is recognised in conjunction with the termination of employment only if it is evident that Tradedoubler is obligated, with-out any realistic possibility of withdrawal, by a formal detailed plan to terminate employment before the normal retirement date. When remuneration is offered to encourage voluntary retirement, it is rec-ognised as a cost if it is likely that the offer will be accepted and the number of employees accepting the offer can be reliably estimated.
Share-based paymentThe company’s share programme allows selected persons to acquire shares in the parent company. The fair value of the shares is recog-nised as a personnel cost in the profit and loss account. The fair value of the shares is estimated based on generally accepted valua-tion models taking into consideration the terms and conditions pre-vailing on the allotment date, including the closing price, statistics on the volatility of the share price and estimated future dividends. The costs will be allocated during the vesting period.
During every year-end closing, an assessment is made as to whether, and to what degree, the vesting conditions will be fulfilled. If this assessment results in an estimate of a lower number of shares being earned during the vesting period, previously expensed amounts are reversed in the income statement. This means that in those cases where the vesting requirements are not fulfilled, no costs will be recognised in the income statement, as viewed over the entire vesting period.
Social security contributions attributable to the share programme are recognised as a personnel cost and a personnel-related liability, respectively. Provisions for social security contributions are calcu-lated using the best estimate at each closing date of the group’s future liability for social security contributions. The provision for social security contributions is allocated over the vesting period. The calcu-lations are based on the fair value of the shares on each closing date.
ProvisionsProvisions are recognised in the balance sheet when the group has an existing legal or informal obligation as a result of past events, and it is probable that an outflow of financial resources will be required to settle the obligation and that the amount can be reliably estimated. Provisions include leases where the outlay exceeds the economic ben-efits. In cases where the effect of payment timing is significant, provi-sions are calculated by discounting the expected future cash flow at an interest rate before tax that reflects current market assessments of the time value of money, and if applicable, the risks specific to the liability.
TaxesIncome taxes in the income statement include both current tax and deferred tax. Taxes are recognised in the income statement except where the underlying transaction is recognised in other comprehen-sive income or directly against equity.
Current tax is tax that shall be paid or received in respect of the current year, using the tax rates which, have been enacted or which in practice were enacted on the balance sheet date. This also includes adjustments of current tax relating to previous periods.
Deferred taxes are estimated in accordance with the liability method, based on temporary differences between the tax bases of assets and liabilities and their carrying amounts. The following tem-porary differences not taken into consideration; temporary differ-ences arising on the initial recognition of goodwill, the initial recog-nition of assets and liabilities that are not business combinations and, which on the transaction date did not affect the recognised or taxable result. Furthermore, temporary differences are not taken into consideration that are attributable to investments in subsidiaries and associated companies and, which are not expected to be reversed within the foreseeable future. The measurement of deferred tax is based on how the carrying amounts of assets or liabilities are expected to be realised or settled. Deferred tax is measured using the tax rates and tax regulations which, have been enacted or which in practice were enacted on the balance sheet date.
Deferred tax assets in respect of deductible temporary differences and loss carry-forwards are only recognised to the extent that it is probable that they can be utilised. The value of deferred tax assets is reduced when it is no longer considered probable that they can be utilised.
Any additional income tax arising on dividends is recognised at the same time as the dividend is recognised as a liability.
Contingent liabilitiesA contingent liability is recognised when there is a possible obligation arising from past events and whose occurrence can only be con-firmed by one or more uncertain future events or when an obligation arises which cannot be recognised as a liability or provision as it is not probable that an outflow of resources will be required or the size of the obligation cannot be estimated with sufficient reliability.

23 Tradedoubler Annual Report 2015
Notes
C2. Critical estimates and judgementsThe preparation of accounts and the application of accounting poli-cies is often based on the management’s judgements and on esti-mates and assumptions that are deemed to be reasonable at the time the judgement was made. However, the result may be different using different judgements, assumptions and estimates and events can occur which can require a significant adjustment of the carrying amount of the asset or liability in question. The accounting policies whose application is based on such judgements are described below and the most important sources of uncertainty in the estimates that the company believes may have the most important impact on the group’s reported results and financial position. The information in this note refers to those areas, where risk of future adjustments of carrying amounts is greatest.
GoodwillTesting of goodwill is based on estimates and assumptions regarding the future. As the company conducts operations in a relatively young industry, which is characterised by development and constant changes, these assumptions are an uncertainty factor. Impairment of goodwill in 2015 resulted in a writedown of SEK 72 M (60). The basis for Tradedoubler’s goodwill impairment test was, as previous year’s, a 10-year discounted cash flow analysis per cash generating unit (segment). The value per segment, derived from the discounted cash flow analysis, changed compared to last year due to changes in out-look per segment. As a consequence, the goodwill referring to seg-ment France & Benelux has been written down by SEK 50 M and seg-ment South has been written down by SEK 22 M. The writedown was mainly explained by the unsatisfactory development in 2015, a related downward revision of future growth potential in existing business and therefore reduced potential for additional sales of new offerings. After the writedown goodwill amounted to SEK 246 M (324) at the end of 2015.
Deferred tax assetsThe group recognises deferred tax assets on loss carryforwards of SEK 0.9 M (25.2). A writedown of deferred tax from previous periods of SEK 23 M (0) was conducted during 2015 related to revised assumptions of the possibility to use loss carried forward. The remaining deferred tax assets are primarily attributable to tax loss carryforwards in the UK. The valuation of loss carryforwards and the ability to utilise these are based on management’s estimates of future taxable income in the various tax areas.
Other intangible assetsThe company’s intangible assets comprise, in addition to Goodwill and deferred tax assets, of internally-developed and acquired prod-ucts. The products that are directly related to the company’s core business have a shorter estimated useful life and are amortised at a faster rate. Each year an impairment test is performed, both for the intangible assets that are in use as well as for those not yet in use. Impairment test 2015 resulted in a writedown of SEK 13 M (0) related to capitalised expenses that did not meet the requirements in the impairment test. See Note C1 and C13 for further information.
Trade receivablesThe group monitors the financial stability of its customers and the conditions under which they operate to estimate the probability of payment in the case of each individual receivable. As of December 31, 2015 the total provisions for doubtful receivables in the balance sheet amounted to SEK 33.1 M (46.6). All trade receivables older than 12 months is written of as doubtful unless there are no special reasons.
Publisher debtThe valuation of the liabilities to publishers is based on IAS 39 VT8. In accordance with IAS 39 requires estimates of expected payments and when they take place in time. In 2014 this resulted in a positive one-time adjustment of the debt with SEK 8 M. No material adjust-ment was made in 2015.
C3. Distribution of revenue
SEK ´000 2015 2014
Transaction revenue 1,589,166 1,703,391
Other revenue 35,098 29,258
Net sales 1,624,264 1,732,649
C4. Segment reportingTradedoubler had six segments during 2015. Five of the segments consisted of market units within Affiliate (DACH, France & Benelux, Nordics, South, UK & Ireland) and the sixth segment consisted of the business unit Technology.
Affiliate’s market units consisted of the following countries;- Germany, Switzerland and Austria (DACH)- France, Belgium and the Netherlands (France & Benelux)- Sweden, Norway, Denmark, Finland and Poland (Nordics)- Italy, Brazil, Portugal and Spain (South)- UK and Ireland (UK & Ireland)
Identification of segments is based on the internal reporting to the chief operating decision-maker. Reporting and follow up took place based on the geographical regions that served as the basis of divi-sion for the segment reporting.
The group’s chief operating decision-maker continually moni-tored Net Sales and EBITDA per segment.
Intra-group transfer prices between different segments are set based on the “arm’s length” principle, in other words, between par-ties that are independent of each other, well informed and with an interest in completing the transactions.
Operating profit for the parent company, central functions and eliminations are allocated to the segments.
The same accounting policies as for the group are applied in the segment reporting.
Tradedoubler has no customers which account for revenues of more than 10 per cent of the company’s total revenues for the years 2015 or 2014.
Net Sales* EBITDA**
SEK ´000 2015 2014 2015 2014
Market Unit DACH 199,830 200,930 13,722 17,042
Market Unit France & Benelux 336,842 416,256 8,698 25,473
Market Unit Nordics 315,944 330,176 27,817 36,993
Market Unit South 168,795 193,536 12,853 12,974
Market Unit UK & Ireland 530,641 509,412 24,453 31,149
Total Network 1,552,052 1,650,310 87,543 123,631
Business Unit Technology 49,654 50,502 16,249 35,420
Group management and supporting functions 22,558 31,837 -139,918 -139,359
Total continued operations 1,624,264 1,732,649 -36,126 19,692
* Net sales in 2014 includes a correction of SEK -10 M relating to an error in the prepayment balance, this correction has been affecting net sales per segment for DACH -1, France & Benelux -3, North 4, South -2, UK & Ireland 2, Technology -1 and Other -8. Net sales in 2015 includes a correction of SEK -5 referred to an adjustment of recurring errors relating to the invoicing to one large customer since mid-2013. For more information see Note C25.
**EBITDA has been affected by change related items, see Note C25 for further information. The variance between EBITDA above of SEK 19,692,000 (53,403,000) and group EBIT according to the Consoli-dated financial statements is attributed to depreciation and amorti-zation of SEK 83,040,000 (29,893,000).

24Tradedoubler Annual Report 2015
Notes
Gegraphical information
SEK ´000 2015 2014
Sweden 136,063 122,200
Great Britain 532,375 504,962
France 286,008 353,067
Germany 158,924 145,993
Italy 92,562 105,763
Spain 86,570 106,439
Other 331,762 394,225
Total 1,624,264 1,732,649
Revenue from external customers is recognised per geographical area in which the revenue was generated.
For geographical information regarding goodwill, see Note C13. Tradedoubler’s other intangible assets are accounted for in the
parent company, for more information see Note P12 Intangible assets in notes to the parent company accounts.
C5. Remuneration to employees, group management and board of directorsAverage number of employees 2015 2014
men (%) men (%)
Parent company
Sweden 60 60 46 54
Subsidiaries
Belgium 0 0 0 0
Brazil 0 0 0 0
Denmark 0 0 1 100
Finland 0 0 1 100
France 41 46 43 44
Ireland 0 0 0 0
Italy 17 54 21 45
Lituaen 0 0 4 47
Netherlands 13 64 15 43
Norway 0 0 7 63
Poland 31 52 30 48
Portugal 0 0 0 0
Switzerland 12 55 10 67
Spain 20 40 21 36
UK 135 48 133 53
Sweden 15 77 14 69
Germany 34 60 29 51
Austria 0 0 0 0
Total subsidiaries 318 52 329 51
Total group 378 53 375 51
*Including permanent and temporary employees
Distribution of men and women in board of directors and group management
Share women (%) 2015 2014
The board of directors 17.0 20.0
President and other senior executives 0.0 0.0
Remuneration to employees distributed between the Parent Company and subsidiaries
Salaries and other
remuneration
Social fees (of which pension)
Salaries and other
remuneration
Social fees (of which pension)
SEK ‘000 2015 2014
Parent company 41,081 15,737 39,703 13,260
(3,990) (3,017)
Subsidiaries 147,722 29,554 143,049 31,686
(4,501) (4,927)
Total 188,803 45,291 182,752 44,946
Capitalisation of personnel-related development costs amounted 2015 to SEK 11 M (2).
Cost of remuneration to employees
SEK ‘000 2015 2014
Salaries and remuneration 188,803 182,752
Share-based payments 493* 741
189,296 183,493
Pension expenses 8,491 7,944
Social security contributions 36,800 37,002
Social security contributions attributable to share-based payments 333* 87
45,624 45,033
Total 234,920 228,526
*Refers to the cost of the 2015 programme

25 Tradedoubler Annual Report 2015
Notes
Remuneration to the president, group management and board of directors
2015 2014
Remuneration and other benefits, (SEK ‘000)
Basic salary, other
remuneration directors’ fees3
Variable remune-
ration
Long-term incentive programs
Pension obligations Total
Basic salary, other
remuneration directors’ fees3
Variable remune-
ration
Long-term incentive programs
Pension obligations Total
The Board of Directors
Pascal Chevalier 164 - - - 164 - - - - -
Peter Larsson 86 - - - 86 250 - - - 250
Thomas Bill 86 - - - 86 250 - - - 250
Mikael Nachemson 164 - - - 164 - - - - -
Martin Ahrend 86 - - - 86 163 - - - 163
Martin Henricson 86 - - - 86 250 - - - 250
Mernosh Saatchi 250 - - - 250 163 - - - 163
Gautier Normand 164 - - - 164
Henrik Kvick 164 - - - 164 - - - - -
Peter Åström 164 - - - 164 - - - - -
Lars Sveder - - - - - 87 - - - 87
Simon Turner - - - - - 87 - - - 87
Rob Wilson (CEO)1 - - - - - 4,125 - -40 221 4,306
Matthias Stadelmeyer (CEO)2 3,029 - 90 43 3,162 1,718 601 - 41 2,360
Other group managment4 5,478 - 59 642 6,179 5,851 450 - 774 7,075
Total 9,921 - 149 685 9,341 12,944 1,051 -40 1,036 14,991
1 Rob Wilson was President and CEO between June 2012 and April 2014. Severance pay and termination benefits were paid after the termination of employment.
Termination benefits amounted to SEK 3,990,000.2 Acting CEO from 23 April 2014, permanently from 1 September 2014.3 Directors’ fees are periodised based on the calendar year.4 Including severance payment to former CTO and a one-time remuneration to CFO (paid in August), both according to employee agreements.
Remuneration to the Board and group managementFees to board members and members of the board’s committeesThe annual general meeting 2015 approved the following remunera-tion to the board of directors: SEK 250,000 to the chairman of the board and to each of the other board members elected by the annual general meeting who are not employed in Tradedoubler.
Guidelines for remuneration to group managementThe annual general meeting 2015 resolved on the following guide-lines for remuneration to senior executives, which refers to the chief executive officer and other members of the group management (the company management).
The total remuneration shall be competitive in the local market in which the employee is based in order to attract, motivate and retain skilled employees. The individual remuneration should be based on the employee’s experience, skills, responsibilities and performance.
The total remuneration should be based on four main compo-nents; fixed salary, variable remuneration, pension benefits and long-term incentive programme. The fixed salary shall be commer-cially competitive and based on experience, skills, responsibilities and performance. Variable remuneration should be commercially competitive and reward growth, operating profit and should be applied consistently throughout the group. It should be based on predetermined measurable targets, both quantitative and qualitative, and agreed in writing with the employee.
The outcome of the variable remuneration programme should have an upper ceiling, which normally should not exceed 50 per cent of the fixed salary.
Pension benefits may be offered to certain members of the com-pany management depending on local market conditions. Swedish-based employees are offered a solution which largely corresponds with the ITP plan.
A mutual period of notice of 3-9 months shall apply for the com-pany management. In the event of termination by the Company, ter-mination benefits, in applicable cases, should not exceed an amount equivalent to 12 fixed monthly salaries. In the event of termination by the employee, he/she should not normally be entitled to any ter-mination benefits.
In addition to variable remuneration, which rewards growth and operating profit during the financial year, the board considers that
long-term incentive programmes are an important part of the long-term compensation strategy. The board resolved that the Company shall continue to invite the company management and other key people to participate in a long-term share-related o r share-price-related incentive programme. The board considers among other things that such a programme should, imply continued employment in the group. Share-related and share-price-related incentive pro-grammes has been en approved by the general meeting of shareholders.
Other benefits, such as car benefit, should have a limited value in relation to the total remuneration package.
Questions regarding terms of employment for the chief executive officer are determined by the board. The chief executive officer determines terms of employment for other members of the company management after approval by the remuneration committee.
The board of directors or the remuneration committee may depart from these guidelines if special grounds exist in a particular case.
Remuneration policy for employeesThe aim of Tradedoubler’s remuneration policy is to offer fair, com-petitive, market-based remuneration that promotes recruitment and retention of skilled employees.
Pension benefitsTradedoubler offers pension plans in some markets that are adapted to local market conditions. The pension plans are mainly defined contribution plans, i.e. Tradedoubler pays fixed fees to an insurance company and has no further obligations subsequently. Obligations regarding fees for defined contribution pension plans are recognised as a cost in the income statement when they arise. The retirement age for all senior executives is 65. No right to early retirement exists.
Variable remunerationTradedoubler operates a performance- and results-based annual programme for variable remuneration for employees within the group. Various quantitative and qualitative performance- and results-based targets are set for different occupational categories, based on company-wide, and regional targets for the employees. The company management receives variable remuneration which is mainly linked to the group’s financial performance. The variable remuneration has a ceiling. The ceiling lies in the range of between

26Tradedoubler Annual Report 2015
Notes
10 and 50 per cent of the fixed salary for the majority of employees. For the group management, the variable remuneration may amount to a maximum of 50 per cent of the fixed salary.
Variable remuneration is paid annually in arrears, however, por-tions of the variable salary are determined and disbursed on a quar-terly basis for employees within the occupational categories Sales and customer service.
During 2015, SEK 6.3 M (8.7) including social security contribu-tions was expensed for the performance- and results-based pro-gramme for variable remuneration. With the former composition of the group management (as of 31 December 2015), the maximum out-come for the variable remuneration programme in 2015 would have amounted to approximately SEK 0 M (3.2). For 2015 the long-term incentive programme has replaced the variable salary for the group management.
Remuneration group managementFor the CEO a mutual period of notice of 6 months shall apply. In the event of termination by the Company, the CEO is entitled to 6 months fixed salary and pension benefits. Pension benefits are based upon German praxis and do not exceed 25 per cent of the base salary. If the employment is terminated by the Company, the CEO does not have to perform any work during the last 3 months of the notice period and the CEO is, in this case, also entitled to severance payment of three months base salary. The latter shall be reduced with other income that the CEO has during this period. The CEO par-ticipate in the long-term incentive programme approved in 2015 by the Annual General meeting and therefore has no possibility to receive variable remuneration.
During 2015, other group management included CFO and CTO. Since early 2016, other group management includes CFO, COO, Chief Strat-egy Officer and Vice President Business Development. The following applied within other group management during 2015; if the employee terminates the contract, a period of notice of 6 months applies. If the Com pany terminates the employment, the notice period never exceeds 12 months. For new members of other group management, since the beginning of 2016, the notice periods from both employees and the Company is generally shorter than it was for other group management during 2015. Pension benefits do not exceed 25 per cent of the base salary for anyone within other group management, either in 2015 or currently.
All members of the present group management, but one, participate in the long-term incentive program approved in 2015 by the Annual General Meeting. Just as in 2015, no member of present group man-agement has a company car or any other material benefits. No member of present other group management has a company car or any other material benefits, nor in 2015.
C6. Share-based remuneration
Long-term incentive programmesThe group had two outstanding long-term incentive programmes during 2015.
Supply of shares to the participants of the Performance-related share programme has been secured through previous purchases of own shares in TradeDoubler AB (publ) with 475,000 shares and an additional purchase of 3,120,000 C-shares during 2015. Tradedoubler has hence 3,595,000 shares in its own custody. It is the view of the board that existing shares in own custody will in all materiality cover the outcome of the Performance-related share programmes.
Personnel expense (including social security contribution) arising from share-based remuneration
SEK ‘000 2015 2014
Personnel expense (including social social security contributions) arising from share-based remuneration -223 828
Total personnel expense arising from share-based remuneration -223 828
Performance-related share programme 2013 to 2015The annual general meetings 2013, 2014 and 2015 resolved on perfor-mance-related share programmes for key people in the group. The pro-grammes aim to boost the group’s attractiveness as an employer and to encourage key personnel to continued loyalty and continued good per-formance. The target for the 2013 programme was not achieved and therefore no allotment was made from the programme. The resolved programme for 2014 was never launched due to limited interest from key people in the group. During the fourth quarter 2015, the company reversed a previously recognised charge of SEK 1 M in respect of option programme 2012 and 2013. The reversal was made since the company estimated that the performance requirement would not be achieved. The cost of the 2015 programme amounted to SEK 825,000.
The programme 2015 includes 24 key employees including the CEO. Participants in the programme must waive their right to short term vari-able remuneration during the three year term of the Program. Alloca-tion in the programme is contingent upon that the share price, includ-ing dividends, in Tradedoubler increases with more than 100 per cent during the performance period starting on 1 June 2015 and ending 31 May 2018 (the “Performance Period”). If the goal is met the shares will be allotted, if not there will be no allotment. An even greater increase in share price will not result in any increased allocation. The calculation shall be based on a comparison of the average price paid for the share on Nasdaq Stockholm during the three months period immediately before 1 June 2015 and the three months period immediately before 31 May 2018. For allotment of shares it is further required, with certain exceptions, that the employment within the Tradedoubler group has remained during the entire Performance Period.
In the event of a change of control in Tradedoubler during the Perfor-mance Period it is not required that the share price has increased with 100 per cent in order for allotment to take place. Consideration shall be taken to the proportion of the Performance Period elapsed before the change of control occurs. This means for example that if a change of control occurs on 31 December 2016 and the share price at that time has increased with more than 50 per cent (the calculation shall be based on an average price paid for the share on Nasdaq Stockholm dur-ing the three months period immediately before 1 June 2015 and the three months period immediately before the occurrence of the change of control) the participants shall be entitled to full allotment under the programme. In case there is no reasonable liquidity in the share the participants shall be compensated with cash remuneration equivalent to the value of the shares the participant would be entitled to.
No of remaining participants
Total no of outstanding savings shares
Share programme 2015 24 2,400,000
C7. Remuneration for auditor
SEK ‘000 2015 2014
EY
Audit assignments 4,268 3,961
Tax services 380 466
Other assignments 337 371
Other auditors
Audit assignments 184 162
Tax services 45 40
Other assignments 46 13
Total 5,260 5,013
Audit assignments refers to the examination of the annual accounts, the consolidated accounts and accounting records as well as the administration of the board of directors and the CEO, other duties that the Company s auditors are obliged to perform as well as advice or other assistance arising from observations during such examina-tion and implementation of such duties. In addition, the auditor reviewed the corporate governance report. The auditor has also reviewed the interim report for the period January-September 2015 and has been retained for certain advice, most of which pertained to audit-related consultations regarding accounting and tax matters.

27 Tradedoubler Annual Report 2015
Notes
C8. Operating costs allocated by type of cost
SEK ´000 2015 2014
Remuneration cost to publishers 1,292,420 1,355,589
Employee costs 230,661 220,218
Depreciation and amortisation 109,261 83,039
Other operating costs 137,309 137,151
Total 1,769,650 1,795,997
C9. Operating leasesLeasing where the Company is lessorNon-terminable lease payments amount to:
SEK ‘000 2015 2014
Within one year 16,696 15,500
Between one and five years 26,914 31,376
Longer than five years 21,979 12,944
65,589 59,820
The operating leases in the group are mainly related to rent for premises.
Costs for operating leases amounted to SEK 20,515,000 (25,212,000) for the group in 2015.
C10. Net financial items
SEK ‘000 2015 2014
Interest income on bank balances & short-term investments 4,812 11,052
Interest income, other 38 735
Unrealised result from short-term investments 5,272 -
Result on sales short-term investments - 626
Financial income 10,122 12,413
Interest expenses on financial liabilities measured at amortised cost -18,048 -18,051
Result from sales of shares in subsidiaries - -330
Interest expense, other -365 -214
Unrealised loss from short-term investments - -4,218
Result on sales short-term investments -4,814 -
Changes in foreign exchange rates -5,558 -8,932
Financial expence -28,785 -31,745
Net financial items -18,663 -19,332
C11. Taxes
Recognised in the income statementThe company’s tax expense is divided into the following components:
SEK ‘000 2015 2014
Current tax expense
Tax expense for the period -4,366 -5,688
Tax expense related to previous periods -507 899
Total current tax expense -4,873 -4,789
Deferred tax expense
Deferred tax in respect of temporary differences 2,744 -2,808
Deferred tax expense due to utilisation and adjusted estimates of previous capitalised loss carryforwards for tax purposes -23,647 7,932
Total deferred tax expense -20,903 5,124
Total -25,776 335
The tax expense for the year can be reconciled to profit before tax according to the following:
Reconciliation of effective tax for continued operations
2015 2014
% KSEK % KSEK
Profit before tax -164,049 -82,679
Tax according to applicable tax rate for parent company 22.0 36,091 22.0 18,189
Effect of other tax rates for foreign subsidiaries -1.1 -1,745 -1.3 -1,098
Adjusted estimates for previous year’s loss carryforwards -13.8 -22,598 0.1 66
Non-deductible expenses -12.4 -20,416 -19.0 -15,696
Non-taxable income 2.2 3,546 3.2 2,650
Effect of changed tax rates in UK (UK) -0.2 -355 -0.2 -204
Increase of loss carryforwards for tax purposes without corresponding capitalisation of deferred tax expense -11.5 -18,846 -3.2 -2,647
Utilisation of previousely not capitalised loss carryforwards -0.1 -209 0.0 3
Other -0.8 -1,245 -1.1 -928
Effective tax/tax rate -15.7 -25,776 0.5 335
Deferred tax assets and tax liabilities recognised in the balance sheetDeferred tax assets and tax liabilities are attributable to the following:
Deferred tax assets
Deferred tax liabilities Net
SEK ‘000 2015 2014 2015 2014 2015 2014
Loss carryforwards 929 25,189 929 25,189
Other receivables 769 1,613 769 1,613
Other liabilities 5,080 6,476 -1,281 -6,974 3,799 -498
Other non-current assets 780 908 780 908
Other unused tax deductions1 14,000 14,000 14,000 14,000
Deferred tax assets and tax liabilities 21,558 48,186 -1,281 -6,974 20,277 41,212
1 In 2007 Tradedoubler Ltd. completed the acquisition of all shares in IMW with
proceeds related to a loan from Tradedoubler AB. HMRC (English tax author-
ity) has retrospectively refused deduction of interest in Tradedoubler Ltd’s tax
declaration due to UK thin capitalization rules. Tradedoubler AB has at the
same time declared interest income and, thus, a double taxation arise.
Tradedoubler AB has in an application requested that the Swedish tax author-
ity should initiate proceedings with HMRC in order to eliminate the double
taxation that has arisen. The total book value amounts to SEK 14 M, and
Tradedoubler estimates that this amount will be collectable.
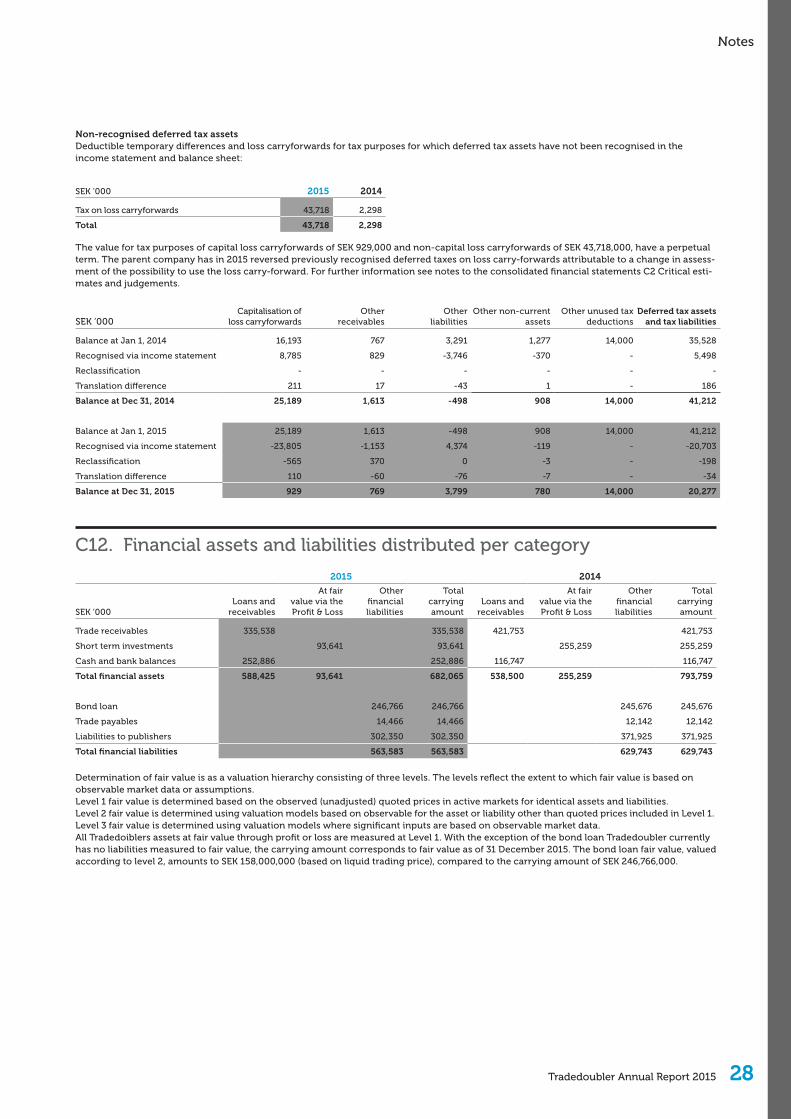
28Tradedoubler Annual Report 2015
Notes
Non-recognised deferred tax assetsDeductible temporary differences and loss carryforwards for tax purposes for which deferred tax assets have not been recognised in the income statement and balance sheet:
SEK ‘000 2015 2014
Tax on loss carryforwards 43,718 2,298
Total 43,718 2,298
The value for tax purposes of capital loss carryforwards of SEK 929,000 and non-capital loss carryforwards of SEK 43,718,000, have a perpetual term. The parent company has in 2015 reversed previously recognised deferred taxes on loss carry-forwards attributable to a change in assess-ment of the possibility to use the loss carry-forward. For further information see notes to the consolidated financial statements C2 Critical esti-mates and judgements.
SEK ‘000Capitalisation of
loss carryforwardsOther
receivablesOther
liabilitiesOther non-current
assetsOther unused tax
deductionsDeferred tax assets
and tax liabilities
Balance at Jan 1, 2014 16,193 767 3,291 1,277 14,000 35,528
Recognised via income statement 8,785 829 -3,746 -370 - 5,498
Reclassification - - - - - -
Translation difference 211 17 -43 1 - 186
Balance at Dec 31, 2014 25,189 1,613 -498 908 14,000 41,212
Balance at Jan 1, 2015 25,189 1,613 -498 908 14,000 41,212
Recognised via income statement -23,805 -1,153 4,374 -119 - -20,703
Reclassification -565 370 0 -3 - -198
Translation difference 110 -60 -76 -7 - -34
Balance at Dec 31, 2015 929 769 3,799 780 14,000 20,277
C12. Financial assets and liabilities distributed per category
2015 2014
SEK ‘000Loans and
receivables
At fair value via the Profit & Loss
Other financial liabilities
Total carrying amount
Loans and receivables
At fair value via the Profit & Loss
Other financial liabilities
Total carrying amount
Trade receivables 335,538 335,538 421,753 421,753
Short term investments 93,641 93,641 255,259 255,259
Cash and bank balances 252,886 252,886 116,747 116,747
Total financial assets 588,425 93,641 682,065 538,500 255,259 793,759
Bond loan 246,766 246,766 245,676 245,676
Trade payables 14,466 14,466 12,142 12,142
Liabilities to publishers 302,350 302,350 371,925 371,925
Total financial liabilities 563,583 563,583 629,743 629,743
Determination of fair value is as a valuation hierarchy consisting of three levels. The levels reflect the extent to which fair value is based on observable market data or assumptions.Level 1 fair value is determined based on the observed (unadjusted) quoted prices in active markets for identical assets and liabilities.Level 2 fair value is determined using valuation models based on observable for the asset or liability other than quoted prices included in Level 1.Level 3 fair value is determined using valuation models where significant inputs are based on observable market data.All Tradedoiblers assets at fair value through profit or loss are measured at Level 1. With the exception of the bond loan Tradedoubler currently has no liabilities measured to fair value, the carrying amount corresponds to fair value as of 31 December 2015. The bond loan fair value, valued according to level 2, amounts to SEK 158,000,000 (based on liquid trading price), compared to the carrying amount of SEK 246,766,000.

29 Tradedoubler Annual Report 2015
Notes
C13. Intangible assets
SEK ‘000Development
expensesAdministration
& Support Goodwill Other Total
Accumulated acquisition costs
Opening balance at Jan 1, 2014 45,009 45,275 499,572 13,219 603,075
Investments for the year 15,444 1,198 - - 16,642
Sales/disposals - - - -13,001 -13,001
Translation difference - - 41,478 244 41,722
Closing balance at Dec 31, 2014 60,453 46,473 541,050 462 648,438
Opening balance at Jan 1, 2015 60,453 46,473 541,050 462 648,438
Investments for the year 37,861 75 - - 37,936
Sales/disposals - - - - -
Translation difference - - -7,000 -163 -7,163
Closing balance at Dec 31, 2015 98,314 46,548 534,050 299 679,212
Accumulated amortisation and impairment losses
Opening balance at Jan 1, 2014 -14,424 -15,237 -136,864 -12,981 -179,506
Amortisation -12,469 -7,205 -59,993 -254 -79,921
Sales/disposals - - - 13,001 13,001
Translation difference - - -20,511 -216 -20,727
Closing balance Dec 31, 2014 -26,893 -22,442 -217,368 -450 -267,153
Opening balance at Jan 1, 2015 -26,893 -22,442 -217,368 -450 -267,153
Amortisation -26,993 -7,365 -71,725 -299 -106,381
Sales/disposals - - - 288 288
Translation difference - - 1,182 162 1,344
Closing balance Dec 31, 2015 -53,886 -29,806 -287,910 -299 -371,902
Carrying amounts
At Jan 1, 2014 30,585 30,038 362,708 238 423,569
At Dec 31, 2014 33,560 24,031 323,682 12 381,285
At Dec 31, 2015 44,429 16,741 246,140 0 307,310
Amortisation of intangible assets is included in administrative expenses. All intangible assets, aside from goodwill, are amortised.
For further information about depreciation methods, see Note C1 Accounting Policies.
Goodwill is tested annually for impairment or as soon as there are indications of a decline in value. This impairment in 2015 has, as pre-vious years, been performed in conjunction with the year-end report and is based on a 10-year discounted cash flow analysis per cash generating unit (segment). The value per segment changed com-pared to last year due to changes in outlook per segment. As a con-sequence, the goodwill referring to segment France & Benelux has been written down by SEK 50 M and the goodwill referring to seg-ment South has been written down by SEK 22 M. Segment South and DACH were included in last year’s write-down, indicating that the headroom for these two segments was zero in last year’s test. This means implicitly that any negative deviations from the previous year will result in impairment for these two segments. Segment South has during 2015 performed in line with last year’s forecast, however, future potential related to additional sales of new offerings has been revised down and given the non-existent headroom goodwill thus has been written down by SEK 22 M. The writedown in the segment of France & Benelux was mainly due to the unsatisfactory develop-ment in 2015 in this segment, a related downward revision of future growth potential in existing business and therefore reduced poten-tial for additional sales of new offerings. After the writedown, good-will amounted to SEK 246 M (324) at the end of 2015. Apart from the segments affected by the writedown, all other segments but Tech-nology showed a good margin between book value and the recover-able amount. In the Technology segment, the recoverable amount exceeds book value by 4 MSEK.
Tradedoubler has performed a sensitivity analysis including the fol-
lowing parameters; net sales growth, gross margin and discount rate.A decrease of the gross profit growth with one percentage point
during 2017-2025, an increased WACC with two percentage points and a lower gross profit growth with half a percentage point after 2015 would indicate further writeoffs referring to the segments South, France & Benelux and Technology. For the segment Technol-ogy, these changed assumptions would incur a writedown of some 20 MSEK.
Assumed gross profit growth per segment, which is the single most important parameter, is based on organic growth. In the dis-counted cash flow statements, a discount rate (WACC) is used based on the risk-free rate of interest plus a stock market premium.
WACC before tax in the estimates for the six cash-generating units on 31 December 2015 was 15.6 (17.4) per cent. WACC after tax was 13.0 (14.7) per cent.
For estimation of future revenue and growth both external and internal assumptions have been used and they may differ from mar-ket to market. Recent actual and budgeted developments, present market share and the respective markets’ size, assumed growth rates, maturity and competitiveness and assumptions regarding future market share and change of addressable market, thanks to the new strategy, all has an effect of the future growth rates in the differ-ent segments. Based upon the above mentioned analysis the seg-ments DACH, UK & Ireland and Nordics are assumed to have higher gross profit growth rates during 2017-2025 than the other segments. Tradedoublers forecast period is set until 2025. The growth rate after the forecast period is set to 1,5 (1,5) per cent annually, which is a rough assessment of the adressable markets estimated growth. The forecast period exceeds five years since the market for internet mar-keting is a relatively new market and strong growth rates are expected over the next ten years.

30Tradedoubler Annual Report 2015
Notes
C15. Prepaid expenses and accrued income
SEK ‘000 2015 2014
Rent of premises 3,507 7,368
Accrued income 2,012 517
Accrued interest income 430 1,464
Other 5,787 6,258
Total 11,736 15,607
C16. Shareholder’s equity
Share capitalShare capital refers to the parent company’s share capital. Each share carries one vote and those entitled to vote may vote for the full number of shares represented and owned without any restriction in voting rights. All shares carry equal rights to share in the company’s assets and profits and in any surplus on liquidation.
At December 31, 2015, Tradedoubler AB had a share capital of SEK 18.4 M distributed among 45,927,449 shares, each share with a par value of SEK 0.40. Tradedoubler issued new shares during 2015 that increased the number of shares with 3,120,000 C-shares and the share capital with SEK 1.2 M.
Reconciliation of number of sharesNumber of
shares issuedIssued
share capital
Number of shares issued January 1, 2015* 42,807,449 17,122,979
Number of shares issued December 31, 2015** 45,927,449 18,370,978
*of which 475,000 shares are in own custody**of which 3,595,000 shares are in own custody
Translation reserveThe translation reserve includes all exchange differences that arise on translation of financial statements from foreign operations that have prepared their financial statements in another currency than the currency which the group’s financial statements are presented in. The parent company and group present their financial statements in Swedish kronor (SEK).
Retained earnings including net profit for the yearRetained earnings including net profit for the year includes profits earned in the parent company and its subsidiaries. Previous alloca-tions to the statutory reserve, excluding transferred share premium reserves, are included in this equity item.
DividendThe board and CEO will propose to Tradedoubler’s Annual General Meeting 2016 that no dividend should be declared for 2015 in accordance with Tradedoubler’s guidelines.
Tradedoubler has a policy of distributing at least 50 per cent of the profit after tax, provided that a suitable capital structure is main-tained. Distribution may occur through share dividends, share redemption and share buyback.
Group capital managementGroup capital under management is composed of shareholders’ equity, which at the end of 2015 amounted to SEK 247.9 M (441.3) in total and loan capital, which at the end of 2015 amounted to SEK 250 (250). The Group’s goal in managing capital is to safeguard its sur-vival and freedom of action and to ensure that shareholders receive a return on their investment. The distribution between shareholders’ equity and loan capital should be such that a good balance is achieved between risk and return. If necessary, the capital structure is adapted to changing economic conditions and other markets fac-tors. To maintain and adapt its capital structure, the Group can dis-
KSEK 2015 2014
Nordics 59,177 61,600
UK & Ireland 42,935 42,104
France & Benelux 33,607 86,087
DACH 44,840 44,471
South 16,829 39,397
Technology 48,752 50,023
Total 246,140 323,682
Variance between the goodwill amount written down of SEK 72 M related to variance between 2014 and 2015 (SEK 78 M) in the table above is attributed to currency adjustments, see above in note trans-lation difference of SEK 5.8 M included in closing balance Dec 31, 2015.
In addition to goodwill, all Tradedoubler’s other intangible assets are recorded in the parent company. See Note M12 Intangible assets in the notes to the parent company’s financial statements.
C14. Property, plant and equipment
SEK ‘000Equipment, tools,
fixtures and fittings
Accumulated cost
Opening balance Jan 1, 2014 27,622
Investments 692
Sales/Disposals -3,814
Translation difference 1,201
Closing balance Dec 31, 2014 25,702
Opening balance Jan 1, 2015 25,702
Investments 6,122
Sales/Disposals -1,906
Translation difference -436
Closing balance Dec 31, 2015 29,481
Accumulated depreciation
Opening balance Jan 1, 2014 -21,713
Depreciation -3,118
Sales/Disposals 3,694
Translation difference -898
Closing balance Dec 31, 2014 -22,035
Opening balance Jan 1, 2015 -22,035
Depreciation -3,360
Sales/Disposals 1,871
Translation difference 274
Closing balance Dec 31, 2015 -23,249
Carrying amounts
At Jan 1, 2014 5,909
At Dec 31, 2014 3,667
At Dec 31, 2015 6,231

31 Tradedoubler Annual Report 2015
Notes
tribute funds, raise shareholder’s equity by issuing new shares or capital contributions, or reduce or increase liabilities.
Shares in own custodyTotal holdings of own shares at the end of 2015 amounted to 475,000 ordinary shares and 3,120,000 C-shares.
No outcome occurred during 2015 in ongoing programmes. For more information regarding long-term incentive programmes, see notes to the consolidated accounts, C6 Share-based remuneration.
C17. Earning per share
Earning per share
2015 2014
Profit for the year attributable to the parent company's shareholders (SEK '000) -189,826 -82,344
Weighted average number of outstanding ordinary shares before and after dilution (thousands) 42,332 42,332
Earnings per share, before and after dilution -4.48 -1.95
Potential future dilusionPerformance-related share programme adopted at the annual gen-eral meeting 2015 can give rise to a future dilution, the maximum outcome of the programme amounts to 2,400,000 shares and it is the view of the board that existing shares in own custody will in all materiality cover the outcome of the programme. For further infor-mations see Note C6 Share-based remuneration.
C18. Bond loanIn December 2013 Tradedoubler issued a five-year unsecured bond loan of SEK 250 M, maturing on December 20, 2018 . The bond has a fixed coupon of 6.75 percent and a total limit of SEK 375 M. The bond was listed on NASDAQ Stockholm in January 2014. Received pay-ment was SEK 244.6 M after transaction costs.
Under the terms of the bond dividends can be paid provided that the ratio of consolidated net debt and EBITDA does not exceeds 2.00 and the Group’s interest coverage ratio exceeds 3.00 . Dividends are also limited to the right of (A) the consolidated net income in the lat-est audited financial statements and (B) an amount equal to the Group’s net cash position minus SEK 100 M. The complete terms of the bond ‘s prospectus is available on the Company’s website and at the Swedish Financial Supervisory Authority.
The above terms indicates that no dividend can be paid for 2015.
C19. Other liabilities
SEK ‘000 2015 2014
Prepayments from clients 164,955 121,661
VAT 8,911 6,265
Withholding tax and social security contributions 13,180 18,896
Other 905 14,499
Total 187,951 161,321
C20. Accrued expenses and deferred income
SEK ‘000 2015 2014
Holiday pay 7,516 6,531
Other payroll expenses 5,002 4,104
Provision for rent, redundant premises 4,601 4,575
Provision for restruct 12,778 -
Provision for consultancy 4,598 4,554
Provision for audit 3,410 3,508
Other 20,276 17,741
Total 58,181 41,013
C21. Financial risks
Treasury PolicyTradedoubler’s Finance policy has been drawn up for the purpose of balancing the group’s financial risks. The policy is continually reviewed and is adopted by the board. Responsibility for the group’s financial transactions and risks is tasked to the group’s central finan-cial department.
Credit risksFinancial investmentsCash and cash equivalents are mainly invested in bank accounts held with Tradedoubler’s two main banks at the best possible bank inter-est. By essentially only working with two banks Tradedoubler reduces the counterparty risk related to liquidity risks. Since the end of 2013, Tradedoubler has also invested its excess liquidity and the unutilised portion of the bond loan in corporate bonds and commer-cial paper. On the balance sheet date, SEK 94 M was invested in cor-porate bonds and SEK 0 M in commercial paper. According to the group’s current Finance policy, which was established by the board in May 2015, investments shall only be made in issuers with stable and positive cash flows, “investment grade”.
Credit rating finansiella placeringar (Standard & Poor s)
SEK ´000 AA A BBB BB B
Not credit rated Total
Cash and cash equivalents
240,207 12,679 - - - - 252,886
Corporate bonds 12,897
24,345 56,399 - - - 93,641
Commercial paper - - - - - - -
Sum
253,104 37,024 56,399 - - - 346,527
Customer credit riskThe group and the company are exposed to credit risk, which arises primarily in connection with trade receivables. Trade receivables at year-end amounted to SEK 369 M (468). New clients are subjected to credit rating reports, which provides the basis for setting credit and payment terms and conditions for each client. The credit controls provide an assessment of clients’ financial position based on infor-mation obtained from various credit information companies.
The group has established a credit policy that determines how cli-ents are managed, with decision-making levels set for various credit limits. If the customer is not considered creditworthy prepayment is usually offered. Tradedoubler also have customers with good credit-worthiness that have chosen prepayment. Current controls are per-formed that exceptions to policies has been approved by authorised personnel.
Tradedoubler has not noticed increased bad debt losses in any geographical area. However, the group management is actively

32Tradedoubler Annual Report 2015
Notes
monitoring the situation, particularly as regards Southern Europe. No specific risk concentration exists for any customer category.
Incurred bad debt losses during the year amounted to SEK 3,384,000 (2,892,000) in the group, net after reversal of liabilities to publishers. Since a publisher in most cases is only paid after the cus-tomer has paid the invoice to Tradedoubler. the company’s customer credit risk and related liquidity risk is reduced.
Provision for feared bad debt losses in the balance sheet amounted to SEK 33,142,000 (46,588,000) and the decrease was mainly due to that a significant part of last year’s balance has been written off.
Maturity analysis, trade receivables
2015 2014
SEK ´000Carrying amount
Carrying amount
Trade receivables not due 236,463 266,965
Trade receivables, due 0-30 days 59,191 81,928
Trade receivables, due 31-90 days 30,171 52,668
Trade receivables, due >90+ days 42,855 66,780
368,680 468,341
Maturity analysis, doubtful trade receivables
2015 2014
SEK ´000 Carrying amount
Trade receivables, due 0-30 days -808 -951
Trade receivables, due 31-90 days -1,819 -1,671
Trade receivables, due >90+ days -30,515 -43,966
-33,142 -46,588
Foreign exchange riskForeign exchange risk refers to the risk that changes in exchange rates may affect the consolidated income statement, balance sheet and cash flow statement. Foreign exchange risk exists in the form of transaction risk and translation risk. Tradedoubler is exposed to for-eign exchange risk in 17 countries involving eight different curren-cies, with Euro (EUR) and British pounds (GBP) representing the majority share.
According to the company’s Finance policy transaction- and translation risks are not hedged.
In 2015, approximately 42 (48) per cent of group sales were made in EUR and approximately 31 (29) per cent in GBP. In 2015, approxi-mately 35 (31) per cent of the group’s costs were in EUR and approxi-mately 15 (20) percent in GBP.
Transaction riskExposure attributable to exchange rate fluctuations in client and sup-plier invoices is limited since invoicing to customers and from suppli-ers largely occurs in local currency for all companies in the group.
Tradedoubler is also exposed to foreign exchange risk in the par-ent company’s intra-group lending to subsidiaries which takes place in the subsidiary’s currency, as well as deposits from subsidiaries of excess liquidity. Exchange rate differences due to deposits and lend-ing from subsidiaries are recognised in the income statement.
Intra-group lending and deposits are currently not hedged. A change of the group’s underlying currencies of 1 per cent would
affect the company’s net sales by approximately SEK 15 M, of which SEK 7 M relates to subsidiaries in euro zone countries, SEK 5 M relates to the UK subsidiary and SEK 3 M to other foreign subsidiaries in the group.
Translation riskChanges in foreign exchange rates impact the group’s earnings on translation of the income statements of foreign subsidiaries to the group’s presentation currency, SEK.
Translation exposure also arises in connection with translation of the group’s investments in foreign subsidiaries to the group’s pres-entation currency, SEK, which is recognised as a component of “other comprehensive income” (outside the income statement).
In the event of a weakening of the group’s underlying currencies of 10 per cent, this would affect the company’s profit before tax neg-atively by approx. SEK 1 M, of which SEK 0.5 M relates to subsidiaries in euro zone countries and SEK 0.5 M relates to the UK subsidiary. If the company’s underlying currencies weakened by 10 per cent at the end of the reporting period, it would weaken consolidated equity by approx. SEK 3 M, of which SEK 1.5 M relates to the subsidiaries in euro zone countries, SEK 1 M relates to the UK subsidiary and SEK 0.5 M to other foreign companies in the group.
The group’s net investments in foreign currency primarily involve EUR and GBP. Net investments in foreign currency are not currently hedged.
Interest riskInterest risk refers to the risk that changes in market interest rates may affect the consolidated income statement and cash flow or the fair value of financial assets and liabilities. A significant factor affecting the interest risk is the interest rate refixing period. The group’s interest rate exposure is managed centrally, which means that the finance function is responsible for identifying and managing this exposure.
On 31 December 2015, interest-bearing assets in the form of bank balances amounted to SEK 253 M, commercial paper SEK 0 M and investments in securities SEK 94 M. Bank balances run according to variable rates of interest, mainly linked to market rates for each cur-rency that the asset relates to. Commercial paper has fixed rates of interest during the term while investments in securities run accord-ing to both fixed and variable interest. A change in the variable inter-est rate of + / - 1 percent on the closing date affect the Group’s net financial items by SEK 0.5 M. During 2013, Tradedoubler issued a bond loan for a nominal amount of SEK 250 M, and the loan runs according to fixed interest of 6.75%. There was no other external bor-rowing on the balance sheet date.
Liquidity riskThe liquidity risk is that Tradedoubler cannot meet its payment obli-gations. The group’s liquidity planning includes all entities and is monitored regularly in order to secure satisfactorily levels of cost efficient financing. Presently the Tradedoubler’s liquidity position is good thanks to the bond loan of 250 MSEK, which was raised at the end of 2013, and the negative working capital of 199 MSEK at the end of 2015. The bond loan matures at the end of 2018 and the negative working capital was affected by temporary effects increasing the cash position and also an increase of prepayments. Group manage-ment closely tracks the cash flow and its considerable variations during the month and cash flow projections are included when long term projections are updated. The considerable variations in liquid-ity position during the month can mainly be explained by that the bulk of publisher payments is executed once a month and these are, with a few exceptions, paid after Tradedoubler has received the related payment from the customer.
Tradedoubler works actively to minimise the group’s liquidity risk by not taking risks in the cash flow. A publisher in most cases is only paid when the customer has paid the invoice to Tradedoubler. Trade-doubler limits its liquidity risk in this way. Credit ratings are per-formed on new clients and Tradedoubler normally requires advance payments from clients for which adequate financial information is not available.
Tradedoubler also has counterparty risk related to liquidity risks, which are principally related to banks in existing markets. The cur-rent uncertainty in Southern Europe is affecting a number of the banks that the group is working with. The group management con-tinually monitors the risk level of the banks concerned and works actively to minimise the exposure to banks that are considered risky. During 2015, Tradedoubler has continued the work to limit counter-party risk by reducing the number of banks that the group works with and by centralising liquidity to the parent company.

33 Tradedoubler Annual Report 2015
Notes
Duration analysis, financial liabilities
2015 2014
SEK ´000 TotalWithin 1
monthWithin 1-3
monthsOver 4
months TotalWithin 1
monthWithin 1-3
monthsOver 4
months
Bond loan1 250,000 - - 250,000 250,000 - - 250,000
Interest bond loan1 50,150 - 4,219 45,931 66,991 - 4,219 62,772
Trade payables 14,466 10,773 2,675 1,018 12,142 11,017 370 755
Short-term liabilities to publishers 302,350 138,476 78,956 84,918 371,925 137,700 213,165 21,060
Total 616,966 149,249 85,850 381,867 701,058 148,717 217,754 334,587
1 Tradedoubler bond in whole maturity on 2018-12-20.
C22. Pledged assets and contingent liabilities
SEK ‘000 2015 2014
Pledged assets
Rental deposits 6,609 7,569
Total pledged assets 6,609 7,569
Contingent liabilities None None
C23. Transactions with related partiesTransactions with related parties are priced on commercial terms. The group has during the year had transactions between the parent company and its subsidiaries. The transactions consist primarily of license invoices from the parent company to the subsidiaries. See further description in Notes to the Parent company’s financial state-ments, M15 Investments and M23 Transactions with related parties.
Transactions with key people in executive positionsAside from transactions in the normal course of business, to board and senior executives specified in Notes to the Consolidated Finan-cial Statements, Note C5 Remuneration to employees, group man-agement and board of directors and Note C6 Share-based remunera-tion, the following third party transactions have occurred. During 2015 Reworld Media (largest shareholder in Tradedoubler) has, as a publisher in France, been paid a total of 12KEUR and, since January 2016, Reworld Media is providing HR-support to the French subsidi-ary at the cost of 3 KEUR per month. The arm lengths principle has been applied in these transactions.
C24. Cash flow statement, supplementary information
Cash and cash equivalents
SEK ‘000 2015 2014
The following sub-components are included in cash and cash equivalents:
Commercial paper - 26,973
Cash and bank balances 252,886 89,774
Total according to the balance sheet 252,886 116,747
Total according to the cash flow statement 252,886 116,747
SEK ‘000 2015 2014
Interest received 5,748 10,883
Interest paid -18,222 -17,777
Adjustment for items not included in the cash flow
SEK ‘000 2015 2014
Depreciation and amortisation 109,261 83,039
Provisions for severance payments 11,767 6,604
Unrealised exchange rate differences -4,185 7,789
Other 13,415 2,205
130,258 99,637

Notes
34Tradedoubler Annual Report 2015
C25. Change related itemsChange related items refer to items of non-recurring nature and the purpose of disclosing these separately is to make it easier for the reader to understand the underlying year-on-year developments. In the table below the items adjusted for in 2015 and 2014 are listed.
SEK ‘000 2015 2014
Revenue
Badwill aquisition Adnologies 864 -
Correction invoicing error -5,473 -
Correction prepayment - -9,940
Sum change related revenue -4,609 -9,940
Cost of revenue
Reasessment publisher debt - 8,121
Sum change related cost of revenue - 8,121
Costs
Severence -4,346 -9,338
Closing of offices -5,433 -5,561
Moving costs UK office -242 -
Costs related to aquisition Adnologies -1,210 -
Restruct costs -11,029 -
Reassessment provision doubtful debts 5,124 -
Other -2,763 -2,991
Sum change related costs -19,899 -17,890
Sum change related items -24,508 -19,709
Total amount effecting EBITDA per segment
KSEK 2015 2014
Nordics -2,432 3,845
UK & Ireland -824 1,662
France & Benelux -1,816 -3,771
DACH -2,715 -318
South -4,355 -8,059
Technology -7,163 -893
Group Management & support functions -5,203 -12,175
Sum -24,508 -19,709
C26. Aquisition of operationsOn 26 January 2015 Tradedoubler AB aquired all shares in the German technology company Adnologies GmbH to support the new company strategy. Aquisition investments and expenditures in the aquisition as well as the impact on the result during 2015 were lim-ited. At the time of aquistion the company had 15 employees.
Net assets of the aquired company on the aquisition date:
SEK ‘000Reported value
in the aquisition
Tangible assets 1,129
Intangible assets 2,811
Accounts receivable and other receivables 1,885
Cash and cash equivalents 345
Accounts payable and other operating liabilities -3,879
Net identifiable assets and liabilities 2,291
Group badwill 864
Purchase price paid 1,427
Acquisition costs 1,761
Less: Cash and cash equivalents in the aquisition 345
Net cash flow 2,843
The aquisition price totalled SEK 3,188,000, including aquisition costs of SEK 1,761,000.
C27. Events after the balance sheet dateAt an extraordinary general meeting on 11 February 2016 it was resolved, in accordance with Reworld Media’s proposal, that the remuneration to the board of directors shall remain unchanged in accordance with the decision made at the 2015 annual general meeting. Pascal Chevalier, Gautier Normand, Nils Carlsson, Jérémy Perola and Erik Siekmann were elected regular board members. Pascal Chevalier was elected as chairman of the board of directors. For the full details of each proposal adopted by the general meeting see www.tradedoubler.com.
Tomas Ljunglöf, CFO of Tradedoubler, resigned in December 2015 and will leave the company after the AGM in May. Viktor Wågström, presently accounting and group accounting manager, will be interim CFO.

35
Financial information
Tradedoubler Annual Report 2015
Parent company income statement
SEK ‘000 Note 2015 2014
Net sales P3 88,649 113,141
Cost of goods sold -5,665 -6,779
Gross profit 82,984 106,361
Selling expenses -254 -2,619
Administrative expenses -100,331 -104,292
Research & development expenses -51,823 -28,935
Operating profit P4, P5, P6, P7, P8 -69,424 -29,484
Profit from financial items
Profit from participations in group companies 54,291 17,084
Other interest income and similar income statement items 10,076 12,161
Interest expenses and similar income statement items -25,202 -29,777
Net financial items P9 39,165 -532
Profit before tax -30,259 -30,017
Tax P10 -23,888 9,789
Net profit for the year -54,147 -20,228
Statement of comprehensive income
Profit for the year -54,147 -20,228
Other comprehensive income
Exchange difference on increased net investment, net after tax - -
Reversal of exchange difference on increased net investment, net after tax - -
Total other comprehensive income - -
Total comprehensive income for the year -54,147 -20,228

36Tradedoubler Annual Report 2015
Financial information
Parent company balance sheet
SEK ‘000 Note Dec 31, 2015 Dec 31, 2014
Assets P11
Non-current assets
Intangible assets P12 61,170 57,592
Equipments, tools, fixtures and fittings P13 467 540
Financial assets
Participations in group companies P14, P15 158,700 158,700
Deferred tax asset P10 14,223 38,110
Total non-current assets 234,560 254,942
Current assets
Trade receivables 5,892 5,615
Receivables from group companies 57,753 86,646
Tax receivables 1,014 1,067
Other receivables 3,510 3,846
Prepaid expenses and accrued income P16 5,741 5,604
Short-term investments 93,641 255,259
Cash and cash equivalents 182,258 58,980
Total current assets 349,810 417,018
Total assets 584,370 671,960
Equity and liabilities
Shareholders’ equity P17
Restricted equity
Share capital 18,371 17,123
Statuatory reserve 89,022 89,022
Total restricted equity 107,393 106,145
Non-restricted equity
Share premium reserve 352,540 352,540
Retained earnings -274,043 -252,098
Net profit for the year -54,147 -20,228
Total non-restricted equity 24,351 80,215
Total equity 131,744 186,360
Long-term liabilities P11
Bond loan P18 246,766 245,676
Total long-term liabilities 246,766 245,676
Current liabilities P11
Trade payables 6,434 8,163
Liabilities to group companies 116,534 130,391
Other liabilities P19 65,855 87,905
Accrued expenses and deferred income P20 17,036 13,465
Total current liabilities 205,859 239,923
Total equity and liabilities 584,370 671,960
Pledged assets P22 1,530 1,530
Contingent liabilities P22 932 1,048

37 Tradedoubler Annual Report 2015
Financial information
Parent company changes in equity
Restricted Non-restricted
SEK ‘000 Share capitalStatutory
reserveShare premium
reserve
Retained earnings inc. net profit for
the year Total equity
Opening balance at January 1, 2014 17,123 89,022 352,540 -242,296 216,390
Comprehensive income
Net profit for the year -20,228 -20,228
Total comprehensive income -20,228 -20,228
Transactions with shareholders
Dividend -10,583 -10,583
Equity-settled share-based payments 781 781
Closing balance at December 31, 2014 17,123 89,022 352,540 -272,325 186,360
Opening balance at January 1, 2015 17,123 89,022 352,540 -272,325 186,360
Comprehensive income
Net profit for the year -54,147 -54,147
Total comprehensive income -54,147 -54,147
Transactions with shareholders
New share issue 1,248 1,248
Repurchase of own shares -1,248 -1,248
Equity-settled share-based payments -470 -470
Closing balance at December 31, 2015 18,371 89,022 352,540 -328,190 131,744

38Tradedoubler Annual Report 2015
Financial information
Parent company cash flow statement
SEK '000 Note 2015 2014
Operating activities P24
Profit before tax -30,259 -30,017
Adjustment for items not included in the cash flow 34,924 20,604
Taxes paid 53 531
Cash flow from operating activities before changes in working capital 4,718 -8,882
Cash flow from changes in working capital
Increase (-)/Decrease (+) in operating receivables 3,639 22,675
Increase (-)/Decrease (+) in operating liabilities -11,976 -30,889
Cash flow from operating activities -3,619 -17,095
Investing activities
Investments in intangible assets -37,936 -16,642
Investments in property, plant and equipment -161 -50
Acquisitions and divestment of subsidiaries -2,843 -
Short-term investments -31,518 -124,437
Sale of short-term investments 199,356 71,232
Repayment of shareholders' contribution - 1,944
Divestment of shares - 236
Cash flow from investing activities 126,899 -67,716
Financing activities
Dividend - -10,583
New share issue 1,248
Repurchase of own shares -1,248 -
External loan - -
Cash flow from financing activities - -10,583
Cash flow for the year 123,278 -95,394
Cash and cash equivalents at the beginning of the year 58,980 154,374
Cash and cash equivalents at the end of the year 182,258 58,980

39 Tradedoubler Annual Report 2015
Notes
P1. Accounting policiesThe parent company has prepared its annual accounts and consolidated accounts according to the Swedish Annual Accounts Act (1995:1554).
Differences between the accounting policies of the group and the parent companyThe differences between the accounting policies applied by the group and the parent company are shown below. The accounting policies set out for the parent company below have been applied consistently for all periods presented in the parent company’s finan-cial statements.
Classification and formatThe parent company’s income statement and balance sheet are pre-pared according to the Swedish Annual Accounts Act’s layout. The difference in relation to IAS 1: Presentation of financial statements that was applied in the presentation of the consolidated financial statements is mainly in recognition of financial income and expenses, non-current assets and shareholders’ equity, discontinued operations and the presence of provisions as a separate heading in the balance sheet.
SubsidiariesParticipations in subsidiaries are recognised in accordance with the cost method.
Group contributions and shareholders’ contributions for legal entitiesThe parent company reports group contributions and shareholders’ contributions in accordance with RFR2. The company has chosen to account for group contributions paid and received in the income statement.
Shareholders’ contributions are carried directly against equity in the case of the receiver and capitalised as shares and participations by the grantor, to the extent that impairment is not required.
P2. Critical estimates and judgementsThe parent company mainly has intangible assets that are affected by estimates and judgements. For information regarding critical esti-mates and judgements in the annual accounts see the note to the Consolidated accounts, C2 Critical estimates and judgements.
P3. Distribution of revenue
SEK ´000 2015 2014
Other revenue 5,594 6,725
License fees 83,056 106,415
Total revenue 88,649 113,141
P4. Remuneration to employees
Average number of employees 2015 2014
men (%) men (%)
Sweden 60 60 46 54
Remunerations and social security contributions
Salaries and other remuneration
2015 2014
Salaries and remuneration 41,081 39,703
of which share-based payments (493) (781)
Social security contributions 15,737 13,260
of which pensions (3,990) (3,017)
Total 56,818 52,963
For further information regarding remuneration to the board and company management and the remuneration policies within the group, see notes to the consolidated statements, Note C5 Remunera-tion to employees, group management and board of directors.
P5. Share-based remuneration
Performance-Based Share Programme 2015The parent company has in 2015 reported a cost of SEK 493,000 (781,000) for the long-term incentive plan that was decided at the annual general meeting 2015.
For more information regarding the share-based remunerations in the group, see notes to the consolidated statements, Note C6 Share-based remuneration.
P6. Remuneration for auditor
SEK ´000 2015 2014
EY
Audit assignments 2,533 2,819
Tax services 66 337
Other assignments 123 177
Total 2,722 3,333
Audit assignments refers to the examination of the annual accounts, the consolidated accounts and accounting records as well as the administration of the board of directors and the CEO, other duties that the Company s auditors are obliged to perform as well as advice or other assistance arising from observations during such examina-tion and implementation of such duties. In addition, the auditor reviewed the corporate governance report. The auditor has also reviewed the interim report for the period January-September 2015 and has been retained for certain advice, most of which pertained to audit-related consultations regarding accounting and tax matters.
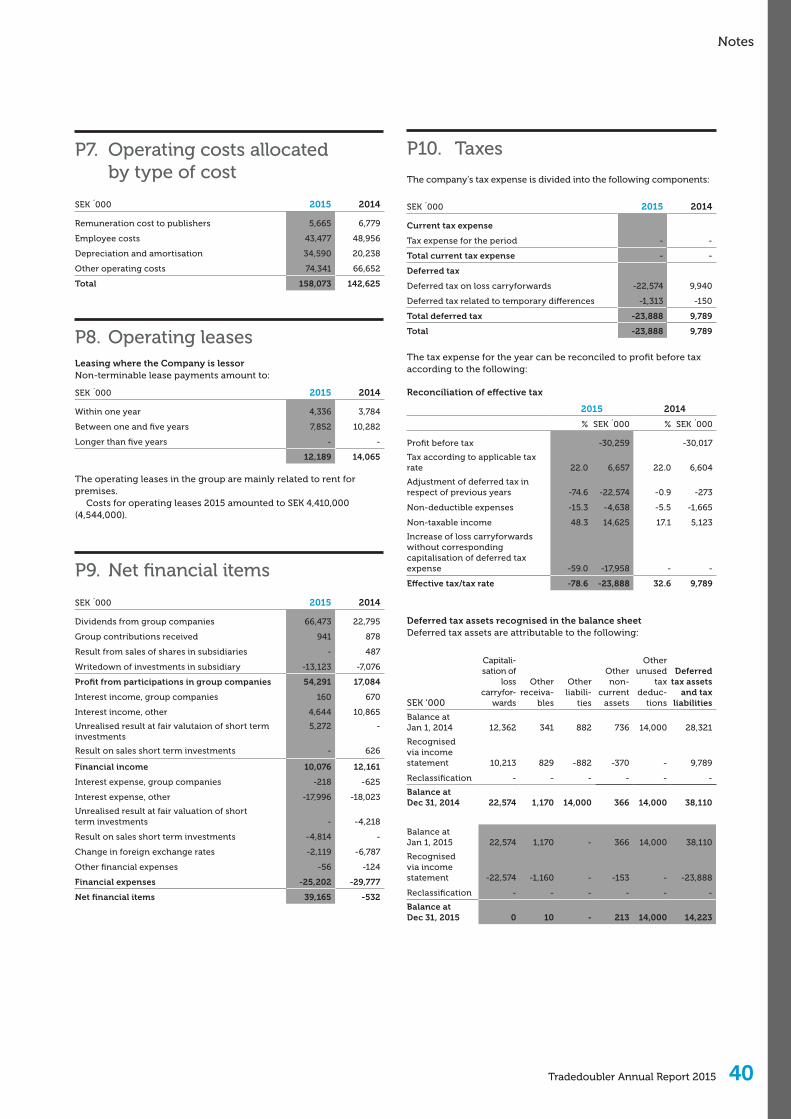
40Tradedoubler Annual Report 2015
Notes
P7. Operating costs allocated by type of cost
SEK ´000 2015 2014
Remuneration cost to publishers 5,665 6,779
Employee costs 43,477 48,956
Depreciation and amortisation 34,590 20,238
Other operating costs 74,341 66,652
Total 158,073 142,625
P8. Operating leasesLeasing where the Company is lessorNon-terminable lease payments amount to:
SEK ´000 2015 2014
Within one year 4,336 3,784
Between one and five years 7,852 10,282
Longer than five years - -
12,189 14,065
The operating leases in the group are mainly related to rent for premises.
Costs for operating leases 2015 amounted to SEK 4,410,000 (4,544,000).
P9. Net financial items
SEK ´000 2015 2014
Dividends from group companies 66,473 22,795
Group contributions received 941 878
Result from sales of shares in subsidiaries - 487
Writedown of investments in subsidiary -13,123 -7,076
Profit from participations in group companies 54,291 17,084
Interest income, group companies 160 670
Interest income, other 4,644 10,865
Unrealised result at fair valutaion of short term investments
5,272 -
Result on sales short term investments - 626
Financial income 10,076 12,161
Interest expense, group companies -218 -625
Interest expense, other -17,996 -18,023
Unrealised result at fair valuation of short term investments - -4,218
Result on sales short term investments -4,814 -
Change in foreign exchange rates -2,119 -6,787
Other financial expenses -56 -124
Financial expenses -25,202 -29,777
Net financial items 39,165 -532
P10. Taxes
The company’s tax expense is divided into the following components:
SEK ´000 2015 2014
Current tax expense
Tax expense for the period - -
Total current tax expense - -
Deferred tax
Deferred tax on loss carryforwards -22,574 9,940
Deferred tax related to temporary differences -1,313 -150
Total deferred tax -23,888 9,789
Total -23,888 9,789
The tax expense for the year can be reconciled to profit before tax according to the following:
Reconciliation of effective tax
2015 2014
% SEK ´000 % SEK ´000
Profit before tax -30,259 -30,017
Tax according to applicable tax rate 22.0 6,657 22.0 6,604
Adjustment of deferred tax in respect of previous years -74.6 -22,574 -0.9 -273
Non-deductible expenses -15.3 -4,638 -5.5 -1,665
Non-taxable income 48.3 14,625 17.1 5,123
Increase of loss carryforwards without corresponding capitalisation of deferred tax expense -59.0 -17,958 - -
Effective tax/tax rate -78.6 -23,888 32.6 9,789
Deferred tax assets recognised in the balance sheetDeferred tax assets are attributable to the following:
SEK ‘000
Capitali-sation of
loss carryfor-
wards
Other receiva-
bles
Other liabili-
ties
Other non-
current assets
Other unused
tax deduc-
tions
Deferred tax assets
and tax liabilities
Balance at Jan 1, 2014 12,362 341 882 736 14,000 28,321
Recognised via income statement 10,213 829 -882 -370 - 9,789
Reclassification - - - - - -
Balance at Dec 31, 2014 22,574 1,170 14,000 366 14,000 38,110
Balance at Jan 1, 2015 22,574 1,170 - 366 14,000 38,110
Recognised via income statement -22,574 -1,160 - -153 - -23,888
Reclassification - - - - - -
Balance at Dec 31, 2015 0 10 - 213 14,000 14,223

41 Tradedoubler Annual Report 2015
Notes
P11. Financial assets and liabilities distributed per category
2015 2014
SEK ‘000Loans and
receivables
Valued to fair value over the
profit & loss
Other financial liabilities
Total carrying amount
Loans and receivables
Valued to fair value over the
profit & loss
Other financial liabilities
Total carrying amount
Trade receivables 5,892 5,892 5,615 5,615
Receivables from group companies 57,753 57,753 86,646 86,646
Short term investments 93,641 93,641 255,259 255,259
Cash and bank balances 182,258 182,258 58,980 58,980
Total financial assets 245,904 93,641 339,545 151,241 255,259 406,500
Liabilities to group companies 246,766 246,766 245,676 245,676
Debt to group companies 116,534 116,534 130,391 130,391
Trade payables 6,434 6,434 8,163 8,163
Total financial liabilities 369,734 369,734 384,230 384,230
Trade receivables, trade payables, other current receivables and liabilities that are measured at cost have short terms and thus fair value corre-sponds with the carrying amount. For further information regarding financial assets and liabilities distrubuted per category, see notes to the consolidated statements, Note C12 Financial assets and liabilities distrubuted per category.
P12. Intangible assets
SEK ‘000Development
expensesAdministration
and support
Accumulated acquisition costs
Opening balance at Jan 1, 2014 45,009 45,275
Investments for the year 15,444 1,198
Sales/disposals - -
Closing balance at Dec 31, 2014 60,453 46,473
Opening balance at Jan 1, 2015 60,453 46,473
Investments for the year 37,861 75
Sales/disposals - -
Closing balance at Dec 31, 2015 98,314 46,548
Accumulated amortisa tion
Opening balance at Jan 1, 2014 -14,424 -15,237
Amortisation for the year -12,469 -7,205
Sales/disposals - -
Closing balance Dec 31, 2014 -26,893 -22,441
Opening balance at Jan 1, 2015 -26,893 -22,441
Amortisation for the year -26,993 -7,365
Sales/disposals - -
Closing balance Dec 31, 2015 -53,886 -29,806
Carrying amounts
At Jan 1, 2014 30,585 30,039
At Dec 31, 2014 33,560 24,032
At Dec 31, 2015 44,428 16,742
P13. Property, plant and equipment
SEK ‘000Equipment, tools,
fixtures and fittings
Accumulated acquisition
Opening balance Jan 1, 2014 11,717
Investments 50
Sales/Disposals -2,760
Closing balance Dec 31, 2014 9,007
Opening balance Jan 1, 2015 9,007
Investments 161
Sales/Disposals -
Closing balance Dec 31, 2015 9,168
Accumulated depreciation
Opening balance Jan 1, 2014 -10,671
Depreciation for the year 2,767
Sales/Disposals -564
Closing balance Dec 31, 2014 -8,468
Opening balance Jan 1, 2015 -8,468
Depreciation for the year -233
Sales/Disposals -
Closing balance Dec 31, 2015 -8,701
Carrying amounts
At Jan 1, 2014 1,047
At Dec 31, 2014 540
At Dec 31, 2015 467

42Tradedoubler Annual Report 2015
Notes
P14. Financial assets
SEK ´000 2015 2014
Accumulated acquisition costs
Opening balance 158,700 160,881
Acquisitions and stock issues in subsidiaries 13,123 6,359
Sold group companies - -236
Repayment of shareholders' contribution - -1,944
Writedown of shares in subsidiaries -13,123 -6,359
Closing balance Dec 31, 2015 158,700 158,700
P15. InvestmentsSpecification of the parent company’s direct holdings of participations in subsidiaries
Book value
Subsidiary Corporate identity numberRegistered office
Number of shares
Participation as % Dec 31, 2015 Dec 31, 2014
TradeDoubler Ireland Ltd 422593 Dublin 1 100 7 7
TradeDoubler OY 777468 Helsingfors 100 100 70 70
TradeDoubler A/S 25137884 Köpenhamn 125 100 5,772 5,772
TradeDoubler LDA 507810007 Lissabon 1 100 46 46
TradeDoubler Ltd 3921985 London 5,000 100 140,000 140,000
TradeDoubler Espana SL B82666892 Madrid 100 100 62 62
TradeDoubler BVBA 874694629 Mechelen 371 100 172 172
TradeDoubler Srl 210954 (rep)/26762 (Rac) Milano 1 100 2,683 2,683
TradeDoubler GmbH 76167/URNo R181/2001 München 1 100 250 250
TradeDoubler AS 982006635 Oslo 1,000 100 6,011 6,011
TradeDoubler SARL B431573716 (2000B08629) Paris 500 100 119 119
TradeDoubler BV 20100140 Rotterdam 40 100 188 188
TradeDoubler International AB 556833-1200 Stockholm 500 100 268 268
TradeDoubler Sweden AB 556592-4007 Stockholm 1,000 100 2,003 2,003
TradeDoubler Sp zoo 015792506 Warszawa 1,000 100 115 115
TradeDoubler Austria Gmbh FN296915 Wien 1 100 324 324
TradeDoubler AG CH020.3.3.028.851-0 Zürich 997 100 609 609
Tradedoubler Performance Marketing LTDA 14.273.556/0001-66 Sao Paolo 297,923 100 0 0
Adnologies GmbH HRB200226 Hamburg 107,912 100 0 0
158,700 158,700
P16. Prepaid expenses and accrued income
SEK ´000 2015 2014
Rent of premises 1,025 1,024
Accrued interest on short term investments 430 1,464
Other 4,287 3,116
Total 5,741 5,604
P17. Shareholders’ equity
Share capitalShare capital refers to the parent company’s share capital. Each share carries one vote and those entitled to vote may vote for the full number of shares represented and owned without any restriction in voting rights. All shares carry equal rights to share in the Company’s assets and profits and in any surplus on liquidation.
At December 31, 2015, Tradedoubler AB had a share capital of SEK 18.4 M distributed among 45,927,449 shares, each share with a par value of SEK 0.40.
Reconciliation of number of sharesNumber of
shares issuedIssued share
capital
Number of shares issued January 1, 2015* 42,807,449 17,122,979
Number of shares issued December 31, 2014** 45,927,449 18,370,978
* of which 475,000 shares are in own custody** of which 3,595,000 shares are in own custody

43 Tradedoubler Annual Report 2015
Notes
P18. Bond loanThe Parent Company has during December 2013 issued a bond loan. For more information regarding the bond issue, see Note to Consoli-dated Financial Statements, C18 Bond loan.
P19. Other liabilities
SEK ´000 2015 2014
Current liabilities to publishers 62,434 84,613
Withholding tax and social security contributions 3,420 2,297
Other - 995
Total 65,855 87,905
P20. Accrued expenses and deferred income
SEK ´000 2015 2014
Holiday pay 2,188 1,604
Other payroll expenses 759 4,832
Accrued interest expense from bond loan 555 555
Provision restruct 2,634 -
Provision consultancy expenses 1,959 3,963
Provision audit 1,130 1,850
Other 7,811 661
Total 17,036 13,465
P21. Financial risks
Financial risks and risk managementTradedoubler’s financial risk management is handled and monitored at Group level. For more information regarding the financial risks, see notes to the Consolidated statements, Note C21 Financial risks.
P22. Pledged assets and contingent liabilities
SEK ´000 2015 2014
Pledged assets 1,530 1,530
Contingent liabilities 932 1,048
Contingent liabilities consists of performance guarantees to subsidiaries.
P23. Transactions with related partiesTransactions with related parties are priced on commercial terms.
Transactions with related parties for Tradedoubler AB mainly con-sists of licensing fees corresponding to SEK 83 M (106.4), invoiced by the parent company to subsidiaries and other revenue of SEK 5.6 M (6.7). The parent company’s receivables from subsidiaries amounted
to SEK 57.8 M (86.6). The parent company s liabilities to subsidiaries amount to SEK 116.5 M (130.4). Receivables and liabilities from sub-sidiaries have been netted off in the balance sheet.
Transactions with key people in executive positionsNo transactions with key people in executive positions have taken place during the year except the ones specified in the notes to the Consolidated statements, Note C5 Remuneration to employees, group management and board of directors, Note C6 Share-based remuneration and Note C23 Transactions with related parties.
P24. Cash flow statement, supplementary information
Cash and cash equivalents
SEK ‘000 2015 2014
The following sub-components are included in cash and cash equivalents
Commercial paper - 26,973
Cash and bank balances 182,258 32,007
Total according to the balance sheet 182,258 58,980
Total according to the cash flow statement 182,258 58,980
SEK ‘000 2015 2014
Interest received 5,678 10,306
Interest paid -18,214 -18,648
Adjustment for items not included in the cash flow
SEK ‘000 2015 2014
Depreciation and amortisation 34,590 20,238
Other provisions 1,090 1,090
Unrealised exchange rate differences -4,164 -691
Other 3,407 -33
34,923 20,604
P25. Events after the balance sheet dateAt an extraordinary general meeting on 11 February 2016 it was resolved, in accordance with Reworld Media’s proposal, that the remuneration to the board of directors shall remain unchanged in accordance with the decision made at the 2015 annual general meeting. Pascal Chevalier, Gautier Normand, Nils Carlsson, Jérémy Perola and Erik Siekmann were elected regular board members. Pascal Chevalier was elected as chairman of the board of directors. For the full details of each proposal adopted by the general meeting see www.tradedoubler.com.
Tomas Ljunglöf, CFO of Tradedoubler, resigned in December 2015 and will leave the company after the AGM in May. Viktor Wågström, presently accounting and group accounting manager, will be interim CFO.
For more information see Note to Consolidated Financial Statements, C27 Events after the balance sheet date.

44Tradedoubler Annual Report 2015
Board’s signatures
The undersigned assure that the consolidated accounts and annual report have been prepared in accordance with international accounting standards, IFRS, as adopted by the EU, and pursuant to generally accepted accounting stand-ards and provide a true and fair view of the group’s and parent company’s operations, financial position and results of operations and describe significant risks and uncertainties facing the group. The consolidated income statement and
statement of financial position and the parent company’s income statement and balance sheet are subject to approval by the annual general meeting to be held on 3 May 2016.
Stockholm, 6 April 2016
Pascal Chevalier
Chairman
Gautier Normand
Board Member
Jérémy Parola
Board Member
Erik Siekmann
Board Member
Nils Carlsson
Board Member
Matthias Stadelmeyer
President and CEO
Our Audit report was submitted on 7 April 2016
Ernst & Young AB
Erik Sandström
Authorised Public Accountant

45 Tradedoubler Annual Report 2015
Auditor’s report
Report on the annual accounts and consolidated accountsWe have audited the annual accounts and consolidated accounts of TradeDoubler AB (publ) for the year 2015, except for the corporate governance statement on pages 9-13. The annual accounts and con-solidated accounts of the company are included in this document on pages 4-44.
Responsibilities of the Board of Directors and the Managing Director for the annual accounts and consolidated accountsThe Board of Directors and the Managing Director are responsible for the preparation and fair presentation of these annual accounts and consolidated accounts in accordance with International Financ-ing Reporting Standards, as adopted by the EU, and the Annual Accounts Act, and for such internal control as the Board of Directors and the Managing Director determine is necessary to enable the preparation of annual accounts and consolidated accounts that are free from material misstatement, whether due to fraud or error.
Auditor’s responsibilityOur responsibility is to express an opinion on these annual accounts and consolidated accounts based on our audit. We conducted our audit in accordance with International Standards on Auditing and generally accepted auditing standards in Sweden. Those standards require that we comply with ethical requirements and plan and per-form the audit to obtain reasonable assurance about whether the annual accounts and consolidated accounts are free from material misstatement.
An audit involves performing procedures to obtain audit evidence about the amounts and disclosures in the annual accounts and con-solidated accounts. The procedures selected depend on the auditor’s judgement, including the assessment of the risks of material misstate-ment of the annual accounts and consolidated accounts, whether due to fraud or error. In making those risk assessments, the auditor con-siders internal control relevant to the company’s preparation and fair presentation of the annual accounts and consolidated accounts in order to design audit procedures that are appropriate in the circum-stances, but not for the purpose of expressing an opinion on the effec-tiveness of the company’s internal control. An audit also includes eval-uating the appropriateness of accounting policies used and the reasonableness of accounting estimates made by the Board of Direc-tors and the Managing Director, as well as evaluating the overall pres-entation of the annual accounts and consolidated accounts.
We believe that the audit evidence we have obtained is sufficient and appropriate to provide a basis for our audit opinions.
OpinionsIn our opinion, the annual accounts have been prepared in accord-ance with the Annual Accounts Act and present fairly, in all material respects, the financial position of the parent company as of 31 December, 2014 and of its financial performance and its cash flows for the year then ended in accordance with the Annual Accounts Act, and the consolidated accounts have been prepared in accordance with the Annual Accounts Act and present fairly, in all material respects, the financial position of the group as of 31 December 2014 and of their financial performance and cash flows in accordance with International Financial Reporting Standards, as adopted by the EU, and the Annual Accounts Act. Our opinion do not cover the cor-porate governance statement on pages 9-13. The statutory adminis-tration report is consistent with the other parts of the annual accounts and consolidated accounts.
We therefore recommend that the annual meeting of shareholders adopt the income statements and balance sheets for the parent com-
pany and the income statement and the statement of financial posi-tion for the group.
Report on other legal and regulatory requirementsIn addition to our audit of the annual accounts and consolidated accounts, we have examined the proposed appropriations of the company’s profit or loss and the administration of the Board of Directors and the Managing Director of TradeDoubler AB (publ) for the year 2015. We have also conducted a statutory examination of the corporate governance statement.
Responsibilities of the Board of Directors and the Managing DirectorThe Board of Directors is responsible for the proposal for appropria-tions of the company’s profit or loss. The Board of Directors and the Managing Director are responsible for administration under the Com-panies Act and that the corporate governance statement on pages 9-13 has been prepared in accordance with the Annual Accounts Act.
Auditor’s responsibilityOur responsibility is to express an opinion with reasonable assurance on the proposed appropriations of the company’s profit or loss and on the administration based on our audit. We conducted the audit in accordance with generally accepted auditing standards in Sweden.
As a basis for our opinion on the Board of Directors’ proposed appropriations of the company’s profit or loss, we examined the Board of Directors’ reasoned statement and a selection of supporting evidence in order to be able to assess whether the proposal is in accordance with the Companies Act.
As a basis for our opinion concerning discharge from liability, in addition to our audit of the annual accounts and consolidated accounts, we examined significant decisions, actions taken and cir-cumstances of the company in order to determine whether any member of the Board of Directors or the Managing Director is liable to the company. We also examined whether any member of the Board of Directors or the Managing Director has, in any other way, acted in contravention of the Companies Act, the Annual Accounts Act or the Articles of Association.
We believe that the audit evidence we have obtained is sufficient and appropriate to provide a basis for our opinions.
Furthermore, we have read the corporate governance statement and based on that reading and our knowledge of the company and the group we believe that we have obtained a sufficient basis for our opinion. This means that our statutory examination of the corporate governance statement is different and substantially less in scope than an audit conducted in accordance with International Standards on Auditing and generally accepted auditing standards in Sweden.
OpinionsWe recommend to the annual meeting of shareholders that the profit be appropriated in accordance with the proposal in the statu-tory administration report and that the members of the Board of Directors and the Managing Director be discharged from liability for the financial year.
A corporate governance statement has been prepared, and its statutory contents consistent with the other parts of the annual accounts and the consolidated accounts.
Stockholm, 7 april 2016Ernst & Young AB
Erik SandströmAuthorised Public Accountant
Auditor’s reportTo the annual meeting of the shareholders of TradeDoubler AB (publ), corporate identity number 556575-7423
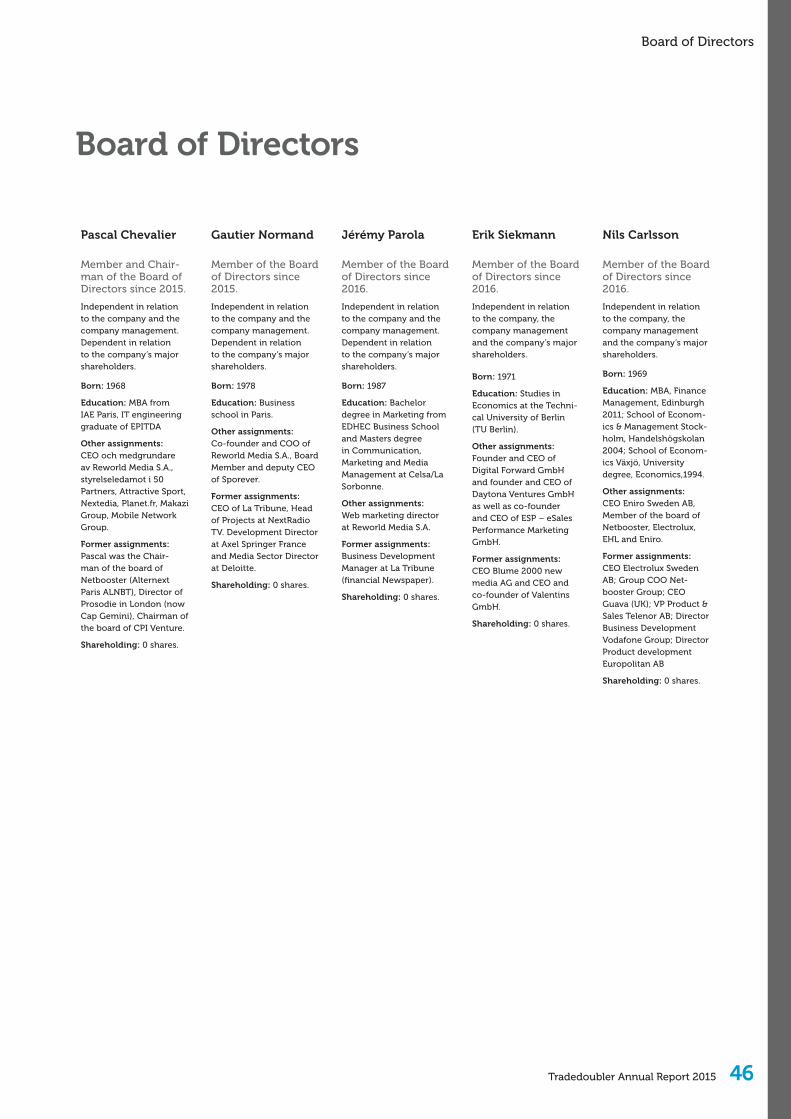
46Tradedoubler Annual Report 2015
Board of Directors
Board of Directors
Pascal Chevalier
Member and Chair-man of the Board of Directors since 2015.
Independent in relation to the company and the company management. Dependent in relation to the company’s major shareholders.
Born: 1968
Education: MBA from IAE Paris, IT engineering graduate of EPITDA
Other assignments: CEO och medgrundare av Reworld Media S.A., styrelseledamot i 50 Partners, Attractive Sport, Nextedia, Planet.fr, Makazi Group, Mobile Network Group.
Former assignments: Pascal was the Chair-man of the board of Netbooster (Alternext Paris ALNBT), Director of Prosodie in London (now Cap Gemini), Chairman of the board of CPI Venture.
Shareholding: 0 shares.
Gautier Normand
Member of the Board of Directors since 2015.
Independent in relation to the company and the company management. Dependent in relation to the company’s major shareholders.
Born: 1978
Education: Business school in Paris.
Other assignments: Co-founder and COO of Reworld Media S.A., Board Member and deputy CEO of Sporever.
Former assignments: CEO of La Tribune, Head of Projects at NextRadio TV. Development Director at Axel Springer France and Media Sector Director at Deloitte.
Shareholding: 0 shares.
Jérémy Parola
Member of the Board of Directors since 2016.
Independent in relation to the company and the company management. Dependent in relation to the company’s major shareholders.
Born: 1987
Education: Bachelor degree in Marketing from EDHEC Business School and Masters degree in Communication, Marketing and Media Management at Celsa/La Sorbonne.
Other assignments: Web marketing director at Reworld Media S.A.
Former assignments: Business Development Manager at La Tribune (financial Newspaper).
Shareholding: 0 shares.
Erik Siekmann
Member of the Board of Directors since 2016.
Independent in relation to the company, the company management and the company’s major shareholders.
Born: 1971
Education: Studies in Economics at the Techni-cal University of Berlin (TU Berlin).
Other assignments: Founder and CEO of Digital Forward GmbH and founder and CEO of Daytona Ventures GmbH as well as co-founder and CEO of ESP – eSales Performance Marketing GmbH.
Former assignments: CEO Blume 2000 new media AG and CEO and co-founder of Valentins GmbH.
Shareholding: 0 shares.
Nils Carlsson
Member of the Board of Directors since 2016.
Independent in relation to the company, the company management and the company’s major shareholders.
Born: 1969
Education: MBA, Finance Management, Edinburgh 2011; School of Econom-ics & Management Stock-holm, Handelshögskolan 2004; School of Econom-ics Växjö, University degree, Economics,1994.
Other assignments: CEO Eniro Sweden AB, Member of the board of Netbooster, Electrolux, EHL and Eniro.
Former assignments: CEO Electrolux Sweden AB; Group COO Net-booster Group; CEO Guava (UK); VP Product & Sales Telenor AB; Director Business Development Vodafone Group; Director Product development Europolitan AB
Shareholding: 0 shares.

47 Tradedoubler Annual Report 2015
Company Management
Company Management
Matthias Stadelmeyer, born 1976
Chief Executive Officer (CEO) since April 2014.
Education: Studied Industrial Management and Engineering at the University of Applied Sci-ences in Munich.
Previous assignments: Matthias Stadelmeyer has held several leading posi-tions within Tradedoubler such as Sales Director and Head of TD Technology in Germany, Regional Director for market unit DACH and Vice President Sales. Matthias started his career as Team leader for Online Marketing at CANCOM IT Systeme AG, Munich.
Based: Münich
Holdings: 100,000 shares.
Tomas Ljunglöf, born 1966
Chief Financial Officer (CFO) since Februari 2014.
Education: Degree in Master of Science in Busi-ness and Economics from Stockholm University.
Previous assignments: Tomas Ljunglöf has worked as Business Controller and CFO for more than 20 years. Tomas has, among other things, worked as CFO at Glocalnet (publ.) year 2000-2006 and as CFO at Telenor Sweden year 2006-2009. Further, Tomas has managed his own consultancy busi-ness and most recently held the position as CFO at ORC Software 2011-2013.
Based: Stockholm
Holdings: 0 shares.
Marcel Chaudron, born 1976
Chief Operation Officer (COO) since January 2016.
Education: Degree in Commercial Economics from The Hague Univer-sity of Applied Sciences.
Previous assignments: Marcel Chaudron has held several leading positions within Tradedoubler such as International Group Account Director, Director Operational Excellence, Product Director, Group Client Service Director and Vice President Af-filiate. Marcel started his career as product & sales manager at Nedstat web analytics (Comscore), Amsterdam.
Based: Rotterdam
Holdings: 0 shares.
Jeff Johnston, born 1976
Chief Strategy Officer (CSO) since January 2016.
Education: Studied Com-merce and Administration at Victoria University Wel-lington in New Zealand.
Previous assignments: Jeff Johnston has held several leading positions within Tradedoubler such as Vice President of product management and Product Director. Jeff aslo co-founded UPCAST, the SaaS platform that helps top brands and agencies build, execute and optimize social media campaigns across Face-book and Twitter, sold to MediaMath in 2014.
Based: London
Holdings: 0 shares.
James Milne, born 1983
VP Business Development since January 2016.
Education: -
Previous assignments: James Milne has held a number of positions within Tradedoubler since 2010, including Account Director and Head of Cli-ent Services looking after some of the company’s largest clients. James began his career in media publishing before moving into digital media with United Business Media Plc.
Based: London
Holdings: 0 shares.

48Tradedoubler Annual Report 2015
Definitions
DefinitionsActive publisherA publisher that has, during the last month, generated a recordable transaction in the Tradedoubler network.
Capital employed Total assets less current and long-term non-interest-bearing liabilities, including deferred tax liabilities.
EBITDA EBITDA is revenue before tax, net financial items and depreciation/amortisation and impairment.
EBITDA-margin EBITDA as a percentage of revenue.
Equity/assets ratio – Shareholders’ equity as a percentage of total assets.
Net margin Profit after tax as a percentage of sales.
Operating margin Operating profit as a percentage of revenue.
Percentage of risk-bearing capital Total of shareholders’ equity, minority inter-ests, shareholder loans and deferred tax lia-bilities divided by total assets.
Price/equity ratio Price of the share divided by shareholders’ equity per share.
P/E ratio Share price divided by revenue for the year per share.
Return on shareholders’ equity Revenue for the period as a percentage of the average shareholders’ equity, calculated as open and closing shareholders’ equity divided by two.
Return on capital employed Operating profit plus interest income as a percentage of average capital employed, cal-culated as opening and closing capital employed divided by two.
Revenue per share Revenue of the year divided by the average number of shares.
Revenue per share after full dilution Revenue of the year divided by the average number of shares after full dilution.
Solidity Total equity as a percentage of total assets.
Working capital Total current assets less cash and cash equivalents, short term investments and total current liabilities.
Change related items Change related items refer to items of non-recurring nature and the purpose of disclos-ing these separately is to make it easier for the reader to understand the underlying year-on-year developments.
Definitions