Trade, Technology Adoption and the Rise of the Skill ... · Trade, Technology Adoption and the Rise...
34
Trade, Technology Adoption and the Rise of the Skill Premium in Mexico Alejandro Ria~ no November 17, 2009 Abstract In this paper I seek to quantify the impact of trade-induced technology adoption on the dramatic increase in the skill premium in Mexico after the unilateral trade liberalization of 1985. To do so, I develop and estimate a structural model of trade and technology adoption with heterogeneous rms in a small open economy. The choice of technology aects the productivity realizations that a rm receives, as well as it’s skill-intensity. The model is estimated using a Simulated Method of Moments estimator, and tted to the Mexican manufacturing sector for the period 1987-1990. The estimates indicate that trade-induced technology adoption can explain about one-sixth of the observed rise of the skill premium in Mexico. Keywords: Wage inequality, Skill-biased technical change, Structural estimation. JEL Classication Numbers: F12, J31, O33. E-mail: [email protected]. GEP, University of Nottingham, Nottingham, NG7 2RD, United Kingdom. Tel.:+44(0) 115 951 5466; fax: +44(0) 115 951 4159. I would like to thank Jim Tybout for his guidance and encouragement. I also want to thank Kerem Cosar, Eugenia Gonzalez, Ed Green, Andr es Rodr guez-Clare, Neil Wallace, Ruilin Zhou and seminar participants at the Fall 2008 Cornell-Penn State Macro Workshop, Illinois, Kansas City FED, Los Andes and Nottingham for useful comments. I would like to thank Nezih Guner for his help in the development of the computer code used in the paper. This research was supported in part by the National Science Foundation (Grant No.SES-0617888). Any opinions, ndings, and conclusions or recommendations expressed in this dissertation are those of the author and do not necessarily reect the views of the National Science Foundation. All remaining errors are my own. 1
Transcript of Trade, Technology Adoption and the Rise of the Skill ... · Trade, Technology Adoption and the Rise...

Trade, Technology Adoption and the Rise of the Skill Premium in
Mexico
Alejandro Riano∗
November 17, 2009
Abstract
In this paper I seek to quantify the impact of trade-induced technology adoption on the dramaticincrease in the skill premium in Mexico after the unilateral trade liberalization of 1985. To do so,I develop and estimate a structural model of trade and technology adoption with heterogeneousfirms in a small open economy. The choice of technology affects the productivity realizationsthat a firm receives, as well as it’s skill-intensity. The model is estimated using a SimulatedMethod of Moments estimator, and fitted to the Mexican manufacturing sector for the period1987-1990. The estimates indicate that trade-induced technology adoption can explain aboutone-sixth of the observed rise of the skill premium in Mexico.
Keywords: Wage inequality, Skill-biased technical change, Structural estimation.JEL Classification Numbers: F12, J31, O33.
∗E-mail: [email protected]. GEP, University of Nottingham, Nottingham, NG7 2RD, UnitedKingdom. Tel.:+44(0) 115 951 5466; fax: +44(0) 115 951 4159. I would like to thank Jim Tybout for his guidanceand encouragement. I also want to thank Kerem Cosar, Eugenia Gonzalez, Ed Green, Andres Rodrıguez-Clare, NeilWallace, Ruilin Zhou and seminar participants at the Fall 2008 Cornell-Penn State Macro Workshop, Illinois, KansasCity FED, Los Andes and Nottingham for useful comments. I would like to thank Nezih Guner for his help in thedevelopment of the computer code used in the paper. This research was supported in part by the National ScienceFoundation (Grant No.SES-0617888). Any opinions, findings, and conclusions or recommendations expressed in thisdissertation are those of the author and do not necessarily reflect the views of the National Science Foundation. Allremaining errors are my own.
1

1 Introduction
Over the last two decades, middle-income developing countries have become more integrated with
the world economy by slashing tariffs and scrapping quotas and other non-tariff barriers to trade.
At the same time wage inequality has increased dramatically (Goldberg and Pavcnik, 2007, and
Hanson and Harrison, 1999a). This fact is at variance with the prediction of the Stolper-Samuelson
theorem which states that the real remuneration of unskilled workers should increase in countries
relatively abundant in unskilled labor after opening up trade.
An alternative hypothesis proposed by Acemoglu (2003) is based on the stylized fact that firms
in developing countries import a significant fraction of their machinery and equipment from skill-
abundant developed countries (Eaton and Kortum, 2001). Since the relative supply of skilled
workers in developed countries has risen continuously since the 1970s, machinery and equipment
(M&E) goods produced there have also become more skill-complementary. Thus, firms in devel-
oping countries would tend to become more skill-intense after purchasing sophisticated M&E from
abroad. Assuming that the operation of advanced M&E is associated with higher fixed costs of
operation (because of more frequent/complex maintenance procedures, for example), a trade liber-
alization, which increases the potential sales for new and existing exporters can induce the adoption
of skill-biased technology embodied in capital equipment, increasing the relative demand for skilled
labor and the skill premium. In this way, trade liberalization in an unskilled-labor abundant country
can result in an increase in wage inequality.
This paper explores the quantitative importance of the mechanism described above, estimating a
structural dynamic model of an open economy with heterogeneous firms. Using plant-level data
from Mexico’s manufacturing sector I estimate the structural parameters that govern the technology
adoption, skill intensity and export decisions for manufacturing firms. I then use my estimated
model to quantify the impact of a unilateral trade liberalization on the skill premium. This paper
is, to the best of my knowledge, the first attempt to structurally estimate the impact of trade-
induced technology adoption on wage inequality.1
1Krusell et. al. (2000) study the role of falling prices of capital equipment in explaining the increase of wage
2

Using my econometric model I estimate the response of technology adoption and the skill premium
to a unilateral trade liberalization of a similar magnitude to the one that took place in Mexico
after 1985 (a 38% reduction in the price of the imported good in the model). I find that only a
small fraction of plants in the middle of the productivity distribution are induced to adopt the more
advanced technology. When imports increase, the balanced trade condition implies that the value of
exports increases in the same magnitude. The number of high-tech exporting firms in the economy
rises (from 29 to 32 percent), while firms in the lower tail of the productivity distribution contract
and become less skill-intensive or exit. Finally, firms that were using the advanced technology before
liberalization see their total profits fall. Overall, the relative demand for skill increases producing
an increase in the skill premium of around 2.4 percent. When the cost of technology adoption is
affected by the change in import tariffs, trade liberalization produces a 4.2 percent increase in the
skill premium. In this scenario, trade-induced technology adoption can explain about one-sixth of
the observed increase in the skill premium in the data.
My model builds on work by Hopenhayn (1992), Melitz (2003) and Yeaple (2005). The model is a
dynamic model of industry evolution, where firms produce using skilled and unskilled labor, and
are heterogeneous in their relative productivity of skilled labor. Productivity evolves according to
an exogenous stochastic process, where the mean of the process depends on the technology that
a firm chooses to operate. Following Yeaple (2005) firms can choose between two technologies: a
“traditional” technology characterized by high marginal costs and low fixed costs, and a “modern
technology” that has low marginal costs but requires a high fixed cost of operation2. Higher pro-
ductivity draws increase the relative marginal product of skilled labor, so firms substitute towards
skilled labor3, becoming more skill-intensive. Only high-productivity firms (firms with sufficiently
large sales) will find optimal to incur the higher per-period fixed cost of operating the modern tech-
nology. Hence, modern firms will be larger and more skill-intensive than firms using the traditional
inequality in the US using a structural estimation framework.2My model is similar to Bustos (2005). In her model firms produce using two types of labor, and choose between
two technologies characterized by the same trade-off between marginal and fixed cost as in my model. However, hermodel is static, and assumes that skilled and unskilled workers are perfect complements in production.
3This is the case if skilled and unskilled labor are gross substitutes.
3
technology4.
Mexico is one the best case studies to understand the distributional effects of increased trade
openness. Mexico went from being a very closed economy to become one of the most open countries
in the world (trade as a fraction of GDP has increased from 20 percent in 1980 to 55 percent in
1995 and it has kept growing, up to 60 percent in 2006). At the same time, the skill premium,
defined as the mean wage of skilled workers relative to the mean wage of unskilled workers increased
by almost 30 percent between 1985 and 1994, remaining stable afterwards. These two trends are
clearly depicted in Figure 1. To put it in perspective, it took more than twenty five years for a
change of similar magnitude in the skill premium to take place in the United States.
Figure 1 here
A large body of literature has studied the relationship between wage inequality and trade openness
from the perspective of the Hecksher-Ohlin-Samuelson (HOS) model and one of its main corollaries,
the Stolper-Samuelson theorem (Esquıvel and Rodrıguez-Lopez, 2003, Feliciano, 2001, Hanson and
Harrison 1999b and Robertson, 2004 for the case of Mexico). However, this approach has not been
very successful, as these studies find that the correlation between changes in output prices and
relative wages at the industry level is extremely low. Moreover, when ‘mandated wage’ equations
(zero-profit conditions derived from HOS) are fitted to the data, their estimates are very imprecise,
grossly over-predict wage changes and have very low explanatory power5. Other studies that have
considered alternative hypotheses for the increase in wage inequality in Mexico include Feenstra
4Doms et. al. (1997) observe a set of 17 advanced automation technologies used by manufacturing plants (i.e.numerically controlled machines, robots, programmable controllers, etc.) in a small set of industries (SICs 34-38) in the US. They find a monotonically increasing relationship between the number of technologies used in aplant and the education level of its workforce. They also find that in more technologically advanced plants, non-production workers’ share of employment and wage-bill are higher (controlling for size and capital-output ratio).Fernandez (2001) studying in detail the retooling of a food processing plant in the Midwest finds that using a modernautomated technology increased the complexity of tasks faced by production workers, and changed the compositionof the production workforce in favor of high-skill occupations. For developing countries, Bustos (2005), Hansonand Harrison (1999a) and Pavcnik (2003) also find a positive correlation between the use of patents and licensingagreements, spending on computers and software, and skill intensity at the firm level.
5Attanasio et. al. (2004) and Hanson and Harrison (1999a, 1999b), argue that the increase in the skill premiumcan be explained using a HOS framework, since the industries that experienced the largest reductions in protection(and which should have experienced the largest changes in relative prices) were predominantly intensive in unskilledlabor
4
and Hanson (1997) that examine the role of foreign direct investment, and Verhoogen (2008) which
provides evidence that improved exporting opportunities increase within-industry wage dispersion
due to quality-upgrading at the plant level.
My model is related to a growing literature that studies the complementarities between investment
and the decision to export at the firm level. These papers present evidence for several countries that
suggests that exporting and productivity-enhancing investment are complementary strategies for a
firm.6 If trade openness does provide a strong incentive for firms to invest and absorb new technolo-
gies, then this channel might also be relevant to explain the rise of the skill premium observed in
Mexico and other developing countries. This paper contributes to this literature by attempting to
measure the impact of this complementarity between exporting and technology adoption on wage
inequality.
The paper is organized as follows: Section 2 presents the model and discusses its main implications.
Section 3 describes the data used for the estimation, and presents preliminary evidence of the pat-
terns of the skill premium, exporting and use of advance technology in the data. Section 4 presents
the estimation method, and discusses the resulting structural parameters. Section 5 presents the
results of a counter-factual unilateral trade liberalization. Section 6 concludes and suggests avenues
for future research. An online appendix provides a brief description of the computational algorithm
used to compute the stationary equilibrium of the model and the data cleaning procedures.
6Aw et. al. (2007) find a positive and significant correlation between shocks that lead a firm to start exporting andshocks inducing investment in R&D/worker training in the Taiwanese electronics industry. Bustos (2005) finds thatnew exporters outspend existing exporters and domestic firms in technology-related investment in Argentina. Iacovoneand Javorcik (2007) document a higher frequency of investment (in physical capital) spikes for Mexican manufacturingfirms that will start exporting within the next two years, and Lileeva and Trefler (2007) find that Canadian plantsthat were induced to become exporters after the CUSFTA agreement increased their labor productivity and adoptionof advanced manufacturing technologies.
5
2 Model
Preferences and Demand
Time is discrete and labeled t = 0, 1, 2, . . .. The economy is populated by a mass of L individuals,
a fraction � of which are skilled7. Each individual is endowed with one unit of time that is supplied
inelastically. Individuals are risk-neutral and maximize the expected present discounted value of a
consumption aggregate, so U = E0[∑∞
t=0 �tCt], with � ∈ (0, 1). Individual income consists of labor
income plus distributed profits of domestic firms. The consumption good is a CES aggregate of a
continuum of domestically-produced varieties, qd(!) and a single imported variety, qf ,
C =
(∫!∈Ω
qd(!)�d! + q�f
) 1�
, � ∈ (0, 1), �c ≡ 1/(1− �).
where Ω denotes the set of domestically-produced goods. It is assumed that the elasticity of
substitution among domestic varieties is the same as the elasticity of substitution between the
foreign good and domestic goods. These preferences result in demand functions for variety !, and
for the imported good of the form
qd(!) =
(Y
P
)(pd(!)
P
)−�c,
qf =
(Y
P
)(pf�fP
)−�c.
where Y is aggregate income, and P is the ideal price index defined as,
P =
[∫!∈Ω
pd(!)1−�cd! + (pf�f )1−�c] 1
(1−�c). (1)
I assume that the economy is small with respect to the rest of the world in the following sense:
consumers can buy the foreign good at a price pf�f , where pf is the world price of the imported
consumption good and �f > 1 is an iceberg transportation cost. Domestic producers in turn, face a
7There are no intrinsic productivity differences between skilled and unskilled workers. They simply are differentfactors of production (imperfect substitutes) from the perspective of firms
6

foreign demand schedule qx(!) = Ax(px(!))−�c for their own variety, where the size of the foreign
market, Ax, is a parameter. Hence, this economy takes as given the price of imports and the
demand schedules for its exports as in Demidova and Rodrıguez-Clare (2009).
Production
Firms are monopolistic competitors with market power in the good they sell but are price-takers
in the labor market. They can operate either a traditional or a modern technology. Let k ∈ {1, 2}
index the technology used by a firm, with k = 1 denoting the traditional technology and k = 2 the
modern one. Technology k requires a per-period fixed cost of operation fk denominated in units of
output that need to be produced but cannot be sold. I assume that the fixed cost of operating the
modern technology is higher than that of the traditional technology, so f1 < f2. This might reflect
higher maintenance costs as the complexity of tasks that workers need to perform increases when
using advanced technologies as documented by Fernandez (2001). The only input in production is
labor, skilled and unskilled. Firms produce according to the following production function:
q =[l� + (zℎ)�
] 1� , �p ≡
1
1− �. (2)
where l and ℎ denote unskilled and skilled labor employed by the firm, �p is the elasticity of
substitution between skilled and unskilled labor, and z is a firm-specific, skill-biased productivity
index. Firm’s productivity follows an AR(1) processes with a mean zk that depends upon a firm’s
technology choice,
log(zt+1) = zk + � log(zt) + "t+1, "t+1 ∼ N (0, �2"), (3)
∣�∣ ∈ (0, 1), z1 < z2.
Technology 2 results in higher productivity realizations on average8, but requires a higher per-period
fixed cost of use relative to technology 1. If a firm wants to start using a different technology, it
8I assume that the persistence and variance of innovations are the same for both technologies.
7
needs to incur a sunk cost that reflects the costs of retooling and adopting the new productive
process9.
This characterization of technology results in a trade-off for firms between marginal cost and the
fixed cost of operating a given technology. The higher productivity realizations that result from
using technology 2 will make a firm larger (in terms of employment) and also more skill-intensive,
provided that skilled and unskilled labor are gross substitutes. How responsive will skill intensity
be to productivity shocks crucially depends on how substitutable skilled and unskilled workers are
in production. If the elasticity of substitution between the two types of labor is very high, even
small productivity shocks will result in large changes in the relative demand for skilled workers
at the firm level. At an aggregate level this will also imply that the skill premium will be highly
responsive to aggregate shifts of the relative labor demand for skilled labor.
The firm’s decision problem can be partitioned in a static profit maximization, in which a firm
chooses optimal price(s) to charge, its labor input and whether or not to export, and a dynamic
problem regarding technology adoption. I describe the static problem first.
Static Problem
Incumbent firms can sell their output in the domestic market alone or they can export some of it,
although exporting is costly. A firm that in a given period decides to sell abroad faces two costs:
1) A (per-period) fixed cost fx of participating in the export market (again, denominated in units
of output) and 2) variable costs that take the form of iceberg transportation costs, so that for one
unit of a good to arrive at its final destination, �x > 1 units must be shipped, which can differ from
�f . Since production exhibits constant-returns-to-scale, firms independently maximize the profits
from domestic and foreign sales. Given the CES preferences, firms set their prices at the usual
constant markup over marginal cost.
Every period a firm compares the potential profits from exporting with the participation cost in
9This representation of the innovation decision is similar in spirit to the one used by Costantini and Melitz(2007) where firms face a one-time opportunity to obtain a high productivity draw which has long-lasting effects onproductivity.
8
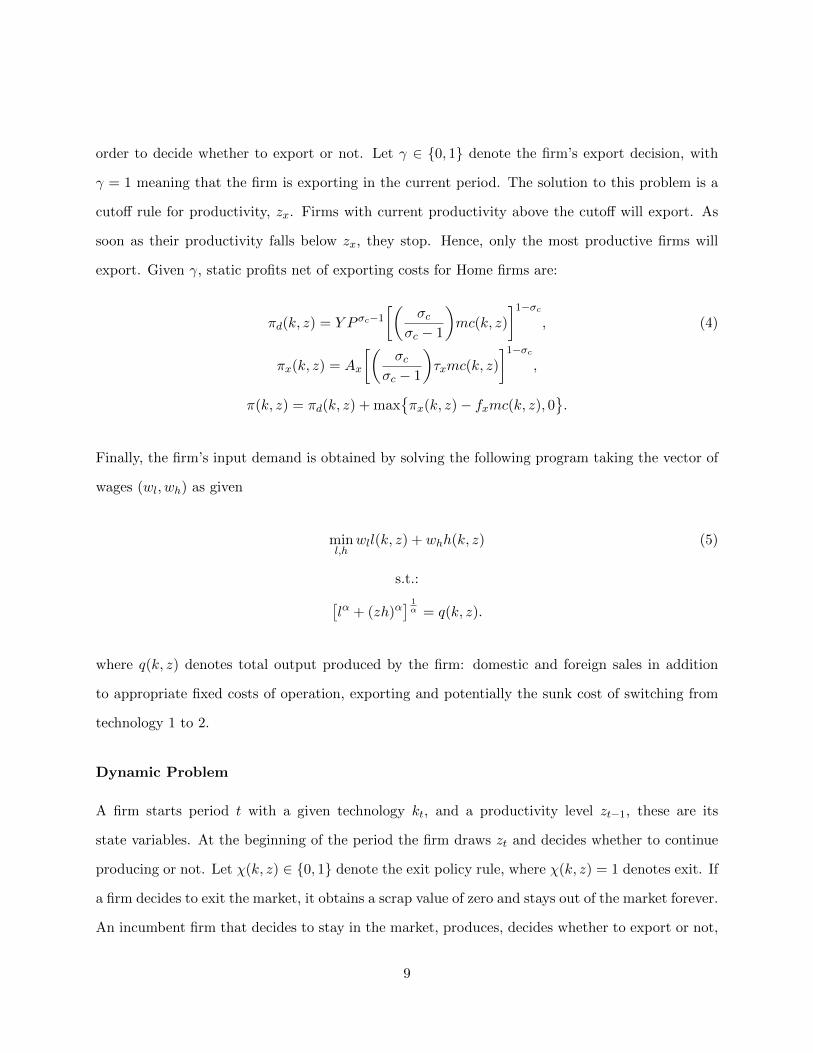
order to decide whether to export or not. Let ∈ {0, 1} denote the firm’s export decision, with
= 1 meaning that the firm is exporting in the current period. The solution to this problem is a
cutoff rule for productivity, zx. Firms with current productivity above the cutoff will export. As
soon as their productivity falls below zx, they stop. Hence, only the most productive firms will
export. Given , static profits net of exporting costs for Home firms are:
�d(k, z) = Y P �c−1
[(�c
�c − 1
)mc(k, z)
]1−�c, (4)
�x(k, z) = Ax
[(�c
�c − 1
)�xmc(k, z)
]1−�c,
�(k, z) = �d(k, z) + max{�x(k, z)− fxmc(k, z), 0
}.
Finally, the firm’s input demand is obtained by solving the following program taking the vector of
wages (wl, wℎ) as given
minl,ℎ
wll(k, z) + wℎℎ(k, z) (5)
s.t.:[l� + (zℎ)�
] 1� = q(k, z).
where q(k, z) denotes total output produced by the firm: domestic and foreign sales in addition
to appropriate fixed costs of operation, exporting and potentially the sunk cost of switching from
technology 1 to 2.
Dynamic Problem
A firm starts period t with a given technology kt, and a productivity level zt−1, these are its
state variables. At the beginning of the period the firm draws zt and decides whether to continue
producing or not. Let �(k, z) ∈ {0, 1} denote the exit policy rule, where �(k, z) = 1 denotes exit. If
a firm decides to exit the market, it obtains a scrap value of zero and stays out of the market forever.
An incumbent firm that decides to stay in the market, produces, decides whether to export or not,
9
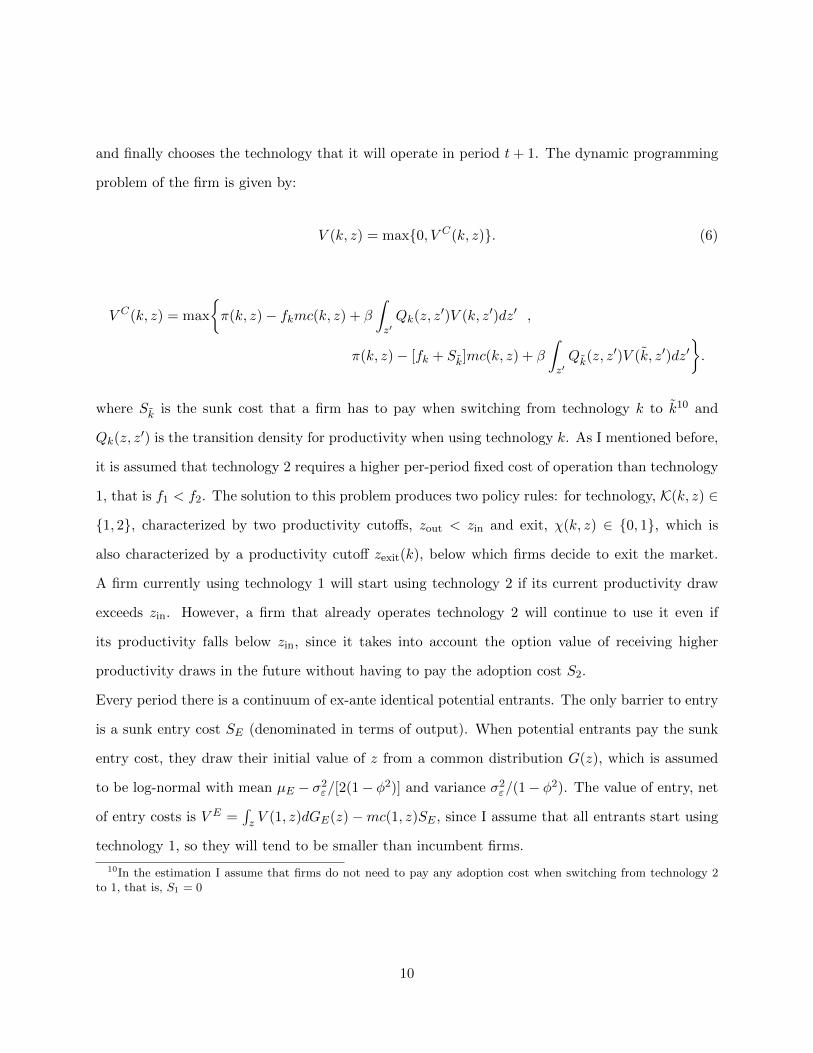
and finally chooses the technology that it will operate in period t+ 1. The dynamic programming
problem of the firm is given by:
V (k, z) = max{0, V C(k, z)}. (6)
V C(k, z) = max
{�(k, z)− fkmc(k, z) + �
∫z′Qk(z, z
′)V (k, z′)dz′ ,
�(k, z)− [fk + Sk]mc(k, z) + �
∫z′Qk(z, z
′)V (k, z′)dz′}.
where Sk is the sunk cost that a firm has to pay when switching from technology k to k10 and
Qk(z, z′) is the transition density for productivity when using technology k. As I mentioned before,
it is assumed that technology 2 requires a higher per-period fixed cost of operation than technology
1, that is f1 < f2. The solution to this problem produces two policy rules: for technology, K(k, z) ∈
{1, 2}, characterized by two productivity cutoffs, zout < zin and exit, �(k, z) ∈ {0, 1}, which is
also characterized by a productivity cutoff zexit(k), below which firms decide to exit the market.
A firm currently using technology 1 will start using technology 2 if its current productivity draw
exceeds zin. However, a firm that already operates technology 2 will continue to use it even if
its productivity falls below zin, since it takes into account the option value of receiving higher
productivity draws in the future without having to pay the adoption cost S2.
Every period there is a continuum of ex-ante identical potential entrants. The only barrier to entry
is a sunk entry cost SE (denominated in terms of output). When potential entrants pay the sunk
entry cost, they draw their initial value of z from a common distribution G(z), which is assumed
to be log-normal with mean �E − �2"/[2(1− �2)] and variance �2
"/(1− �2). The value of entry, net
of entry costs is V E =∫z V (1, z)dGE(z)−mc(1, z)SE , since I assume that all entrants start using
technology 1, so they will tend to be smaller than incumbent firms.
10In the estimation I assume that firms do not need to pay any adoption cost when switching from technology 2to 1, that is, S1 = 0
10
Stationary Equilibrium Definition
A recursive competitive equilibrium for the model consists of a value function for firms V C(k, z), a
list of decision rules for pricing {pd(k, z), px(k, z)}, exporting (k, z), labor demand {l(k, z), ℎ(k, z)},
exit �(k, z) and technology adoption K(k, z); a post entry/exit distribution of firms across tech-
nologies and productivity �(k, z) and a set of aggregate variables: aggregate income Y , ideal price
index P , mass of incumbents M and entrants ME and a vector of wages {wl, wℎ} such that: (i)
V C(k, z) solves the dynamic problem of the firm. Decision rules are optimal; (ii) labor demand
equals labor supply for both types of workers; (iii) the flow of entrants balances the flow of exiting
firms; (iv) equilibrium good prices are consistent with the aggregate price index P ; (v) aggregate
income Y equals aggregate profits plus total labor income; (vi) Free entry and (vii) balanced trade.
Discussion
Several combinations of technology use and exporting status are possible depending on the relative
position of these cutoffs in the productivity distribution (for instance, if the productivity cutoff
for exporting is too high, then all firms that become exporters have first to adopt technology 2).
As firms with high productivity levels tend to export and use the modern technology, simulations
of the model show that intermediate states such as exporting using technology 1 or not exporting
using technology 2, are not very persistent - firms quickly become high-tech exporters or low-tech
domestic producers.
When the variable cost of trade that domestic firms face when selling abroad falls, total profits
for exporting firms increase, providing an incentive to adopt technology 2 if they still have not
done it, as the higher fixed cost of operation can be spread over a higher volume of sales. In
a stationary equilibrium with lower trade costs, the share of firms using the modern technology
increases. Firms using technology 2 become larger and more skill-intensive at the expense of firms
that use technology 1 which contract or exit the market altogether.
If on the other hand, what happens is that the economy pursues a unilateral trade liberalization
which reduces the price that consumers pay for the imported good, the demand for the imported
11

good rises (at the expense of the demand for domestic goods), reducing domestic profits for all
firms. The reduction in profits causes smaller, unskilled worker-intensive firms to contract and
exit. However, some firms in the middle of the productivity distribution are induced to export,
thus maintaining balanced trade. Some of these new exporters will also adopt technology 2 and
become more skill-intensive.
3 Data
The data used in the paper comes from the Encuesta Industrial Anual (Annual Manufacturing
Survey) produced by the Instituto Nacional de Estadısticas, Geografıa, e Informacion (INEGI), the
Mexican government statistical agency. After cleaning the data (the exact procedure is described
in the online Appendix), I have a balanced panel of 1,913 plants for the period 1984-1990. For
each plant I have information on the total number of obreros (blue-collar workers whose main
activities include machine operation, production supervision, repair, maintenance and cleaning)
and empleados (white-collar workers such as managers, administrators, professionals and salesmen),
total number of hours worked for each type of worker, total remuneration, production, input use,
investment in capital goods, including machinery and equipment imports, and exporting status
from 1986 onwards.
Exporting and Use of Imported Technology
Empirically, I identify plants that purchase imported machinery and equipment (M&E) as using
the modern technology described above11. Similar definitions of technology adoption have also been
used by Huggett and Ospina (2001) and Kasahara (2001). Table 1 shows how export participation
and the use of imported machinery and equipment (M&E) experienced a dramatic increase over
the second half of the 1980s. The patterns of openness for the manufacturing sector mirror the
behavior of the aggregates for the whole economy shown in Figure 1. In 1986, 66 percent of
11Alvarez and Robertson (2004) using data from the 1995 National Survey of Employment, Salaries, Technology,and Training (ENESTYC) document that Mexican firms tend to adopt new advanced production technologies throughimports rather than through R&D on-site.
12

the plants served only the domestic market and did not import any machinery and equipment,
by the 1990, this group comprised 42 percent of the sample. At the same time, the number of
plants that both export and use imported machinery doubled. The number of plants that export
but do not import M&E increased by just 8 percent. Although the barriers faced by Mexican
exporters were relatively low and did not change much during this period, one of the components
of the macroeconomic stabilization program of 1985 was a 46 percent depreciation of the nominal
exchange rate, which in turn resulted in depreciation of the real exchange rate of over one hundred
percent, providing a tremendous boost for exports. At the same time, by the end of 1987 the
price of machinery and equipment relative to consumer prices experienced a 30 percent fall which
persisted until the Tequila crisis of 1994. This trend is very similar to what has been documented in
the United States by Krusell et. al. (2000), but was also reinforced by a 55 percent tariff reduction.
Table 1 here
Relative Employment and Wages
Table 2 shows the evolution of mean employment and hourly wages over the sample period. Between
1984 and 1990, the hourly remuneration for skilled workers increased by 20 percent, with most of
the increase happening after 1988. Wages for unskilled workers fell by 7 percent over the same
period. The two trends put together result in an increase in the skill premium of 31 percent in
just six years, or a rate of growth of 4.6 percent per year, a dramatic rise in the skill premium.
Importantly, the rise of the skill premium was not concentrated in a handful of industries, it took
place across the board. The skill premium increased for 115 out 127 4-digit industries between 1984
and 1990.
The pattern of employment is surprisingly stable during the period of study. In the sample, to-
tal employment increases by 17 percent, and white and blue-collar employment increase both by
13 percent. Mean employment share of non-production workers (a measure of skill intensity) re-
mains stable at around 30 percent during the sample period. However, the wage-bill share of
non-production workers increased by 15 percent.
13
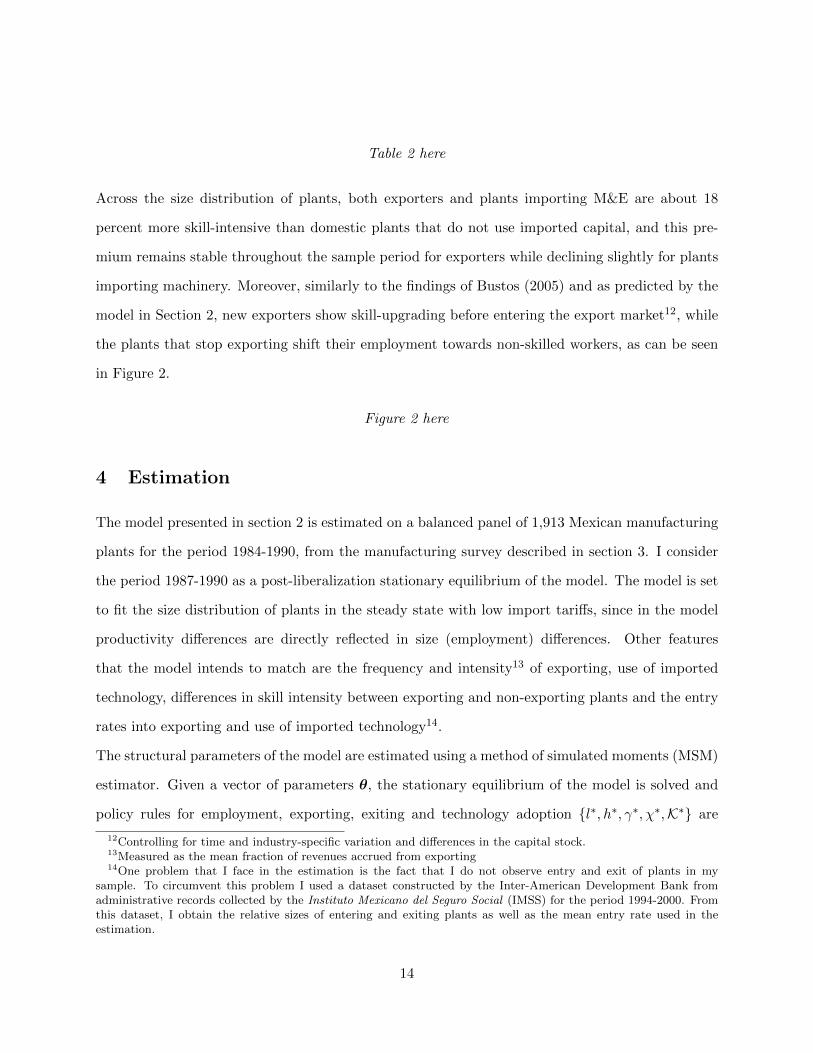
Table 2 here
Across the size distribution of plants, both exporters and plants importing M&E are about 18
percent more skill-intensive than domestic plants that do not use imported capital, and this pre-
mium remains stable throughout the sample period for exporters while declining slightly for plants
importing machinery. Moreover, similarly to the findings of Bustos (2005) and as predicted by the
model in Section 2, new exporters show skill-upgrading before entering the export market12, while
the plants that stop exporting shift their employment towards non-skilled workers, as can be seen
in Figure 2.
Figure 2 here
4 Estimation
The model presented in section 2 is estimated on a balanced panel of 1,913 Mexican manufacturing
plants for the period 1984-1990, from the manufacturing survey described in section 3. I consider
the period 1987-1990 as a post-liberalization stationary equilibrium of the model. The model is set
to fit the size distribution of plants in the steady state with low import tariffs, since in the model
productivity differences are directly reflected in size (employment) differences. Other features
that the model intends to match are the frequency and intensity13 of exporting, use of imported
technology, differences in skill intensity between exporting and non-exporting plants and the entry
rates into exporting and use of imported technology14.
The structural parameters of the model are estimated using a method of simulated moments (MSM)
estimator. Given a vector of parameters �, the stationary equilibrium of the model is solved and
policy rules for employment, exporting, exiting and technology adoption {l∗, ℎ∗, ∗, �∗,K∗} are
12Controlling for time and industry-specific variation and differences in the capital stock.13Measured as the mean fraction of revenues accrued from exporting14One problem that I face in the estimation is the fact that I do not observe entry and exit of plants in my
sample. To circumvent this problem I used a dataset constructed by the Inter-American Development Bank fromadministrative records collected by the Instituto Mexicano del Seguro Social (IMSS) for the period 1994-2000. Fromthis dataset, I obtain the relative sizes of entering and exiting plants as well as the mean entry rate used in theestimation.
14

obtained. Using these policy rules, I simulate the behavior of a large number of plants, creating
S15 simulated panel datasets {Dsit(�)}. Taking averages over these simulations, I construct a vector
of simulated moments, m(�) = 1S
∑Ss=1 m(Ds
it(�)).
The estimated vector of parameters minimizes the log-differences between a set of simulated and
sample moments:
� = arg min�∈Θ
Ψ = (log(m(�))− log(m))′[(1 + 1/S)Σ]−1(log(m(�))− log(m)). (7)
where m is the vector of moments calculated directly from the data, and Σ is the estimated optimal
weighting matrix16. The objective function results from a complicated dynamic programming
problem, hence is not smooth and presents multiple local minima. In order to deal with these
issues, I use a stochastic pattern search algorithm to solve the problem in equation 7.
There is a set of parameters that are determined out of the estimation routine. The discount
factor � is set equal to 0.939 to match the average real interest rate17 for the period 1982-2006,
of 6.46 percent. The fraction of skilled workers in the economy is set equal to the mean share of
non-production employment, 0.311. Given the CES demand system used, the ratio of domestic
revenues to total variable cost is constant across firms, and equal to the markup charged by firms.
The mean of this ratio for the post-liberalization period is 1.379, which implies a demand elasticity
�c = 3.634. The price of the imported good faced by consumers �f is set to 1.05. The variable cost
of exporting for Mexican firms is set to match the average U.S. tariff on dutiable goods imported
from Mexico, 5 percent. Table 3 summarizes the parameter values fixed outside the estimation.
Finally, the size of the economy L is normalized to 1,000.
Table 3 here
15The estimation procedure uses S = 5016The details on how the optimal weighting matrix is estimated can be found on Appendix ??.17Based on Certificados de la Tesoreria de la Federacion a 28 dıas, CETES bonds.
15

This leaves the following 12 parameters to be estimated by MSM:
� ≡ {z1, z2, �, �2" , f1, f2, S2, Ax, fx, �E , SE , �p}.
Where (z1, z2, �, �2z) determine the stochastic process for firm-specific productivity, (f1, f2, S2) are
the fixed cost of operating and adopting each technology, Ax is the size of the foreign market, fx
is the fixed cost of participating in the export market in each period, and �p is the elasticity of
substitution between skilled and unskilled labor.
Table 4 reports the moments used in the estimation. The first set of moments is based on the
size distribution of plants in the post-liberalization steady state. In the model, all productivity
differences will be reflected in size (employment) differences. Fixed costs fk and and the intercepts
of the productivity processes, zk will affect the average size of incumbent firms, since higher fixed
costs and higher productivity realizations will result in larger firms in equilibrium. The difference
between z1 and z2 and f1 and f2 will be determined by the premium in skill-intensity and size
between exporting and non-exporting plants (due to selection effects the largest firms become
exporters), as well as by the share of firms importing M&E in steady state.
Table 4 here
The parameters governing the decision to export (Ax, fx) are pinned down by the frequency and
intensity of exporting: a larger foreign market induces more firms to export, and also leads exporters
to sell a larger share of their output abroad. A higher fx on the other hand reduces the number
of firms engaged in exporting activities, but increases the share of exports in total revenues as the
fewer firms that find profitable to export will seek to spread the large fixed cost over a larger volume
of sales.
The elasticity of substitution between skilled (non-production) and unskilled (production) workers
determines the responsiveness of skill-intensity to productivity innovations (given that labor supply
is fixed in the model). If �p is large, firms that draw good productivity shocks become very large
and highly skill-intensive, while firms that suffer bad draws will shrink and employ a large share
16
of unskilled workers. Matching the share of plants in different size bins, and the employment
dispersion will help me to identify �p. The relative size of entrants and the mean entry rate (which
will be identical to the exit rate in the stationary equilibrium) determine �E and SE .
A set of dynamic moments allows me to identify the root of the auto-regressive process governing
productivity which in turn will affect the persistence of skill-intensity, which is very high in the
data. If productivity is highly persistent, in my model this would result in a highly persistent
skill-intensity across firms (for a given elasticity of substitution), with large changes taking place
only when firms switch technology. The dispersion of the size distribution helps me to identify the
variance of productivity shocks. Finally, the sunk cost of adopting technology 2 will be identified
by the share of firms importing technology in the cross-section and the mean rate at which plants
start importing M&E.
Point Estimates
Table 5 report the point estimates produced by the model. All the parameters with the exception
of the elasticity of substitution are statistically significant. The elasticity of substitution between
skilled and unskilled workers is estimated to be 1.41, although is not very precisely estimated as
the other parameters in the model, it falls in middle of the range of estimates obtained for the
US (between 1 and 2.2) estimated from macroeconomic data, and is very close to the preferred
estimate found by Katz and Murphy (1992), 1.42.
Table 5 here
The difference on average productivity for the two technologies is statistically significant. Plants
that become sufficiently productive to start operating the modern technology become significantly
bigger and more skill-intensive. On average, plants using technology 2 are 82 times larger than
their counterparts using the high-marginal cost technology, and account for most of the dispersion
of the size distribution.
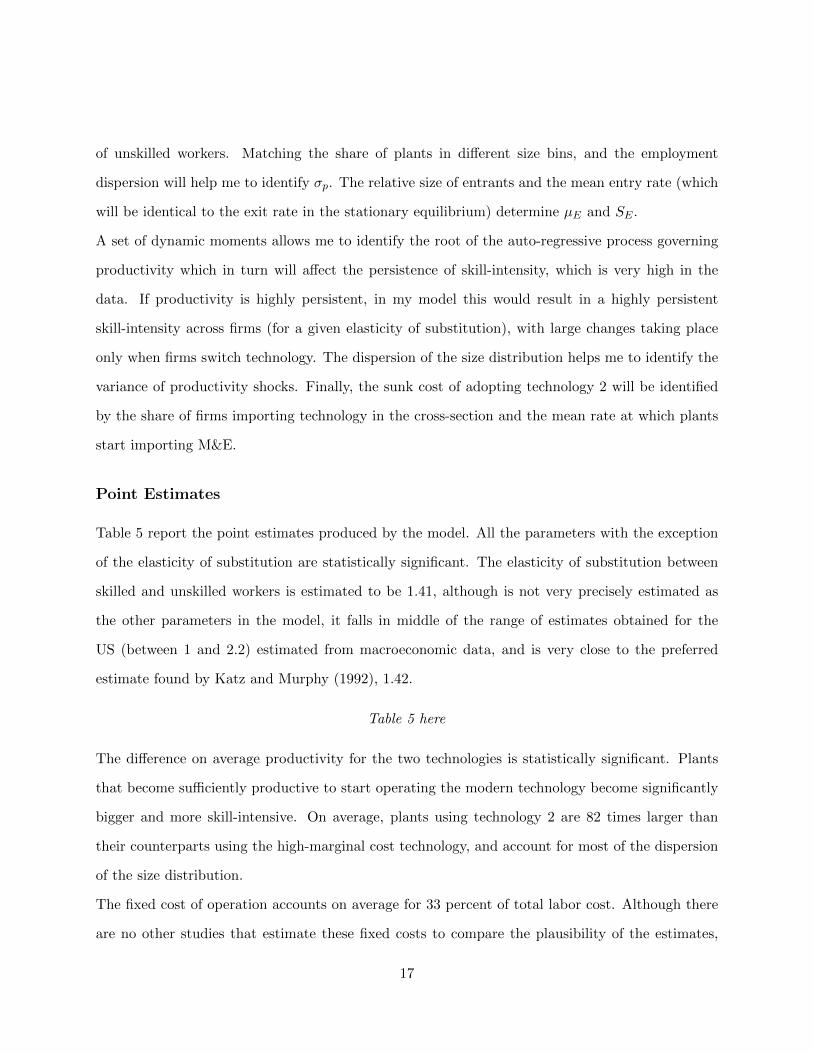
The fixed cost of operation accounts on average for 33 percent of total labor cost. Although there
are no other studies that estimate these fixed costs to compare the plausibility of the estimates,
17
Costantini and Melitz (2007) calibrate the fixed cost of operation in their model so that plants
devote 20 percent of their labor cost to overhead, assuming that all non-production workers are
devoted to overhead, based on results from Bustos (2005). Exporters pay on average 5 percent
of their foreign revenues as a per-period cost to serve the world market. However, since the fixed
cost of exporting is denominated in units of output, the smaller new exporters pay on average 11
percent of their exporting revenues.
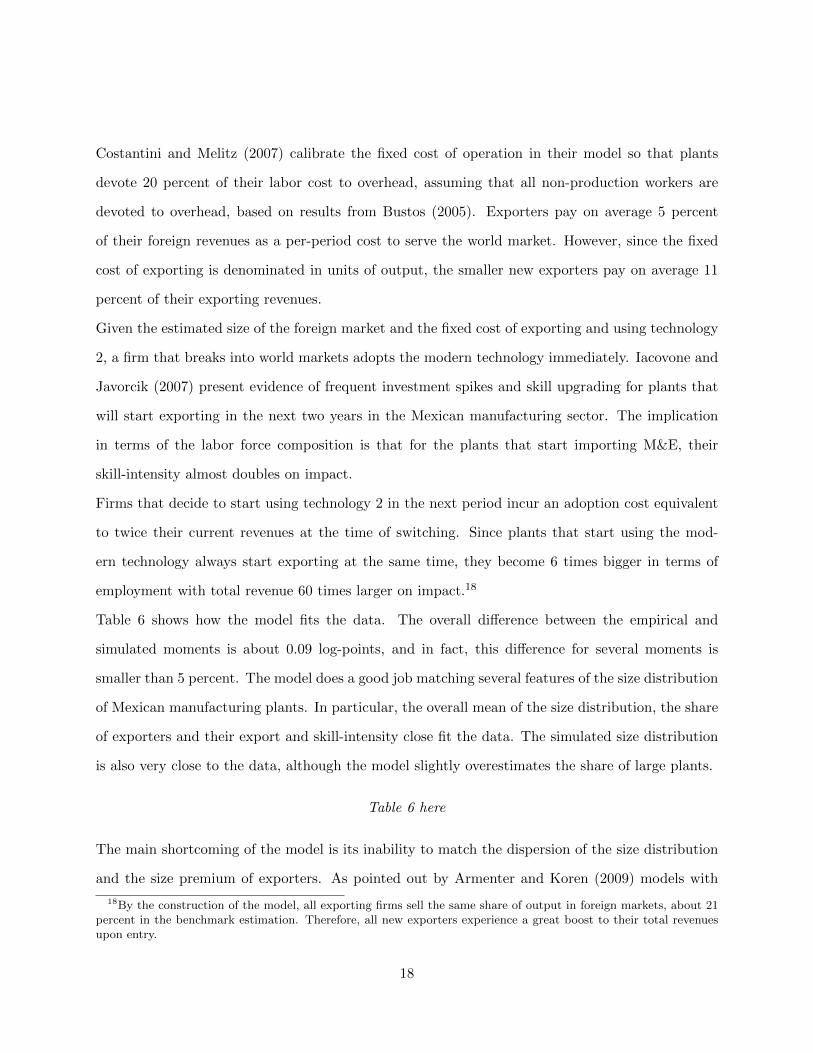
Given the estimated size of the foreign market and the fixed cost of exporting and using technology
2, a firm that breaks into world markets adopts the modern technology immediately. Iacovone and
Javorcik (2007) present evidence of frequent investment spikes and skill upgrading for plants that
will start exporting in the next two years in the Mexican manufacturing sector. The implication
in terms of the labor force composition is that for the plants that start importing M&E, their
skill-intensity almost doubles on impact.
Firms that decide to start using technology 2 in the next period incur an adoption cost equivalent
to twice their current revenues at the time of switching. Since plants that start using the mod-
ern technology always start exporting at the same time, they become 6 times bigger in terms of
employment with total revenue 60 times larger on impact.18
Table 6 shows how the model fits the data. The overall difference between the empirical and
simulated moments is about 0.09 log-points, and in fact, this difference for several moments is
smaller than 5 percent. The model does a good job matching several features of the size distribution
of Mexican manufacturing plants. In particular, the overall mean of the size distribution, the share
of exporters and their export and skill-intensity close fit the data. The simulated size distribution
is also very close to the data, although the model slightly overestimates the share of large plants.
Table 6 here
The main shortcoming of the model is its inability to match the dispersion of the size distribution
and the size premium of exporters. As pointed out by Armenter and Koren (2009) models with
18By the construction of the model, all exporting firms sell the same share of output in foreign markets, about 21percent in the benchmark estimation. Therefore, all new exporters experience a great boost to their total revenuesupon entry.
18
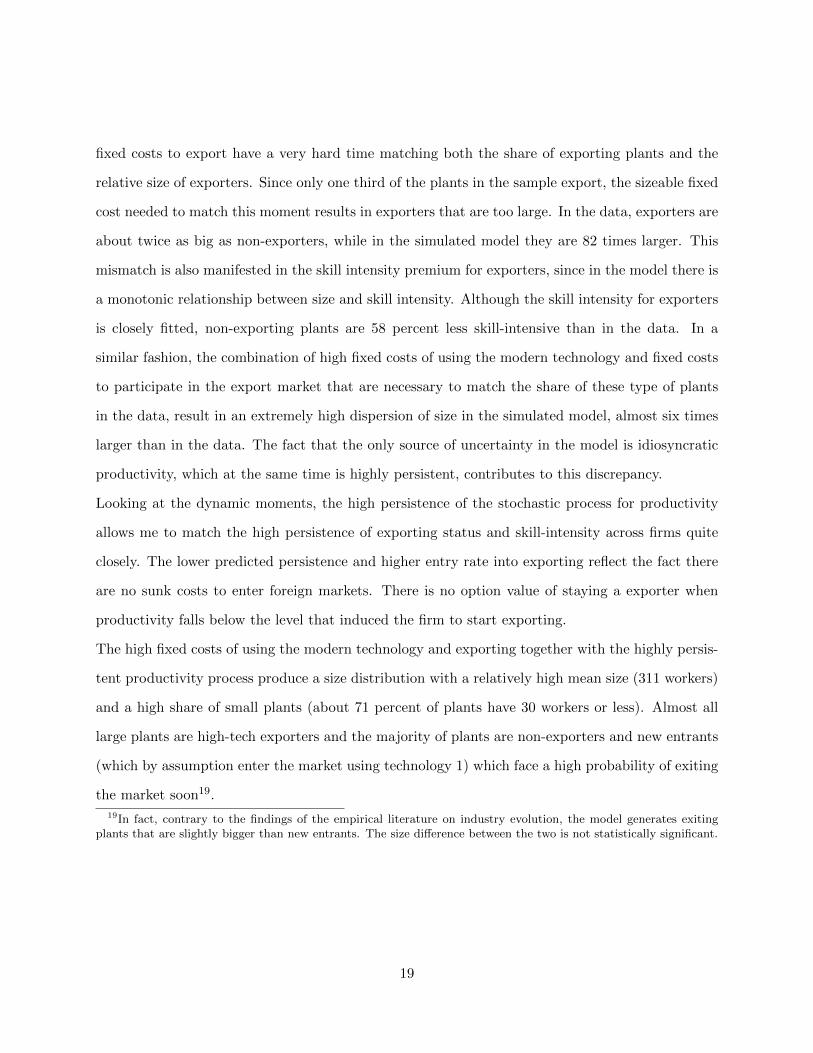
fixed costs to export have a very hard time matching both the share of exporting plants and the
relative size of exporters. Since only one third of the plants in the sample export, the sizeable fixed
cost needed to match this moment results in exporters that are too large. In the data, exporters are
about twice as big as non-exporters, while in the simulated model they are 82 times larger. This
mismatch is also manifested in the skill intensity premium for exporters, since in the model there is
a monotonic relationship between size and skill intensity. Although the skill intensity for exporters
is closely fitted, non-exporting plants are 58 percent less skill-intensive than in the data. In a
similar fashion, the combination of high fixed costs of using the modern technology and fixed costs
to participate in the export market that are necessary to match the share of these type of plants
in the data, result in an extremely high dispersion of size in the simulated model, almost six times
larger than in the data. The fact that the only source of uncertainty in the model is idiosyncratic
productivity, which at the same time is highly persistent, contributes to this discrepancy.
Looking at the dynamic moments, the high persistence of the stochastic process for productivity
allows me to match the high persistence of exporting status and skill-intensity across firms quite
closely. The lower predicted persistence and higher entry rate into exporting reflect the fact there
are no sunk costs to enter foreign markets. There is no option value of staying a exporter when
productivity falls below the level that induced the firm to start exporting.
The high fixed costs of using the modern technology and exporting together with the highly persis-
tent productivity process produce a size distribution with a relatively high mean size (311 workers)
and a high share of small plants (about 71 percent of plants have 30 workers or less). Almost all
large plants are high-tech exporters and the majority of plants are non-exporters and new entrants
(which by assumption enter the market using technology 1) which face a high probability of exiting
the market soon19.
19In fact, contrary to the findings of the empirical literature on industry evolution, the model generates exitingplants that are slightly bigger than new entrants. The size difference between the two is not statistically significant.
19

5 Trade Liberalization
Using the estimates from the previous section, I can now perform a counterfactual analysis and ask
what would happen to technology adoption and the skill premium prior to the trade liberalization.
In order to capture the experience of Mexico in the second half of the 1980s, I will look at an increase
in the foreign price of 38% (that is, �f rises from 1.05 to 1.55).20 The results of this experiment
are presented in Table 7. This increase in �f is bigger than the change in the production-weighted
average tariff for manufacturing imports that took place after liberalization, but intends to take
into account the broad licensing requirements that were in place at the time, which are considered
the most binding barrier to trade.
Table 7 here
Moving from a low to a high import tariff steady state has a direct effect on the aggregate price
index, which rises 21 percent. This has a positive effect on domestic profits and aggregate income
which increases by 16 percent, resulting in an increase in the average plant size of about one
percent. When the economy moves from a high to a low tariff regime the equilibrium mass of firms
in the market falls by approximately 2 percent. Exit takes place at the lower end of the productivity
distribution and workers employed on these firms reallocate to larger and more skill-intensive firms.
This is a pro-competitive effect that would occurs after trade liberalization.
The balanced trade condition implies that as the value of imports falls, so does the value of ex-
ports. The exporting cutoff increases, thus reducing the share of exporting plants by 12 percent
when import competition is less intense. The plants that remain exporting are larger and more
skill-intensive (12 and 3 percent respectively), although they sell a smaller share of their output
abroad. The reduction in exporting plants also is accompanied by a reduction in the fraction of
plants importing M&E. The fall in the share of high-tech plants is smaller, hence in the high-tariff
equilibrium there will be a very small fraction of high-tech non-exporters.
20Notice that the iceberg transportation cost for Mexican producers remains the same.
20
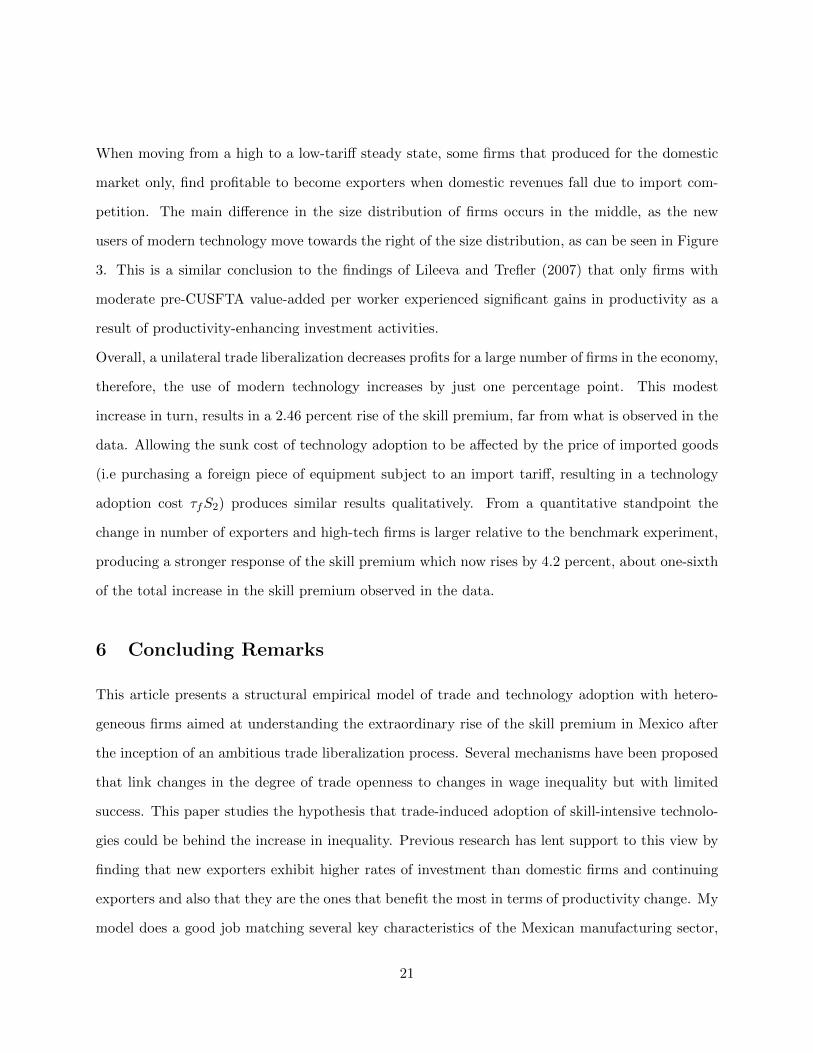
When moving from a high to a low-tariff steady state, some firms that produced for the domestic
market only, find profitable to become exporters when domestic revenues fall due to import com-
petition. The main difference in the size distribution of firms occurs in the middle, as the new
users of modern technology move towards the right of the size distribution, as can be seen in Figure
3. This is a similar conclusion to the findings of Lileeva and Trefler (2007) that only firms with
moderate pre-CUSFTA value-added per worker experienced significant gains in productivity as a
result of productivity-enhancing investment activities.
Overall, a unilateral trade liberalization decreases profits for a large number of firms in the economy,
therefore, the use of modern technology increases by just one percentage point. This modest
increase in turn, results in a 2.46 percent rise of the skill premium, far from what is observed in the
data. Allowing the sunk cost of technology adoption to be affected by the price of imported goods
(i.e purchasing a foreign piece of equipment subject to an import tariff, resulting in a technology
adoption cost �fS2) produces similar results qualitatively. From a quantitative standpoint the
change in number of exporters and high-tech firms is larger relative to the benchmark experiment,
producing a stronger response of the skill premium which now rises by 4.2 percent, about one-sixth
of the total increase in the skill premium observed in the data.
6 Concluding Remarks
This article presents a structural empirical model of trade and technology adoption with hetero-
geneous firms aimed at understanding the extraordinary rise of the skill premium in Mexico after
the inception of an ambitious trade liberalization process. Several mechanisms have been proposed
that link changes in the degree of trade openness to changes in wage inequality but with limited
success. This paper studies the hypothesis that trade-induced adoption of skill-intensive technolo-
gies could be behind the increase in inequality. Previous research has lent support to this view by
finding that new exporters exhibit higher rates of investment than domestic firms and continuing
exporters and also that they are the ones that benefit the most in terms of productivity change. My
model does a good job matching several key characteristics of the Mexican manufacturing sector,
21
and produces sensible estimates of the parameters that govern technology adoption. The results of
my estimation suggest that the import-competition effect result from trade liberalization does not
provide a sufficiently large push of the relative demand for skilled labor (by means of a significantly
adoption of modern technology) to explain the rise of the skill premium that we observed in Mexico
since the mid 1980s.
Future work on the impact of trade openness on wage inequality would benefit greatly from using
data from the National Survey of Employment, Salaries, Technology, and Training (ENESTYC)
to construct more refined measurements of advanced manufacturing technology utilization. This
would enable researchers to better identify how the labor force composition of a firm changes when
specific technologies are introduced in the workplace. Another interesting area for future research
is the transitional dynamics of wage inequality after trade liberalizations. Work on this area should
aim to explain why the skill premium increase so rapidly after Mexico joined the GATT while
remaining stable when it joined NAFTA and its volume of trade almost tripled. Understanding the
evolution of wage inequality is particulary interesting since similar patterns are observed in several
developing countries such as Argentina, Chile and Colombia. Structural empirical models of these
dynamics should help to further our understanding of the factors determining wage inequality.
References
[1] Acemoglu, D., 2003. Patterns of Skill Premia. Review of Economic Studies. 70, 199–230.
[2] Alvarez, R. and Robertson, R., 2004. Exposure to Foreign Markets and Plant-level Innovation:Evidence from Chile and Mexico. Journal of International Trade and Development. 13, 57–87.
[3] Armenter, R. and Koren, M., 2009. Economies of Scale and the Size of Exporters. WorkingPaper Federal Reserve Bank of Philadelphia.
[4] Atkenson, A. and Burnstein, A., 2007. Innovation, Firm Dynamics and International Trade.Working Paper UCLA.
[5] Attanasio, O., Goldberg, P. and Pavcnik, N., 2004. Trade Reforms and Wage Inequality inColombia. Journal of Development Economics. 74, 331–366.
22

[6] Aw, B. Y., Roberts, M. J. and Winston, T., 2007. Export Market Participation, Investmentsin R&D and Worker Training, and the Evolution of Firm Productivity. The World Economy.14, 83–104.
[7] Berman, E., Bound, J. and Griliches, Z., 1994. Changes in the Demand for Skilled Laborwithin U. S. Manufacturing Industries. Quarterly Journal of Economics. 109, 367–398.
[8] Bernard, A. B. and Jensen, J. B., 1997. Exporters, Skill Upgrading, and the Wage Gap. Journalof International Economics. 42, 3–31.
[9] Bustos, P., 2005. The Impact of Trade on Technology and Skill Upgrading: Evidence fromArgentina. Working Paper CREI Universitat Pompeu Fabra.
[10] Costantini, J. A. and Melitz, M. J., 2007. The Dynamics of Firm-Level Adjustment to TradeLiberalization. Working Paper Princeton University.
[11] Demidova, S. and Rodrıguez-Clare, A., 2009. Trade Policy under Firm-Level Heterogeneity ina Small Economy. Journal of International Economics. 78: 100–112.
[12] Doms, M., Dunne, T. and Troske, K. R., 1997. Workers, Wages and Technology. QuarterlyJournal of Economics. 112, 253–290.
[13] Eaton, J. and Kortum, S., 2001. Trade in Capital Goods. European Economic Review. 45,1195–1235.
[14] Esquivel, G. and Rodrıguez-Lopez, J. A., 2003. Technology, Trade and Wage Inequality inMexico Before and After NAFTA. Journal of Development Economics. 72, 543–565.
[15] Feenstra, R. C. and Hanson, G. H., 1997. Foreign Direct Investment and Relative Wages:Evidence from Mexico’s Maquiladoras. Journal of International Economics. 42, 371–393.
[16] Feliciano, Z. 2001. Workers and Trade Liberalization: The Impact of Trade Reforms in Mexicoon Wages and Employment. Industrial and Labor Relations Review. 55, 95–115.
[17] Fernandez, R., 2001. Skill-Biased Technological Change and Wage Inequality: Evidence froma Plant Retooling. American Journal of Sociology. 107, 273–320.
[18] Goldberg, P. and Pavcnik, N., 2007. Distributional Effects of Globalization in DevelopingCountries. Journal of Economic Literature. 45, 39–82.
[19] Hanson, G. and Harrison, A. E., 1999a. Who Gains from Trade Reform? Some RemainingPuzzles. Journal of Development Economics. 59, 125–154.
[20] Hanson, G. and Harrison, A. E., 1999b. Trade and Wage Inequality in Mexico. Industrial andLabor Relations Review. 52, 271–288.
[21] Hopenhayn, H., 1992. Entry, Exit and Firm Dynamics in the Long-Run. Econometrica. 60,1127–1150.
23
[22] Huggett, M. and Ospina, S., 2001. Does Productivity Growth Fall After the Adoption of NewTechnology. Journal of Monetary Economics. 48, 173–195.
[23] Iacovone, L. and Javorcik, B. S., 2007. Preparation to Export. Working Paper World Bank.
[24] Inter-American Development Bank, 2004. Job Flows in Latin America dataset.
[25] Kasahara, H., 2001. Temporary Increases in Tariffs and Machine Replacement: The ChileanExperience in 1980-1996. Working Paper University of Wisconsin-Madison.
[26] Katz, L. F. and Murphy, K. M., 1992.Changes in Relative Demand, 1963-1987: Supply andDemand Factors. Quarterly Journal of Economics. 107, 35–78.
[27] Krusell, P., Ohanian, L. E., Rıos-Rull, J.-V. and Violante, J.-V., 2000. Capital-Skill Comple-mentarity and Inequality: A Macroeconomic Analysis. 68, 1029–1053.
[28] Lileeva, A. and Trefler, D., 2007. Improved Access to Foreign Markets Raises Plant-levelProductivity... for Some Plants. Working Paper University of Toronto.
[29] Melitz, M. J., 2003. The Impact of Trade on Aggregate Industry Productivity and Intra-Industry Reallocations. Econometrica. 71, 1695–1725.
[30] Pavcnik, N., 2003. What Explains Skill Upgrading in Less Developed Countries? Journal ofDevelopment Economics. 71. 311–328.
[31] Robertson, R., 2004. Relative Prices and Wage Inequality: Evidence from Mexico. Journal ofInternational Economics. 64, 387–409.
[32] Verhoogen, E., 2008. Trade, Quality Upgrading and Wage Inequality in the Mexican Manu-facturing Sector. Quarterly Journal of Economics. 123, 489–530.
[33] Yeaple, S. R., 2005. A Simple Model of Firm Heterogeneity, International Trade and Wages.Journal of International Economics. 65, 1–20.
24
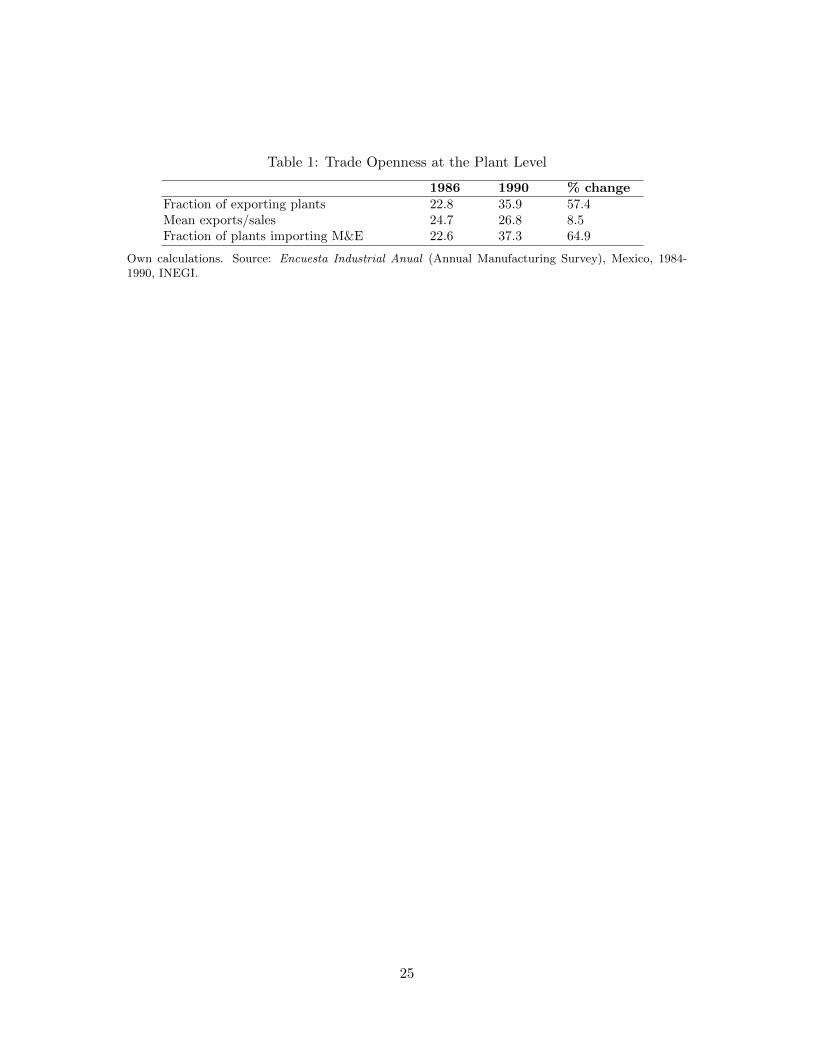
Table 1: Trade Openness at the Plant Level
1986 1990 % changeFraction of exporting plants 22.8 35.9 57.4Mean exports/sales 24.7 26.8 8.5Fraction of plants importing M&E 22.6 37.3 64.9
Own calculations. Source: Encuesta Industrial Anual (Annual Manufacturing Survey), Mexico, 1984-1990, INEGI.
25
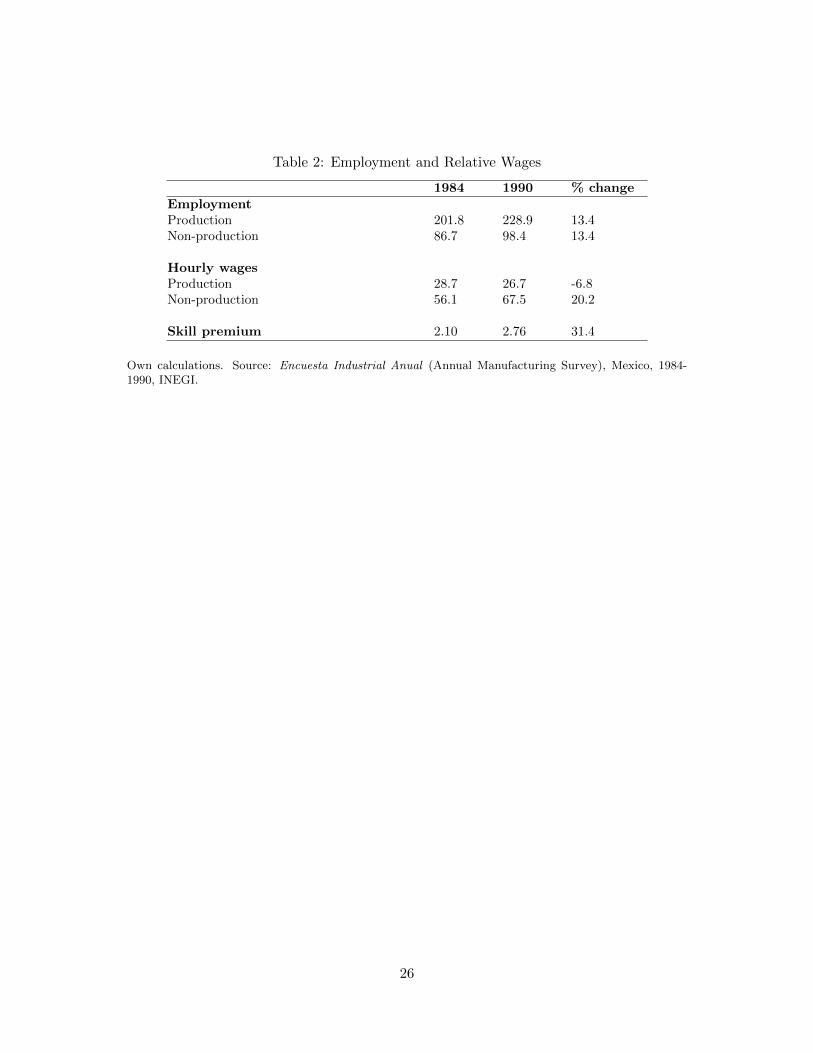
Table 2: Employment and Relative Wages
1984 1990 % changeEmploymentProduction 201.8 228.9 13.4Non-production 86.7 98.4 13.4
Hourly wagesProduction 28.7 26.7 -6.8Non-production 56.1 67.5 20.2
Skill premium 2.10 2.76 31.4
Own calculations. Source: Encuesta Industrial Anual (Annual Manufacturing Survey), Mexico, 1984-1990, INEGI.
26
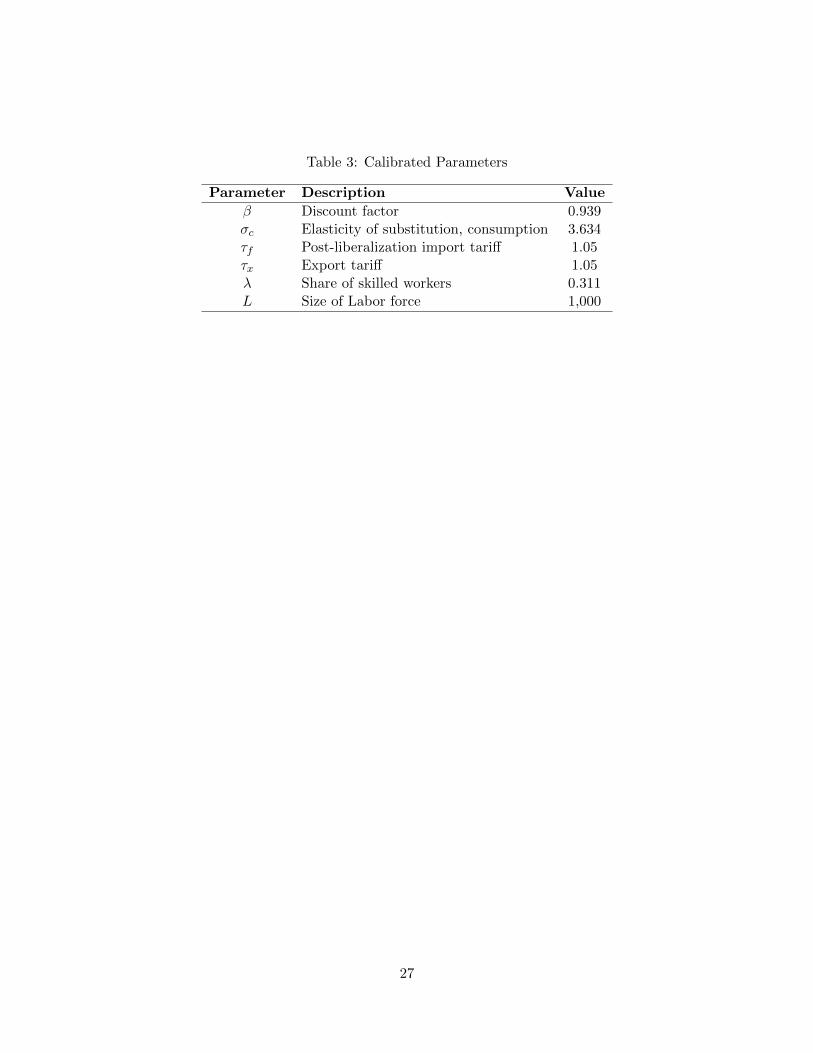
Table 3: Calibrated Parameters
Parameter Description Value
� Discount factor 0.939�c Elasticity of substitution, consumption 3.634�f Post-liberalization import tariff 1.05�x Export tariff 1.05� Share of skilled workers 0.311L Size of Labor force 1,000
27

Table 4: Moments used for Estimation (Data)
Post-Liberalization (1987-1990) Value
Mean fraction of exporting firms 0.317Mean exports/sales ratio 0.213Std. skill share of employment 0.175Mean skill share, exporters 0.347Mean entry rate 0.110Mean total employment 311.76Std total employment 461.70Mean total employment, entrants 17.85Mean total employment, exiters 15.564Mean fraction of firms using foreign technology 0.222Mean total employment, exporters 504.93Correlation(exportt, exportt−1) 0.862Correlation (skill sharet, skill sharet−1) 0.937Mean adoption rate imported technology 0.053Mean entry rate into exporting 0.039Fraction of plants with 0-30 employees 0.713Fraction of plants with 30-100 employees 0.209Fraction of plants with 100-500 employees 0.051
Own calculations. Source: Encuesta Industrial Anual (Annual Manufacturing Survey), Mexico, 1984-1990, INEGI, and Job Flows in Latin America dataset, Inter-American Development Bank (2004).
28

Table 5: Parameter Estimates
Parameter Point Estimate
Mean productivity tech. 1 (z1) 0.050(0.003)
Mean productivity tech. 2 (z2) 0.109(0.005)
Root productivity process (�) 0.952(0.012)
Variance productivity innovations (�2") 0.278
(0.073)Fixed cost of using tech. 1 (f1) 91.409
(2.354)Fixed cost of using tech. 2 (f2) 568.53
(30.242)Sunk cost of adopting tech. 2 (S) 65.093
(14.881)Foreign market size (Ax) 910.23
(0.892)Fixed cost of exporting (fx) 48.726
(0.045)Mean productivity, entrants (�E) 1.226
(0.0187)Sunk cost of entry (SE) 4.234
(1.555)Elasticity of substitution (�p) 1.410in production (0.952)
Value objective function (Ψ) 0.0926
Standard errors in parenthesis.
29
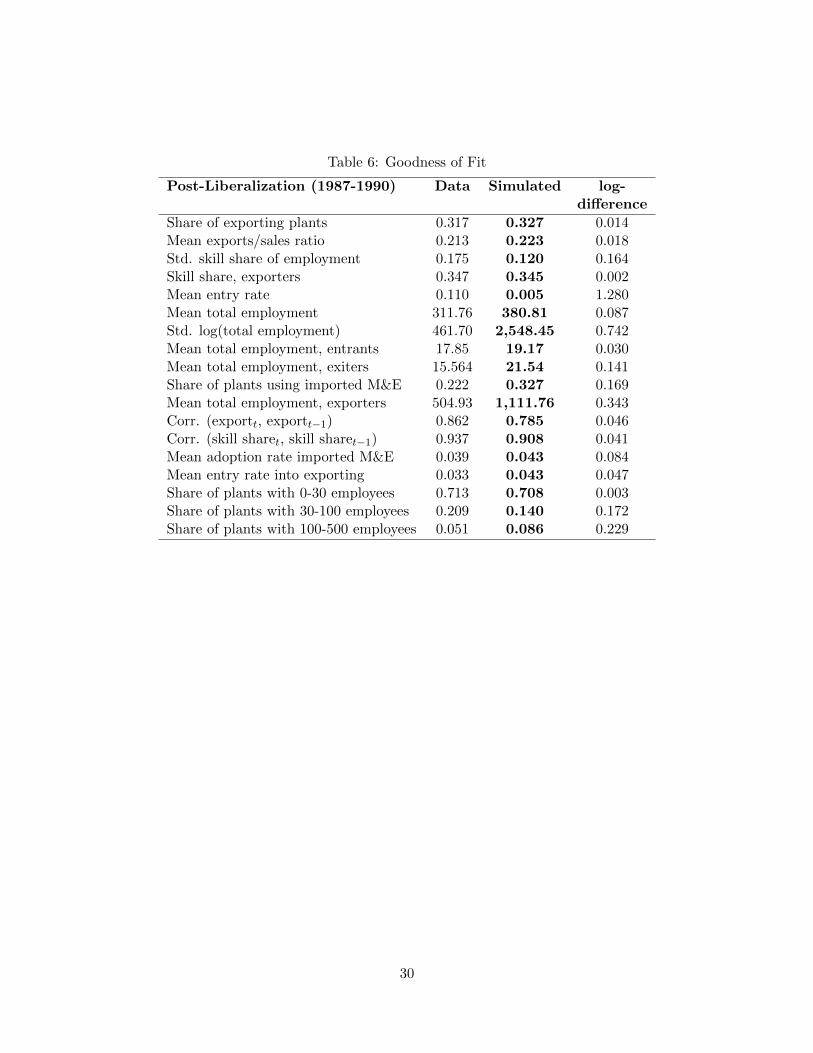
Table 6: Goodness of Fit
Post-Liberalization (1987-1990) Data Simulated log-difference
Share of exporting plants 0.317 0.327 0.014Mean exports/sales ratio 0.213 0.223 0.018Std. skill share of employment 0.175 0.120 0.164Skill share, exporters 0.347 0.345 0.002Mean entry rate 0.110 0.005 1.280Mean total employment 311.76 380.81 0.087Std. log(total employment) 461.70 2,548.45 0.742Mean total employment, entrants 17.85 19.17 0.030Mean total employment, exiters 15.564 21.54 0.141Share of plants using imported M&E 0.222 0.327 0.169Mean total employment, exporters 504.93 1,111.76 0.343Corr. (exportt, exportt−1) 0.862 0.785 0.046Corr. (skill sharet, skill sharet−1) 0.937 0.908 0.041Mean adoption rate imported M&E 0.039 0.043 0.084Mean entry rate into exporting 0.033 0.043 0.047Share of plants with 0-30 employees 0.713 0.708 0.003Share of plants with 30-100 employees 0.209 0.140 0.172Share of plants with 100-500 employees 0.051 0.086 0.229
30
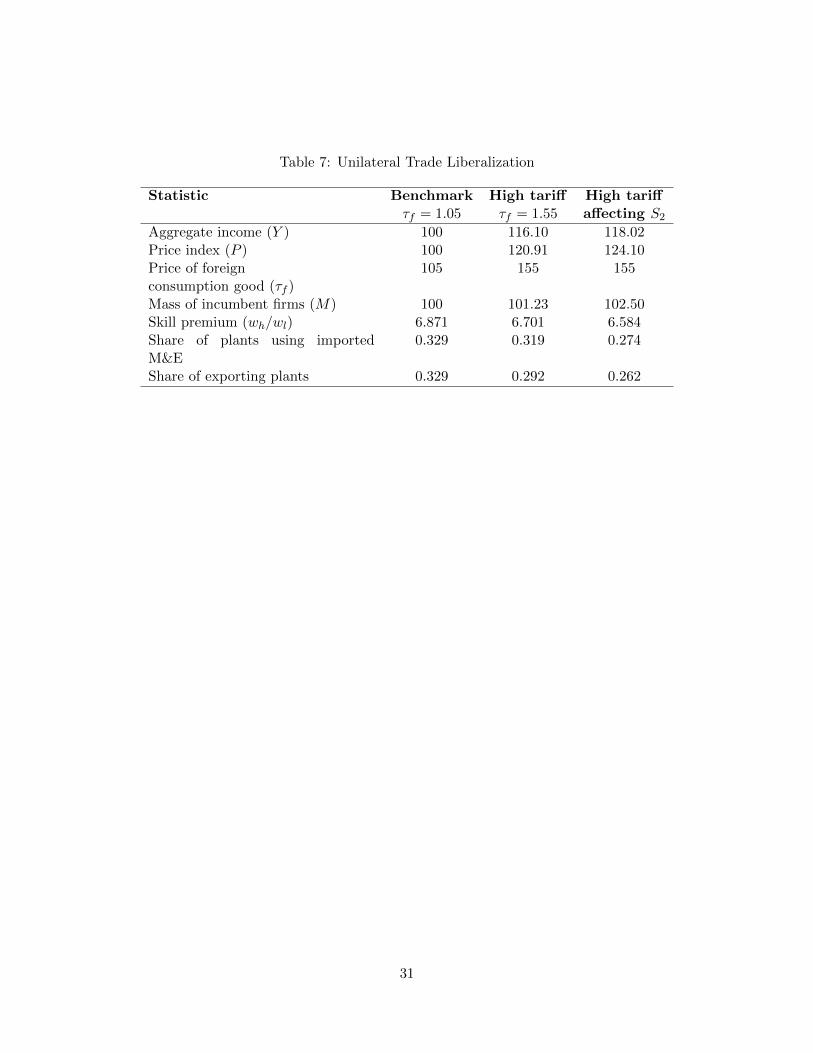
Table 7: Unilateral Trade Liberalization
Statistic Benchmark High tariff High tariff�f = 1.05 �f = 1.55 affecting S2
Aggregate income (Y ) 100 116.10 118.02Price index (P ) 100 120.91 124.10Price of foreign 105 155 155consumption good (�f )Mass of incumbent firms (M) 100 101.23 102.50Skill premium (wℎ/wl) 6.871 6.701 6.584Share of plants using importedM&E
0.329 0.319 0.274
Share of exporting plants 0.329 0.292 0.262
31
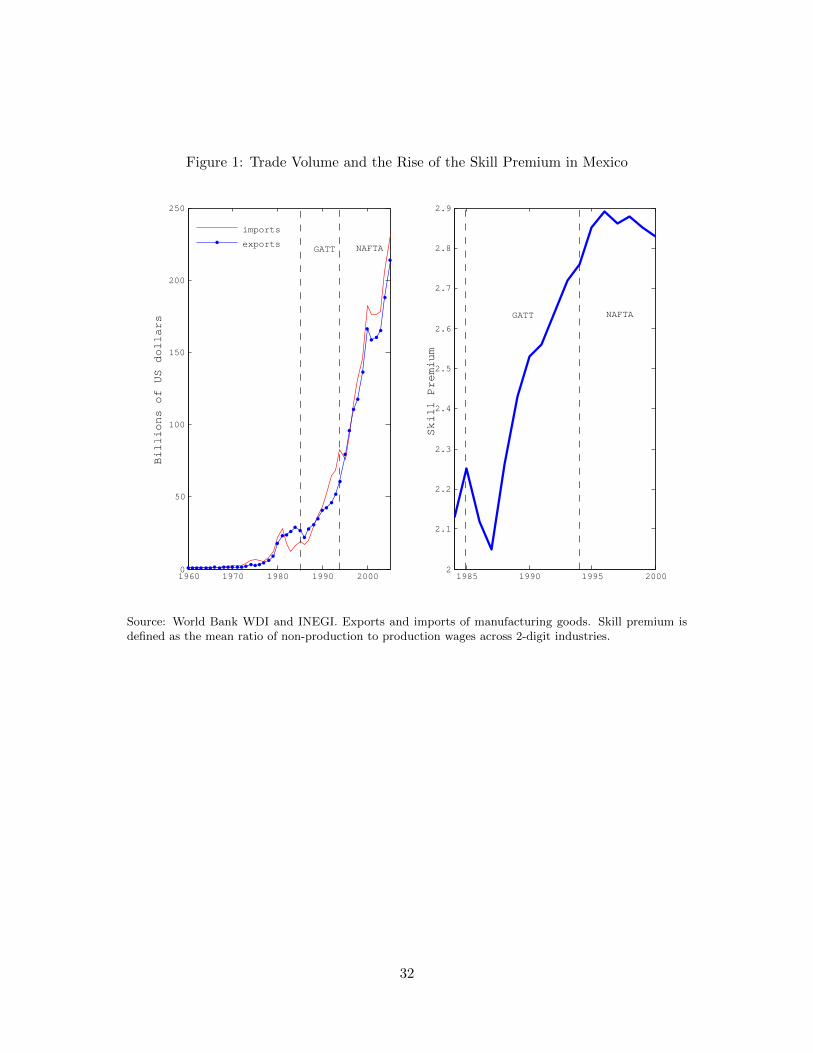
Figure 1: Trade Volume and the Rise of the Skill Premium in Mexico
1960 1970 1980 1990 20000
50
100
150
200
250
Billions of US dollars
1985 1990 1995 20002
2.1
2.2
2.3
2.4
2.5
2.6
2.7
2.8
2.9
Skill Premium
imports
exportsGATT NAFTA
NAFTAGATT
Source: World Bank WDI and INEGI. Exports and imports of manufacturing goods. Skill premium isdefined as the mean ratio of non-production to production wages across 2-digit industries.
32
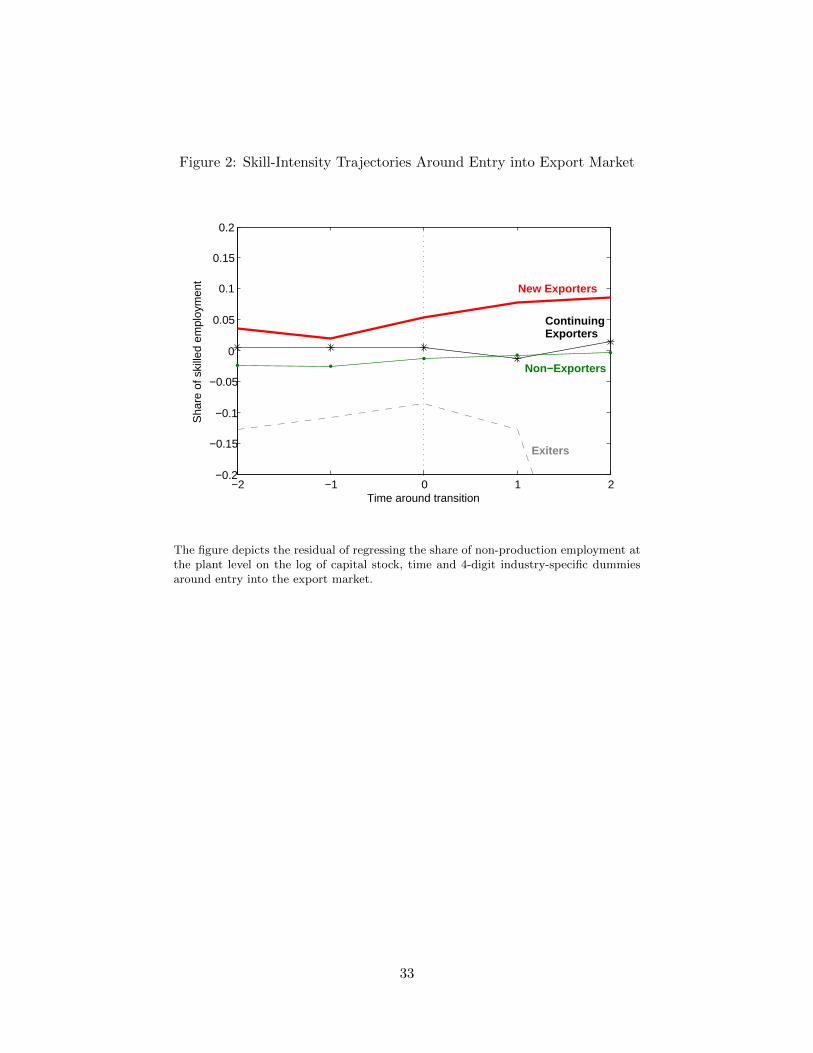
Figure 2: Skill-Intensity Trajectories Around Entry into Export Market
−2 −1 0 1 2−0.2
−0.15
−0.1
−0.05
0
0.05
0.1
0.15
0.2
Time around transition
Sha
re o
f ski
lled
empl
oym
ent
New Exporters
Exiters
ContinuingExporters
Non−Exporters
The figure depicts the residual of regressing the share of non-production employment atthe plant level on the log of capital stock, time and 4-digit industry-specific dummiesaround entry into the export market.
33

Figure 3: Size Distribution after Trade Liberalization
1 2 3 4 5 6 70
0.2
0.4
0.6
0.8
1
1.2
1.4
log(employment)
dens
ity
τf = 1.55
τf = 1.05
34