Trade similarity across the Mediterranean Basin
55
Trade similarity across the Mediterranean Basin Bridging the gap: the role of trade and FDI in the Mediterranean Naples, 9 June 2006 Luca De Benedictis and Lucia Tajoli Politecnico di Milano Università di Macerata
-
Upload
oliver-livingston -
Category
Documents
-
view
38 -
download
0
description
Trade similarity across the Mediterranean Basin. Luca De Benedictis and Lucia Tajoli. Università di Macerata. Politecnico di Milano. Bridging the gap: the role of trade and FDI in the Mediterranean Naples, 9 June 2006. General Issues - PowerPoint PPT Presentation
Transcript of Trade similarity across the Mediterranean Basin

Trade similarity across the Mediterranean Basin
Bridging the gap: the role of trade and FDI in the Mediterranean
Naples, 9 June 2006
Luca De Benedictis and Lucia Tajoli
Politecnico di MilanoUniversità di Macerata

Research questions
General IssuesGeneral Issues
Is economic integrationeconomic integration affecting trade structures making countries more similar or more diversified in terms of production and trade patters?
Which are the implications of a given specialization?Is the trade structure trade structure relevant? theory vs. empiricsstatic vs. dynamic
Which is the role of export compositionrole of export composition in determining income convergence within a group of countries (catching-up)?
Luca De Benedictis:
Trade and other openness indicators often positively associated to growth, but criticisms on criticisms on the the robustness of robustness of the evidencethe evidence, on the indicators used, and on the lack of a clear underlying mechanism linking the two variables.
Luca De Benedictis:
Trade and other openness indicators often positively associated to growth, but criticisms on criticisms on the the robustness of robustness of the evidencethe evidence, on the indicators used, and on the lack of a clear underlying mechanism linking the two variables.

Research questions
Does it make a difference to change the export pattern?
Does it matter to become more or less similar to a given country or group of countries?
Does it matter in which way (in terms of forms of integration and in terms of sectoral composition) a country is open (and not only how much it is open)?

Relatively high GDP growth rates for the MED
countries, but little or no catching-up in terms of GDP
per capita
Many political and institutional problems Many political and institutional problems
hampering growth and integrationhampering growth and integration
Difficulties in running acceptable growth
regressions for these countries
Relevance of these issues for the Mediterranean countries
Are trade and export composition related to these
problems ? Can an export-led growth model be
achieved?

• Aim of this work:Aim of this work:
-verify if export structures in the process of economic integration with the EU has become more similar to the EU export structure
- verify if the change in the export structure is associated with other forms (non-traditional trade) of economic integration
- verify if export structures capture characteristics of the development process
Research questions

A group of countries with very strong ties with the EU
Initial agreements very early, in the late 1978
EU is the main trade partner for the MED group, but EU is the main trade partner for the MED group, but
not for allnot for all
Barcellona Agreement Barcellona Agreement as a compensation for the as a compensation for the
trade diversion?trade diversion?
Growth of Med economic integration with the EU -
and growth of their trade in general - somehow
disappointing
The EU - Med partnership
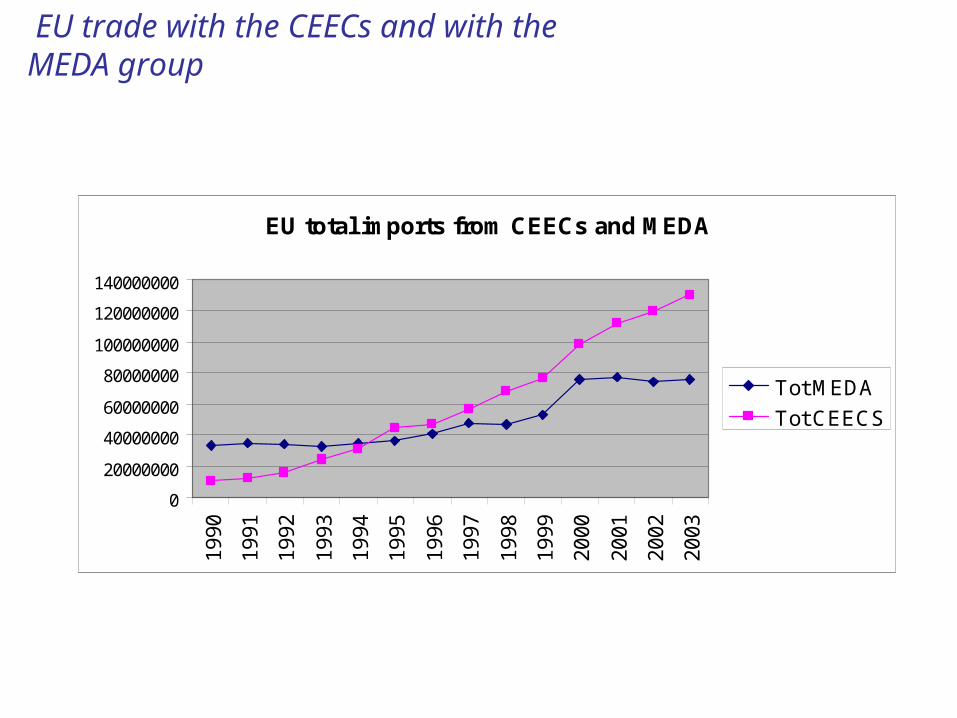
EU trade with the CEECs and with the MEDA group
EU total imports from CEECs and MEDA
0
20000000
40000000
60000000
80000000
100000000
120000000
140000000
1990
1991
1992
1993
1994
1995
1996
1997
1998
1999
2000
2001
2002
2003
Tot MEDA
Tot CEECS

Algeria
Egypt
Israel
JordanLebanon
Morocco
Tunisia
Palestinean Terr. Syria
Turkey
Export Share to EU - 1990

Algeria
EgyptIsrael
JordanLebanon
Morocco
Tunisia
Palestinean Terr.
Syria
Turkey
Export Share to EU - 2003

Data and sources for this empirical analysis
Countries: Algeria, Egypt, Israel, Jordan, Lebanon, Morocco, Palestinian territories, Syria, Tunisia, Turkey
Benchmark: EU15
Trade data: exports toward the EU market in 97 sectors from Comext, Eurostat database
Time period: 1990-2003

Three groups of countries in this sample:
Mono-export (fuel) countries: Algeria and SyriaMono-export (fuel) countries: Algeria and Syria
Diversified but not changingDiversified but not changing
Characteristics of the export composition of the MED
Diversified and changingDiversified and changing

Algeria 1990
Gini = 0.983
exp
ort
sh
are
02
04
06
08
0
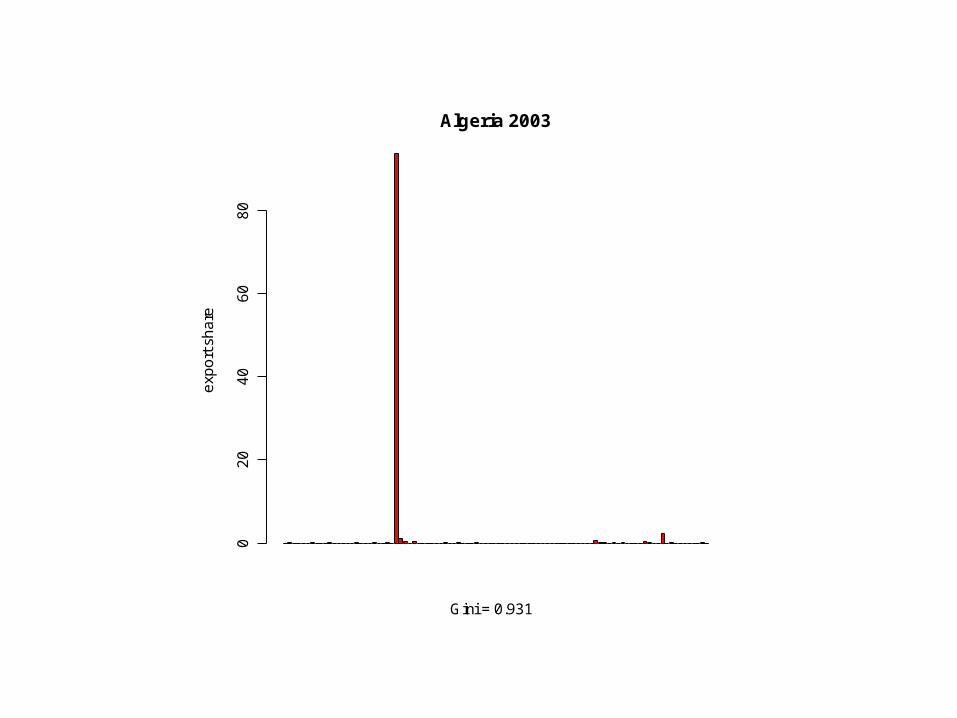
Algeria 2003
Gini = 0.931
exp
ort
sh
are
02
04
06
08
0

Egypt 1990
Gini = 0.858
exp
ort
sh
are
01
02
03
04
05
06
0

Egypt 2003
Gini = 0.775
exp
ort
sh
are
01
02
03
0

Israel 1990
Gini = 0.801
exp
ort
sh
are
02
46
81
01
2

Israel 2003
Gini = 0.897
exp
ort
sh
are
05
10
15
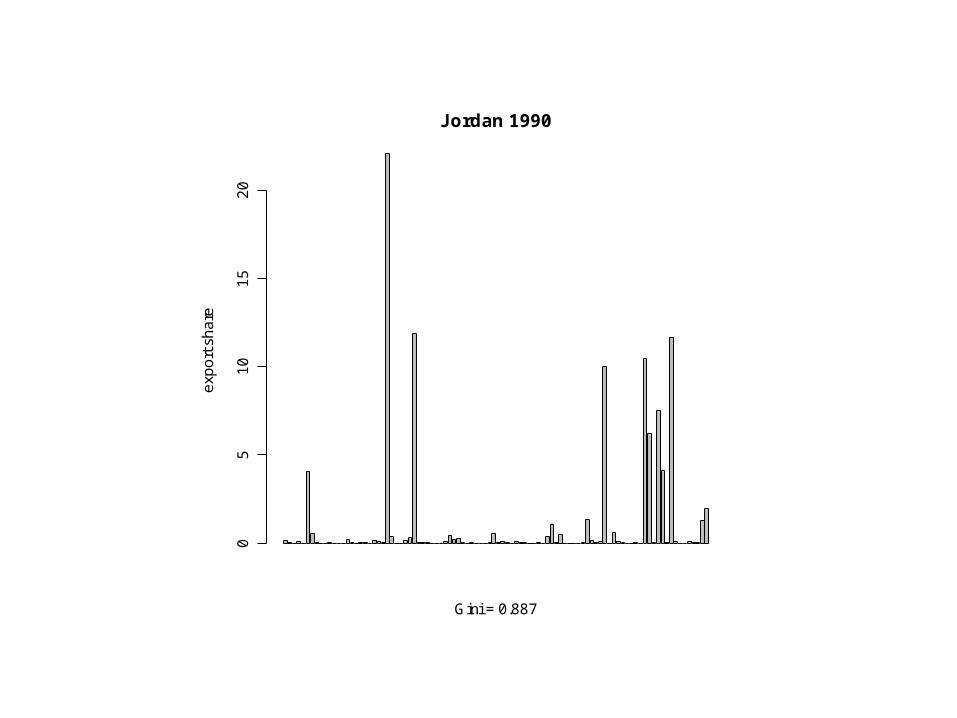
Jordan 1990
Gini = 0.887
exp
ort
sh
are
05
10
15
20

Jordan 2003
Gini = 0.802
exp
ort
sh
are
05
10
15
20
25

Lebanon 1990
Gini = 0.786
exp
ort
sh
are
02
46
81
0

Lebanon 2003
Gini = 0.855
exp
ort
sh
are
02
46
81
01
2

Morocco 1990
Gini = 0.860
exp
ort
sh
are
05
10
15
20
25

Morocco 2003
Gini = 0.860
exp
ort
sh
are
05
10
15
20
25

Tunisia 1990
Gini = 0.898
exp
ort
sh
are
01
02
03
0

Tunisia 2003
Gini = 0.882
exp
ort
sh
are
05
10
15
20
25
30

Palestinian Territories 1990
Gini = 0.989
exp
ort
sh
are
02
04
06
08
01
00

Palestinian Territories 2003
Gini = 0.955
exp
ort
sh
are
05
10
15
20
25
30

Syria 1990
Gini = 0.980
exp
ort
sh
are
02
04
06
08
0

Syria 2003
Gini = 0.972
exp
ort
sh
are
02
04
06
08
0

Turkey 1990
Gini = 0.814
exp
ort
sh
are
05
10
15

Turkey 2003
Gini = 0.815
exp
ort
sh
are
05
10
15

EU 1990
Gini = 0.675
exp
ort
sh
are
02
46
81
01
2

EU 2003
Gini = 0.718
exp
ort
sh
are
02
46
81
01
21
4

Measuring export structure and similarity
Export structure: the vector of shares of each sector on
total exports, x1j, ……xnj.
Self-similarity: taking a base year, we observe how a
country export structure changed in time. The change is
measured by the variation of the correlation or distance
indices.
EU-Similarity: we compare a country’s export structure with the one of the EU, using different indices.
We compare country’s export structure to the EU benchmark over time to observe whether differences narrow or widen.

ProductivityProductivitySelection (Melitz, 2003)Knowledge spillovers (Keller, 2002)Factor composition (Slaughter, 1997; Ventura, 1997)=> proxy used: high-tech intensity
InvestmentsInvestmentsFDIOutward Processing Trade => proxy used: FDI + OPT
Adaptation to international demandAdaptation to international demandThe Linder hypothesis (Linder, 1961; Markusen, 1986)=> proxy used: growth in demand
StabilityStabilityInternational risk sharing (Acemoglu and Zilibotti, 1997)Optimal currency area arguments=> proxy used: efficiency of financial system and institutions
Why similarity in trade structure should matter? Some possible channels:

Methodological points
SimilaritySimilarity => (1 – Distance)
Distance: Bray-Curtis index
Measuring similaritysimilarity in trade structures through a synthetic metric based on distance (De Benedictis-Tajoli, 2004)
Measuring similarity in trade structures both with respect to itself at the beginning of the period (SELF-SIMILARITYSELF-SIMILARITY), and with respect to the EU15 (EU-SIMILARITYEU-SIMILARITY)
countries
Export sectoral sharessectors
j = countryk = benchmarkx = sectoral export sharei = sector
Strong similarity 1Weak similarity 0
Similarity in Trade StructuresSimilarity in Trade Structures

Methodological points
Advantages of such a similaritysimilarity index with respect to other alternatives:
- no need of a normal distribution of observations, it is is appropriate in presence of skewed distributions (unlike correlation)
- change of weight of sectors is taken into account (not based on pure ranking) =>it capture changes due to specific sectors
- this particular index is immune from the double-zero paradox, it has the advantage of not increasing in the number of sectors considered, n; of being invariant to proportional sub-classifications of the n sectors considered; of considering both large and small differences

0.0 0.2 0.4 0.6 0.8 1.0
0.0
0.2
0.4
0.6
0.8
1.0
MEDA EU-Similarity (Bray-Curtis)
ME
DA
Se
lf-s
imila
rity
(B
ray-C
urt
is)
AlgeriaEgyptIsraelJordaniaLebanonMoroccoTunisiaPalestinian territoriesSyriaTurkey

A comparison with another group: The EU- and SELF- similarity Plot for the CEECs

How can economic integration influence the observed changes?
On the supply side: through FDI and other forms of delocalization of production, production sharing agreements between the EU and the MEDA can affect the share of exports in important sectors
Previous result for the CEECs confirm the relevance of these effects: changes in the export structure of all CEECs is driven by changes in a few sectors highly involved in processing trade, and growth in EU demand also plays a role. But for the CEECs international fragmentation of production can foster both convergence and divergence of trade structures
On the demand side: opening of the EU market can influence the export structure of the MEDA to accomodate the European demand
Are these effects at work for the Mediterranean Are these effects at work for the Mediterranean countries? Has integration gone far enough to countries? Has integration gone far enough to produce them?produce them?

0 20 40 60 80 100
0.0
00
.05
0.1
00
.15
Algeria - Opt in 2003
sectors
sect
ora
l sh
are
of o
pt
Wood
Autovehicles

0 20 40 60 80 100
0.0
00
.01
0.0
20
.03
0.0
40
.05
0.0
6
Egypt - Opt in 2003
sectors
sect
ora
l sh
are
of o
pt
Apparel
Autovehicles

0 20 40 60 80 100
0.0
00
.05
0.1
00
.15
0.2
0
Israel - Opt in 2003
sectors
sect
ora
l sh
are
of o
pt
Aircraft
Clocks

0 20 40 60 80 100
0.0
00
.05
0.1
00
.15
Jordan - Opt in 2003
sectors
sect
ora
l sh
are
of o
pt
Cutlery and tools

0 20 40 60 80 100
0.0
00
.05
0.1
00
.15
0.2
00
.25
Lebanon - Opt in 2003
sectors
sect
ora
l sh
are
of o
pt
Photog. Products

0 20 40 60 80 100
0.0
0.2
0.4
0.6
0.8
1.0
Morocco - Opt in 2003
sectors
sect
ora
l sh
are
of o
pt
Other animal prods.
Cereal preparations
Hats
Clocks

0 20 40 60 80 100
0.0
0.2
0.4
0.6
0.8
Tunisia - Opt in 2003
sectors
sect
ora
l sh
are
of o
pt
Sugar
Photog. Products
CementJewellery

0 20 40 60 80 100
0.0
0.1
0.2
0.3
0.4
0.5
0.6
Syria - Opt in 2003
sectors
sect
ora
l sh
are
of o
pt
Jewellery
Art pieces

0 20 40 60 80 100
0.0
00
.05
0.1
00
.15
0.2
00
.25
0.3
0
Turkey - Opt in 2003
sectors
sect
ora
l sh
are
of o
pt
Pharmaceut. Jewellery
Art pieces

Exports toward the EU market: total and OPT tradeCorrelation for Tunisia: 0.95
Tunisia composition of OPT and total exports
0
10
20
30
40
50
60
1 5 9 13 17 21 25 29 33 37 41 45 49 53 57 61 65 69 73 77 81 85 89 93 97
CN sectors
%
OPT
Total exports

Exports toward the EU market: total and OPT tradeCorrelation for Israel: 0.39
Israel: composition of total and OPT trade
0
5
10
15
20
25
30
35
40
1 5 9 13 17 21 25 29 33 37 41 45 49 53 57 61 65 69 73 77 81 85 89 93 97
CN sectors
%
OPT
Total export

Exports toward the EU market: total and OPT tradeCorrelation for Turkey: 0.40
Turkey composition of OPT and total trade
0
5
10
15
20
25
30
35
1 5 9 13 17 21 25 29 33 37 41 45 49 53 57 61 65 69 73 77 81 85 89 93 97
CN sectors
%
OPT
Total exports

Export structure correlated to export volumesExport structure correlated to export volumes
Changes in export composition correlated with Changes in export composition correlated with
increase in EU similarityincrease in EU similarity
Changes in export composition correlated with Changes in export composition correlated with
inward FDIinward FDI
Some regression results
Changes in export composition correlated with OPTChanges in export composition correlated with OPT

Similarity in export composition and trade
Dependent Variable: TOTEXPEU?Method: Pooled Least SquaresDate: 05/22/06 Time: 15:42Sample: 1990 2003Included observations: 14Number of cross-sections used: 8Total panel (balanced) observations: 112Cross sections without valid observations dropped
Variable CoefficientStd. Error t-Statistic Prob.
EUSIM? 32261372 5333587 6.048719 0SELFSIM? -6626375 1890934 -3.50429 0.0007Fixed EffectsALG--C 13089913EGY--C -401063ISR--C -6014709LEB--C -7187733MOR--C -2184132SYR--C 5554367JOR--C -7857860TUR--C 4284490
R-squared 0.795012 Mean dependent var4711510Adjusted R-squared0.776925 S.D. dependent var 4.98E+06S.E. of regression2350038 Sum squared resid 5.63E+14Log likelihood -1796.72 F-statistic 395.5902

Similarity in export composition and trade
Dependent Variable: TOTEXPEU?Method: Pooled Least SquaresDate: 06/08/06 Time: 19:38Sample: 1990 2003Included observations: 14Number of cross-sections used: 9Total panel (unbalanced) observations: 115
Variable CoefficientStd. Error t-Statistic Prob.
GDP? 107.9112 11.94513 9.033907 0EUSIM? 13369352 5118070 2.612186 0.0103Fixed EffectsEGY--C -8310466ISR--C -9957794LEB--C -6248052MOR--C -2268398TUN--C -1709597TUR--C -1E+07ALG--C 3113890SYR--C -471313JOR--C -5363180
R-squared 0.867569 Mean dependent var5013036Adjusted R-squared0.854836 S.D. dependent var 4.76E+06S.E. of regression 1813994 Sum squared resid 3.42E+14Log likelihood -1814.67 F-statistic 681.3174