Trade Off Among Conflicting Multi Objectives of CNC End ...=.pdfCNC Vertical Milling Machine End...
8
International Journal of Science and Research (IJSR) ISSN (Online): 2319-7064 Impact Factor (2012): 3.358 Volume 3 Issue 9, September 2014 www.ijsr.net Licensed Under Creative Commons Attribution CC BY Trade Off Among Conflicting Multi Objectives of CNC End Milling Process for LM6 Al/SiC p Neeraj Kumar 1 , K. K. Chhabra 2 1 P.hd Student (Mechanical), Faculty of Engineering, Pacific Academy of Higher Education and Research University, Udaipur 2 Professor, Faculty of Engineering, Pacific Academy of Higher Education and Research University, Udaipur Abstract: This research work focuses on trade off among conflicting multi objectives of CNC End Milling process for metal matrix composite (MMC s ). Experiments were designed and conducted based on L 27 orthogonal array. The controllable parameters for end milling are weight percentage of SiC P in the metal matrix, cutting speed, depth of cut, feed & cutter diameter. The study provided to minimizing surface roughness (R a ) and maximizing material removal rate (MRR) occurring during end milling process for composite material LM6 AL/SiC p . A statistical approach “Grey-Taguchi Method” is used for combining the orthogonal array (OA), design of experiments (DOE) with grey-relational analysis (GRA), which enables to optimizing multiple objectives problem of CNC end milling. The results show that semi finishing process of milling is best among 27 experiments. Regression modelling validate grey-taguchi methodology by obtaining best value of grey relational grade. Keywords: CNC End Milling, Composite material, Taguchi method, Grey relational analysis. 1. Introduction with Literature Review Quality and productivity are the challenging two main objectives for growth of manufacturing industries. It can be seen that these two are conflicting to each other, thus quality increases then productivity tends to decrease, or vice-versa. But manufacturing industries require optimizing both quality and productivity simultaneously. The product being machined has to have the minimum surface roughness in order to obtain high surface quality processing time has to be compromised which directly affects the productivity [1]. The quality of the product mainly depends upon the material and process parameters [2]. Among various types of milling processes, as shown in Figure-1, end milling is the most important and common metal cutting process used for machining parts because of its capability to producing complex geometric surfaces at faster rate with reasonable accuracy and surface finish [3]. Figure-1: End Milling Operation [4] Also, it is capable of producing a variety of configurations including aerospace and automotive sectors, where surface quality is an important response factor in the production of slots, pockets, precision moulds and dies [4]. Computer numerically controlled (CNC) machine tools provide greater improvements in productivity, and enhance the surface quality of the machined parts and require less operator input. For these reasons, CNC end milling process is very versatile and useful machining operation in most of the modern manufacturing industries [6]. Composites are one of the most widely used materials in engineering due to their outstanding mechanical properties. aluminum matrix composite (AMCs) have become a large leading material in composite materials because of their superior properties such as lightweight, high strength, hardness, stiffness, and greater wear resistance [7]. In recent times, aluminum matrix composites (AMCs) refer to the class of lightweight high-performance aluminum centric material systems which is highly sought after in the automotive and aircraft industry [8]. These materials are known as the difficult-to-machine materials, because of the hardness and abrasive nature of reinforcement element like silicon carbide (SiC) particles [9]. In the view of extensive using composites in manufacturing industries, a detailed and systematic study is required for investigate their machining characteristics. In this present study, composite LM6 Al/SiC p with different percentage 5%, 10% and 15% of weight of SiC p were fabricated by stir casting technique and machined on CNC end milling. The experiment designs were determined by using Taguchi’s experimental design method. Grey relational analysis was applied to obtain the optimum values of the control parameters among 27 experiments for formation of straight rectangular slots of 100 mm length. The control parameters such as weight percentage of SiC p , cutting speed, feed, depth of cut and cutter diameter of end mill cutting tool were optimized with the considerations of conflicting Paper ID: SEP1463 138
Transcript of Trade Off Among Conflicting Multi Objectives of CNC End ...=.pdfCNC Vertical Milling Machine End...
International Journal of Science and Research (IJSR) ISSN (Online): 2319-7064
Impact Factor (2012): 3.358
Volume 3 Issue 9, September 2014 www.ijsr.net
Licensed Under Creative Commons Attribution CC BY
Trade Off Among Conflicting Multi Objectives of CNC End Milling Process for LM6 Al/SiCp
Neeraj Kumar1, K. K. Chhabra2
1P.hd Student (Mechanical), Faculty of Engineering,
Pacific Academy of Higher Education and Research University, Udaipur
2Professor, Faculty of Engineering, Pacific Academy of Higher Education and Research University, Udaipur
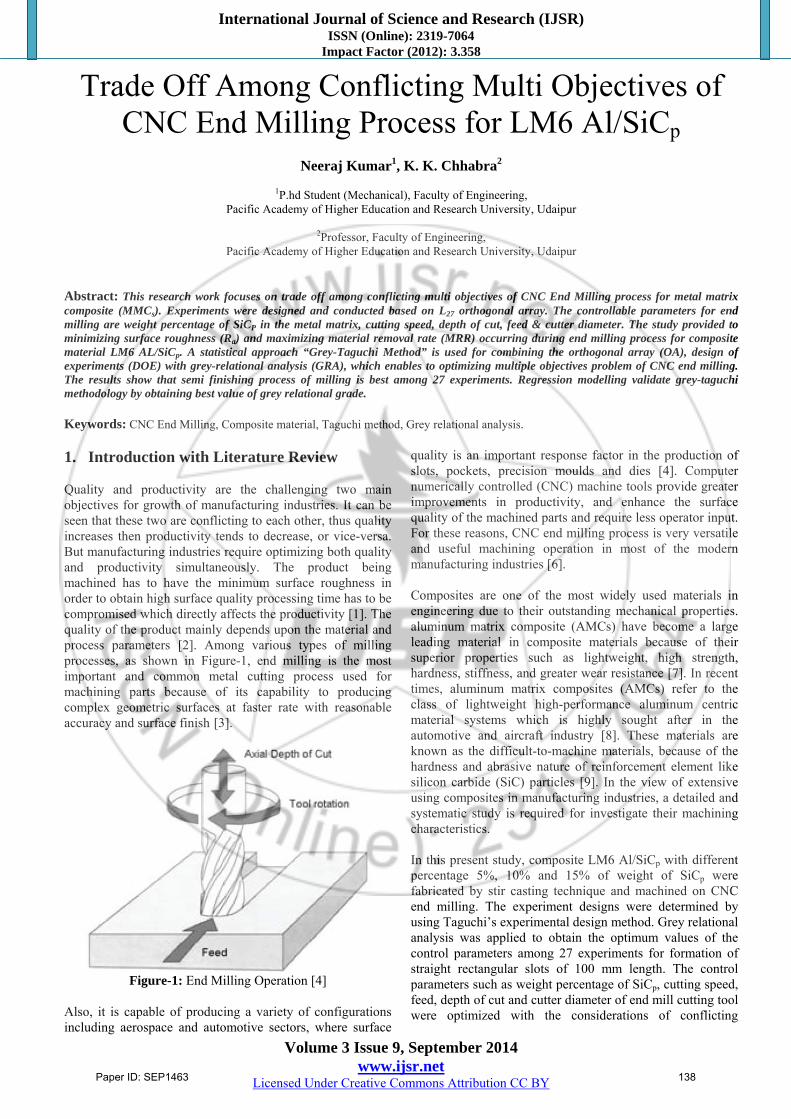
Abstract: This research work focuses on trade off among conflicting multi objectives of CNC End Milling process for metal matrix composite (MMCs). Experiments were designed and conducted based on L27 orthogonal array. The controllable parameters for end milling are weight percentage of SiCP in the metal matrix, cutting speed, depth of cut, feed & cutter diameter. The study provided to minimizing surface roughness (Ra) and maximizing material removal rate (MRR) occurring during end milling process for composite material LM6 AL/SiCp. A statistical approach “Grey-Taguchi Method” is used for combining the orthogonal array (OA), design of experiments (DOE) with grey-relational analysis (GRA), which enables to optimizing multiple objectives problem of CNC end milling. The results show that semi finishing process of milling is best among 27 experiments. Regression modelling validate grey-taguchi methodology by obtaining best value of grey relational grade. Keywords: CNC End Milling, Composite material, Taguchi method, Grey relational analysis. 1. Introduction with Literature Review Quality and productivity are the challenging two main objectives for growth of manufacturing industries. It can be seen that these two are conflicting to each other, thus quality increases then productivity tends to decrease, or vice-versa. But manufacturing industries require optimizing both quality and productivity simultaneously. The product being machined has to have the minimum surface roughness in order to obtain high surface quality processing time has to be compromised which directly affects the productivity [1]. The quality of the product mainly depends upon the material and process parameters [2]. Among various types of milling processes, as shown in Figure-1, end milling is the most important and common metal cutting process used for machining parts because of its capability to producing complex geometric surfaces at faster rate with reasonable accuracy and surface finish [3].
Figure-1: End Milling Operation [4]
Also, it is capable of producing a variety of configurations including aerospace and automotive sectors, where surface
quality is an important response factor in the production of slots, pockets, precision moulds and dies [4]. Computer numerically controlled (CNC) machine tools provide greater improvements in productivity, and enhance the surface quality of the machined parts and require less operator input. For these reasons, CNC end milling process is very versatile and useful machining operation in most of the modern manufacturing industries [6]. Composites are one of the most widely used materials in engineering due to their outstanding mechanical properties. aluminum matrix composite (AMCs) have become a large leading material in composite materials because of their superior properties such as lightweight, high strength, hardness, stiffness, and greater wear resistance [7]. In recent times, aluminum matrix composites (AMCs) refer to the class of lightweight high-performance aluminum centric material systems which is highly sought after in the automotive and aircraft industry [8]. These materials are known as the difficult-to-machine materials, because of the hardness and abrasive nature of reinforcement element like silicon carbide (SiC) particles [9]. In the view of extensive using composites in manufacturing industries, a detailed and systematic study is required for investigate their machining characteristics. In this present study, composite LM6 Al/SiCp with different percentage 5%, 10% and 15% of weight of SiCp were fabricated by stir casting technique and machined on CNC end milling. The experiment designs were determined by using Taguchi’s experimental design method. Grey relational analysis was applied to obtain the optimum values of the control parameters among 27 experiments for formation of straight rectangular slots of 100 mm length. The control parameters such as weight percentage of SiCp, cutting speed, feed, depth of cut and cutter diameter of end mill cutting tool were optimized with the considerations of conflicting
Paper ID: SEP1463 138

International Journal of Science and Research (IJSR) ISSN (Online): 2319-7064
Impact Factor (2012): 3.358
Volume 3 Issue 9, September 2014 www.ijsr.net
Licensed Under Creative Commons Attribution CC BY
multiple objectives such as material removal rate and surface roughness value on the work material. This study may be helpful to the manufacturers for getting good surface quality with high productivity. 2. Composite Materials and Fabrication
Method The fabrications of metal matrix composites LM6 Al/SiCp with different percentage of weight SiCp were carried out by stir casting technique. The composition of LM6 is tabulated in Table 1.
Table 1: Chemical composition (LM6)
Elements Al Si Cu Mn Mg Fe Zn Cr
%age 87.33 10.41 0.14 0.35 0.28 0.98 0.38 0.02
Elements Ni Ti Ca Pb V P As
%age 0.01 0.02 0.01 0.01 0.01 0.001 0.008 A measured amount of LM6 aluminium base alloy ingots were taken into a graphite crucible and melted in an electrical furnace. A measured amount (5%, 10%, and 15%) of laboratory tested moisture free ‘silicon carbide particles’ with mesh 200 µm were added to the melt. After that, the melt was stirred at an average mixing speed of 400 rpm to make a vortex in order to disperse the particles in the melt. After through stirring the melt was poured into sand moulds and result out in the form of as shown in Figure 2, three workpiece samples of 100 mm different amount of SiC (5%, 10%, and 15%) with dimension length, 100 mm width and 10 mm thickness.
Figure 2: Casted composite materials after stir casting
3. Experimental Set Up The following equipment’s were used in this experimental works: CNC Vertical Milling Machine End Milling Cutters Surface Roughness Tester Digital Vernier Caliper 3.1 CNC Vertical Milling Machine As shown in Figure 3, CNC vertical machining center (Jyoti VMC 430) was used to perform the end milling. It is installed in AVTS Hi-Tech Training Centre, Tarsali, Vadodara.
Figure 3: Experimental set up for end milling operation
3.2 End Mill Cutters The tool used for performing end milling operation are made up of coated solid carbide tool of different diameters (6 mm, 8 mm and 10 mm diameter) as shown in Figure 4. Tools with four flutes are selected for better surface quality.
Figure 4: Solid carbide end mill with different diameters
3.3 Surface Roughness Tester The machining length was of 100mm. After performing the machining process, the machined surface was checked at three position by using a surface roughness tester as shown in Figure 5 (Make: HOMMEL surf test at MS university, vadodara) and it given average surface roughness (Ra) measurement value that was recorded in micron meter.
Figure 5: Set up for HOMMEL surface roughness tester
Paper ID: SEP1463 139

International Journal of Science and Research (IJSR) ISSN (Online): 2319-7064
Impact Factor (2012): 3.358
Volume 3 Issue 9, September 2014 www.ijsr.net
Licensed Under Creative Commons Attribution CC BY
3.4 Digital Vernier Caliper As Shown in Figure 6, digital vernier Caliper of resolution 0.01 was used to measure the dimension (Length × Width × Depth) of the machined straight rectangular slots on work pieces after the machining process.
Figure-6: Digital Vernier Caliper
4. Response Objectives Parameters There are two response objective parameters include: Surface Roughness (Ra) Material Removal Rate (MRR) 4.1 Surface Roughness Roughness is often a good predictor of the performance of a mechanical component, since irregularities in the surface may form nucleation sites for cracks or corrosion [10]. Roughness is quantified by the vertical deviations of a real surface from its mean line. If these deviations are large, the surface is rough; if small, the surface is smooth [11]. There are various roughness parameters such as average roughness (Ra), smoothening depth (Rp), root mean square (Rq), and maximum peak-to-valley height (Rt). In this work, the average surface roughness (Ra), was adopted and measurements were carried at three different positions of the machined surface using a HOMMEL Surftest. It measured average surface roughness by comparing all the peaks and valleys to the mean line, and then averaging them all over the entire cut-off length. 4.2 Metal Removal Rate (MRR) In this research work, material removal rate (MRR) is used as another performance measure to evaluate a machining performance. Material removal rate is expressed as the amount of material removed under a period of machining time and is expressed in mm3/min.
MRR in mm3/min =
Where L is the machining length, D is the depth of cut and W is the width of cut, and these dimension are measured with digital vernier caliper. In the above MRR relationship, t is the machining time in minute. 5. Grey – Taguchi Method: Proposed
Methodology Grey – Taguchi method is of combining the orthogonal array (OA) design of experiments (DOE) with grey relational analysis (GRA) which enables the determination of the optimal combination of CNC end milling process for
multiple objectives response [12]. The use of Taguchi method with grey relational analysis to optimize the end milling process with multiple performance characteristics includes the following procedure as shown in Figure 7.
Figure 7: Taguchi- Grey Relational Analysis
5.1 Design of Experiment
The design of experiments technique is a very powerful tool, which allows us to carry out the modeling and analysis of the influence of controllable variables on the response variables. The response variable is an unknown function of the controllable variables, which are known as design factors [13]. The Design of experiment includes five controllable milling parameters at three levels are tabulated with their performance characteristics in Table 2. The three level parameters include weight percentage of SiCp (A), cutting speed (B), feed (C), Depth of cut (D) and cutter diameters (E). Orthogonal array L27 with sample size two has been considered to conduct experiments and investigate the interrelationships of parameters within experimental design. The Orthogonal array (OA) has 5 columns and 27 rows. Each end milling parameter was assigned to a column, according to standard methodology of OA [14]. All experiments were carried out on vertical milling machine. The workpiece material used for the purpose was LM6 Al/SiCp as described earlier and the dimensions of the workpiece were 100mm×10mm×10mm. The objective was to obtain optimal levels of the controllable parameter for end milling machining process.
Paper ID: SEP1463 140
International Journal of Science and Research (IJSR) ISSN (Online): 2319-7064
Impact Factor (2012): 3.358
Volume 3 Issue 9, September 2014 www.ijsr.net
Licensed Under Creative Commons Attribution CC BY
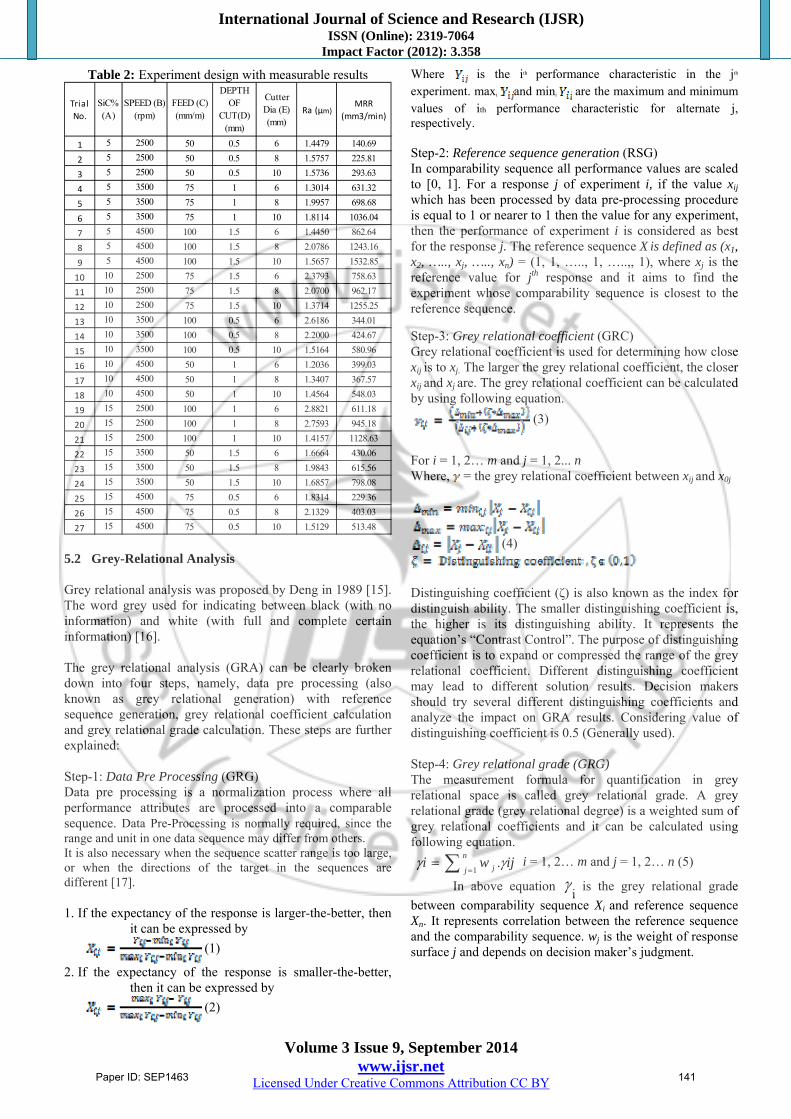
Table 2: Experiment design with measurable results
Trial
No.
SiC% (A)
SPEED (B) (rpm)
FEED (C) (mm/m)
DEPTH OF
CUT(D) (mm)
Cutter Dia (E) (mm)
Ra (µm)MRR
(mm3/min)
1 5 2500 50 0.5 6 1.4479 140.69
2 5 2500 50 0.5 8 1.5757 225.81
3 5 2500 50 0.5 10 1.5736 293.63
4 5 3500 75 1 6 1.3014 631.32
5 5 3500 75 1 8 1.9957 698.68
6 5 3500 75 1 10 1.8114 1036.04
7 5 4500 100 1.5 6 1.4450 862.64
8 5 4500 100 1.5 8 2.0786 1243.16
9 5 4500 100 1.5 10 1.5657 1532.85
10 10 2500 75 1.5 6 2.3793 758.63
11 10 2500 75 1.5 8 2.0700 962.17
12 10 2500 75 1.5 10 1.3714 1255.25
13 10 3500 100 0.5 6 2.6186 344.01
14 10 3500 100 0.5 8 2.2000 424.67
15 10 3500 100 0.5 10 1.5164 580.96
16 10 4500 50 1 6 1.2036 399.03
17 10 4500 50 1 8 1.3407 367.57
18 10 4500 50 1 10 1.4564 548.03
19 15 2500 100 1 6 2.8821 611.18
20 15 2500 100 1 8 2.7593 945.18
21 15 2500 100 1 10 1.4157 1128.63
22 15 3500 50 1.5 6 1.6664 430.06
23 15 3500 50 1.5 8 1.9843 615.56
24 15 3500 50 1.5 10 1.6857 798.08
25 15 4500 75 0.5 6 1.8314 229.36
26 15 4500 75 0.5 8 2.1329 403.03
27 15 4500 75 0.5 10 1.5129 513.48 5.2 Grey-Relational Analysis Grey relational analysis was proposed by Deng in 1989 [15]. The word grey used for indicating between black (with no information) and white (with full and complete certain information) [16]. The grey relational analysis (GRA) can be clearly broken down into four steps, namely, data pre processing (also known as grey relational generation) with reference sequence generation, grey relational coefficient calculation and grey relational grade calculation. These steps are further explained: Step-1: Data Pre Processing (GRG) Data pre processing is a normalization process where all performance attributes are processed into a comparable sequence. Data Pre-Processing is normally required, since the range and unit in one data sequence may differ from others. It is also necessary when the sequence scatter range is too large, or when the directions of the target in the sequences are different [17]. 1. If the expectancy of the response is larger-the-better, then
it can be expressed by
(1)
2. If the expectancy of the response is smaller-the-better, then it can be expressed by
(2)
Where is the ith performance characteristic in the jth
experiment. maxi and mini are the maximum and minimum values of ith performance characteristic for alternate j, respectively. Step-2: Reference sequence generation (RSG) In comparability sequence all performance values are scaled to [0, 1]. For a response j of experiment i, if the value xij which has been processed by data pre-processing procedure is equal to 1 or nearer to 1 then the value for any experiment, then the performance of experiment i is considered as best for the response j. The reference sequence X is defined as (x1, x2, ….., xj, ….., xn) = (1, 1, ….., 1, …..,, 1), where xj is the reference value for jth response and it aims to find the experiment whose comparability sequence is closest to the reference sequence.
Step-3: Grey relational coefficient (GRC) Grey relational coefficient is used for determining how close xij is to xj. The larger the grey relational coefficient, the closer xij and xj are. The grey relational coefficient can be calculated by using following equation.
(3)
For i = 1, 2… m and j = 1, 2... n Where, = the grey relational coefficient between xij and x0j
(4)
Distinguishing coefficient (ζ) is also known as the index for distinguish ability. The smaller distinguishing coefficient is, the higher is its distinguishing ability. It represents the equation’s “Contrast Control”. The purpose of distinguishing coefficient is to expand or compressed the range of the grey relational coefficient. Different distinguishing coefficient may lead to different solution results. Decision makers should try several different distinguishing coefficients and analyze the impact on GRA results. Considering value of distinguishing coefficient is 0.5 (Generally used). Step-4: Grey relational grade (GRG) The measurement formula for quantification in grey relational space is called grey relational grade. A grey relational grade (grey relational degree) is a weighted sum of grey relational coefficients and it can be calculated using following equation.
ijwi
n
j j .1
i = 1, 2… m and j = 1, 2… n (5)
In above equation i is the grey relational grade
between comparability sequence Xi and reference sequence Xn. It represents correlation between the reference sequence and the comparability sequence. wj is the weight of response surface j and depends on decision maker’s judgment.
Paper ID: SEP1463 141

International Journal of Science and Research (IJSR) ISSN (Online): 2319-7064
Impact Factor (2012): 3.358
Volume 3 Issue 9, September 2014 www.ijsr.net
Licensed Under Creative Commons Attribution CC BY
6.Analysis and discussion of Experimental Results
In the present study, Grey relational analysis was used to make a trade off among conflicting multi objectives namely surface roughness and material removal rate by considering two type of machining cut like semi-finishing and finishing with five controllable parameters. The values of the parameter level in 27 experimental runs as per orthogonal array (L27) are set to be the comparability sequences for five controllable parameters as shown in Table 3. Data pre-processing was calculate from Equation 1 & 2 for material removal rate & surface roughness respectively, and the normalized results were tabulated in Table 3. The deviation sequences were calculated using the same method above with the help of Equation (4).
Table 3: Calculated data pre processing and its deviations
Trial No.
Data Pre Processing Deviation
1 0.8544 0.0000 0.1456 1.0000
2 0.7783 0.0611 0.2217 0.9389
3 0.7795 0.1099 0.2205 0.8901
4 0.9417 0.3524 0.0583 0.6476
5 0.5281 0.4008 0.4719 0.5992
6 0.6378 0.6431 0.3622 0.3569
7 0.8561 0.5186 0.1439 0.4814
8 0.4787 0.7919 0.5213 0.2081
9 0.7842 1.0000 0.2158 0.0000
10 0.2995 0.4439 0.7005 0.5561
11 0.4838 0.5901 0.5162 0.4099
12 0.9000 0.8006 0.1000 0.1994
13 0.1570 0.1461 0.8430 0.8539
14 0.4064 0.2040 0.5936 0.7960
15 0.8136 0.3163 0.1864 0.6837
16 1.0000 0.1856 0.0000 0.8144
17 0.9183 0.1630 0.0817 0.8370
18 0.8493 0.2926 0.1507 0.7074
19 0.0000 0.3380 1.0000 0.6620
20 0.0732 0.5779 0.9268 0.4221
21 0.8736 0.7097 0.1264 0.2903
22 0.7242 0.2079 0.2758 0.7921
23 0.5349 0.3411 0.4651 0.6589
24 0.7127 0.4722 0.2873 0.5278
25 0.6259 0.0637 0.3741 0.9363
26 0.4463 0.1884 0.5537 0.8116
27 0.8157 0.2678 0.1843 0.7322
To obtain the grey relational coefficients, the deviation sequences and the distinguishing coefficient were substituted in Equation (3). The grey relational grade can be calculated by using equation (5) which is the overall representative of both the responses which is shown for semi-finishing and finishing machining cut in Table 4.
Table 4: Calculated grey relational grade (GRA) and its Rank in optimization process
TrialNo.
Ra MRR
Semi-Finishing (wRa = 0.5 & wMRR = 0.5)
Finishing (wRa = 0.7 & wMRR = 0.3)
Grade Rank Grade Rank
1 0.7745 0.3333 0.5539 14 0.6422 9
2 0.6928 0.3475 0.5201 17 0.5892 14
3 0.6940 0.3597 0.5268 15 0.5937 12
4 0.8955 0.4357 0.6656 5 0.7576 4
5 0.5144 0.4549 0.4847 19 0.4966 20
6 0.5799 0.5835 0.5817 10 0.5810 15
7 0.7766 0.5095 0.6430 6 0.6964 7
8 0.4896 0.7061 0.5978 8 0.5545 17
9 0.6985 1.0000 0.8493 1 0.7890 3
10 0.4165 0.4734 0.4450 23 0.4336 24
11 0.4920 0.5495 0.5208 16 0.5093 18
12 0.8333 0.7149 0.7741 2 0.7978 2
13 0.3723 0.3693 0.3708 27 0.3714 26
14 0.4572 0.3858 0.4215 25 0.4358 23
15 0.7284 0.4224 0.5754 11 0.6366 10
16 0.9999 0.3804 0.6902 4 0.8141 1
17 0.8595 0.3740 0.6167 7 0.7138 6
18 0.7684 0.4141 0.5913 9 0.6621 8
19 0.3333 0.4303 0.3818 26 0.3624 27
20 0.3504 0.5422 0.4463 22 0.4080 25
21 0.7982 0.6326 0.7154 3 0.7485 5
22 0.6445 0.3870 0.5157 18 0.5672 16
23 0.5181 0.4314 0.4748 20 0.4921 21
24 0.6351 0.4865 0.5608 13 0.5905 13
25 0.5720 0.3481 0.4601 21 0.5049 19
26 0.4745 0.3812 0.4279 24 0.4465 22
27 0.7307 0.4058 0.5682 12 0.6332 11
According to the performed experiment design it is clearly observed from Table 4 that the semi finishing of end milling process having parameters setting of experiment no. 9 has the highest grey relational grade and finishing process experiment no. 16 has highest grey relational grade. In this work, considering trade off among conflicting multi-objectives then experiment no. 9 is given best compromising result because GRA is high for experiment no. 9 in comparison of experiment no. 16, another thing is that experiment no. 9 has good value of surface roughness with high value of material removal rate. Therefore, surface roughness is compromised in increasing value of material removal rate. Thus the experiment 9 gives the best compromising multi performance characteristics among the 27 experiments. Since the Grey relational grades show the level of correlation between the reference and the comparability sequences, the larger Grey relational grade means the comparability sequence exhibiting a stronger correlation with the reference sequence. Based on this study, one can select a combination of the levels that provide the best values for responses. As per concept of Taguchi method, the statistic delta defined as the difference between the high and the low effect of each
Paper ID: SEP1463 142

International Journal of Science and Research (IJSR) ISSN (Online): 2319-7064
Impact Factor (2012): 3.358
Volume 3 Issue 9, September 2014 www.ijsr.net
Licensed Under Creative Commons Attribution CC BY
parameter, was used. A classification can be done to determine the most significant parameter. When so done, the multiple objective optimization problems are transformed into a single equivalent objective function optimization problem. The higher grey relational grade will be close to the optimal condition. Using the grey relational grade value, the mean of the grey relational grade for each level of different parameters, and the total mean of the grey relational grade is summarized in Table 5. Table 5: Response table for the mean Grey relational grade
LevelsSiC% (A)
SPEED (B) (rpm)
FEED (C)
(mm/m)
DEPTH OF
CUT(D)(mm)
Cutter Dia (E) (mm)
1 0.603 0.5427 0.5611 0.4916 0.5251
2 0.5562 0.5168 0.5476 0.5749 0.5012
3 0.5057 0.6049 0.5557 0.5979 0.6381
Delta 0.0969 0.0882 0.0136 0.1063 0.1369
Rank 3 4 5 2 1
Grey Grade Analysis for Control Parameter
(Total mean Grey relational grade = 0.558)
Then a response graph of the grey relational analysis is obtained by main effect analytic computation, as shown in Figure 8.
Figure 8: Response graph for mean grey relational grades
From Table 5 and Figure 8, the optimal parameter combination of A1, B3, C1, D3 and E3 shows the highest value of the Grey relational grade i.e SiC of 5%, cutting speed of 4500 rpm, feed of 50 mm/min, depth of cut of 1.5 mm and cutter diameter of 10 mm. Therefore compromising surface roughness with high value of material removal rate is obtained for the end milling operation 7. Analysis of Variance ANOVA is a statistical technique that is used in determining the level of significance of significant parameters. It separates the total variance of the response into contributions rendered by each of parameters. ANOVA was performed for Grey relational grade value to identify the most significant parameters tabulated in Table 6. It is observed that the cutter diameter (27.21%) is most significant parameter.
Table 6: Results of ANOVA
SiC% 2 0.042271 0.021136 4.56 0.093 11.95
SPEED 2 0.036959 0.01848 3.99 0.112 10.45
FEED 2 0.000842 0.000421 0.09 0.915 0.24
DEPTH 2 0.056251 0.028126 6.07 0.061 15.90
Cutter Dia 2 0.09628 0.04814 10.39 0.026 27.21
SiC% *Cutter Dia 4 0.017388 0.004347 0.94 0.524
4.91
SPEED *Cutter Dia 4 0.02251 0.005627 1.21 0.428
6.36
FEED *Cutter Dia 4 0.062786 0.015696 3.39 0.132
17.75
Error 4 0.018535 0.004634 5.24
Total 26 0.353823 100
Fexp =
MSV/MSVeP-Value
% Contribution
SourceDegree of Freedom
(DF)
Adjusted Sum of Squares
Mean Square Value
Figure 9 shows the percentile contribution of various input control parameters simultaneously over both surface roughness and material removal rate values.
Figure 9: Percentile contribution of parameters
8. Regression Modeling Regression models can be used to predict the response output behavior by taking different input independent parameters values and grey relational grades associated with each test response results. Equation (6) shows the general form of quadratic regression model. GRA = a + b*A + c*B + d*C + e*D + f*E + g*A2 + h*B2 + i*C2 + j*D2 + k*E2 + l*A*E + m*B*E + n*C*E + o*D*E (6) In the above formula a, b, c, d, e, f, g, h, i, j, k, l, m, n & o are the regression coefficients to be estimated. In this study, based on the GRA data given in Table 4, the regression model is developed and regression coefficients obtained using DataFit software. The independent variables in model (7) are weight percentage of SiC (A), cutting speed (B), feed rate (C) depth of cut (D) and cutter diameter (E). GRA = 2.888836577 - 0.034112223*A -0.000228111*B - 0.013719556*C + 0.150311112*D -0.392618750*E - 0.000083778*A2 + 0.000000057*B2 + 0.000017369*C2 - 0.120311111*D2 +0.020109722*E2 + 0.003262500*A*E - 0.000017504*B*E + 0.001375667*C*E + 0.024575000*D*E (7)
Paper ID: SEP1463 143

International Journal of Science and Research (IJSR) ISSN (Online): 2319-7064
Impact Factor (2012): 3.358
Volume 3 Issue 9, September 2014 www.ijsr.net
Licensed Under Creative Commons Attribution CC BY
9. Model validation and ANOVA Results Analysis of variance (ANOVA) is a mathematical way to determine precision and adequacy of regression modeling. It shows how well the proposed model fits the experimental data and, therefore, represents the actual process under study [18]. It is also a powerful tool in analyzing the variable effects on the process output responses. A summary of ANOVA results for regression model have been presented in Table 7. Based on the statistical analysis results, the coefficient of determination (R2) for this model is equal to 91.59%. This indicates that the model has good compatibility to the actual data. The p-value of the model is also close to zero which shows the model is good at 95% confidence level. These demonstrate the appropriate compliance of the model with the actual test results.
Table 7: Result of ANOVA
Source DFSum of Squares
Mean Square
F Ratio p
Regression 14 0.3241005 0.02315 9.3467286 0.00021
Error 12 0.0297217 0.0024768
Total 26 0.3538221
10. Confirmation Test for Proposed Methodology
The grey relational grade value is 0.6736 at combination A1B3C1D3E3 was calculated from regression equation (7). This GRA value validate that the proposed grey-taguchi approach is good for trade off among conflicting multi objectives of CNC end milling process for composite material LM 6/Al SiCp.
11. Conclusion This research work successfully demonstrated a methodology for making trade off among conflicting multiple objectives of CNC end milling process for composite material LM 6/Al SiCp and validate that methodology with using the regression models. The conclusions can be drawn from the present work were as follows: (a) The highest Grey relational grade of 0.849 was observed
for the semi-finishing milling process in experiment no. 9, shown in Table 4. So, we can say that experiment no. 9 among performed 27 experiments has best combination A1B3C3D3E3 for controllable parameters.
(b) Proposed grey-taguchi methodology given best combination A1B3C1D3E3 which is not in the range of performed 27 experiments.
(c) Regression model validate proposed methodology by obtaining good GRA value.
(d) The most significant parameter in the minimizing surface roughness (Ra) and maximizing material removal rate (MRR), is cutter diameter.
As a result, this methodology can be effectively applied for optimizing multiple objective problem. This methodology
also is found efficient for determining the optimal combination of parameter levels.
References [1] Abhishek Dubey, Devendra Pathak, Nilesh Chandra,
Ajendra Nath Mishra and Rahul Davis, “A Parametric Design Study of End Milling Operation using Grey Based Taguchi Method”, International Journal of Emerging Technology and Advanced Engineering, IV (4), pp. 1140 – 1146, 2004.
[2] Venkata Rao. R., Advanced Modelling and Optimization of Manufacturing Processes, Springer, 2011.
[3] Jignesh G. Parmaran and Prof. Alpesh Makwana, “Prediction of surface roughness for end milling process using Artificial Neural Network”, International Journal of Modern Engineering Research, II (3), pp. 1006-1013, 2012.
[4] Mohammed T. Hayajneh, Montasser S. Tahat and Joachim Bluhm, “A Study of the Effects of Machining Parameters on the Surface Roughness in the End-Milling Process”, Jordan Journal of Mechanical and Industrial Engineering, I (1), pp. 1 – 5, 2007.
[5] Bharat Chandra Routara, Saumya Darsan Mohanty, Saurav Datta, Asish Bandyopadhyay and Siba Sankar Mahapatra, “Optimization in CNC end milling of UNS C34000 medium leaded brass with multiple surface roughnesses characteristics”, Indian Academy of Sciences, XXXV (5) , pp. 619–629, 2010.
[6] Sanjit Moshat, Saurav Datta, Asish Bandyopadhyay and Pradip Kumar Pal, “Optimization of CNC end milling process parameters using PCA-based Taguchi method”, International Journal of Engineering, Science and Technology, II (1), 2010, pp. 92-102, 2010.
[7] B.Shivapragash, K.Chandrasekaran, C.Parthasarathy, and M.Samuel, “Multiple Response Optimizations in Drilling Using Taguchi and Grey Relational Analysis”, International Journal of Modern Engineering Research, III (2), pp. 765-768, 2013.
[8] A.Mahamani and V.Anandakrishnan, “Multi-response optimization of turning parameters of AL-6061–TIB2 in-situ metal matrix composite using grey-taguchi method”, International eJournal of Mathematics and Engineering 25, pp. 246 – 255, 2010.
[9] B. Mohan, A. Rajadurai and K.G. Satyanarayana, “Electric discharge machining of Al/SiC metal matrix composites using rotary tube electrode”, Journal of Mater Process Technology 153 -154, pp. 978-985, 2004.
[10] K.Kadirgama, M.M.Noor, N.M.Zuki.N.M, M.M. Rahma, M.R.M. Rejab, R. Daud, K. A. Abou-El-Hossein, “Optimization of S urface Roughness in End Milling on Mould Aluminium Alloys (AA6061-T6) Using Response Surface Method and Radian Basis Function Network”, Jordan Journal of Mechanical and Industrial Engineering, II (4), pp. 209- 214, 2008.
[11] Raghuraman S, Thiruppathi K , Panneerselvam T and Santosh S, “Optimization of EDM Parameters Using Taguchi Method and Grey Relational Analysis for Mild Steel is 2026”, International Journal of Innovative Research in Science, Engineering and Technology, II (7), pp. 3095 – 3103, 2013.
Paper ID: SEP1463 144

International Journal of Science and Research (IJSR) ISSN (Online): 2319-7064
Impact Factor (2012): 3.358
Volume 3 Issue 9, September 2014 www.ijsr.net
Licensed Under Creative Commons Attribution CC BY
[12] Mohd H.I. Ibrahim, Norhamidi Muhamad, Abu B. Sulong , Khairur R. Jamaludin , Nor H.M. Nor and Sufizar Ahmad, “Optimization of Micro Metal Injection Molding with Multiple Performance Characteristics using Grey Relational Grade”, Chiang Mai J. Sci., 38(2), pp. 231-241, 2011.
[13] B. C. Routara & A. Bandyopadhyay & P. Sahoo, “Roughness modeling and optimization in CNC end milling using response surface method: effect of workpiece material variation”, Int J Adv Manuf Technol 40, pp. 1166 – 1180, 2009.
[14] Phillips. J .Ross, “Taguchi Techniques for Quality Engineering”, Mc Graw Hill Publication, 2nd ed., pp. 281-285, 1996.
[15] Sanjeev Kumar Pal and Rahul Davis, “A Design of Experiment Approach to Compare the Machining Performance of CNC End Milling”, IPASJ International Journal of Mechanical Engineering, II (7), pp. 34-44, 2014.
[16] S. Y. Chavan, V. S. Jadhav, “Determination of Optimum Cutting Parameters for Multiperformance Characteristics in CNC End Milling of Al-Si7Mg Aluminum Alloy”, International Journal of Engineering and Technical Research, I (6), pp. 15-21, 2013.
[17] S.Balasubramanian, “Grey Relational Analysis to determine optimum process parameters for Wire Electro Discharge Machining”, International Journal of Engineering Science and Technology, III (1), pp. 95 – 101, 2011.
[18] A. Al-Refaie, L. Al-Durgham, and N. Bata, “Optimal Parameter Design by Regression Technique and Grey Relational Analysis”, The World Congress on Engineering (WCE) , III, 2010.
Author Profile
Neeraj Kumar received the B.E. degrees in Mechanical Engineering from M.B.M. Engineering College, Jodhpur in 2004. Then, he received M.Tech degree in Manufacturing System Engineering from MNIT, Jaipur in 2008. He is now pursuing P.hd in
Faculty of Engineering from Pacific Academy of Higher Education and Research University, Udaipur, Rajasthan, India Prof. K.K. Chhabra is currently working as Director at Pacific College of Engineering, Udaipur, Rajasthan, India
Paper ID: SEP1463 145


![CNC Milling[1]](https://static.fdocuments.in/doc/165x107/55cf9cd7550346d033ab3f24/cnc-milling1.jpg)