Trade-led Growth: A Sound Strategy for Asia
43
-
Upload
united-nations-publications -
Category
Documents
-
view
226 -
download
5
description
The global economic crisis triggered changes in real economies and trade in all countries, including those in Asia, which adopted the so-called export-led growth model. With these drastic changes in trade flows, and the need to counteract potential adverse effects, the old debate on the advantages and flaws of the export-led model has re-opened. It aims to provide some theoretical and empirical reasons towards an argument that for developing Asian economies, export-led growth is still a valid model of stable, equitable and sustainable growth. It also combines local research with that of established ones. While there is extensive literature focusing on the role of openness and trade in a country’s development, much of it dates to before the most recent global crisis. Volumes that were recently published argue against an export-led growth strategy, while this volume argues in defence of trade-led growth for the Asian region.
Transcript of Trade-led Growth: A Sound Strategy for Asia

i
Trade-led growth: A sound strategy for Asia
Edited by Simon J. Evenett, Mia Mikic
and Ravi Ratnayake
Papers presented at the 5th Anniversary Conference ofARTNeT “Trade-led Growth in Times of Crisis”,
2-3 November 2009
United Nations
ESCAP
New York, 2011

ii
Trade-led growth: A sound strategies for Asia
A Study by the Asia-Pacific Research andTraining Network on Trade
United Nations Publication
Sales No. E.11.II.F.4
Copyright © United Nations 2011
All rights reserved
ISBN: 978-92-1-120621-0
ST/ESCAP/2618
For further information on this publication, please contact:
Mr. Ravi Ratnayake
Director
Trade and Investment Division
ESCAP
Rajadamnern Nok Avenue
Bangkok 10200, Thailand
Tel: (66-2) 288-1902
Fax: (66-2) 288-1027, 288-3066
e-mail: [email protected]
The opinions, figures and estimates set forth in this publication are the responsibility
of the authors, and should not necessarily be considered as reflecting the views or carrying
the endorsement of the United Nations.
The designations employed and the presentation of the material in this publication
do not imply the expression of any opinion whatsoever on the part of the Secretariat of the
United Nations concerning the legal status of any country, territory, city or area, or of its
authorities, or concerning the delimitation of the frontiers or boundaries.
Mention of firm names and commercial products does not imply the endorsement
of the United Nations.
All material in this publication may be freely quoted or reprinted, but acknowledgment
is required, together with a copy of the publication containing the quotation or reprint.
The use of the publication for any commercial purposes, including resale, is prohibited,
unless permission is first obtained from Secretary of the Publications Board, United Nations,
New York. Request for permission should state the purpose and the extent of reproduction.
iii
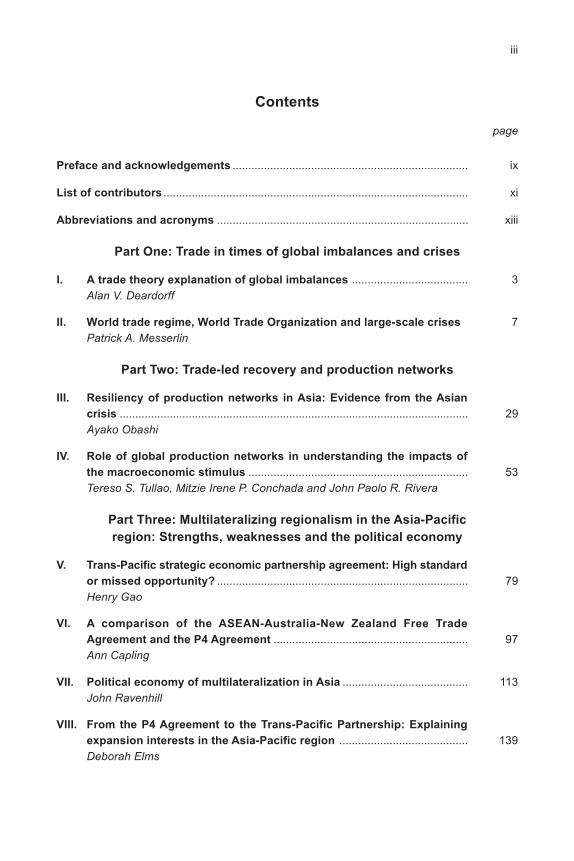
Contents
page
Preface and acknowledgements ........................................................................... ix
List of contributors ................................................................................................. xi
Abbreviations and acronyms ................................................................................ xiii
Part One: Trade in times of global imbalances and crises
I. A trade theory explanation of global imbalances ..................................... 3
Alan V. Deardorff
II. World trade regime, World Trade Organization and large-scale crises 7
Patrick A. Messerlin
Part Two: Trade-led recovery and production networks
III. Resiliency of production networks in Asia: Evidence from the Asian
crisis ............................................................................................................... 29
Ayako Obashi
IV. Role of global production networks in understanding the impacts of
the macroeconomic stimulus ...................................................................... 53
Tereso S. Tullao, Mitzie Irene P. Conchada and John Paolo R. Rivera
Part Three: Multilateralizing regionalism in the Asia-Pacific
region: Strengths, weaknesses and the political economy
V. Trans-Pacific strategic economic partnership agreement: High standard
or missed opportunity? ................................................................................ 79
Henry Gao
VI. A comparison of the ASEAN-Australia-New Zealand Free Trade
Agreement and the P4 Agreement .............................................................. 97
Ann Capling
VII. Political economy of multilateralization in Asia ........................................ 113
John Ravenhill
VIII. From the P4 Agreement to the Trans-Pacific Partnership: Explaining
expansion interests in the Asia-Pacific region ......................................... 139
Deborah Elms
iv
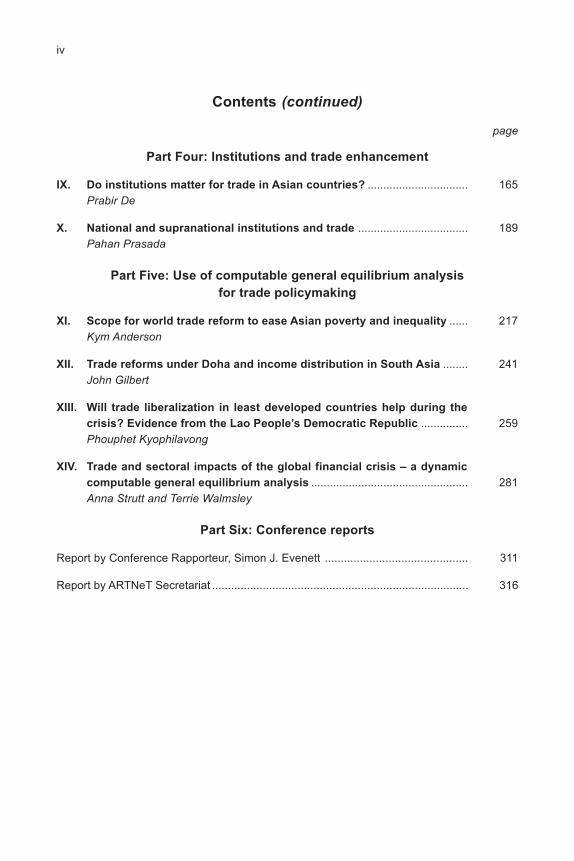
Contents (continued)
page
Part Four: Institutions and trade enhancement
IX. Do institutions matter for trade in Asian countries? ................................ 165
Prabir De
X. National and supranational institutions and trade ................................... 189
Pahan Prasada
Part Five: Use of computable general equilibrium analysis
for trade policymaking
XI. Scope for world trade reform to ease Asian poverty and inequality ...... 217
Kym Anderson
XII. Trade reforms under Doha and income distribution in South Asia ........ 241
John Gilbert
XIII. Will trade liberalization in least developed countries help during the
crisis? Evidence from the Lao People’s Democratic Republic ............... 259
Phouphet Kyophilavong
XIV. Trade and sectoral impacts of the global financial crisis – a dynamic
computable general equilibrium analysis .................................................. 281
Anna Strutt and Terrie Walmsley
Part Six: Conference reports
Report by Conference Rapporteur, Simon J. Evenett ............................................. 311
Report by ARTNeT Secretariat ................................................................................. 316
v
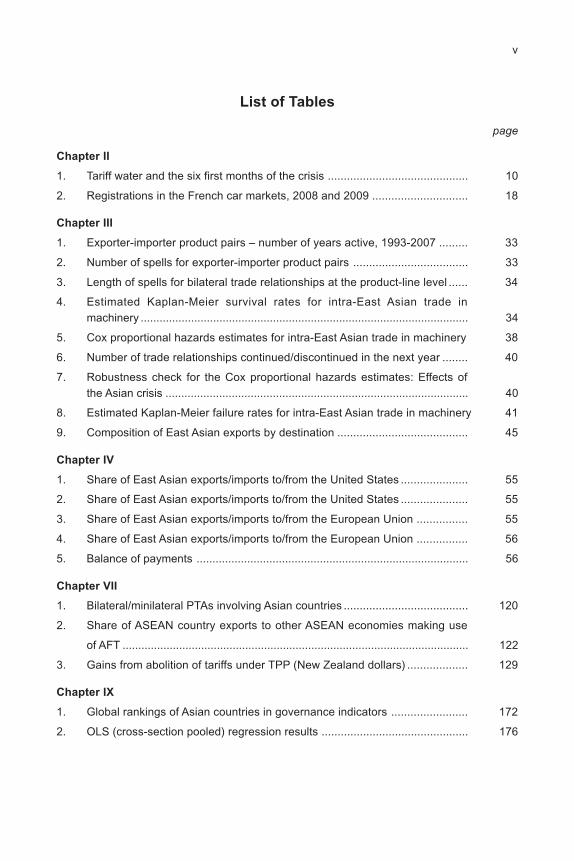
List of Tables
page
Chapter II
1. Tariff water and the six first months of the crisis ............................................ 10
2. Registrations in the French car markets, 2008 and 2009 .............................. 18
Chapter III
1. Exporter-importer product pairs – number of years active, 1993-2007 ......... 33
2. Number of spells for exporter-importer product pairs .................................... 33
3. Length of spells for bilateral trade relationships at the product-line level ...... 34
4. Estimated Kaplan-Meier survival rates for intra-East Asian trade in
machinery ........................................................................................................ 34
5. Cox proportional hazards estimates for intra-East Asian trade in machinery 38
6. Number of trade relationships continued/discontinued in the next year ........ 40
7. Robustness check for the Cox proportional hazards estimates: Effects of
the Asian crisis ................................................................................................ 40
8. Estimated Kaplan-Meier failure rates for intra-East Asian trade in machinery 41
9. Composition of East Asian exports by destination ......................................... 45
Chapter IV
1. Share of East Asian exports/imports to/from the United States ..................... 55
2. Share of East Asian exports/imports to/from the United States ..................... 55
3. Share of East Asian exports/imports to/from the European Union ................ 55
4. Share of East Asian exports/imports to/from the European Union ................ 56
5. Balance of payments ...................................................................................... 56
Chapter VII
1. Bilateral/minilateral PTAs involving Asian countries ....................................... 120
2. Share of ASEAN country exports to other ASEAN economies making use
of AFT .............................................................................................................. 122
3. Gains from abolition of tariffs under TPP (New Zealand dollars) ................... 129
Chapter IX
1. Global rankings of Asian countries in governance indicators ........................ 172
2. OLS (cross-section pooled) regression results .............................................. 176

vi
List of Tables (continued)
page
Chapter X
1. Correlation between per capita GDP and domestic institutional quality
variables .......................................................................................................... 197
2. Summary statistics: domestic institutional quality variables .......................... 197
3. Correlation between scaled governance score and its sub-indices ............... 198
4. Description of national institutional quality scores by OECD membership .... 198
5. Political and trading association membership ................................................ 199
6. Description of the dependent variables .......................................................... 199
7. Different functional forms and their specifications implemented ................... 201
8. Implementation of fixed effect model .............................................................. 203
9. Estimates for key gravity variables in alternative specifications .................... 203
10. Elasticities of domestic institutional variables for alternative functional forms 205
11. Elasticities of domestic institutional variables from fixed effect models ........ 206
12. Elasticities of supranational institutional membership effects ........................ 207
13. Elasticities of the Poisson estimates of gravity model by development status 208
Chapter XII
1. Intra-South Asian trade shares, 2001-2008 ................................................... 244
2. Intra-South Asian trade intensity, 2001-2008 ................................................. 244
3. Intra-South Asian trade complementarity, 2001-2008 .................................... 245
4. Intra-South Asian trade complementarity matrix, 2008 ......................................... 245
5. Intra-South Asian export similarity, 2001-2008 ............................................... 245
6. Intra-South Asian export similarity matrix, 2008 ............................................. 246
7. Trade-weighted average applied tariffs, 2007 ................................................ 246
8. Household categories in the model by region ................................................ 250
9. Household welfare impact of trade reform ..................................................... 253
10. Sectoral impact of trade reform ...................................................................... 255
Chapter XIII
1. Key macroeconomic indicators ....................................................................... 262
2. Exports by region/country ............................................................................... 263
3. Exports by commodity .................................................................................... 264
4. Imports by region/country ............................................................................... 265
5. Imports by commodity ..................................................................................... 265
6. Tariff rate structure changes ........................................................................... 267
vii
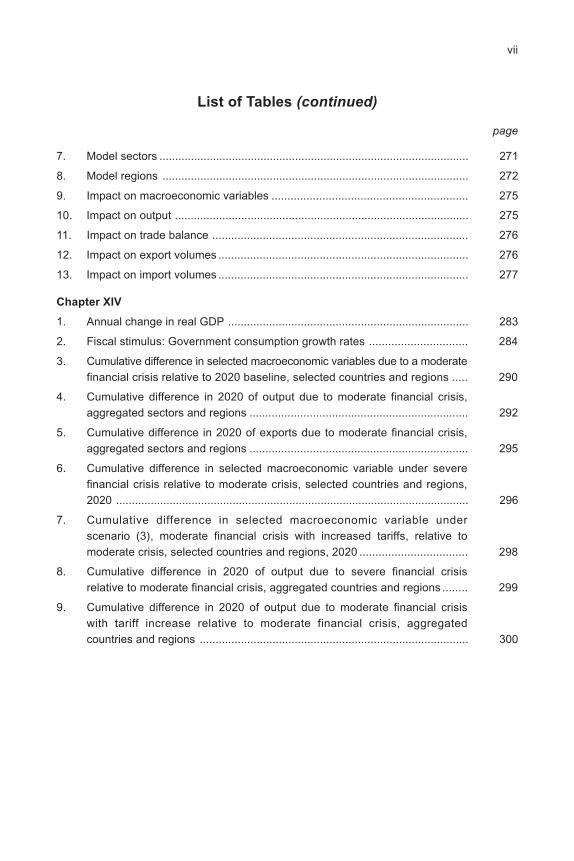
List of Tables (continued)
page
7. Model sectors .................................................................................................. 271
8. Model regions ................................................................................................. 272
9. Impact on macroeconomic variables .............................................................. 275
10. Impact on output ............................................................................................. 275
11. Impact on trade balance ................................................................................. 276
12. Impact on export volumes ............................................................................... 276
13. Impact on import volumes ............................................................................... 277
Chapter XIV
1. Annual change in real GDP ............................................................................ 283
2. Fiscal stimulus: Government consumption growth rates ............................... 284
3. Cumulative difference in selected macroeconomic variables due to a moderate
financial crisis relative to 2020 baseline, selected countries and regions ..... 290
4. Cumulative difference in 2020 of output due to moderate financial crisis,
aggregated sectors and regions ..................................................................... 292
5. Cumulative difference in 2020 of exports due to moderate financial crisis,
aggregated sectors and regions ..................................................................... 295
6. Cumulative difference in selected macroeconomic variable under severe
financial crisis relative to moderate crisis, selected countries and regions,
2020 ................................................................................................................ 296
7. Cumulative difference in selected macroeconomic variable under
scenario (3), moderate financial crisis with increased tariffs, relative to
moderate crisis, selected countries and regions, 2020 .................................. 298
8. Cumulative difference in 2020 of output due to severe financial crisis
relative to moderate financial crisis, aggregated countries and regions ........ 299
9. Cumulative difference in 2020 of output due to moderate financial crisis
with tariff increase relative to moderate financial crisis, aggregated
countries and regions ..................................................................................... 300

viii
List of Figures
page
Chapter I
1. Free inter-temporal trade with identical preferences ...................................... 4
2. Free inter-temporal trade with non-identical preferences: Country A consumers
favouring Qpresent and country B consumers favouring Qfuture ................. 5
3. Policy-distorted inter-temporal trade: Country A subsidizes exports of Qfuture
and country B subsidizes exports of Qpresent ............................................... 6
Chapter III
1. Kaplan-Meier estimates of survival functions and hazard functions for
intra-East Asian trade in machinery ................................................................ 35
2. Kaplan-Meier estimates of failure functions and hazard functions for
intra-East Asian trade in machinery ................................................................ 42
Chapter IV
1. Variance decomposition for equation 1 .................................................................. 65
2. Impulse response for equation 1 .................................................................... 66
3. Variance decomposition for equation 2 .......................................................... 67
4. Impulse response for equation 2 .................................................................... 68
5. Variance decomposition for equation 3 .......................................................... 69
6. Impulse response for equation 3 .................................................................... 69
Chapter VII
1. Percentage share of surveyed exporting firms utilizing PTAs ........................ 123
Chapter IX
1. Regional governance systems – actors and accountabilities ........................ 169
2. Scatter of trade and governance indicators in Asia, 2007 ............................. 174
ix
Preface and acknowledgements
This volume is a collection of papers presented at the conference which celebrated
5th anniversary of the establishment of Asia-Pacific Research and Training Network on
Trade (ARTNeT). The conference took place in November 2009 as the global economy
and the Asian region in particular were already starting to taste some traces of recovery in
both trade flows and GDP growth. At that time it was too early to declare crisis over, and
from today’s perspective this was a right call. While trade flows, at least of most of the
Asian economies as well as of commodity producers around the world returned by the
pre-crisis monthly values by mid 2010, escalating financial problems in Euro zone economies
and no return of growth to the United States, couple with economic disasters in Japan and
some other countries, caused for halting of trade growth towards the end of 2011. While it
is too early to comment on the duration and characteristics of this slow-down (could it be
a second recession bottom – tracing the famous W shape of the crisis?) the fact that it
again has the most direct implications for the trade-dependent economies comforts the
editors of this volume. Namely “trade-led growth in times of crisis” has not disappear from
the agendas of researchers, analysts, practitioners and development strategists as it seems
that “crisis”, understood as a short-fall in a global demand, will remain a characteristics of
a medium term of development for developing countries of the Asia and the Pacific region.
One hundred and fifty trade researchers from the Asia-Pacific region and beyond
who participated in the Conference discussed the origins of the global economic and crisis
and its implications for the region’s trade-led growth model. A summary of the discussions
prepared by the ARTNeT secretariat is added in Part six of the book, together with the text
from the Conference rapporteur, Dr. Simon J. Evenett. From both of these reports it is
obvious that, based on the collective knowledge and wisdom at the Conference, the region
is prepared to discuss the premise and components of its development strategy but is not
willing to part ways from utilizing trade as the main support to development. the chapters
in this volume therefore really are further exploration how trade could remain the major
power of the engine of growth.
The authors of the chapters are well known experts and thinkers in their respective
fields and we are most grateful for their contributions. The chapters were peer reviewed
and thus the versions appearing in this book differ more or less from the papers presented
at the conference. While editors tried to group the papers according to some common
themes or messages, there is still a diversity which is impossible to eliminate in a volume
like this. Thus it should be noted that views expressed in the chapters are to be attributed
strictly to their respective authors, and not the editors of the volume.
There are many other people that we need to thank, without implicating them in the
views expressed in this volume, for assisting with the process of getting the book ready for
publication. Mr. Martin Wermelinger, Research Assistant with ARTNeT secretariat and
doctorate candidate at St. Gallen University worked with authors on the revision of chapters.
Mr. Robert Oliver, external copy and style editor of ARTNeT, undertook the painful task of
harmonizing style and presentation of the material throughout the book. As this book was

x
conceived as one of the objective for the Conference, we need to thank many people who
assisted in organization of the event. Trade and Investment Division staff, in particular
Ms. Melanie Ramjoue, Ms. Panjai Limchupong and Ms. Pradtana Limkrailassiri for logistic
support in organization of the Conference. We wish to thank IDRC, the core partner of
ARTNeT in providing sponsorship to the conference and to Dr. Evan Due from the IDRC
for his substantive contributions during the Conference and also in the operation of the
network. ARTNeT member institutions, partners and associate partners took active interest
and contributed papers and discussions. Last, but not the least, we would like to express
appreciation to Dr. Noeleen Hayzer, the Undersecretary General of the United Nations and
the Executive Secretary of the ESCAP for inaugurating and attending the conference.
Simon J. Evenett
Mia Mikic
Ravi Ratnayake
xi
List of contributors
Kym Anderson, Professor, University of Adelaide, Australia, E-mail: kym.anderson@
adelaide.edu.au
Ann Capling, Professor, School of Social and Political Sciences, Faculty of Arts, The
University of Melbourne, Australia, E-mail: [email protected]
Mitzie Irene P. Conchada, De La Salle University, Manila, the Philippines, E-mail:
Prabir De, Fellow, Research and Information System for Developing Countries, New Delhi,
India. E-mail: [email protected]
Alan V. Deardorff, Professor of Economics, University of Michigan, United States. E-mail:
Deborah Elms, Assistant professor and Head, Temasek Foundation for Trade & Negotiations
Nanyang Technological University, Singapore, E-mail: [email protected]
Simon J. Evenett, Professor of International Trade and Economic Development, University
of St. Gallen, Switzerland. E-mail: [email protected]
Henry Gao, Associate Professor of Law, Singapore Management University. E-mail:
John Gilbert, Professor, Department of Economics and Finance, Utah State University,
United States. E-mail: [email protected]
Phouphet Kyophilavong, Associate Professor, Faculty of Economics and Business
Management, National University of Laos. E-mail: [email protected]
Patrick A. Messerlin, Professor of Economics, Institut d’Etudes Politiques de Paris, Paris,
France. E-mail: [email protected]
Mia Mikic, Economic Affairs Officer, Trade and Investment Division, United Nations Economic
and Social Commission for Asia and Pacific. E-mail: [email protected]
Ayako Obashi, Associate Professor, Faculty of Economics, Keio University. E-mail:
Pahan Prasada, Department of Agricultural Economics and Business Management Faculty
of Agriculture. University of Peradeniya, Sri Lanka. E-mail: [email protected],
Ravi Ratnayake, Director, Trade and Investment Division, ESCAP. E-mail: [email protected]
John Ravenhill, Professor, Department of Internmational Relations, Australia National
University. E-mail: [email protected]
xii
John Paolo R. Rivera, De La Salle University, Manila, the Philippines. E-mail: john.paolo.
Anna Strutt, Senior Lecturer, Department of Economics, University of Waikato, New Zealand.
E-mail: [email protected]
Tereso S. Tullao, De La Salle University, Manila, the Philippines. E-mail: [email protected]
Terrie Walmsley, Assistant Professor and Director of the Centre for Global Trade Analysis,
Purdue University and Principal Fellow, University of Melbourne, Australia. E-mail:

xiii
Abbreviations and acronyms
AANZFTA ASEAN-Australia-New Zealand Free Trade Agreement
ACP African, Caribbean and Pacific Group of States
ADB Asian Development Bank
AEC ASEAN Economic Community
AFTA ASEAN Free Trade Area
AGOA African Growth and Opportunity Act
AHTN ASEAN Harmonized Tariff Nomenclature
ANZSCEP Agreement between New Zealand and Singapore on a Closer Economic
Partnership
APC Australian Productivity Commission
APEC Asia-Pacific Economic Cooperation
APTIAD Asia-Pacific Trade and Investment Agreement Database
ARTNeT Asia-Pacific Research and Training Network on Trade
ASEAN Association of Southeast Asian Nations
ASEAN5 Brunei Darussalam, Indonesia, Malaysia, Singapore and Thailand
ASEAN6 ASEAN5 plus the Philippines
ASEC ASEAN Secretariat
ASW ASEAN Single Window
ATIGA ASEAN Trade in Goods Agreement
BoP balance of payments
CAFTA Central American Free Trade Agreement
CAFTA-DR Dominican Republic-Central America-United States Free Trade Agreement
CAN Andean Community
CAREC Central Asia Regional Economic Cooperation
CARICOM Caribbean Community
CCCA Coordinating Committee on the Implementation of CEPT for AFTA
CCFTA Central European Free Trade Agreement
CEPR Centre of Economic Policy Research
CGE computable general equilibrium
CLMV Cambodia, Lao People’s Democratic Republic, Myanmar and Viet Nam
COMTRADE United Nations Commodity Trade Statistics Database
CTC change in tariff classification
CTH change in tariff heading
CTSH change in tariff subheading
DDA Doha Development Agenda
DFAT Australian Department of Foreign Affairs and Trade
EAFTA East Asia Free Trade Agreement
EC European Communities
ECMS EC Member States
xiv
EFTA European Free Trade Association
ERIA Economic Research Institute for ASEAN and East Asia
ESCAP Economic and Social Commission for Asia and the Pacific
FDI foreign direct investment
FOB free on board
FTA Free Trade Agreement
FTAA Free Trade Area of the Americas
FTAAP Free Trade Area of the Asia-Pacific
G20 Group of Twenty (major economies)
GATS General Agreement on Trade in Services
GATT General Agreement on Tariffs and Trade
GDP gross domestic product
GDyn GTAP framework incorporating dynamic behaviour
GE government effectiveness
GFC global financial crisis
GMS Greater Mekong Subregion
GPN global production network
GSP Generalized System of Preferences
GTAP Global Trade Analysis Project
HQC Hannan-Quinn criterion
HS Harmonized System
ICT information and communication technology
IDRC International Development Research Centre
IMF International Monetary Fund
IPR intellectual property rights
KIEP Korean Institute for International Economic Policy
LAIA Latin American Integration Agreement
LDC least developed country
MDS multidimensional scaling
MERCOSUR Southern Common Market
MFN most-favoured nation
MNC multinational corporation
NAFTA North American Free Trade Agreement
NT2 Nam Theun 2
NTB non-tariff barrier
NTM non-tariff measure
xv
ODA official development assistance
OECD Organisation for Economic Co-operation and Development
OLS ordinary least squares
OPEC Organization of the Petroleum Exporting Countries
ORRC other restrictive regulations of commerce
P4 Trans-Pacific Strategic Economic Partnership, a free trade agreement
between Brunei Darussalam, Chile, New Zealand and Singapore
PECS Pan-European Cumulation System
PTA preferential trade agreement
RIS Research and Information System for Developing Countries
RL rule of law
ROO rules of origin
RQ regulatory quality
RTA regional trade agreement
RVC regional value content
SAARC South Asian Association for Regional Cooperation
SCM Subsidy and Countervailing Measures
SIC Schwarz Information Criterion
SPS sanitary and phytosanitary standards
TBT technical barriers to trade
TECH technical requirement
TNC transnational corporation
TPA Trade Promotion Authority
TPP Trans-Pacific Partnership
TPSEP Trans-Pacific Strategic Economic Partnership Agreement
TPS transitional product-specific safeguard
TRAINS Trade Analysis and Information System
TS Tariff Schedule of the United States
UNCTAD United Nations Conference on Trade and Development
UNDP United Nations Development Programme
USTR United States Trade Representative
VAC value added criterion
VAR vector autoregression
VC value content
WITS World Integrated Trade Solution
WTO World Trade Organization

1
Part one
Trade in times of global imbalancesand crises

3
I. A trade theory explanation of global imbalances1
By Alan V. Deardorff
There has been concern for many years over the large and growing trade
imbalances of various countries in the world economy. This has led to calls for “global
rebalancing” in which countries with persistent trade deficits, such as the United States,
would reduce net imports while countries with persistent trade surpluses, such as China,
would reduce net exports. This issue has become associated with concerns about the
managed exchange rates of China and other economies as well as budget imbalances of
the United States and other economies. The purpose of this chapter is to look at global
imbalances from the perspective that a trade theorist would take to global trade. The issue
is whether trade imbalances are necessarily harmful to global welfare and, therefore, a sign
that policies are needed to correct them.
From a trade perspective, trade imbalances need not be a sign of disequilibrium.
Rather, they could be a simple indication that there is trade across time as well as across
space. This is illustrated simply by figure 1, which shows the familiar trade theorists’
illustration of differing production possibilities in two countries, A and B, together with
indifference curves showing the welfare that they can achieve both in autarky and with free
trade. However, instead of the axes showing quantities of two different goods at the same
point in time, they show what could be the same good but at different times. That is,
country A is relatively better at, and therefore has a comparative advantage in, producing
the good in the present, while the production possibilities of country B are similarly skewed
towards production in the future. In autarky, these differences are reflected in a relative price
that is lower at pesent in country A than in country B compared with future consumption; this
corresponds to a lower real interest rate in A than in B. With free trade (shown by price lines
with the same slope and thus the same interest rate in both countries), country A expands
production in the present, exporting its excess to country B, while B does the reverse. In the
present, it follows that country A is producing more than it is consuming, and thus is running
a trade surplus, while country B is running a deficit.
Are there gains from this trade? Certainly, as each country is exploiting its own
inter-temporal comparative advantage, and both are accordingly able to reach higher
indifference curves, representing higher welfare. If this were the situation in the world
economy of today, it would not be a cause for concern.
However, what differentiates the two countries in figure 1 is that country A has
a comparative advantage in present production while country B has a comparative
advantage in future production. This difference in the two production possibility curves
means that the ratio of real output in the future, compared with the present, is larger in
1 The author acknowledges having benefited from comments by participants at the Asia-Pacific Trade
Economists’ Conference in Bangkok in November 2009 and at the UNCTAD-India conference on “Global
Economic Crisis: Challenges and Opportunities” in Delhi in December 2009.

4
country B than in country A; in other words, real output is growing faster in country B. That is
why it makes sense for consumers in country B to run a trade deficit, in effect smoothing
their consumption over time.
However, trying to match this scenario to the current situation in the world economy
creates a problem. The country that is running the largest chronic trade surplus is rapidly-
growing China, not the slow-growing United States. Thus, in the figure, the United States
would be country A and China would be country B. The theory would indicate that the United
States should be running a surplus and China should be running a deficit.
How is it possible, in the context of this model, to account for the fact that the two
countries are doing just the opposite? One possibility would be to let them have different
preferences. Suppose that country A has an even greater preference for present
consumption than its ability to produce in the present, while country B has a similarly
extreme preference for consuming in the future. Figure 2 shows such a free trade
equilibrium. It has the two countries gaining from this inter-temporal trade, which is now
motivated more by their difference in preferences than by their difference in their ability to
produce.
Is figure 2 a plausible explanation of the situation in the world today? Perhaps. It is
certainly true that many in the United States, the author included, act as though present
consumption is preferred over future consumption to an extreme degree, while the savings
rates of China and other developing countries suggest the opposite preference. However, if
that were the whole story, then a higher real interest rate could be expected in the United
States than in China, except to the extent that trade and/or capital flows have equalized
interest rates internationally. That does not seem plausible. In any case, the author hesitates
Figure 1. Free inter-temporal trade with identical preferences
QfutureQfuture
....
....
....
....
....
..
....
....
....
....
....
....
....
....
....
.
....
....
....
....
....
....
....
....
....
.
....
....
....
....
....
....
Country A Country B
Qpresent Qpresent
Surplus
Deficit
5
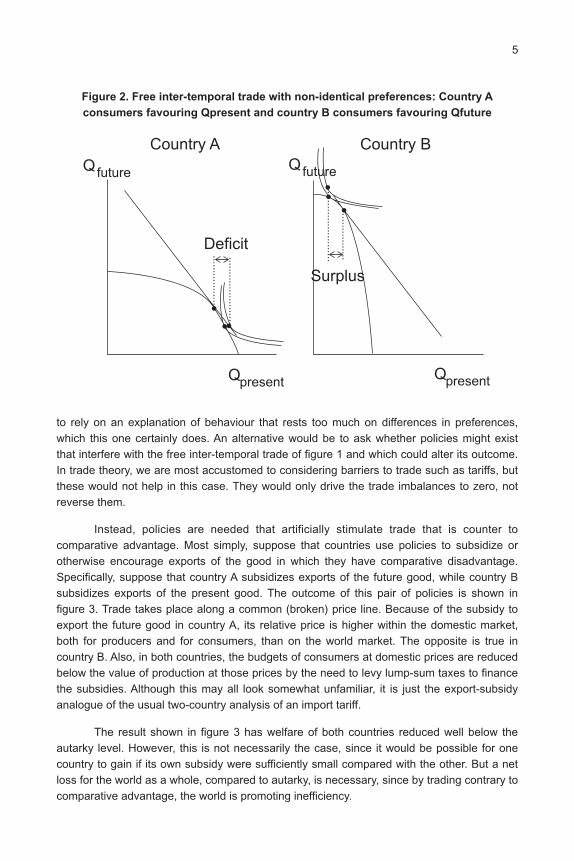
Figure 2. Free inter-temporal trade with non-identical preferences: Country A
consumers favouring Qpresent and country B consumers favouring Qfuture
to rely on an explanation of behaviour that rests too much on differences in preferences,
which this one certainly does. An alternative would be to ask whether policies might exist
that interfere with the free inter-temporal trade of figure 1 and which could alter its outcome.
In trade theory, we are most accustomed to considering barriers to trade such as tariffs, but
these would not help in this case. They would only drive the trade imbalances to zero, not
reverse them.
Instead, policies are needed that artificially stimulate trade that is counter to
comparative advantage. Most simply, suppose that countries use policies to subsidize or
otherwise encourage exports of the good in which they have comparative disadvantage.
Specifically, suppose that country A subsidizes exports of the future good, while country B
subsidizes exports of the present good. The outcome of this pair of policies is shown in
figure 3. Trade takes place along a common (broken) price line. Because of the subsidy to
export the future good in country A, its relative price is higher within the domestic market,
both for producers and for consumers, than on the world market. The opposite is true in
country B. Also, in both countries, the budgets of consumers at domestic prices are reduced
below the value of production at those prices by the need to levy lump-sum taxes to finance
the subsidies. Although this may all look somewhat unfamiliar, it is just the export-subsidy
analogue of the usual two-country analysis of an import tariff.
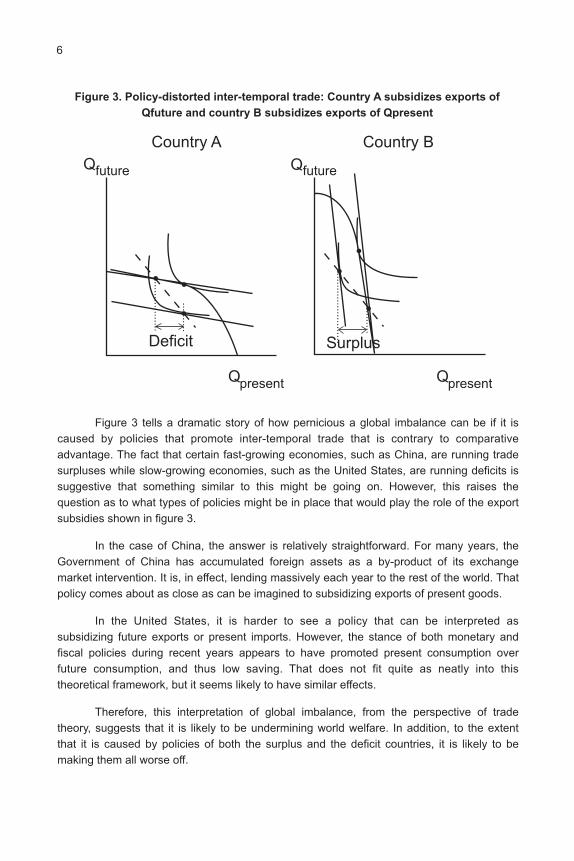
The result shown in figure 3 has welfare of both countries reduced well below the
autarky level. However, this is not necessarily the case, since it would be possible for one
country to gain if its own subsidy were sufficiently small compared with the other. But a net
loss for the world as a whole, compared to autarky, is necessary, since by trading contrary to
comparative advantage, the world is promoting inefficiency.
..................
....................... ........................
................
Country A Country B
Qfuture
Qpresent
Deficit
Surplus
Qpresent
Qfuture
6
Figure 3 tells a dramatic story of how pernicious a global imbalance can be if it is
caused by policies that promote inter-temporal trade that is contrary to comparative
advantage. The fact that certain fast-growing economies, such as China, are running trade
surpluses while slow-growing economies, such as the United States, are running deficits is
suggestive that something similar to this might be going on. However, this raises the
question as to what types of policies might be in place that would play the role of the export
subsidies shown in figure 3.
In the case of China, the answer is relatively straightforward. For many years, the
Government of China has accumulated foreign assets as a by-product of its exchange
market intervention. It is, in effect, lending massively each year to the rest of the world. That
policy comes about as close as can be imagined to subsidizing exports of present goods.
In the United States, it is harder to see a policy that can be interpreted as
subsidizing future exports or present imports. However, the stance of both monetary and
fiscal policies during recent years appears to have promoted present consumption over
future consumption, and thus low saving. That does not fit quite as neatly into this
theoretical framework, but it seems likely to have similar effects.
Therefore, this interpretation of global imbalance, from the perspective of trade
theory, suggests that it is likely to be undermining world welfare. In addition, to the extent
that it is caused by policies of both the surplus and the deficit countries, it is likely to be
making them all worse off.
Figure 3. Policy-distorted inter-temporal trade: Country A subsidizes exports of
Qfuture and country B subsidizes exports of Qpresent
..................
..........
........................
........
Country A Country B
Qfuture
Qpresent
Deficit Surplus
Qpresent
Qfuture
7
II. World trade regime, World Trade Organizationand large-scale crises1
By Patrick A. Messerlin
Introduction
One year after the collapse of Lehman Brothers and three years after the start of the
food and commodities crisis, the time seems ripe to make a provisional assessment of the
resilience of the open trade policies to this severe downturn, and to draw the main lessons.
In attempting to answer this question, it is necessary to make a distinction between
the “world trade regime” and the World Trade Organization (WTO). The former consists of
all the multilateral, plurilateral and unilateral trade policies. Sometimes such policies amplify
WTO weaknesses. However, sometimes they amplify WTO disciplines, as during the past
year (see section A). WTO, with its key disciplines and its dispute settlement mechanism, is
the undisputed legal skeleton of the world trade architecture. However, it is in great need of
adjustiment to a faster-moving, often chaotic, world trade regime.
The distinction between WTO and the world trade regime is even more crucial, since
the designation of the G20 as the “premier forum” for international economic cooperation
between the largest world economies (Pittsburgh Summit communiqué). The Republic of
Korea, which holds the G20 Chair for 2010 (and Canada, as the host of the G20 in spring
2010) will have the major task of developing this new architecture – weaving together the
G20, WTO and the other trade-related international institutions.
Section A of this chapter argues that, during the past year, the world trade regime
has shown an unexpected resilience to an economic downturn of a magnitude unknown
before. Section B explains why such a positive conclusion is not shared by all observers.
Section C suggests four concrete proposals that would improve the resilience of open trade
policies, particularly during the perilous exit period of the current crisis. Section D stresses
the fact that any progress in the world trade architecture faces a political constraint that is
likely to stay with us for a long time – the “iron law of thin majorities” (the vast majority of the
governments of the largest economies depend on very thin majorities). Section E examines
the balance to be struck between designing stricter international disciplines and building
robust institutions when improving the long-term resilience of the world trade regime to
large-scale crises. Section F draws some conclusions for the Doha Round and the
1 Paper presented at the ARTNeT Conference on “Trade-led growth in times of crisis” (2-3 November
2009). The author is grateful to Mia Mikic, Jean-Jacques Hallaert and the participants of the ARTNeT
Conference and the seminars hosted by the Korean Institute for International Economic Policy (KIEP),
the Graduate School of International Studies (Seoul National University) and the Hong Kong Forum for
their very useful comments. The paper was written prior to the G20 meetings in 2010. Any errors are
those of the author.
8
post-Doha Agenda, emphasizing the key role of the Republic of Korea and Canada in the
G20 context, and the assets of those two countries when playing such a role.
A. The good news: The (unexpected) resilience of theworld open trade regime
This section argues that the world trade system has shown an unexpected resilience
to the tidal waves of the past three years (Messerlin 2009; World Trade Organization, 2010).
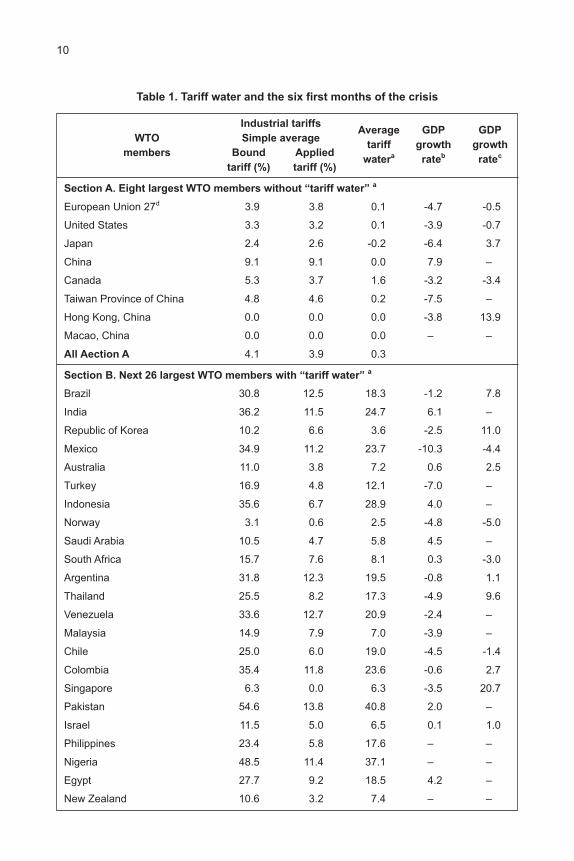
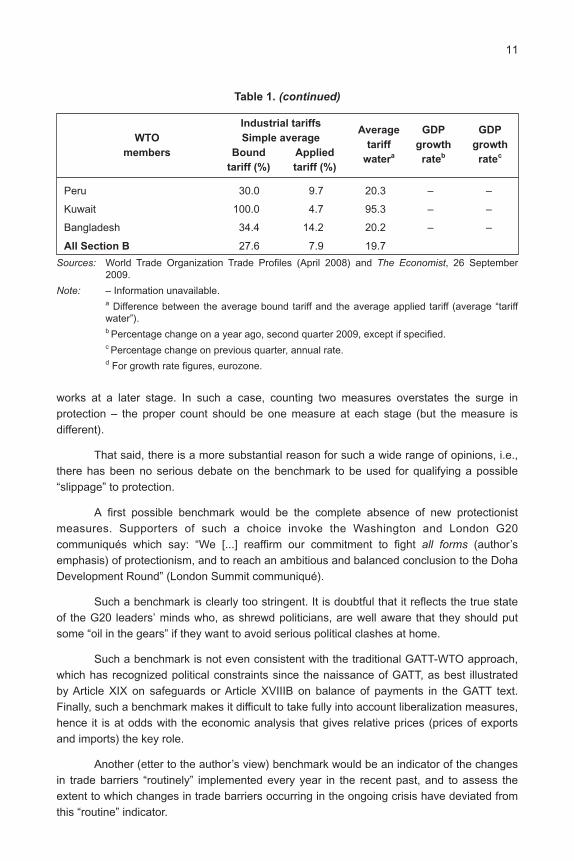
Eighteen months ago, most observers were expecting a massive surge of tariff increases
from the approximately 20 largest developed, emerging and developing economies that are
applying tariffs at a (much) lower level than their levels bound at the 1995 Uruguay Round
(table 1). This surge did not happen, except in a very few countries (most notably, Argentina
and Indonesia, but these countries had adopted harmful trade policies long before the
crisis).
Meanwhile, substantial liberalization has been implemented. Many barriers to
exports have been reduced or eliminated (economic analysis shows that barriers to exports
are barriers to imports).2 Despite a severe downturn a key emerging economy, Mexico, has
launched a swiping unilateral liberalization, thus completing the preferential trade
agreements that it has already with the United States and the European Communities (EC).
Therefore, it is too early to “cry wolf” – such resilience of the open trade regime is
good news. However, it is also much too early to declare victory for several reasons.
First, this unexpected resilience comes from the world trade regime (the practice),
not from legal commitments at WTO. Countries with “tariff water” (bound tariffs higher than
applied tariffs) did not align their bound tariffs to their applied tariffs at WTO; this remains
a key issue of the Doha negotiations (see section F). However, the fact that the trade
policies of the largest economies are, de facto, enforcing the key WTO notion of “value of
binding” (no gap between applied and bound tariffs) is a promising sign in the long term. In
addition, it may significantly change the dynamics of the Doha negotiations in the short term
(see section F).
Second, key emerging and developing economies have faced a much less dramatic
domestic downturn than the downturn faced by the developed economies, or they appear to
have rebounded more rapidly (table 1). In other words, their virtue has not been tested as
harshly as the virtue of the industrial countries. For example, China and India are exhibiting
growth rates of 7.9 per cent and 6.1 per cent, respectively (second quarter of 2009,
percentage change on a year ago) (The Economist, 25 September 2009]. These growth
rates are considerably higher than those enjoyed by the United States during the “golden”
1990s and 2000s, and three to four times more than the EC growth rates of those same
decades.
2 It should be noted that many of these barriers to exports were explicitly temporary and had explicit
end dates, hence mostly raising the risk of being extended. This feature is also observed for barriers on
imports currently imposed by non-WTO members, particularly the Russian Federation.

9
Third, developed countries continue to show negative or very low growth rates, while
they may have exhausted the leverage of macroeconomic policies (Eichengreen and Irwin,
2009). In such a context, recent trade barriers such as the United States’ 35 per cent import
duties on tyres from China, adopted under the transitional product-specific safeguard (TPS)
included in China’s WTO protocol accession, are worrisome for two reasons:
(a) They may open the door to new cases (such as shoes, example) in the United
States, since it is much easier to impose measures under TPS than under other
WTO safeguards.3 The TPS provision is scheduled to be eliminated in 2014,
hence will be enforceable for the whole duration of the crisis in the United
States (see section D),
(b) The “trade-diversion” TPS provision means that, as soon as one WTO member
takes a TPS measure, other members could enforce similar measures at almost
no cost in terms of investigation, prior notification, input from Chinese parties
etc. As a result, it may be ultimately much more difficult than expected for
Chinese firms to shift exports to non-United States markets – thereby fuelling
frustrations at future G20 Summits.
Last, the food and commodities crisis preceded the downturn crisis. Protectionist
measures adopted during the former crisis (export restrictions) have been eliminated during
the latter. In other words, the liberalization undertaken during the downturn has notably
consisted of correcting the protectionist drift introduced only 18 months earlier. Such a swift
shift offers the best-ever illustration of the intertemporal inefficiency costs generated by the
volatility of protectionist measures. However, the ongoing crisis seems unlikely to end within
the next two years, meaning that we will not benefit from such a happy turn of events soon.
B. The missing debate
The positive view on the past year described above does not reflect a consensus.
For some observers, the slippage in protection is big enough to raise serious concerns
(Evenett, 2009a) while other observers have significantly reduced their initial concerns from
a “significant slippage” (WTO, 2009) to “sand in the gears” (WTO-OECD-UNCTAD, 2009
and 2010).
Why such a wide range of opinions? It flows from the many intrinsic difficulties of an
accurate monitoring of the ongoing changes. Such difficulties begin with collecting the
protectionist measures. For example, it is much harder to get the full range measures
aiming at reducing domestic distortions (e.g., between large and small firms) than to collect
tariff changes. There are also methodological difficulties. For example, it would be
necessary to pay much more attention to the procedure consisting of systematically adding
the count of measures at one point in time. Such an addition ignores the fact that barriers
are often substitutable, hence one barrier works at one stage of the crisis while another one
3 This is illustrated by the fact that the petition was tabled on 20 April 2009, and President Obama
announced his decision on 11 September 2009 – a record time for such procedures. China was
particularly frustrated by not even getting a few days of discussions with the United States in September.
10
Table 1. Tariff water and the six first months of the crisis
Industrial tariffsAverage GDP GDP
WTO Simple averagetariff growth growth
members Bound Appliedwatera rateb ratec
tariff (%) tariff (%)
Section A. Eight largest WTO members without “tariff water” a
European Union 27d 3.9 3.8 0.1 -4.7 -0.5
United States 3.3 3.2 0.1 -3.9 -0.7
Japan 2.4 2.6 -0.2 -6.4 3.7
China 9.1 9.1 0.0 7.9 –
Canada 5.3 3.7 1.6 -3.2 -3.4
Taiwan Province of China 4.8 4.6 0.2 -7.5 –
Hong Kong, China 0.0 0.0 0.0 -3.8 13.9
Macao, China 0.0 0.0 0.0 – –
All Aection A 4.1 3.9 0.3
Section B. Next 26 largest WTO members with “tariff water” a
Brazil 30.8 12.5 18.3 -1.2 7.8
India 36.2 11.5 24.7 6.1 –
Republic of Korea 10.2 6.6 3.6 -2.5 11.0
Mexico 34.9 11.2 23.7 -10.3 -4.4
Australia 11.0 3.8 7.2 0.6 2.5
Turkey 16.9 4.8 12.1 -7.0 –
Indonesia 35.6 6.7 28.9 4.0 –
Norway 3.1 0.6 2.5 -4.8 -5.0
Saudi Arabia 10.5 4.7 5.8 4.5 –
South Africa 15.7 7.6 8.1 0.3 -3.0
Argentina 31.8 12.3 19.5 -0.8 1.1
Thailand 25.5 8.2 17.3 -4.9 9.6
Venezuela 33.6 12.7 20.9 -2.4 –
Malaysia 14.9 7.9 7.0 -3.9 –
Chile 25.0 6.0 19.0 -4.5 -1.4
Colombia 35.4 11.8 23.6 -0.6 2.7
Singapore 6.3 0.0 6.3 -3.5 20.7
Pakistan 54.6 13.8 40.8 2.0 –
Israel 11.5 5.0 6.5 0.1 1.0
Philippines 23.4 5.8 17.6 – –
Nigeria 48.5 11.4 37.1 – –
Egypt 27.7 9.2 18.5 4.2 –
New Zealand 10.6 3.2 7.4 – –
11
works at a later stage. In such a case, counting two measures overstates the surge in
protection – the proper count should be one measure at each stage (but the measure is
different).
That said, there is a more substantial reason for such a wide range of opinions, i.e.,
there has been no serious debate on the benchmark to be used for qualifying a possible
“slippage” to protection.
A first possible benchmark would be the complete absence of new protectionist
measures. Supporters of such a choice invoke the Washington and London G20
communiqués which say: “We [...] reaffirm our commitment to fight all forms (author’s
emphasis) of protectionism, and to reach an ambitious and balanced conclusion to the Doha
Development Round” (London Summit communiqué).
Such a benchmark is clearly too stringent. It is doubtful that it reflects the true state
of the G20 leaders’ minds who, as shrewd politicians, are well aware that they should put
some “oil in the gears” if they want to avoid serious political clashes at home.
Such a benchmark is not even consistent with the traditional GATT-WTO approach,
which has recognized political constraints since the naissance of GATT, as best illustrated
by Article XIX on safeguards or Article XVIIIB on balance of payments in the GATT text.
Finally, such a benchmark makes it difficult to take fully into account liberalization measures,
hence it is at odds with the economic analysis that gives relative prices (prices of exports
and imports) the key role.
Another (etter to the author’s view) benchmark would be an indicator of the changes
in trade barriers “routinely” implemented every year in the recent past, and to assess the
extent to which changes in trade barriers occurring in the ongoing crisis have deviated from
this “routine” indicator.
Peru 30.0 9.7 20.3 – –
Kuwait 100.0 4.7 95.3 – –
Bangladesh 34.4 14.2 20.2 – –
All Section B 27.6 7.9 19.7
Sources: World Trade Organization Trade Profiles (April 2008) and The Economist, 26 September2009.
Note: – Information unavailable.a Difference between the average bound tariff and the average applied tariff (average “tariffwater”).b Percentage change on a year ago, second quarter 2009, except if specified.c Percentage change on previous quarter, annual rate.d For growth rate figures, eurozone.
Table 1. (continued)
Industrial tariffsAverage GDP GDP
WTO Simple averagetariff growth growth
members Bound Appliedwatera rateb ratec
tariff (%) tariff (%)
12
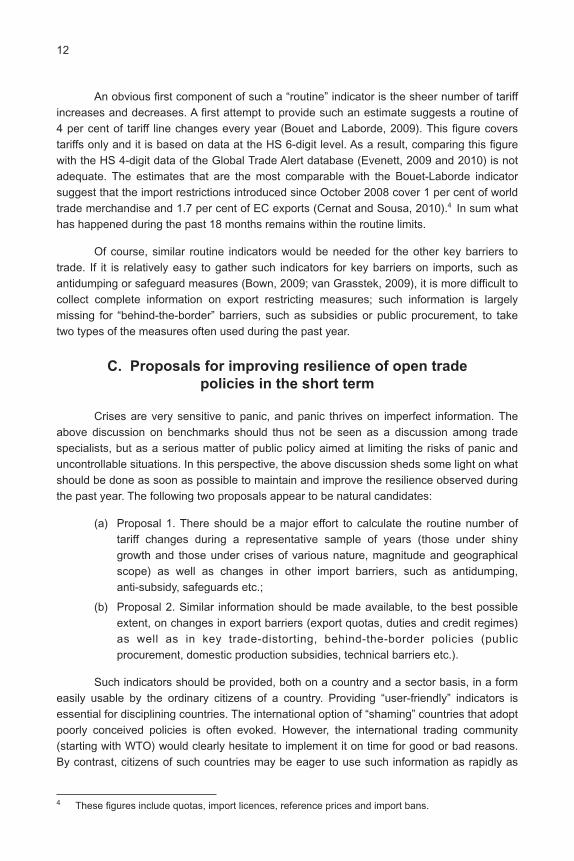
An obvious first component of such a “routine” indicator is the sheer number of tariff
increases and decreases. A first attempt to provide such an estimate suggests a routine of
4 per cent of tariff line changes every year (Bouet and Laborde, 2009). This figure covers
tariffs only and it is based on data at the HS 6-digit level. As a result, comparing this figure
with the HS 4-digit data of the Global Trade Alert database (Evenett, 2009 and 2010) is not
adequate. The estimates that are the most comparable with the Bouet-Laborde indicator
suggest that the import restrictions introduced since October 2008 cover 1 per cent of world
trade merchandise and 1.7 per cent of EC exports (Cernat and Sousa, 2010).4 In sum what
has happened during the past 18 months remains within the routine limits.
Of course, similar routine indicators would be needed for the other key barriers to
trade. If it is relatively easy to gather such indicators for key barriers on imports, such as
antidumping or safeguard measures (Bown, 2009; van Grasstek, 2009), it is more difficult to
collect complete information on export restricting measures; such information is largely
missing for “behind-the-border” barriers, such as subsidies or public procurement, to take
two types of the measures often used during the past year.
C. Proposals for improving resilience of open tradepolicies in the short term
Crises are very sensitive to panic, and panic thrives on imperfect information. The
above discussion on benchmarks should thus not be seen as a discussion among trade
specialists, but as a serious matter of public policy aimed at limiting the risks of panic and
uncontrollable situations. In this perspective, the above discussion sheds some light on what
should be done as soon as possible to maintain and improve the resilience observed during
the past year. The following two proposals appear to be natural candidates:
(a) Proposal 1. There should be a major effort to calculate the routine number of
tariff changes during a representative sample of years (those under shiny
growth and those under crises of various nature, magnitude and geographical
scope) as well as changes in other import barriers, such as antidumping,
anti-subsidy, safeguards etc.;
(b) Proposal 2. Similar information should be made available, to the best possible
extent, on changes in export barriers (export quotas, duties and credit regimes)
as well as in key trade-distorting, behind-the-border policies (public
procurement, domestic production subsidies, technical barriers etc.).
Such indicators should be provided, both on a country and a sector basis, in a form
easily usable by the ordinary citizens of a country. Providing “user-friendly” indicators is
essential for disciplining countries. The international option of “shaming” countries that adopt
poorly conceived policies is often evoked. However, the international trading community
(starting with WTO) would clearly hesitate to implement it on time for good or bad reasons.
By contrast, citizens of such countries may be eager to use such information as rapidly as
4 These figures include quotas, import licences, reference prices and import bans.

13
possible, in order to stimulate a better informed public debate on the policy of their own
country.
Proposals based on counting measures are clearly insufficient (they could even be
misguiding in some cases, as argued below in the case of antidumping). It is thus
indispensable to get a “quick” economic assessment of the trade barriers introduced. At first
glance, such a task appears vast and thus out of reach. However, the situation is not so bad
for two reasons:
(a) There is no reason to undertake such a task for the whole universe of trade
barriers. Only a few key barriers need to be monitored with special care
because they are likely to be the first and/or most used components of
a protectionist wave. The best illustrations are antidumping, safeguards or
(direct and indirect) production subsidies;
(b) Some crude criteria could be developed for a rapid assessment of the
harmfulness of those instruments put under “special” scrutiny. For example,
antidumping cases aim at fragmenting world markets and at establishing
collusive markets that would normally be competitive. Some new antidumping
cases in products close to cases lodged during the past 20 or 30 years may
mostly be aimed at ensuring that the downturn will not induce firms to breach
the existing collusive agreements – in short, that the cartel-like disciplines
generated by the previous antidumping measures will not collapse. They
simply reveal the true practices that were going on, quietly and behind the
scenes, before the crisis. The extent to which such “new” antidumping cases
cause notable deterioration of the situation existing in such markets is thus
questionable – this is a case where a mere counting could create devastating
panic under the form of a race in antidumping actions. The truly worrisome
sign of increased protection would be a spreading of antidumping cases to
goods never involved in past antidumping complaints. Only such cases would
deserve “special” scrutiny.
The above discussion therefore suggests two more proposals:
(a) Proposal 3. Establish a list of crucial trade barriers – those which have the
highest likelihood of generating wide (e.g., recent safeguard measures tend to
have a large product coverage) and/or long-term (e.g., antidumping measures,
once adopted, tend to last long) distortions for the ongoing crisis;
(b) Proposal 4. Develop crude but fast techniques aimed at splitting the trade
barriers being monitored into those expanding protection and collusive
behaviour into new products and those “merely” re-enforcing existing protection
and collusion.
The list of trade barriers to be put under special scrutiny cannot be decided once
and for all because trade barriers are substitutable with each other to some extent. Hence,
such a list may evolve over time, even during the same crisis. For example, at the beginning
of the current crisis, many observers believed that tariff increases were the indicator to

14
scrutinize carefully. However, subsidies and public procurement have played a much bigger
role in spreading the impression of a surge in protection. Such a role may vanish in the
coming years – subsidies may be much less fashionable when the Treasuries face
increasing budgetary constraints.
The tasks required by the four proposals above require skills and means that are not
available in one international institution. For tariffs and import quotas, WTO clearly has the
expertise as well as access to the required information. It may also be the case for export
quotas and duties, if the practice and/or legal language of WTO concerning these
instruments are strengthened. However, WTO has no expertise in export restrictions and
credit regimes, export or production subsidies, or public procurement, unlike the World
Bank, the International Monetary Fund, the Organisation for Economic Co-operation and
Development (OECD), the Bern Union of Export-Import agencies (and perhaps the Bank of
International Settlements in the case of the financial sector), for example.
This is where efficient post-Pittsburgh G20 Summits could change the situation
dramatically. Previously, no international institution was capable of deciding to undertake
such tasks in an efficient way. As a result, no initiative was taken, or the most affordable
initiatives were taken by several institutions generating useless duplications. Since
Pittsburgh, it has become possible for the G20 (or an ad hoc G20 subcommittee) to make
such decisions, and to assign the tasks among the various available international institutions
based on their skills, capacities and access to information (while ensuring that the
institutions properly carry out their tasks).
D. Facing the “iron law of thin majorities”
Exit is often the most dangerous phase of a crisis because it is the time when the
pains and gains accumulated during the recession are netted out, making fully visible the
stark contrast between net losers and winners, hence generating long-term bitterness. Such
a phase may be difficult even in countries where growth has been severely cut for only
a few months. The long-term impact of brutal short-term decelerations is difficult to assess.
It could be substantial in economic terms. One key lesson from the Japanese “Lost Decade”
(Kaji, 2009) is that a great crisis generates relatively rapidly a severe attrition of competition
in certain markets for goods and services, as may already be the case in financial services.
The long-term impact of brutal short-term decelerations could also be substantial in political
terms. Bitter memories of what happened may fuel a loss of confidence in market efficiency,
generating a political establishment more wary of open trade and, more generally, markets.
As of today, macroeconomic analysts expect that the the United States – the largest
badly-hit economy – will be back on its “potential GDP” growth path in a few years from now,
probably around 2014 (Pisani, 2009). If correct, this simulation implies that all the next key
elections in the largest industrial democracies (French and United States Presidents, and
German, Japanese and United States Parliaments) will occur before the end of the recovery
– hence possibly while they are still under serious political stress. The exact intensity of
such stress will depend of the path of the recovery; will it be V-, U- or W-shaped? The most
frequent scenario appears to be a W-shaped curve (a recovery followed by a smaller
15
downturn, before the final recovery), which could be very stressful from a political point of
view because such a double-dip could again damage the return to confidence.
This scenario deserves an important remark Concerning the fact that the pre-crisis
situation is taken as the benchmark. Strictly speaking, this is incorrect because the potential
gross domestic product (GDP) path before the crisis was “doped” by the financial excesses
of the late 1990s and 2000s, compared to what would have occurred in a “normal” world.
However, calculating a “financial excesses-adjusted” potential GDP path is far beyond our
capacity, meaning that we have to live with this error as an unavoidable additional cost of
the excesses of the past decade or so.
The same observation should be made from a trade policy perspective. The financial
excesses of the 1990s have generated huge distortions in markets, inflating some sectors at
the expense of the others. During those years, few observers paid attention to such
distortions and their discriminatory impact on trade flows. For example, exports of sports
utility vehicles expanded to the detriment of exports of smaller cars, making some countries
more successful (and others less successful) than they would have been with prices and
incomes less “doped” by financial excesses.
Unfortunately, as in macroeconomic matters, it seems impossible to create the
“counterfactual” of financial excesses-free economies. However, trade analysts should at
least be very careful when evoking trade-related discrimination based on the situation
prevailing a year ago. For example, the strong decline in the demand for large cars since
late 2008 is not entirely discriminatory – it simply reflects a move towards a healthier
situation, which should have prevailed years ago. This point is important to keep in mind if
only because the manufacturers of large cars will certainly argue that the recent evolution is
entirely discriminatory, and thus possibly ask for countervailing protectionist measures.
That said, waiting until 2014 for the return to normality makes the “iron law of thin
majorities” a tough constraint. This law reflects the observed fact that, since the late 1980s,
all the industrial democracies happen to have shared the same political trend – increasingly
thin majorities support the elected governments, independently from the political colour
(Messerlin, 2007). Whatever the reasons are for such a similar evolution, the final result is
that narrowly elected governments are very likely to be weaker due to resisting lobbies than
they were before the 1990s.
The “iron law” has two dimensions. First, increasingly tiny lobbies may succeed
where they would have failed 20 years ago, a possible explanation of the difficulties to
achieve success in the Doha Round in July 2008. Second, the time during which
governments could successfully resist pressure groups may be shorter – a dimension highly
relevant to the topic of this chapter since it endangers the long-term resilience of trade
policies to large-scale crises.
That said, two lessons could be drawn from the “iron law”. First, waiting for “better”
times (stronger majorities) may be illusory. For example, the current United States Congress
may be hostile to, or uninterested in, trade issues. Yet, if the “iron law” continues to be
verified, any hope that the 2012 United States election could change the situation is illusory

16
because it will deliver another tiny majority only slightly less hostile to, or uninterested in,
trade matters. In short, procrastination is not an option – a key point to keep in mind when
looking at the G20 role.
The second lesson to be drawn from the “iron law of thin majorities” is that one
should be very careful when designing medium- or long-term initiatives. There is a need to
choose initiatives that require the lowest amount of political capital, since such capital is
limited. Of course, such a conclusion applies to initiatives to be tabled at the G20 Summit,
as well as to those initiatives to be tabled in WTO or other trade-related international forums.
In short, agility and flexibility should be the driving force of the initiatives to be taken.
E. Stricter international disciplines and robust domesticinstitutions: A key balance
This section examines the initiatives that would have the best chance of enhancing
the long-term resilience of the world trade regime to large-scale economic crises. It starts
from the observation that there is currently a tendency to overinvest in stricter international
disciplines and to underinvest in robust domestic institutions that appear critical to effective
enforcement of strict international disciplines. Indeed, the current crisis provides some
evidence that (a) large-scale economic crises can easily circumvent or wipe out international
disciplines conceived during a quieter period (often many years before the crisis erupts),
and (b) international institutions are robust only as long as they can rely on the support of
robust domestic institutions.
This section assumes that large-scale economic crises are infrequent (e.g.,
occurring once every two to three decades). This assumption is important because it gives
a timespan that is long enough to find the best balance between designing stricter
disciplines (enough time to agree on disciplines more substantive than those existing today)
and building robust domestic institutions (enough time to design them and for them to
establish their reputation).
1. Designing stricter disciplines
The current crisis has witnessed the proposal of many stricter disciplines to be
implemented in case of large-scale economic crises. For example, Dhar and others (2009)
tabled a protocol organized into five sections (general principles, non-discrimination,
standstill, subsidies and technical barriers to trade) and laid out 28 specific commitments.
These commitments would be signed only by the G20 members (although non-G20
members could join them), and they would be “exceptional” to the extent that they would
lapse after a predetermined number of years (e.g., two years).
Subsidies offer a good example for discussing such proposals. Since mid-2008,
industrial countries and the richest emerging economies have granted huge subsidies to the
banking and car manufacturing sectors. The recent evolution of these subsidies is unclear.
While some banks are speeding up reimbursement of the subsidies they received, a notable
share of subsidies (public guarantees to banks and production subsidies to carmakers) is

17
currently being extended to next year, despite increasingly distressed public budgets. As all
the subsidizing countries are signatories of the Subsidy and Countervailing Measures
(SCM) Agreement of the Uruguay Round, does that mean that a stricter SCM WTO
Agreement should be negotiated?
The current situation in the EC offers a compelling illustration of the fact that
a stricter SCM Agreement is not sufficient. The EC has a system of notifications,
transparency and standstill disciplines for subsidies that is so precise and binding, and so
strongly linked to the core competition provisions of the Treaty establishing the EC, that it is
hard to believe that a similar agreement could ever be achieved at the world level during the
next 30 years. Despite such a legal arsenal, EC anti-subsidy disciplines have been
extremely disappointing during the past year. Subsidies to carmakers and banks were
routinely notified by the EC Member States (ECMS). However, there is no clear indication
that, during the examination of the notified subsidies by the Commission, significant
changes have been requested by the Commission and introduced in the initial packages
tabled by ECMS. In addition, the whole mechanism ended up with a blanket acceptance by
the European Commission of almost all the notified subsidies. It is only very recently that the
then-Competition Commissioner began to show some willingness to block mergers and to
require rescued banks to restructure (International Herald Tribune, 17 October 2009).
How can we explain that the already well-oiled, relatively successful EC anti-subsidy
mechanism did not “bite” after the few first months of the ongoing crisis (i.e., after allowing
some time for assessing the extent of the damage)? A first possible explanation is that these
subsidies are ultimately not so discriminatory, thus inducing the Commission to estimate that
the political costs of fighting subsidies would exceed the economic benefits of eliminating
them. There may be some truth in this argument. For example, in late 2008, all those ECMS
producing cars granted subsidies for scrapping old cars (“cash for clunkers”). If such
subsidies were officially granted for greening the stock of cars in ECMS, they were above all
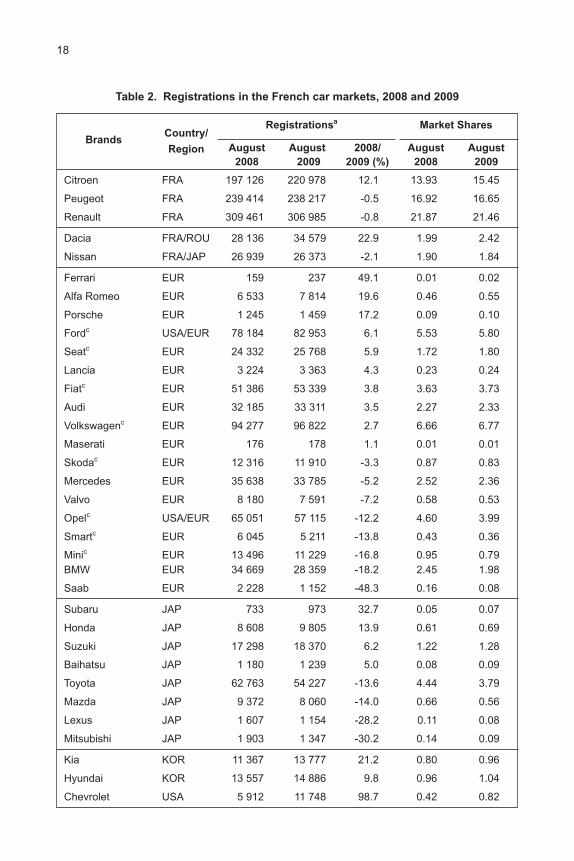
adopted for boosting the sales of new cars.5 Available evidence on recent car registrations
does not suggest strong distortionary effects within the car sector in the short term. Table 2
suggests that the shares of domestically-made and foreign-made cars sold in the French
market during the first eight months of 2008 and the first eight months of 2009 were
relatively similar for similar brands. For example, the European brands of non-luxury cars
closest to Renault and Peugot products exhibited similar performances. The deepest
changes during that period involved carmakers that were unfashionable before the crisis,
and attractive subsequently – such as Dacia in the low-end range, or the Republic of
Korea’s brands in the middle-high range. Carmakers (from Japan and Germany) producing
sophisticated cars that fitted in well with the pre-crisis conditions suffered the most – an
evolution that is evident for all industrial products (Freire and Mikic, 2009).
However, the “non-discriminatory” impact of subsidies is likely to be limited to two
key aspects. First, even if subsidies for greener cars do not introduce a massive
discrimination in car markets, they definitively distort the demand for cars relative to the
5 In fact, many old and delapitated vehicles are still being run, including in their countries of origin,
because the subsidy schemes have often been badly designed, as best illustrated by Germany.
18
Table 2. Registrations in the French car markets, 2008 and 2009
Registrationsa Market Shares
BrandsCountry/
Region August August 2008/ August August
2008 2009 2009 (%) 2008 2009
Citroen FRA 197 126 220 978 12.1 13.93 15.45
Peugeot FRA 239 414 238 217 -0.5 16.92 16.65
Renault FRA 309 461 306 985 -0.8 21.87 21.46
Dacia FRA/ROU 28 136 34 579 22.9 1.99 2.42
Nissan FRA/JAP 26 939 26 373 -2.1 1.90 1.84
Ferrari EUR 159 237 49.1 0.01 0.02
Alfa Romeo EUR 6 533 7 814 19.6 0.46 0.55
Porsche EUR 1 245 1 459 17.2 0.09 0.10
Fordc USA/EUR 78 184 82 953 6.1 5.53 5.80
Seatc EUR 24 332 25 768 5.9 1.72 1.80
Lancia EUR 3 224 3 363 4.3 0.23 0.24
Fiatc EUR 51 386 53 339 3.8 3.63 3.73
Audi EUR 32 185 33 311 3.5 2.27 2.33
Volkswagenc EUR 94 277 96 822 2.7 6.66 6.77
Maserati EUR 176 178 1.1 0.01 0.01
Skodac EUR 12 316 11 910 -3.3 0.87 0.83
Mercedes EUR 35 638 33 785 -5.2 2.52 2.36
Valvo EUR 8 180 7 591 -7.2 0.58 0.53
Opelc USA/EUR 65 051 57 115 -12.2 4.60 3.99
Smartc EUR 6 045 5 211 -13.8 0.43 0.36
Minic EUR 13 496 11 229 -16.8 0.95 0.79
BMW EUR 34 669 28 359 -18.2 2.45 1.98
Saab EUR 2 228 1 152 -48.3 0.16 0.08
Subaru JAP 733 973 32.7 0.05 0.07
Honda JAP 8 608 9 805 13.9 0.61 0.69
Suzuki JAP 17 298 18 370 6.2 1.22 1.28
Baihatsu JAP 1 180 1 239 5.0 0.08 0.09
Toyota JAP 62 763 54 227 -13.6 4.44 3.79
Mazda JAP 9 372 8 060 -14.0 0.66 0.56
Lexus JAP 1 607 1 154 -28.2 0.11 0.08
Mitsubishi JAP 1 903 1 347 -30.2 0.14 0.09
Kia KOR 11 367 13 777 21.2 0.80 0.96
Hyundai KOR 13 557 14 886 9.8 0.96 1.04
Chevrolet USA 5 912 11 748 98.7 0.42 0.82

19
demand for other goods and services – the global demand for cars has been achieved to
the detriment of current or future demand for other goods and services. Second, it is
doubtful that long-lasting subsidies would have no discriminatory impact in the long-term.
For these reasons, one would have expected the Commission to at least have paved
the way for a progressive removal of the subsidies to such key sectors. For example, it
could have tabled guidelines – following a tradition dating back to the 1970s and 1980s,
which were marked by the huge excess capacities in steel production or shipbuilding. The
very long silence of the Commission raises serious questions about the robustness of
international institutions that would be in charge of implementing stricter disciplines at the
global level.
2. Building robust national institutions
How then to ensure effective enforcement of stricter international disciplines during
large-scale economic crises? The European subsidies case is interesting because it shows
that international institutions – even with executive power and a long record, such as that of
the European Commission – are not sufficient.
Two reasons may explain the Commission’s inertia. First is the Commission’s desire
to behave as a government. This is an unfortunate deviation from the Commission’s core
mandate, which is to “ensure that the provisions of this Treaty and the measures taken by
Jaguar IND 1 207 812 -32.7 0.09 0.06
Land Rover IND 2 308 1 334 -42.2 0.16 0.09
Dodge USA 1 808 1 038 -42.6 0.13 0.07
Jeep USA 1 792 835 -53.4 0.13 0.06
Chrysler USA 2 008 801 -60.1 0.14 0.06
Lada RUS/FRA 124 28 -774 0.01 0.00
Cadillac USA 66 10 -84.8 0.00 0.00
French brandsb 746 001 766 180 2.7 52.73 53.56
Non-lux. EuR brandsc 345 088 344 347 -0.2 24.39 24.07
Japanese brands 103 491 95 175 -8.0 7.31 6.65
Korean brands 24 925 28 663 15.0 1.76 2.00
Total 1 414 828 1 430 391 1.1 100.00 100.00
Source: Comité des constructeurs français d’automobiles.a First eight months of 2008 and 2009.b Citroen, Peugeot and Renault.c Non-luxury European brands.
Table 2. (continued)
Registrationsa Market Shares
BrandsCountry/
Region August August 2008/ August August2008 2009 2009 (%) 2008 2009

20
the institutions pursuant thereto are applied, and formulate recommendations or deliver
opinions on matters dealt with in this Treaty, if it expressly so provides or if the Commission
considers it necessary” (Article 211 of the Treaty of Nice).6 Second, and more importantly,
the Commission has no strong institutional support in ECMS. Such an absence of domestic
support at the ECMS level makes it politically almost impossible to launch of economically
sound debates on ECMS subsidies concerned during difficult periods – preventing any
action by the Commission.
This discussion leaves two options. First is giving up about any willingness to design
stricter international disciplines and to rely, as is currently the case, on “light” disciplines with
international institutions by being merely the host of negotiations on cooperative solutions to
reduce and eliminate discriminatory measures. This “light” option requires a decision to
launch negotiations and an assignment procedure (concerning which institution will be
asked to host the negotiations). After the Pittsburgh Summit, the G20 is clearly the forum in
which to take the decision to launch negotiations. Then the G20 could either directly assign
an institution to undertake the task, or it could charge WTO to act as its “dispatching”
(assigning) arm to the extent that the issues at stake are trade-related. For example, in the
case of subsidies in the car manufacturing sector, a candidate institution to host negotiations
first on netting out subsidies, then on progressive cuts of the remaining subsidies, would be
the OECD Secretariat, which was the forum for a similar exercise on subsidies in steel and
shipbuilding during the 1970s and 1980s. An alternative would be an ad hoc subcommittee
set up by the G20.
The second option would be to design stricter disciplines and to ensure that
international institutions would be robust enough. The European case suggests that this
second condition requires the existence of robust domestic institutions that would buttress
the international institutions in the front line.
Is there a blueprint for such domestic institutions? The Australian Productivity
Commission (APC) appears to be an attractive model. Its mandate is to be an “independent
research and advisory body on a range of economic, social and environmental issues
affecting the welfare of Australians” (APC website). This mandate looks promising for the
same two reasons that make the European Commission a disappointing institution. First,
independence is ensured at no cost in terms of executive power (APC is an advisory body).
In other words, APC is not preoccupied with attending to the most urgent things first
(behaving as a government). However, this independence is not without a price – the
influence of an APC-type institution is not instantaneous. Rather, it flows from its capacity,
year after year, to deal with difficult issues by collecting the appropriate information,
providing a sound economic analysis, and disseminating both via numerous hearings
involving all parties – in short, from its capacity to build, over the years, a strong reputation
to offer good solutions. All these features make APC-type institutions quite different from
competition authorities. Indeed, it is remarkable that no ECMS competition authority has
6 The Lisbon Treaty makes no mention of delivering opinions. Article 9D1 simply states that “the
Commission shall promote the general interest of the Union and take appropriate initiatives to that end”
before listing its coordinating, executive and management functions.

21
raised a strong voice in favour of disciplining the subsidies granted since mid-2008, and that
Australia has a very active competition authority apart from APC.
The second key – and by far the most important – feature of the APC mandate is
that the APC goal is the “welfare of Australians”, which includes not only producers but also
consumers and tax-payers, thus allowing APC to take the widest possible economic
perspectives. Such a feature gives APC-type domestic institutions two key additional virtues.
First, it makes them are very sensitive to the risk of attrition from competition in the markets
of many goods and services often generated by deep crises (as amply shown by the
Japanese “Lost Decade”). Second, it may allow reliance on such institutions in taking some
risks in the world trade regime and in WTO – for example, when opening or reopening the
difficult negotiations on rules on contingent protection (particularly safeguards).
Therefore, adopting stricter international disciplines with some chance of enforcing
them during harsh times requires building robust domestic institutions such as APC. It is
conceivable that each WTO member could create its own APC. However, that is not
necessary. What counts for the resilience of the world trade regime is that the G20 members
be equipped with such institutions (of course, this should not prevent smaller countries from
also creating such an institution).
F. Conclusion – Doha Round, post-Doha agenda and G20
The G20 Pittsburgh Summit sticks to the official line of “we will fight protectionism
[and] we are committed to bringing the Doha Round to a successful conclusion in 2010.”
However, the tone is definitively softer – there is no emphatic reference to fight “all forms” of
protectionism. Such language is unlikely to boost the already low moral of the trade
negotiators in Geneva.
Paradoxically, the current crisis may have made the Doha Round easier. During the
past year, the largest emerging economies have revealed their willingness and capacity not
to increase their applied tariffs in difficult times – that is, not to use their WTO rights to
increase applied tariffs up to their much higher bound tariffs.
Such a revealed preference may dramatically change the background environment
of the Doha negotiations. It should induce the emerging economies to abandon their claim
that they make huge concessions when cutting their bound tariffs (they are currently
showing that they do that for their own good) and instead accept a limit on their requests for
exceptions to such cuts. Symmetrically, it should induce the developed countries to abandon
their claim for “effective market access” (meaning cuts in the tariffs applied by the emerging
economies) if they do not want a definitive collapse of the Doha Round – facing for ever the
risk of high bound tariffs in the emerging economies and losing the huge opportunities in
services liberalization. In other words, both camps have to accept their responsibilities.
In any event, concluding the Doha Round in 2010 or 2011 remains a serious
challenge. The Republic of Korea – the G20 Chair in 2010 thus have the critical role toof
generating momentum. Such a goal would require the G20 to move on three fronts.

22
1. Mobilize trade negotiators
First, it would be important to mobilize trade negotiators’ energy on the proposals
suggested in section C – getting a better sense of the trade-related measures routinely
taken during “normal” years as well as the potential impact of the most dangerous forms of
protection. The exit phase of a large-scale crisis is perilous, and it has the capacity to cause
severe damage to the resilience of trade policies. Avoiding confusion – hence fear, the
greatest cause of all panic – in the coming months requires a better assessment of the level
of resilience achieved in the coming months and years.
As of today, such benchmarks do not exist. However, WTO only has the capacity to
generate these benchmarks for import barriers. The G20 should thus designate the
international institutions capable of providing the benchmarks for barriers on exports as well
as for key “behind-the-borders” barriers, such as public procurement, subsidies etc. Rather
than directly designating the other institutions, the G20 could ask WTO to “dispatch” the task
of providing the benchmarks to other appropriate institutions (OECD, UNCTAD, World Bank,
export-import agencies etc.).
2. Mobilize the business community
Second, it is important to mobilize the energy of the business community in
supporting open markets. In this regard, goods do not offer very attractive opportunities to
the business community in the long term for several reasons. Applied industrial tariffs in the
25 or so largest economies are already low or moderate. Binding them and cutting the
remaining tariff peaks will be the important goal to achieve through the Doha Round.
However, that also means the gains from negotiations in manufacturing after a successful
Doha Round will be largely limited to the small developing economies – crucial result for
those countries, but only of marginal importance to the largest economies. Tariffs in farm
and food products will remain substantial in most countries after a successful Doha Round.
However, huge pressure to further liberalize agricultural trade will come from climate
change, water scarcity and energy substitution giving a new raison d’être for tariff cuts in
agriculture as a key tool for fighting climate-driven hunger and avoiding water-driven
conflicts.
Services can attract the support of the business community much more than any
other conceivable trade-related issues such as intellectual property rights, norms, non-tariff
barriers, public procurement, rules etc. They are the largest source of opportunities for firms
for three reasons: their sheer size (50 to 75 per cent of countries’ GDP), their ubiquitous
presence (even the manufacturing or agrobusiness firms have a significant share – often
about 50 per cent – of their turnover in services) and their high level of protection, as
services enjoy, on average, twice as much protection than that given to goods (Shepherd
and Miroudot, 2009). Services liberalization will translate these opportunities into vast gains
for consumers all over the world.
As this stage, the Doha negotiators can do very little in services for two reasons.
They have imposed on themselves a sequencing of negotiations – getting results in
agriculture and NAMA before starting to look at services – thereby shuting themselves out.

23
More permanently, the huge and heterogeneous WTO membership is not well suited to
negotiations in services that deal with regulations, and thus are much more complex than
negotiations on tariffs.
As a result, there would be no harm in starting exploratory talks on services outside
WTO, then continuing them in WTO if they are promising (Messerlin and van der Marel,
2009). Such talks should be limited to the largest economies (aprroximately 10, including
the EC) – a group small enough to keep negotiations manageable and large enough to
cover more than 80 per cent of world production in services. One initial possibility would be
for the two largest world economies, the United States and the EC, to explore the option of
bilateral talks on services in order to gain a better idea of the expected gains for consumers
and opportunities for services providers. Such talks have interesting “dynamics”; it would be
relatively cost-free and highly beneficial to extend them to eight countries in order to cover
more than 80 per cent of world production in services. Furthermore, extending transatlantic
talks to those eight countries would greatly reduce the risk of trade distortions.
The transatlantic option is not the only one available. Alternatives could be
a transpacific (APEC) or a Eurasian dialogue. All these options are open, because once one
of these dialogues is launched the above-mentioned dynamic forces will induce the
non-participating largest economies to join the talks – the EC, the United States and the
group of the eight other countries have more or less the same share in most services, and
no interest in being excluded from the exploratory talks.
Since these ten economies are all G20 members, the G20 is the natural forum in
which to facilitate such talks. The G20 could even set up an informal committee to start such
talks immediately at the G20 level. If promising, the results of the talks could (and, ideally,
should) then be included in the Doha negotiations and constitute the embryo of a Doha
agreement in services. That would give the Doha Round the critical boost that was missing
in July 2008.
3. Mobilize robust domestic institutions
The “iron law of thin majorities” is a permanent threat to the open world trade regime
and WTO. Such a challenge can be dealt with in two different but complementary ways.
First, WTO should be “flex-plined”, that is, made as flexible as possible while
keeping its full role as a rule-maker (non-discrimination) and rule-guardian (dispute
settlement) (Messerlin 2007). There are many possible sources of flexibility in WTO. The
most important is undoubtedly a re-interpretation of the “Single Undertaking” notion (“every
WTO member shall sign all the agreements negotiated during a round”). Ten years later,
such a strict interpretation is backfiring. It has fuelled a process of de facto systemic evasion
of the WTO negotiations, with groups of WTO members getting exemptions from various
obligations (“negative coalitions”) under various pretexts such as they are small or
vulnerable, net food importers, recent WTO members etc. The alternative interpretation
would be to make the “Single Undertaking” enforceable at future times, not at every Round.
Within a period with no “Single Undertaking”, the negotiation process would allow members
to “discriminate positively”, that is, to open their markets further by participating in plurilateral
agreements without waiting for an agreement among all members.

24
Indeed, the crisis and a successful Doha outcome exert convergent pressures for
“flex-plining” WTO. The current business of WTO as the key negotiating forum on tariff cuts
in goods will be much smaller – it is “death by success”. WTO is unlikely to be such a forum
for services because of the complexity of services negotiations. However, it will remain the
ultimate world forum for binding market access in goods and services if it is made more
flexible (see above). In contrast, WTO may increase its role as “rule-maker/guardian” by
improving its dispute settlement mechanism, and by becoming an effective monitor of the
world trade regime, a “dispatcher” on behalf of the G20 of tasks to be undertaken in trade
matters by other international institutions as well as a repository of stricter international
disciplines.
The second way to deal with the “iron law of thin majorities” would consist of
a serious effort to strengthen the national foundations of the world trade regime and WTO.
GATT was a “light” body in terms of commitments and disciplines. WTO is more demanding
to the point that many obligations are routinely ignored or bungled by its members, as
illustrated by its many monitoring obligations rarely fulfilled on time or even fulfilled at all.
As a result, seeking stricter disciplines for facing future large-scale economic crises
could be a dangerous illusion. It runs the high risk that the disciplines will not be enforced
precisely when it becomes time to use them. What is needed are domestic institutions that
are robust enough to invest their reputation in their own country by supporting the stricter
disciplines desirable at the world level. An illustration of such an institution is APC, with its
two main features – independence (requiring the absence of executive power and the focus
on analyses, debates and persuasion) and a mandate focusing on the “welfare of all the
people living in the country”. Such institutions are also well-equipped to make adequate
impact assessments of future national laws and regulations – a feature that is crucial when
topics tabled at negotiations include services or norms.
4. Final remarks
The crisis has put the G20 at the heart of the world trade regime, but the page is still
blank. Much will depend on the initiatives to be taken by the Republic of Korea (as the G20
Chair in 2010, the co-host of the G20 Summit in June 2010 and the host of the G20 Summit
in November 2010).
The Republic of Korea and Canada are well suited to the huge task awaiting them.
They are enjoying a rapid recovery, are strong supporters of the world trade regime and
WTO, and have the best records in terms of the resilience of their trade policies among the
G20 members.
Last but not least, both countries share a very valuable advantage. They are among
the 10 largest economies (including the EC as one) but not among the “big elephants”. This
feature allows the Republic of Korea and Canada to table bold proposals without attracting
the suspicion that the same proposals would attract if tabled by one of the “big elephants”.
The long history of the international trade negotiations shows how decisive bold initiatives
can be when taken by such countries.
25
References
Bown, C. (2009). “The pattern of antidumping and other types of contingent protection”,
World Bank PREM Notes No. 144, 21 October 2009,. Washington, D.C.
Bouet A. and D. Laborde (2009). “The potential cost of a failed Doha Round”, Discussion
Paper No. 00886, International Food Policy Research Institute, Washington, D.C.
Cernat, L. and N. Sousa (2010). “The impact of crisis-driven protectionism on EU exports:
The ‘Russian doll’ effect”, VoxEU.org. Accessed at www.voxeu.org/
index.php?q=node/4464.
Dhar, B., S. Evenett, G. Long, A-M. Nassar, S. Tangermann and A. Trejos (2009).
“Disavowing protectionism: A strengthened G20 standstill and surveillance”
(mimeograph). The Graduate Institute, Geneva.
Eichengreen, B. and D. Irwin (2009). “The slide to protectionism in the Great Depression:
Who succumbed and why?” National Bureau of Economic Research Working Paper
No. 15142. Massachussetts.
Evenett, S. (2010). “The prospects for the world trading system in 2010”, paper presented at
the Jeddah Economic Forum.
(2009). “What can be learned from crisis-era protectionism? An initial assessment”,
Business and Politics. October 2009.
Freire, C. and M. Mikic (2009). “Export performance in the aftermath of global economic
crisis”, paper presented at the ARTNeT Conference on “Trade-led growth in times of
crisis”, 2-3 November 2009 (mimeograph). ESCAP, Bangkok.
Kaji, S. (2009). “Déjà vu? Japan’s financial crisis revisited”. Groupe d’Economie Mondiale at
Sciences Po (GEM), Paris. Accessed at http://gem.sciences-po.fr.
Messerlin, P. (2009). “A significant slippage in protectionism? Not yet”, in S. Evenett,
B. Hoekman and O. Cattaneo (eds.), Effective Crisis Response and Openness:
Implications for the Trading System. Centre for Economic Policy Research, London,
and World Bank, Washington, D.C.
(2007). “Reviving the Doha Round: The agenda for the developed countries”, in
B. Blonigen (ed.), “Monitoring Trade Policy: A New Agenda for Reviving the Doha
Round”. Centre for Economic Policy Research, London, and Kiel Institute for the
World Economy, Kiel, Germany.
Messerlin, P. and E. van der Marel (2009). “Leading with services: The dynamics of
transatlantic negotiations in services”, Working Paper, Groupe d’Economie Mondiale
at Sciences Po (GEM), Paris. Accessed at http://gem.sciences-po.fr.
Pisani, F. (2009). “L’économie américaine après le choc”. CEPII, Paris.
Shepherd, B. and S. Miroudot (2009). “Leveraging in services to consolidate the global
economic recovery: An agenda for the G20”. Groupe d’Economie Mondiale at
Sciences Po (GEM), Paris. Accessed at http://gem.sciences-po.fr.

26
van Grasstek, C. (2009). “The short- and long-run declines in the supply and demand for
U.S. trade policy”, Powerpoint presentation. University of Toronto.
World Trade Organization (2009). Report to the TPRB from the Director-General on the
financial and economic crisis and trade-related developments. Washington, D.C.
WTO-OECD-UNCTAD (2010). Report on G20 trade and investment measures, 8 March
2010. Geneva.
(2009). Report on G20 trade and investment measures, 14 September 2009.
Geneva.