Trade in Services Negotiations - ICTSD · of a project focused on leveraging services to drive...
64
Trade in Services Negotiations: A Southern African Perspective Inclusive Economic Transformation May 2017 | Nicolette Cattaneo Issue Paper
Transcript of Trade in Services Negotiations - ICTSD · of a project focused on leveraging services to drive...
Trade in Services Negotiations:A Southern African Perspective
Inclusive Economic TransformationMay 2017 |
Nicolette Cattaneo
Issue Paper

l Inclusive Economic Transformation
Trade in Services Negotiations:
A Southern African Perspective
Issue Paper
May 2017
Nicolette CattaneoRhodes University, Department of Economics and Economic History
ii
Published by
International Centre for Trade and Sustainable Development (ICTSD)International Environment House 27 Chemin de Balexert, 1219 Geneva, Switzerland
Tel: +41 22 917 8492 Fax: +41 22 917 8093 [email protected] www.ictsd.org
Publisher and Chief Executive: Ricardo Meléndez-OrtizManaging Director: Deborah Vorhies
Acknowledgements
This paper was produced under ICTSD’s Programme on Inclusive Economic Transformation as part of a project focused on leveraging services to drive sustainable economic growth.
and Trudi Hartzenberg (Trade Law Centre, Stellenbosch), as well as Ambassador Faizel Ismail (University of Cape Town) for helpful discussions.
International Development (DFID); the Swedish International Development Cooperation Agency
Citation Trade in Services Negotiations: A Southern African Perspective. Geneva: International Centre for Trade and Sustainable Development (ICTSD).
Copyright © ICTSD, 2017. Readers are encouraged to quote and reproduce this material for
To view a copy of this license, visit: https://creativecommons.org/licenses/by-nc-nd/4.0/
views of ICTSD or the funding institutions.
iiiInclusive Economic Transformation
TABLE OF CONTENTS
LIST OF TABLES iv
LIST OF ABBREVIATIONS v
FOREWORD vi
EXECUTIVE SUMMARY vii
1. INTRODUCTION 1
2. GROWTH, STRUCTURE, AND OPENNESS OF SERVICES SECTORS IN THE TFTA REGION 3
2.1 The Contribution of the Services Sector to Value Added, Employment, and FDI Stock, and Aggregate Growth in Services Value Added 3
2.2 Sectoral Growth of Value Added, Employment, and Productivity in Selected TFTA Countries 8
2.3 Services Trade: Growth, Structure, and Contribution to Value Added Trade 9
3. SERVICES TRADE COMMITMENTS UNDER THE GATS 15
3.1 Least Developed Countries and the GATS 16
3.2 GATS Commitments of Eastern and Southern African WTO Member States 17
4. SERVICES TRADE NEGOTIATIONS AT THE REGIONAL AND CONTINENTAL LEVELS 25
4.1 The SADC Trade in Services Protocol 25
4.2 COMESA and EAC Services Negotiations 28
4.3 EPA Services Negotiations 30
4.4 TFTA and CFTA Processes 32
4.5 A Summary View of Regional and Continental Services Negotiations 35
5. CHALLENGES AND OPPORTUNITIES: THE POTENTIAL IMPACT OF EXCLUSION FROM MEGAREGIONAL AND PLURILATERAL SERVICES TRADE NEGOTIATIONS 36
5.1 Mega-Regional Trade Negotiations 36
5.2 Plurilateral Negotiations on Trade in Services 40
6. CONCLUSION: TOWARDS A DEVELOPMENTAL SERVICES STRATEGY 42
REFERENCES 44
ANNEX 1. OVERVIEW OF TFTA COUNTRIES BY INCOME CATEGORY AND REGIONAL MEMBERSHIP 50
ANNEX 2. GROWTH RATES OF VALUE ADDED, EMPLOYMENT, AND PRODUCTIVITY IN SELECTED AFRICAN ECONOMIES 51
iv
LIST OF TABLESTable 2.1: Services as a share of GDP in TFTA countries
Table 2.2: Selected TFTA countries: Services employment as a percentage of total employment
Table 2.3: Average annual growth rates of services value added in TFTA countries
Table 2.4: Total services exports, imports and trade balance (USD millions)
Table A1: TFTA Countries: Income Categories, LDC Status, Membership of Regional Groupings and
Table A2.1: Ethiopia: growth rates of value added (at constant prices), employment and productivity
Table A2.2: Malawi: growth rates of value added (at constant prices), employment and productivity
Table A2.3: Tanzania: growth rates of value added (at constant prices), employment and productivity Table A2.4: Zambia: growth rates of value added (at constant prices), employment and productivity
productivity

vInclusive Economic Transformation
LIST OF ABBREVIATIONS
of States
AU African Union
BIT bilateral investment treaty
BRICS Brazil, Russia, India, China, South Africa
CFTA Continental Free Trade Area
CMA Common Monetary Area
Southern African States
DRC Democratic Republic of the Congo
EAC East African Community
EPA Economic Partnership Agreement
ESA eastern and southern Africa
EVAD export value added database
FDI foreign direct investment
FTA free trade area
GATS General Agreement on Trade in Services
GATT General Agreement on Tariffs and Trade
GDP gross domestic product
GGDC Groningen Growth and Development Centre
GTAP Global Trade Analysis Project
GVC global value chain
IMF International Monetary Fund
ITC International Trade Centre
LCU local currency unit
LDC least developed country
LIC low-income country
LMC lower-middle-income country
M&As mergers and acquisitions
OAU Organisation of African Unity
OECD Organisation for Economic Co-operation and Development
OECD STRI OECD Services Trade Restrictiveness Index
PTA Preferential Trade Area for Eastern and Southern Africa
RCEP Regional Comprehensive Economic Partnership
REC regional economic community
SACU Southern African Customs Union
SADC Southern African Development Community
SADCC Southern African Development Coordination Conference
SDG Sustainable Development Goal
SPR Services Policy Review
TiSA Trade in Services Agreement
TFTA Tripartite Free Trade Area
TPR Trade Policy Review
TTIP Transatlantic Trade and Investment Partnership
UMC upper-middle-income country
Trade and Development
Economic and Social Affairs
International Economic and Social Affairs
Commission for Africa
Development Organisation
Restrictions Index
vi
FOREWORDEvidence suggests that the role of services in the economies of the world’s poorest countries has
in least developed countries (LDCs) and trade in services, as a proportion of GDP, reaching 14 percent
the policy space available to least developed and low-income countries (LICs).
Understanding the implications of services negotiations, at the multilateral, regional, and bilateral
should be approached strategically in order to maximise sustainable development objectives for LDCs and LICs is of critical importance in advancing sustainable development in the globe’s most underdeveloped countries.
negotiating landscape that impacts on the countries of the COMESA-EAC-SADC region and delves into the ways in which services negotiations can be harnessed to drive sustainable development outcomes for the region’s LDCs and LICs. After highlighting current trends, the structure of negotiations, and challenges and opportunities for the region’s LDCs and LICs, the paper recommends a set of strategic policy responses that could be applied at the multilateral, regional, and bilateral levels in order to enhance the utilisation of the services sector for developmental purposes.
This paper, the fourth in a series of publications related to services and the Sustainable Development
Ricardo Meléndez-Ortiz Chief Executive, ICTSD

viiInclusive Economic Transformation
EXECUTIVE SUMMARY
context within which Africa’s development strategies are evolving. Extensive trade, investment, and
areas such as services, investment, intellectual property protection, and government procurement, have affected development policy space and increased the exposure of developing countries to
emerged for Africa’s least developed (LDC) and low-income countries (LIC). The Doha Round of multilateral trade negotiations has stalled, and there is a trend towards plurilateral negotiations
agreements, as well as mega-regional trade negotiations from which African countries are presently excluded.
In this context, African countries need to develop innovative strategies for integrating different aspects of economic and social policy for catch-up and development. There has been renewed discussion of the importance of structural change on the continent, but less systematic analysis of the role of the services sector in facilitating growth and development-enhancing structural transformation in low-income and least developed African economies in particular.
This study examines the regional and international services negotiating landscape that impacts on the countries of the COMESA-EAC-SADC region and explores how these negotiations can be harnessed strategically to facilitate a developmental role for the services sector in the least developed and low-income countries of the region in particular. The study explores the growth and structure of the services sector in the region in both value added and employment terms, with a focus on the interaction between output, employment, and productivity growth and the implications for structural change. It then investigates the growth and structure of services trade and trade in value
for trade negotiations.
Given the challenging international environment which countries of eastern and southern Africa face, the development of strategic responses and a range of policy initiatives is of critical importance.
First, in order to develop a coherent and empirically grounded set of policy responses, improvements in the quality of services data and analysis is required. Improvements in sub-sectoral data are needed to analyse the impact of services on value addition and structural change adequately. In order to identify defensive interests, accurate intraregional services data is of critical importance, as a
should be prioritised in bilateral, regional, and international negotiations. Similarly, additional analysis of those services that act as inputs into gross exports at a country level is required as these services should be included in a country’s grouping of offensive interests. Case study research
of the economy, examine the impact of the current regulatory and legislative environment, and

viii
forged with other developing countries, and old alliances (such as the LDC group) reinvigorated. As
approach and toward a single-issue system, the development of strategies to cope with this by the Africa group is necessary.
Fourth, in order to support the current developmental approach utilised by the COMESA-EAC-SADC region, with its focus on trade integration, infrastructure, and industrial development, regional

1Inclusive Economic Transformation
1. INTRODUCTIONSince the early 1990s, accelerated economic globalisation, characterised by the reform and extension of international trade rules together
liberalisation, has substantially altered the international context in which African plans for regional integration and economic development are being pursued. Seguino
wave of globalisation that have had important implications for developing countries’ policy space. These include extensive trade liberalisation, the removal of limitations and
together with the emergence of a controversial international investor protection system, and
exposure of developing countries to volatile
In this context, African countries need to be innovative in integrating different aspects of economic policy, including trade, industrial, technology, and regional integration policies, for catch-up and development. This is particularly the case in light of the broadening of international trade rules to services, investment, intellectual property protection, and government procurement, and the growing organisation of production and trade in global value chains (GVCs). A challenging international environment has developed with the impasse in the Doha Round of multilateral trade negotiations and the apparent neutralisation of the Round’s development agenda. The global environment has been characterised by a tendency towards
and investment agreements. The recently stalled
mega-regional trade negotiations, between
share of world trade and investment, did not include any African countries. At the same time, Mauritius (an upper-middle-income economy) is at present the only African country that has expressed an interest in being involved in the plurilateral Trade in Services Agreement (TiSA) negotiations amongst a small group of (mostly
Despite the challenging environment, the
recent commodity boom, has arguably given African countries more space to experiment with a wider range of industrial and other developmental policies in recent years (Salazar-Xirinachs et al. 2014, 8-9).1 There has been a broader questioning of traditional mainstream policy recommendations, as well as renewed discussion of the importance of structural change in catch-up and development.2 Important questions to address in this context relate to the type of structural change that will be growth- and development-enhancing; the role and position of the services sector in such structural transformation; the nature and importance of
and whether traditional categorisations retain the same relevance in an era of GVCs.
The position of the services sector in this regard has been under-researched in the Eastern and Southern African region, particularly in the case of LICs and LDCs.3
integration approach has been proposed for the Tripartite Free Trade Area (TFTA),4
1
notes for the exceptions).
4 The TFTA is being negotiated between the member states of COMESA, the EAC, and SADC. Annex 1 indicates
2
which emphasises the three pillars of trade integration, infrastructure development, and industrialisation, the focus to date has still
than on trade in intermediaries, services trade, and the development of regional value chains.
The need for a developmental trade strategy for the services sector is becoming more pressing, however, given the share of services in domestic and global value added and employment, growing
the services sector in facilitating and supporting
economy, particularly manufacturing (Cattaneo
percent of GDP in LDCs and has been growing
percent per annum since 2000. Trade in services as a proportion of GDP in LDCs has reached 14 percent in the past decade, with some countries experiencing rapid growth in services trade
pressure on developing countries to liberalise
investment agreements, often before domestic
developed and in some cases before multilateral commitments have had to be made.
The important question for eastern and southern African LICs and LDCs is how services trade negotiations at different levels
be approached strategically in this context to advance these countries’ development
the various proposed services negotiations that have already been planned at the regional
are the implications for the services sectors of African LICs and LDCs of the exclusion of these countries from the mega-regional trade negotiations and plurilateral trade in services negotiations? How can the services sector
be harnessed to promote development and structural transformation? These questions require a range of strategic responses at all
The objective of this study is to examine the regional and international services negotiating landscape that impacts on the countries of the COMESA-EAC-SADC region (hereafter the TFTA region) and to explore how these negotiations can be harnessed strategically to facilitate a developmental role for the services sector in the least developed and low-income countries of the region in particular. The study is structured as follows. Section 2 maps out the growth and structure of the services sector in the region in both value added and employment terms, with a focus on the interaction between output, employment, and productivity growth and the implications for structural change. It then examines the growth and structure of services trade and trade in value added, as well as the services trade balance in external trade and, where data is available, within the region.
Section 3 examines the existing GATS commitments of the TFTA countries that are
form the basis of a number of the regional negotiations currently underway. Section 4 explores the services negotiating landscape in the region, including the roadmap and proposed structure of negotiations under the SADC trade in services protocol, TFTA Phase II and CFTA Phase I negotiations, as well as the EPAs, with a focus on their coherence, sequencing, and relationship to existing GATS commitments.
trends in services negotiations and in particular the potential impact of the exclusion of African LICs and LDCs from mega-regional and plurilateral services trade negotiations.
recommends a set of strategic policy responses at multilateral, regional, and domestic levels to harness the services sector for growth and development in African LICs and LDCs.

3Inclusive Economic Transformation
2. GROWTH, STRUCTURE, AND OPENNESS OF SERVICES SECTORS IN THE TFTA REGION
to outline the contribution of the services sector in the aggregate to value added and employment in the countries of the region for which
supplemented by a more in-depth consideration in Section 2.2 of value added, employment, and productivity growth in selected countries for which more detailed data is available from the Groningen Growth and Development Centre (GGDC) ten-sector database (Timmer et al. 2014). In Section 2.3, the growth and structure of services trade and its contribution to foreign exchange earnings in the countries of the region, as well as the contribution of services to value added trade, are examined using data from the International Trade Centre (ITC) and existing case studies.
2.1 The Contribution of the Services Sector to Value Added, Employment, and FDI Stock, and Aggregate Growth in Services Value Added
the aggregate accounted for between 42 and 74 percent of domestic value added in most of the
countries of the TFTA region in 2014 (Table 2.1).The share was highest for the non-LDC countries
share was lowest for the LDC states of Burundi,
percent respectively, although most TFTA LDCs in the sample had services value added shares
in domestic employment is sparse from this
Table 2.2 suggest services employment shares of
and employment in a developed economy is a sign of economic maturity in a high income context,
services in the case of low- and middle-income developing countries may signal premature deindustrialisation and tertiarisation (Palma
to consider the interaction between output, employment, and productivity growth at a more disaggregated level to explore the nature of the structural change that has occurred and its implications for development.
1970 1975 1980 1985 1990 1995 2000 2005 2010 2012 2014Angola 33.33 22.21
Botswana 32.41 34.13
Burundi 19.20 42.43
Comoros 49.81 47.17 47.29
Congo, dem. Rep.
38.18 37.13 40.04 42.28 43.24
Djibouti 74.89 81.32 81.10
Egypt, Arab Rep.
42.40 44.07 48.79 48.48 49.90
Eritrea
Ethiopia 34.97 38.18 40.04 43.42
48.33
Table 2.1: Services value added as a share of GDP in TFTA countries

4
1970 1975 1980 1985 1990 1995 2000 2005 2010 2012 2014Lesotho 40.84 41.13
Libya 22.19
Madagascar
Malawi 42.43 33.72 49.93
Mauritius 70.29 71.80
Mozambique 28.49 39.30 44.47
Rwanda 29.79 31.82 42.83 40.03 49.23 49.79
Seychelles 78.93 71.14
South Africa
Sudan 42.03 37.02 40.78 48.81
Swaziland 38.32 47.11 43.00 43.88 42.20 49.33
Tanzania 47.34
Uganda 23.48 37.38 47.72 48.78
Zambia 40.19 42.79 28.12
Zimbabwe 48.30 49.28
All LDCs 43.81 41.91 43.12 48.44 49.70 49.34
1985 1990 1995 2000 2005 2010 2013Botswana 31.40
Egypt, Arab Rep. 40.23 44.00 49.33 47.43 48.00
Ethiopia
32.20
Lesotho 30.70 18.30
Libya 47.00
Madagascar
Malawi
Mauritius 40.00
Rwanda
Seychelles 78.20
South Africa
Sudan 40.10
Tanzania 11.70 20.30
Uganda 23.20 19.10 20.20
Zambia 20.80 38.30
Zimbabwe 28.10
Table 2.1: Continued
Table 2.2: Selected TFTA countries: Services employment as a percentage of total employment
Source: World Bank (2016)
Source: Author’s calculations from available data in World Bank (2016)Note: Three year rolling averages due to the paucity of data from this source. For example, 1985 is the average for 1984-86. No services employment share data is available for Angola, Burundi, Comoros, Djibouti, DRC, Eritrea, Mozambique, South Sudan, and Swaziland in World Bank (2016).
Inclusive Economic Transformation
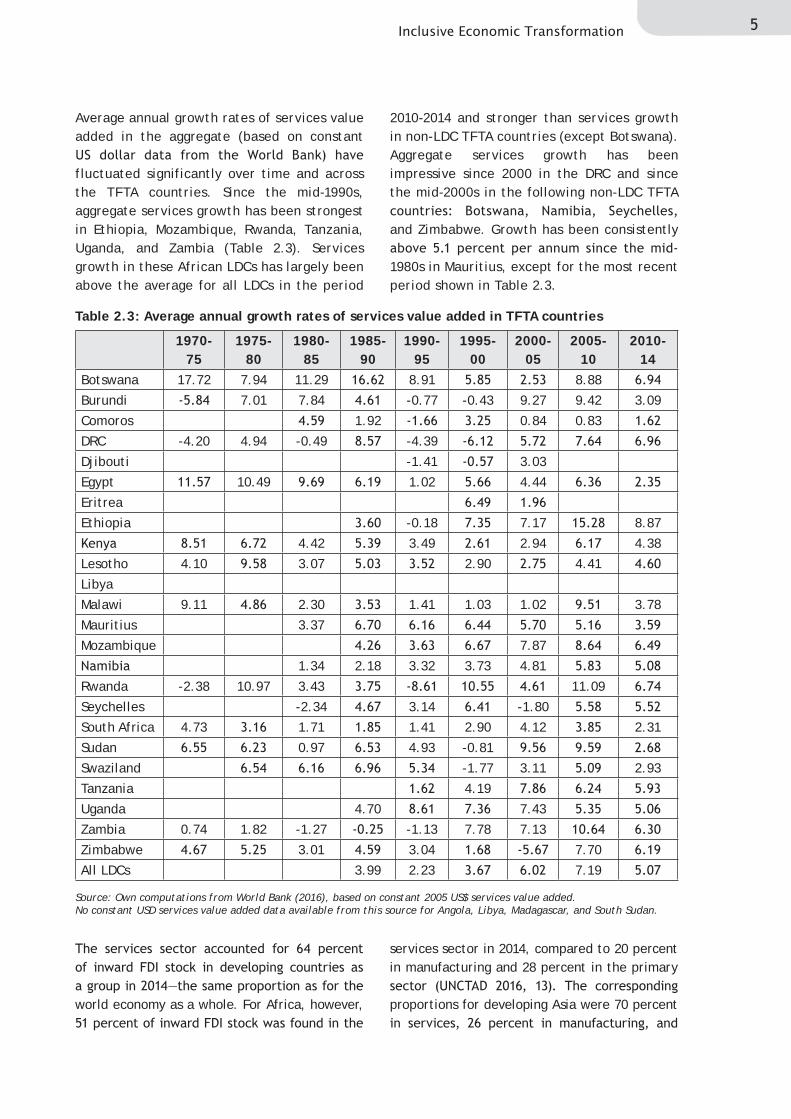
Source: Own computations from World Bank (2016), based on constant 2005 US$ services value added. No constant USD services value added data available from this source for Angola, Libya, Madagascar, and South Sudan.
Average annual growth rates of services value added in the aggregate (based on constant
fluctuated significantly over time and across the TFTA countries. Since the mid-1990s, aggregate services growth has been strongest in Ethiopia, Mozambique, Rwanda, Tanzania, Uganda, and Zambia (Table 2.3). Services growth in these African LDCs has largely been above the average for all LDCs in the period
2010-2014 and stronger than services growth in non-LDC TFTA countries (except Botswana). Aggregate services growth has been impressive since 2000 in the DRC and since the mid-2000s in the following non-LDC TFTA
and Zimbabwe. Growth has been consistently
1980s in Mauritius, except for the most recent period shown in Table 2.3.
1970-75
1975-80
1980-85
1985-90
1990-95
1995-00
2000-05
2005-10
2010-14
Botswana 17.72 7.94 11.29 8.91 8.88
Burundi 7.01 7.84 -0.77 -0.43 9.27 9.42 3.09
Comoros 1.92 0.84 0.83
DRC -4.20 4.94 -0.49 -4.39
Djibouti -1.41 3.03
Egypt 10.49 1.02 4.44
Eritrea
Ethiopia -0.18 7.17 8.87
4.42 3.49 2.94 4.38
Lesotho 4.10 3.07 2.90 4.41
Libya
Malawi 9.11 2.30 1.41 1.03 1.02 3.78
Mauritius 3.37
Mozambique 7.87
1.34 2.18 3.32 3.73 4.81
Rwanda -2.38 10.97 3.43 11.09
Seychelles -2.34 3.14 -1.80
South Africa 4.73 1.71 1.41 2.90 4.12 2.31
Sudan 0.97 4.93 -0.81
Swaziland -1.77 3.11 2.93
Tanzania 4.19
Uganda 4.70 7.43
Zambia 0.74 1.82 -1.27 -1.13 7.78 7.13
Zimbabwe 3.01 3.04 7.70
All LDCs 3.99 2.23 7.19
Table 2.3: Average annual growth rates of services value added in TFTA countries
world economy as a whole. For Africa, however,
services sector in 2014, compared to 20 percent in manufacturing and 28 percent in the primary
proportions for developing Asia were 70 percent
just 2 percent in the primary sector. According
since 2014 in the structural pattern of inward FDI to Africa following the recent collapse in commodity prices. This is most obvious in the case of mergers and acquisitions (M&As). Although the value of M&As increased fourfold
primary and tertiary sectors while the value of M&As in manufacturing increased greatly from US$330 million to US$20,937 million. By contrast,
announced for Africa decreased between 2014
increased investments in the electricity, gas, and water supply sector. Both the value and
manufacturing sectors decreased between 2014
in sectors such as electricity, gas, and water
development goals (SDGs), there has been much debate on the role and position of the services sector within a broader developmental strategy in both low and middle-income countries. On the one hand, it has been argued that the sector’s contribution to GDP and employment and the rapid growth of trade in services provide a case for positioning the services sector at the centre of the development process. This rationale is frequently challenged, however, as the aggregate picture in terms of value added and employment conceals a range of activities and employment prospects that may include a
7 Some proponents of a services-led growth path argue that competition in manufactured
for many low and middle-income countries to pursue export-oriented industrialisation.8 Many
argue, however, that the re-organisation of production and trade in GVCs offers new and easier opportunities for the integration of low and middle-income countries into the global economy through specialisation and trade in
9 The role of ICT services in India’s growth acceleration is often highlighted in arguments in favour of a services-led growth path, as is the sector’s importance for the country’s balance of payments. Others have questioned the sustainability of rapid economic growth based on a high rate of growth in services in a context of jobless growth in manufacturing and inadequate accompanying formal services employment growth.10
The manufacturing sector has long been considered as central to the development
structuralist, and Schumpetarian traditions (Palma 2008). This perspective derives from the notion that a rise in manufacturing value added has a greater economy-wide growth-enhancing effect than a corresponding rise in agricultural or services value added. Manufacturing has particular growth-pulling effects due to the
economies, increasing returns, learning by doing and technological diffusion to other sectors, as
payments constraint (Palma 2008; Tregenna
(2013, 1-2), manufacturing provides developing countries with the best opportunity to enhance value added growth while maintaining employment and improving productivity. By contrast, “direct transition from agriculture to services, especially for low-income countries,
wages for a broader range of wage-earners are generally found in manufacturing which can in turn improve incomes and stimulate a larger
http://www.un.org/sustainabledevelopment/economic-growth/.
8 See, for example, Sheehan (2008).
10 See, for example, the discussion in Singh (2009).

7Inclusive Economic Transformation
11 For a critique of the traditional distinction between agriculture and industry, for example, see Cramer and Sender
Sheehan (2008) argues that particular modern services sectors display many of the
as important for growth and development. Furthermore, the role of the services sector as a supporter and facilitator of manufacturing production and trade needs greater recognition,
organisation of production, trade, and investment
by developed country multinationals. Trade
necessary to coordinate the different parts of the production process internationally (Cattaneo 2009). As Van Long et al. (2001, 1) emphasise, countries participating in GVCs need to have services sectors that can support and facilitate international production sharing. Dasgupta and
service activities such as retail and transportation may primarily depend on manufacturing sector growth, ICT-related service activities would in turn stimulate the expansion of manufacturing activity. From the perspective of low-income countries, a developmental services strategy could be harnessed to facilitate industrialisation and upgrading in South-South regional production
towards new opportunities related to innovation
However, the evidence suggests that an emphasis on the services sector to the exclusion of manufacturing will not be effective as a development strategy. As Tregenna (2008)
of demand for the services sector and the poor performance of manufacturing will adversely affect both services growth and that of the
at growth and structural change, it is important to separate out services value added and
employment changes that are a consequence of inter-sectoral outsourcing from manufacturing to services (Tregenna 2008). This indicates the limitations of a focus on the services sector in isolation from the rest of the economy and the manufacturing sector in particular. The implication is not that particular services sub-sectors do not have the potential for propulsive growth, but rather that analysis at the sub-sectoral level, that places greater emphasis on
and employment multipliers, is required. Traditional categorisations of economic sectors have, in any event, become less pertinent in the face of technological developments across agriculture, services, and manufacturing.11 This reinforces the need to situate a developmental strategy for the services sector within a broader development strategy encompassing industrial policy and other aspects of economic policy-
an important part of its development at both domestic and regional levels is an assessment of the sectoral growth performance, structure, and openness of the region’s services sectors. African countries are under pressure to open up their
greater extent in bilateral and regional trade agreements, often before appropriate domestic
In order to facilitate the development and
services landscape in the region needs to be
of availability of reliable and consistent data, particularly for LICs and LDCs. A comprehensive discussion of the data issues, particularly with respect to the measurement of trade in services, is beyond the scope of this paper.12 However, these
the discussion that follows in the remainder of this section.
8
2.2 Sectoral Growth of Value Added, Employment, and Productivity in Selected TFTA Countries
the performance and relative importance of
Data should be disaggregated beyond the broad sector level in order to provide a better picture of the nature and characteristics of structural change and the role of the services sector in this process. There has been increased emphasis in recent years on the study of structural change in Africa both at the broad sector level and within particular sectors, such as manufacturing and services.13
sectors, studies have explored the interactions between output, employment, and productivity changes, distinguishing between adverse and
comprehensive review of this literature is beyond the scope of this paper, it is clear that structural change associated with a larger share of value added and employment in services needs to be carefully interrogated at the sub-sector level to explore its productivity and employment enhancing potentials.
For example, based on the GGDC ten-sector
wholesale and retail trade sector as having the potential for propulsive growth in the African LDC countries in the database due to “high
“a destination for excess labor being shed from
The wholesale retail & trade sector is highly absorbent of labor…with varying
Senegal exhibit low productivity in the retail (sic) trade sector, while [the LDCs] Tanzania, Ethiopia, Malawi, and Zambia have a relatively productive trade sector
Two points are important here. Firstly, Enache et
excluding restaurants and hospitality in the GGDC ten-sector database, stating that restaurants, hospitality, etc. fall under the tenth sector which
ten-sector descriptions in Timmer et al. (2014)
under trade services as including “wholesale and retail trade; repair of motor vehicles, motorcycles and personal and household goods, hotels and
as “other community, social and personal service
indicates that the GGDC trade services sector is still highly aggregated in terms of the range of activities involved. Secondly, Tables A2.1 to A2.4 of the present paper suggest that, in the case of the LDCs Ethiopia, Malawi, Tanzania, and Zambia, productivity growth in the trade sector in 2000-10 was negative or negligible, with little improvement from 1990-2000 in most cases.
clear what the basis is for their conclusion about the productivity performance of the wholesale
This reinforces the importance of sub-sectoral
in individual LDCs and LICs. The point can be further illustrated with reference to more
(2009) and Cattaneo and Fryer (2014) in the case of South Africa (though of course a middle-income country). Tregenna (2009, 1) notes that “relatively high growth in services employment is driven by an expansion of employment of cleaners and security guards and an outsourcing-type reallocation of these activities from manufacturing and the public sector towards private services. These activities have limited
sub-sectors to generate propulsive growth, value added growth should be accompanied by both employment and productivity growth. In Table
9Inclusive Economic Transformation
e GGDC ten-sector category “FIRE
value added growth accompanied by healthy employment and productivity growth in the case of South Africa. However, Cattaneo and Fryer (2014) show that once FIRE and business services (as well as transport and communication) are disaggregated, the picture changes considerably at the sub-sectoral level. Two sub-sectors (business services and retail trade) show dramatic employment growth with very low productivity, while two different sub-sectors (FIRE and communication) show dramatic productivity growth with little employment growth (Cattaneo and Fryer 2014).
above regarding the level of aggregation in the GGDC ten-sector database, a few general observations can be made. In absolute terms in the most recent years, the trade sector has tended to be important for both value added
construction sector is not in the top three sectors in terms of employment, it is growing rapidly in these terms off a very low base. Value added growth has been significant in this sector in the recent period.
2.3 Services Trade: Growth, Structure, and Contribution to Value Added Trade
As noted in Section 2.1, the growing tradability of many services has been an important factor in the global re-organisation of production and trade in recent decades. According
services accounted for about 21 percent of total global trade in 2014, with developing countries accounting for about 34 percent of
services comprise an important component of trade in value added, which measures the
domestic and foreign value added embodied in exports and distinguishes the sectoral composition of this value added. Services exports provide a source of foreign exchange earnings and potentially a less costly source
Table 2.4 depicts services exports, imports, and the services trade balance for individual TFTA countries based on nominal data from
services exporters in recent years have been
the largest importers Angola, Egypt, South Africa, and Libya. The importance of services trade for the individual TFTA countries’ balance of payments is also depicted in Table 2.4. Africa’s trade deficit in services has worsened
in absolute terms in 2014 in the LDC TFTA countries of Angola, Libya, Mozambique, and the DRC. The highest services trade surpluses
Botswana. The only LDC TFTA countries with
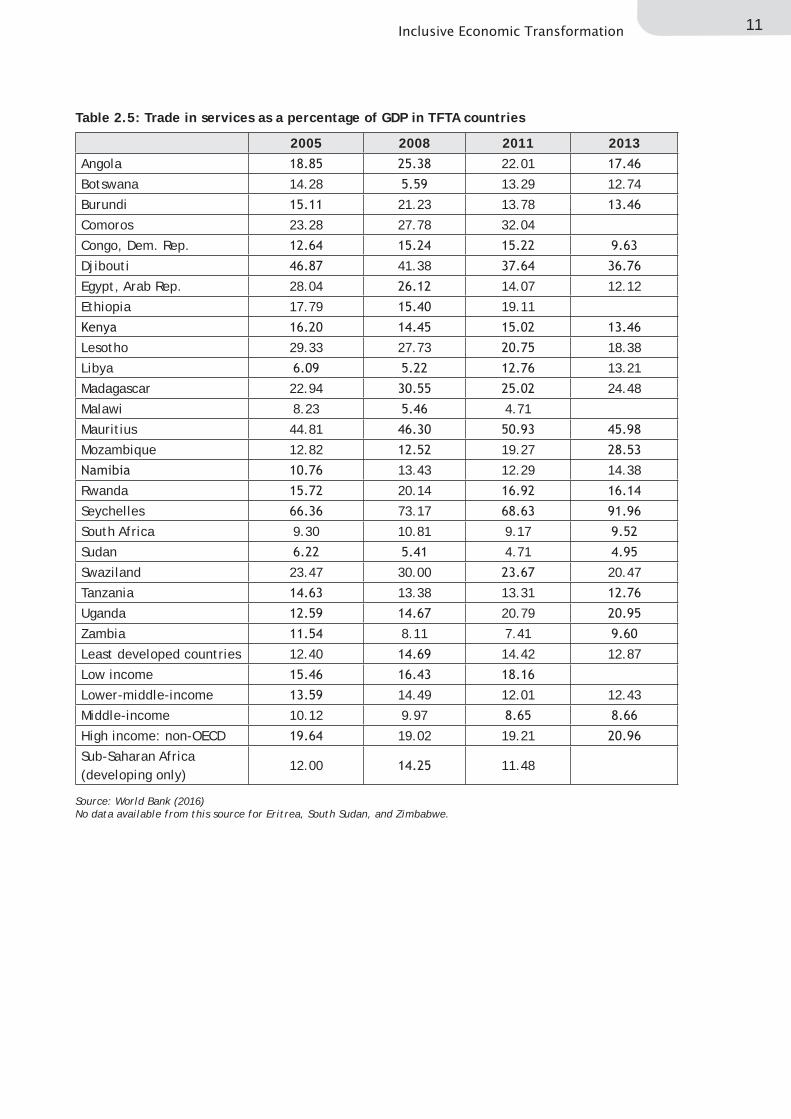
as a proportion of GDP is considered, based on
and Djibouti had the highest shares of services
closely by Comoros and Mozambique, while South Africa and Egypt had among the lowest
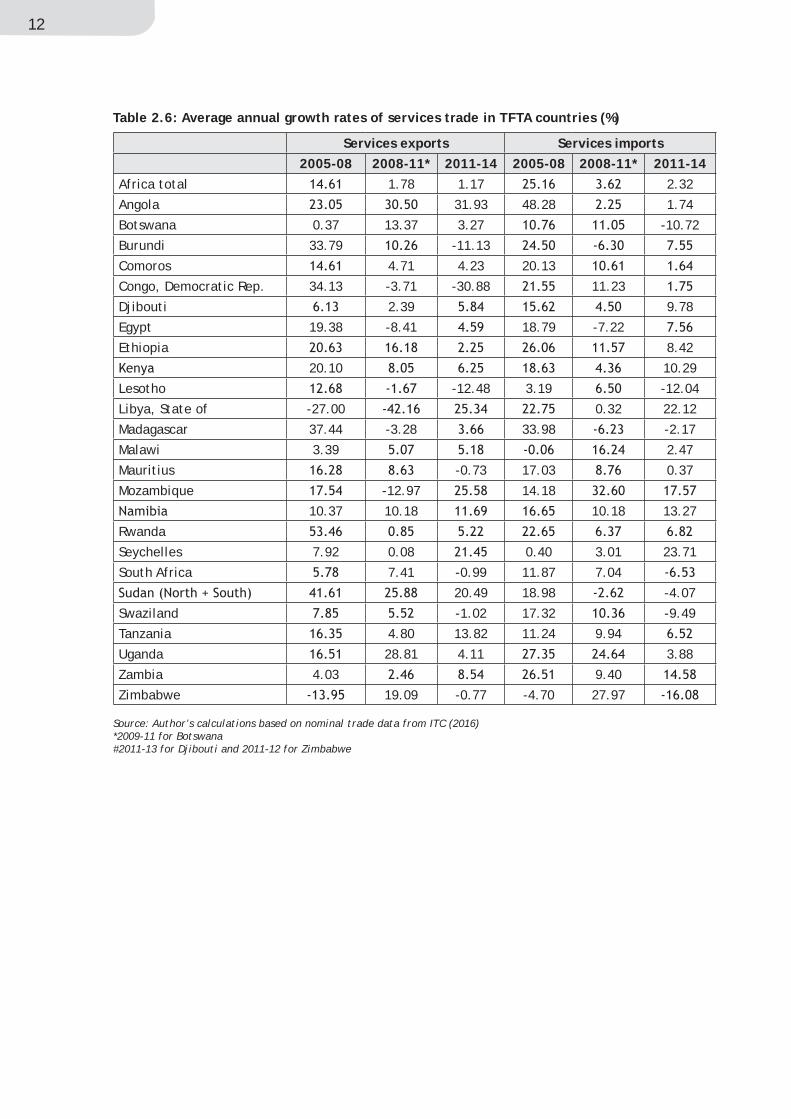
14 It is not ideal to compute average annual growth rates on the basis of nominal services
are relatively erratic across countries for the
that, for Africa in the aggregate, growth in imports has exceeded growth in exports in the most recent period. This also applies to seven of the TFTA LDCs included in the table.

10
Serv
ices
exp
orts
Serv
ices
impo
rts
Serv
ices
bal
ance
2005
2008
*20
1120
14#
2005
2008
*20
1120
14#
2005
2008
*20
1120
14#
Afri
ca t
otal
1794
99-7
8439
Ango
la17
732
973
222
139
2492
8-2
1810
-229
38
Bots
wan
a83
384
212
2810
8877
424
848
139
+
Buru
ndi
8311
278
134
213
-99
-101
Com
oros
4374
8479
108
113
-3-3
4-2
9
Cong
o, D
emoc
rati
c Re
p.34
382
873
924
421
0028
8930
43-1
271
-279
9
Dji
bout
i24
829
731
984
130
148
178
171
179
+
Egyp
t24
912
1914
021
898
1407
072
9743
88+
Ethi
opia
1012
1777
2978
1194
2392
3322
4234
-182
1883
1924
2934
731
1338
1928
2002
+
Leso
tho
3448
3140
448
833
2-3
34-4
42-3
01
Liby
a20
840
7923
4943
4479
88-4
137
-790
9
Mad
agas
car
499
1173
1302
1219
-283
-129
87
Mal
awi
7410
0-9
2
Mau
riti
us31
9011
9819
2024
7024
9842
079
1+
Moz
ambi
que
342
-307
-410
-293
2
413
742
1034
783
1138
44-3
1-4
1-1
04
Rwan
da12
043
344
477
4-1
92
Seyc
helle
s37
083
424
024
312
922
120
033
0+
Sout
h Af
rica
1182
913
999
1701
317
042
-322
-301
4
147
417
833
2338
-211
4
Swaz
iland
203
300
291
403
-200
Tanz
ania
1999
2300
3392
1207
2208
337
9272
4+
Uga
nda
832
1779
2007
2729
-83
-722
Zam
bia
412
1093
137
-428
-794
Zim
babw
e23
139
038
7-2
73-3
19
Tabl
e 2.
4: T
otal
ser
vice
s ex
port
s, i
mpo
rts,
and
tra
de b
alan
ce (
US$
mil
lion
s)
Sour
ce:
ITC
(20
16)
(No
data
pro
vide
d fo
r Er
itre
a)*2
009
for
Bots
wan
a#2
013
for
Dji
bout
i an
d 20
12 f
or Z
imba
bwe
11Inclusive Economic Transformation
2005 2008 2011 2013Angola 22.01
Botswana 14.28 13.29 12.74
Burundi 21.23 13.78
Comoros 23.28 27.78 32.04
Congo, Dem. Rep.
Djibouti 41.38
Egypt, Arab Rep. 28.04 14.07 12.12
Ethiopia 17.79 19.11
Lesotho 29.33 27.73 18.38
Libya 13.21
Madagascar 22.94 24.48
Malawi 8.23 4.71
Mauritius 44.81
Mozambique 12.82 19.27
13.43 12.29 14.38
Rwanda 20.14
Seychelles 73.17
South Africa 9.30 10.81 9.17
Sudan 4.71
Swaziland 23.47 30.00 20.47
Tanzania 13.38 13.31
Uganda 20.79
Zambia 8.11 7.41
Least developed countries 12.40 14.42 12.87
Low income
Lower-middle-income 14.49 12.01 12.43
Middle-income 10.12 9.97
High income: non-OECD 19.02 19.21
Sub-Saharan Africa (developing only)
12.00 11.48
Table 2.5: Trade in services as a percentage of GDP in TFTA countries
Source: World Bank (2016)No data available from this source for Eritrea, South Sudan, and Zimbabwe.
12
Source: Author’s calculations based on nominal trade data from ITC (2016)*2009-11 for Botswana#2011-13 for Djibouti and 2011-12 for Zimbabwe
Services exports Services imports 2005-08 2008-11* 2011-14 2005-08 2008-11* 2011-14Africa total 1.78 1.17 2.32
Angola 31.93 48.28 1.74
Botswana 0.37 13.37 3.27 -10.72
Burundi 33.79 -11.13
Comoros 4.71 4.23 20.13
Congo, Democratic Rep. 34.13 -3.71 -30.88 11.23
Djibouti 2.39 9.78
Egypt 19.38 -8.41 18.79 -7.22
Ethiopia 8.42
20.10 10.29
Lesotho -12.48 3.19 -12.04
Libya, State of -27.00 0.32 22.12
Madagascar 37.44 -3.28 33.98 -2.17
Malawi 3.39 2.47
Mauritius -0.73 17.03 0.37
Mozambique -12.97 14.18
10.37 10.18 10.18 13.27
Rwanda
Seychelles 7.92 0.08 0.40 3.01 23.71
South Africa 7.41 -0.99 11.87 7.04
20.49 18.98 -4.07
Swaziland -1.02 17.32 -9.49
Tanzania 4.80 13.82 11.24 9.94
Uganda 28.81 4.11 3.88
Zambia 4.03 9.40
Zimbabwe 19.09 -0.77 -4.70 27.97
Table 2.6: Average annual growth rates of services trade in TFTA countries (%)
13Inclusive Economic Transformation
Intra-African services trade data are hard to
on GTAP data, intra-African services trade as a proportion of Africa’s total services trade is less than 4 percent. Egypt and South Africa are
intra-African services trade in the TFTA area.
the region are those between South Africa and Mozambique, South Africa and Botswana, South Africa and Egypt, and between Angola and the
Data on services value added trade from the
provide an additional picture of services trade
goods and services.that the value of the contribution that a traded
goods usually exceeds the value of the traded
computing the ratio of the value of the sector as an input into other traded sectors to the value of the sector that is directly exported (Stuart
for Africa as a whole, services contribute just over four times more in value as inputs to other traded sectors than they contribute to exports directly. The contribution is highest in the case of
services, and communication services.
TFTA LDCs’ external services trade needs further
detailed discussion of the sectoral structure of services trade across the TFTA countries is beyond the scope of this paper, such an analysis
number of reasons. Firstly, in preparing for services trade negotiations at regional and bilateral levels, TFTA countries need to identify their offensive and defensive interests at the sub-
sector level (tralac 2011). In this regard it would be interesting to compare the sectoral structure of intra-African services trade with that of African countries’ external services trade. This would be of assistance in identifying sectors of importance in negotiations at the regional versus bilateral and multilateral levels. There may be particular services sectors that it would be advantageous
economies and to facilitate the creation of In the absence
of reliable data on the sectoral structure of intra-African services trade, case studies and sector by sector analysis is necessary to identify priority sectors for a regional focus.17
Secondly, an analysis of the current structure of services trade, value added, and employment relative to the commitments made in the GATS negotiations in the 1990s is long overdue. The ITC
structure of individual countries’ services exports and imports based on the sixth edition of the IMF’s Balance of Payments and International
The data are sparse for some TFTA countries but the following are important export sectors: personal travel, business travel, freight and passenger transport, other transport, technical, trade-related, and other business services, and reinsurance. On the import side, travel and transport services once again predominate, along with telecommunications, construction services and, in the case of South Africa, charges
structure of intra-African services trade is not available, it is evident that transport, travel, and
are traded within the continent (Sandrey 2017).
An important comparative perspective on the openness of the services sectors of countries in the TFTA region can be obtained by exploring
these countries in the Uruguay Round of trade
Africa and Tunisia are currently the only African countries included in the dataset.
14
negotiations. It should be noted at the outset however that, with a lapse of over 20 years (in most cases) since the commitments reflected
domestic reality in many of these economies is generally far from what is reflected in the
estimates of the difference between specific commitments of GATS member states and the existing services trade regimes in these
sectors using the OECD Services Trade Restrictiveness Index (OECD STRI). It is found that in general actual services regimes are a
lot more open relative to what is reflected in country GATS schedules, even in unbound sectors, although with significant sectoral variations. However, the only TFTA country in the sample is South Africa.18 It is also important to review the GATS commitments of
basis, to date, for the services negotiations
tralac 2011). Accordingly, Section 3 begins by reviewing the GATS process and then considers existing scheduled commitments as a basis
services trade negotiations at the regional and continental levels.
where there appears to be little difference between the prevailing services regime and the country’s scheduled GATS commitments.

Inclusive Economic Transformation
The General Agreement on Trade in Services
services disciplines at the multilateral level,
following the conclusion of the Uruguay Round of trade negotiations. The Agreement contains general obligations and disciplines, including most-favoured nation treatment and
19 The latter apply to services sectors included in each country’s schedule of commitments. A country’s schedule need only specify those sectors in which that country is prepared to
as a positive list approach. This contrasts with the negative list approach adopted in many
treaty obligations apply to all sectors unless
Low and Mattoo (2000) point out that in the
list approach is applied to indicate sectoral
national treatment across the four modes of supply, a negative list approach is then adopted
national treatment in the listed sectors.
The modes of supply refer to the four different ways in which services may be supplied across borders, as distinguished in Article I of the GATS. Mode 1 refers to cross-border supply of a service, whereby non-resident service providers supply services across the border
refers to consumption abroad, where residents purchase services in another member country. Mode 3 indicates commercial presence: service suppliers from abroad establish, operate, or expand commercial presence (such as a branch or subsidiary) in a member’s territory. Finally, Mode 4 refers to the presence of natural
persons; in this case foreigners enter and temporarily stay in another member’s territory in order to supply a service (Cattaneo 2011).20
purposes as outlined in the services sectoral
are business services; communication services; construction and related engineering services; distribution services; educational services;
health related and social services; tourism and travel related services; recreational, cultural, and sporting services; transport services and other. For each sector or sub-sector entered in a country’s schedule, the two columns
any restrictions that the country applies to
treatment under each of the four modes
commitments in the schedule, a country may include a set of horizontal commitments that apply to all sectors included in that schedule. In the horizontal commitments section of the schedule, the columns headed “Limitations on
across all sectors listed in the schedule (Cronjé
At the time of entry into force of the GATS, countries were also permitted to submit an
paragraph of Article II of the GATS. Exemption lists form part of the Annex on Article II
include, for example, preferences granted in particular services sectors in terms of regional accords existing at the date of entry into force
3. SERVICES TRADE COMMITMENTS UNDER THE GATS
https://www.wto.org/english/docs_e/.
and telecommunications in the mid to late 1990s. In the case of basic telecommunications,
and resulted in additional commitments by
the sector. The resulting post-Uruguay Round Basic Telecommunications Agreement (the GATS Fourth Protocol) came into force at the beginning of 1998. Two Protocols on Financial Services (the Second and Fifth GATS Protocols)
29 and 70 member states respectively.21
negotiations appear as supplements to the original GATS schedules of these countries, with provisions that replace or supplement the original relevant sections of the schedule.
3.1 Least Developed Countries and the GATS
In the Uruguay Round negotiations there was no minimum requirement on the number of services sectors that member states had to commit.
a GATS schedule, it was possible to commit just one sub-sector. Many LDCs, for example, made limited commitments only within the Tourism and Travel Services sector. As a result, a wide
by developing countries (tralac 2011, 3). Article XIX of the GATS does, however, oblige countries to enter into successive rounds of services trade negotiations.22 Although there has been little movement in the GATS negotiations since 2000, three developments should be noted with respect to the position of LDCs.
Trade in Services adopted modalities for the special treatment of LDC member states
Cs in
negotiations on services going forward with respect to requests made by other member states. LDCs would be entitled to open “fewer
not be expected to provide full national
that might exceed their “institutional,
short, commitments could be “limited in terms
2003, 1). In addition, other member states should give priority in their offers to LDCs to sectors and modes of supply that LDCs identify as important for their development strategies.
The second development to note on the position
services negotiations, but states explicitly that
new services commitments going forward in the
Finally, at the 2011 Ministerial Conference, a Ministerial Decision was adopted on preferential treatment for services and service suppliers of LDCs in the form of a waiver on
with respect to LDCs. Member countries are entitled to grant preferential treatment to services and service suppliers of LDCs without having to extend these preferences to other
date of adoption in December 2011. At the Bali Ministerial Conference in 2013 a decision was
to encourage its use. The LDC Group at the
horizontal measures, sectors, and modes of supply of interest to LDCs in this regard. At the
waiver was extended for another four years due to the slow progress in its implementation.23
21 For more detail see https://www.wto.org/english/tratop_e/serv_e/s_negs_posturuguay_e.htm.
https://www.wto.org/english/docs_e/.
.
17Inclusive Economic Transformation
3.2 GATS Commitments of Eastern and Southern African WTO Member States
Since existing GATS commitments are the starting point from which regional services
2011), it is important to provide a clear picture of the diverse commitments made under the GATS by the countries in the TFTA region. All eastern and southern African countries
exception of Comoros, Eritrea, Ethiopia, Libya, South Sudan, and Sudan. Of the latter, all but Eritrea and South Sudan are observer countries and have begun the process of accession to the
24
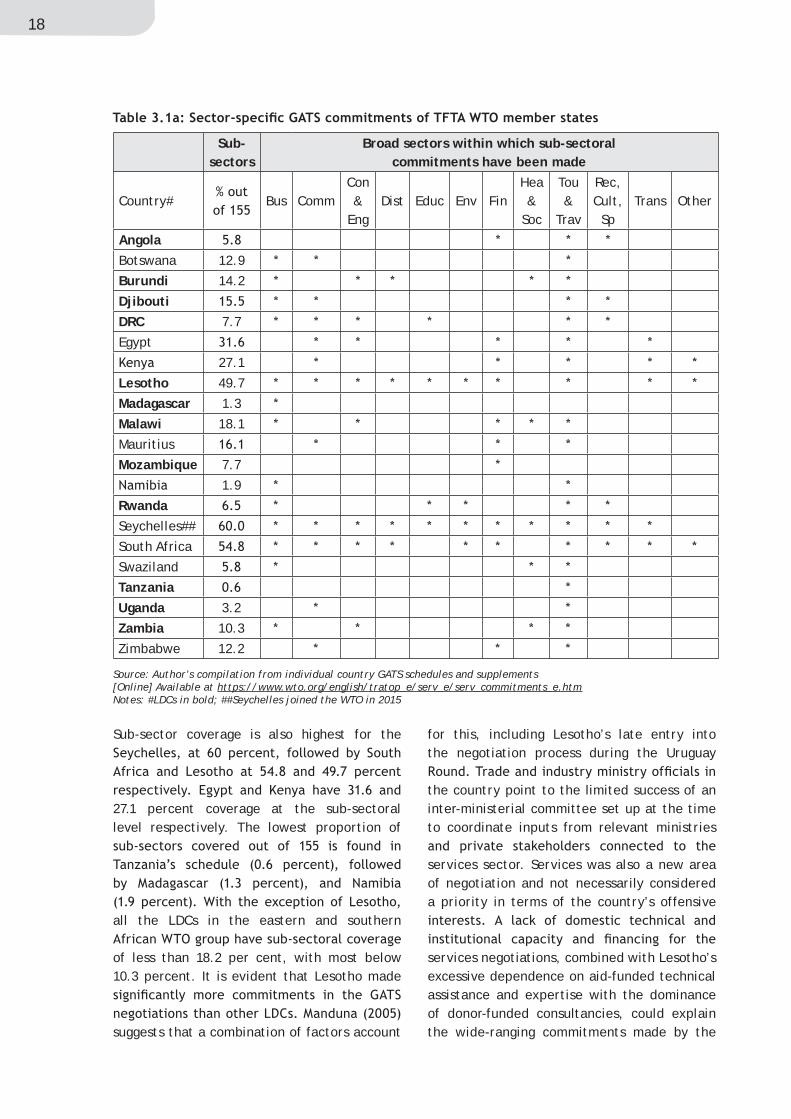
Table 3.1a provides information on the sector-
table, constructed from individual country GATS schedules and supplements, indicates
in which of the 12 broad sectors sub-sectoral commitments have been made, as well as the proportion of sub-sectors out of the total of
broad sector terms, all 21 eastern and southern
commitment in the Tourism and Travel sector, except for Madagascar and Mozambique. The next most frequently committed sectors at the broad level are Business Services (13 countries), Communication Services (11 countries), Financial Services (10 countries), and Construction
have made GATS commitments in Educational, Environmental, Distribution, Health and Social, Transport, and Other Services (Table 3.1a). The country with the widest range of broad sectors covered in its schedule is the Seychelles, which
12 broad sectors covered. This is followed by South Africa and Lesotho (each with 10 out of 12 broad sectors covered). At the other end of the spectrum, Madagascar, Mozambique, and Tanzania made GATS commitments in only one
two.
24 See .
18
Source: Author’s compilation from individual country GATS schedules and supplements [Online] Available at https://www.wto.org/english/tratop_e/serv_e/serv_commitments_e.htm Notes: #LDCs in bold; ##Seychelles joined the WTO in 2015
Sub-sector coverage is also highest for the
27.1 percent coverage at the sub-sectoral level respectively. The lowest proportion of
all the LDCs in the eastern and southern
of less than 18.2 per cent, with most below 10.3 percent. It is evident that Lesotho made
suggests that a combination of factors account
for this, including Lesotho’s late entry into the negotiation process during the Uruguay
the country point to the limited success of an inter-ministerial committee set up at the time to coordinate inputs from relevant ministries
services sector. Services was also a new area of negotiation and not necessarily considered a priority in terms of the country’s offensive
services negotiations, combined with Lesotho’s excessive dependence on aid-funded technical assistance and expertise with the dominance of donor-funded consultancies, could explain the wide-ranging commitments made by the
Sub-sectors
Broad sectors within which sub-sectoral commitments have been made
Country# Bus CommCon &
EngDist Educ Env Fin
Hea &
Soc
Tou &
Trav
Rec, Cult, Sp
Trans Other
Angola
Botswana 12.9
Burundi 14.2
Djibouti
DRC 7.7
Egypt
27.1
Lesotho 49.7
Madagascar 1.3
Malawi 18.1
Mauritius
Mozambique 7.7
1.9
Rwanda
Seychelles##
South Africa
Swaziland
Tanzania
Uganda 3.2
Zambia 10.3
Zimbabwe 12.2
19Inclusive Economic Transformation
mostly related to the number of service suppliers, employees, or operations, and the value of the services activities involved. There is no such list of national treatment limitations. See gats.pdf for more detail.
country. Attention has also been drawn to the similarity between South Africa and Lesotho’s GATS schedules.
discussing the sub-sectoral coverage of any individual country’s GATS schedule, it is important to note that a count of sub-sector listings such as that provided in Table 3.1a does not provide an indication of the scope and depth of a country’s commitments nor of the limitations placed by the country on those
2011; tralac 2011). However, a sub-sector’s listing in the schedule reveals whether the sub-sector is committed fully, partially, or not
treatment under each mode of supply. For
access restrictions for Modes 1 to 3, but may
the meantime, another sub-sector may have no
In other words, even if a sub-sector is listed in a country’s GATS schedule, there is a wide range of underlying commitments and limitations that could be in place for that sub-sector. Simply counting the number of sub-sectors in a country’s schedule does not therefore provide
each
access and national treatment by eastern and
each mode of supply for each committed sub-
sector listing where a commitment is made with no limitation for the given mode of supply.
refers to a sub-sector listing where there is a commitment with limitations.
or national treatment in one or more of the
modes of supply, even though the sub-sector is listed in the country’s GATS schedule. In this instance the inscription in the schedule reads
for that mode of supply in that sub-sector.
the significance of the sector-specific GATS commitments made by the eastern and
computing the number of full and partial commitments as a proportion of the total number of possible commitments that could be made across all sub-sectors and modes
and national treatment. He finds that the proportion of total possible commitments
Lesotho 38.4 percent using this measure.27 The lowest proportion of commitments was made
countries other than Botswana and Mauritius
More detailed analysis of commitments is also possible by examining which particular modes
and national treatment in each sub-sector. For example, a commitment under Mode 2 permitting home country residents to consume abroad may be viewed as less significant than a commitment under Mode 4 permitting movement of natural persons into the home
sector-specific GATS commitments is beyond the scope of the present paper, Table 3.1b compiles this information for the horizontal commitments of eastern and southern African
schedules may include a set of horizontal
or national treatment that apply to all sectors included in that schedule.
20
country has a horizontal section but no entry is listed for that particular mode of supply.
schedule has a horizontal section and there are no horizontal limitations for that mode of
horizontal section in the schedule and there is at least one limitation for that mode of supply. The table suggests that horizontal limitations
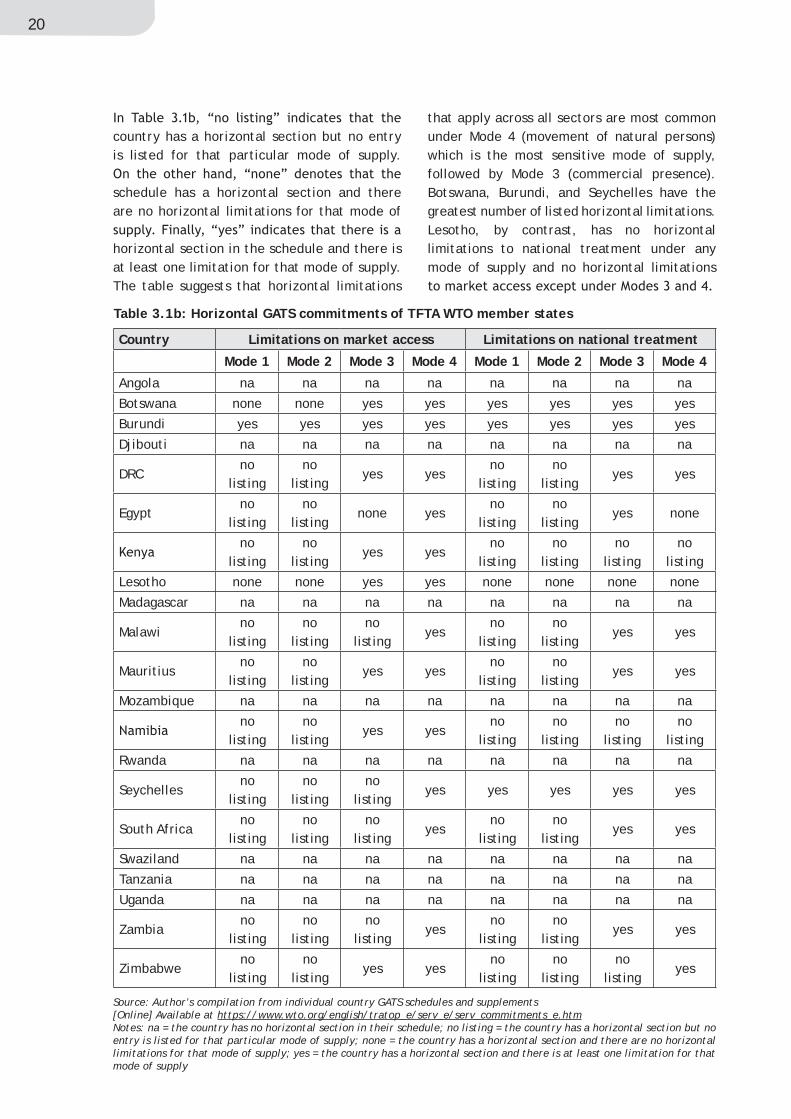
that apply across all sectors are most common under Mode 4 (movement of natural persons) which is the most sensitive mode of supply, followed by Mode 3 (commercial presence). Botswana, Burundi, and Seychelles have the greatest number of listed horizontal limitations. Lesotho, by contrast, has no horizontal limitations to national treatment under any mode of supply and no horizontal limitations
Source: Author’s compilation from individual country GATS schedules and supplements[Online] Available at https://www.wto.org/english/tratop_e/serv_e/serv_commitments_e.htmNotes: na = the country has no horizontal section in their schedule; no listing = the country has a horizontal section but no entry is listed for that particular mode of supply; none = the country has a horizontal section and there are no horizontal limitations for that mode of supply; yes = the country has a horizontal section and there is at least one limitation for that mode of supply
Country Limitations on market access Limitations on national treatment
Mode 1 Mode 2 Mode 3 Mode 4 Mode 1 Mode 2 Mode 3 Mode 4
Angola na na na na na na na na
Botswana none none yes yes yes yes yes yes
Burundi yes yes yes yes yes yes yes yes
Djibouti na na na na na na na na
DRCno
listingno
listingyes yes
no listing
no listing
yes yes
Egyptno
listingno
listingnone yes
no listing
no listing
yes none
no listing
no listing
yes yesno
listingno
listingno
listingno
listing
Lesotho none none yes yes none none none none
Madagascar na na na na na na na na
Malawino
listingno
listingno
listingyes
no listing
no listing
yes yes
Mauritiusno
listingno
listingyes yes
no listing
no listing
yes yes
Mozambique na na na na na na na na
no listing
no listing
yes yesno
listingno
listingno
listingno
listing
Rwanda na na na na na na na na
Seychellesno
listingno
listingno
listingyes yes yes yes yes
South Africano
listingno
listingno
listingyes
no listing
no listing
yes yes
Swaziland na na na na na na na na
Tanzania na na na na na na na na
Uganda na na na na na na na na
Zambiano
listingno
listingno
listingyes
no listing
no listing
yes yes
Zimbabweno
listingno
listingyes yes
no listing
no listing
no listing
yes
Table 3.1b: Horizontal GATS commitments of TFTA WTO member states
21Inclusive Economic Transformation
It was noted in Section 2 that the domestic
schedules. More recent information on the openness of the services trade landscape in the
Services Trade Restrictions Database,28 the
states, the Diagnostic Trade Integration Studies
29
Services Policy Reviews (SPRs), initiated
Restrictions Database covers 103 countries,
telecommunications, retail distribution, transport, and professional services) and 19 sub-sectors, across three modes of supply (Modes 1, 3, and 4).30
aggregate index of applied policy measures. In addition, the database provides more detailed
measures in place by sub-sector and mode, as well as a broader category of all relevant policy measures. The data are based on surveys completed between 2008 and 2011 by domestic
laws and regulations in force in each country.31
available TFTA countries overall and for each
Table 3.2 indicates that the overall index was highest in Ethiopia, followed by Zimbabwe and Egypt, and lowest in Mauritius, Mozambique, and Madagascar for the survey period. At the broad sector level, the index is highest for professional services (due to measures affecting Mode 4) and telecommunications, and lowest
are numerous differences across countries and sub-sectors. Professional services are the
only broad sector where Mode 4 measures are
to the high index levels in this sector. Care must
an examination of actual laws and regulations (rather than being a perceptions index), it includes policy measures and regulations that are essential components of any domestic regulatory landscape. In addition, it includes public policy measures that are important for countries’ domestic development objectives. Use of the database should go beyond just
place at the time of the survey. In addition,
the index and the information provided on
survey was done in any given country, namely between 2008 and 2011. The information would
in the policy and regulatory landscape in these countries since then.
Policy Review (SPR) initiative aims to identify services trade policy options that cohere with domestic development objectives. The idea
sectoral strategies supported by an enabling institutional and regulatory environment and
the rest of the economy. The SPR process is intended to facilitate a review of domestic services sectors and provide recommendations regarding the development of “regulatory,
TFTA countries, namely Lesotho, Rwanda, and Uganda. Lesotho’s SPR focuses on tourism, financial services, and professional medical
Restrictiveness Index Database. The latter includes South Africa, but no other African countries.
https://www.wto.org/english/tratop_e/devel_e/teccop_e/if_e.htm.
30 All TFTA countries except Angola, Comoros, Djibouti, Eritrea, Libya, Seychelles, Sudan, South Sudan, and Swaziland
31 For more information see .

22
Sour
ce:
Aut
hor’
s co
mpi
lati
on f
rom
the
Wor
ld B
ank
Serv
ices
Tra
de R
estr
icti
ons
Dat
abas
e. [
Onl
ine]
Ava
ilab
le a
t ht
tp:/
/ire
sear
ch.w
orld
bank
.org
/ser
vice
trad
e/ho
me.
htm
Tabl
e 3.
2: W
orld
Ban
k Se
rvic
es T
rade
Res
tric
tive
ness
Inde
x 20
08-2
010
Ove
rall
STRI
Fina
ncia
l ser
vice
sTe
leco
mm
u-
nica
tion
sRe
tail
Tran
spor
tati
onPr
ofes
sion
al s
ervi
ces
Coun
try
Ove
r-al
lM
ode
1M
ode
3M
ode
4O
ver-
all
Mod
e 1
Mod
e 3
Ove
r-al
lM
ode
3O
ver-
all
Mod
e 3
Ove
r-al
lM
ode
1M
ode
3O
ver-
all
Mod
e 1
Mod
e 3
Mod
e 4
Bots
wan
a38
.331
.330
.347
.0
Buru
ndi
20.2
11.8
18.9
39.0
0.0
0.0
0.0
0.0
0.0
0.0
40.0
DRC
0.0
30.0
Egyp
t24
.042
.849
.733
.380
.0
Ethi
opia
88.2
84.9
93.2
80.0
89.7
87.1
100.
010
0.0
100.
010
0.0
100.
072
.984
.010
0.0
80.0
80.0
30.1
23.4
9.7
28.2
0.0
0.0
31.0
22.2
73.0
80.0
Leso
tho
27.3
22.0
0.0
0.0
0.0
9.4
37.0
0.0
20.0
Mad
agas
car
18.7
40.0
31.2
87.1
0.0
0.0
0.0
33.3
40.0
Mal
awi
34.2
31.8
31.8
38.0
33.3
Mau
riti
us30
.440
.09.
09.
70.
00.
00.
00.
020
.042
.033
.340
.040
.0
Moz
ambi
que
10.8
17.2
34.7
0.0
0.0
0.0
30.0
41.7
0.0
37.0
29.7
40.3
27.4
29.7
34.0
80.0
Rwan
da23
.10.
00.
00.
020
.332
.00.
0
Sout
h Af
rica
1.8
37.1
0.0
47.9
0.0
Tanz
ania
30.7
10.0
29.7
22.7
9.7
29.4
0.0
Uga
nda
29.4
28.2
27.7
21.1
38.0
0.0
30.0
Zam
bia
21.0
13.7
21.3
8.4
19.4
9.7
0.0
0.0
0.0
44.0
0.0
Zim
babw
e73
.1
23Inclusive Economic Transformation
services and Rwanda’s concentrates on tourism
Uganda has had the most comprehensive SPR of the three, with a first phase report in 2011 focused on insurance, legal, accounting, and construction and engineering services and a second phase report in 2014 with an emphasis on distribution services, ICT and computer-related services, and transport services
Integration Studies prepared by individual LDCs
also provide an important basis for identifying
the constraints they face.
a more recent picture of the services regimes in a number of TFTA countries, the GATS
member states remain the crucial starting point for regional services negotiations on a number of fronts. In this regard, the wide
countries, together with the absence of GATS schedules as an initial reference point for
will complicate regional negotiations going
varied scope of existing GATS commitments and the unequal levels of development of the
provisions of GATS Article V governing services trade agreements. Article V(1) of the GATS provides that regional services agreements
terms of “number of sectors, volume of trade
must provide for “the absence or elimination of
to national treatment within a reasonable period of time, both through “the elimination
prohibition of new or more discriminatory 32 Article V(3) provides for
Article V(1) in the case of services agreements among developing countries, particularly with respect to “the elimination of substantially all
to do so. Article V(7a) requires prompt notification of the services agreement to the Council for Trade in Services, while Article V(7b) provides that services agreements implemented over a period of time should
progress in implementation.
An immediate problem is that there is no consensus on the interpretation of GATS Article V provisions particularly with respect to what
33 Least developed countries, for example, which have generally made minimal GATS commitments
trade agreements in particular to meet the requirements of Article V(1). Furthermore, there
acceptable in the case of services agreements among developing countries. However, one
agreements in which all parties are developing
are not party to the regional services agreement
in the territory of one of the parties should receive the preferences available in terms of
this provision in the case of regional services agreements among developing countries. More
a developing country services agreement may be limited to service providers “owned or controlled by natural persons of the parties to
34 This could be useful
32 Article V(1) of the GATS. [Online] Available at .
case of GATT Article XXIV covering regional agreements on trade in goods.
34 Article V(3b) of the GATS. [Online] Available at .

24
for eastern and southern African countries wishing to negotiate on the development of
South services negotiations.
Although LDCs and other countries with minimal
the requirements of Article V(1) in terms of
would arguably have greater policy space and
negotiating leverage in regional negotiations
bilateral level compared to countries with fewer existing obligations. This may account for the reluctance to bind what is currently applied in the domestic services policy context in multilateral offers in the Doha Round since

Inclusive Economic Transformation
Seychelles, South Africa, Swaziland, Tanzania, Zambia, Zimbabwe.
The countries of eastern and southern Africa have committed to regional and bilateral services negotiations on a number of fronts. Apart from their own internal services negotiation processes, the regional economic communities (RECs) of SADC, COMESA, and
Trade Area (TFTA) negotiations with Phase II set to cover services, as well as the Continental Free Trade Area (CFTA) negotiations where both goods and services fall under Phase I of the negotiations. Furthermore, some countries in the region have agreed to negotiate on services in the various Economic Partnership Agreements (EPAs) with the EU. This section considers the coherence, sequencing, and interaction between the various negotiations and their relationship with existing GATS commitments.
4.1 The SADC Trade in Services Protocol
The Southern African Development Community (SADC) was established in 1980 as the Southern African Development Co-ordination Conference (SADCC) to reduce the Frontline States’ economic dependence particularly, but not only, on apartheid South Africa. It began as a loose organisation adopting a functional approach to economic integration with a focus on sectoral and project co-operation in
mining, energy, industry and trade, agriculture and food security, and tourism. The 1992 SADC Treaty transformed the grouping into the Southern African Development Community and provided for a move towards deeper economic integration. South Africa became a member in 1994, following the transition to democracy.
initiating the move towards an FTA (Cattaneo
launched in September 2000, and the SADC FTA
in August 2008. SADC’s integration agenda is mapped out in the Regional Indicative Strategic Development Programme, recently revised to emphasise the re-prioritisation of regional industrial and infrastructure development by
for a SADC agreement on trade in services.
adopted at the SADC Summit in August 2012. The Protocol, which is similarly structured to
trade negotiations within SADC, modelled on the GATS scheduling approach. Article 2 outlines the objectives of the Protocol as follows:
1. progressively liberalise intra-regional trade in services on the basis of equity, balance
achieving the elimination of substantially all discrimination between State Parties
in services with a view to creating a single
2. promote sustainable economic growth and development, thereby raising the standard and quality of life of the people of Southern Africa…;
3. enhance economic development,
investment in the services economies of the Region;
4. ensure consistency between liberalisation of trade in services and the various
fully preserving the right to regulate and to introduce new regulations; and
4. SERVICES TRADE NEGOTIATIONS AT THE REGIONAL AND CONTINENTAL LEVELS

of the services sectors of the State Parties.37
provision of Article V(1b) of the GATS, namely that regional agreements on trade in services should pursue the “elimination of substantially
agreement. The fourth objective draws attention to the need to ensure coherence between the Trade in Services Protocol and existing SADC Protocols on particular services sectors, a number of which emerged out of SADCC’s earlier sectoral cooperation approach.
sectors include, amongst others, those on Transport, Communications and Meteorology
(1997), Tourism (1998), Movement of Persons
processes in related sectoral protocols is re-emphasised in Article 7 of the Services Trade Protocol on Mutual Recognition, Article 12 on Monopolies and Exclusive Service Suppliers, Article 18 on the Promotion of Trade and Investment in Services, Article 19 on Business Practices, and Article 24 on Institutional Arrangements. Sectoral annexes to the Trade in Services Protocol are being negotiated to align the Services Trade Protocol to the individual sector Protocols.
emphasises that parties not only preserve the right to regulate but also to “introduce new
V(1bii) on regional services agreements calls for the “prohibition of new or more discriminatory
and purpose of the regulations. However, this
has the potential to cause controversy with respect to regulations that may be introduced to pursue domestic development objectives. Article 3 of the Services Trade Protocol
accordance with the four GATS modes of supply. The general obligations of the Protocol provide
to maintain or enter into new services trade agreements with third parties and to liberalise further with particular SADC parties to the agreement provided that other SADC parties are given the opportunity to negotiate any preferences so granted on a reciprocal basis. Member states are also permitted to attach an
GATS, subject to periodic review.38
Other general obligations and disciplines cover transparency, domestic regulation, mutual recognition, monopolies and exclusive service suppliers, treatment of subsidies, general exceptions, and the exclusion of government
these general obligations are similar to those in the GATS, there are a number of differences related to the particular circumstances of SADC as a grouping of countries at highly unequal levels of development. These
the SADC Protocol on the Right to Regulate which emphasises more strongly that “[i]n light of the asymmetry in terms of State Parties
be granted to State Parties which are at a disadvantage by reason of size, structure, vulnerability and level of development to use
39 Assistance to and facilitation of the participation of LDCs and disadvantaged countries is also emphasised in Articles 7(3) (Mutual Recognition) and Article 8(3b) (Transparency). Article 11 of the SADC Protocol on the use of subsidies is more strongly worded than Article XV of the GATS, emphasising that
37 SADC Trade in Services Protocol, Article 2. [Online] Available at http://www.sadc.int/documents-publications/show/1933. See also Cronjé (2014).
38 SADC Trade in Services Protocol, Article 4. [Online] Available at http://www.sadc.int/documents-publications/show/1933.
http://www.sadc.int/documents-publications/show/1933.
27Inclusive Economic Transformation
“[n]othing in this Protocol shall be construed to prevent State Parties from using subsidies
that there will be future negotiations in this
apply to services sectors included in a member state’s schedule of commitments. These obligations are phrased in a similar manner to those in the GATS. The Protocol also provides,
through successive negotiating rounds with each round commencing three years after the
will cover six priority sectors, namely communication services, construction services,
and travel, and transport services. Future negotiations will cover all sectors, subject to
states that Parties which are “disadvantaged by reason of size, structure, vulnerability and level of development of their economy shall
of the commitments negotiated under each 40
SADC LDCs and vulnerable economies will be
41 It is arguable that LDCs may be more willing to extend existing commitments at the regional rather than the multilateral level. Ultimately, however, conformity with Article V of the GATS on substantial sectoral coverage and
the removal of substantially all discrimination between Parties to the SADC Trade in Services Protocol will be required. By engaging in services liberalisation under a GATS-type scheduling approach, the SADC countries will be obliged to ensure conformity with Article V of the GATS, including Article V(7) requiring
party may be set up by the Council to examine whether the agreement complies with Article V of the GATS.42
It is noteworthy that four of the six priority
are also amongst the broad sectors in which most sub-sectoral commitments were made under the GATS (communication services,
tourism services) (see Table 3.1a). Five of the six priority sectors are covered by existing SADC sectoral protocols, the exception being construction services. Most of the priority sectors also feature as focus sectors in at least
and southern African countries to date. The COMESA services negotiations cover the same six priority sectors as the SADC negotiations plus business services.43 The EAC negotiations, which are the most advanced, also cover seven sectors, but include education and distribution services, along with business, communication,
access and national treatment commitments began in April 2012 following the approval of a set of negotiating and scheduling guidelines
http://www.sadc.int/documents-publications/show/1933.
http://www.sadc.int/documents-publications/show/1933. The majority of SADC member states are LDCs and vulnerable economies. Recall that LDCs are not
42 Possible alternative negotiating approaches to regional services cooperation are explored in Section 4.4 below.

28
Forum-Services.44 In terms of the scope of the negotiations, the six SADC priority services sectors for liberalisation, namely communications, construction, energy-related,
“deemed to cover the sub-sectors included in
approach, there will be limited sub-sectoral coverage of energy services in the SADC negotiations as a result, with only three sub-sectors (services incidental to mining, services incidental to energy distribution and pipeline transport, transportation of fuels) regarded as energy-related services sub-sectors. However,
to all energy services, irrespective of whether
He recommends that CPC Version 2 (2008) be used for energy services in the SADC schedules of commitment, rather than the Provisional CPC of 1991.
The negotiating and scheduling guidelines state
round of SADC negotiations will be the existing GATS commitments of member states and that the offer-request method of negotiation will be
existing GATS obligations should be offered by each party in each of the priority sectors. The extent of the additional commitments expected
ting
guidelines re-emphasise the principle of asymmetry set out in the Trade in Services Protocol, stating that “[d]isadvantaged State
fewer sectors and liberalise fewer types of
Protocol on Trade in Services is seen as an important instrument for giving impetus to the implementation of the provisions of existing sectoral protocols in particular services sectors (tralac 2011, 11).
4.2 COMESA and EAC Services Negotiations
COMESA began as the Preferential Trade Area for Eastern and Southern Africa (PTA), formed in 1983 as part of the OAU initiative
objective was to facilitate intra-regional trade by gradually lowering tariff and other trade barriers, although the intention was always to develop into a deeper integration arrangement. In line with their longer term vision, member states signed a new treaty in December 1994,
for Eastern and Southern Africa (COMESA) (Cattaneo 1998, 17). A free trade area has been in place among a subset of member states since 2000. COMESA’s integration agenda emphasises trade integration, infrastructure development, and investment promotion. There is a focus on science and technology development and cooperation in sectors such as transport, communication, energy, and agriculture. There has also been a strong emphasis on trade facilitation and the development of institutions
House.47
The Treaty Establishing the EAC48 was signed in
44 See SADC (2009).
http://unstats.un.org/unsd/cr/registry/regct.asp?Lg=1.
Mauritius, Rwanda, Seychelles, Sudan, Swaziland, Uganda, Zambia, Zimbabwe. Overlapping membership between
belong to both groups.
47 For more detail see http://www.comesa.int/comesa-strategy/.
All EAC member states belong to COMESA except for Tanzania, which is part of SADC.

29Inclusive Economic Transformation
dissolved in 1977. The member states of the
as the East African Cooperation between 1993 and 2000 to resume a programme of regional cooperation and integration. The East African Cooperation Agreement was developed into the EAC Treaty between 1997 and 1999. By the
been initiated. The Customs Union became fully operational at the beginning of 2010 and
force six months later. The EAC’s integration agenda includes a move towards a common currency, with full monetary union within the next ten years.49
The COMESA Protocol on the Free Movement of Persons, Labour, Services, Right of Establishment and Residence was adopted in
that member states agree to remove barriers to services trade by 2004 in line with a liberalisation programme that would be adopted by the COMESA Council. This target date was missed, but in 2009 the Council adopted the COMESA Regulations on Trade in Services to guide the negotiation process. The regulations provide, in Article 4, for the broadening and deepening of existing GATS commitments between COMESA member states using the offer-request method of negotiation and the same scheduling approach as the GATS and SADC services negotiations. In addition, Article 4 of the Regulations provides for conformity with Article V of the GATS, as well as the right to regulate, special and differential treatment, and variable geometry. The guidelines are similarly structured to the SADC Trade in Services Protocol. As noted in Section 4.1,
the COMESA negotiations cover the same six priority sectors as the SADC negotiations plus business services, but have begun with four
tourism, and transport services. According
have been sector meetings to explore the
focus on the collection of services statistics for
In the case of the EAC, Part F of the EAC Common governs trade in services and
provides for progressive liberalisation based on a positive list approach with schedules that are structured in a similar manner to the GATS schedules. The schedules also specify an elimination date by which time the stipulated
14). One noteworthy aspect of Part F on Free Movement of Services that differs from SADC
appearing in the country schedules. However, commitments have already been scheduled by each country in all seven EAC priority sectors, including education and distribution
Protocol sets out each country’s schedule of commitments.EAC member states are currently re-negotiating commitments in Mode 4 (presence of natural persons) and mutual recognition agreements are in place in accounting, architectural, and engineering services.
Approaches to the negotiation of trade in services appear to be similar in COMESA, the
49 See http://www.eac.int/about/EAC-history for further detail.
Residence. [Online] Available at https://www.tralac.org/resources/by-region/comesa.html.
https://www.tralac.org/resources/by-region/comesa.html. Variable geometry allows a subset of member countries to liberalise more rapidly if so desired. This is also provided for in the SADC services liberalisation process.
https://www..
.

30
EAC and SADC, and follow the GATS scheduling approach discussed in detail in Section 3. All three processes build on existing GATS commitments and employ the offer-request
are at different stages, with the EAC negotiations the most advanced, the choice
been similar, with the exception of the EAC’s inclusion of education and distribution services and exclusion of construction services. One important difference to the broad sectors commonly committed in the GATS schedules of these countries is energy services, highlighted by both SADC and COMESA. As noted in Section 4.1, there was no separate broad sector
the time of the GATS negotiations. It has been suggested that the RECs use CPC Version 2 to classify energy services more systematically in their schedules of commitments (see Section 4.1). Other differences from the GATS relate to a stronger emphasis (in the case of SADC and
account of the development positions of the member states.
4.3 EPA Services Negotiations
trade relations between the EU and the ACP countries was replaced by the Cotonou Agreement, as the EU sought to develop reciprocity in its trade relations with the ACP countries and move towards compliance
obligations for the Cotonou Agreement expired in 2007. For the past decade, eastern and southern African ACP states have been engaged in contentious Economic Partnership Agreement (EPA) negotiations with the EU.
southern and eastern Africa, two of which cut across existing regional groupings. The
countries plus Angola and Mozambique, therefore conforming neither to SACU nor to
Rwanda, and Burundi. The ESA-EPA group includes Comoros, Djibouti, Eritrea, Ethiopia, Madagascar, Malawi, Mauritius, Seychelles, Sudan, Zambia, and Zimbabwe (in other words, the remainder of COMESA less the DRC, Egypt, and Libya).
The SADC-EPA negotiations were concluded
export taxes and a number of other long-
except Angola. However, EU pressure for more comprehensive EPAs covering investment, intellectual property rights, services, competition policy, and public procurement continues to be divisive. Articles 17 and 18 of the EU-SADC EPA provide for cooperation in public procurement and competition with the proviso that countries “may consider entering
will endeavour to do so as a collective. The EPA further provides that any agreement in these areas should not inhibit the development of a regional (SADC) procurement or competition
In the case of services, Article 73 stipulates that the parties “may negotiate trade in services to extend the scope of this
such negotiations with Botswana, Lesotho, Mozambique, and Swaziland. Article 74 states that the EU and these particular countries
in future consider negotiating an agreement on investment in economic sectors other than
areas should not, however, be incompatible
developing countries.
http://ec.europa.eu/trade/policy/countries-and-regions/regions/sadc/.

31Inclusive Economic Transformation
with the development of a regional (SADC)
It is evident that while a cooperative approach has been adopted to new generation issues such as public procurement and competition, there are divisions within the SADC-EPA group over the way forward on services and investment. Davies (2014, 2) argues that services and investment negotiations between the EU and some SADC-EPA countries have the potential to
procurement and competition, where SADC-EPA states have expressed the intention of
for common positions to be adopted and may complicate the development of regional (SADC)
negotiations will be important, and it seems advisable that regional processes should be concluded before negotiations on the newer
In the EU SADC EPA, the guiding principles in Article 73 on services trade negotiations are mostly straightforward. Article 73(2b) and 73(2f) suggest that negotiations will build on existing GATS commitments and follow a GATS-type scheduling approach. It should be noted, however, that Article 73(2f) does not mention
states that “negotiations shall build on the relevant provisions of existing applicable legal
In the case of negotiations that have begun with Botswana, Lesotho, Mozambique, and Swaziland, this would refer
SADC-EPA countries enter into negotiations with the EU after a SADC trade in services
Article 73, services liberalisation will be
of developing countries, and may provide for special and differential treatment.
matters, and liberalisation will be compliant with Article V of the GATS on services trade
the CARIFORUM-EU EPA negotiations it was expected that more developed economies
while relatively less developed countries
Apart from the general shortcoming of counting subsectors to determine the extent of liberalisation (see Section 3.2), this approach does not consider coverage of modes of supply and volume of trade as required under Article V of the GATS. The proportion of sub-sectors to be liberalised in the case of the SADC-EPA
in Article 73 of the EPA. The division within the SADC-EPA group on negotiating a services trade agreement with the EU means that the grouping will be unable to approach the services negotiations as a collective. However, tralac (2011, 19-20) suggests that those SADC-EPA countries negotiating services with the EU need to present a more united front and be more proactive in pushing for the designation of priority sectors of interest, as well as examining EU offers in EPA negotiations with other ACP groupings and in the Doha Round negotiations.
The EU EPA negotiations with the EAC-EPA grouping were concluded in October 2014 and
The agreement covers trade in goods and development cooperation, with a rendezvous clause (Article 3) that states that the parties
conclude negotiations on trade in services as well as other new generation
http://ec.europa.eu/trade/policy/countries-and-regions/regions/sadc/.
http://ec.europa.eu/trade/policy/countries-and-regions/regions/sadc/.
32
issues such as investment, competition, intellectual property rights, and transparency
of the entry into force of the EPA. Finally, the EU has signed an interim EPA with a subset of
the ESA-EPA group. Madagascar, Mauritius, the Seychelles, and Zimbabwe signed the interim EPA in August 2009.has a rendezvous clause providing for future negotiations on trade in services, investment and other new generation issues, the details of the processes involved and the deadlines for the negotiations are still under discussion.
different stages across the three negotiating
but Davies (2014, 3) explains that each of the EPAs also has different tariff reduction commitments, exclusion lists and rules of origin, as well as different provisions on (among others) the use of instruments such as
implications for both the regional and broader African integration agendas. The need to sequence these processes carefully may in part account for the current impetus and momentum that is apparent in the Continental Free Trade
notes that the prospect of Britain’s exit from the European Union will add a further layer of concern to this complex set of negotiations.
4.4 TFTA and CFTA Processes
In October 2008, the Heads of State and Government of SADC, COMESA, and the EAC resolved to establish a tripartite free trade area (TFTA) between the three regional blocs. The process gained momentum as a way of
southern African regional groupings. A draft
Annexes relating to matters such as customs cooperation, trade facilitation, rules of origin, trade remedies, non-tariff barriers, intellectual property rights, competition policy, services negotiations, movement of business persons, and dispute settlement. Annex 12 of the 2009 draft agreement dealt with guidelines for the negotiation of trade in services. A revised agreement with annexes appeared in December 2010, but without a revised annex on services.
at the 2011 Summit. Phase I of the negotiations was to cover trade in goods and Phase II trade in services and other trade-related matters. It was agreed in 2014 that movement of business persons would be negotiated as part of Phase
remedies, and rules of origin are, however, still
II negotiations, provides for the conclusion of protocols on trade in services and other trade-related areas within 24 months of the
(2011, 1-2) points out, it is useful to examine Annex 12 of the 2009 draft TFTA Agreement as the guidelines in this Annex appear to be the only ones available regarding Phase II services negotiations. Annex 12 indicates that a GATS-type positive list approach will be adopted using the offer-request negotiation method to agree
the method that has been adopted in all three RECs. The Annex states that commitments will include those made at the REC level and, in addition, that parties will extend existing GATS commitments to TFTA countries that are not
that requests may propose the scheduling of sub-
http://ec.europa.eu/trade/policy/countries-and-regions/regions/eac/.
http://ec.europa.eu/trade/policy/countries-and-regions/regions/esa/.
can be found at https://www.tralac.org/resources/by-region/comesa-eac-sadc-tripartite-fta.html.
33Inclusive Economic Transformation
sectors that have been unilaterally liberalised, as well as commitments in new sub-sectors or the reduction of restrictions in sectors and sub-sectors in which commitments already
sectors, the Annex states that commitments must be made in the seven designated priority sectors. These are identical to the COMESA priority sectors, which are in turn the same as the six SADC priority sectors plus business services. Annex 12 also provides for a sanction:
priority sector then they “shall not receive the preferential treatment available under the
Furthermore, commitments in the priority sectors should as far as possible
Although this Annex is clearly a limited preliminary draft, some of these provisions appear to suggest that deeper initial commitments than those provided for in the SADC and COMESA processes are expected.
Since fuller and more recent guidelines on the TFTA Phase II services negotiations have not
original (2009) draft Annex 12 is undergoing substantial revision and further development.
Council would wish to wait for further progress in the individual REC negotiations on services, and for the TFTA Phase I negotiations to be concluded, before publishing the revised TFTA services negotiating guidelines. It is arguable that the focus in the TFTA services negotiations going forward will be on the consolidation, at the TFTA level, of what has been achieved in the SADC and COMESA services negotiations and ensuring its coherence with the more advanced state of affairs in the EAC services
will shift to the Continental Free Trade Area (CFTA) process that appears to have gained
modalities for achieving a meaningful services trade agreement in the CFTA.
2012 at the 18th Summit of AU Heads of State and
to the 1980 Lagos Plan of Action and the 1991 Abuja Treaty establishing the African Economic Community. The 2012 AU Summit also sanctioned the Action Plan on Boosting Intra Africa Trade
trade policy, trade facilitation, productive capacity, trade related infrastructure, trade
with a combined GDP of over USD3.4 trillion (AU 2014). The AU initiative emphasises a development integration approach focused on
development of the continent’s productive capacities. This includes an emphasis on the establishment of negotiating modalities
development of the participating member states. Phase I of the negotiations will cover trade in goods and services, while Phase II will cover other trade-related aspects such as investment, intellectual property rights,
debate on possible alternative approaches to the basic GATS-plus scheduling method for future services negotiations has recently emerged. Arguably, a limited expansion of existing GATS commitments at the REC level may be an inadequate approach to achieving a meaningful developmental services agreement, and more so at the broader TFTA or CFTA level.
One approach that seems to have developed further in some REC negotiations than in
author).
author).

34
the GATS has been to address horizontal or cross-cutting issues that affect all sectors in more comprehensive annexes to trade in services agreements, rather than simply in GATS-type horizontal sections of commitment
provisions and greater clarity can be given on cross-cutting issues in such annexes. These
schedule inscriptions. It has been suggested that horizontal disciplines across sectors
liberalisation at the domestic or REC level) and a ratchet clause (whereby any unilateral liberalisation becomes immediately bound). These two particular horizontal disciplines have been controversial in contexts such as
as constraining policy space in the context of a group of developing countries at highly unequal levels of development.
with annexes addressing cross-cutting issues,
recommended, to facilitate cooperation on regulatory and competition issues that are
and continental regulatory bodies, private
the REC and continental levels have already made good progress in regulatory cooperation and development. AU sectoral initiatives in this
for Harmonisation of Telecom and ICT Policies
Action Plan, the Programme for Infrastructure Development in Africa (PIDA), and the Convention of the African Energy Commission
be developed further and form the basis of a continental services trade agreement.
potential starting points for the CFTA services
existing GATS schedules or on any GATS-plus commitments achieved at the REC level. This may have limited impact because of the number
differences in their levels of development and the involvement of a number of CFTA countries that have not gone through the GATS process
would be to begin with the existing state of liberalisation in the domestic economies of CFTA member states. There is, however, often a wish to preserve policy space and a (related) reluctance to bind what is currently applicable at the domestic level, particularly with the
South) bilateral services negotiations in the future. A third option would be to start with a sectoral regulatory cooperation approach, developing and building on, for example, AU and other REC sectoral initiatives.
services agreement could include two main
agreement covering general matters such as
transparency, the right to regulate, and other usual provisions. The second would involve
sectoral annexes under development in the SADC trade in services negotiations that draw on the provisions of existing sectoral SADC protocols follow a similar approach. Sectoral regulatory cooperation would not aim to impose across-the-board harmonisation, but could involve mutual recognition of standards,
for example, and regional regulatory development that is carefully sequenced and furthers domestic development objectives.

Inclusive Economic Transformation
Liberalisation of trade in services is more complex and sensitive than the liberalisation of trade in goods, due to the social nature of services and the involvement of factor movements. A sector-by-sector approach and appropriate sequencing are important to avoid unfavourable outcomes for the sector itself and the broader macroeconomy (Cattaneo 2011).
4.5 A Summary View of Regional and Continental Services Negotiations
As the discussion in Section 4 indicates, the three regional economic communities in the TFTA region have each initiated their own internal services negotiation processes that are at different stages of development, with the EAC process the most advanced. In addition to this, the RECs are set to negotiate services in Phase II of the TFTA negotiations and Phase I of the CFTA negotiations. Furthermore, some countries have signalled their intention to engage in services
TFTA negotiations seem set to consolidate what has been achieved in the SADC and COMESA processes, there is much discussion at present about the most constructive trajectory for the CFTA negotiations. In particular, there is interest in exploring how the negotiating path adopted in the CFTA may improve upon the approach that has been followed regionally to date, which generally builds on the existing GATS
As noted in Section 4.2, the negotiating approach to trade in services appears to be similar in COMESA, the EAC, and SADC, with all three processes building on existing GATS commitments and adopting the offer-request method of negotiation. There is a greater emphasis, however, and in the case of SADC
and COMESA in particular, on provisions
development of the member states. The choice of priority sectors has also been broadly similar in the three RECs, with the SADC and COMESA processes initially emphasising communication services, construction services, energy
travel, and transport services. COMESA has additionally focused on business services. The more advanced EAC negotiations cover seven sectors, and include education and distribution services, along with business, communication,
Interestingly, construction services have not been included in the EAC negotiations to date, although it is seen as a priority sector in SADC and COMESA.
The intention of some countries and regional groupings to pursue services negotiations in the EPAs may lend some impetus to the
and to the CFTA process. The countries involved in negotiations with the EU should be proactive in designating priority sectors of interest, drawing on trade data and case study analysis that assesses the prospects and potential benefits of regional versus external services trade liberalisation at the sub-sector level. At this stage, guidelines for the services negotiations in the TFTA and CFTA are not yet available. There is a view that a sectoral regulatory cooperation approach would be more beneficial than a GATS-type negotiating approach for the CFTA. Sectoral regulatory cooperation would build on existing sectoral protocols and AU initiatives and encompass mutual recognition agreements and regional regulatory development that is sensitive to domestic development goals and priorities.
The 2008 impasse in the Doha Round of trade negotiations followed what developing country trade negotiators have referred to as a steady erosion of the Round’s development agenda
in negotiations on agriculture together with increasing pressure on emerging economies
services has signalled a divergence between larger developed countries and their emerging
obligations going forward. According to Ismail (2012), a number of reasons for the 2008
These include shifts in the balance of power in the negotiations as a result of successful
that saw developing countries resist pressure
access beyond the 2008 texts. Furthermore, the attitude of US lobby groups and other constituencies that the Round has become irrelevant in the changing global environment provided little incentive for developed country negotiators to conclude the negotiations. This has been coupled with a shift away from a single
to be agreed upon, to a single issue approach, where deals on individual issues (such as trade
agreement on other issues of concern (such as agriculture). In this vein, at the Bali Ministerial in 2013, the Trade Facilitation Agreement was
LDC issues (including operationalisation of the services waiver) and food security.
Alongside the shift away from the single
plurilateral negotiations such as the Trade in Services Agreement (TiSA). According to Ismail
impact on developing country coalitions and
suggests that differences on how to address
these changes meant that it was harder for
s that it will be important for the Africa group to re-unify and develop a strategic approach to the new environment
participation in the TiSA plurilateral process is related to the view that a move towards single
prospects of meaningful progress in agriculture and other areas of particular interest to developing countries.
The new global environment following the Doha impasse has also been characterised by the emergence of mega-regional trade negotiations led mainly by the US and other large developed economies. Together with the move towards single issue plurilaterals, it has been argued that the mega-regional negotiations aim to provide a space for the conclusion of trade deals that focus on issues of interest to developed country multinational corporations operating in global value chains and to counter increasing
it is in the context of these mega-regional and plurilateral trade negotiations, as well as in
and international investment agreements, that some of the newer generation trade-related
the mega-regional negotiating landscape is changing rapidly and is in a state of uncertainty following the US Presidential election, the
uncertainty, it is important to consider the implications of these processes for services negotiations on the African continent.
5.1 Mega-Regional Trade Negotiations
The mega-regional trade negotiations include,
Agreement (TPP), the Trans-Atlantic Trade and Investment Partnership (TTIP), and the Regional
5. CHALLENGES AND OPPORTUNITIES: THE POTENTIAL IMPACT OF EXCLUSION FROM MEGAREGIONAL AND PLURILATERAL SERVICES TRADE NEGOTIATIONS

37Inclusive Economic Transformation
Comprehensive Economic Partnership (RCEP). The TPP Agreement involves Australia, Brunei,
Zealand, Peru, Singapore, Vietnam and, until recently, the US. The TTIP negotiations are
China, RCEP includes both China and India, but not the US. Seven countries are involved in both the TPP and RCEP. There are no LDCs in the TPP but there are two LDCs in the RCEP formation (Cambodia and Myanmar). There are no African countries involved in the mega-regional trade negotiations. Despite the US withdrawal and the uncertain future of the TPP, the Agreement is interesting to consider as it includes both developed and developing countries and the
agenda for regulatory convergence that has a number of characteristics that go well beyond
example, the EPAs and international investment treaties. The potential impact of such trade deals on the African continent is important to consider.
After seven years of secretive negotiations,
Parties to the agreement. It is currently awaiting
place within a period of two years. There was much controversy surrounding the Agreement in the US, as evidenced by the campaign on the US Trade Department’s website, in place until
2017, to promote the Agreement and advertise
the announcement of the US withdrawal from the TPP, this campaign has been replaced by a paragraph describing a new “America First
The TPP Agreement has 30 chapters plus a set of annexes and covers a wide range of areas from trade in goods and services to investment, intellectual property protection, government procurement, competition policy, labour, the environment and even the operation of state-owned enterprises. Since the TPP negotiations have been concluded and involve a mix of developed and developing economies, it is interesting to consider the services aspects of the Agreement and some of the arguments surrounding the potential impact such an agreement could have on African economies. In the services arena the TPP has separate
services, temporary entry for business persons, e-commerce and telecommunications.
Chapter 10 of the TPP deals with cross-border
services.70 The provisions of Chapters 10 and 11 do not apply to government procurement or
as the GATS but omit the restriction in the GATS against imposing a percentage limitation
that local presence or investment may not be stipulated as a requirement in order to supply a service across a border. Article 10(8) recognises the right to regulate and to introduce new regulations. The services provisions of the TPP adopt a negative list approach in contrast to
the TPP. If the US is included, the TPP and TTIP would each impact on over a quarter of global trade and investment (see https://www.weforum.org/agenda/2014/07/trade-what-are-megaregionals/). Furthermore, there is considerable overlap between the TPP and RCEP in terms of membership, with the notable exception of China.
https://ustr.gov https://ustr.). Interestingly, a series of chapter summaries
that strongly promote the Agreement from a US perspective can still be found with the text of the main agreement. The withdrawal letter can be found at
.
70 See .

38
the positive list approach of the GATS and the eastern and southern African RECs. Although a negative list approach is generally viewed as more transparent, it is more restrictive in terms of policy space and automatically subjects new services areas to the liberalisation provisions of the agreement even if such services did not exist at the time the agreement was negotiated. The country schedules specifying the exceptions to Chapter 10 services obligations distinguish between exceptions which may not be made more restrictive in future and those to which no such constraint applies. Article 11(11) of
provides that no party will be prevented from “adopting or maintaining measures for
services, Article 11(9) on senior management and boards of directors, prohibits parties
institutions of another party to impose employment requirements for local managerial or other essential personnel. Parties may also not require that “more than a minority of the
of another Party be composed of nationals
implications for economic empowerment policies adopted in many developing countries.
of the trade in services provisions of the TPP are similar to those of the GATS. The TPP is, however, clearly intended to provide for more extensive services trade liberalisation than the GATS, both through particular provisions and the adoption of a negative list approach. The TPP also provides for an investor-state dispute settlement mechanism, in contrast to the
investor-state dispute settlement system has generated much controversy in the context of international investment agreements (Cattaneo
chapters on investment and the operation of state-owned enterprises is beyond the scope of this paper, but their close relationship to
areas for further scrutiny and research.
The deeper liberalisation and regulatory convergence within the TPP (and proposed for the TTIP) implies that excluded countries can expect to be affected in a number of ways. Draper and Ismail (2014) analyse a variety of
an assessment of the impact on sub-Saharan African countries. Firstly, to the extent that common standards and regulatory convergence are achieved within the mega-regionals, the importance of these groupings in world trade
towards adopting or conforming
the conclusion of the mega-regional deals
participate in global value chains. Draper
TTIP, and RCEP cover the main centres of
and East Asia. They argue that there may be
the development of productive capacity in sub-Saharan Africa as a consequence of the mega-regionals. Both of these aspects could have important implications for the services sectors of these countries.
One suggested response is to see the TTIP, for example, as an opportunity for the US and EU to improve their preference schemes in favour of African LICs and LDCs (Draper and Ismail 2014, 4). However, the EPA negotiations and
Act suggest that this view is unrealistic. If anything, the move is in the other direction, with demands for reciprocity coming from
preference erosion and increased competition will be experienced by African countries in
been concluded. African countries will have to develop a set of strategic responses to counter the possible adverse effects of these deals.
Trade facilitation and reliance on the possibility of better preferences from developed countries,
39Inclusive Economic Transformation
as well as on meaningful operationalisation of
in terms of a strategic response to the mega-regional challenge. As Draper and Ismail (2014,
responses are also required. Furthermore, although a focus on infrastructure development
telecommunications, and transportation is critically important, the pressing question for African LICs and LDCs is how productive transformation policies, complemented by a developmental services strategy, can be made effective in a context of GVCs and mega-regional trade negotiations.71 LICs and LDCs should not be trapped in the lower value added service segments of GVCs while the high value ends are
There must be scope for upgrading along the
implementation of the CFTA would be an important step in this environment, together with the development of regional value chains and an industrial development strategy.
A further important response would be to enhance South-South cooperation in trade and investment, including in services sectors. This is already happening on the continent
development of trade and investment relations
3), consolidation of these trade relations will offset the trade diversion effects of the mega-regional trade deals. External trade creation due to increased demand from the mega-regional area as a result of higher incomes following its formation could also offset trade diversion from excluded countries (Putzhammer
African countries, however, to negotiate the terms of these relationships in such a way as to improve the balance and composition of trade with East and South Asian partners to support growth-enhancing structural transformation on the continent. From a services perspective, the nature of bilateral services trade and
investment relations with these countries needs further examination, as does the importance of services in bilateral value added trade with partners in the South.
A number of recent studies have attempted to estimate the impact of mega-regional trade deals on excluded countries such as those on the African continent. These studies tend to evaluate the impact of the agreement as a whole, since they cover more than just services. Results have been mixed, as the following two quotations suggest:
…[M]odern simulations show that the effect of mega-regionals on Africa will mostly be a positive one. Only a few countries should expect negative welfare impacts under the
effects are generally low, they might hit
since there is little data on the distribution of effects among the population, chances are that the poorest might have to carry this burden. On the brighter side, mega-regionals are expected to have positive effects on average for African countries
Empirical evidence based on computable
that while the establishment of the three major MRTAs would create vast export opportunities for their members, especially in RCEP countries, African economies would
assessment which is highly dependent on underlying assumptions and the reliability of the data used in the model. In the case of CGE analysis related to the impact of the liberalisation of trade in services in particular, data availability and measurement issues are even more challenging, particularly in the case of LDCs and LICs (Cattaneo 2011).
71 For a useful discussion on power relations and productive transformation strategies in a context of global value chains

40
Complementary approaches should also be used in assessing the effects of trade regime changes, including case study analysis.
the mega-regional trade negotiations are driven by the interests of developed country multinationals in the context of the re-organisation of production and trade in global
disciplines in areas such as services, investment, intellectual property protection, trade facilitation, and competition policy appear to be designed to further these interests.72 Issues of particular importance to LDCs are not a major part of the mega-regional landscape. It is therefore important for African LDCs and
at continental and regional levels to foster an
account of their development imperatives.
5.2 Plurilateral Negotiations on Trade in Services
discussions on a plurilateral services agreement were initiated following calls by services sector groupings, particularly in the US and Australia, to move forward with negotiations in this area. Many developing countries argue that plurilateral agreements
the negotiation process from agriculture and other Doha Development Agenda issues.
have joined the Trade in Services Agreement (TiSA) negotiations, although Mauritius is the only African country currently participating.
in the negotiations: Australia, Canada, Chile, Chinese Taipei, Colombia, Costa Rica, the EU,
aland,
countries are LDCs.
According to Cronjé (2013), the TiSA parties
negotiations in the future, with a view to the eventual multilateralisation of the agreement, rather than the negotiation of a GATS Article V services integration arrangement. However, the TiSA negotiations have been criticised for
to attend as observers (Cronjé 2013). In response to some of the criticism, the EU has published a number of its own position documents related to the negotiations, including its initial 2013 offer and a proposal for a state to state dispute settlement mechanism.73 According to the European Commission, TiSA is based on the
access, national treatment, and exemptions.74
The core text is being structured in such a way as to be compatible with the GATS in order to
The impact on those outside of the TiSA process (most African countries, MERCOSUR, and the BRICS, for example) will depend on whether or not the agreement is multilateralised on an
drafts of the TiSA core texts, chapters and annexes. The latest draft of the core text that
access provisions in the core text follow the GATS approach where commitments apply only to sectors listed in the schedules and are
national treatment clause is different. The national treatment provision does not limit such treatment to the sectors inscribed in
of the US Trade Representative website at https://ustr.gov/tpp/#text, with the opening invitation to “read the deal
73 See http://trade.ec.europa.eu/doclib/press/index.cfm?id=1133.
74 See http://ec.europa.eu/trade/policy/in-focus/tisa/.
.
41Inclusive Economic Transformation
the schedules, suggesting that it applies to all services and modes of supply unless otherwise stated explicitly. In addition, new disciplines are provided for, such as those on domestic
provisions of the GATS are so far absent in the TiSA draft text. Moreover, the exclusion in the text on government procurement of services is
the exclusion only applies to services procured by government that are not for re-sale, suggesting that the exclusion would not apply when government secures contracts to supply public services such as water and electricity, or social services. Other commentators have raised concerns about the prospect of provisions that bind the status quo across sectors and automatically extend liberalisation to new services that may emerge (so-called standstill and ratchet provisions). From a developing country perspective, draft TiSA
enterprises in particular require detailed analysis to examine their implications for the
institutions, as well their impact on the public policy role of SOEs.
Since most eastern and southern African
Another option would be for TiSA to be attached
an action. The alternative that seems the most
services trade agreement. It is advisable for the
negotiations, particularly the development of annexes and chapters that go further than the GATS and REC negotiations and whether the texts remain as potentially limiting to developing country policy space. A particular issue is the
needs and imperatives of developing countries and the absence of special and differential treatment provisions for LDCs. It is unclear that the latter would change in the event that any LDCs decide to join the discussions.
th
http://www.ituc-csi.org/global-union-statement-of?lang=en.
42
The services sector has the potential to occupy
strategies of low-income and least developed African countries. The re-organisation of production and trade in global and regional value chains highlights the importance of the services sector as a supporter and facilitator of manufacturing. At the same time, particular modern services sectors have the potential to generate both employment and value added growth and contribute to growth-enhancing structural change. The manufacturing sector provides an important source of demand for the services sector, and the centrality of manufacturing in the development process suggests that a focus on services alone to the
a development strategy. This reinforces the
manufacturing and services growth at both the sub-sectoral and sectoral levels.
The countries of the eastern and southern African region face a challenging international environment within which to shape and navigate the various regional and continental services trade negotiations currently under way. This environment includes mega-regional trade negotiations from which the continent is excluded, as well as single issue plurilateral
such as agriculture that are of particular interest to LDCs in the multilateral setting.
trade and investment agreements and the reorganisation of production and trade in global value chains dominated by developed country multinationals are further features of the current global landscape. This environment requires a set of strategic policy responses at multilateral, regional, and domestic levels to harness the services sector and investment for growth and development in African LICs and LDCs. Strategies for the services sector and services trade negotiations should not be approached in isolation from African countries’ broader development goals and policies. Industrial, agricultural, and technology policies,
to services sector activities, particularly as the boundaries between traditional economic sectors become more indistinct.
In this context, a range of policy initiatives towards the promotion of a developmental services strategy should be considered. The development of domestic regulatory
precursor to participation in services trade negotiations. It can also be argued that the
cooperation in particular services sectors will
Legal assessment of core texts, sector annexes, and relevant chapters of the TPP, TTIP, and TiSA
to navigate the emerging international services negotiations landscape and to prepare for changes such as Britain’s exit from the European Union and pressure from the US to negotiate reciprocal FTAs with services and investment chapters. An assessment of existing and potential trade and investment relations with partner countries that are also outside
particularly China, the rest of BRICS, and the
in regional and global value chains should be explored.
South Africa’s Trade Policy and Strategy
to participate in the world economy while
domestic development objectives (DTI 2010). There are regional, bilateral, and multilateral aspects to this engagement. The analysis of ongoing negotiations at the REC level and proposed negotiations at the continental level
suggests that the idea of strategic global
6. CONCLUSION: TOWARDS A DEVELOPMENTAL SERVICES STRATEGY
43Inclusive Economic Transformation
integration is embraced more broadly on the continent as well.
This suggests a number of ways forward on how to approach negotiations at different levels (multilateral, regional, and bilateral, and in
in the current global environment. At the multilateral level, it is important for countries to re-unify the Africa group at the
group, and develop new alliances with other developing countries. Although there are divergent interests among developing countries in many areas, it is important to develop strategies on how to manage the shift away
that areas of importance to LDCs and LICs are addressed.
Another important response to the mega-regional landscape is to prioritise the CFTA negotiations with a manageable agenda and
case of services, this is especially important for developing countries that are not
members and have therefore not had the GATS negotiating experience. The development of
future negotiations as it will include setting up collaborative structures with local and regional
at the regional level could be developed with respect to plurilateral negotiations, the mega-regionals, and international investment agreements.
The approach to regional integration currently highlighted by SADC, COMESA, and the TFTA, as well as at the continental level, is one of development integration, focusing on trade integration, infrastructure and industrial
the highly unequal levels of development of the countries of the region. Regional industrial policy and cooperation between development
are important aspects of this approach. As Ismail
provides the most useful approach to regional development in terms of achieving the targets
Sustainable Development Goals. The services sector has a critical role to play in this regard.
44
REFERENCES
ACET (African Center for Economic Transformation). 2014. Growth with Depth: 2014 African Transformation Report
AU (African Union). 2014. Update on the Continental Free Trade Area (CFTA). Addis Ababa: African Union. wd-update_on_the_report_on_the_continental_free_trade_en.pdf
Services Exports for Growth and Development: Case Studies from Africa. Addis Ababa: African Union. https://www.tralac.org/images/docs/9200/trade-in-services-
Preferences. Geneva: International Centre for Trade and Sustainable Development (ICTSD).
The Theoretical and Empirical Analysis of Trade Integration among Unequal Partners: Implications for the Southern African Development Community. Unpublished Master of Science Dissertation, Department of Economics and Economic History, Rhodes University, Grahamstown.
Journal of Contemporary African Studies
South African Institute of International Affairs (SAIIA) Occasional Paper No.94, September.
at the VIIth BRICS Academic Forum, Moscow, 22-23 May.
Conference on Manufacturing-led Growth for Employment Equality co-hosted by the SA-EU Strategic Partnership Dialogue Facility and Trade and Industrial Policy Strategies (TIPS),
http://www.comesa.int/comesa-members-states/
Working Paper for the Department of Trade and Industry. Pretoria: Trade and Industrial Policy Strategies (TIPS).
Inclusive Economic Transformation
Trade Law Centre (tralac) Discussion Note. Stellenbosch: tralac.
The SADC Protocol on Trade in Services: What is Necessary to Support the Establishment of an Integrated Market? Trade Law Centre (tralac) Working Paper No. S14WP05/2014. Stellenbosch: tralac.
Trade Law Centre (tralac) Discussion Note. Stellenbosch: tralac.
Personal Communication.
Trade Law Centre (tralac) Discussion Note, Stellenbosch: tralac.
UNU-WIDER Research Paper, 2006/49
African Security Review
GREAT Insights Magazine
Development Research Centre Working Paper No. 46, London: London School of Economics.
Draper, P. and S. Ismail. 2014. “Sitting on the Sidelines: How will Mega-regionals Affect African Bridges Africa 3(10), 1 December.
DTI (South African Department of Trade and Industry). 2010. A South African Trade Policy and Strategy Framework. Pretoria: International Trade and Economic Development Division, South African Department of Trade and Industry.
http://www.eac.int/about/partner-states
World Bank Policy Research Working Paper No. 7743
Lexology http://www.
Development Southern Africa
World Economic OutlookEconomic &
Political Weekly XLVII, 31, 4 August.
Trade Hot Topics Issue 131. London Commonwealth Secretariat.
http://www.trademap.org/Index.aspx
Working Paper https://www.
TiSA: Updated Analysis of the Leaked ‘Core Text’ from July 2016
Learning, Technology Acquisition and Governance Challenges in Developing Countries. Report prepared for DFID, London.
Trade Law Centre (tralac) Working Paper No. D11WP10/2011. Stellenbosch: tralac.
South Africa’s Way Ahead: Shall We Samba?
No.3, December.
GATS 2000: New Directions in Services Trade Liberalization, edited by P.
Trade Law Centre (tralac) Working Paper No. 8
Centre for Research in Economic Development and International Trade (CREDIT) Research Paper No. 15/03
Supporting Regional Integration in East and Southern Africa: Review of Select Issues, edited by C.
tralac and Pretoria: the Royal Danish Embassy (Danida).
https://tis.sadc.int/english/tis/documents-and-resources/resources-by-sector-and-topic/energy-related-services/
Bridges Africa
Transforming Economies: Making Industrial Policy Work for Growth, Jobs and Development
47Inclusive Economic Transformation
OECD Trade Policy Papers No. 185, Paris: OECD
Journal of Contemporary African Studies
Trade Law Centre Discussion Note https://
integration-and-industrial-development-going-forward.html
OAU (Organisation of African Unity). 1991. Treaty Establishing the African Economic Community. http://www.wipo.int/edocs/lexdocs/treaties/en/aec/trt_aec.pdf
Joint OECD-WTO Note http://www.oecd.org/sti/ind/49894138.pdf
In The New Palgrave Dictionary of Economics (2e), edited by S. Durlauf and L. Blume.
Bridges Africa
SADC (Southern African Development Community). 1992. “Declaration and Treaty of the Southern http://www.sadc.int/
for the 1st https://tis.sadc.int/
http://www.sadc.int/member-states/
Transforming Economies: Making Industrial Policy Work for Growth, Jobs and Development
Trade Law Centre (tralac) Working Paper No. S17WP04/2017. Stellenbosch: tralac.
Trade Law Centre (tralac) Working Paper No. S16WP03/2016. Stellenbosch: tralac.
UNU-WIDER Research Paper
48
Industrial Policy and Development: The Political Economy of Capabilities Accumulation. M. Cimoli, G. Dosi, and
Trade Law Centre (tralac) Special Report No. S15SR01/2015
GGDC Research Memorandum No. 149. http://www.ggdc.net/publications/memorandum/gd149.pdf
Trade and Industrial Policy Strategies (TIPS) Research Report Series 2011-03. Pretoria: TIPS.
Tregenna, F. 2008. “The Contributions of Manufacturing and Services to Employment Creation and South African Journal of Economics
Tregenna, F. 2009. “Contracting Out of Service Activities and the Effect on Sectoral Employment Cambridge Working Papers in Economics No. 0906. Cambridge:
Faculty of Economics, University of Cambridge.
Manual on Statistics of International Trade in Services.
Towards SADC Services Liberalization: Balancing Multiple Imperatives
Services Policy Review: Uganda
Services Policy Review: Lesotho
Services Policy Reviews: A Detailed Methodology for Reviewing Policy, Regulatory and Institutional Frameworks for Services
Services Policy Review: Rwanda
Services Policy Review: Uganda II
World Investment Report 2016: Investor Nationality - Policy Challenges
Handbook on the Least Developed Country Category: Inclusion, Graduation and Special Support Measures (Second Edition)

49Inclusive Economic Transformation
http://www.un.org/en/development/desa/policy/cdp/ldc/ldc_list.pdf. Last
Statistical Papers Series M No. 77
Economic Report on Africa 2015: Industrializing through Trade
Industrial Development Report 2013: Sustaining Employment Growth: The Role of Manufacturing and Structural Change.
CIRANO Working Paper 2001s-43 (revised)
Global Policy
org/data-catalog/world-development-indicators
. https://www.wto.org/english/tratop_e/serv_e/mtn_gns_w_120_e.doc
Modalities for the Special Treatment for Least-developed Country Members in the Negotiations on Trade in Services. TN/S/13
Doha Work Programme: Ministerial Declaration Adopted on 18 December 2005, WT/MIN(05)/DEC, 22 December https://www.wto.org/
Preferential Treatment to Services and Service Suppliers of Least-developed Countries. WT/L/847
World Trade Report 2014: Trade and Development: Recent Trends and the Role of the WTO https://www.wto.org/english/res_e/
International Trade Statistics 2015 https://
https://www.wto.org/english/

ANNEX 1. OVERVIEW OF TFTA COUNTRIES BY INCOME CATEGORY AND REGIONAL MEMBERSHIP
Source: Author’s compilation from World Bank (2016), UNDESA (2016), SADC (2016), COMESA (2016), EAC (2016), WTO (2016)Notes: NOC=high income non-OECD, UMC=upper-middle-income country, LMC=lower-middle-income country, LIC=low-income country (World Bank 2016); LDC=least developed country (UNDESA 2016).§Graduates from LDC status in 2021.§§Accession to COMESA and EAC in progress.#While other LMCs on this list appear to qualify as LDCs, Swaziland evidently does not.
WB (UN) COMESA EAC SADC SACU CMA WTO
Angola UMC (LDC)§ SSA
Botswana UMC SSA
Burundi LIC (LDC) SSA
Comoros LIC (LDC) SSA
DRC LIC (LDC) SSA
Djibouti LMC (LDC)
Egypt LMC
Eritrea LIC (LDC) SSA
Ethiopia LIC (LDC) SSA
LMC SSA
Lesotho LMC (LDC) SSA
Libya UMC
Madagascar LIC (LDC) SSA
Malawi LIC (LDC) SSA
Mauritius UMC SSA
Mozambique LIC (LDC) SSA
UMC SSA
Rwanda LIC (LDC) SSA
Seychelles SSA
South Africa UMC SSA
South Sudan§§ LIC (LDC) SSA
Sudan LMC (LDC) SSA
Swaziland LMC# SSA
Tanzania LIC (LDC) SSA
Uganda LIC (LDC) SSA
Zambia LMC (LDC) SSA
Zimbabwe LIC## SSA
Table A1: TFTA Countries: Income Categories, LDC Status, Membership of Regional Groupings, and the WTO

Inclusive Economic Transformation
ANNEX 2. GROWTH RATES OF VALUE ADDED, EMPLOYMENT, AND PRODUCTIVITY IN SELECTED AFRICAN ECONOMIES
Source: Author’s computations from Timmer et al. (2014)
Source: Author’s computations from Timmer et al. (2014)
Percentages VA EMP PROD VA EMP PROD1990-2000 2000-2010
Agriculture 0.7 2.1 -1.4 2.2 4.3
Mining 9.8 11.4 8.7 10.3
Manufacturing 8.7 -3.1 7.4 10.9 -3.1
Utilities 3.0 2.3 0.7 0.7
Construction 3.9 10.1 12.0
Trade, restaurants, hotels -0.8 10.9 11.8 -0.8
Transport, storage, communications
10.8 7.0
FIRE, business services 8.1 12.2 -2.7
Government services 14.1 7.3 7.3 0.9
Community, social, personal 9.1 4.9 4.0 2.4 4.0
Total Economy 3.3 8.2
Percentages VA EMP PROD VA EMP PROD1990-2000 2000-2010
Agriculture 7.2 0.7 2.4 0.8
Mining 0.9 -9.8 11.8 20.2 13.3
Manufacturing 0.3 0.1 0.2 -2.4
Utilities 9.2 -2.4
Construction 1.4 3.4 -1.9 -4.3
Trade, restaurants, hotels 0.1 7.1 -4.2
Transport, storage, communications
1.3 1.8 9.8 14.7 -4.2
FIRE, business services 3.1 -1.8
Government services -1.9 4.2 1.2 8.2
Community, social, personal 0.7 -0.4 1.2 12.7
Total Economy 1.2 1.3 3.2 1.8
Table A2.1: Ethiopia: growth rates of value added (at constant prices), employment, and productivity
Table A2.2: Malawi: growth rates of value added (at constant prices), employment, and productivity

Source: Author’s computations from Timmer et al. (2014)
Source: Author’s computations from Timmer et al. (2014)
Source: Author’s computations from Timmer et al. (2014)
Percentages VA EMP PROD VA EMP PROD
1990-2000 2000-2010
Agriculture 2.0 4.3 2.1 2.1
Mining 17.2 3.7 13.0 11.1 8.4
Manufacturing 4.4 4.4 0.0 8.3 10.8 -2.2
Utilities 13.4 -7.9 10.4
Construction -0.7 3.1 -3.7 10.3 9.3 1.0
Trade, restaurants, hotels 3.8 -0.8 0.0
Transport, storage, communications 3.2 1.8 1.4 8.9 -4.2
FIRE, business services 1.2 0.2 1.0 7.1 -8.3
Government services 1.4 2.9 -1.4 8.0 12.9 -4.4
Community, social, personal -1.2 2.9 2.9 0.1
Percentages VA EMP PROD VA EMP PROD
1990-2000 2000-2010
Agriculture 1.2 3.0 -4.4
Mining -7.7 -2.7 20.3 9.8
Manufacturing 0.2 -1.9 2.1 4.8 0.4
Utilities 1.9 0.4 2.0 -1.1 3.1
Construction -0.4 0.7 -1.0 11.7 3.9
Trade, restaurants, hotels 7.2 -0.3
Transport, storage, communications 3.4 0.2 3.2 17.0 3.3 13.3
FIRE, business services 11.4 14.2 2.1
Government services 2.8 12.0
Community, social, personal 3.3 -1.7 11.8 -3.8
Total Economy 3.1 1.8 1.4 8.1 2.9
Percentages VA EMP PROD VA EMP PROD
1990-2000 2000-2010
Agriculture 0.7 0.3 0.3 1.8 -1.3 3.1
Mining -0.3 -7.2 7.4 0.0 -4.1 4.3
Manufacturing 1.3 1.0 0.3 2.4 2.9
Utilities 2.4 -4.3 7.1 1.8 2.1 -0.2
Construction -0.8 -1.4 8.1 4.7 3.3
Trade, restaurants, hotels -0.9 3.4 2.8
Transport, storage, communications 4.9 2.4 0.8 4.1
FIRE, business services -1.7 8.7 3.4
Government services -4.3 2.7 1.2
Community, social, personal 4.1 2.0 2.1 3.2 1.7
Total Economy 1.9 1.8 0.1 3.7 0.9 2.8
Table A2.3: Tanzania: growth rates of value added (at constant prices), employment, and productivity
Table A2.4: Zambia: growth rates of value added (at constant prices), employment, and productivity
Table A2.5: South Africa: growth rates of value added (at constant prices), employment, and productivity


www.ictsd.org
Other recent publications from ICTSD’s Programme on Inclusive Economic Transformation include:
• Realising the Potential of Services SMEs in Developing Economies Sonja Grater, Ali Parry, and Wilma Viviers, 2017
• The Gender Dimensions of Services Julia Lipowiecka and Tabitha Kiriti Nganga, 2016
• Inclusive and Sustainable Growth: The SDG Value Chain Nexus Raphael Kaplinsky, 2016
• The Gender Dimensions of Global Value Chains Cornelia Staritz and Penny Bamber, 2016
• Services and Sustainable Development: A Conceptual Approach ICTSD, 2016
• Trade Policies and Sustainable Development in the Context of Global Value Chains ICTSD, 2016
About ICTSDThe International Centre for Trade and Sustainable Development (ICTSD) is an independent think-and-do-tank, engaged in the provision of information, research and analysis, and policy and multistakeholder dialogue, as a not-for-profit organisation based in Geneva, Switzerland. Established in 1996, ICTSD’s mission is to ensure that trade and investment policy and frameworks advance sustainable development in the global economy.