TRADE IN LIVESTOCK PRODUCTS and THE WTO MILLENIUM ROUND: PROJECTIONS … · TRADE IN LIVESTOCK...
30
TRADE IN LIVESTOCK PRODUCTS and THE WTO MILLENIUM ROUND: PROJECTIONS TO 2005 and PROBLEMS WITH TRQs ∗ Allan N Rae Centre for Applied Economics and Policy Studies Massey University Palmerston North New Zealand ABSTRACT While the Uruguay Round resulted in greater transparency of agricultural trade barriers and limited liberalization, substantial barriers to trade in livestock products remain. This paper makes a projection of the global economy to 2005, and then seeks to determine the impacts of alternative outcomes of the next WTO Millenium Round. Three options for reform are explored – one is restricted to freeing up grains trade, while the others evaluate across-the-board reductions in tariffs and export subsidies in agriculture. The outcomes differ substantially across these scenarios. The paper is completed with a discussion on tariff-rate-quotas (TRQs) in livestock products trade. Aspects of the projections are likely to be biased since they did not specifically consider TRQ constraints, especially where the projections are suggestive of regime switches. Attention is then drawn to issues that require urgent attention to enable TRQs to be adequately incorporated into future trade reform projections. 1. INTRODUCTION The way in which dietary patterns are changing in developing countries in particular as economic growth and development proceeds is now well documented. Due to factors such as income growth, urbanisation and the modernisation of marketing infrastructures, consumption patterns are switching from an emphasis on traditional foods to non-traditional cereals (eg wheat-based foods) and value-added processed and high-protein foods such as those derived from animal products (Huang and David 1993, Huang and Bouis 1996, Rae 1997 and 1998, Delgado et al. 1999). This typically involves a switch in the domestic utilisation of grains from human consumption to feeding of livestock. Much recent debate has centered on the impacts of ∗ Paper presented at the International Agricultural Trade Consortium Symposium on Trade in Livestock Products, Auckland, New Zealand, 18-19 January 2001. Discussions with Tom Hertel and Alejandro Nin- Pratt are acknowledged. This threesome has commenced work on a paper to address specifically the reform of livestock TRQs, but the time available in this case was incompatible with the technical complexity of the task! Deleted: Livestock consumption is expanding rapidly in East Asia. Governments have responded by supporting and protecting domestic production but resource constraints and environmental problems are adding to the costs of self-sufficiency objectives. Rising costs to consumers and taxpayers are also causing such an approach to be questioned, both domestically and internationally. While the Uruguay Round resulted in greater transparency of agricultural trade barriers and limited liberalization, substantial barriers to trade in livestock products remain. This paper makes a projection of the global economy to 2005, and then seeks to determine the impacts of alternative outcomes of the next WTO Millenium Round. Three options for reform are explored – one is restricted to freeing up grains trade, while the others evaluate across-the-board reductions in tariffs and export subsidies in agriculture. The outcomes with regard to East Asia and its trade in livestock products differ substantially across the e scenarios.
-
Upload
hoangkhuong -
Category
Documents
-
view
216 -
download
0
Transcript of TRADE IN LIVESTOCK PRODUCTS and THE WTO MILLENIUM ROUND: PROJECTIONS … · TRADE IN LIVESTOCK...

TRADE IN LIVESTOCK PRODUCTS and THE WTO MILLENIUM ROUND: PROJECTIONS TO 2005 and PROBLEMS WITH TRQs∗
Allan N Rae
Centre for Applied Economics and Policy Studies Massey University Palmerston North
New Zealand
ABSTRACT While the Uruguay Round resulted in greater transparency of agricultural trade barriers and limited liberalization, substantial barriers to trade in livestock products remain. This paper makes a projection of the global economy to 2005, and then seeks to determine the impacts of alternative outcomes of the next WTO Millenium Round. Three options for reform are explored – one is restricted to freeing up grains trade, while the others evaluate across-the-board reductions in tariffs and export subsidies in agriculture. The outcomes differ substantially across these scenarios. The paper is completed with a discussion on tariff-rate-quotas (TRQs) in livestock products trade. Aspects of the projections are likely to be biased since they did not specifically consider TRQ constraints, especially where the projections are suggestive of regime switches. Attention is then drawn to issues that require urgent attention to enable TRQs to be adequately incorporated into future trade reform projections. 1. INTRODUCTION The way in which dietary patterns are changing in developing countries in particular as economic growth and development proceeds is now well documented. Due to factors such as income growth, urbanisation and the modernisation of marketing infrastructures, consumption patterns are switching from an emphasis on traditional foods to non-traditional cereals (eg wheat-based foods) and value-added processed and high-protein foods such as those derived from animal products (Huang and David 1993, Huang and Bouis 1996, Rae 1997 and 1998, Delgado et al. 1999). This typically involves a switch in the domestic utilisation of grains from human consumption to feeding of livestock. Much recent debate has centered on the impacts of
∗ Paper presented at the International Agricultural Trade Consortium Symposium on Trade in Livestock
Products, Auckland, New Zealand, 18-19 January 2001. Discussions with Tom Hertel and Alejandro Nin-Pratt are acknowledged. This threesome has commenced work on a paper to address specifically the reform of livestock TRQs, but the time available in this case was incompatible with the technical complexity of the task!
Deleted: Livestock consumption is expanding rapidly in East Asia. Governments have responded by supporting and protecting domestic production but resource constraints and environmental problems are adding to the costs of self-sufficiency objectives. Rising costs to consumers and taxpayers are also causing such an approach to be questioned, both domestically and internationally. While the Uruguay Round resulted in greater transparency of agricultural trade barriers and limited liberalization, substantial barriers to trade in livestock products remain. This paper makes a projection of the global economy to 2005, and then seeks to determine the impacts of alternative outcomes of the next WTO Millenium Round. Three options for reform are explored – one is restricted to freeing up grains trade, while the others evaluate across-the-board reductions in tariffs and export subsidies in agriculture. The outcomes with regard to East Asia and its trade in livestock products differ substantially across the e scenarios.

2
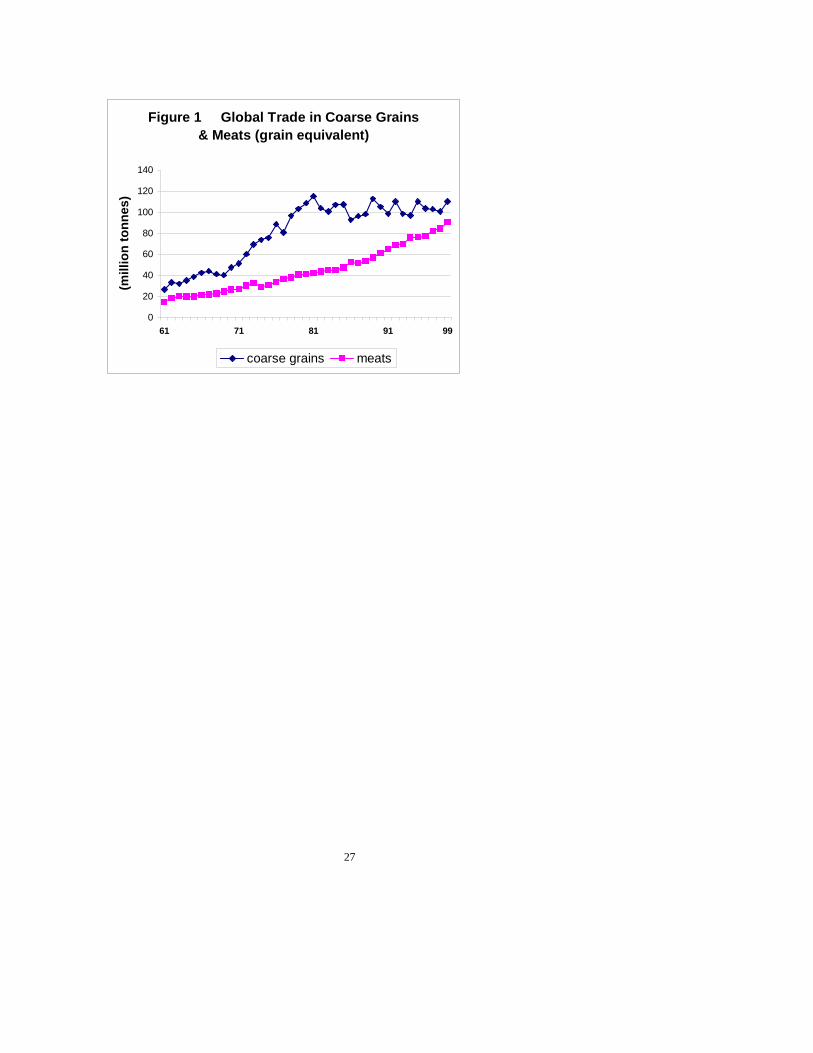
such consumption changes on world food markets, especially those for grains, although until recently less attention has been paid to the implications for trade in livestock products. For a variety of reasons, many countries have a comparative disadvantage in the production of certain livestock products, and sometimes feedstuffs also. Thus government assistance, including trade barriers, has been aimed at encouraging domestic production to help meet the growing demand. Such assistance has in some cases led to the achievement of near self-sufficiency, and has also encouraged the rapid growth of feedgrains imports as it became clear that demand for feedstuffs exceeded domestic supply capacities. The countries of Northeast Asia in particular are major importers of feedgrains, with Japan and South Korea accounting for one-third of global maize imports in 1997-98. The GTAP Version 4 database (McDougall et al. 1998) contains tariff equivalents for 1995. On average, the global agricultural tariff of 17.4% was four times as great as that on manufactured imports (4.3%). Within agriculture, some of the highest tariffs are levied on livestock products. The average global tariffs on beef and dairy products, for example, were over 25% compared with 17% for all agricultural commodities on average. These tariff equivalents ranged up to 205% for ruminant meats, 187% for nonruminant meats and 350% for dairy products, and are reflective of the particularly high levels of livestock support in Western Europe and Northeast Asia. Even where government assistance has achieved self-sufficiency, its sustainability into the future must be questioned. Increasing pressures on land and labour, along with environmental degradation due to livestock farming, are all increasing the marginal costs of livestock production in many regions. Further, national and international pressures for trade reforms are resulting in a reduction of trade barriers. A consequence is that imports of final product will increasingly substitute for imports of animal feeds. This process has in fact been underway for the last two decades, as suggested by Figure 1. 2. WTO MILLENIUM ROUND SCENARIOS The UR Agreement on Agriculture established rules that improved the conditions for market access for agricultural goods, and reduced export subsidies and domestic support payments (OECD 1995). However there is mounting evidence that the Agreement did little to liberalise agricultural trade (Ingco 1996, Josling 1998). For example in many cases, including livestock products, the “tariffication” process put in place tariffs that were so high that profitable trade is largely impossible. How might such high barriers to agricultural and livestock products trade be lowered in the next Round? Three possible approaches to reducing trade barriers are (i) to reduce the average level of agricultural tariffs, (ii) to reduce the variability of such tariffs across both countries and sectors, and (iii) to completely liberalise only selected sectors. These approaches will be reflected in the experimental scenarios outlined below, along with a comment on their implications for the reduction of export subsidies. We have not allowed for any further reduction in domestic support - such support, totaled over the entire agricultural sector, was agreed in the URAA to be reduced
Deleted: was
Deleted: T
Deleted: .
3
by 21%. Our reason for excluding the possibility of further reductions in our simulations is that a large component of domestic support in both developed and developing regions is, one way or another, exempt from this reform commitment. The major domestic support programs of the EU and USA, for example, were linked to production controls and hence exempt, while more recently US support has been re-instrumented such that it may now be considered ‘decoupled’ from trade impacts and hence not liable for future reduction. Also, many regions are shifting the emphasis of agricultural support payments away from direct production subsidies to payments linked to environmental improvements. One approach to future trade liberalisation in agriculture that has been put forward by some countries (eg the USA) is to completely eliminate tariffs on particular goods (the so-called zero-for-zero approach). An advantage is that resistance to liberalization in ‘politically-sensitive’ sectors (such as dairy) need not hold up progress in the negotiations. A downside is that the politically-difficult sectors may never get addressed unless a framework were to be agreed that ensured no long-term exclusions. A zero-for-zero agreement in grains and oilseeds has been mooted. It would likely be acceptable to the USA as they are a major exporter, and could also be acceptable to the EU if the Agenda 2000 cuts in grains intervention prices were to be followed by further cuts that resulted in internal EU prices being closer to world levels. This scenario is of interest here, since grains and oil crops are important ingredients in animal feeds. The Uruguay Round Agreement on Agriculture includes the commitment to reduce agricultural tariffs by an average of 36%. Another approach in the new Millenium Round, then, would be to agree a further 36% cut in all agricultural tariffs and this is mimicked in our second experiment1. Such an approach does little, however, to reduce the extreme variability present in current agricultural tariffs. Thus a third approach is to negotiate some modality that will result in greater percentage reductions in the higher tariffs, thus reducing the height of these tariff peaks (such as exist for several livestock products). Specific formulas may be used to compute such cuts, such as the Swiss Formula that was used for tariff reductions in industrial goods in the GATT Tokyo Round. However once the Swiss formula is calibrated to give politically-acceptable cuts to the highest tariffs, such a formula might result in rather small cuts to the lower tariffs. One way around this is to negotiate a ‘cocktail’ mix of modalities that cuts lower tariffs by an agreed percentage, and the very high tariffs according to the Swiss formula. Such an approach is illustrated in our third scenario. There, the mix is to completely remove agricultural tariffs that are less than 5%, to cut by 36% tariffs within the 5%-85% range, and to apply the Swiss formula2 to all agricultural tariffs that exceed 85%.
1 The GTAP database includes instances of negative tariffs (market prices less than border prices). In all
experiments, these negative tariffs were not adjusted. Further, the Version 4 GTAP database applied observed domestic/world price gaps at the commodity level on both the import and export sides. Thus in the experiments, reductions in export subsidies are identical to those applied to import tariffs.
2 The Swiss formula t1 = a*t0/(a+t0), where t0 and t1 are the original and reduced tariff, respectively. The value of ‘a’ was chosen such that a tariff of 85% would be cut by 36%.
Deleted: 2. DEVELOPMENTS IN LIVESTOCK PRODUCTS CONSUMPTION AND TRADE
Deleted: The per capita consumption levels of animal products
Deleted: i are shown in Table 1, along with their shares of the total diet, for selected Asian economies.
Deleted: Over the past
Deleted: 30
Deleted: 20 years there has been a steady increase in the share of the average diet contributed by animal food products in
Deleted: all these countries, with the possible exception of Thailand.
Deleted: East Asia,
Deleted: M
Deleted: most noticeably
Deleted: , that share has almost trebled
Deleted: in the Republic of Korea and
Deleted: doubled in
Deleted: China
Deleted: over the data period
Deleted: .
Deleted: On average over 1988-1992, animal products’ share of human diets ranged from a low of 3.9% in Indonesia to 30.2% in Hong Kong. The per capita consumption of animal products was also highest in Hong Kong and lowest in Indonesia. In Thailand, the consumption of animal products has increased at a rate only a little more than that for all foods, providing little change in animal products’ share of the total diet in that country.
Deleted: Over this period, the percentage of total calorie intakes contributed by animal products rose from just 6% to over 18% in China. The increases in Northeast and Southeast Asia were less spectacular, but by 1998 the average consumer in Northeast Asia obtained almost 20% of total calories from foods of animal origin (Table 1).¶¶The extent of the switch to meats in the diets of East Asians is made clear by
Deleted: 
Deleted: ¶East Asia is a net importer of meats and
Deleted: [Table 1 about here.]¶In 1992 meat products provided the
Deleted: ¶¶
... [2]
... [1]
... [3]
... [4]
4
Given the prevalence of tariff-rate-quotas (TRQs) in agricultural (and livestock products) trade and the opportunities they provide for non-transparent trade barriers, they are bound to be a focus of attention in the new Round. Instituted rather late in the Uruguay Round Agricultural Agreement (URAA), they were designed to permit a minimum level of market access (the quota volume) but to offer the possibility of much higher domestic protection through the tariff that applies on any imports beyond the quota amount. A large number of countries have TRQs in place for meats and/or dairy products, including major importers such as the EU, USA, Japan and Korea. Options for reform include the lowering of the tariff both within but particularly outside the quota, the expansion of the quantity constraint imposed by the quota, or complete elimination. We return to this topic in an endnote to the paper. Meanwhile, their overt absence from the following reform scenarios constitutes the implicit assumption that any resultant expansion of imports of commodities constrained by TRQs are assumed to be accompanied by an expansion of the quota. 3. POSSIBLE MILLENIUM ROUND IMPLICATIONS FOR LIVESTOCK TRADE:
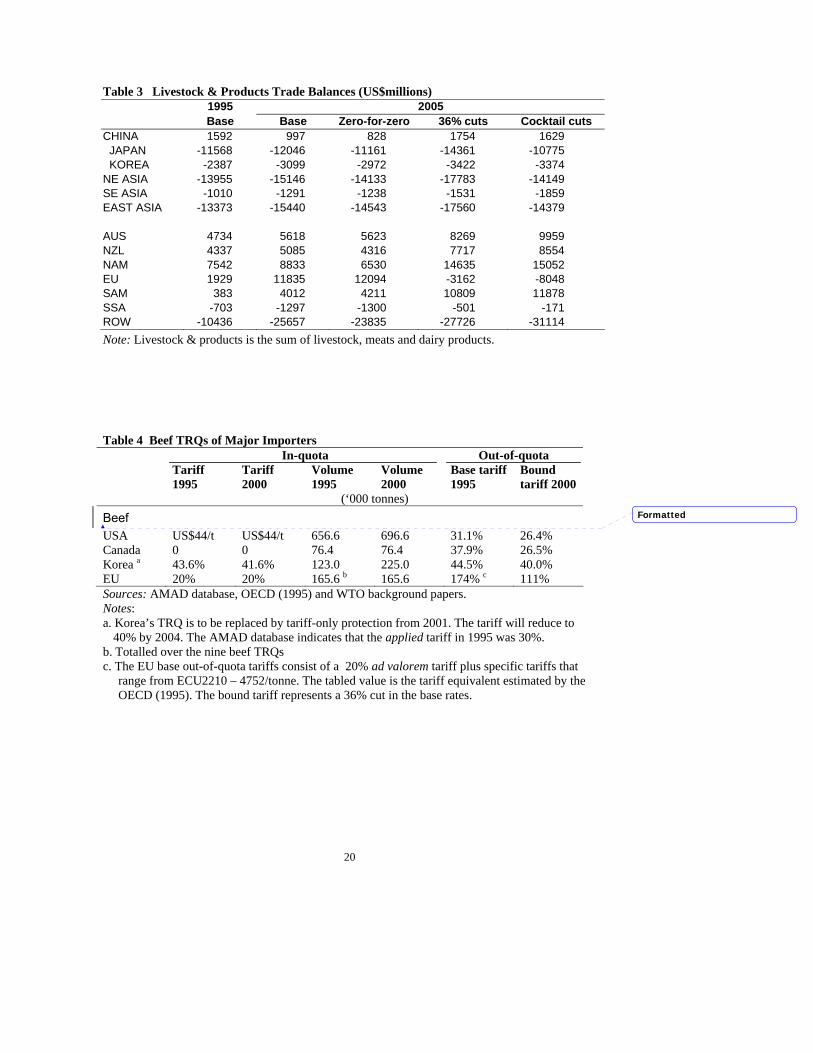
PROJECTIONS TO 2005 Trade model and database We use a slightly modified version of the GTAP applied general equilibrium model (Hertel 1997) to project national and regional production, consumption and trade flows between 1995 and 2005. This is a relatively standard, multi-region model built on a complete set of economic accounts and detailed inter-industry linkages for each of the economies represented. The GTAP production system distinguishes sectors by their intensities in five primary production factors: land (agricultural sectors only), natural resources (extractive sectors only), capital, and skilled and unskilled labour. In trade, products are differentiated by country of origin, allowing bilateral trade to be modeled, and bilateral international transport margins are incorporated and supplied by a global transport sector. The model is solved using GEMPACK (Harrison and Pearson 1996). The 50 commodities in the version 4 GTAP database have been aggregated up to 15 commodity groups, of which 6 commodities (rice, wheat, other grains, oil crops, other crops and processed food) compete for use in the feedstuffs composite. We modify the model to incorporate feedstuff substitution into the livestock production functions. Livestock farming is represented by three aggregates: beef cattle (i.e. ruminant livestock), other livestock (primarily non-ruminants)3 and raw milk production. These farming sectors provide inputs to the beef processing (ruminant meat), other meat (non-ruminant meat) and dairy products industries in each region. All remaining production sectors are aggregated into manufactures, services, and other natural resource based commodities. 3 While we refer to these aggregates as beef cattle and other livestock, it should be remembered that the
former also includes sheep, goats and horses, while the latter comprises eggs, honey, hides and skins in addition to pigs, poultry and live animals not otherwise covered. Further disaggregation was not possible.
Deleted: IMPLICATIONS FOR
Deleted: TRADE: PROJECTIONS TO

5
Some of the protection data in the GTAP version 4 database were modified to reflect more recent estimates of agricultural protection, especially for East Asian economies. Import tariffs were modified for Korea (wheat, beef cattle, beef and dairy products), Southeast Asia (wheat, other grains, beef and dairy products), and the EU (beef and dairy products). Export subsidies on wheat, other grains, beef and dairy products were removed in Southeast Asia and Korea, that on other meats in Southeast Asia was reduced, and the export subsidy on dairy products in Australia was eliminated. Output subsidies were increased for dairy products in Australia, and for beef and dairy products in the EU. Following Hertel et al. (1999a) we also removed all export subsidies in China4. Details of the regional and commodity aggregations are to be found in Appendix Tables 1 and 2. Macroeconomic projections What will be happening in the world economy in the coming years, that ought to be captured in our projections? Income growth will tend to boost the demand for livestock products relative to grains, and in some regions there will be a strong shift away from food products altogether. On the supply side, the accumulation of skilled labor and capital in China and some other developing regions can be expected to continue to promote the shift of activity away from agriculture, in favor of manufacturing and services. Various sectors, including livestock farming, will be experiencing technological change and productivity levels in developing countries could be converging on those of the developed world. As has become standard with the GTAP model, following the work of Gehlhar et al. (1994), projections are made through exogenous shocks to each region’s endowments of physical capital, skilled and unskilled labor, population, and technology.5 Appendix Table 3 reports the shocks to population, endowments and productivity that we assume in this paper. Forecasts for population, investment (capital stock), and labor force are based on forecasts from the World Bank. Projected changes in skilled labor are based on expected increases in the stock of tertiary educated labor and are taken from Ahuja and Filmer (1995) for developing countries. Projections for the OECD countries are based on inputs developed for the World Bank’s Global Economic Prospects (1997 and 1998). The stock of farmland in each region is simply held constant.
Forecasting productivity growth is notably difficult. Therefore, we adopt a rather simple approach which is transparent and which can be easily modified. First of all, based on the work of Bernard and Jones (1996), we observe that productivity growth tends to be more rapid in agriculture than in manufacturing, which in turn has a higher productivity growth rate than services. (They find virtually no evidence of productivity growth in mining where quality of reserves confound the usually difficult measurement problems.) Based on their averages for the OECD as a whole
4 These additional tariff and output subsidy data had been prepared by Dr David Vanzetti of the Australian
Bureau of Agricultural and Resource Economics. Selection of the changes to export subsidies was guided by Hertel et al. 1999a.
5 We also follow Gehlhar's suggestion that increasing the standard trade elasticities is appropriate in longer run simulations. For this eleven year period, we double the standard GTAP values for the elasticities of substitution between imports and domestic goods and among imports from different sources.

6
(Bernard and Jones, 1996, Table 1), we obtain the following multiples of the manufacturing productivity growth rate for the other sectors: (non-livestock) agriculture = 1.4 * manufactures, services = 0.5 * manufactures, and mining = 0 * manufactures. In this way, we are able to link productivity growth in each sector of the economy to a common metric - namely the rate of manufacture’s productivity growth.
We then divide economies into four groups according to their overall rate of productivity growth: low, medium, high and very high. The assumed annual growth rates of productivity in manufacturing value-added for these groups are as follows: 0.25%, 0.75%, 1.25% and 1.75% per year. As can be seen from the entries in Appendix Table 3, the low growth group includes Japan, Southeast Asia, and New Zealand. The medium group includes North America, Sub-Saharan Africa and ROW. Higher productivity growth rates are foreseen for Australia, the EU, and South America. Finally, Korea and China’s productivity growth rates are expected to remain quite high – although somewhat lower than implied by the period prior to the Asian crisis. As a check on the plausibility of these assumptions, we compare our baseline cumulative GDP growth (second to last column) to that forecast by the World Bank, in the last column of Appendix Table 3. Apart from China and Korea, all of these GDP projections are reasonably close. In order to hit the World Bank targets for these regions, we would have to raise the very high growth category still further. In light of the current macro-economic uncertainty in that region, we opt for our more conservative projections. There is mounting evidence that livestock productivity in some developing countries (for example China and Korea) has been converging on that in developed countries (Rae and Hertel, 2000), which trends we seek to continue in the projections. Our livestock productivity projections have been updated from those reported in Hertel et al. (1999b). Following those authors, we apply these livestock productivity shocks to both value-added and to the feed composite, in order to maintain a constant ratio of feed use per animal. Provided these shocks are positive, feed consumption per unit of output (the feed conversion ratio) will decrease. If this is the case, then the implications for feed demand, and hence for trade in grains and oilseeds as well as livestock products could be substantial.6
6 There is considerable evidence to support this assumption. A recent survey conducted by Wailes et al.
(1998) gathered data on feed use across a range of enterprise and livestock types in seven provinces of China where the trend is towards development of specialised livestock production units and larger, more intensive management systems. They concluded that such structural changes will contribute to a declining demand for feedgrains per kg of meat production. Another set of livestock and feeds projections for China are those of Simpson et al. (1994, Tables 7.6, 7.7 and 8.1), covering the period 1989-91 to 2000. Their projections imply little increase in feed inputs per animal so feed per unit output (the feed conversion ratio) shows negative growth, indicating increases in feed efficiency especially for poultry. This is consistent with the projections of Wang et al. (1998) who assume improvements in feed efficiency for all animal types and technologies. Finally, Tweeten (1998) reports projected annual USA growth rates in output per feed of 0.2% (beef and pigs), 0.6% (milk) and 2.0% (poultry). If the US is the source of much of the new livestock production technology that is transferred to China, then such improvements will eventually be felt in China.

7
Trade policy projections Significant trade policy developments over the 1995-2005 projections period include completion of the manufacturing tariff cuts under the Uruguay Round, implementation of the Agreement on Textiles and Clothing (ATC) and the probable accession of China to the WTO. These changes are incorporated in our projection by using the results of Francois and Strutt (1999) to specify the remaining UR manufacturing tariff cuts to be made from our 1995 base period.7 It is assumed that the abolition of quotas under the ATC will have been completed by the year 2005 and that China, as a WTO member, will also benefit fully from these reforms. These were modeled by removing the implicit export taxes due to the quotas on textile and clothing exports from developing countries to the industrialised regions. China’s WTO offer is based on the manufacturing tariff data in the US-China Bilateral Agreement8. As regards agriculture, while reforms were negotiated during the Uruguay Round, they were based on the late-1980s when prices were very low and hence measured protection was high. In contrast, our base year of 1995 was one of much higher world prices and hence lower protection. Because of this, and the extent of “dirty tariffication” in agriculture (Ingco 1996) we assume no change from 1995 protection in agriculture9. 4. PROJECTIONS & SIMULATION RESULTS 4.1 The baseline projection: 1995-2005 The objective of the baseline is to project the global economy to the year 2005, by which time the policy reforms of the UR should be fully implemented. What might be expected to occur over this projection period? The changes in population, resource endowments, productivity and tariffs that we model have implications on both the demand and supply side of each regional economy. Income growth, for example, will boost the demand for livestock products relative to grains, and in some regions there will be a shift away from food products altogether. In addition, accumulation of skilled labour and capital will tend to promote a shift in production away from agriculture in favour of manufacturing and services perhaps further encouraged by increased access to foreign markets for textiles, clothing and manufactures due to the UR reforms. These forces together will help shape the changes in regional trade and therefore the sectoral trade balances. Livestock productivity growth was projected to be most rapid (at least in the meat sectors) in China, and the results suggest around 80% growth in livestock outputs over the projection period. Even so, China’s net trade surplus in livestock products deteriorates somewhat since domestic demand for such products is also projected to increase substantially. Further, China’s
7 Thanks are due to Dr Anna Strutt for supplying the relevant shock files. 8 See http://www.chinapntr.gov. The current and proposed tariffs in that agreement were used, weighted by
the import values in the GTAP 1995 database These specified current tariffs were often less than those in the GTAP 1995 database. By basing the tariff shocks on a comparison of the proposed tariffs with current tariffs, rather than those in the GTAP database, we could have underestimated those shocks in the event that China’s tariffs had been reduced since 1995. The details in the agreement with respect to agricultural tariff cuts are clouded by uncertainty over the future role of STE’s in China’s agricultural imports, and also over estimates of her current levels of agricultural protection, so no adjustments to China’s agricultural tariffs were made.
9 Others have also taken a similar approach – see Hertel et al. (1999a) and Anderson et al. (2000).
8
manufacturing and service sectors are projected to increase output by over 100% compared with their 1995 base. Other regions to experience relatively rapid manufacturing and services growth (although by half the rate projected for China) are the developing regions of Southeast Asia and Korea, as well as North America. Although the manufactures sectors are not the focus of this paper, their sheer size in most regions means that policy reforms in these sectors can have a major impact on the rest of the economy. Over the 10-year projection period, assisted by the completion of the UR manufacturing tariff cuts plus those that result from China’s assumed accession to the WTO, China’s trade surplus in manufactures more than doubles. Korea’s manufacturing trade surplus is projected to double, while the EU trade surplus is reduced and North America’s trade deficit in this sector worsens. Turning to the livestock products, base-period beef trade surpluses in Australia, New Zealand and South America all increase, while that for North America is reduced. The EU is projected to shift from a net importer to a net exporter of beef, and China’s small base trade surplus is projected to increase. China has been a not insubstantial exporter of non-ruminant meats in the past, and this trade surplus is projected to be cut by a third. Other traditional non-ruminant exporters such as the EU, North America and Southeast Asia all increase their net non-ruminant exports. The traditional dairy exporters – Australasia, North America and the EU – are all projected to increase their trade surpluses, whereas the deficits of Northeast and Southeast Asia are projected to worsen. In the case of China, the small base trade deficit worsens substantially. Changes in the size of the livestock sectors in each region also contribute to the projected changes in the net trade situation with respect to grains and oilseeds. We project that China’s 1995 trade deficit in these commodities of US$2.5 billion will expand to $7.5 billion by 2005, and Southeast Asia’s deficit worsens by 50%. North America’s trade surplus in grains and oilseeds increases substantially. 4.2 The Zero-for-Zero Liberalisation of Grains and Oilseeds: 2005 Our interest in this scenario is fueled by likely changes in domestic and world prices of grains and oilseeds,10 and the direct and indirect effects they will have on the costs of feedstuffs and therefore livestock production incentives11. Grains and oilseeds contribute 5% to 10% of total livestock production costs12 in most regions. An exception is North America where grains and oilseeds comprise 25% of beef cattle production costs and 40% of those for milk. Thus price changes for grains could have a direct impact on the level of livestock production in North America. The indirect effects come through recognition of the share of grains and oilseeds in the processed food sector, which in the GTAP database includes processed animal feeds. This share is typically in the range of 5% to 15%, and the processed food sector has a 30% to 50% share of livestock production costs in Japan and Korea and at least 10% in most other regions. 10 These are the wheat, other grains and oils sectors. 11 Recall also that we modified the GTAP model to allow substitution among grains, oilseeds and other
feedstuffs (the latter are rice, processed food and other crops) 12 As recorded in the GTAP version 4 database.

9
The removal of all tariffs and export subsidies on wheat, other grains and oilseeds in 2005 boosts world prices of these commodities by 3-5% for grains and by 3% for oilseeds13. Volumes traded globally expand by over 40% for other grains and by 20% for oilseeds, but global trade in livestock products contracts. For those regions with high tariffs on grains and oilseeds, the liberalisation results in a substantial fall in domestic prices of 15% in Japan, and by more than 30% for other grains in Korea. As a result Northeast Asian livestock sectors expand by up to 5%, while their grains outputs decline significantly. Both Japan and Korea decrease their net imports of livestock products (ie their trade balances improve in Table 3) but increase grains imports (Table 2), and most world livestock product prices fall. In many other regions, where grains tariffs are either very low or zero, domestic grains prices rise with world prices, by as much as 5% in North America. Hence net exporters of grains such as Australia, North and South America expand international sales, but this expansion draws resources out of livestock production. The impact of higher grains costs on livestock trade balances in the traditional exporting regions is interesting. Higher feeds costs reduce beef exports from North America (where grains are an important feedstuff), but beef exports from the primarily grass-fed industries of Australia and South America expand. Grains are more widely used as a major feedstuff in non-ruminant livestock production, so this trade balance worsens in most regions except Northeast Asia. Who would be the ‘winners’ should this reform be agreed in the Millenium Round? The welfare results of Table 1 clearly show that almost the entire global gain is shared by Japan, the EU and North America. In the cases of Japan and the EU, most of this gain in welfare comes from efficiency gains as the grains sectors are downsized and resources put to better use elsewhere in those economies. However, these efficiency gains are not as high as they would have been had not the highly-subsidised livestock sectors been encouraged to expand through lower feed costs. In contrast, North America benefits primarily from improved terms of trade, especially higher prices for grains exports. Welfare gains to other regions are either relatively small, or are negative. 4.3 A 36% Cut in all Agricultural Import Tariffs & Export Subsidies: 2005 In this scenario, trade barriers are reduced for all agricultural commodities, not just grains and oilseeds. In several regions, including the EU, North America and Northeast and Southeast Asia, the tariffs on imports of livestock products are substantial. Reductions in these tariffs will reduce domestic prices and increase the import demand for such commodities. Export subsidies on several products, including dairy products and beef, are also very high such as in the EU and (for dairy products) North America. Cuts in these export subsidies will discourage domestic production of the affected commodities and will therefore reduce the volume of export surpluses.
13 In this and all subsequent experiments, reported changes in variables are measured in relation to the
projected 2005 base data.

10
Hence the impact of simultaneous cuts to tariffs and export subsidies on global trade volumes and prices is unclear. While the volume of trade in dairy products falls, that in most other agricultural commodities increases. A major factor in the dairy result is the impact of lower export subsidies on the EU’s dairy export volumes which decline by more than 15%. Average export prices increase the most for dairy products, and meat export prices rise by not quite half that for dairy products. Impacts on regional exports and imports can be summarised by changes in the trade balances. For livestock and meats, the largest increases in trade balances occur from North and South America, but also from New Zealand, Australia and China (Figure 2). By far the greatest decrease occurs in the EU, with smaller deteriorations in Japan, Korea and Southeast Asia. Changes in regional dairy trade balances are dominated by the increased exports out of Australia, New Zealand and South America, with a smaller export increase from North America. The EU decreases its dairy exports substantially, and dairy trade balances of Japan and the rest of East Asia also deteriorate (Figure 3). Some changes in regional grains trade balances are worth noting (Table 2). This scenario leads to smaller deteriorations of the grains trade balances in Northeast and Southeast Asia and the EU, compared with the zero-for-zero experiment. This is because the livestock sectors of these regions now generally decline due to reduced livestock protection, rather than expand under zero-for-zero, with consequent reductions in feedstuffs demands. As a result, North America’s trade surplus in grains is lower than under the former experiment. Changes in regional welfare due to the cuts in all agricultural tariffs and export subsidies are quite different from those that result when reforms are limited to the grains and oilseeds sectors (Table 1). Globally, welfare rises by US$31 billion, well above the gain of $12 billion estimated to result from the zero-for-zero scenario. The largest welfare gain by far is enjoyed by the EU, primarily due to improvements in allocative efficiency but also improved terms of trade. Japan receives the second highest welfare gain, due to improvements in resource use. North American welfare increases by less than when the grains sectors only were liberalised, and these gains arise mainly from improved terms of trade. The traditional livestock product exporters of Australia and South America, who gain little from the grains liberalisation, receive considerably enhanced welfare gains when liberalisation is spread across all of agriculture. Improved efficiency in resource use contributes to this result, but the major gains are due to higher export prices. The situation is somewhat different in New Zealand – although the terms of trade improve, expansion of the protected non-ruminant sector results in a less efficient use of resources. Finally, Southeast Asia (which suffered a decline in welfare under the zero-for-zero scenario) now experiences an increase in welfare due mainly to improvements in the allocation of its resources.

11
4.4 The ‘Cocktail’ Formula of Agricultural Liberalisation: 2005 The major difference between this scenario and the previous one is that the highest tariffs and export subsidies are reduced by more, in some cases much more, than the 36% applied previously. Some of the highest agricultural tariff equivalents in the database are in excess of 400% for grains and over 300% for dairy products into Japan, close to 200% for other grains into Korea, and around 100% for beef and dairy product imports into the EU. The Swiss formula component of our ‘cocktail’, which applies when tariffs are in excess of 85%, results for example in cuts of 50% on tariffs of 150% and 75% on those of 450%. Differences in the results from this scenario, compared with the previous one, are likely to be driven by these extra large cuts to grains protection in Northeast Asia, and to components of the livestock sectors of Northeast Asia and the EU. Once again, the direction of these changes cannot be predicted since lower grains protection will provide a boost to livestock production which will be offset to some extent by reduced livestock protection. The volume of global grains trade increases by more than in the scenario of 36% tariff cuts, as a result of decreased domestic output in Japan and Korea, and consequently increased grains imports. The volume of world trade in beef expands and that of non-ruminant meats increases but by less than in the last scenario. In the present scenario, the EU’s beef export subsidies are cut by more than 36% with consequent impact on the volume of the EU's beef exports. The volume of global dairy trade increases. While the EU’s dairy export subsidy is now cut by 45%, rather than by the 36% of the previous experiment, the high dairy import tariffs in some regions are also now cut by more than 36% producing increased import demand from such regions. Consequently the world price index for dairy exports rises by nearly 7% compared with less than 6% when tariff cuts are restricted to 36%. This price increase encourages even greater output responses and hence exports from Australia and North and South America than was previously the case. The livestock and meats trade balances of New Zealand and South America increase, and by more than when tariffs and export subsidies were cut by 36% (Figure 2). These trade balances also improve under this scenario for North America and Australia, by about the same as in the previous experiment. That of the EU falls by more than with 36% tariff cuts. Japan, whose trade balance in livestock and meats worsened under a scenario of 36% cuts to tariffs, now experiences a substantial improvement in this trade balance from the 2005 base. One reason is that with such large cuts to Japan’s grains tariffs, livestock production costs fall relative to the previous scenario, and non-ruminant production receives an additional boost. The dairy trade balances of Australasia and North and South America improve, and by more than when tariffs were cut by 36% (Figure 3). In contrast, those of the EU and Japan decline and by more than resulted in the previous experiment, substantially so in the case of Japan whose dairy tariff was reduced by 70% under our Swiss formula. Global welfare increases by about 15% more than was the case when tariffs were cut by 36% (Table 1). The regions experiencing the greatest gains were again the EU and Japan due mainly to better resource allocations. The traditional agricultural exporters obtain even larger welfare gains

12
than in the previous experiment, due primarily to improved terms of trade for Australasia and North America, and both efficiency and terns of trade improvements in South America. 5. TRQ PROBLEMS The above analysis, like several others, is a fairly standard application of general equilibrium modeling in support of international trade reform. In common with other such studies, it did not explicitly incorporate TRQs and their possible reform. This suggests either data or modeling complexities, or both. This final section of the paper makes the case for the explicit recognition of TRQs in agricultural trade reform analyses, and draws from the above results to indicate some of the potentially misleading results that arise when TRQs are ignored. The Uruguay Round Agreement on Agriculture (URAA) instituted tariff rate quotas (TRQs) with the intention of eliminating non-tariff barriers. Thus they replaced previous preferential bilateral schemes and voluntary export restraints, and prevented such trade flows from being reduced or eliminated through the URAA’s tariffication process. In addition, the URAA specified levels of minimum access to markets which had been effectively closed to international trade, which minimum access was specified within the context of TRQs. As of May 2000, WTO background papers record a total of 1,371 TRQs covering agricultural and food commodities, of which less than 100 specify country-specific quotas. Of all TRQs, 449 are for livestock and their products. Of these 247 are for meats of various types, 181 for dairy products and 21 for eggs. 5.1 Economics of TRQs TRQs incorporate a quota with a two-step tariff system as indicated14 in Figure 4. The quota may be a constant (ie remains the same over the URAA implementation period) or an expanding quota (eg where the URAA specifies increasing market access). Up to the quantity OQ can be imported at the tariff ti (typically rather low or perhaps zero) but all imports above OQ are levied a (usually much) higher tariff to. Some of the highest “mega-tariffs” that exist are those bound in the TRQs, and especially those for livestock products. Three trading outcomes (or quota regimes) are possible, depending on the quota settings and excess demand conditions. D1, D2 and D3 are three such demand curves. Given D1, imports do not meet the quota – in other words, the “fill rate” is less than 100%. Under D2, imports are effectively limited by the quota, and the high out-of-quota tariff (to) inhibits further trade. With the excess demand curve D3, quantities could be imported above the quota. We shall refer to these as regimes 1, 2 and 3 respectively. Thus the previous quantitative restrictions that were supposedly outlawed in the URAA still inhibit trade in many commodities, where the magnitude of the above-quota tariffs are so high as to effectively prohibit trade. TRQs therefore can be both market access and protection instruments. Once the quota fill-rate reaches 100%, rents accrue since imports within the quota can be sold at prices that exceed the import cost plus tariff (see area OABC in Figure 4). The distribution of such rents is an important issue, and is determined by the structure of the market and the procedures used to allocate the quota to market participants. For example, shares may be
14 Figure 4 is based on Abbott and Paarlberg (1998).

13
allocated to individual importers, to producer organisations or to state trading entities, in which cases the rents (if any) accrue to the importing agency. Around 5% of existing TRQs also specify country-specific allocations of tariff quotas. This may have been done, for example, to allow previous preferential access to continue. In such cases, rents may accrue to the exporter. 5.2 Projections, market growth and TRQs Is it possible that some of the above projected increases in imports would in fact be constrained by quotas? The projected market dynamics might also bring about regime switches in the presence of TRQs. Thus the interactions between market dynamics and TRQs is of relevance. This is particularly so in the study of livestock products TRQs, since rapidly increasing consumption (and in some cases livestock productivity) are observed in many countries. It can be demonstrated that under certain conditions, the existence of a TRQ can prevent the transmission of price signals to market participants and can therefore hinder the smooth adjustment of domestic and global markets to changing market conditions (Abbott and Paarlberg 1998). Consider first either a decrease in supply or an increase in demand in the importing country. In both cases, the excess demand curve would shift to the right over time, a not uncommon situation with respect to meats and dairy products in several importing countries. As long as the shifting demand curve maintained either regimes 1 or 3, then the TRQ would act like tariff-only protection and imports would increase. However should regime 2 be in force, or become in force due to the shift in demand, then such market expansion is not transmitted to international markets and hence imports can not increase with demand. The impacts of the increasing demand is transmitted to the quota rents, which increase and hence benefit those to whom quota rents have been allocated. Consider next changes in demand and supply conditions elsewhere in the world. In terms of Figure 4, changes in the world price would cause parallel movements of the stepped function OABC. Hence, even if the importer’s excess demand curve remains stationary, regime switches may occur. If the quota is not effective (regime 1), a decline in the world price could allow imports to increase, but only until the quota is filled. Thereafter, further price falls would benefit quota holders with no impact on trade flows. World prices may have to fall substantially, especially where the above-quota tariff is very high, before imports show further growth. Alternatively, should world prices rise when trade is taking place over the quota (regime 3), then it is possible that the quota will become effective. Then further increases in world prices would have no impact on the level of imports, unless the price rise was sufficiently large to reduce imports to below the quota 5.3 Illustrations In this section, we take from the above simulations some examples of the way in which our projections might have changed had TRQs been incorporated into the analysis. We look first at some of the beef projections, followed by those for dairy. Several TRQs exist for both these commodities.
Formatted

14
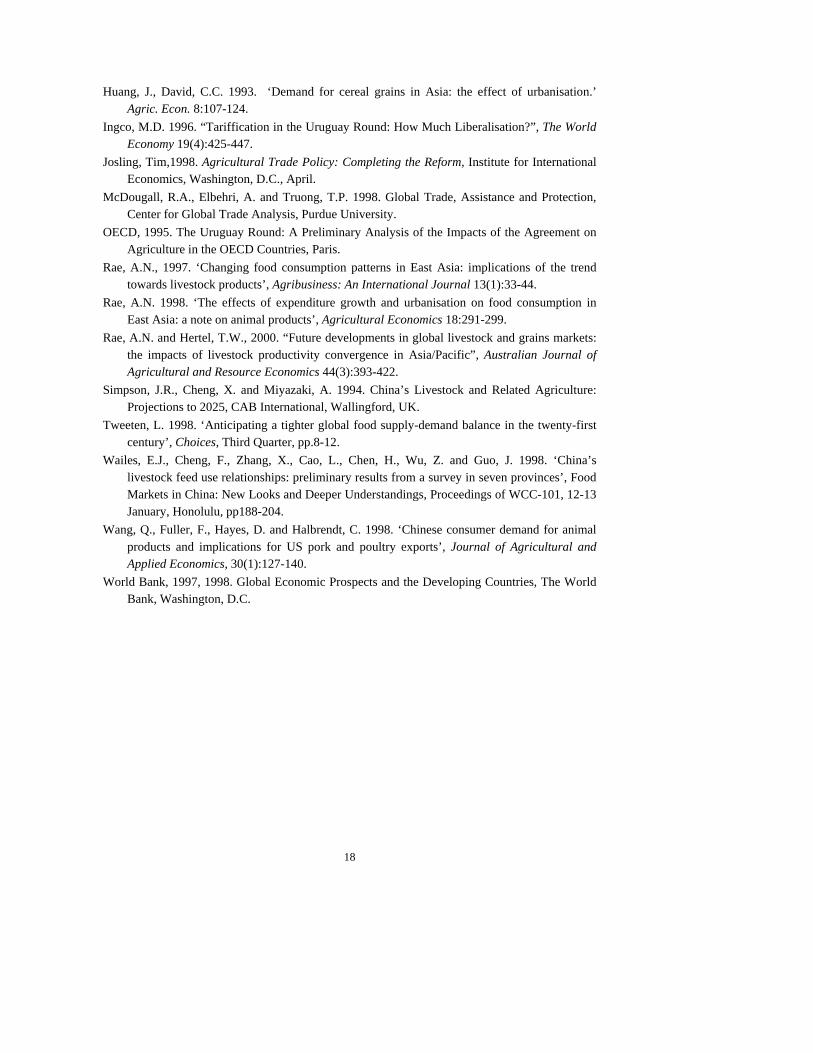
Table 4 includes some details of beef TRQs. That of the USA has a rather low in-quota tariff (close to zero in the GTAP database) and the fill-rate in 1995 was 66%. Neither Australia nor New Zealand filled their bilateral quotas in that year, so regime 1 applied in each case. Uruguay and Argentine exported only processed beef to the USA at that time, but once cleared of foot-and-mouth disease, small quota allocations were made to each country. By 2000, all these exporters except Australia filled their allocations, and therefore had moved into regime 2. In our simulated projections to 2005, Australian beef exports to the US remained within quota and those from New Zealand suggested continuation of a 100% fill-rate. Export volumes from South America, however, approximately doubled compared with 1995 levels. Would this have exceeded the quota? Trade data show that between 1995 and 1999, beef exports from Uruguay and Argentina to the US expanded from around 30,000 tonnes (all processed beef) to 62,000 tonnes including 45,000 tonnes of fresh product. Hence our projection could be consistent with the trade regulations, but since fresh and processed beef are aggregated in the GTAP database, not much more can be said. The beef TRQs of the EU are more complex. Nine TRQs exist, some of which are global quotas while others include country allocations. Most had 100% fill-rates in 1995, and the overall average fill-rate was 87%. Our simulated 1995-2005 projection was for reductions in imports from Australia, North America and New Zealand, but a 50% increase in beef imports from South America. This may have violated South American allocations, but could also be made feasible due to the reduced imports from other sources. The tariff for EU beef used in this study, of 120%, is closer to the out-of-quota tariff than to that which applied within-quota. Reducing this tariff in our trade reform scenarios had a major impact on the volume of EU beef imports, with those from the principal suppliers simulated to increase by 200% or more. As is clear from Figure 4, when regime 2 is in effect, cuts to the above-quota tariff need have no impact on the level of imports unless the cut is sufficiently severe to cause a switch to regime 3. Thus our simulated expansion of trade is likely to be biased upwards. The TRQs for dairy products in several countries comprise quotas for a large number of individual dairy products, several of which have bilateral quotas specified. In some cases, above-quota bound tariffs are extremely high. The data of Table 5 is taken from Elbehri et al. (1999). The US, Japan and Korea would all appear to have been in regime 1, while the EU’s dairy quotas were, on average, very close to regime 2. Taking the EU as an example, we projected that this region’s dairy imports from New Zealand would contract 17% between 1995 and 2005, but that those from Australia and North America would expand. Whether this would violate existing quotas can only be answered through examination at the detailed product level, impossible with the level of aggregation used in the GTAP database. For example, all of the 1995 butter quota of 76,667 tonnes was allocated to New Zealand with another 10,000 tonnes available on a global basis, phased in over 1995-2000. Would the expanded Australian and US sales to the EU have included butter, and if so would the latter quota have been adequate? The EU tariff on dairy products used in our analysis was similar to the above-quota rate shown in Table 5, appropriate should the EU dairy TRQs be in regime 2. In our trade reform scenarios, this
15
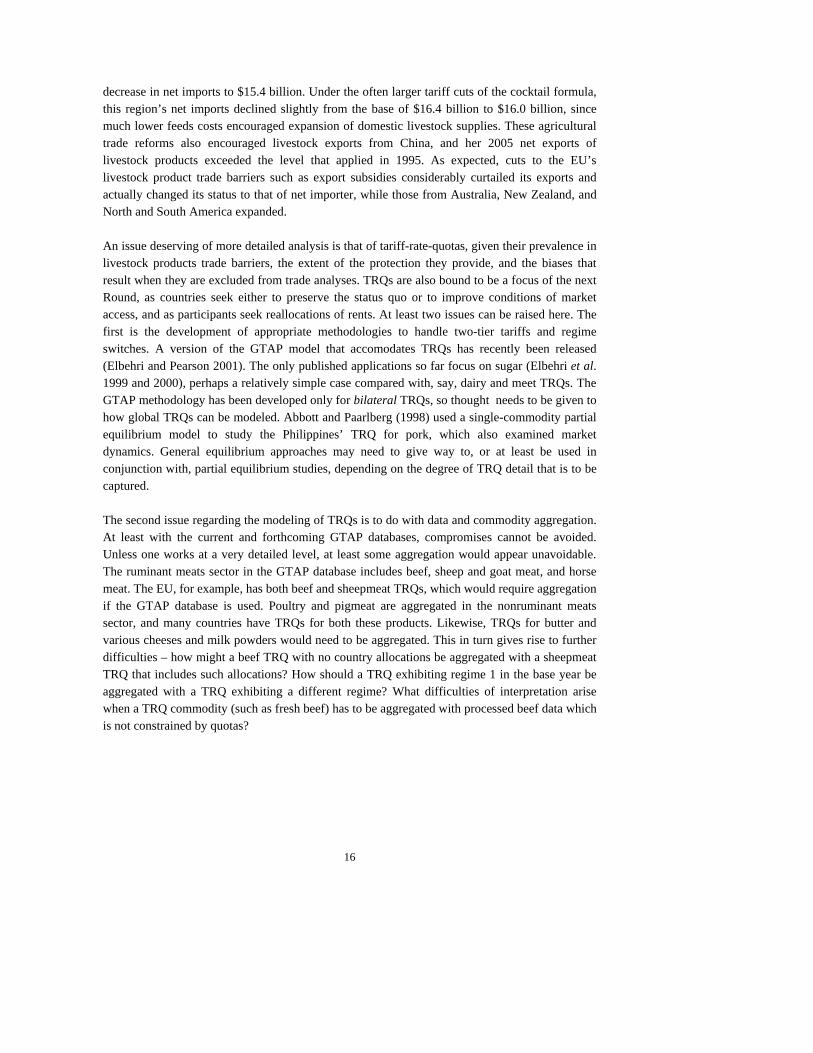
tariff was reduced, and by somewhat more than 36% in the case of the ‘cocktail’ scenario. Since we did not model the TRQ constraints, dairy product sales to the EU expanded considerably – by over 150% from New Zealand and by over 200% from Australia. As in the beef case, tariff reductions when regime 2 is operable need not increase imports at all, so our results no doubt are again biased upwards. 6. SUMMARY AND CONCLUSIONS This paper offered quantitative assessments of three agricultural trade liberalisation options with particular reference to livestock products. It had three objectives. The first, a stepping stone to the others, was to project the 1995 global economy to the year 2005. This incorporated projections of population, labour and capital growth, and changes in productivity. Particular attention was paid to projecting recent trends in livestock productivity, as the convergence of such productivity towards Western levels has been a major recent feature in other regions. The projections also attempted to incorporate the completion of the Uruguay Round outcomes, including the removal of quotas on textiles and clothing trade, as well as (partial) account of China’s accession to the WTO. The resulting measures of GDP growth over the projection period were very similar to recent independent projections of the World Bank. As to the resulting projections of trade in livestock products, traditional exporters increased their net exports, with this result especially evident for South America and the EU. Japan, Korea and Southeast Asia all increased their net imports while China’s net export status diminished somewhat. Our second, and major, objective was to explore the impacts of possible future trade reforms on trade in meats and dairy products. Three imagined outcomes of the next WTO Round of multilateral trade negotiations were (i) a complete removal of trade barriers on just grains and oilseeds, (ii) a 36% cut in all agricultural import tariffs and export subsidies and (iii) a formula approach that reduced the highest agricultural tariffs by more than 36%. In the first of these scenarios, most of the benefits were enjoyed by three major players in global grains trade – North America, the EU and Japan. Benefits to the traditional livestock products’ exporters were severely curtailed since lower feeds costs in the formerly-protective economies of Northeast and Southeast Asia encouraged expansion of livestock farming there and hence lower demand for imports. Such an expansion of the highly-protected livestock sectors of East Asia also contributed welfare losses in those regions through less-efficient use of their scarce resources. In summary this scenario, while freeing trade in grains, led to worsened distortions in the markets for livestock products. The second and third scenarios applied across-the-board reductions in agricultural trade barriers, including those to livestock products trade. Results for livestock products are rather similar in both scenarios, although welfare gains are somewhat higher for the third experiment since some tariff/subsidy cuts are larger than in the second scenario. Compared with the projected base 2005 situation, net imports of livestock products into both Northeast and Southeast Asia increased substantially when tariffs were cut by 36%. In total, this increase was from a base of US$16.4 billion to net imports of $19.3 billion. In contrast, the zero-for-zero grains scenario resulted in a
16
decrease in net imports to $15.4 billion. Under the often larger tariff cuts of the cocktail formula, this region’s net imports declined slightly from the base of $16.4 billion to $16.0 billion, since much lower feeds costs encouraged expansion of domestic livestock supplies. These agricultural trade reforms also encouraged livestock exports from China, and her 2005 net exports of livestock products exceeded the level that applied in 1995. As expected, cuts to the EU’s livestock product trade barriers such as export subsidies considerably curtailed its exports and actually changed its status to that of net importer, while those from Australia, New Zealand, and North and South America expanded. An issue deserving of more detailed analysis is that of tariff-rate-quotas, given their prevalence in livestock products trade barriers, the extent of the protection they provide, and the biases that result when they are excluded from trade analyses. TRQs are also bound to be a focus of the next Round, as countries seek either to preserve the status quo or to improve conditions of market access, and as participants seek reallocations of rents. At least two issues can be raised here. The first is the development of appropriate methodologies to handle two-tier tariffs and regime switches. A version of the GTAP model that accomodates TRQs has recently been released (Elbehri and Pearson 2001). The only published applications so far focus on sugar (Elbehri et al. 1999 and 2000), perhaps a relatively simple case compared with, say, dairy and meet TRQs. The GTAP methodology has been developed only for bilateral TRQs, so thought needs to be given to how global TRQs can be modeled. Abbott and Paarlberg (1998) used a single-commodity partial equilibrium model to study the Philippines’ TRQ for pork, which also examined market dynamics. General equilibrium approaches may need to give way to, or at least be used in conjunction with, partial equilibrium studies, depending on the degree of TRQ detail that is to be captured. The second issue regarding the modeling of TRQs is to do with data and commodity aggregation. At least with the current and forthcoming GTAP databases, compromises cannot be avoided. Unless one works at a very detailed level, at least some aggregation would appear unavoidable. The ruminant meats sector in the GTAP database includes beef, sheep and goat meat, and horse meat. The EU, for example, has both beef and sheepmeat TRQs, which would require aggregation if the GTAP database is used. Poultry and pigmeat are aggregated in the nonruminant meats sector, and many countries have TRQs for both these products. Likewise, TRQs for butter and various cheeses and milk powders would need to be aggregated. This in turn gives rise to further difficulties – how might a beef TRQ with no country allocations be aggregated with a sheepmeat TRQ that includes such allocations? How should a TRQ exhibiting regime 1 in the base year be aggregated with a TRQ exhibiting a different regime? What difficulties of interpretation arise when a TRQ commodity (such as fresh beef) has to be aggregated with processed beef data which is not constrained by quotas?

17
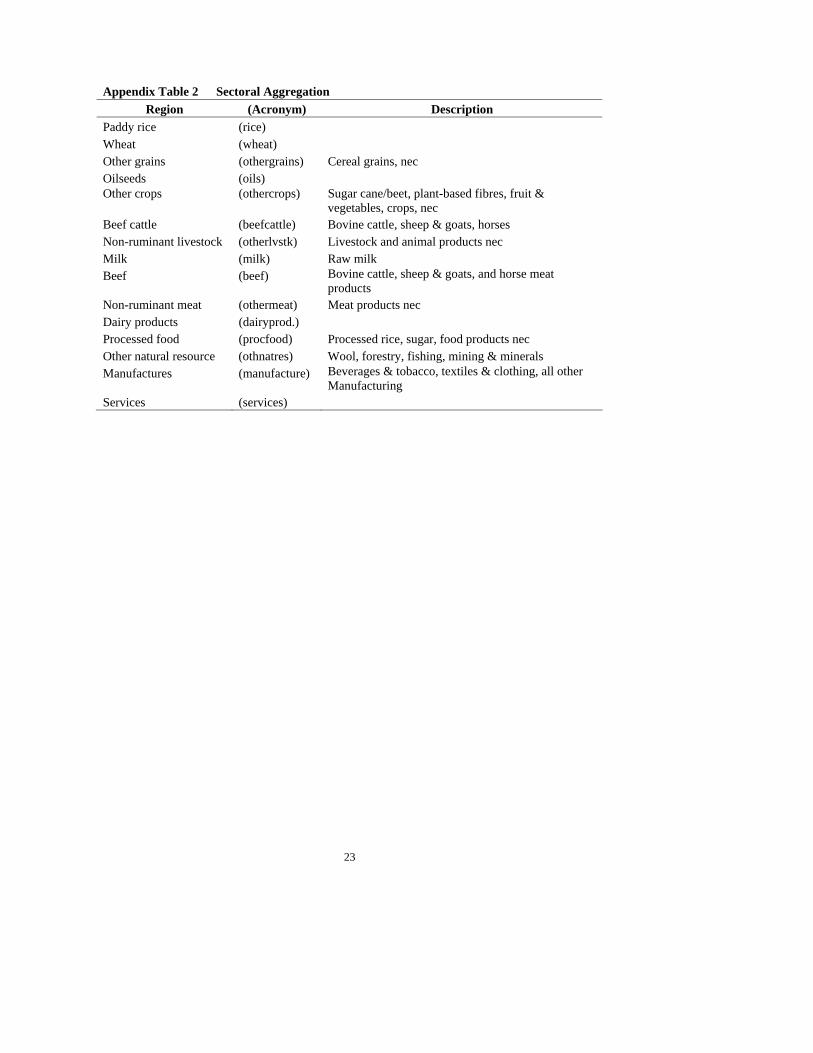
REFERENCES
Abbott, Philip and Paarlberg, Philip (1998), “Tariff rate quotas: structural and stability impacts in growing markets”, Agricultural Economics 19:257-267.
Ahuja, V. and Filmer, D. 1995. “Educational Attainment in Developing Countries: New Estimates and Projections Disaggregated by Gender”. Policy Research Working Paper #1489, World Bank, Washington D.C.
Anderson, K., Francois, J., Hertel, T., Hoekman, B. and Martin, W., 2000. Potential Gains from Trade Reform in the New Millenium. Paper presented to the Third Annual Conference on Global Economic Analysis, Melbourne,27-30 June.
Bernard, A.B. and Jones, C.I. 1996. “Productivity Across Industries and Countries: Time Series Theory and Evidence”, Review of Economics and Statistics 78(1):135-146.
Delgado, C., Rosegrant, M., Steinfeld, H., Ehui, S., Courbois, C. 1999. Livestock to 2020: The Next Food Revolution, 2020 Vision for food, Agriculture and the Environment Discussion Paper 28, International Food Policy Research Institute, Washington, D.C.
Elbehri, A., Ingco, M., Hertel, T. and Pearson, K., 1999. Agriculture and WTO 2000: Quantitative Assessment of Multilateral Liberalisation of Agricultural Policies. Paper presented at the Conference on Agriculture and the New Trade Agenda in the WTO 2000 Negotiations, Geneva, 1-2 October.
Elbehri, A., Hertel, T., Ingco, M. and Pearson, K. (2000), “Partial liberalisation of the world sugar market: A general equilibrium analysis of tariff-rate quota regimes”, presented at The Third Annual Conference on Global Economic Analysis, Melbourne, 27-30 June.
Elbehri, A. and Pearson, K.R. (2000), Implementing Bilateral Tariff Rate Quotas in GTAP using GEMPACK, GTAP Technical Paper #18.
Francois, J.F. and Strutt, A. 1999. “Post Uruguay Round Tariff Vectors for GTAP Version 4”, mimeo, Global Trade Analysis Project, Purdue University, West Lafayette.
Gehlhar, M., Hertel, T.W. and Martin, W. 1994. ‘Economic Growth and the changing structure of trade in the Pacific Rim,’ American Journal of Agricultural Economics, 76(5): 1101-1110.
Harrison, W.J. and Pearson, K.R. 1996. ‘Computing solutions for large general equilibrium models using GEMPACK’, Computational Economics 9:83-127.
Hertel, T.W.(ed.) 1997. Global Trade Analysis: Modeling and Applications, Cambridge University Press, Cambridge and New York.
Hertel, T.W., Anderson, K. Francois, J.F., Hoekman, B. and Martin, W., 1999a. Agriculture and Non-agricultural Liberalisation in the Millenium Round. Paper presented at the Conference on Agriculture and the New Trade Agenda in the WTO 2000 Negotiations, Geneva, 1-2 October.
Hertel, T.W., Nin-Pratt, A., Rae, A.N. and Ehui, S., 1999b. Productivity Growth and “Catching-up”: Implications for International trade in Livestock Products, Paper presented at the Second Annual Conference on Global Economic Analysis, Denmark, 20-22 June.
Huang, J., Bouis, H., 1996. Structural Changes in the Demand for Food in Asia. Food, Agriculture and the Environment Discussion Paper 11. International Food Policy Research Institute, Washington, DC.
18
Huang, J., David, C.C. 1993. ‘Demand for cereal grains in Asia: the effect of urbanisation.’ Agric. Econ. 8:107-124.
Ingco, M.D. 1996. “Tariffication in the Uruguay Round: How Much Liberalisation?”, The World Economy 19(4):425-447.
Josling, Tim,1998. Agricultural Trade Policy: Completing the Reform, Institute for International Economics, Washington, D.C., April.
McDougall, R.A., Elbehri, A. and Truong, T.P. 1998. Global Trade, Assistance and Protection, Center for Global Trade Analysis, Purdue University.
OECD, 1995. The Uruguay Round: A Preliminary Analysis of the Impacts of the Agreement on Agriculture in the OECD Countries, Paris.
Rae, A.N., 1997. ‘Changing food consumption patterns in East Asia: implications of the trend towards livestock products’, Agribusiness: An International Journal 13(1):33-44.
Rae, A.N. 1998. ‘The effects of expenditure growth and urbanisation on food consumption in East Asia: a note on animal products’, Agricultural Economics 18:291-299.
Rae, A.N. and Hertel, T.W., 2000. “Future developments in global livestock and grains markets: the impacts of livestock productivity convergence in Asia/Pacific”, Australian Journal of Agricultural and Resource Economics 44(3):393-422.
Simpson, J.R., Cheng, X. and Miyazaki, A. 1994. China’s Livestock and Related Agriculture: Projections to 2025, CAB International, Wallingford, UK.
Tweeten, L. 1998. ‘Anticipating a tighter global food supply-demand balance in the twenty-first century’, Choices, Third Quarter, pp.8-12.
Wailes, E.J., Cheng, F., Zhang, X., Cao, L., Chen, H., Wu, Z. and Guo, J. 1998. ‘China’s livestock feed use relationships: preliminary results from a survey in seven provinces’, Food Markets in China: New Looks and Deeper Understandings, Proceedings of WCC-101, 12-13 January, Honolulu, pp188-204.
Wang, Q., Fuller, F., Hayes, D. and Halbrendt, C. 1998. ‘Chinese consumer demand for animal products and implications for US pork and poultry exports’, Journal of Agricultural and Applied Economics, 30(1):127-140.
World Bank, 1997, 1998. Global Economic Prospects and the Developing Countries, The World Bank, Washington, D.C.

19
Table 1 Changes in Welfare from Trade Policy Reforms: 2005 (US$million) zero-for-zero 36% cuts cocktail AUS 61 651 946 CHN -432 131 11 JPN 3279 4790 10005 KOR 771 449 628 NZL 625 474 733 SEA -169 1817 1524 NAM 1791 1429 1431 EU 3941 18881 21125 SAM 211 1762 1910 SSA -73 36 -12 ROW 1922 478 -3098 GLOBAL 11930 30897 35203 Table 2 Grains and Oilseeds Trade Balances (US$million)
1995 2005 Base Base Zero-for-zero 36% cuts Cocktail cuts
CHINA -2551 -7477 -7045 -7294 -7263 JAPAN -6360 -7166 -9137 -7746 -8461 KOREA -2599 -3274 -4790 -3744 -4069 NE ASIA -8959 -10439 -13927 -11490 -12530 SE ASIA -3178 -4801 -5729 -4927 -4984 EAST ASIA -14688 -22718 -26702 -23711 -24777
AUS 1442 1949 2500 1924 2023 NZL -51 -72 997 -99 -1 NAM 24736 34561 48513 37976 38917 EU -4242 -1496 -6934 -2612 -2439 SAM -1465 -452 1412 -420 -460 SSA -595 -918 -1017 -1005 -1011 ROW -8063 -14760 -23913 -16118 -16387
20
Table 3 Livestock & Products Trade Balances (US$millions) 1995 2005 Base Base Zero-for-zero 36% cuts Cocktail cuts
CHINA 1592 997 828 1754 1629 JAPAN -11568 -12046 -11161 -14361 -10775 KOREA -2387 -3099 -2972 -3422 -3374 NE ASIA -13955 -15146 -14133 -17783 -14149 SE ASIA -1010 -1291 -1238 -1531 -1859 EAST ASIA -13373 -15440 -14543 -17560 -14379
AUS 4734 5618 5623 8269 9959 NZL 4337 5085 4316 7717 8554 NAM 7542 8833 6530 14635 15052 EU 1929 11835 12094 -3162 -8048 SAM 383 4012 4211 10809 11878 SSA -703 -1297 -1300 -501 -171 ROW -10436 -25657 -23835 -27726 -31114 Note: Livestock & products is the sum of livestock, meats and dairy products. Table 4 Beef TRQs of Major Importers In-quota Out-of-quota Tariff
1995 Tariff 2000
Volume 1995
Volume 2000
Base tariff 1995
Bound tariff 2000
(‘000 tonnes) Beef
USA US$44/t US$44/t 656.6 696.6 31.1% 26.4% Canada 0 0 76.4 76.4 37.9% 26.5% Korea a 43.6% 41.6% 123.0 225.0 44.5% 40.0% EU 20% 20% 165.6 b 165.6 174% c 111% Sources: AMAD database, OECD (1995) and WTO background papers. Notes: a. Korea’s TRQ is to be replaced by tariff-only protection from 2001. The tariff will reduce to
40% by 2004. The AMAD database indicates that the applied tariff in 1995 was 30%. b. Totalled over the nine beef TRQs c. The EU base out-of-quota tariffs consist of a 20% ad valorem tariff plus specific tariffs that
range from ECU2210 – 4752/tonne. The tabled value is the tariff equivalent estimated by the OECD (1995). The bound tariff represents a 36% cut in the base rates.
Formatted

21
Table 5 Dairy TRQs of Some Major Importers (1996) Number of
TRQs Simple average Fill-Rate
(%) In-quota ad
valorem tariff Above-quota ad valorem tariff
USA 24 64 11 70 EU 12 92 24 91 Japan 12 56 29 344 Korea 5 70 21 107 Canada 11 94 7 262 Source: Elhebri et al. (1999)

22
Appendix Table 1 Regional Aggregation Region (Acronym) Description
Australia (AUS) China (CHN) Japan (JPN) South Korea (KOR) New Zealand (NZL) Southeast Asia (SEA) Indonesia, Malaysia, Philippines, Thailand North America (NAM) Canada, USA EU (EU) EU15 South America (SAM) Mexico, Central and South America Sub-Sahara Africa (SSA) South Africa, rest of Sub-Sahara and Southern Africa Rest of the World (ROW)
23
Appendix Table 2 Sectoral Aggregation Region (Acronym) Description
Paddy rice (rice) Wheat (wheat) Other grains (othergrains) Cereal grains, nec Oilseeds (oils) Other crops (othercrops) Sugar cane/beet, plant-based fibres, fruit &
vegetables, crops, nec Beef cattle (beefcattle) Bovine cattle, sheep & goats, horses Non-ruminant livestock (otherlvstk) Livestock and animal products nec Milk (milk) Raw milk Beef (beef) Bovine cattle, sheep & goats, and horse meat
products Non-ruminant meat (othermeat) Meat products nec Dairy products (dairyprod.) Processed food (procfood) Processed rice, sugar, food products nec Other natural resource (othnatres) Wool, forestry, fishing, mining & minerals Manufactures (manufacture) Beverages & tobacco, textiles & clothing, all other
Manufacturing Services (services)

24
Appendix Table 3 Annual growth rates of exogenous variables used in the projections and GDP growth
Popu-lation
Endowments Livestock productivity Manufacture’s productivity
Forecast GDP
World Bank
Forecast Unskilled
labor Skilled labor
Capital Beef cattle
Other livestock
Milk
Australia 0.91 1.04 4.72 1.59 0.70 2.49 2.79 0.75 3.0 2.9
China 0.75 1.06 3.33 8.22 4.57 5.39 -0.29 1.75 6.6 6.9
Japan 0.18 -0.26 2.57 0.33 2.33 2.55 2.15 0.25 0.8 0.9
Korea 0.74 0.64 4.74 1.53 4.48 3.23 2.03 1.75 2.9 3.4 New Zealand
0.73 0.71 4.72 2.28 2.39 2.89 0.82 0.25 2.4 2.3
South East Asia
1.36 1.89 6.27 2.31 0.51 2.51 2.07 0.25 2.6 2.6
North America
0.78 0.89 3.02 3.04 0.86 2.37 2.17 0.75 2.7 2.5
E.U. 0.09 0.02 3.02 0.76 2.91 2.19 2.17 1.25 1.9 2.3 South America
1.37 1.94 5.50 0.96 3.15 2.91 2.79 1.25 2.8 3.0
Sub-Saharan Africa
2.55 2.84 5.97 1.05 -0.03 1.85 0.30 0.75 3.1 3.3
ROW 1.38 1.86 5.45 2.47 0.30 0.97 2.07 0.75 3.3 3.2
Source: Hertel et al. (1999b)
Deleted: 3
Deleted: 3
Deleted: 7
Deleted: 0
Deleted: 2

25
Figure 4 Graphical presentation of a TRQ
O Q
D1
D2
D3
Pw
Pw (1+ ti)
Pw (1+ to)
a
b
c d

26
27
Figure 1 Global Trade in Coarse Grains & Meats (grain equivalent)
0
20
40
60
80
100
120
140
61 71 81 91 99
(mill
ion
tonn
es)
coarse grains meats

Page 3: [1] Deleted Professor Allan Rae 1/11/2001 11:27:00 AM
Over this period, the percentage of total calorie intakes contributed by animal products rose from just 6% to over 18% in China. The increases in Northeast and Southeast Asia were less spectacular, but by 1998 the average consumer in Northeast Asia obtained almost 20% of total calories from foods of animal origin (Table 1). The extent of the switch to meats in the diets of East Asians is made clear by Table 2 which shows that of the total global increase in meat consumption over the 1970-98 period, over half occurred in East Asia and over 40% in China alone. East Asia’s contribution to global increases in dairy product consumption is less dramatic – while global consumption increased by 185 million tonnes over 1970-98, less than 10% of that increased consumption took place in East Asia. Average levels of per capita consumption of meats and dairy products in East Asia are given in Table 3. Regional meat consumption per person prior to 1990 was highest in Northeast Asia. Since then, it has been overtaken by China due to that country’s rapid consumption increase. Even so, meat consumption per capita has doubled since the late 1970s in both Northeast and Southeast Asia. The countries of Northeast Asia dominate as far as consumption of dairy products is concerned and by 1998 consumption levels were about one-third higher than in 1978. While the consumption per person of dairy products showed little growth over this period in Southeast Asia, Chinese consumers had increased consumption of milk and dairy products by over 150% from a low base.
Page 3: [2] Deleted Professor Allan Rae 1/11/2001 11:27:00 AM
East Asia is a net importer of meats and dairy products, with Japan dominating this trade. Table 4 shows that of the total increase in the tonnage of meat traded globally between 1970 and 1998, East Asia absorbed nearly 30%. In contrast, the region accounted for less than 10% of the total growth in global meat exports over the same period. For dairy products, East Asia accounted for 15% of the expansion in global imports over the 1970-98 period. Close to 25% of the total world meat trade by value is imported into East Asia, with Japan’s share of global imports varying between 15% and 20% depending on the meat type. Despite her huge population and rapidly increasing consumption of meats, China remains a net exporter. However, her trade balance in meats of US$1 - 3 billion in recent years is dwarfed by Japan’s trade deficit of $7 - $9 billion. East Asia’s net trade deficit in dairy products has exceeded US$2 billion in recent years, with around one half of that deficit due to Southeast Asia’s dairy imports. Japan has the single largest trade deficit, of a little under $1 billion. In contrast to her position as a meats trader, China is a net importer of dairy products. Japan is the region’s major cheese importer, while milk powders are prominent in Southeast Asia’s dairy imports (FAOSTAT).
Page 3: [3] Deleted Allan Rae 7/24/2000 9:27:00 PM
[Table 1 about here.] In 1992 meat products provided the greatest contribution to animal-based calorie intake in all of the countries with the exception of Japan, where it was second to fish consumption. Pork

provided the highest proportion of total meat consumption in each country except for Malaysia and Thailand, where it ranked second to poultry. In five of the seven economies, dairy products accounted for less than 15% of the animal-based calories consumed - the exceptions being Japan and Malaysia where the proportions were 18% and 23% respectively. Annual growth rates in the per capita consumption of all animal products are presented in Table 2 for the periods 1972-82 and 1982-92. During the earlier of these periods consumption growth was by far the highest in Korea at 7% per year, followed by both China and Malaysia with annual growth rates of 3.5%. Over the period 1982-92, the growth in animal products consumption in Korea had slowed to 4.4% per year, while the annual growth rate in China had risen to 6.2%. The country with almost static per person consumption of animal products during 1972-82 (Thailand) showed an increased rate of consumption growth during the following ten years. In none of the study countries had total animal products consumption demonstrated a falling trend. Table 2 also gives the annual growth rates in per person consumption of meats and dairy products. China and Korea stand out as exhibiting rapid recent growth in the consumption of both types of animal products. In China for example, consumption per person of each product group rose by over 6% per annum, on average, over the period 1982-92. Mention is also made of the 7% annual growth in the per person consumption of dairy products in Thailand over the more recent time period. [Table 2 about here.]
Page 3: [4] Deleted Professor Allan Rae 1/11/2001 11:27:00 AM
3. LEVELS OF PROTECTION IN LIVESTOCK PRODUCTION Governments use a variety of instruments to provide protection to their livestock industries. These include support prices, input subsidies, import tariffs, quantitative restrictions on imports, sanitary and food safety regulations that restrict imports, and export subsidies when domestic prices are supported above world prices. There are a number of ways in which the extent of such protection can be measured by a single indicator. For example the effective rate of protection (ERP) compares value-added at domestic prices with value-added at world prices. The OECD makes extensive use of the producer subsidy equivalent (PSE) which measures the total funds transferred to farmers through agricultural policies as a percentage of farmers revenue. Other possible indicators are the levels of the tariffs applied to imports, or subsidies paid on exports. All of these measures have been calculated for some livestock products and countries at various times, and together help form a picture of the extent of livestock protection. While the PSE measure excludes the impact of non-agricultural policies on farm production incentives, the OECD estimates comprise arguably the most comprehensive comparable collection of farm protection data. In 1999, total funds transferred to farmers through agricultural policies in all OECD countries amounted to US$283 billion. Of this, one-third was directed to

livestock producers. Of the major livestock products, milk was by far the most heavily supported, this commodity alone accounting for 18% of total OECD support payments to agriculture. Beef accounted for 9% of the total transfers, while total spending on support of pig and poultry meat and eggs amounted to just 5% of total support. Table 5 shows trends in the PSE payments as a percentage of dairy and beef farm revenues over the past 15 years. Of the countries shown, dairy protection is highest by far in Japan and Korea with around 70-80% of farm revenue derived from support payments. This measure of dairy protection is around 50-60% in the EU and North America, and also similar to the OECD average. Dairy protection is lowest in New Zealand, with zero transfers recorded in 1999. For beef production, protection is highest in Korea and the EU, followed by Japan. In contrast, the beef sectors of Australasia and North America receive very little government support. Obtaining comprehensive data on the extent of livestock protection in the non-OECD countries of Asia is more problematic. Rae (1992) gives ERP estimates for livestock protection in Southeast Asian countries, although based on late-1980s data they are somewhat outdated. At that time, dairy production was highly protected with ERP values ranging between 70% in Thailand to over 300% in Malaysia. Effective protection of beef production in Thailand exceeded 80% but was negative in Indonesia due mainly to the impact of restrictive trade policies on feeds prices. For the same reason, effective protection of non-ruminants in Indonesia was also negative. Protection of non-ruminant livestock production in Malaysia and Thailand was relatively low, in the range of –25% to +15%. Thus the overall picture in Southeast Asia was one of high protection to ruminant livestock and lower if not negative protection of non-ruminant production. Little information also seems to be available on the extent of protection offered to livestock sectors in China. Imports of both meats and dairy products are constrained by tariffs, import licensing requirements and restrictions over the permitted domestic distribution activities of foreign suppliers. The levels of tariffs, especially for dairy products (up to 50% or more), appear to provide substantial support to domestic producers (APEC).