
Trade arrival dynamics and quote imbalance in a limit ... arrival dynamics and quote imbalance in a...
15
Trade arrival dynamics and quote imbalance in a limit order book Alexander Lipton * , Umberto Pesavento † and Michael G Sotiropoulos ‡ 2 December 2013 Abstract We examine the dynamics of the bid and ask queues of a limit order book and their relationship with the intensity of trade arrivals. In particular, we study the probability of price movements and trade arrivals as a function of the quote imbalance at the top of the limit order book. We propose a stochastic model in an attempt to capture the joint dynamics of the top of the book queues and the trading process, and describe a semi-analytic approach to calculate the relative probability of market events. We calibrate the model using historical market data and discuss the quality of fit and practical applications of the results. 1 Introduction The prevalence of computer driven trading has radically changed the market struc- ture in several asset classes, most notably in equities and futures. This has attracted the interest of researchers driven by both practical and academic motivations. Early studies have followed an econometric approach in exploring the relationship between order flow and prices within electronic trading venues [8, 7, 5, 13], whereas later stud- ies focused on understanding and reducing the price impact caused by large orders [1, 4]. More recently, several researchers have focused on the application of point processes [12, 3], queueing theory [6] and agent’s utility functions [2] to modeling electronic markets. Participants in electronic trading fall into several categories, with different char- acteristics and objectives. Although any formal classification is blurred by the fact that the same market participants often interact in several capacities at the same * Bank of America Merrill Lynch and Imperial College † Bank of America Merrill Lynch ‡ Bank of America Merrill Lynch 1 arXiv:1312.0514v1 [q-fin.TR] 2 Dec 2013
Transcript of Trade arrival dynamics and quote imbalance in a limit ... arrival dynamics and quote imbalance in a...

Trade arrival dynamics and quote imbalance in alimit order book
Alexander Lipton∗, Umberto Pesavento†and Michael G Sotiropoulos‡
2 December 2013
Abstract
We examine the dynamics of the bid and ask queues of a limit order bookand their relationship with the intensity of trade arrivals. In particular, westudy the probability of price movements and trade arrivals as a function ofthe quote imbalance at the top of the limit order book. We propose a stochasticmodel in an attempt to capture the joint dynamics of the top of the book queuesand the trading process, and describe a semi-analytic approach to calculate therelative probability of market events. We calibrate the model using historicalmarket data and discuss the quality of fit and practical applications of theresults.
1 IntroductionThe prevalence of computer driven trading has radically changed the market struc-ture in several asset classes, most notably in equities and futures. This has attractedthe interest of researchers driven by both practical and academic motivations. Earlystudies have followed an econometric approach in exploring the relationship betweenorder flow and prices within electronic trading venues [8, 7, 5, 13], whereas later stud-ies focused on understanding and reducing the price impact caused by large orders[1, 4]. More recently, several researchers have focused on the application of pointprocesses [12, 3], queueing theory [6] and agent’s utility functions [2] to modelingelectronic markets.
Participants in electronic trading fall into several categories, with different char-acteristics and objectives. Although any formal classification is blurred by the factthat the same market participants often interact in several capacities at the same∗Bank of America Merrill Lynch and Imperial College†Bank of America Merrill Lynch‡Bank of America Merrill Lynch
1
arX
iv:1
312.
0514
v1 [
q-fi
n.T
R]
2 D
ec 2
013

time, algorithmic traders can be roughly divided into the following categories: marketmakers, who provide the most liquidity in the markets and try to capture the bid-ask spread with minimum duration risk; systematic traders and arbitrageurs, whotypically try to profit from price dislocations and statistical relationships among theprices of different securities; and agency brokers, who execute large trades on behalfof their customers. Irrespective of their objectives, all market participants in a publicelectronic venue contribute to price formation by adding and removing liquidity in alimit order book where quotes are published and orders are matched.
Here, we will analyze the dynamics of prices and trades from an agency broker’spoint of view, faced with the task of buying or selling a given number of shareswithin a set time horizon and at the best possible price. The broker typically seeksto obtain liquidity from a variety of market venues, including public exchanges, darkpools and internal liquidity sources. In a public exchange, a broker has the choice toeither remove liquidity from the far side (that is, the ask side for a buy order or thebid side for a sell order) or add liquidity to the near side of the order book. Eitherstrategy has its advantages and trade-offs. When removing liquidity, one pays thefull spread but is free to choose the timing of the trade. When posting passively, oneavoids paying the spread but gives up the timing option. In order to explore thistrade-off, we study the relationship between price dynamics and intensity of tradearrival. In the next sections we will first compute empirically average price movesand waiting times conditional on the state of the order book. We then attempt tocapture the main features by introducing a stochastic model for diffusion in threedimensions. We compute the probabilities of price movement and trade occurrencefrom the model, and calibrate them to recent historical market data.
2 Empirical observationsA common intuition among market practitioners is that the order sizes displayed atthe top of the book reflect the general intention of the market. When the numberof shares available at the bid exceeds those at the ask, participants expect the nextprice movement to be upwards, and inversely, for the ask. This is why, for example,a broker working an order on behalf of a client might be concerned about postingtoo much of it at the near side, thus showing his intentions to the rest of the market.In order to quantify and model this intuition, we calculate a few quantities relatedto the microstructure of the order book conditional on its bid-ask imbalance definedas
I =qb − qa
qb + qa, (1)
where qb and qa are the bid and ask quantities posted at the top of the book. Positive(negative) imbalance indicates an order book that is heavier on the bid (ask) side. In
2

Figure 1: Average mid price move normalised by the bid-ask spread and waiting timeuntil the next mid price move as a function of book imbalance. The data displayclearly the non-martingale nature of prices at the short time scales considered here. Inthe case shown, the average price move can be up to a third of the spread in a highlyimbalanced book. The data shown are obtained by averaging the mid price movesof VOD.L for all trading days in the first quarter of 2012. The data are bucketedaccording the initial imbalance in the book and averaged over the entire tradingday. Error bars are calculated by treating the daily averages of price variations asindependent data points. The daily average variations display error bars so smallthat they are hardly visible in the scale of the plot above.
3

t0 pb0 pa0 qb0 qa0t1 pb1 pa1 qb1 qa1t2 pb2 pa2 qb2 qa2t̃0 p̃0 q̃0 s̃0t3 pb3 pa3 qb3 qa3t4 pb4 pa4 qb4 qa4t̃1 p̃1 q̃1 s̃1t5 pb5 pa5 qb5 qa5t6 pb6 pa6 qb6 qa6t̃2 p̃2 q̃2 s̃2... ... ... ... ...
Table 1: Price moves and waiting times until trade arrival. We denote quote updatesby tuples (ti, pbi , pai , qbi , qai ), with the quantities indicating respectively the time of thequote update, the new best bid, the new best ask, the number of shares at thebest bid and those at the ask. The change in just one of the prices or quantities issufficient to trigger the publication of a quote update, i.e. a new row in the table. Inthe same table we denote a trade execution by the tuple (t̃j, p̃j, q̃j, s̃j) with quantitiesindicating the time, the price, the quantity and the side of the trade. This sequenceis used for computing price moves and waiting times until the arrival of the nexttrade, as described in the text
Figure 1, we show the effect of the book imbalance on the average mid price changeand on the waiting time until the next price change. We calculate these quantitiesby considering the stopping time defined by the next change in either the best bidor the best ask. The average price changes are therefore related to the conditionalup-tick and down-tick probabilities, which have been previously considered in theliterature [6]. Here, we use the same probabilities to compute the average size of theprice jump1. As expected, a high book imbalance is indicative of the general tradingintention in the market and, on average, a good predictor of mid price movements.The price change until the next tick is well approximated by a linear function ofthe imbalance and is typically well below the bid-ask spread, even for highly imbal-anced order books. In other words, although book imbalance might be used as apredictor for the next price movement, it does not by itself offer an opportunity fora straightforward statistical arbitrage.
The average waiting time until the next mid price change is also affected by theimbalance of the order book, with highly imbalanced books indicating a price movecoming in a relatively short time. This relationship is to be expected in a market
1A mid price change event can be induced by several actions, such as a trade, a cancellationor even the addition of a new quote between the current bid and ask spread, if the spread is bigenough. None of these actions is a sufficient condition for the mid price to change, but at least oneof them is necessary.
4
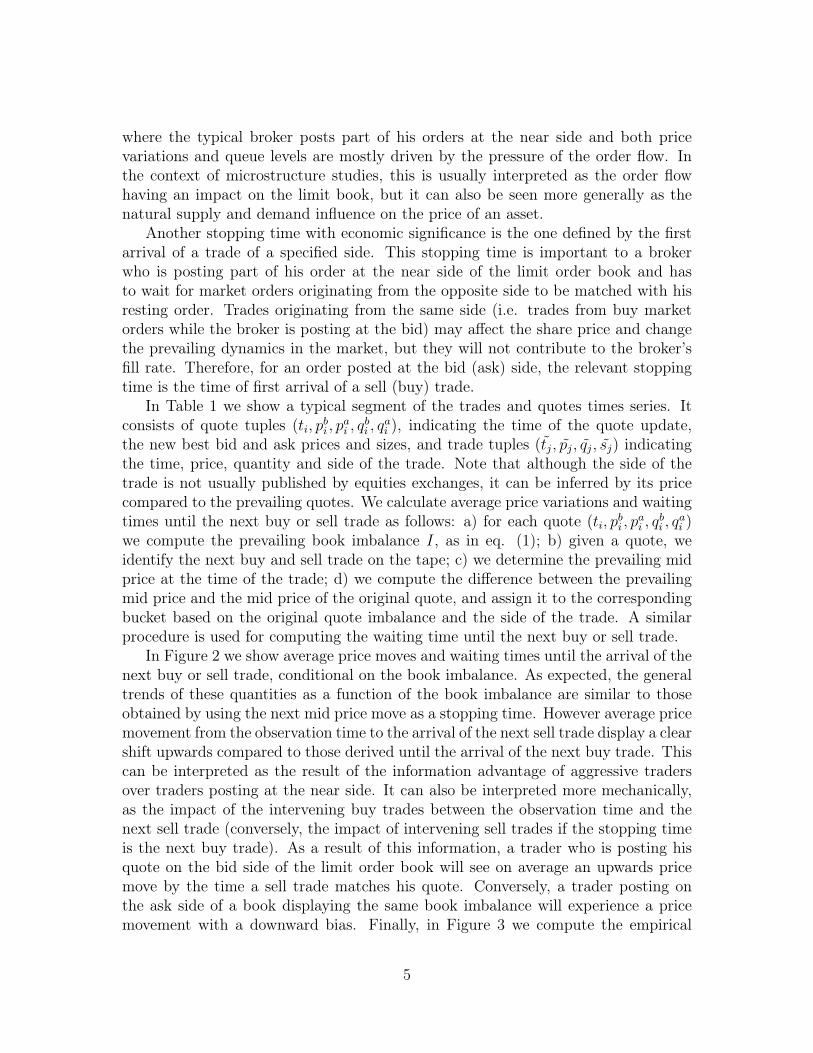
where the typical broker posts part of his orders at the near side and both pricevariations and queue levels are mostly driven by the pressure of the order flow. Inthe context of microstructure studies, this is usually interpreted as the order flowhaving an impact on the limit book, but it can also be seen more generally as thenatural supply and demand influence on the price of an asset.
Another stopping time with economic significance is the one defined by the firstarrival of a trade of a specified side. This stopping time is important to a brokerwho is posting part of his order at the near side of the limit order book and hasto wait for market orders originating from the opposite side to be matched with hisresting order. Trades originating from the same side (i.e. trades from buy marketorders while the broker is posting at the bid) may affect the share price and changethe prevailing dynamics in the market, but they will not contribute to the broker’sfill rate. Therefore, for an order posted at the bid (ask) side, the relevant stoppingtime is the time of first arrival of a sell (buy) trade.
In Table 1 we show a typical segment of the trades and quotes times series. Itconsists of quote tuples (ti, p
bi , p
ai , q
bi , q
ai ), indicating the time of the quote update,
the new best bid and ask prices and sizes, and trade tuples (t̃j, p̃j, q̃j, s̃j) indicatingthe time, price, quantity and side of the trade. Note that although the side of thetrade is not usually published by equities exchanges, it can be inferred by its pricecompared to the prevailing quotes. We calculate average price variations and waitingtimes until the next buy or sell trade as follows: a) for each quote (ti, p
bi , p
ai , q
bi , q
ai )
we compute the prevailing book imbalance I, as in eq. (1); b) given a quote, weidentify the next buy and sell trade on the tape; c) we determine the prevailing midprice at the time of the trade; d) we compute the difference between the prevailingmid price and the mid price of the original quote, and assign it to the correspondingbucket based on the original quote imbalance and the side of the trade. A similarprocedure is used for computing the waiting time until the next buy or sell trade.
In Figure 2 we show average price moves and waiting times until the arrival of thenext buy or sell trade, conditional on the book imbalance. As expected, the generaltrends of these quantities as a function of the book imbalance are similar to thoseobtained by using the next mid price move as a stopping time. However average pricemovement from the observation time to the arrival of the next sell trade display a clearshift upwards compared to those derived until the arrival of the next buy trade. Thiscan be interpreted as the result of the information advantage of aggressive tradersover traders posting at the near side. It can also be interpreted more mechanically,as the impact of the intervening buy trades between the observation time and thenext sell trade (conversely, the impact of intervening sell trades if the stopping timeis the next buy trade). As a result of this information, a trader who is posting hisquote on the bid side of the limit order book will see on average an upwards pricemove by the time a sell trade matches his quote. Conversely, a trader posting onthe ask side of a book displaying the same book imbalance will experience a pricemovement with a downward bias. Finally, in Figure 3 we compute the empirical
5

Figure 2: Mid-price moves normalised by the bid-ask spread and waiting times untilarrival of the next buy or sell trade. The average mid-price moves and waiting timesare shown as a function of the book imbalance. Again, the expected price movedisplays a strong dependence on the book imbalance. However it also shows a cleardependence on the side of the trade determining the stopping time.
probability of the next market event as a function of the current book imbalance.The events of interest are a favourable or unfavourable price move or the occurrenceof a matching trade from the point of view of a broker pegging part of his order onthe near side, i.e. the broker keeps updating his quote to stay at the prevailing bestbid or ask price.
In the next sections, we will explain the empirical observations summarized inFigures 1 and 3 by introducing a three-dimensional stochastic model for the jointevolution of the bid/ask queues and the near side trade arrival process. Beforedeveloping the full model we will first review a simpler, two-dimensional model forthe bid and ask queues only, in order to introduce some of the analytical techniquesthat are used in the full three-dimensional model.
3 Modeling the bid and ask queuesOur starting point is the two-dimensional diffusion model for the top of the book[6].We model the number of shares qb and qa posted at the top of the order book forthe bid and ask with the following stochastic processes:
(dqb, dqa) = (dwb, dwa), (2)
where wb, wa are Brownian motions. Because the number of shares available at thetop of the book is always a positive quantity, when either of the two processes crossthe positive axis we reset its value by drawing from two positive distributions qbinitial
6

Figure 3: Probabilities of market events as a function of the book imbalance. Thedata are obtained by averaging probabilities of market events bucketed by the im-balance in the order book for VOD.L for all trading days in the first quarter of 2012.Error bars are obtained by treating averages of different trading days as independentdata points. Favourable or unfavourable price moves are from the point of view of abroker who is posting part of his order at the near side of the order book.
and qainitial. One can think of these distributions as modeling the next price levels inthe book; once the first level is depleted, they serve as a new starting point for thetop queue. Following this interpretation, we will also assume that every time oneof the two queues is depleted the price also moves in the direction of the depletedqueue. If the ask queue is depleted the price moves up; if the bid is depleted theprice moves down. In other words, we assume that as one side of the book is depletedunder the pressure of incoming aggressive trades and cancellations of existing limitorders, the other side follows it to keep the bid-ask spread fixed.
Given the queue model of equation (2), it is natural to ask whether an up-tick ora down-tick is the most likely future price move. We can calculate such probabilitiesby identifying the x and the y axes of the plane with the bid and the ask quotesizes respectively and writing the general equation for the evolution of the hittingprobability:
1
2Pxx +
1
2Pyy + ρxy Pxy = 0, (3)
where ρxy is the correlation between the diffusion processes governing the depletionand replenishment of the bid and ask queues. This correlation is typically negativein a normal market. The choice of boundary conditions selects the event with corre-sponding probability P . For example, for an up-tick price movement, the boundaryconditions are
P (x, 0) = 1, P (0, y) = 0. (4)
7
Moreover, since the probability P is for event occurrence up to the first stoppingtime, the PDE in eq. (3) is time independent. In fact, the solution is the T → ∞limit of the fixed T horizon problem.
As shown in [9, 6, 11] among others, it is possible to solve the above PDE by in-troducing two changes of variables. The first transformation removes the correlationbetween the queue processes:
α(x, y) = x
β(x, y) =(−ρxyx+ y)√
1− ρ2xy,
(5)
yielding the equation
Pαα + Pββ = 0. (6)
The second transformation casts the modified problem in polar coordinates:
{α =r sin(ϕ)
β =r cos(ϕ)←→
r =√α2 + β2
ϕ =arctan(α
β
),
(7)
where cos$ = −ρxy. Then the equation for the hitting probability becomes
Pϕϕ(ϕ) = 0, (8)
and the boundary conditions for an up-tick price movement become
P (0) = 0, P ($) = 1. (9)
The solution in polar coordinates is straightforward, P (ϕ) = ϕ/$, which in theoriginal set of coordinates has the form
P (x, y) =1
2
1−arctan(
√1+ρxy1−ρxy
y−xy+x
)
arctan(√
1+ρxy1−ρxy )
. (10)
This is the probability of upward movement of a Markovian order book in the diffusivelimit.
4 Adding trade arrival dynamicsIn order to capture the joint dynamics of the bid and ask queues and trade arrival,we introduce another stochastic process to model the arrival of trades on the nearside of the book (the bid side for a broker executing a buy order, or the ask side fora sell order):
8

(dqb, dqa, dφ) = (dwb, dwa, dwφ) (11)
The process φ does not correspond to a market observable. However, in analogy toour model for the bid and ask queues, we assume that a new trade hits the near sidewhenever φ crosses the origin. Within this extended three dimensional model, thequeue processes qb and qa are now driven exclusively by the addition and cancellationof limit orders in the book until the arrival of a trade, while the timing of near sidetrade arrivals is governed by the φ process. More importantly, we can model therelationship between book imbalance, order flow and price variations by introducingcorrelations between the stochastic processes dwb, dwa, and dwφ.
The introduction of an unobserved diffusion process dwφ for modeling trade ar-rival leads to a non-Markovian model. As in the two-dimensional case, we assumethat once a queue gets depleted or a trade arrives, the process wφ restarts at a valueφ0 which characterizes the trade arrival time distribution. This model parameter isto be determined by calibration.
During the dynamic optimization of an execution schedule, one needs to considerthe relative likelihood of favourable and adverse price moves and of trade arrivalat the near side of the book. In terms of the model described above, these eventscorrespond to the three dimensional stochastic process (qb, qa, φ) crossing the posi-tive orthant. In the following, we calculate the probability of these market eventsconditional on the state of the queue and the value of the trade process φ. As in theprevious section we identify the x and y coordinates with the processes governingthe bid and ask queue sizes, and the z coordinate with the level of the process φ.The equation for the hitting probability becomes:
1
2Pxx +
1
2Pyy +
1
2Pzz + ρxyPxy + ρxzPxz + ρyzPyz = 0, (12)
where ρxy is the correlation between the processes governing the bid and ask queues,and ρxz and ρyz are the correlation of those processes with that governing the arrivalof the trades at the near side. The different events are identified by the boundaryconditions of P , which are set to one on the plane corresponding to the market eventconsidered, and zero on all other boundaries. For example, the probability of a nearside trade before any price move corresponds to the boundary conditions
P (x, 0, z) = 0, P (0, y, z) = 0, P (x, y, 0) = 1. (13)
As in the two dimensional case, it is possible to remove the correlations betweendwb, dwa, and φ via the coordinate change
9

α(x, y, z) =x
β(x, y, z) =(−ρxyx+ y)√
1− ρ2xy
γ(x, y, z) =
[(ρxyρyz − ρxz)x+ (ρxyρxz − ρyz) y + (1− ρ2xy)z
]√1− ρ2xy
√1− ρ2xy − ρ2xz − ρ2yz + 2ρxyρxzρyz
,
(14)
yielding the equation
Pαα + Pββ + Pγγ = 0. (15)
Then we cast the problem into a convenient set of curvilinear coordinates via thetransformation
α =r sin θ sinϕ
β =r sin θ cosϕ
γ =r cos θ
←→
r =√α2 + β2 + γ2
θ =arccos(γr
)ϕ =arctan
(α
β
) (16)
yielding the modified problem
1
sin2 θPϕϕ +
1
sin θ
∂
∂θ(sin θPθ) = 0, (17)
and the boundary condition for a near side trade becomes
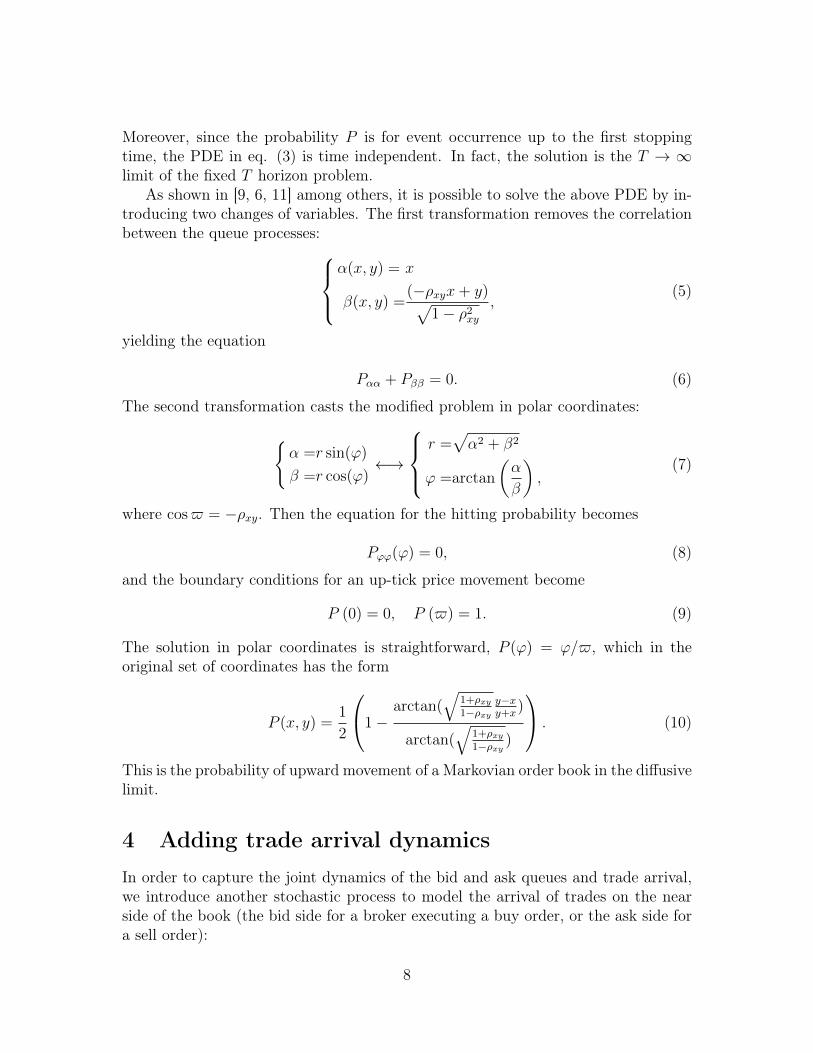
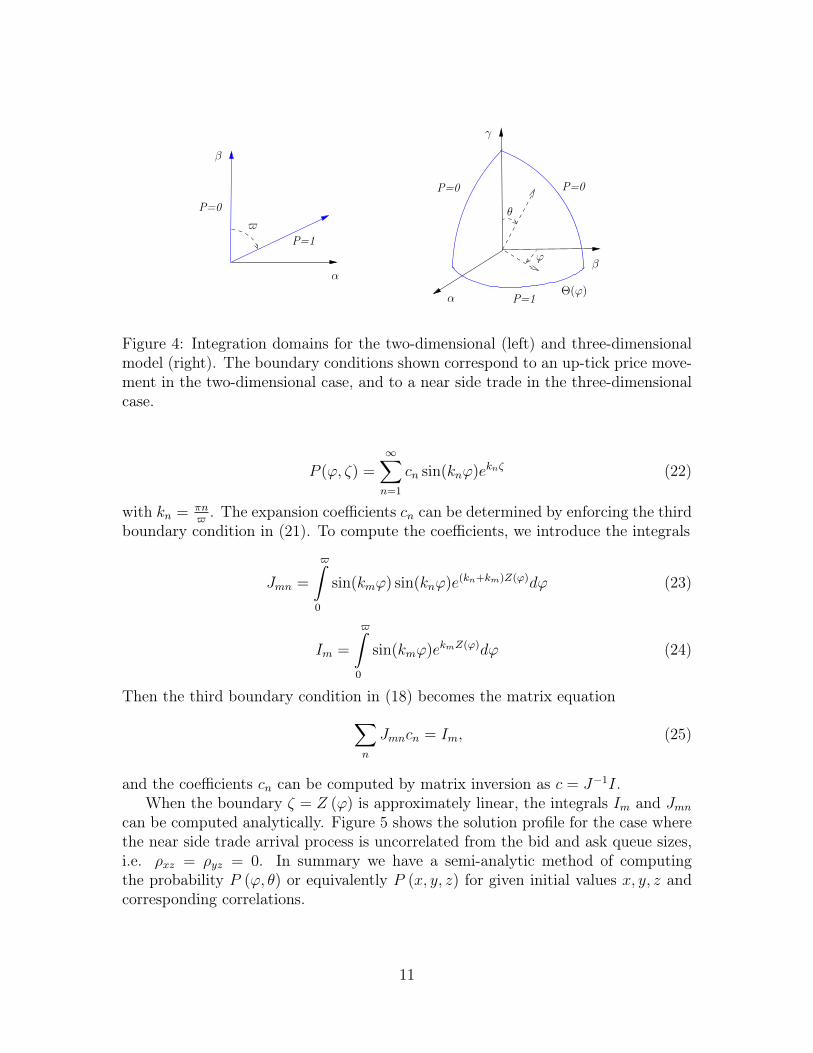
P (0, θ) = 0, P ($, θ) = 0, P (ϕ,Θ(ϕ)) = 1. (18)
The new integration domain after the introduction of spherical coordinates is shownin Figure 4. The problem (17) can be further simplified by introducing one extratransformation,
ζ = ln tan θ/2, (19)
which changes the integration domain into the semi-infinite strip, 0 ≤ φ ≤ $, ζ ≤Z (φ), and the diffusion equation (17) into the form
Pϕϕ + Pζζ = 0. (20)
In this domain the near side trade boundary conditions become
P (0, ζ) = 0, P ($, ζ) = 0, P (ϕ,Z(ϕ)) = 1. (21)
The solution to problem (20) that satisfies the first two boundary conditions (21)can be expressed as a generalized Fourier series [10]:
10
Θ(ϕ)
θ$
P=0 P=0
P=1α
β
γ
α
β
P=1
P=0
ϕ
Figure 4: Integration domains for the two-dimensional (left) and three-dimensionalmodel (right). The boundary conditions shown correspond to an up-tick price move-ment in the two-dimensional case, and to a near side trade in the three-dimensionalcase.
P (ϕ, ζ) =∞∑n=1
cn sin(knϕ)eknζ (22)
with kn = πn$. The expansion coefficients cn can be determined by enforcing the third
boundary condition in (21). To compute the coefficients, we introduce the integrals
Jmn =
$̂
0
sin(kmϕ) sin(knϕ)e(kn+km)Z(ϕ)dϕ (23)
Im =
$̂
0
sin(kmϕ)ekmZ(ϕ)dϕ (24)
Then the third boundary condition in (18) becomes the matrix equation∑n
Jmncn = Im, (25)
and the coefficients cn can be computed by matrix inversion as c = J−1I.When the boundary ζ = Z (ϕ) is approximately linear, the integrals Im and Jmn
can be computed analytically. Figure 5 shows the solution profile for the case wherethe near side trade arrival process is uncorrelated from the bid and ask queue sizes,i.e. ρxz = ρyz = 0. In summary we have a semi-analytic method of computingthe probability P (ϕ, θ) or equivalently P (x, y, z) for given initial values x, y, z andcorresponding correlations.
11

Figure 5: PDE solution to the problem (17) in the ϕ, θ space, for $ = 1.2 andboundary conditions as in (18) .
5 CalibrationWe proceed by calibrating the model jointly to the average mid-price moves shown inFigure 2 and to the empirical probabilities of price moves and trade arrivals summa-rized in Figure 3. It was shown in the previous section that the model probabilitiesare determined by the book imbalance (relative size of the bid and ask queues), theinitial position of the trade arrival process φ0 and the three elements of the correla-tion matrix ρ. The book imbalance is a market observable, and the remaining fourparameters are to be estimated by the calibration process. Model probabilities arecomputed semi-analytically as in the previous section. Expectations of price changesup to the stopping time defined by the arrival of a trade cannot be easily computedwith analytic methods and Monte Carlo simulations were used instead.
We calibrate the model against empirical probabilities of price movements forequity VOD.L for all trading days in the first quarter of 2012. The results are shownin Figures 6 and 7. Calibrations against data from other liquid stocks displayedqualitatively similar results. We note that the model reproduces the gap between theaverage mid-price moves until the arrival of a buy or sell trade. The gap is controlledby the correlation matrix ρ and in particular by the two correlations between thetrade arrival process and the bid and ask queue processes. This shift in averageprice moves conditioned on the side of the trade can be interpreted as the expectedslippage of a passive fill. When executing an order, a broker will typically post afraction of the total quantity at the near side in an attempt to save part of the spread.However, when measuring the differences in the average price achieved by aggressive
12
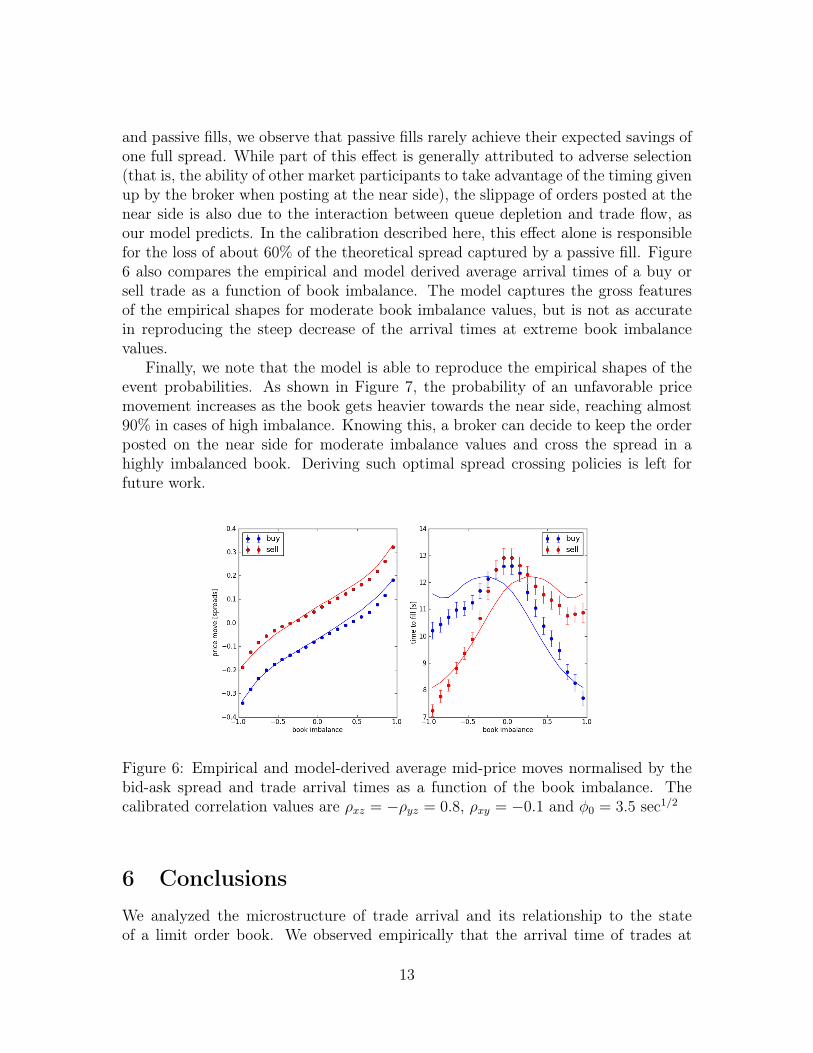
and passive fills, we observe that passive fills rarely achieve their expected savings ofone full spread. While part of this effect is generally attributed to adverse selection(that is, the ability of other market participants to take advantage of the timing givenup by the broker when posting at the near side), the slippage of orders posted at thenear side is also due to the interaction between queue depletion and trade flow, asour model predicts. In the calibration described here, this effect alone is responsiblefor the loss of about 60% of the theoretical spread captured by a passive fill. Figure6 also compares the empirical and model derived average arrival times of a buy orsell trade as a function of book imbalance. The model captures the gross featuresof the empirical shapes for moderate book imbalance values, but is not as accuratein reproducing the steep decrease of the arrival times at extreme book imbalancevalues.
Finally, we note that the model is able to reproduce the empirical shapes of theevent probabilities. As shown in Figure 7, the probability of an unfavorable pricemovement increases as the book gets heavier towards the near side, reaching almost90% in cases of high imbalance. Knowing this, a broker can decide to keep the orderposted on the near side for moderate imbalance values and cross the spread in ahighly imbalanced book. Deriving such optimal spread crossing policies is left forfuture work.
Figure 6: Empirical and model-derived average mid-price moves normalised by thebid-ask spread and trade arrival times as a function of the book imbalance. Thecalibrated correlation values are ρxz = −ρyz = 0.8, ρxy = −0.1 and φ0 = 3.5 sec1/2
6 ConclusionsWe analyzed the microstructure of trade arrival and its relationship to the stateof a limit order book. We observed empirically that the arrival time of trades at
13
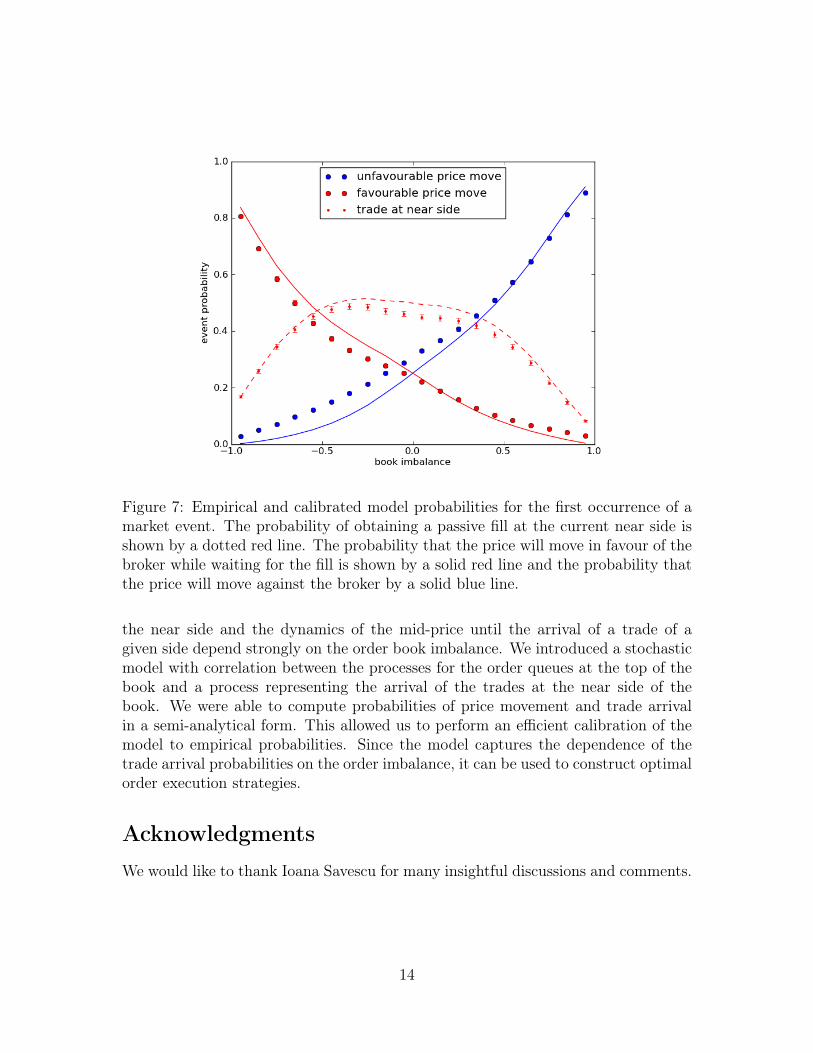
Figure 7: Empirical and calibrated model probabilities for the first occurrence of amarket event. The probability of obtaining a passive fill at the current near side isshown by a dotted red line. The probability that the price will move in favour of thebroker while waiting for the fill is shown by a solid red line and the probability thatthe price will move against the broker by a solid blue line.
the near side and the dynamics of the mid-price until the arrival of a trade of agiven side depend strongly on the order book imbalance. We introduced a stochasticmodel with correlation between the processes for the order queues at the top of thebook and a process representing the arrival of the trades at the near side of thebook. We were able to compute probabilities of price movement and trade arrivalin a semi-analytical form. This allowed us to perform an efficient calibration of themodel to empirical probabilities. Since the model captures the dependence of thetrade arrival probabilities on the order imbalance, it can be used to construct optimalorder execution strategies.
AcknowledgmentsWe would like to thank Ioana Savescu for many insightful discussions and comments.
14

References[1] R. Almgren, C. Thum, H. L. Hauptmann, and H. Li. Equity market impact.
Risk, 18:57, 2005.
[2] M. Avellaneda and S. Stoikov. High-frequency trading in a limit order book.Quantitative Finance, 8:217–224, 2008.
[3] E. Bacry and J.F. Muzy. Hawkes model for price and trades high-frequencydynamics. SIAM Journal of Financial Mathematics, submitted to, 2013.
[4] J.-P. Bouchaud, J. D. Farmer, and F. Lillo. How markets slowly digest changesin supply and demand. In T. Hens and K Schenk-Hoppe, editors, Handbook ofFinancial Markets: Dynamics and Evolution. Elsevier: Academic Press, 2008.
[5] J.-P. Bouchaud, D. Mezard, and M. Potters. Statistical properties of stock orderbooks: empirical results and models. Quantitative Finance Finance, 2:251–256,2002.
[6] R. Cont and A. de Larrard. Order book dynamics in liquid markets: limittheorems and diffusion approximations. Working paper, 2012.
[7] R. F. Engle. The econometrics of ultra-high frequency data. Econometrica,68:1–22, 2000.
[8] J. Hasbrouck. Measuring the information content of stock trades. Journal ofFinance, 46:179–207, 1991.
[9] A. Lipton. Mathematical Methods For Foreign Exchange: A Financial Engi-neer’s Approach. World Scientific Publishing Company, 2001.
[10] A. Lipton. A structural approach to pricing credit derivatives with counter-party adjustments: additional thoughts. Global Derivatives, Trading and RiskManagement, Amsterdam, 2013.
[11] A. Lipton and I. Savescu. CDSs, CVA and DVA - a structural approach. Risk,26(4), 2013.
[12] S. Stoikov R. Cont and R. Talreja. A stochastic model for order book dynamics.Operations research, 58(3):549–563, 2010.
[13] E. Smith, J.D. Farmer, L. Gillemot, and S. Krishnamurthy. Statistical theoryof the continuous double auction. Quantitative Finance, 3:481–514, 2003.
15