Trade and Fisheries: Key Issues for the World Trade ... · World Trade Organization ... other...
62
Staff Working Paper ERSD-2010-03 Date: January 2010 World Trade Organization Economic Research and Statistics Division This paper appears in the WTO working paper series as commissioned background analysis for the World Trade Report 2010 on "Trade in Natural Resources: Challenges in Global Governance" Trade and Fisheries: Key Issues for the World Trade Organization Frank Asche: University of Stavanger, Norway and Martin D. Smith: Duke University, USA Manuscript date: December, 2009 Disclaimer : This is a working paper, and hence it represents research in progress. This paper represents the opinions of the authors, and is the product of professional research. It is not meant to represent the position or opinions of the WTO or its Members, nor the official position of any staff members. Any errors are the fault of the authors. Copies of working papers can be requested from the divisional secretariat by writing to: Economic Research and Statistics Division, World Trade Organization, Rue de Lausanne 154, CH 1211 Geneva 21, Switzerland. Please request papers by number and title.
Transcript of Trade and Fisheries: Key Issues for the World Trade ... · World Trade Organization ... other...
Staff Working Paper ERSD-2010-03 Date: January 2010
World Trade Organization Economic Research and Statistics Division
This paper appears in the WTO working paper series as commissioned background analysis
for the World Trade Report 2010 on "Trade in Natural Resources: Challenges in Global Governance"
Trade and Fisheries: Key Issues for the World Trade Organization
Frank Asche: University of Stavanger, Norway and
Martin D. Smith: Duke University, USA
Manuscript date: December, 2009 Disclaimer: This is a working paper, and hence it represents research in progress. This paper represents the opinions of the authors, and is the product of professional research. It is not meant to represent the position or opinions of the WTO or its Members, nor the official position of any staff members. Any errors are the fault of the authors. Copies of working papers can be requested from the divisional secretariat by writing to: Economic Research and Statistics Division, World Trade Organization, Rue de Lausanne 154, CH 1211 Geneva 21, Switzerland. Please request papers by number and title.
1
Trade and Fisheries: Key Issues for the World Trade Organization
Frank Asche and Martin D. Smith°
December 2009
° Frank Asche is a professor in the Department of Industrial Economics, University of Stavanger, N-4036 Stavanger, Norway, [email protected] . Martin D. Smith is an associate professor of environmental economics in the Nicholas School of the Environment and the Department of Economics, Duke University, Box 90328, Durham, NC 27701, USA, [email protected] . The authors gratefully acknowledge comments and suggestions from Cathy Roheim, Ahmed Khan, and other participants in the Global Seafood Sustainability Working Group sponsored by the National Center for Ecological Analysis and Synthesis in Santa Barbara, California. The authors also thank Jim Wilen for permission to reprint Figure 3.3. The opinions expressed in this document are those of Asche and Smith.
2
Executive Summary
Fisheries are common-pool resources, and many of world’s fisheries are overexploited. At the same time, capture fisheries and aquaculture operations can impinge on public goods provided by marine ecosystems such as marine biodiversity and unique habitat. The common-pool and public goods dimensions of the marine environment justify regulation, but the issues frequently transcend national boundaries. Individual countries have few alternatives to protect the marine environment beyond their own jurisdictions. The international nature of marine conservation thus provides an incentive for countries to use trade policy as an indirect means to protect the marine environment. Because a large share of the available seafood is being traded, trade restrictions can potentially lead to better resource protection and better fishing practices. Seafood’s high degree of tradability also suggests that trade policy as a means to promote marine conservation can have significant economic consequences. Although seafood has long been traded internationally, trade has increased dramatically in recent decades such that fish and fishery products now constitute the most highly traded food commodity internationally. Many seafood markets have expanded from strictly regional to truly global markets. Freezing and storage technology along with low transportation costs have facilitated this globalization of the fish trade. The seafood trade is characterized by both high degrees of segmentation and market integration. Segmentation results from the fact that there are many product types, most of which are not close substitutes for each other. Still, globalization has led to more integration of certain product types such as the whitefish market, which includes species caught in multiple regions around the globe. The trend is toward further integration. Another important consideration for the seafood trade is that production from capture fisheries has leveled off and even declined in some countries. The increase in seafood trade is thus attributable to growth in aquaculture production and increased exports from developing countries. Developing countries, in turn, may be most affected by trade policies that restrict seafood imports failing to meet environmental standards. Two features of seafood production complicate the application of standard trade theory to seafood trade restrictions or liberalization. First, seafood production, whether from capture fisheries or aquaculture, has an unusually close connection to the environment. In capture fisheries, producing fish directly feeds back on the ability of the environment to sustain fish production in the future. This feature distinguishes fisheries from most other natural resources. The higher degree of control with the production process in aquaculture makes aquaculture more like traditional industries. Second, many fisheries are open access, an institutional arrangement in which fishermen cannot be excluded from fishing. Open access (or management systems that do little to exclude access) is considered to be the root cause of overexploitation in fisheries, leading to economic waste from excess capacity and environmental harm through degradation of biological stocks and alteration of ecosystems. Biological growth of a fish stock combined with open access or poor management systems can lead to a backward-bending supply curve for fish along which the long-run supply of fish is less when price increases. This characteristic of open access fisheries theoretically can lead to unconventional outcomes
3
from trade liberalization, including the possibility that increased trade may not benefit both parties in the long run. When a fishery is well managed, standard trade theory applies. Optimally or well managed fisheries will typically operate on the conventional portion of the supply curve that is not backward-bending and also with a larger fish stock than under open access. The literature on policy instruments to achieve optimal outcomes in fisheries focuses mostly on rights-based tools such as individually transferable quotas, which break the non-excludability problem of open access. A complementary literature on regulated open access suggests that biological stocks in many fisheries are maintained at safe levels through input controls and season closures, but failure to exclude access leads to economic losses. Under trade liberalization, regulated open access many not lead to changes in the long-run supply of fish. There is still much debate about the effectiveness of different management types and the resulting impacts on biological and economic outcomes. The quality of management systems varies substantially across and within countries from poor management systems close to open access to well developed systems close to optimal management. As a result, predicting the effects of trade restrictions or trade liberalization on fisheries must be done on a case by case basis. In addition, there are a number of fish stocks that are subject to Illegal, Unregulated and Unreported (IUU) fishing—some in international waters and some within jurisdictions of individual nations. Fishing practices also differ substantially across countries, and in many developing countries—and for industrial fleets fishing in international waters—the overfishing problem is often exacerbated by subsidies. In contrast to other industries, such subsidies, while wasteful, are unlikely to convey long-run competitive advantages for subsidizing countries. Many common-pool fisheries problems occur in international waters or involve straddling or shared fish stocks. Regional Fishery Management Organizations (RFMOs) work to establish multilateral agreements on fishing levels and practices and seek to enforce these agreements with the assistance of member countries. In some cases, as with IUU fishing, trade restrictions can be the only way to regulate environmentally problematic practices. At the same time, such measures can also discriminate between countries, and particularly be detrimental to developing countries with limited capacity to manage fish stocks or to document the management. There is significant momentum in industrialized countries toward rights-based management of fisheries that break the non-excludability problem of open access. But there is also momentum toward more ecosystem-based management of the marine environment that considers a broader set of issues such as spatial characteristics of fisheries. These trends may influence the international fish trade, as they have the potential to alter production of capture fisheries and aquaculture operations and thus can affect demand for imports. Moreover, management trends may influence international environmental norms, which could lead to increased pressure for trade restrictions to promote marine conservation.
4
Trade actions of individual countries or groups of countries have the potential to fall under the jurisdiction of, and possibly conflict with, a wide range of WTO rules, including sanitary and phytosanitary measures, anti-dumping, subsidies and countervailing measures, and technical barriers to trade and rules of origin. Depending on how broadly protection of human health and the environment are interpreted, efforts to promote marine conservation could lead to a proliferation of trade restrictions that are allowable under WTO rules.
5
Table of Contents
Executive Summary ............................................................................................................ 2
1. Introduction ................................................................................................................. 6
2. Trade in seafood products ........................................................................................... 7
3. Bioeconomics of the fishery ..................................................................................... 15
4. Trade theory and renewable resource economics ..................................................... 26
5. International institutions and the global commons ................................................... 29
6. Domestic trends toward ITQs and ecosystem-based management ........................... 33
7. Trade disputes, open access, ecosystem externalities, and WTO rules .................... 35
References ......................................................................................................................... 44
6
1. Introduction
Though overfishing is the most widely discussed environmental issue in fisheries, it is just one of many issues that potentially will influence the international seafood trade. On the simplest level, unmitigated overfishing globally will affect the supply of seafood available for international trade. After all, there is little doubt that many of the world’s fish stocks are degraded (FAO, 2006). In addition, by reducing fish stocks to unnecessarily low levels, overfishing influences the balance of ecosystems and threatens biodiversity. However, many more subtle influences on international trade in seafood products could emerge from the interactions among domestic fisheries management, international agreements, and a wide array of environmental concerns about fisheries and fish production—some of which transcend national boundaries while others do not. These interactions have the potential to conflict with WTO rules that include anti-dumping measures, subsidies and countervailing measures, and technical barriers to trade. Seafood safety issues, in contrast, will likely emerge in the context of sanitary and phytosanitary measures. As globalization has dramatically increased the amount of fish traded internationally, there are growing concerns that many countries lack the necessary infrastructure to manage fish stocks sustainably, protect against food-borne illnesses, and mitigate against the environmental impacts of fishing and fish farming. What distinguishes fisheries from most other natural resources and traditional industries is the unusually close connection to the environment. Depending on management system, this feature can lead to unconventional outcomes from trade liberalization. Open access—when fishermen cannot be excluded from fishing—is considered the root cause of overexploitation in fisheries, leading to economic waste from excess capacity and environmental harm through degradation of biological stocks and alteration of ecosystems. Biological growth of a fish stock combined with open access or poor management systems can lead to a backward-bending supply curve for fish along which the long-run supply of fish is less when price increases. Optimally or well managed fisheries will typically operate on the conventional portion of the supply curve that is not backward-bending and with a larger fish stock than under open access. Many of the theoretical results on trade and renewable resources build on the backward-bending supply of fish. Trade liberalization, as a result, can be welfare reducing depending on whether resource management institutions are effective. In this report we first give a brief overview of trade in seafood and seafood production. We then review the basic bioeconomic theory of the fishery and pinpoint why fisheries are different from most other industries. We next review the theoretical literature on trade and renewable resources that shows how unconventional outcomes from trade liberalization can emerge. Given this background, we discuss the most important policy issues in relation to seafood and trade, including sections on managing the global commons and domestic trends in management. In the final section, we discuss specific issues that are germane to the WTO and its rules.
7
2. Trade in seafood products1
Seafood has been a traded commodity for thousands of years. From early on, the quantity traded was limited. A main reason for this was the perishability of seafood, and conserving fish (e.g., by producing dried fish) was time consuming, costly, and often inefficient. However, improved storage and preservation technologies and cheaper transportation have dramatically increased fish trade over the last 30 years. After adjustment for inflation, from 1976 to 2006 world seafood trade value increased threefold, from 28.3 billion USD to 86.4 billion USD. During the same period, trade volume increased from 7.9 million tonnes to 31.3 million tonnes, or almost fourfold. Hence, the unit value of seafood has decreased, increasing seafood’s competitiveness as a food source. A number of factors have caused the increased trade in seafood. Transportation and logistics have improved significantly. Substantial reductions in transportation costs by surface and air has promoted the international trade of new product forms like such as fresh seafood. Lower transportation costs have also given new producers access to the global market. Improved logistics has allowed economies of scale and scope on all levels of the supply chain, and particularly in the retail sector where supermarkets has replaced fishmongers and markets in a number of places. Progress in storage and preservation has continued, allowing a wider range of seafood products to be traded. Freezing technology during recent years has improved to such an extent that many product forms can be frozen twice. Products can be processed in locations with competitive advantages in processing fish rather than in locations close to where the fish is caught. Aquaculture production has increased significantly and now makes up over 40% of total production. The improved control in the harvesting process has enabled producers to better target the needs of the modern consumer, and to further innovate in the supply chains. Total seafood production has continued to increase, increasing the available supply of seafood globally. The imposition of 200-mile exclusive economic zones (EEZs) by coastal nations also gave strong incentives to increased trade.2 Countries with considerable distant-water fishing fleets, such as Spain and Japan, have been negatively affected, as coastal nations expanded their domestic fleets to exploit the fisheries within their 200-mile EEZ. As a result, countries that relied on harvesting within the 200-mile EEZ of foreign nations had to increase their imports to meet domestic demand. The different factors tend to reinforce each other even though the strength of each differs by market and species. While increased seafood production in itself gives incentives to increase trade, this is not a necessary consequence. It is primarily improved transportation and logistics and better storage and preservation together with competitive prices that enabled expansion of trade. The increased trade has had a profound effect on seafood
1 This section is largely based on Anderson, Asche and Tveterås (2009) 2 Peru, Ecuador, and Chile implemented EEZs as early as 1952. By the time the US declared its 200-mile EEZ in 1976, 37 nations had already extended their jurisdiction, and by the mid-1980s, nearly all coastal nations had imposed EEZs.
8
markets, as an increasing number of markets have gone from regional to global and as more species from widely different places have become substitutes. Moreover, a growing share of producers have access to the global market as global transportation systems improve and can take advantage of new market opportunities. For those markets that have the ability to pay, these trends increase the available supply of seafood in the short run. Hence, the share of the imports into the EU, Japan, and the USA remain high. In the long run, it remains to be seen whether market access will lead to sustained production of seafood, as this access could lead to further degradation of fish stocks and the environment in regions with poor management institutions. As trade flows have increased, the organization of the supply chain has changed in a number of places. The growth of large supermarket chains exemplifies this change. These chains emphasize efficient logistics and distribution and have, in many cases, removed some intermediaries associated with traditional supply chains. Moreover, improved freezing technology has enabled processing to be set up in places far removed from where the fish is caught, such as China, Poland and Thailand. Air freight of fresh fish has opened up competition from producers located thousands of miles away from the high-end fresh markets that traditionally were served only by local fishermen. 2.1 Seafood production and trade patterns
The total supply of seafood increased from 71.7 million tonnes in 1976 to 159.9 million tonnes in 2006 (FAO, 2008). Hence, the availability of seafood has more than doubled. Seafood appears from two main modes of production – harvest and aquaculture. Until the 1970s, aquaculture was not very important. However, since then a virtual revolution has taken place. Figure 2.1 shows the changing production from wild fisheries and aquaculture. In 1970 aquaculture production was still rather miniscule with a produced quantity of about 3.5 million tones, representing 5.1% of total seafood supply. In 2006, aquaculture made up 41.8% of total seafood supply with a production of 66.7 million tonnes. Capture fisheries production, on the other hand, has fluctuated between 90 and 100 million tonnes in annual landings with no particular trend. The increased production in aquaculture is accordingly the only reason why global seafood supply has continued to increase since 1990. The increased production has been sufficient to not only maintain, but also to slightly increase global per capita consumption of seafood. Aquaculture is a production technology with its origins in Egypt and China thousands of years ago. Beginning in the 1970s, a significant change took place as better control over the production process enabled a number of new technologies and production practices to develop. These changes dramatically improved the competitiveness of aquaculture products both as sources of basic food and as cash crops. The competitiveness of aquaculture has further been increased by the product development and marketing that was possible with a more predictable supply. The combined effect of productivity and market growth has made aquaculture the world’s fastest growing animal-based food sector of the last decades (FAO 2006).
9
It is interesting to note that the breadth of species being produced in aquaculture is almost as large as in wild fisheries, including kelp, mussels, low-value fish like carp, medium-value species like tilapia, and high-value species like shrimp and salmon. High-value species tend to play a more significant role in the international trade of aquaculture products. Fisheries supply is, on the other hand, not expected to increase very much, as FAO (2006) defines a majority of fish stocks being either fully exploited or over-exploited. We may be fairly close to extracting as much seafood as possible from the oceans assuming we do not change the composition of the species in the oceans significantly. In this report, the main focus will be on fisheries, because it is primarily the unique features of the production process of these common-pool resources that create particular challenges. Aquaculture is a more traditional production process that is comparable to agriculture in its interaction with the environment and exploitation of natural resources. Aquaculture’s interaction with common-pool resources (e.g. water, mangrove forest) is similar to that of agriculture and is best dealt with in a similar fashion. This is generally true also of the interactions between aquaculture and fisheries, such as the so called fishmeal trap. The ‘fish meal trap’ is the name of a hypothesis that claims that aquaculture is environmentally degrading because increased demand for feed leads to increased fishing effort and thereby threatens the viability of wild fish stocks (Naylor et al. 2000). Moreover, it follows from this hypothesis that the availability of marine feed will put a limit on how much the aquaculture sector can produce because the availability of wild fish is limited. However, fishmeal is used also by other industries, particularly chicken and poultry production, and because overfishing is essentially a fisheries management problem, it is difficult to argue that the use of fishmeal in aquaculture should be restricted (Anderson, Asche and Tveterås, 2009). International trade has increased much faster than total seafood production.3 From 1976 to 2006 the export volume of seafood increased from 7.9 million tonnes to 31.3 million tonnes, or almost fourfold. Adjusted for inflation, the export value during this period increased threefold from 28.3 billion USD to 86.4 billion USD (Figure 2.2). One should note that export quantities are not directly comparable to the production quantities, as exports are measured in product weight, which can lead to dramatic differences. The fillet weight of tilapia, for instance, is only between 30% and 40% of its harvest weight. As such, when the traded quantity is about 30 million tonnes product weight and the total production quantity is about 150 million tonnes live weight, one can conclude that the traded quantity is at least 25%. But traded quantity is most likely higher because a significant share of the trade is in processed products. The actual figure is probably between 30 and 40% of total production. In addition, seafood trade also influences many domestic markets significantly, as local fishermen and fish farmers are exposed to the competition from imports. When export quantity increases fourfold and export value only threefold, the unit value of the seafood decreases. This has increased seafood’s competitiveness as a food source, and
3 Anderson (2003) provides a thorough review of international seafood trade, and also discusses trade of the most important species.
10
is an important factor explaining increased trade. Successful aquaculture species such as salmon and shrimp demonstrate this phenomenon, where real prices now are less than one-third of what they were 25 years ago. The profitable expansion in the production of these species, despite decreasing prices, is partly due to lower production cost, improved production technologies, and lower distribution and logistics costs. We will return to this issue later in the paper to address whether production costs have decreased at the expense of the environment. The trade patterns are widely different between exports and imports. The export sources were split almost equally between developing and developed countries in 2006, as shown in Figure 2.2. The share for developing countries has increased from 37% in 1976 to 49% in 2006. For imports, the picture looks very different, as shown in Figure 2.3. Imports to developed countries comprised 80% of all imports in 2006. Even though the share declined from 86% in 1976, most of the increased trade in seafood is due to developed countries, and a considerable share is exported from developing countries. This picture is confirmed in Table 2.1, which shows the world’s 10 largest seafood exporters and importers. The 10 largest importers make up 67.5% of all imports, while the 10 largest exporters make up 51.5% of the exports. Hence, imports are more concentrated. Additionally, four of the exporters are developing countries, but only two of the importers are developing countries. Japan and the USA appear as the two largest importers (Table 2.1). However, if the EU countries are aggregated, the EU is clearly the largest market. Figure 2.4 illustrates this strong growth in the EU market. It is certainly not arbitrary that developed countries take most of the imports and that the EU, Japan, and the USA are the largest seafood importers. These are the wealthiest regions in the world, with the best ability to pay. In a similar manner, economic growth has led to an impressive growth in seafood demand and also imports in growing economies like China and Southeast Asia (Delgado et al 2003).4 Improved (and cheaper) transportation and infrastructure give an increased number of developing country producers access to these markets, and thereby lead to increased seafood exports. Improved transportation has further catalyzed the development of industrialised aquaculture, and, as such, is the main reason why an increasing number of new species is available at fish counters and restaurants in the EU, Japan, and the USA, and now, increasingly in China and South East Asia. In general, increased trade will be beneficial for exporters that receive a higher price for their product. In developing countries, this increase leads to economic development. It is also beneficial for consumers (and often also processors) in the importing country, as the imports provide a higher quantity at competitive prices. For local consumers in exporting regions, increased exports often lead to higher prices. In some cases, higher prices can be a food security challenge in places where seafood is a staple for the poorest citizens. Increased imports can also be negative for domestic fishermen and aquaculturists in the import market, since the imports tend to put downward pressure on the demand of their
4 In Figure 2.4, the import figures for China start in 1998.
11
products. Protectionism may be the main reason for the increased number of anti-dumping complaints related to seafood in the EU and the USA.5 2.2 From regional to global markets
As noted above, the geographical extent of fish markets was traditionally limited by the perishability of the product. Until one hundred years ago, dried, dried salted, and heavily salted fish were the main product forms that were shipped over long distances. For other product forms, the market was at best regional and often very local.6 From about the turn of the 20th century, the seafood trade has increased steadily due to improved storage and preservation and cheaper transportation. For instance, railways allowed larger but still limited quantities of high-end products, like oysters and lobster, to be shipped by rail. In addition, canning provided preservation that allowed seafood to be stored for a long time. However, canned product is very different from fresh product, and storage and preservation technology led to market segmentation. For canned product, the geographical extent of the market was vastly expanded, and for some species the market became global, e.g. tuna and salmon. While fish was caught throughout the world in the first half of the 20th century, most of what was traded was consumed in the EU, Japan and the USA.7 When freezing technology became popular in the 1950s, it largely replaced canning (and drying and salting) as the main storage and preservation method for a number of species and markets. Freezing is now the preferred storage and preservation method for most high value species. Because freezing requires capital equipment, both in the freezing process and in storage throughout the value chain, it is still most prevalent in wealthier countries, although its use is steadily expanding. The concentration of freezing in wealthy countries also made most markets appear regional. For instance, the whitefish market was a North Atlantic market involving countries in Western Europe, Canada, and the USA; Pacific halibut was a Pacific Northwest market. However, as transportation and logistics continued to improve, freezing technology spread to other regions, and demand for fish could not be met from regional fisheries due to overfishing, the sources for fish became increasingly global. The whitefish market is a good example. In 1980 it included primarily North Atlantic species like cod, saithe, and haddock. But by 1990, Alaska pollock and Pacific cod were established as major parts of the market, linking the North Atlantic and North Pacific fisheries. During the 1990s, species such as Nile perch, Argentinean and Namibian hake, hoki from New Zealand, as well as farmed species like
pangasius and tilapia, made the market truly global. For most preserved products, transportation costs are not a big issue because they make up only a small percentage of the final price. For instance, the current cost of transporting
5 Keithly and Poudel (2008) provide an interesting discussion of shrimp in the USA. 6 It is interesting to note that an important reason for the longstanding, long-distance fish trade in Europe was that Catholics generally did not eat meat on Fridays and during Lent prior to the changes of Vatican II. 7 We use the term EU to describe the countries of Western Europe even before the formation of the European Community and the European Union (EU).
12
frozen salmon from Alaska or Chile to virtually any market in the world is about US 50 cents per kilo. Hence, for producers with access to the international trade routes, distance is generally no longer a significant barrier. For producers in many developing countries, the main challenge in this respect is processing and infrastructure. Until the late 1980s, most seafood trade was in preserved products, although limited quantities of some high-end products were also shipped fresh on ice or live. Fresh seafood was primarily supplied by fishermen within the same region, even though improved infrastructure had expanded the market so that it could be accessed by virtually any producer. Salmon aquaculture then changed this picture dramatically. Initially, salmon farmers in Norway and the UK sold their fish to the same markets that consumed wild salmon, that is, domestic high end restaurants and gourmet shops. As these markets were saturated and pressure on prices commenced, new markets were sought. Because of substantial economies of scale in transport and logistics, producers tended to target one geographic market at a time. The first target was France, the largest seafood importer in Europe, with one of the largest high-end markets. It takes approximately 24 hours to transport salmon from Scotland or western Norway to Paris by truck, so it became possible to guarantee delivery of fresh fish that would reach the market less than three days after it was caught. With the geographic expansion of the market, a number of innovations were made with respect to logistics, preservation, and packaging. The development of leak-proof styrofoam packaging helped make airfreight feasible. In the mid-1980s the trade flow from Norway took a surprising turn as the USA became the largest export market after France. The use of air freight was important, as it largely removed the barrier that distance previously presented to the global market for fresh salmon. In 2006, Norway and Chile exported fresh salmon to more than 150 countries. Air freight also allowed producers in any location to access the market, and this can be seen as the main factor behind the success of Chile, now the second largest salmon producer.8 The same pattern can also be found for a number of other species. For instance, virtually all fresh tilapia consumed in the USA is flown in from Central and South America. Where the regulatory system allows a sufficient degree of control in the harvesting operation, similar systems have also been created for wild fish, with air freight of cod from Iceland being the most prominent example. Therefore, during the last two decades, a global market has been formed for fresh seafood. However, as air freight is significantly more expensive than other modes of transportation, this is still a high-end market. 2.3 Species and product forms
Despite the fact that the seafood market has largely become global, it is highly segmented. The market is segmented in at least two dimensions, by species and by product forms. We say that a market is integrated when: a) consumers are willing to shift their consumption to the relatively cheaper product when a product’s price changes
8 As the scale of production increases in industrialized aquaculture, the production risks also increase. An example is the recent disease outbreaks in Chilean salmon aquaculture, which may lead to Scottish and Canadian production of Atlantic salmon being higher than the Chilean production in 2010.
13
relative to its substitute, and/or b) producers shift their supply to the relatively higher paying market (product) when the market’s (product’s) price changes relative to the alternative. For example, if consumers shift from cod to haddock if the price of cod increases, then these two species are integrated. Another example of integrated markets is if producers increase supply to Europe and reduce it to the USA if prices in Europe increase relatively to the prices in the USA. When two markets form a common market (i.e., an integrated market) prices will tend to be highly correlated over time. However, as the daily catches vary, one would expect price to change from day to day.9 When investigating whether markets are integrated, one is not interested in the actions of individual consumers or firms. Rather, one is interested in whether a sufficient number of consumers or producers respond to the initial change in the relative prices so that the two products have a common price determination process. The seafood market is highly segmented because for most species prices are determined independently of each other, and this is also the case for many product forms.10 However, markets for different product forms using the same species as raw material tend to be more integrated than markets for different species. The main reason for this is that a producer does not care much about who the fish is sold to, and the fish will be sold to the buyer willing to pay the highest price. If two processors both want fish from the same fishery, they will have to pay similar prices. As such, the globalization of the fish market can be seen as a process through which a barrier to trade, namely transportation costs, has been reduced and the market has become more integrated as producers from more places ship their seafood to the highest-paying market. That the markets for different species are segmented, or not integrated, can be interpreted as evidence that consumers have different preferences for different types of seafood. Different species have different characteristics, and no chef would consider using the same recipe for cod as for herring or squid. However, globalisation also makes new species compete with each other. This change is most apparent in the whitefish market. Thirty years ago cod was the preferred species in this market. However, there also were several cheaper alternatives such as saithe and redfish. The price movements of these species were influenced by cod; few consumers would buy saithe or redfish if their prices become too close to the price of cod, while demand for the alternative species increased when their prices decreased relative to cod. In the 1980s Alaska pollock and Pacific cod entered the whitefish market, making the price of Alaska pollock related to the price of other types of whitefish. A number of other new species entered this market during the 1990s and later. These include farmed catfish, hoki, farmed pangasius, Nile perch, and farmed tilapia. Hence, the whitefish market not only became global during the last decades, but it grew as new species entered and
9 Asche, Bjørndal, and Gordon (2007) provide a review of studies investigating substitution and market integration for seafood. 10 This argument indicates that there is a limited degree of substitution between different types of protein. The empirical literature generally supports this view; there seems to be no or very little substitution between seafood and other types of meat in Europe and north America, though there is some evidence of such substitution in Japan (Asche, Bjørndal and Gordon, 2007). However, it should also be noted that this evidence is from developing countries, and circumstances can well be different in developing countries.
14
influenced the price determination process. The market also has more interconnections, since many species have alternative markets, including markets where they were traditionally sold. For instance, surimi has been one of the most important product forms for Alaska. When processors choose whether to produce a frozen fillet or surimi,11 they make decisions based on the prices in these markets, linking the whitefish and surimi markets. The whitefish market has changed, and there are now indications that cod, which used to be the leading species in the market segment, is no longer a competitor but forms a separate market segment. One reason that species with attributes that appear quite different from the traditional whitefish species can enter the market is the introduction of new product forms. In particular, with breaded and battered products, as well as ready-made meals, it is often very hard to distinguish between different species. As prices of cod and other whitefish species increased and landings decreased during the last decades, cheaper substitutes have become more attractive. As a result, cod is no longer used in low-valued product forms like fish fingers. It is also noteworthy that the aquaculture industry has started to target new market segments, and increasingly high volume rather than high price segments. Further, several firms are experimenting with frozen tilapia blocks, targeting the lower-priced end of the whitefish market. Figure 2.5 shows how US imported values of traditional whitefish like cod and Pollock have decreased since 1993, but total overall imported value has increased due to growth in tilapia imports. The aquaculture industry is also increasingly targeting market segments that traditionally have been serviced by land-based food producers. In many West European countries, one can now find freshly packed fish like salmon in similar presentations and in counters beside the chicken and pork sections. One can also find an increasing array of ready-made meals and easy-to-prepare seafood appetizers. The reliable supplies of farmed fish has also allowed an increasing degree of standardization in the hotel, restaurant and catering sector, and consequently increased the share of aquaculture products in this market segment. This development was led by salmon, catfish (in the USA), and shrimp, but more recently, new species like tilapia and pangasius appear on menus. The impact of aquaculture on seafood in the USA can be seen in Table 2.2. The table shows per capita consumption of the largest species in 2000 and 2006. As one can see, consumption of traditional wild species like tuna and cod is stagnant or declining, while consumption of (primarily) farmed species like shrimp, salmon and tilapia is rapidly increasing. The effect of tilapia is particularly profound, as the species was not on the top ten list in 2000. While the seafood market is still diverse, a significant part of product development makes it less diverse. For instance, as more species become “whitefish” and lose their separate identity, the seafood market becomes less segmented, as these species face a similar price determination processes. This development is likely to continue in order to meet the requirements of the largest outlets for seafood in many parts of the world, the retail chains.
11 Surimi is a processed fish paste that is a common ingredient in Japanese and other East Asian foods.
15
Most of the main trends in the seafood market have in common that they lead to more trade and a less segmented market; they contribute to the globalisation of the seafood market. However, during the last decade there also has been an increased focus on factors that segment the market, particularly in the EU and the USA. The two most important concerns are the environmental impacts of the fishing or aquaculture activity and seafood safety. The environmental impacts of fishing and fish farming as well as food safety factors have become product attributes that differentiate fish products that otherwise are similar tasting, and also influence market access. While food safety primarily has been a government concern, environmental attributes have generally fallen within the domains of private organizations and particularly NGOs. Through labelling, consumer campaigns, and certification, some NGOs have sought to establish product attributes such as the status of a fish stock, i.e. whether it is overfished, and the production methods used in catching the fish, e.g. whether the fishing gear harms marine biodiversity. Some of these campaigns seek to differentiate health attributes such as the mercury content of fish. When fish production and trade is strictly domestic, one can argue that government regulation is justified for all of these examples. But when fish are produced in other countries and traded internationally, parsing the roles of national governments and private organizations becomes more difficult. We return to these issues in later sections of the paper.
3. Bioeconomics of the fishery
In order to understand the efficiency consequences of trade in fisheries, it is important to review sources of inefficiency in fisheries more generally and highlight specific features of the fishery sector that are unique or unusual compared to other resource sectors. The starting place for understanding issues in fisheries is a recognition that fish resources are finite. Fish populations renew through biological reproduction, but there is only so much productive capacity in the oceans. By harvesting fish, humans reduce the stock of fish remaining in the oceans. But humans also affect the rate of regeneration and thus the availability of fish for harvest in the future. This feature distinguishes fisheries from most other natural resources that either do not renew (e.g. fossil fuels and other mineral resources) or that are cultivated in ways that humans have more control over biological growth (e.g. agricultural products and commercial forest extraction).12 In this section, we review the bieconomic theories of open access, optimal management, and regulated open access, and we discuss some of the empirical literature on these topics. The relationship between harvest and biological growth that distinguishes fisheries from most other natural resources can contribute to economically counterintuitive results, namely a backward-bending supply curve of fish.
12 Other biological resources that are harvested from the wild share this feature. In contrast, the productive capacities of farmed biological resources such as food crops, livestock production, fish from aquaculture, and commercial forest products are limited in part by an economically determined extensive margin, and the rates of growth are controlled at least partly by the harvester through breeding, planting, re-seeding, and stocking. Moreover, the extensive margin for farming ultimately has physical limits, but not all potential agricultural land is in agriculture.
16
3.1 Open access
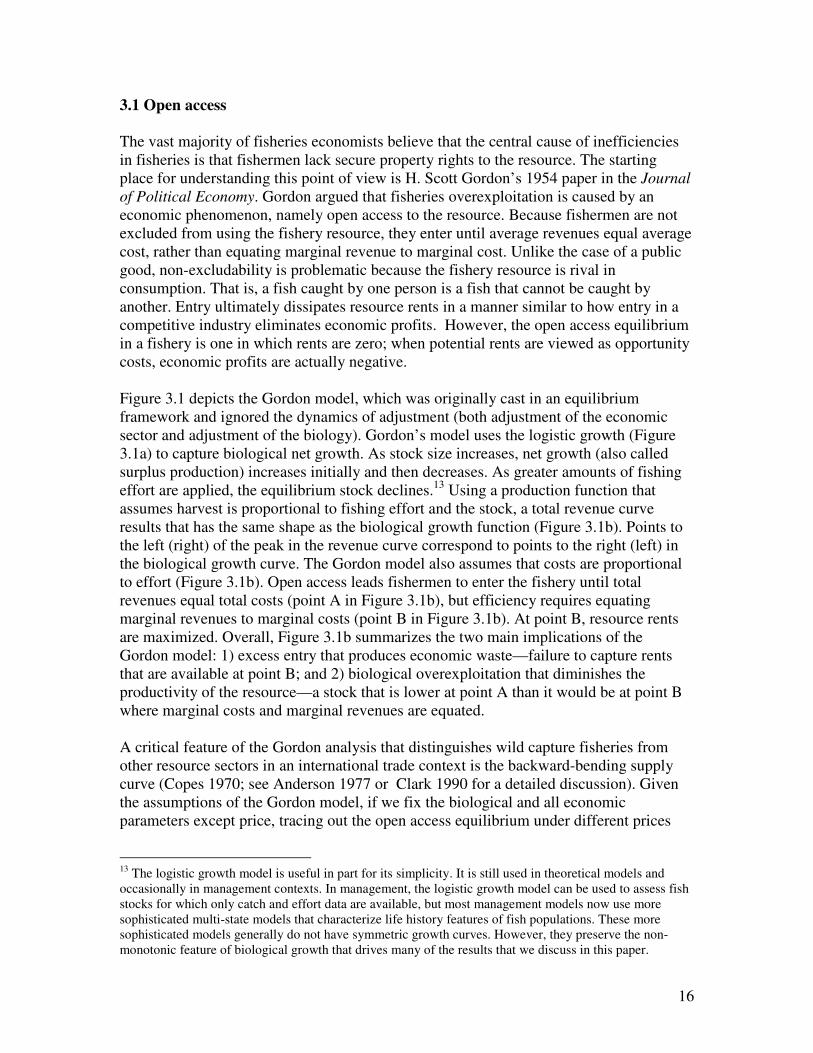
The vast majority of fisheries economists believe that the central cause of inefficiencies in fisheries is that fishermen lack secure property rights to the resource. The starting place for understanding this point of view is H. Scott Gordon’s 1954 paper in the Journal
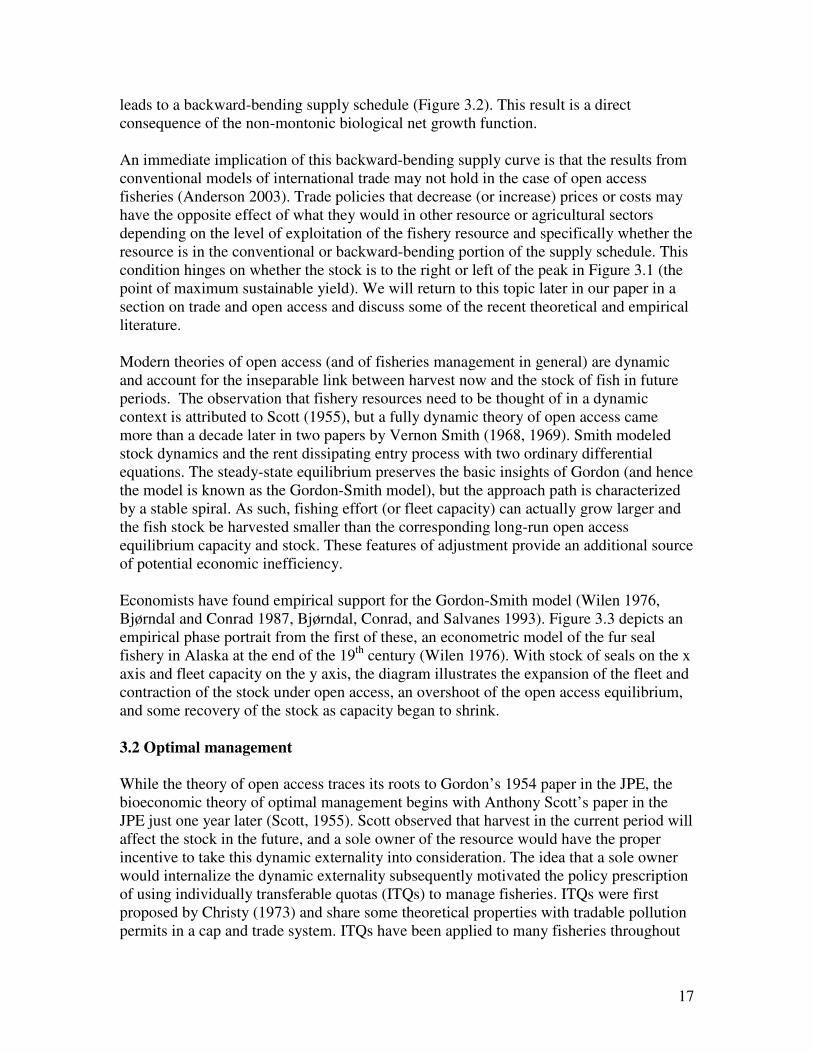
of Political Economy. Gordon argued that fisheries overexploitation is caused by an economic phenomenon, namely open access to the resource. Because fishermen are not excluded from using the fishery resource, they enter until average revenues equal average cost, rather than equating marginal revenue to marginal cost. Unlike the case of a public good, non-excludability is problematic because the fishery resource is rival in consumption. That is, a fish caught by one person is a fish that cannot be caught by another. Entry ultimately dissipates resource rents in a manner similar to how entry in a competitive industry eliminates economic profits. However, the open access equilibrium in a fishery is one in which rents are zero; when potential rents are viewed as opportunity costs, economic profits are actually negative. Figure 3.1 depicts the Gordon model, which was originally cast in an equilibrium framework and ignored the dynamics of adjustment (both adjustment of the economic sector and adjustment of the biology). Gordon’s model uses the logistic growth (Figure 3.1a) to capture biological net growth. As stock size increases, net growth (also called surplus production) increases initially and then decreases. As greater amounts of fishing effort are applied, the equilibrium stock declines.13 Using a production function that assumes harvest is proportional to fishing effort and the stock, a total revenue curve results that has the same shape as the biological growth function (Figure 3.1b). Points to the left (right) of the peak in the revenue curve correspond to points to the right (left) in the biological growth curve. The Gordon model also assumes that costs are proportional to effort (Figure 3.1b). Open access leads fishermen to enter the fishery until total revenues equal total costs (point A in Figure 3.1b), but efficiency requires equating marginal revenues to marginal costs (point B in Figure 3.1b). At point B, resource rents are maximized. Overall, Figure 3.1b summarizes the two main implications of the Gordon model: 1) excess entry that produces economic waste—failure to capture rents that are available at point B; and 2) biological overexploitation that diminishes the productivity of the resource—a stock that is lower at point A than it would be at point B where marginal costs and marginal revenues are equated. A critical feature of the Gordon analysis that distinguishes wild capture fisheries from other resource sectors in an international trade context is the backward-bending supply curve (Copes 1970; see Anderson 1977 or Clark 1990 for a detailed discussion). Given the assumptions of the Gordon model, if we fix the biological and all economic parameters except price, tracing out the open access equilibrium under different prices
13 The logistic growth model is useful in part for its simplicity. It is still used in theoretical models and occasionally in management contexts. In management, the logistic growth model can be used to assess fish stocks for which only catch and effort data are available, but most management models now use more sophisticated multi-state models that characterize life history features of fish populations. These more sophisticated models generally do not have symmetric growth curves. However, they preserve the non-monotonic feature of biological growth that drives many of the results that we discuss in this paper.
17
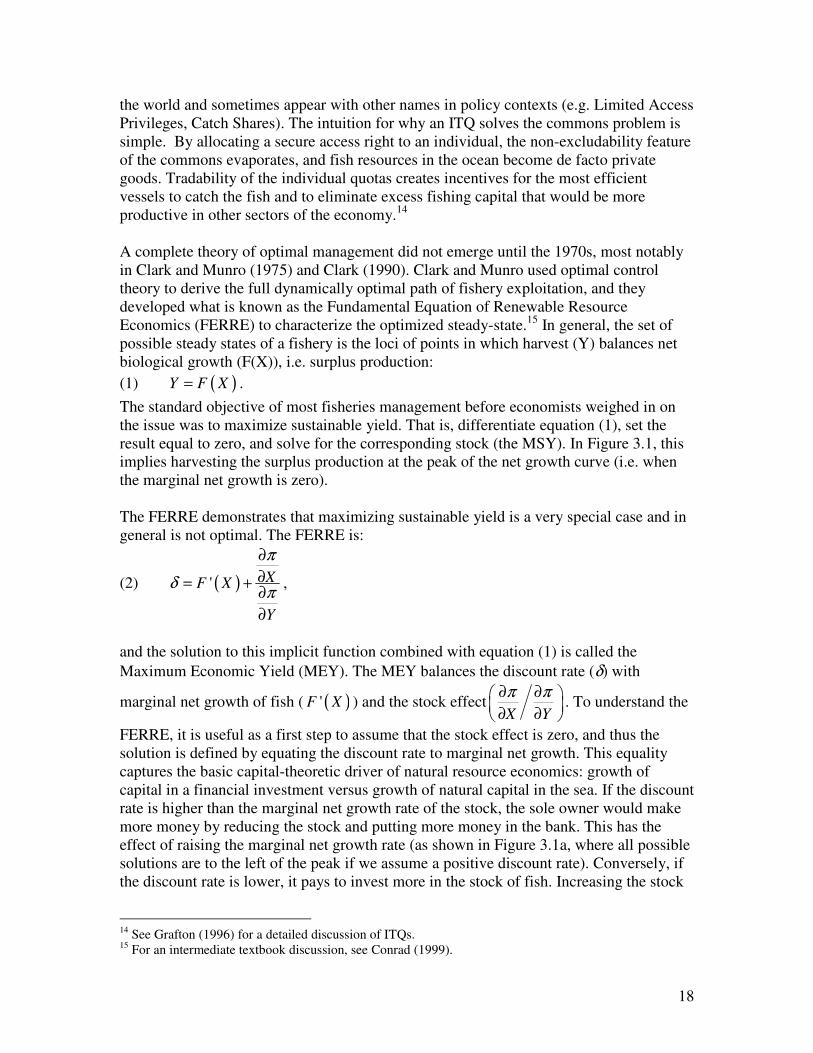
leads to a backward-bending supply schedule (Figure 3.2). This result is a direct consequence of the non-montonic biological net growth function. An immediate implication of this backward-bending supply curve is that the results from conventional models of international trade may not hold in the case of open access fisheries (Anderson 2003). Trade policies that decrease (or increase) prices or costs may have the opposite effect of what they would in other resource or agricultural sectors depending on the level of exploitation of the fishery resource and specifically whether the resource is in the conventional or backward-bending portion of the supply schedule. This condition hinges on whether the stock is to the right or left of the peak in Figure 3.1 (the point of maximum sustainable yield). We will return to this topic later in our paper in a section on trade and open access and discuss some of the recent theoretical and empirical literature. Modern theories of open access (and of fisheries management in general) are dynamic and account for the inseparable link between harvest now and the stock of fish in future periods. The observation that fishery resources need to be thought of in a dynamic context is attributed to Scott (1955), but a fully dynamic theory of open access came more than a decade later in two papers by Vernon Smith (1968, 1969). Smith modeled stock dynamics and the rent dissipating entry process with two ordinary differential equations. The steady-state equilibrium preserves the basic insights of Gordon (and hence the model is known as the Gordon-Smith model), but the approach path is characterized by a stable spiral. As such, fishing effort (or fleet capacity) can actually grow larger and the fish stock be harvested smaller than the corresponding long-run open access equilibrium capacity and stock. These features of adjustment provide an additional source of potential economic inefficiency. Economists have found empirical support for the Gordon-Smith model (Wilen 1976, Bjørndal and Conrad 1987, Bjørndal, Conrad, and Salvanes 1993). Figure 3.3 depicts an empirical phase portrait from the first of these, an econometric model of the fur seal fishery in Alaska at the end of the 19th century (Wilen 1976). With stock of seals on the x axis and fleet capacity on the y axis, the diagram illustrates the expansion of the fleet and contraction of the stock under open access, an overshoot of the open access equilibrium, and some recovery of the stock as capacity began to shrink. 3.2 Optimal management
While the theory of open access traces its roots to Gordon’s 1954 paper in the JPE, the bioeconomic theory of optimal management begins with Anthony Scott’s paper in the JPE just one year later (Scott, 1955). Scott observed that harvest in the current period will affect the stock in the future, and a sole owner of the resource would have the proper incentive to take this dynamic externality into consideration. The idea that a sole owner would internalize the dynamic externality subsequently motivated the policy prescription of using individually transferable quotas (ITQs) to manage fisheries. ITQs were first proposed by Christy (1973) and share some theoretical properties with tradable pollution permits in a cap and trade system. ITQs have been applied to many fisheries throughout
18
the world and sometimes appear with other names in policy contexts (e.g. Limited Access Privileges, Catch Shares). The intuition for why an ITQ solves the commons problem is simple. By allocating a secure access right to an individual, the non-excludability feature of the commons evaporates, and fish resources in the ocean become de facto private goods. Tradability of the individual quotas creates incentives for the most efficient vessels to catch the fish and to eliminate excess fishing capital that would be more productive in other sectors of the economy.14 A complete theory of optimal management did not emerge until the 1970s, most notably in Clark and Munro (1975) and Clark (1990). Clark and Munro used optimal control theory to derive the full dynamically optimal path of fishery exploitation, and they developed what is known as the Fundamental Equation of Renewable Resource Economics (FERRE) to characterize the optimized steady-state.15 In general, the set of possible steady states of a fishery is the loci of points in which harvest (Y) balances net biological growth (F(X)), i.e. surplus production:
(1) ( )Y F X= .
The standard objective of most fisheries management before economists weighed in on the issue was to maximize sustainable yield. That is, differentiate equation (1), set the result equal to zero, and solve for the corresponding stock (the MSY). In Figure 3.1, this implies harvesting the surplus production at the peak of the net growth curve (i.e. when the marginal net growth is zero). The FERRE demonstrates that maximizing sustainable yield is a very special case and in general is not optimal. The FERRE is:
(2) ( )' XF X
Y
π
δπ
∂
∂= +∂
∂
,
and the solution to this implicit function combined with equation (1) is called the
Maximum Economic Yield (MEY). The MEY balances the discount rate (δ) with
marginal net growth of fish ( ( )'F X ) and the stock effectX Y
π π∂ ∂
∂ ∂ . To understand the
FERRE, it is useful as a first step to assume that the stock effect is zero, and thus the solution is defined by equating the discount rate to marginal net growth. This equality captures the basic capital-theoretic driver of natural resource economics: growth of capital in a financial investment versus growth of natural capital in the sea. If the discount rate is higher than the marginal net growth rate of the stock, the sole owner would make more money by reducing the stock and putting more money in the bank. This has the effect of raising the marginal net growth rate (as shown in Figure 3.1a, where all possible solutions are to the left of the peak if we assume a positive discount rate). Conversely, if the discount rate is lower, it pays to invest more in the stock of fish. Increasing the stock
14 See Grafton (1996) for a detailed discussion of ITQs. 15 For an intermediate textbook discussion, see Conrad (1999).
19
of fish lowers the marginal net growth rate in this case (Figure 3.1a). Naturally, the equilibrium occurs where the two are balanced. The stock effect, which is the ratio of marginal profit from an additional unit of the stock to marginal profit from an additional unit of harvest, captures the possibility that the fishery might be more profitable if the fish stock is maintained at a higher level. The reason is simple; finding fish is easier and thus less costly when the stock is larger. This feature is then balanced against the capital-theoretic aspect of the problem (growth of value in the bank versus growth of value in the sea). The larger the stock effect, the larger the MEY stock level will be. With a sizable stock effect (or a small stock effect combined with a high biological growth rate), the MEY will be to the right of the MSY, i.e. MEY stock will be bigger than MSY stock. By inspection of (2), we see that the MSY solution would occur for a zero discount rate with no stock effect. The intuition here is simple. With no discounting, the optimal economic strategy would be to maximize the perpetuity. Without a stock effect, the highest perpetuity value occurs where harvest is highest. MSY and MEY could also coincide for any combination in which the discount rate exactly equals the stock effect. In spite of the well-established bioeconomic theory of optimal management, the MSY objective still persists in most countries that regulate fisheries today. For example, in the U.S. the Magnuson-Stevens Fishery Conservation and Management Reauthorization Act of 2006 (the primary federal fisheries legislation in the U.S.), overfishing is still benchmarked to the MSY stock. That is, stocks that are below the MSY level are considered overfished and in need of rebuilding. The “optimum” in the act “(A) will provide the greatest overall benefit to the Nation, particularly with respect to food production and recreational opportunities, and taking into account the protection of marine ecosystems; (B) is prescribed as such on the basis of maximum sustainable yield from the fishery, as reduced by any relevant economic, social, or ecological factor; and (C) in the case of an overfished fishery, provides for rebuilding to a level consistent with producing the maximum sustainable yield in such fishery.” (16 U.S.C. 1802 MSA § 3 104-297-33). The act goes on to state “the terms ‘overfishing’ and ‘overfished’ mean a rate or level of fishing mortality that jeopardizes the capacity of a fishery to produce the maximum sustainable yield on a continuing basis.” (16 U.S.C. 1802 MSA § 3 104-297-34) Because the MEY can be to the right or to the left of MSY, the backward-bending supply curve can emerge even in an optimized fishery. A change in price will affect the denominator of the stock effect, whereas a change in cost will affect the numerator and/or the denominator, depending on whether the change is in the cost of effort itself (e.g. the price of fishing gear or labor) or affects the dependence of cost on the stock of fish (e.g. an advance in fish finding technology). The conventional wisdom in fisheries economics is that most species would be managed optimally with stocks higher than MSY, and small
20
changes in price or cost would affect optimal harvest as in a traditional industry.16 Nevertheless, it is possible for an optimally managed typical fishery to enter the backward-bending portion of the supply curve if costs decrease dramatically due to a technological innovation (e.g. fish finding equipment) or a large jump in price (e.g. due to scarcity of substitute fish products potentially due to poor management in other countries). Thus, changes in international trade policy that affect price or cost can, in principle, have the opposite effect on fish supply than in the case of a traditional industry. 3.3 Capacity utilization in fisheries
A large portion of the empirical work in fisheries economics in the 1980s, 1990s and even into this decade measures capacity and capacity utilization. To a large extent, this work is motivated by the Gordon model’s prediction of excess fishing effort in the absence of property rights (Asche 2007). Capacity utilization provides a measure of the extent of economic waste from failure to address the open access problem in fisheries (or at least failure to address the problem in a way that treats the underlying cause, namely lack of secure access to the resource). The flip side of this argument is that capacity utilization provides an indication of the potential efficiency gains from fishery rationalization. Examples of empirical studies that have found substantial excess capacity include: Homans and Wilen (1997) for the north Pacific halibut fishery, Squires et al. (1994) for Pacific sablefish, Weninger (1998) for U.S. Atlantic surfclam and ocean quahog, Weninger and Waters (2003) for Gulf of Mexico reef fish, Kirkley et al. (2002) for Atlantic sea scallops, and Asche, Bjørndal and Gordon (2009) for Norwegian cod.17 Kirkley et al. (2002) reviews the main methods used in the fisheries capacity literature, namely data envelope analysis (DEA) and stochastic production frontier modeling (SPF). They illustrate the methods with an application to the U.S. North Atlantic sea scallop fishery and find some significant discrepancies in overcapacity measures depending on the technique employed (20-60%). Some economists are critical of the capacity literature in part because it has taken on a life of its own. Overcapacity is a symptom of management failure, not a cause (Wilen 2006). While there is still debate, Wilen (2007) argues that attempts to manage fleet capacity through buybacks and command and control measures have been failures because they fail to address the root cause of fisheries problems, namely lack of secure access rights. Cox (2007) argues that the explosion of interest in capacity utilization in fisheries may have led to a misperception in policy circles that overcapacity causes fishery declines and is not just a symptom. And Anderson (2007) laments the invocation of the overly simplistic notion of ‘too many fishermen chasing too few fish.’ Nevertheless, Kirkley et al. (2002), while acknowledging that overcapacity is not a first cause of fisheries problems, argue that it generates a ratchet effect. Overcapacity begets
16 Exceptions would be extremely slow-growing species (e.g. some rockfish species) and extreme schooling species for which stock effects are expected to be minimal (e.g. Atlantic menhaden). Both of these effects tend to push MEY to the left of MSY and into the region of backward-bending supply. 17 See also Vestergaard (2004) and Asche et al (2008) for reviews of some recent work on fishing capacity in European fleets.
21
political-economy problems that make it difficult to regulate fisheries successfully and ultimately to reduce capacity. While it is important to draw a sharp theoretical distinction between symptoms and causes of fisheries management problems, for our purposes in this paper what is of greater significance is that there is a lot of excess capacity in fisheries around the world, and many countries are taking steps to reduce that capacity directly or indirectly by rationalizing fisheries. For example, there is now a UNFAO International Plan of Action on managing fleet capacity (Roheim 2007). As countries reduce capacity, the supply of scrapped fishing capital available on the international market will shift outward. Remaining open access fisheries may see additional fishing pressure. This effect could have significant consequences, as some researchers have argued that globalization has increased the speed with which fleets can exploit remaining open access resources before management institutions can respond (Berkes et al. 2006). The implications for supply of fish from countries that are reducing capacity will depend on other regulatory measures as we will see in the next section. 3.4 Regulated open access and empirical bioeconomics of regulated fisheries
Arguably, the most important fisheries economics paper in the last two decades is Homans and Wilen (1997), which claims that the most literature on fisheries economics fails to characterize modern fisheries accurately. Homans and Wilen (HW) observed that virtually all conceptual literature depicts fisheries as falling into one of two categories: pure open access or an optimized first best. However, there were few pure open access fisheries remaining by the 1990s, and there were fewer still that could be characterized as optimized. Instead, HW observed that most fisheries are ‘regulated open access,’ which they defined as one in which access was open, but in which participants were nevertheless regulated. They argued that economists failed to appreciate the importance of the extension of the Exclusive Economic Zone jurisdiction in 1978, by which the vast majority of the world’s important fisheries were brought under the mandate and control of coastal countries’ governments. The implication of this observation is that the task of predicting how modern fisheries are operating and evolving requires some explicit understanding and modeling of the role of the regulatory sector. Moreover, regulations cannot be viewed as simple production constraints; instead they emerge out of purposeful institutional behavior. HW argue that the regulatory sector in most fisheries employs a two-stage process. First, targeted harvests are determined as an outcome of a political economy process that reflects the concept of “safe” or sustainable biomass levels.18 Second, policy instruments are prescribed to meet the target. An application to the Alaskan Pacific halibut fishery regulated with season length illustrates the model, but any regulation that controls
18 In the U.S. context, this safe level until recently could be thought of as the MSY level. The most recent reauthorization of the Magnusson-Stevens Act, however, includes additional language on incorporating scientific uncertainty, suggesting that the MSY stock level will serve as a lower bound for the safe stock level.
22
effective effort and harvest such as gear restrictions, area closures, and other similar commonly used measures are valid considerations. The predictive consequences of the HW model are substantively different than what would come out of applying either the open access or first best optimal models. In particular, the widely accepted bioeconomic open access equilibrium predictions of the Gordon (1954) model—predictions popularized by Garrrett Hardin’s 1968 Science paper “Tragedy of the Commons”—require a second look. With an effective regulatory sector, biomass will be maintained at higher levels than Gordon/Hardin would predict. However, under regulated open access, the level of rent dissipation and economic waste will be even higher than suggested by Gordon’s analysis. The reason is that under regulated open access the potential rents will be higher and hence will induce even more entry of effort before rents are dissipated and effort is choked off. This new view turns current discussion of fisheries policy on its head, directing attention away from biology and toward the main driver of the status of fisheries, namely economic incentives operating within a regulatory setting. The HW framework, as such, is not in between pure open access and an optimized fisheries; it is qualitatively different.19 In their application to Pacific halibut, HW find strong empirical support for their framework. Valderama and Anderson (2009) extend the HW framework to account for limited entry. Under limited entry, regulators still target a healthy stock level but cap the number of vessels (or participants). These vessels do not necessarily dissipate away all rents as in HW or the pure open access cases. However, if price decreases sufficiently, the limited entry fishery will reduce to a regulated open access one with full dissipation of rents but with less than 100% participation of license holders. Valdereamma and Anderson apply their model to Alaska’s Bristol Bay salmon fishery, which has seen substantial declines in ex vessel prices20 due to competition from salmon aquaculture. Empirical results suggest that price decreases eroded rents to a point where the limited entry equilibrium switched to a regulated open access equilibrium. In essence, the limited entry regulation became irrelevant under competition from salmon aquaculture. Trade policy in this context is important in that it exposes the domestic industry to (or protects it from) competition from imports and thus can drive whether the regulated fishery is able to generate rents. A related strand of literature empirically analyzes the bioeconomic implications of fishing vessel microbehavior in a regulated environment. A key motivation of this work is to provide fishery managers with a means to avoid surprises (in terms of both economic and biological outcomes) in the face of newly planned input controls, many of which are spatial management measures like marine reserves (Wilen et al. 2002). Smith and Wilen (2003) demonstrate that marine reserves in the California sea urchin fishery lead to long-run economic costs if empirical spatial behavior of the harvest sector is
19 A large literature explores conditions under which groups can manage the commons for the collective good successfully without privatization in the form of individual property rights. These systems of common property resource management can be in between or close to optimal management. See Ostrom (1990). Most of the examples of successful common property management come from developing countries where regulatory infrastructure is otherwise lacking. An important question that faced by marine conservationists is the extent to which globalization will undermine successful common property management. 20 Ex vessel prices are the prices paid to fishermen for fish or shellfish at the dock.
23
considered, but management models that ignore this behavior reach the opposite conclusion. Smith et al. (2006) showed that marine reserves in the Gulf of Mexico not only reduced the stock of reef fish available for harvest instantaneously, but also continued to reduce stocks over the next 4.5 years. More poignantly, Smith et al. (2008) show empirically that a season closure intended to protect spawning biomass of Gulf of Mexico gag (a species of grouper) actually decreases the stock due to effort substitution of the fleet, while a model that ignores harvester behavior predicts that the policy has its intended consequences. Command and control regulations like closed areas and season closures can present merely an illusion of control, as fishermen substitute around these regulations in ways that simple theoretical models fail to predict. Returning to the backward-bending supply curve of Figure 3.2, we can summarize the implications of open access, optimized fisheries, and non-optimized regulated fisheries (fisheries characterized by regulated open access, restricted access, or otherwise some attempt to control exploitation). Many high seas fisheries outside Exclusive Economic Zones (EEZs) remain open access, and some fisheries within EEZs remain unregulated and are thus de facto open access. Backward-bending supply is likely to be an issue for these fisheries. A number of fisheries around the world have adopted rights-based measures like ITQs, most notably in New Zealand, Iceland, and increasingly in the U.S., while many other fisheries around the world are managed with fishing cooperatives or common-property institutions that are able to exclude access successfully. Such fisheries may be reasonably close to being first best optimized with the caveat that there may be statutory restrictions on operating at an MEY stock below the MSY stock level. They are thus less likely than open access ones to operate in the backward-bending portion of supply, but it is still possible. The vast majority of industrial fisheries fall into a third category that has many subcategories; these fisheries are regulated but not in a way that produces a first best optimum. The regulated open access framework suggests that biological management is effective in controlling the stock. Thus, there is no backward-bending supply issue; the supply of fish is determined by updating information on the biology. If prices fall low enough, effort decreases and output can fall, but both of these effects pertain to the conventional portion of the supply curve. In the Smith et al. (2008) framework, biological management is not necessarily effective, and thus backward-bending supply responses are possible in regulated fisheries. The reality is that both of these stories may be correct, and they may simply describe different fisheries. Debates about the effectiveness of different regulatory regimes in controlling stocks—and hence the likelihood for different regimes to generate a backward-bending fish supply curve—are echoed in a recent paper in Science (Costello et al. 2008) and some of the criticism of that paper. In a treatment effects model (using matching methods) of a global fisheries data set, Costello et al. find that fisheries regulated with an ITQ program (‘catch shares’ in their language) are less likely to collapse biologically. However, Bromley (2009) correctly points out that Costello et al. fail to control for the effect of a fishery having a restriction on the Total Allowable Catch (TAC). All ITQ fisheries have a TAC by construction, and thus the authors have confounded the treatment effect of an ITQ with the treatment effect of a TAC. The discrepancy between HW and Smith et al. (2008) suggests that the issue is not the presence of a TAC (both fisheries in their studies
24
have them) but whether it is set sufficiently low to be binding and negate the biological effects of other regulations. Taken together, all of this debate makes it difficult to conjecture about the overall likelihood of backward-bending supply effects in regulated fisheries. 3.5 Other sources of inefficiency in fisheries that may influence international trade
outcomes
While insecure property rights is the central cause of inefficiency in fisheries, a number of other issues contribute to inefficiency. The key issues that we consider are subsidies, buybacks, bycatch, ecosystem interactions, human health issues, and illegal, unreported, and unregulated (IUU) fishing. Subsidies to fisheries may be economically wasteful in and of themselves, but when applied to fisheries that are open access, they can exacerbate existing problems of biological overexploitation. Buybacks offer a means to reduce capacity but can be another source of subsidy and may not achieve the intended capacity reduction. Bycatch is the incidental catch of species that are not targeted by the fishing vessel, and much of this is thrown back but does not survive. Other important ecosystem interactions create inefficiencies through the diminution of public goods, including destruction of unique habitat or incidental takes of charismatic megafauna like whales, dolphins, and sea turtles. Lastly, IUU fishing works against management efforts that otherwise might successfully eliminate the commons problem. In this section, we briefly discuss subsidies, buybacks, and bycatch. We return to the issue of ecosystem interactions in section 5, and we address IUU fishing in section 4 after providing background on the institutional context of international fisheries. Many fisheries around the world receive sizable subsidies. Following a World Bank study (Milazzo, 1998) that estimated that fisheries subsidies made up 30-35% of total cost, there has been significant attention to this issue. Researchers have estimated the magnitude of subsidies for particular regions such as the North Atlantic (Munro and Sumaila 2002) and globally (Sumaila and Pauly 2006). Examples of fishery subsidies include boat construction, foregone government revenue on income taxes, and foregone government revenue on fuel taxes. The literature also discusses fisheries buybacks, port construction, and fisheries research as subsidies to fisheries. There seem to be two main arguments: 1) Subsidies reduce cost and thereby increase effort in a fishery. As most fisheries operate on the backward-bending part of the supply schedule, this leads to more overfishing than in an open access equilibrium. Hence, the subsidy is a problem because it reduces the fish stocks to lower levels than without the subsidy and possibly to lower levels than the open access equilibrium. 2) More in line with the standard WTO subsidy argument, it is also argued that subsidies give some fishermen an unfair competitive advantage and should therefore be abolished. For us, this argument seems somewhat irrelevant, because as long as most stocks are fully or overexploited, increased effort leads to lower landings in the long run and higher prices because of the backward bending supply schedule. Accordingly, the subsidy will in most cases actually improve the position of competitors.
25
There is also discussion of whether there is a distinction between good and bad subsidies, where good subsidies are used to reduce fishing effort (Hatcher and Robinson, 1999; FAO, 2003). An example of a potentially good subsidy is a buyback program where fishermen are compensated to remove their vessel from a fishery and thereby, presumably reduce fishing effort. However, opponents of the notion that there are good subsidies claim that all transfers will eventually be transformed into effort as the fishermen do everything they can to disseminate the resource rent. Hence, entry to the fishery or increased capacity in the remaining fleet will make up for the reduction in effort implied by the removal of one vessel. We return to the subsidy issue in section 6 with more explicit consideration of WTO rules. Buyback programs are a common tool to reduce capacity in fisheries, particularly in developed countries. As discussed above, overcapacity is often regarded as a main problem threatening the fishermen’s livelihoods as well as the fish stocks. Moreover, in many cases, the vessels have little alternative value and it is therefore difficult for the fishers to withdraw from the fishery. Buyback programs can then provide the means to change the dynamics in the fishery. Groves and Squires (2007) give eight categories of reasons why fishery buybacks are used as a management tool: (1) increasing economic efficiency, (2) modernizing fleets and adjusting fleet structure, (3) facilitating transition between management regimes, (4) providing alternatives when rights based management forms are not an alternative, (5) providing disaster or crises relief, (6) addressing compensation and distribution issues, (7) helping conserve or rebuild overexploited stocks, and (8) protecting ecological public goods and biodiversity. They recognize that a buyback program often targets several different and even conflicting objectives and that the program is the outcome of a policy process that in most cases will target improved, not optimal, management as the objective. How well a buyback program works does to a large extent depend on objectives, circumstances, design, and implementation. Groves and Squires (2007) and Hannesson (2007) show that buyback programs in fisheries without access restrictions cannot achieve any objective (with the possible exception of transferring revenue to a group of fishermen). In fact, if the program is poorly designed and restriction on access or capacity expansion for the vessels remaining in the fishery, a buyback program can reduce both stock size and fisherman profitability. Some argue that vessel buybacks as a means to reduce capacity can be a form of a subsidy as well (Clark et al. 2003). Curtis and Squires (2007) provide a set of case studies that give a broad picture of how fisheries buybacks have been implemented and provide a number of important lessons. The cases seem to indicate that fisheries buybacks are a luxury affordable primarily by developed countries, although examples are also provided for wealthier developing countries including Malaysia and Taiwan. The cases cover a number of countries in Australia, Asia, Europe, and North America, and a number of different experiences. Bycatch is an important domestic efficiency issue that can transcend national boundaries. To the extent that non-targeted species are economically valuable, bycatch is economically wasteful. Bycatch can also be a form of an ecosystem interaction. Even if
26
bycatch species themselves are not economically valuable, they may be ecologically valuable in sustaining marine food webs, and thus catching them constitutes an important opportunity cost. Whether or not the non-targeted species has direct harvest value, international conflicts can emerge. In both cases one country’s inability to control bycatch can influence another country’s fish stocks. Another important issue that will undoubtedly influence the global seafood trade is global climate change. With a changing climate, the ranges of some fish stocks may shift, expand, or contract. The productivity of the oceans overall could decrease or increase, but the effects are likely to be heterogeneous. Moreover, as fish stocks move, existing international agreements to manage these stocks may be destabilized (Hannesson et al. 2007). All of these impacts have the potential to affect trade, but the magnitudes and spatial distribution of impacts are sufficiently uncertain to make it difficult to speculate on just how they will affect trade. Climate mitigation policy could also affect fisheries. A cap and trade policy for carbon could increase the cost of fishing for some species (relative to other ways of producing protein) and could increase the cost of transport. The impacts on the flow of fish products will depend on whether the relevant fisheries are operating on the backward-bending portion of supply.
4. Trade theory and renewable resource economics
The theoretical literature on trade and natural resources consistently finds that the benefits of free trade can be undermined when domestic natural resource management institutions are inadequate, a scenario that describes many of the world’s fisheries. Chichilinsky (1994) analyzes the implications of trade in a natural resource for which one country has incomplete property rights. She finds that with trade, wealthy importing countries will tend to over-consume inexpensive resource-intensive products from exporters with poorly defined property rights such that the equilibrium is not Pareto efficient. In a series of papers, Brander and Taylor (1997a, 1997b, 1998a, 1998b)21 develop this theme more explicitly for renewable resources with general equilibrium modeling, and they explore long-run implications of open access to the resource under trade liberalization. Using logistic growth to characterize the resource, their model explicitly incorporates the backward-bending fish supply curve, and indeed many of their seemingly counterintuitive results are a direct consequence of this unique feature of fisheries. Brander and Taylor (1997a) find that trade may actually reduce welfare for a small open economy (trading at fixed world prices) that has open access to the resource. Whether trade is welfare-reducing or -enhancing hinges critically on whether the world price is above or below the autarky price, which in turn depends on the ratio of the growth rate of the resource to the economy’s endowment of labor. Intuitively, the possibility for a welfare-increasing or welfare-reducing effect stems from two countervailing forces: the long-run effect of trade on production possibilities and the terms of trade effect. An open
21 Brander and Taylor (1998b) is not about trade per se but demonstrates in a general equilibrium context the insidious consequences of open access.
27
access resource exporter will have lower production possibilities in the long run under trade because the resource productivity is lower with higher exploitation, but the trade itself in the short run raises consumption possibilities. Brander and Taylor (1998a) analyze trade between two countries and allow world prices to be endogenous. With trade liberalization, the resource-abundant country exports the resource, while the labor-abundant country exports manufactured goods. The result is that the resource importer gains from trade and the resource exporter loses from trade in the steady state. Whether the resource exporter has a present value net welfare loss from trade depends on how parameters affect the dynamic path. Moreover, when an importer imposes tariffs, the resource exporter benefits. Brander and Taylor (1997b) consider trade between two countries with equal endowments but that differ based on their resource management institutions: an open access country and a conservationist country that maximizes present value utility. By allowing for excess exploitation, open access can be a source of comparative advantage and lead to exporting the resource to the conservationist country. Welfare increases for the conservationist country but declines for the open access country in the long run. However, it is also possible that the well-managed resource in the conservationist country can lead to this country having a lower price. The result is that the conservationist country exports the resource, and both countries gain from trade. Brander and Taylor (1997a) aptly summarize, “when a renewable resource is subject to open access, or something approaching it, then free trade may not be the tide that raises all boats. Improved management of renewable resources may be a necessary precondition for gains from trade.” Anderson (2003 – chapter 5) illustrates many of the counterintuitive results of the Brander and Taylor papers in a simple two-country partial equilibrium framework. Again, the driving force for the non-conventional outcome is the backward-bending supply of fish. Anderson (2003) also discusses stock enhancement programs such as the use of salmon hatcheries to augment wild salmon runs. If wild stocks and hatchery stocks intermix in the exporting country, which is considered likely, enhancement can decrease wild stocks in this country and increase wild stocks in the importing country. In his conclusion, Anderson (2003) argues that trade in farmed fish is more likely to be characterized by the conventional analysis of international trade, as property rights in aquaculture operations are similar to those in agriculture. Roheim (2004) summarizes issues in aquaculture and fisheries trade when the two markets are connected through markets for fish meal (see Table 15 in Roheim 2004, which is based on a 2003 OECD report Liberalising Trade in Fisheries Markets: Scope and Effects). A recent related paper by Copeland and Taylor (2009) takes the analysis one step further by posing the question of why different countries have different levels of success in managing resources, essentially endogenizing the property rights regime. They show that management success hinges on the enforcement power of the regulator, harvesting capacity, and the resource’s regenerative capacity. These features lead to a continuum of enforcement with pure open access rent dissipation and an optimized first best as the

28
limiting cases. In between the extremes, management is limited, some rents are generated, but rents fall short of the optimum.22 An interesting feature of the Copeland and Taylor model is that improvements in fish harvesting technology can threaten stocks but can also provide an incentive for effective management. Also of note is that trade liberalization for exporting countries in this framework is less likely to lead to welfare losses than in the earlier work of Brander and Taylor. Lastly, the authors find that the arrival of new technologies through market integration can destabilize management systems. Although there have been many extensions to the Brander and Taylor theoretical framework—some reinforcing the basic insights in other settings and others challenging the generality of welfare losses from trade in renewable resources—empirical testing has been elusive.23 Lack of empirical work most likely reflects a combination of data problems and the complexity of bioeconomic systems. Testing the Brander-Taylor framework would require observing fisheries in some countries before and after trade liberalization and being able to compare these fisheries to ones in other countries over the same time horizon that did not have the same changes in trade policy. Because the sharpest predictions are about steady states, one would need some years after the policy change, possibly many years depending on biological and economic speeds of adjustment. Adding further to the data challenge, countries that collect extensive biological data for measuring exploitation rates and stock status are not likely to have pure open access regimes. By making some strong structural assumptions, Liese et al. (2007) provide indirect empirical evidence of the Brander-Taylor framework by exploiting within-country variation. Different fishing villages exploit spatially delineated fisheries under open access, and the intensity of exploitation is a function of market integration. Villages that have road connections and lower travel distances to fish markets have greater levels of exploitation. Though the link to Brander-Taylor is somewhat tenuous, the intuition is that physical barriers to market integration (lack of roads and long travel distances) afford some protection to open access fish stocks in the way that trade barriers might. In contrast, Roheim (2004) cites anecdotal evidence that when trade liberalization lowers price in the importing country, fishing effort increases to earn the same level of revenue. The empirical importance of the Brander-Taylor framework is still very much an open question.
22 Though a continuum of management outcomes like Copeland and Taylor’s has an intuitive appeal, it fails to capture the qualitatively different case of regulated open access as in Homans and Wilen (1997). Further research will be needed to explain the emergence of institutions that may successfully manage biological stocks but nonetheless generate economic waste comparable to or even greater than under open access. We believe that this is a fruitful and important area for both theoretical and empirical research. 23 In a theoretical extension, Nielsen (2009) finds that trade liberalization can improve welfare for a regulated restricted access country, a case not considered by Brander and Taylor. Hannesson (2000) finds that even under open access, trade will improve welfare of the resource exporter if there are diminishing returns to the manufactured goods sector. However, there can be welfare losses under trade in a transition to optimal management.
29
5. International institutions and the global commons
A natural starting place for understanding international institutions and fisheries management is the Exclusive Economic Zone. Most fisheries are conducted on continental shelves or the upwellings along the edge of the continental shelf because these areas contain the highest natural productivity. When the Exclusive Economic Zone (EEZ) was extended to 200 miles in 1977, most fisheries fell within the jurisdiction of individual nations. Nations gained the legal authority to bring an end to open access by excluding fishing vessels and managing their fishery resources for their own economic benefit. This policy change also had the effect of closing down most distant water fisheries. In spite of the legal authority, many fisheries that lie within EEZs are still poorly managed. How successful or unsuccessful management has been overall is a matter of some debate (Worm et al. 2009). Thus, issues of open access and international trade are still salient for fisheries within EEZs. But another set of issues emerges for fisheries that are not contained within a single EEZ. 5.1 Fisheries not contained within one EEZ and RFMOs
There are three types of fisheries that are not contained within a single EEZ. Shared stocks are fisheries in which the fish stock can be fished within the jurisdiction of two or more countries. Straddling stocks are fisheries in which the stock also moves into international waters. Highly-migratory species are fisheries in which the stock is primarily in international waters. For shared stocks, the countries involved in most cases agree on a common management plan and share the quota. Then typically the individual countries have the responsibility to enforce their shares of the overall quota and carry out management. However, for straddling and highly migratory stocks, agreement is much more difficult. Straddling stocks have similar growth functions to other stocks and are therefore subject to the same common-pool overfishing problems. However, as they move into international waters, there is no single country that can prevent overfishing and enforce a management plan. To try to overcome this problem, the United Nations Fish Stocks Agreement (1995) allows the creation of Regional Fisheries Management Organisations (RFMO).24 These bodies are to consist of coastal states and relevant distant water fishing nations. There are enough signatories that the treaty is international law, but it is so far binding only for the signatories. RFMOs can also manage fish stocks in international waters. However, they are to be open for any party that shows a real interest in the fishery, and they have little or no means available to enforce their management regime (Bjørndal, 2009). Hence, their effectiveness can be questioned.
24 The nine existing RFMOs include Commission for the Conservation of Antarctic Marine Living Resources, Commission for the Conservation of Southern Bluefin Tuna, General Fisheries Commission for the Mediterranean, Inter-American Tropical Tuna Commission, International Commission for the Conservation of Atlantic Tunas, Northwest Atlantic Fisheries Organization, North East Atlantic Fisheries Commission, South East Atlantic Fisheries Organization, and Western and Central Pacific Fisheries Commission (Tarasofsky 2007).
30
RFMOs also play an important role in the conservation of marine biodiversity. Whereas the benefits of successful RFMO management of the commons accrue to member states (and unfortunately to IUU fishing vessels that get away with their activities), the benefits of protecting biodiversity accrue to all nations. We believe that this distinction is an important one for thinking about economic efficiency of international agreements to manage marine resources. Marine biodiversity is a global public good, and the total value of the marine environment is the value of these goods combined with the value of common-pool extracted goods. Controversies about conserving marine biodiversity may confound efficiency and equity issues, where wealthier nations may attach higher values to these public goods than poorer nations and thus be more willing to forego extractive use or pay a higher price for the product. In the next two sections, we discuss two key challenges for RFMOs: IUU fishing and the game-theoretic dimensions of reaching agreements on shared fish stocks. 5.2 Illegal, unregulated and unreported (IUU) fishing
IUU fishing has become a major concern during recent decades as researchers have discovered that significant quantities of fish come from IUU fisheries. This discovery has resulted in the creation of international bodies such as the High Seas Task Force, which was created at an OECD round table in 2003 with ministers from the UK, Australia, New Zealand, Namibia, Canada and Chile. Metuzals et al. (2009) reviews a number of studies reporting that actual landings can be 10 to 60% higher than reported landings. The spectrum of IUU fishing spans illegally harvested fish from regulated fisheries, unreported or misreported fishing activities, and unregulated fishing by vessels with no flag or a flag of convenience. The literature discusses whether fishing must be illegal, unreported, and unregulated to constitute a problem, or whether it is sufficient that fishing meets one of these criteria. In any case, the fisheries that are perceived to be the main problem have all three characteristics. Fisheries in developing countries without infrastructure to report catch are in general not perceived as IUU, and the same is true for bycatch. As it is difficult to directly stop IUU fishing, different initiatives to restrict market access for the fish have been advocated (Roheim, 2004). These include ecolabels, traceability and other measures that disclose information about how the fish has been harvested. This is an area where trade disputes are likely, as several of these measures will also limit market access for other fish, for instance from developing countries with poor reporting infrastructure.
5.3 Game theory and international agreements
As shown in our review of the theory, there are potentially very large differences in harvest and stock size between a well managed fishery and an unregulated fishery. As a consequence, there is a substantial literature that describes under which conditions one can expect different parties to reach an agreement. The theoretical basis for this literature is game theory, which is a tool that allows the different actions of each of the countries
31
(players) to be analyzed.25 For shared stocks, the games are cooperative, and usually one can find a solution, although often one has to make side payments in the forms of higher quotas to some parties. For straddling and highly migratory stocks, the fact that it is virtually impossible to limit entry to the fishery from new countries, including countries that fly a flag of convenience, makes the game uncooperative, and the equilibrium is virtually always open access. The only solution then seems to be an enabling of a cooperative game, which is what can be achieved with a RFMO. However, as long as parties that are not parties to RMFO can enter freely and there are no mechanisms to enforce agreements even among its members, this has so far not provided a good solution. One response to this issue and to IUU fishing has been to make it more difficult and costly to handle the fish. For instance, some coast states prohibits landings of fish if one cannot document that it has been legally caught, and some vessels are also blacklisted and refused services in port. In addition, traceability is becoming an important requirement in markets where this issue is perceived as serious. In the next two sections, we discuss examples of RFMOs, including ones that manage different species of tuna and the North East Atlantic Fisheries Comission (NEAFC). 5.4 The Inter-American Tropical Tuna Commission (IATTC) and the International
Commission for the Conservation of Atlantic Tunas (ICCAT)26
Tuna are highly-migratory animals. Tuna populations generally do not remain within any one EEZ, and tuna spend much of their lives in international waters. Tuna are also valuable in international markets and costs of harvesting them in international waters are not prohibitively high. Because of these features, RFMOs are necessary to prevent overexploitation from open access. The main charge of tuna RFMOs is to manage the common-pool resources including different stocks of tuna and tuna-like species. IATTC manages tuna stocks in the eastern Pacific Ocean, while ICCAT manages tuna stocks in the Atlantic and adjacent seas. Both organizations coordinate scientific research to assess stocks and set total allowable catches. Both have elaborate catch documentation schemes and maintain vessel databases with the purpose of excluding access. Both specifically list IUU vessels and prohibit landings and transshipments from these vessels in member countries. Vessel monitoring and product tracking require substantial infrastructure that some argue presents a technical barrier to trade. However, it is unclear what a viable alternative enforcement strategy would be that still has the potential to restrict access to the international commons.
25 Examples of the game theoretic literature applied to fishing include Levhari and Mirman (1980), Hannesson (1997), and Sumaila (1997). 26 This section draws on Roheim (2004), Roheim and Sutinen (2006), and Tarasofsky (2007) as well as websites: http://www.iattc.org/ , http://www.iccat.int/en/ , http://www.ers.usda.gov/publications/aer793/aer793f.pdf , and http://www.nmfs.noaa.gov/ia/intlagree/aidcp.htm .

32
Tuna RFMOs are also involved in conserving marine biodiversity (i.e. promoting global public goods) because harvesting tuna can lead to incidental mortality of marine megafauna such as dolphins, sea turtles, and sharks as well as seabirds. IATTC, for example, has separate provisions for the protection of sea turtles, sharks, and seabirds. But the most well-known issue involving tuna and biodiversity is dolphin-safe tuna from the Eastern Tropical Pacific (ETP). Until 1992, IATTC addressed dolphin mortality with voluntary measures. However, U.S. vessels were governed by the Marine Mammal Protection Act of 1972, and most U.S. vessels exited the ETP fishery by the end of the 1980s. U.S. tuna canners began labeling tuna as dolphin-safe, and eventually the major tuna canners pledged to sell only dolphin-safe tuna. The U.S. also imposed an import ban on tuna that had been caught by vessels from countries with higher dolphin mortality rates in their tuna fisheries. In 1992, IATTC members agreed to voluntary quotas on dolphin takes, and a binding international agreement was signed in 1998, the Agreement on the International Dolphin Conservation Program (AIDCP). The AIDCP is widely considered a success story in dramatically reducing dolphin mortality. A current issue that combines the role of RFMOs to address common-pool resources and to address global public goods is the potential listing of Atlantic Bluefin tuna as an endangered species under the Convention on International Trade in Endangered Species of Wild Fauna and Flora (CITES). Bluefin is a high-value product, and ICCAT members naturally have an incentive to manage the fishery sustainably. However, stocks are degraded to a point where some are concerned about the future survival of the species in the wild. Some NGOs are calling for listing under CITES, which could prohibit international trade in Atlantic Bluefin. While many RFMO conservation efforts appear consistent with WTO rules, a CITES listing would appear to have even greater immunity to a WTO challenge. 5.5 North East Atlantic Fisheries Comission (NEAFC)
27
The NAFC is the RMFO for the north Atlantic. Its contracting parties are the coastal nations Denmark (on behalf of the Faroe Islands and Greenland), the EU, Iceland, Norway, and Russia, as well as the distant water fishing nations. The NEAFC manages several fish stocks such as redfish, spring spawning herring, blue whiting and mackerel. While the member parties in general seem to agree on technical fishing measures and the TAC, how the TAC is shared is often a source of conflict. A main reason is that the pattern of movements for the stocks changes over time. Countries that hold a larger portion of the stock for a longer time tend to want to increase their share of the quota, while the remaining countries tend to be reluctant to reduce their landings. As a result, the sum of the national quotas for several of the species has been significantly higher than the TAC in a number of years. The blue whiting stocks were significantly fished down before a common agreement could be reached in 2005. Moreover, the agreement for spring spawning herring was suspended for the years 2003-2006. The latest conflict is the mackerel quota. Traditionally, Iceland has not caught much mackerel as the species has not moved into or close to Icelandic waters in significant quantities. However, this situation changed in 2007, and Iceland is therefore demanding quota. The other countries
27 This section draws on Bjørndal (2009).
33
are reluctant to give quota to Iceland, and Iceland is therefore now “demonstrating” that they can catch significant quantities of mackerel, with landings exceeding 100,000 tonnes in 2008. The total TAC of the NEAFC is only 385,000 tonnes. If the pattern that has earlier been observed for spring spawning herring and blue whiting are to be followed, one would expect that Iceland will eventually be accommodated, but only after the fish stock has been overfished for some time.
6. Domestic trends toward ITQs and ecosystem-based management
In the United States and other industrialized countries, two dominant trends in fisheries management within EEZs have emerged over the past decade: a greater push to use rights-based management systems like ITQs and a greater emphasis on the broader ecosystem context of fisheries including more attention to spatial characteristics of marine systems. While these trends may not have direct trade implications, indirectly we expect them to influence the amount of fish products that are traded, the costs of fishing, the level of fishing capacity, and—perhaps most importantly—international norms with regards to environmental impacts of fishing. Iceland and New Zealand were the first two countries to adopt ITQ-based management on a broad scale, and their management systems are generally considered to be successful.28 Some fisheries in the U.S. began experimenting with ITQs in the 1990s, and the Alaskan halibut fishery that transitioned to ITQ management in 1995 is the most notable. The significance of the Alaskan halibut ITQ program stems from the extreme conditions that existed prior to ITQs with a season length averaging just two to three days each year from 1980-1994 resulting in a derby fishery. After ITQs, the season has lasted as long as nine months with a reduction in capacity, increases in ex vessel prices, and steady total catches (NRC 1999). As such, the Alaskan halibut program is seen as the poster child of how ITQs can end overcapitalization and the race to fish. Nevertheless, beginning in the late 1990s there was a moratorium on new ITQ programs in the U.S., which just ended a few years ago. The momentum has picked up again with explicit support for catch shares expressed by Jane Lubchenco, President Obama’s appointee as Under Secretary of Commerce and Administrator of the National Oceanic and Atmospheric Administration. The trend towards ITQs has at least four possible implications for trade. First, fisheries managed with ITQs are not likely to be on the backward-bending portion of supply curve and conventional theory of gains from trade should apply. Second, and related, is that ITQ fisheries may be less likely to collapse (Costello et al. 2008). ITQs might be able to increase or at least sustain the long-run supply of fish to the global fish trade. However, recall our caveat that TACs may be the causal factor and not rights-based management per se. Third, rationalization of some stocks could intensify overexploitation of stocks in other countries that are still operating under open access. Rationalization generally has led to capacity reductions, and this capacity is then available to fish elsewhere. In the Brander-Taylor framework, the cost of fishing in open access countries goes down,
28 See Newell et al. (2005) for empirical work on New Zealand’s quota markets.
34
adding pressure to already overexploited fish stocks. Gains from international trade in fishing vessels might be suspicious gains if vessels are flowing to countries with limited or no regulation of their fisheries. Shifting of redundant fishing capital to other fisheries could unfold domestically and contribute to overexploitation. An argument can be made that new fisheries that are not currently exploited will be developed with the low cost of fishing capital, but many marine ecologists and fisheries scientists believe that the oceans have been exploited close to or in excess of the maximum overall sustainable yield. Fourth, countries that aggressively rationalize their fisheries, or at least have binding total allowable catches, may see this step as an international social norm such that countries preserving open access are not playing by the rules and are degrading the environment. The feedback on an importing country’s environmental quality hinges on an ecological argument. Degradation of the exporter country’s stock reduces resilience of the ecosystem, and marine ecosystems are connected over space and transcend EEZ boundaries. The environmental impacts of one country’s open access regime spill over into another EEZ or into international waters. It is unclear whether a trend like this would lead countries with rationalized fisheries to impose import tariffs on those with open access or to ban imports from open access countries, but these outcomes are possible. It is harder to conjecture about the how the trend toward ecosystem-based management (EBM) will affect the seafood trade, but the international interest in EBM is significant enough for some discussion of the topic. Marine EBM is a shift away from single-species management with MSY toward considerations of humans within the ecosystem, multispecies (trophic) interactions, spatial features of fisheries, habitat impacts, and recognition of both extractive and non-extractive values of marine ecosystems (Pew, 2003; US Commission on Ocean Policy 2004).29 Much of the academic literature on EBM has focused on the spatial dimensions of management in which fish stocks are not considered single populations but rather metapopulations, i.e. collections of individual populations that are linked over space by larval dispersal and adult migration. In this spatial view, there are potential advantages to controlling fishing effort differentially over space, depending on physical and biological processes in the oceans. This emphasis has led to an enormous amount of support for the use of marine reserves—i.e. areas in which no fishing is allowed—to manage fisheries and conserve marine biodiversity. Some proposals call for as much as 30% of the oceans to be placed in no-take areas. A large economic literature has explored spatial fisheries topics (e.g. Holland and Brazee 1996, Hannesson 1998, Sanchirico and Wilen 1999, 2001, 2005, Smith and Wilen 2003, 2004, Costello and Polasky 2008, Smith et al. 2009). This literature has found that there are circumstances in which spatial management can improve upon traditional management and even circumstances in which having some no-take areas is optimal. On a practical level, spatial management that achieves win-win outcomes may require a heightened level of regulatory control. Even when the bio-physical system seems appropriate for spatial management, spatial measures can backfire because fishermen will substitute around them or the fundamental driver of overexploitation, namely open access, is left unregulated.
29 See Smith (2008) and Sanchirico et al. (2008) for discussions of the economic issues surrounding marine EBM.
35
In spite of these caveats about the difficulty of achieving desired spatial outcomes, the adoption of spatial management and EBM more broadly may become an international social norm. Countries that fail to consider the broader ecosystem impacts of their fisheries or that fail to acknowledge important spatial features of fisheries ecology in management may be perceived as not playing by the rules and degrading the global environment. As argued above, the ecosystem impacts within an exporter country’s EEZ spill over into other EEZs and into international waters. Do these ecosystem impacts provide a justification for an importer country to impose trade restrictions, and would these restrictions then be allowed under the WTO’s agreement on technical barriers to trade? Moreover, the push for spatial management will lead to efforts to form marine reserves in international waters as well. Policing these reserves from IUU fishing will reinforce the importance of vessel monitoring and registration that RFMOs currently engage in. How profoundly will marine EBM influence international standards, and to what extent will countries use trade measures to promote EBM internationally? These are open questions. We see that the two most important points to consider are: 1) there is enormous scientific momentum behind the move toward EBM, and 2) broad adoption of EBM could lead to a proliferation of environmental issues that may constitute technical barriers to trade.
7. Trade disputes, open access, ecosystem externalities, and WTO rules
Fish products are currently treated as industrial products under the WTO. Actions of individual countries or groups of countries have the potential to fall under the jurisdiction of, and possibly conflict with, a wide range of WTO rules. We discuss briefly sanitary and phytosanitary measures, anti-dumping, subsidies and countervailing measures, and technical barriers to trade and rules of origin. We then provide an overview of efforts from NGOs to promote marine conservation through private means, which could eventually involve governments and hence WTO rules. Given the unique characteristics of fisheries, there may be some benefit to having a set of WTO rules to govern the fisheries trade that is separate from both industrial products and agriculture. Whether the benefit is large enough to overcome the undoubtedly substantial cost of establishing separate rules is unclear. 7.1 Sanitary and Phytosanitary Measures
There are many food safety issues that emerge in the seafood trade. The health benefits and health risks associated with seafood consumption are well documented. On the benefit side, for instance, the American Heart Association recommends consuming fish (particularly fatty fish) at least twice each week because of its high levels of omega-3 fatty acid and relatively low levels of saturated fat (compared to other fatty sources of animal protein).30 Health risks from seafood consumption are varied and include the potential for a wide range of bacterial and parasititic illnesses, histamine poisoning, and
30 See http://www.americanheart.org/presenter.jhtml?identifier=4632 .
36
the consequences of consuming high levels of mercury and PCBs.31 Some health issues stem from local water quality problems where seafood is grown, particularly for shellfish whether wild caught or aquacultured. Though mercury contamination can be acute and local, many health concerns about mercury stem from regional or even global water quality. The reason is that mercury bioaccumulates such that higher trophic fish (ones higher on the food chain) tend to have higher concentrations of mercury in their flesh, ultimately transcending local boundaries. Many other seafood-borne illnesses result from processing, handling, inadequate refrigeration, and spoilage. In Europe, seafood safety is a part of a larger trend with respect to food safety, which became particularly acute after the BSC (bovine spongiform encephalopathy), or mad cow disease, outbreaks in the UK. Many retailers now prefer or require more stringent quality assurances and demand more information about how a product is produced and how it moves through the supply chain, which is often referred to as the traceability of a product. The retailers and consumers also want to be assured that the production processes meet specific requirements with respect to hygiene, animal welfare and related concerns. Exporters are therefore increasingly required to meet Hazard Analysis and Critical Control Point (HACCP) standards, provide different types of ISO certificates, or meet national standards in the importing countries. There are certainly cases where such measures seem to be justified. For example, some aquacultured fish from China were found to contain chemicals including malachite green that had been introduced in the feeding process. There are also a number of exporters who think these requirements are a new form of trade barriers. The experiences of Kenyan exporters of Nile perch and Bangladeshi shrimp exporters are examples. For some periods, imports to the EU were terminated by the EU due to food safety concerns. The EU Commission, of course, claims that import bans were entirely justified. Article 5 under the Agreement on Sanitary and Phytosanitary Measures states, “In the assessment of risks, Members shall take into account available scientific evidence; relevant processes and production methods; relevant inspection, sampling and testing methods; prevalence of specific diseases or pests; existence of pest- or disease-free areas; relevant ecological and environmental conditions; and quarantine or other treatment.” Because food safety issues and health risks associated with these issues are extremely well documented in the scientific literature, many trade measures will be allowed by WTO rules. Ensuring food safety requires traceability systems with substantial infrastructure, and developing countries are less likely to have such systems in place. As such, traceability requirements may limit trade flows from developing countries. A secondary outcome may be the concentration of seafood exports from developing countries in a small number of species or product categories. There may be gains from specialization in seafood products that will facilitate meeting sanitary and phytosanitary requirements of importing industrialized countries. The coincidence of high levels of mercury contamination and high tropic-level fish present an interesting possibility for an end around on WTO rules. High trophic-level fish like tunas and swordfish have some of the highest mercury concentrations of fish that are
31 See Cato (1998) for an overview of the economic issues related to seafood safety.
37
regularly traded internationally, but they also pose some of the most significant international conservation challenges, including conservation of the stocks themselves (e.g. Atlantic bluefin tuna) and interactions with seabirds and marine megafauna. Though unlikely, it may be possible that some countries will use sanitary and phytosanitary regulations to limit imports of fish with a high mercury content with the actual objective being international marine conservation.
7.2 Anti-dumping measures
If the basis for an anti-dumping case or other trade dispute is that the exporter is selling below cost, then the bioeconomic interpretation of cost may be central to determining whether the claim has merit. Consider the contrast between open access and optimal management. Under open access, the fishery operates in a way that fails to consider the opportunity cost of dissipating resource rents. Short-run overexploitation comes at the expense of higher long-run sustained rents that would be obtained under optimal management. In that sense, an importer may argue that an open access exporter is not paying the full economic cost of producing fish. Note that the same argument could be mounted to dispute imports from a country operating under regulated open access. There again the management regime fails to account for opportunity costs of fishery rents. While open access and regulated open access implicitly undervalue opportunity cost, the financial cost (here we mean harvest cost plus amortized cost of fishing capital) under these regimes is likely to be higher than the financial cost under optimal management. Under open access, equilibrium stock generally will be below the optimal stock, and when stock effects are present (as in equation 2), the cost of harvesting a unit of fish is thus higher than under optimal management. Under regulated open access, the stock may be at the optimal level, but there is excess capital, and the total capital cost required to harvest the desired amount of fish is higher than under optimal management. These phenomena can be seen as countervailing effects to weigh against treatment of opportunity costs as zero. Considering the text of the WTO Agreement on Implementation of Article VI of the GATT 1994, the opportunity cost argument with respect to open access and regulated open access does not seem likely to stand up to WTO scrutiny. Specifically, the text in Article 2 does not mention opportunity cost: “Sales of the like product in the domestic market of the exporting country or sales to a third country at prices below per unit (fixed and variable) costs of production plus administrative, selling and general costs may be treated as not being in the ordinary course of trade by reason of price…. costs shall normally be calculated on the basis of records kept by the exporter or producer under investigation.” Moreover, determination of normal value may be done by examining prices in the domestic market, and these prices would not necessarily be higher as a result of the fishery being open access. The opportunity cost argument may have some economic justification and it may be invoked in anti-dumping cases, but it does not appear to be allowed by existing WTO rules.
38
So far, anti-dumping has been a WTO concern primarily in relation to aquaculture. The rapid increase in aquaculture production for certain species had led to increased imports in some countries where domestic producers of similar product have filed anti-dumping complaints against what they perceive as unfair competition. Among the most important examples are shrimp (Keithly and Poudel, 2008), salmon (Asche, 2001) and catfish (Norman-Lopez and Asche, 2008). Although the exporters in all cases feel that the anti-dumping complaints are unfair and protectionist, from a trade perspective these cases are more straightforward than any case related to capture fisheries. This is because the production technology in aquaculture more closely resembles the production technology in most other industries, and in particular, there is in general no commons problem leading to a backward bending supply schedule.32 We return to the shrimp case in the next section. 7.3 Subsidies and countervailing measures
Many fisheries subsidies—such as fuel subsidies, preferential tax treatment, and boat construction subsidies—appear to meet the basic definition of a subsidy set forth in WTO’s Agreement on Subsidies and Countervailing Measures (Article 1). Two other frequently mentioned fishery subsidies are 1) government sponsored wharf and port construction and 2) the free provision of fisheries research and regulatory infrastructure. These types of support less obviously meet the definition of Article 1 but could be debated as “a government provides goods or services other than general infrastructure.” Whether any subsidies to fisheries contribute to an “Adverse Effect” as in Article 5 likely depends critically on the existing management regime and the bioeconomic circumstances of the relevant fishery. The trade implications of a fishery subsidy depend on the management regime. We assume that a trade issue may arise if the flow of fish products changes as a result of the subsidy. In most cases, a subsidy will lower the cost of harvest or raise the effective price of fish for the fishing vessel. Under open access, both of these effects will reduce the steady-state stock. Assuming the fishery was operating in the backward-bending portion of supply before the subsidy, the policy will actually reduce the amount of fish harvested in the new steady state. Neither importers from a subsidizing country nor exporters to the subsidizing country would appear to have grounds for complaint to the WTO. Under optimal management with a significant stock effect, a subsidy would have the opposite effect (or the conventional effect predicted in trade models). Here, the reduction of the stock moves the fishery towards the MSY, increasing equilibrium harvest. As such, it is possible that a subsidy to an optimized fishery exporter could produce an adverse effect for the domestic industry in the importing country.
32 There are exceptions. For instance, Le Grel and Le Bihan (2009) indicates that oyster aquaculture in the bay of Bourgneuf in France has a backward bending supply schedule because the food supply from the sea is limited, and when the farmers stock too many oysters, lack of feed leads to lower growth. In this case, the naturally provided feed for the oysters seems to be a common pool resource.
39
Strictly speaking, a subsidy in a regulated open access fishery will have no effect on the amount of fish harvested as it will not change the biological target. Similarly, in management systems with vessel quotas that are distributing a biologically determined overall quota, the subsidy issue is irrelevant when the quota is binding. The subsidy in that case cannot influence how much fish is harvested. An interesting case that highlights many complexities of the global seafood trade is the U.S. anti-dumping action against shrimp from China, Vietnam, India, Thailand, Ecuador, and Brazil filed in 2003 (Keithly and Poudel, 2008). In contrast to most species that are fished commercially, the reproductive characteristics of shrimp mean that the stock in one year has little connection to how many were caught the previous year. Thus, the backward-bending supply curve is not likely to be an issue, and subsidies more likely would confer a competitive advantage in an open access setting. However, the vast majority of U.S. imports from these countries came from farmed shrimp. As such, an important basis for the case was that international organizations such as the World Bank subsidized the development of shrimp aquaculture in these countries and conferred an unfair competitive advantage on this growing export industry. Quantitatively assessing this claim is difficult. The production methods of shrimp farming and wild capture shrimp fishing differ dramatically, but to consumers the products are quite similar, especially once processed or frozen. The different production methods make it difficult to compare production costs of imports to the domestic product. The similarity of the product, however, means that farmed shrimp imports compete directly with domestic wild capture shrimp. This case also presents some interesting equity issues. Suppose an international development organization encourages a country to develop a particular industry. Being successful in developing an export industry, the country could subsequently be punished with an anti-dumping duty, which is legitimated by another international organization, namely the WTO. Given the potential environmental impacts of fish farming, environmental NGOs and possibly some development organizations in the future may provide technical support and financial incentives for developing countries to farm fish more sustainably. Will these actions be seen as subsidies and grounds for anti-dumping duties allowed by the WTO? One could stretch the logic further and suggest that lack of international coordination in such cases could lead to inefficient investment in infrastructure. It is important to point out that, in spite of the theory of backward-bending supply and open access, some scholars argue that the WTO has a critical role to play in promoting fisheries sustainability through the elimination of subsidies (Sumaila et al. 2007). We agree that eliminating subsidies will alleviate some pressure on fish stocks and help to mitigate against overfishing. However, we believe that elimination of subsidies is not likely to eliminate overfishing problems as long as fisheries remain open access or are regulated by a weak management system. Moreover, we believe that many subsidies discussed in this literature could be considered general infrastructure (e.g. fisheries research and port construction), and fisheries subsidies to open access countries generally do not appear to violate existing WTO rules as discussed above.
40
7.4 Technical barriers to trade and point of origin
The WTO agreement on technical barriers to trade is potentially relevant to the vast majority of trade conflicts in fish products, with a preamble stating: “Recognizing that no country should be prevented from taking measures necessary to ensure the quality of its exports, or for the protection of human, animal or plant life or health, of the environment.” The production of fish products whether from wild capture fisheries or from aquaculture has a deep connection to environmental quality, and environmental issues in many cases transcend national boundaries. So protection of the environment under the WTO rules really is a matter of scope. To what extent do practices of an exporting country impinge on global public goods even if the actions took place on land or exclusively within the country’s EEZ? To what extent are global public goods a contributor to an importer country’s domestic environmental quality, which the importing country has a right to protect under the agreement on technical barriers to trade? When fisheries have direct impacts on marine biodiversity, trade restrictions appear relatively easy to justify as allowable under technical barriers to trade unless they discriminate between different WTO member countries. An interesting example is the use of turtle excluder devices (TEDs) in shrimp trawls to reduce sea turtle mortality. In the U.S., NOAA requires TEDs on shrimp trawlers and has worked with other nations to adopt TEDs.33 The U.S. in 1989 required countries exporting shrimp to the U.S. to certify that their shrimp trawlers were equipped with TEDs. In 1997, India, Pakistan, Malaysia, and Thailand brought a complaint to the WTO, and ultimately the WTO ruled against the U.S. From the WTO’s website:
The US lost the case, not because it sought to protect the environment but because it discriminated between WTO members. It provided countries in the western hemisphere — mainly in the Caribbean — technical and financial assistance and longer transition periods for their fishermen to start using turtle-excluder devices. It did not give the same advantages, however, to the four Asian countries (India, Malaysia, Pakistan and Thailand) that filed the complaint with the WTO. 34
The appellate panel specifically states:
185. We have not decided that the sovereign nations that are Members of the WTO cannot adopt effective measures to protect endangered species, such as sea turtles. Clearly, they can and should. And we have not decided that sovereign states should not act together bilaterally, plurilaterally or multilaterally, either within the WTO or in other
33 See http://www.nmfs.noaa.gov/pr/species/turtles/teds.htm . 34 See http://www.wto.org/english/tratop_e/envir_e/edis08_e.htm .
41
international fora, to protect endangered species or to otherwise protect the environment. Clearly, they should and do. 186. What we have decided in this appeal is simply this: although the measure of the United States in dispute in this appeal serves an environmental objective that is recognized as legitimate under paragraph (g) of Article XX of the GATT 1994, this measure has been applied by the United States in a manner which constitutes arbitrary and unjustifiable discrimination between Members of the WTO.
So, it appears that there is a lot of room for pursuing marine conservation objectives through trade policy. Countries that wish to do so need to make sure that their rules apply uniformly across WTO members and that they have not favored some WTO members through technical assistance. One can imagine setting uniform transition times for TEDs, but given that existing multilateral cooperation in conservation efforts is often regional, it is harder to imagine that technical assistance would not somehow privilege some states over others. In the case of TEDs, the Inter-American Convention (IAC) for the Protection and Conservation of Sea Turtles entered into force in 2001. Fifteen countries participate in this multi-lateral agreement and commit to the use of TEDs in shrimp trawls. However, many other countries continue to allow shrimp trawling without the use of TEDs. A qualitatively different argument from effects on global public goods is that a reduction of the fish stock under open access relative to optimal management constitutes an environmental harm. If fisheries management is successful in eliminating the negative consequences of open access in some countries, these countries may expect other countries to do the same. Does banning imports from countries with open access constitute a technical barrier to trade? On the surface, one might conclude yes if a stock is contained entirely within the open access country’s EEZ. However, marine ecosystems rarely conform to political boundaries. Even if the fish range only within one EEZ, the predators of that fish, for instance, may not. By extension, this argument would lead to a proliferation of environmental exceptions that would not violate WTO rules on technical barriers to trade because marine ecosystems are inherently interconnected. It may be useful for the WTO to establish clear rules on what constitutes protection of domestic environmental quality with regards to fisheries exploitation and the resulting impacts on marine ecosytems. Lastly, the globalization of the fish trade has led to substantial product that is exported to one country, processed, and then re-exported, sometimes back to the original country. China, for instance, is both a large importer and exporter of seafood products from the U.S. Much of this trade involves importing raw product and re-exporting processed product (USDA Foreign Agricultural Service 2008). As this trend develops, it is an open question as to how countries will ensure traceability of seafood products. If product is processed in a country besides the one harvesting or producing it, traceability may be more difficult. Traceability requirements could then become technical barriers to trade
42
not just for raw product but also for processed product that ostensibly originates in the importing country.
7.5 Non-governmental efforts to promote marine conservation
NGOs generally have not been satisfied with the track records of governments, trade policy, international agreements, and international organizations to promote marine conservation. Overfishing due to open access and the deleterious effects of fishing on marine biodiversity and unique marine habitats persist in many parts of the world. As a result, NGOs have started to advocate for using the market to influence fisheries management and marine conservation through consumer pressure (as distinct from market-based regulations like ITQs). Some NGOs claim that consumers do not accept the mismanagement of fish stocks and wish to purchase sustainable seafood alternatives. Ecolabeling is one market-based tool, allowing consumers to choose seafood only from well managed fisheries.35 To strengthen the credibility of ecolabels, they often also require third-party certification. The most notable certification body is the Marine Stewardship Council (MSC), which has certified a number of fisheries as meeting their standards for sustainability. Some examples include Alaska (wild) salmon, Gulf of Alaska pollock, New Zealand hoki, Norway north east Arctic saithe, Oregon pink shrimp, South Africa hake trawl, and South Georgian Patagonian toothfish longline.36 To use an ecolabel will in most cases also require some kind of traceability to ensure that fish with the right to an ecolabel is not mixed with other fish in the supply chain. Certification, labelling, or meeting specific standards segment the market into those products where the standard is met, and those where it is not. Meeting the standards requires that producers provide information that otherwise would not be provided and carry out costly additions to the production processes they otherwise would not undertake. These burdens make some producers unable or unwilling to meet the standards and therefore further segments the market, reduces trade, or changes the trade pattern. While some standards seem justified, the myriad of requirements that differ across countries creates a barrier for many producers. This is particularly true for producers in developing countries, where limited infrastructure makes it very hard to document the production process even when it is compliant. The problem is particularly acute for ecolabeling, as many developing countries lack the governance structure for their fisheries to be certified. However, at the other end of the labelling spectrum, it is difficult to draw a clear distinction between a generic brand that focuses on promoting an attribute of the product, and a company brand that promotes certain attributes of the seller. Hence, if one were to implement measures that prohibit some voluntary labels because they are distorting trade, it is difficult to identify the point where labelling should not be allowed without outlawing all labels.
35 Wessells (2002) provides a more general discussion about the role of information in seafood sales, while Ward and Phillips (2008) provide a useful review of seafood ecolabeling in practice. 36 An updated list of MSC-certified fisheries is available at http://www.msc.org/ .
43
While ecolabeling follows a product directly, there are other approaches to provide consumers with information that allow them to make their choices in an environmentally friendly manner. For instance, a number of NGOs provide wallet cards or information on their web pages using traffic light systems to categorize species based on their sustainability (Roheim, 2009). Some cards focus on sustainability issues, while others include health information as well. Some retail chains cater to the environmentally conscious consumer by providing specific labels on some of their seafood products (e.g. the French chain Carrefour), on a product range or for the whole chain (e.g. the U.S. chain Whole Foods). 7.6 Government sponsored labels and traceability An open question is the extent to which governments will adopt ecolabeling standards and insist that imports meet these standards, or at least create standards that specify what a specific type of label must imply. Organic labelling and origin labelling are examples in the food industry. These standards could then become technical barriers to trade, but again questions would emerge as to whether the standards are intended to protect environmental quality (or human health) and whether they are discriminatory. In addition, fisheries management has traditionally been a government activity, and in several countries there are strong objections to allowing private entities to engage in management albeit indirectly in the case of ecolabels. In Iceland, Japan, and Norway, work has been undertaken to assess the feasibility of a government issued ecolabel. To date, government ecolabels for fish have yet to be implemented. Moreover, as we discussed in relation to IUU fishing and RMFOs, several of the measures needed for a credible ecolabel can also be effective tools against illegal fishing. This is particularly true for traceability requirement and for any mechanism that uses denial of market access as a means to prevent an unwanted activity. Hence, if some countries limit market access to discourage unsustainable fishing outside of their own jurisdictions, this activity could closely resemble how ecolabels will unfold in practice. Thus, ecolabels could become de facto government-sponsored tools that prevent market access for products lacking certain attributes.
44
References
Anderson, J. L. The International Seafood Trade. Cambridge: Woodhead Publishing, 2003. Anderson, J. L., Asche, F. and Tveterås, S. (2009) World Fish Markets. In Handbook of
Marine Fisheries Conservation and Management (Eds, Grafton, R. Q., Hilborn, R., Squires, D., Tait, M. and Williams, M.) Oxford University Press, Oxford. Anderson, L.G. 1977. The Economics of Fisheries Management. Baltimore, MD: The Johns Hopkins University Press. Anderson, L.G. 2007. Does Capacity Analysis Help us Meet Fishery Policy and Management Objectives? Comments. Marine Resource Economics 22:89-93. Asche, F. (2001) “Testing the effect of an anti-dumping duty: The US salmon market.” Empirical Economics, 26, 343-355. Asche, F. 2007. Capacity Measurement in Fisheries: What Can we Learn? Marine
Resource Economics 22:105-108. Asche, F., T. Bjørndal, and D. V. Gordon. "Studies in the Demand Structure for Fish and Seafood Products." In Handbook of Operations Research in Natural Resources, edited by A. Weintraub, C. Romero, T. Bjørndal and R. Epstein, 295-314. Berlin: Springer, 2007. Asche, F., T. Bjørndal and D. V. Gordon (2009) Resource Rent in Individual Quota Fisheries. Land Economics, 85: 280-292. Asche, F., H. Eggert, E. Gudmundsson, A. Hoff and S. Pascoe (2008) Fisher’s Behaviour with Individual Vessel Quotas – Over-capacity and Potential Rent: Five case studies. Marine Policy, 32: 920-927. Berkes, F. and 14 co-authors. 2006. Globalization, Roving Bandits, and Marine Resources. Science 311:1557-1558. Bjørndal, T. (2009) Overview, roles and performance og the North East Atlantic Fisheries Comission (NEAFC) Marine Policy, 33:685-697. Bjørndal, T. and J.M. Conrad. 1987. The Dynamics of an Open Access Fishery. Canadian Journal of Economics 20:74-85. Bjørndal, T., J.M. Conrad, and K.G. Salvanes. 1993. Stock Size, Harvest Costs, and the Potential for Extinction: The Case of Sealing. Land Economics 69:156-67.
45
Brander, J.A. and M.S. Taylor .1997a. International Trade and Open-Access Renewable Resources: The Small Open Economy Case. Canadian Journal of Economics 30:526-552. Brander, J.A. and M.S. Taylor. 1997b. International Trade between Consumer and Conservationist Countries. Resource and Energy Economics 19:267-298. Brander, J.A. and M.S. Taylor. 1998a. Open Access Renewable Resources Trade and Trade Policy in a Two-country Model. Journal of International Economics 44:181-210. Brander, J.A. and M. S. Taylor. 1998b. The Simple Economics of Easter Island: A Ricardo-Malthus Model of Renewable Resource Use. American Economic Review 88:119-139. Bromley, D.W. 2009. Abdicating Responsibility: The Deceits of Fisheries Policy. Fisheries 34(6):280-302. Cato, J.C. 1998. Seafood Safety - Economics of Hazard Analysis and Critical Control
Point (HACCP) programmes. FAO FISHERIES TECHNICAL PAPER – 381. Rome: Food and Agriculture Organization of the United Nations, available online http://www.fao.org/docrep/003/x0465e/x0465e00.HTM. Chichilnisky, G. 1994. North-South trade and the global environment. American
Economic Review 84:851-74. Christy, F. T. Jr. 1973. Fishermen quotas: a tentative suggestion for domestic management. Occasional Paper 19. Kingston, Rhode Island: University of Rhode Island, Law of the Sea Institute. Clark, C.W. 1990. Mathematical Bioeconomics: The Optimal Management of Renewable
Resources, Second Edition, New York, NY: John Wiley & Sons, Inc. Clark, C.W. and G.R. Munro. 1975. The Economics of Fishing and Modern Capital Theory: A Simplified Approach. Journal of Environmental Economics and Management 2:92-106. Clark, C.W., G.R. Munro, and U.R. Sumaila. 2005. Subsidies, buybacks, and sustainable fisheries. Journal of Environmental Economics and Management 50:47058. Conrad, J.M. 1999. Resource Economics. New York: Cambridge University Press. Copeland, B. and M.S. Taylor. 2009. Trade, tragedy and the commons. American
Economic Review 99:725-49. Copes, P. 1970. The backward-bending supply curve of the fishing industry. Scottish
Journal of Political Economy 17:69-77.
46
Costello, C., S. Gaines, and J. Lynham. 2008. Can catch shares prevent fisheries collapse?. Science 321: 1678-1681. Costello, C. and S. Polasky. 2008. Optimal Harvesting of Stochastic Spatial Resources. Journal of Environmental Economics and Management 56. Cox, A. 2007. Capacity Analysis and Fisheries Management: Is the Tail Wagging the Dog? Marine Resource Economics 22:95-98. Curtis, R. and D. Squires (2007) Fisheries buybacks. Blackwell: Ames, Iowa. Delgado, C. L., N. Wada, M. W. Rosengrant, S. Meijer, and M. Ahmed. Fish to 2020:
Supply and Demand in Changing Global Markets. Washington: IFPRI, 2003. FAO. Report of the Expert Consultation on Identifying, Assessing and Reporting on
Subsidies in the Fishing Industry. Rome, 3-6 December 2002. FAO Fisheries Report. No. 698. Rome, FAO. 2003. FAO. The State of World Fisheries and Aquaculture 2006. Rome: FAO, 2006. FAO FISHSTAT Plus. Universal software for fishery statistical time series. Fisheries Department, Fishery Information, Data and Statistics Unit. Version 2.3. Rome, 2008. Gordon, H.S. 1954. Economic theory of a common property resource: the fishery. Journal of Political Economy 75:124-142. Grafton, R.Q. 1996. 1996a. Individual transferable quotas: theory and practice. Reviews
in Fish Biology and Fisheries 6:5-20. Groves, T. and D. Squires (2007) Lessons from Fisheries Buybacks, in R. Curtis and D. Squires (ed.). Fisheries buybacks. Blackwell: Ames, Iowa Hannesson, R. 1997. Fishing as a Supergame. Journal of Environmental Economics and
Management 32(3):309–322. Hannesson, R.1998. Marine Reserves: What will they accomplish? Marine Resource
Economics 13:159-170. Hannesson, R. 2000. Renewable resources and the gains from trade. Canadian Journal of
Economics 33:122-32. Hannesson, R. (2007) Do Buyback Programes Make Sensde? in R. Curtis and D. Squires (ed.). Fisheries buybacks. Blackwell: Ames, Iowa
47
Hannesson, R. M. Barange, and S.F. Herrick Jr. 2006. Climate Change and the
Economics of the World’s Fisheries: Examples of Small Pelagic Stocks. Northhampton, MA: Edward Elgar. Hardin, G. 1968. The tragedy of the commons. Science 162:1243-1248. Hatcher, A. and Robinson, K. (Eds.). Overcapacity, overcapitalisation and subsidies in European fisheries, Portsmouth, Proceedings of the first Concerted Action workshop on Economics and the Common Fisheries Policy: UK, 28-30 October, 1998. CEMARE Miscellaneous Publication no. 44 1999. Holland DS & Brazee RJ. 1996. Marine Reserves for Fisheries Management. Marine
Resource Economics 11:157-171. Homans, F.R. and J.E. Wilen. 1997. A Model of Regulated Open Access Resource Use. Journal of Environmental Economics and Management 32:1-21.
Keithly, W. R. Jr., and P. Poudel. "The Southeast U.S. Shrimp Industry: Issues Related to Trade and Antidumping Duties." Marine Resource Economics 23:459-83 (2008). Kirkley, J., C.J.M. Paul, D. Squires. 2002. Capacity and Capacity Utilization in Common-pool Resource Industries: Definition, Measurement, and a Comparison of Approaches. Environmental and Resource Economics 22: 71–97. Le Grel L. and V. Le Bihan (2009) Oyster Farming and Externalities: The Experience of the Bay of Bourgneuf, Aquaculture Economics and Management, 2: 112-123. Levhari, D., and L.J. Mirman. 1980. The Great Fish War: An Example Using a Dynamic Cournot-Nash Solution. Bell Journal of Economics 11:322–334. Liese, C., M.D. Smith, and R.A. Kramer. 2007. Open Access in a Spatially Delineated Artisanal Fishery: The Case of Minahasa, Indonesia. Environment and Development
Economics 12(1):123-143. Metuzals, K., R. Baird, T. Pitcher, U. R. Sumaila and P. Ganapathiraju (2009) In Handbook of Marine Fisheries Conservation and Management (Eds, Grafton, R. Q., Hilborn, R., Squires, D., Tait, M. and Williams, M.) Oxford University Press, Oxford. Milazzo, M. 1998. Subsidies in World Fisheries: A Reexamination. World Bank Technical Paper No. 406. Washington, D.C.: World Bank. Munro, G.R. and U.R. Sumaila. 2002. Subsidies and their potential impact on the management of the ecosystems of the North Atlantic, Fish and Fisheries 3:233–250. Naylor, R. L., R. J. Goldburg, H. Mooney, M. Beveridge, J. Clay, C. Folke, N. Kautsky, J. Lubchenco, J. Primavera and M. Williams. 1998. Nature's Subsidies to Shrimp and Salmon Farming. Science 282: 883-884.
48
Newell, R., J. N. Sanchirico, and S. Kerr. 2005. Fishing Quota Markets, J. of Environ.
Econom. Management 49(3): 437-462. Nielsen, M. 2009. Modelling fish trade liberalisation: Does fish trade liberalisation result in welfare gains or losses?. Marine Policy 33:1-7. National Research Council (NRC). 1999. Sharing the Fish: Toward a National Policy on
Individual Fishing Quotas. Washington D.C.: National Academy Press.
Norman-López, A. and F. Asche (2008) Competition between imported Tilapia and US catfish in the US market. Marine Resource Economics, 23, 199-214.
Ostrom, E. 1990. Governing the Commons: The Evolution of Institutions for Collective
Action. New York: Cambridge University Press. Pew Oceans Commission. 2003. America's Living Oceans: Charting a Course for Sea
Change, Pew: Arlington, Virginia. Roheim, C.A. 2004. Trade liberalization in fish products: Impacts on sustainability of international markets and fish resources. in Global Agricultural Trade and Developing
Countries. A. Aksoy and J. Beghin, eds. Washington D.C.: The World Bank. Roheim, C.A. and J.G. Sutinen. 2006. Trade and marketplace measures to promote sustainable fishing practices. International Centre for Trade and Sustainable Development (ICTSD) Issue Paper No. 3. Geneva: ICTSD. Roheim, C.A. 2007. Does Capacity Analysis Help us Meet Fishery Policy and Management Objectives? Marine Resource Economics 22:77. Roheim, C. A. (2009) An Evaluation of Sustainable Seafood Guides: Implications for Envirobnmental Groups and the Seafood Industry. Marine Resource Economics 24: 301-310. Sanchirico, J.N., M.D. Smith, and D.W. Lipton. 2008. An empirical approach to ecosystem-based fishery management. Ecological Economics 64(3):586-96. Sanchirico, J.N. and J.E. Wilen. 1999. Bioeconomics of Spatial Exploitation in a Patchy Environment. Journal of Environmental Economics and Management 37:129-50. Sanchirico JN & Wilen JE. 2001. A Bioeconomic Model of Marine Reserve Creation. Journal of Environmental Economics and Management 42:257-276. Sanchirico, J.N. and J.E. Wilen. 2005. Optimal Spatial Management of Renewable Resources: Matching Policy Scope to Ecosystem Scale. Journal of Environmental
Economics and Management 50: 23-46.
49
Scott, A. 1955. The fishery: the objectives of sole ownership. Journal of Political
Economy 63:116-24. Smith, M.D. Bioeconometrics: Empirical Modeling of Bioeconomic Systems. 2008. Marine Resource Economics, 23:1-23. Smith, M.D., J.N. Sanchirico, and J.E. Wilen. 2009. The Economics of Spatial-Dynamic Processes: Applications to Renewable Resources. Journal of Environmental Economics
and Management 57:104-121. Smith, M.D. and J.E. Wilen. 2003. Economic Impacts of Marine Reserves: The Importance of Spatial Behavior. Journal of Environmental Economics and Management 46:183-206. Smith, M.D. and J.E. Wilen. 2004. Marine Reserves with Endogenous Ports: Empirical Bioeconomics of the California Sea Urchin Fishery. Marine Resource Economics 19:85-112. Smith, M.D., J. Zhang, and F.C. Coleman. 2006. Effectiveness of Marine Reserves for Large-Scale Fisheries Management. Canadian J. of Fisheries and Aquatic Sciences
63:153-164. Smith, M.D., J. Zhang, and F.C. Coleman. 2008. Econometric Modeling of Fisheries with Complex Life Histories: Avoiding Biological Management Failures. Journal of
Environmental Economics and Management 55:265-280. Smith, V.L. Economics of Production from Natural Resources. 1968. American
Economic Review 409-431. Smith, V.L. 1969. On Models of Commercial Fishing. Journal of Political Economy 77:181-198. Squires, D. , M. Alauddin, J. Kirkley. 1994. Individual transferable quota markets and investment decisions in the fixed gear sablefish industry. Journal Environmental
Economics and Management 27:185–204. Sumaila, U.R. 1997. Strategic Dynamic Interaction: The Case of Barents Sea Fisheries. Marine Resource Economics 12: 77-94. Sumaila, U.R., A. Khan, R. Watson, G. Munro, D. Zeller, N. Baron, and D. Pauly. 2007. The World Trade Organization and global fisheries sustainability. Fisheries Research 88:1-4. Sumaila, U.R., Pauly, D. (Eds.), 2006. Catching more bait: A bottom-up reestimation
of global fisheries subsidies. Fisheries Centre Research Reports 14(6), Vancouver.
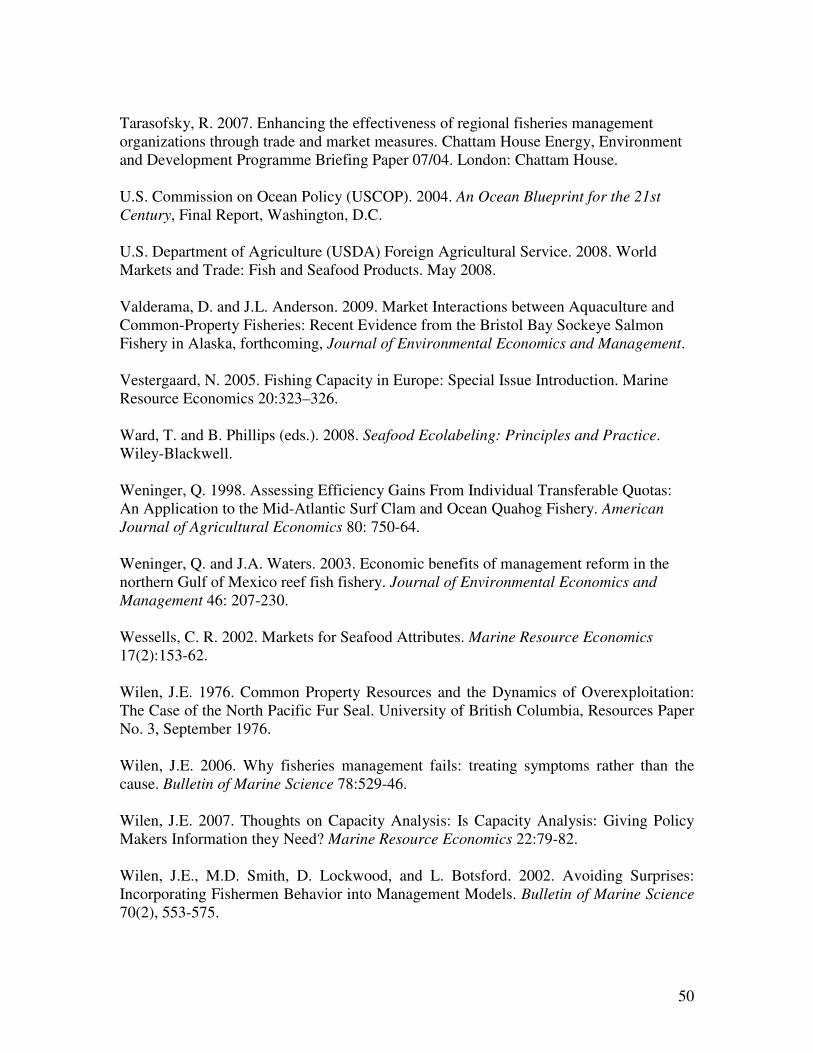
50
Tarasofsky, R. 2007. Enhancing the effectiveness of regional fisheries management organizations through trade and market measures. Chattam House Energy, Environment and Development Programme Briefing Paper 07/04. London: Chattam House. U.S. Commission on Ocean Policy (USCOP). 2004. An Ocean Blueprint for the 21st
Century, Final Report, Washington, D.C. U.S. Department of Agriculture (USDA) Foreign Agricultural Service. 2008. World Markets and Trade: Fish and Seafood Products. May 2008. Valderama, D. and J.L. Anderson. 2009. Market Interactions between Aquaculture and Common-Property Fisheries: Recent Evidence from the Bristol Bay Sockeye Salmon Fishery in Alaska, forthcoming, Journal of Environmental Economics and Management. Vestergaard, N. 2005. Fishing Capacity in Europe: Special Issue Introduction. Marine Resource Economics 20:323–326. Ward, T. and B. Phillips (eds.). 2008. Seafood Ecolabeling: Principles and Practice. Wiley-Blackwell. Weninger, Q. 1998. Assessing Efficiency Gains From Individual Transferable Quotas: An Application to the Mid-Atlantic Surf Clam and Ocean Quahog Fishery. American
Journal of Agricultural Economics 80: 750-64. Weninger, Q. and J.A. Waters. 2003. Economic benefits of management reform in the northern Gulf of Mexico reef fish fishery. Journal of Environmental Economics and
Management 46: 207-230. Wessells, C. R. 2002. Markets for Seafood Attributes. Marine Resource Economics 17(2):153-62. Wilen, J.E. 1976. Common Property Resources and the Dynamics of Overexploitation: The Case of the North Pacific Fur Seal. University of British Columbia, Resources Paper No. 3, September 1976. Wilen, J.E. 2006. Why fisheries management fails: treating symptoms rather than the cause. Bulletin of Marine Science 78:529-46. Wilen, J.E. 2007. Thoughts on Capacity Analysis: Is Capacity Analysis: Giving Policy Makers Information they Need? Marine Resource Economics 22:79-82. Wilen, J.E., M.D. Smith, D. Lockwood, and L. Botsford. 2002. Avoiding Surprises: Incorporating Fishermen Behavior into Management Models. Bulletin of Marine Science 70(2), 553-575.

51
Worm, B., R. Hilborn and 19 co-authors. 2009. Rebuilding Global Fisheries. Science 325:578-85.
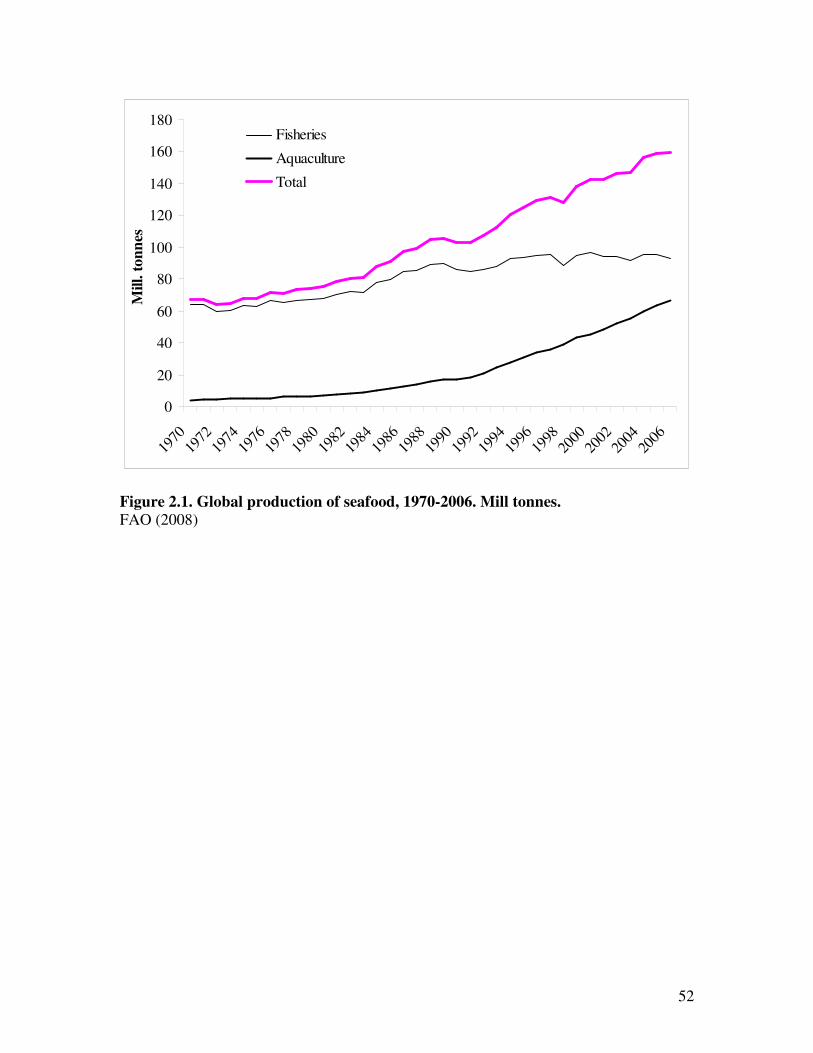
52
0
20
40
60
80
100
120
140
160
180
1970
1972
1974
1976
1978
1980
1982
1984
1986
1988
1990
1992
1994
1996
1998
2000
2002
2004
2006
Mill. t
on
nes
Fisheries
Aquaculture
Total
Figure 2.1. Global production of seafood, 1970-2006. Mill tonnes.
FAO (2008)
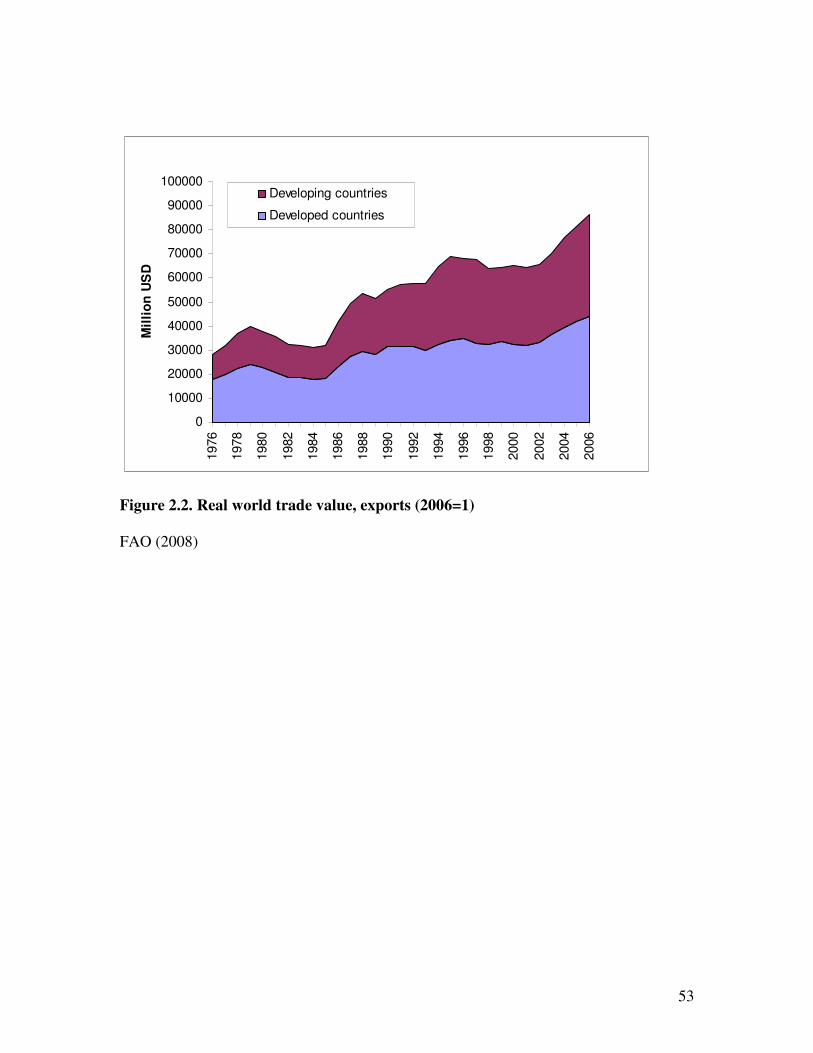
53
0
10000
20000
30000
40000
50000
60000
70000
80000
90000
100000
1976
1978
1980
1982
1984
1986
1988
1990
1992
1994
1996
1998
2000
2002
2004
2006
Mil
lio
n U
SD
Developing countries
Developed countries
Figure 2.2. Real world trade value, exports (2006=1)
FAO (2008)
54
0
10000
20000
30000
40000
50000
60000
70000
80000
90000
100000
1976
1978
1980
1982
1984
1986
1988
1990
1992
1994
1996
1998
2000
2002
2004
2006
Mil
lio
n U
SD
Developing countries
Developed countries
Figure 2.3. Real world trade value, imports (2006=1)
FAO(2008)
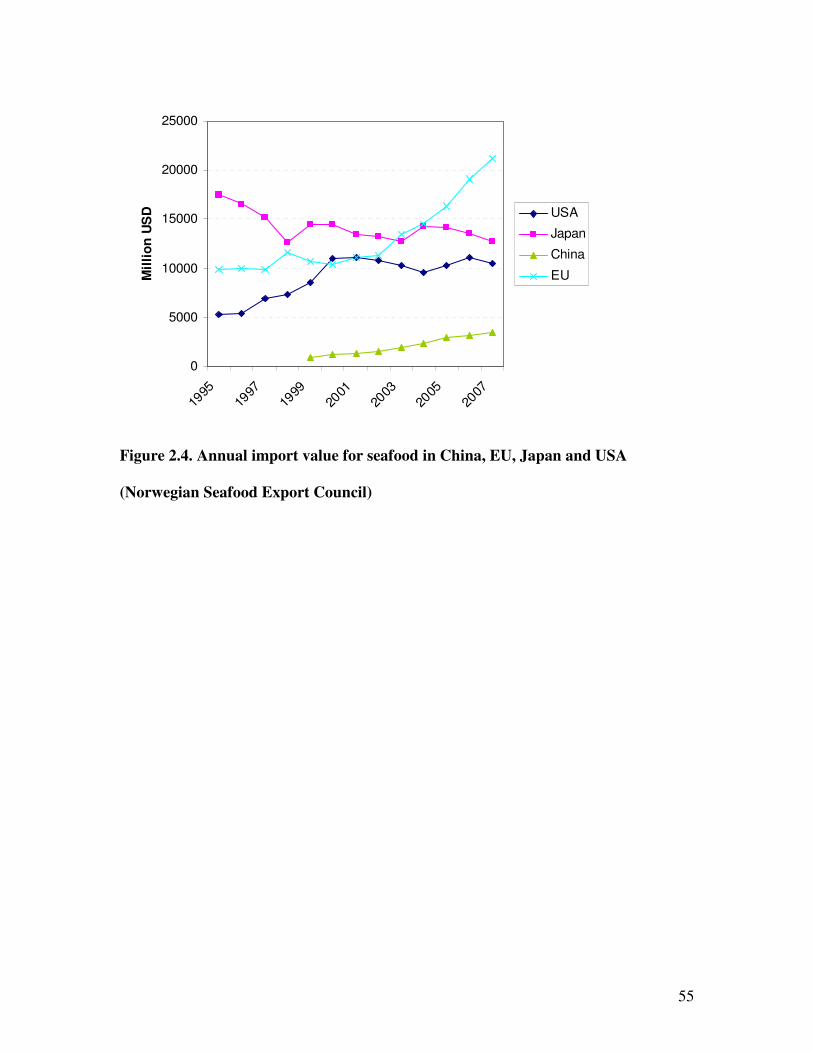
55
0
5000
10000
15000
20000
25000
1995
1997
1999
2001
2003
2005
2007
Mil
lio
n U
SD USA
Japan
China
EU
Figure 2.4. Annual import value for seafood in China, EU, Japan and USA
(Norwegian Seafood Export Council)
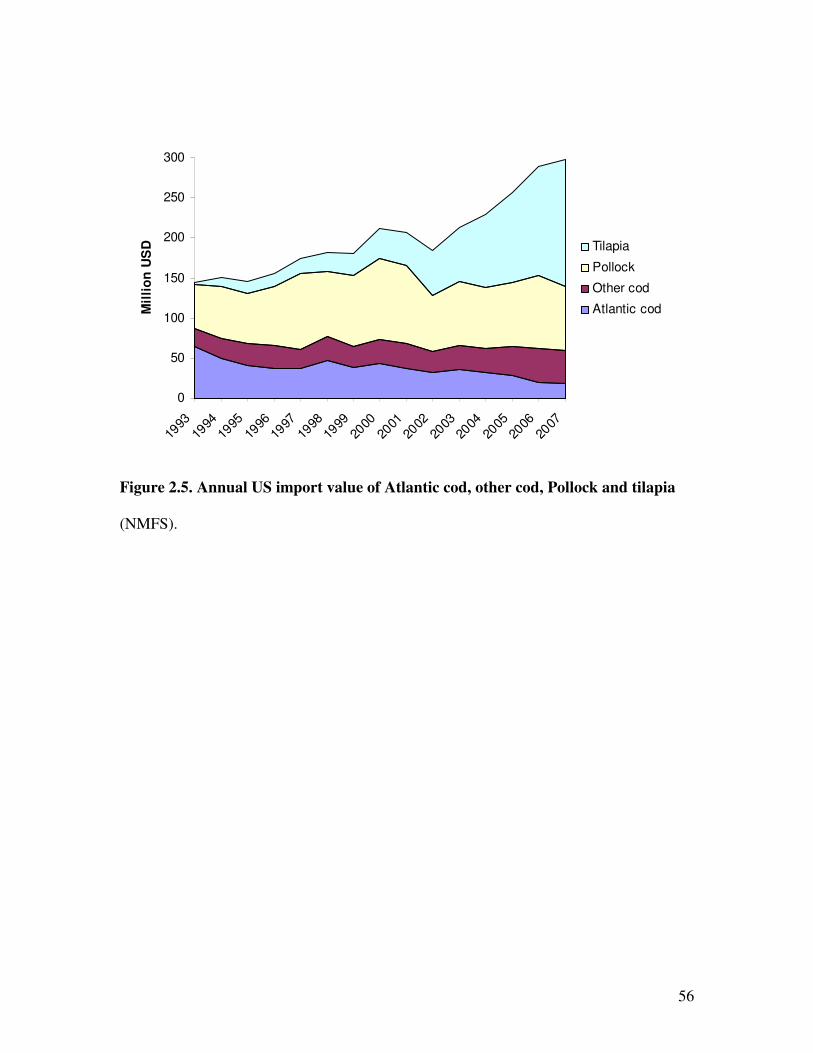
56
0
50
100
150
200
250
300
1993
1994
1995
1996
1997
1998
1999
2000
2001
2002
2003
2004
2005
2006
2007
Mil
lio
n U
SD Tilapia
Pollock
Other cod
Atlantic cod
Figure 2.5. Annual US import value of Atlantic cod, other cod, Pollock and tilapia
(NMFS).
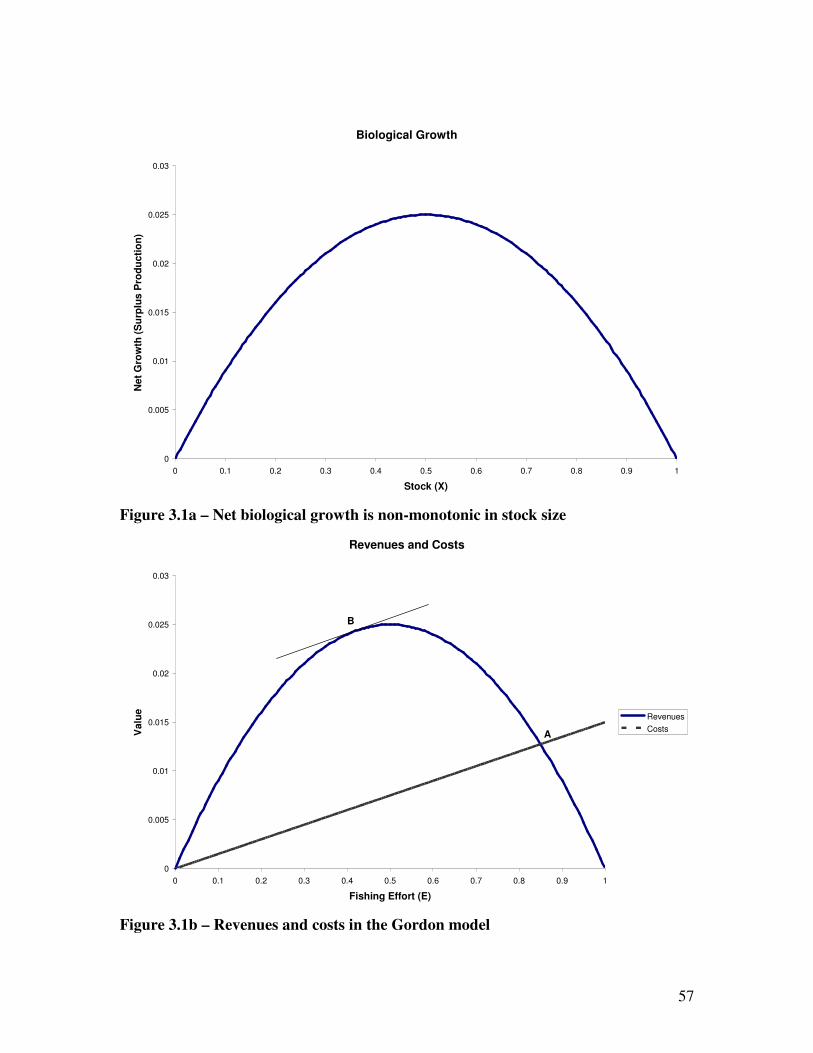
57
Biological Growth
0
0.005
0.01
0.015
0.02
0.025
0.03
0 0.1 0.2 0.3 0.4 0.5 0.6 0.7 0.8 0.9 1
Stock (X)
Net
Gro
wth
(S
urp
lus P
rod
ucti
on
)
Figure 3.1a – Net biological growth is non-monotonic in stock size
Revenues and Costs
0
0.005
0.01
0.015
0.02
0.025
0.03
0 0.1 0.2 0.3 0.4 0.5 0.6 0.7 0.8 0.9 1
Fishing Effort (E)
Valu
e
Revenues
CostsA
B
Figure 3.1b – Revenues and costs in the Gordon model
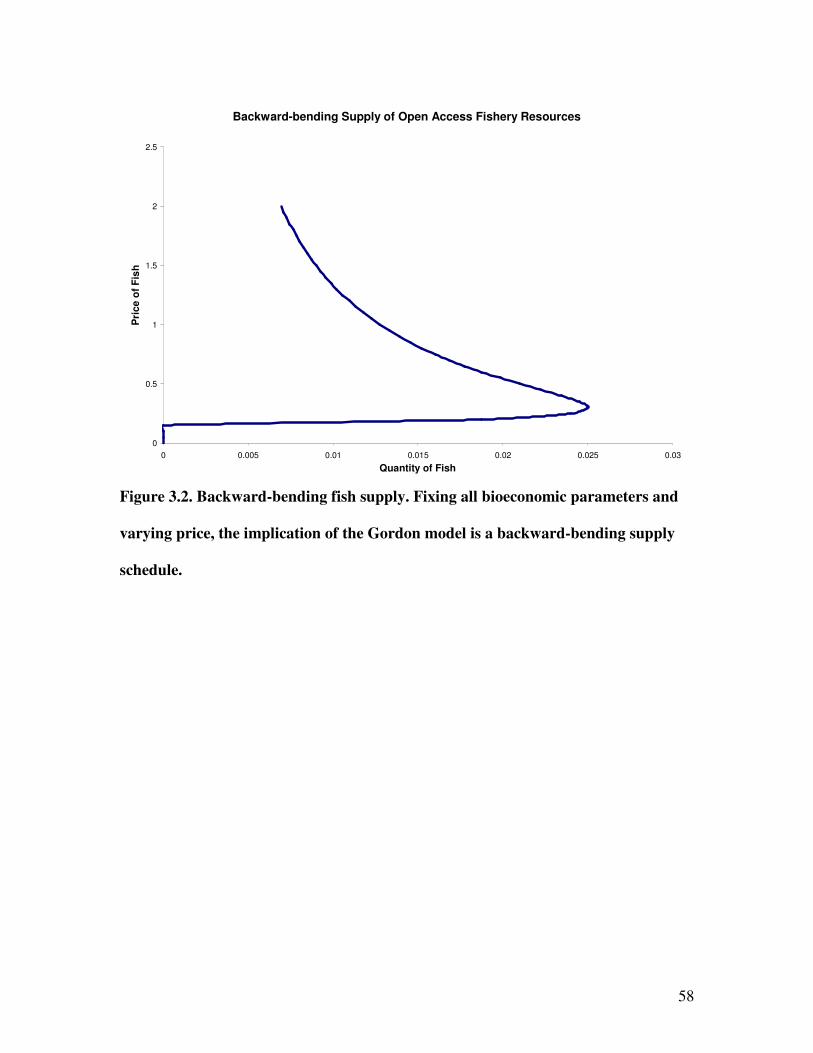
58
Backward-bending Supply of Open Access Fishery Resources
0
0.5
1
1.5
2
2.5
0 0.005 0.01 0.015 0.02 0.025 0.03
Quantity of Fish
Pri
ce o
f F
ish
Figure 3.2. Backward-bending fish supply. Fixing all bioeconomic parameters and
varying price, the implication of the Gordon model is a backward-bending supply
schedule.

59
Figure 3.3 Empirical Gordon-Smith Model of Open Access (from Wilen 1976)
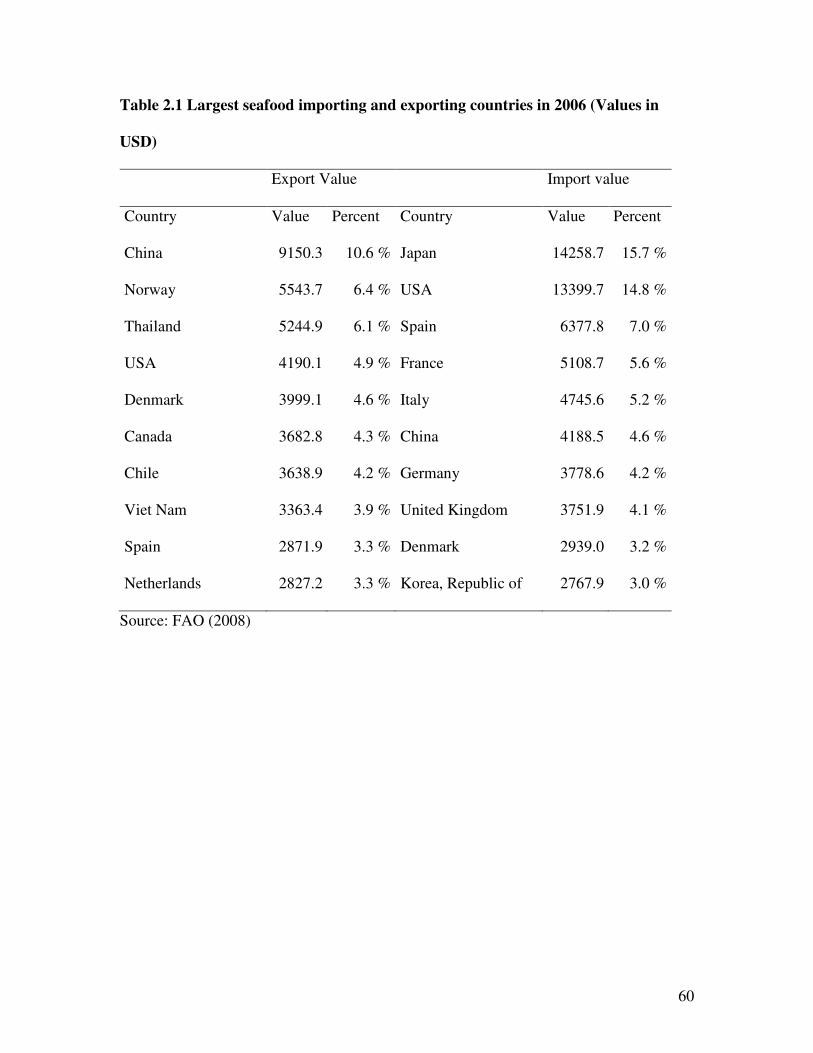
60
Table 2.1 Largest seafood importing and exporting countries in 2006 (Values in
USD)
Export Value Import value
Country Value Percent Country Value Percent
China 9150.3 10.6 % Japan 14258.7 15.7 %
Norway 5543.7 6.4 % USA 13399.7 14.8 %
Thailand 5244.9 6.1 % Spain 6377.8 7.0 %
USA 4190.1 4.9 % France 5108.7 5.6 %
Denmark 3999.1 4.6 % Italy 4745.6 5.2 %
Canada 3682.8 4.3 % China 4188.5 4.6 %
Chile 3638.9 4.2 % Germany 3778.6 4.2 %
Viet Nam 3363.4 3.9 % United Kingdom 3751.9 4.1 %
Spain 2871.9 3.3 % Denmark 2939.0 3.2 %
Netherlands 2827.2 3.3 % Korea, Republic of 2767.9 3.0 %
Source: FAO (2008)
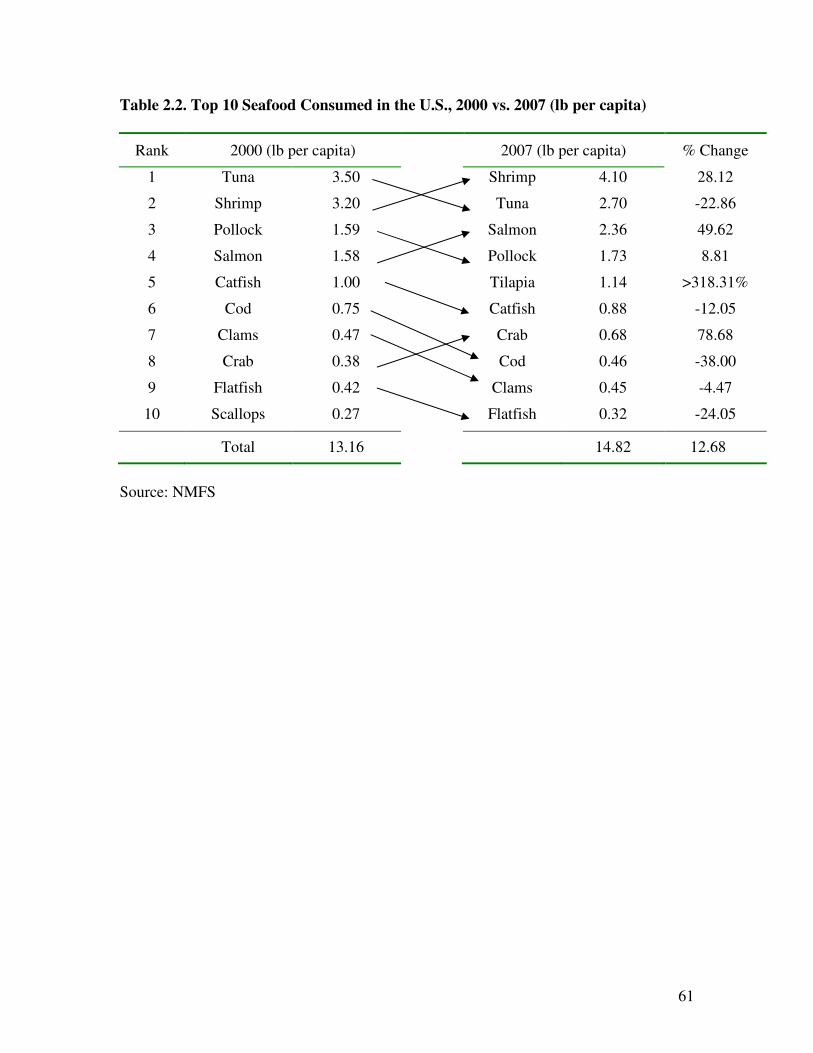
61
Table 2.2. Top 10 Seafood Consumed in the U.S., 2000 vs. 2007 (lb per capita)
Rank 2000 (lb per capita) 2007 (lb per capita) % Change
1 Tuna 3.50 Shrimp 4.10 28.12
2 Shrimp 3.20 Tuna 2.70 -22.86
3 Pollock 1.59 Salmon 2.36 49.62
4 Salmon 1.58 Pollock 1.73 8.81
5 Catfish 1.00 Tilapia 1.14 >318.31%
6 Cod 0.75 Catfish 0.88 -12.05
7 Clams 0.47 Crab 0.68 78.68
8 Crab 0.38 Cod 0.46 -38.00
9 Flatfish 0.42 Clams 0.45 -4.47
10 Scallops 0.27 Flatfish 0.32 -24.05
Total 13.16 14.82 12.68
Source: NMFS