Tracking of Moving Coronary Artery Segment in Sequence …cdn.intechweb.org/pdfs/13897.pdf ·...
19
14 Tracking of Moving Coronary Artery Segment in Sequence of X-Ray Images Goszczynska Hanna and Kowalczyk Leszek Nałęcz Institute of Biocybernetics and Biomedical Engineering PAS Poland 1. Introduction The variety of motion artefacts like situations when the patient is not able to hold his or her breath, natural organ movements and others cause great problems in current medical imaging techniques, such as image subtraction technique (eg. Digital Subtraction Angiography), registration technique, morphological and functional analysis, e.g. flow or perfusion estimation, and support of therapeutic intervention, eg. surgical tools and organ movement tracking. There are numerous reports in the literature mentioning possible types of motion artefacts. Many techniques are described to avoid and to correct such artefacts by means of digital image processing. The most important tasks utilized in all these techniques are the construction of a 2D geometrical transformation, which refers to original 3D deformation, finding correspondence between two images using only grey-level information, and efficient computer application of this correspondence [Meijering, 2000; Wang et al., 1999]. The procedure of finding the correspondence or estimation of the level of similarity between two images is the most important part of the above mentioned techniques, which has been applied either in static or dynamic approaches. This work presents an application of a correspondence finding technique to the densitometric analysis performed for coronary flow estimation on the image of a moving artery segment in X-ray image sequences of coronary arteries (Fig. 1). Fig. 1. Sequence of coronarographic images (every 6 th image) from negative coronarographic film with visible contrast medium passing www.intechopen.com
-
Upload
duongthuan -
Category
Documents
-
view
221 -
download
4
Transcript of Tracking of Moving Coronary Artery Segment in Sequence …cdn.intechweb.org/pdfs/13897.pdf ·...

14
Tracking of Moving Coronary Artery Segment in Sequence of X-Ray Images
Goszczynska Hanna and Kowalczyk Leszek Nałęcz Institute of Biocybernetics and Biomedical Engineering PAS
Poland
1. Introduction
The variety of motion artefacts like situations when the patient is not able to hold his or her breath, natural organ movements and others cause great problems in current medical imaging techniques, such as image subtraction technique (eg. Digital Subtraction Angiography), registration technique, morphological and functional analysis, e.g. flow or perfusion estimation, and support of therapeutic intervention, eg. surgical tools and organ movement tracking. There are numerous reports in the literature mentioning possible types of motion artefacts. Many techniques are described to avoid and to correct such artefacts by means of digital image processing. The most important tasks utilized in all these techniques are the construction of a 2D geometrical transformation, which refers to original 3D deformation, finding correspondence between two images using only grey-level information, and efficient computer application of this correspondence [Meijering, 2000; Wang et al., 1999]. The procedure of finding the correspondence or estimation of the level of similarity between two images is the most important part of the above mentioned techniques, which has been applied either in static or dynamic approaches. This work presents an application of a correspondence finding technique to the densitometric analysis performed for coronary flow estimation on the image of a moving artery segment in X-ray image sequences of coronary arteries (Fig. 1).
Fig. 1. Sequence of coronarographic images (every 6th image) from negative coronarographic film with visible contrast medium passing
www.intechopen.com

Object Tracking
268
Coronary image sequences are collected during coronarographic examination with X-ray contrast medium injection into coronary arteries for visualization purposes. Based on coronarographic sequences, both the morphometry of the arteries and the velocity of washing out of the indicator can be assessed [Nissen & Gurley, 1991; Goszczyńska & Rewicki, 2008]. For densitometric analysis the measurements of the image gray levels of the pixels forming a measuring window (called the cross-sectional line) are performed for each image of a coronarographic sequence. The measurements are performed along the same cross-sectional line with its adjacent background. Fig. 2 shows the cross-sectional line positioned on the left coronary artery (LCA).
Fig. 2. Fragments of images of the left coronary artery (LCA) from a coronarographic sequence during injection, filling and washing out of a contrast medium
a) b)
Fig. 3. Densitometric measurements performed on the segment of LCA: a) brightness profile Da (x) along the artery cross-sectional line and the background estimation line Db(x), d = d2-d1, which is the inner artery diameter, b) densitometric curve A(t) and its low pass version
Figure 3a shows the brightness curve Da(x) along the cross-sectional line (the measuring window) and the approximated background image intensity line Db(x), which is a straight line passing through two interpolation nodes [Goszczynska, 2005]. The Da(x) and Db(x) curves make it possible to calculate the A(t) curve (with a temporal resolution equal to the image acquisition rate) proportional to the amount of the indicator present under the measuring window (i.e. segment d1-d2, which is the inner diameter of the artery) at time t:
www.intechopen.com

Tracking of Moving Coronary Artery Segment in Sequence of X-Ray Images
269
( ) 2
1
( , )ln
( , )
da
bx d
D x tA t dx
D x t=⎛ ⎞= ⎜ ⎟⎝ ⎠∫ (1)
where x is the coordinate within the cross-sectional line. Fig. 3b presents an example of the densitometric curve A(t) for a sequence of coronarographic images. Densitometric curve A(t) is a basis for coronary flow estimation in indicator dilution method (Appendix A). In coronary flow estimation method based on indicator dilution presented in [Goszczynska & Rewicki, 2008] the number of frames needed for the calculation of the densitometric curve A(t) depends on contrast medium injection parameters and the coronary flow rate, being usually larger than 100. Sections 1.1 covers problems concerning data collection from coronarographic image sequences. In Section 1.2 the techniques of object movement estimation in image sequences are briefly described. Section 2 presents a proposed method of automatic tracking of an artery segment and Section 3 brings the results obtained with this method. The error of the method is estimated in Section 4, and other solutions for the problem of artery movement tracing are mentioned in Section 5.
1.1 Issues related to automatic drawing of the cross-sectional line The estimation of coronary blood flow, besides the difficulties concerning densitometric measurements, is affected by an additional problem of the cyclic movement of an artery segment or part of the myocardium. In the following sections we describe some issues related to the automatic and manual drawing of the artery cross-sectional line. In the manual case, the operator marks a cross-sectional line at the same point of the artery on each frame of the sequence. Unfortunately the phrase “the same point” is not precise due to at least two reasons:
• the myocardium movement results in the changes of the location and shape of the particular part of the artery which makes ensuring that the cross-sectional line on the frame is in the same place as in the previous frame difficult,
• the subjective nature of manual positioning of the same point, in the absence of some characteristic points, is very error-prone, even when the location and the shape of the object remain unchanged.
The above issues suggest that the process of drawing the cross-sectional line should be automated. The manual solution, besides being inaccurate, is also very exhaustive and boring for the operator - the cross-sectional line has to drawn on at least hundred of consecutive frames for a single measurement. For a clinical study of the flow measurement method presented in [Goszczynska & Rewicki, 2008; Goszczynska, 2008] the analysis of more than ten thousand images was required, and that is why certain type of automatic aid for cross-sectional line positioning has been strongly suggested. The algorithms performing the task mentioned above are described as movement correction
(the 3D transformation of each frame in sequence resulting in apparent lack of heart
movement) or tracing the object (relocation of the ROI, so that the particular detail of the
heart image – the artery fragment – is traced). The movement correction algorithms may be
applied to local areas of the whole frame. For heart images processing movement correction
for the whole frame is used to reduce the distortions made by patient movement. This
makes it impossible to precisely determine a mask frame within the DSA technique
[Meijering, 1999; Meijering, 2000].
www.intechopen.com

Object Tracking
270
The crucial difficulty preventing an effective incorporation of those algorithms to coronarographic frames analysis is a low densitometric contrast of the heart areas of interest. As an example an artery fragment image can be considered, across the whole sequence of the frames, also covering frames before contrast medium injection, and during contrast medium washing. In the instances when the area of interest covers only a part of the myocardium with tiny arteries, the frame analysis results in the analysis of the areas with nearly homogenous brightness, similar to the surrounding area. In such situation the movement detection can be performed indirectly, by tracing the movement of the nearest artery segment and applying a 2D interpolation. In the analysis of movement in frames containing the image of clearly distinguishable arteries another difficulty appears. Local examination of continuous movement for contour in the plane perpendicular to the image detection plane may be hardly possible. The local movement analysis of a continuous contour had first been described by Stumpf in 1911 [Hildreth, 1987]. Obviously the observed movement of an artery using 2D systems lacks component of the real movement perpendicular to the image plane (the observed movement is barely visible). Computing any corrections of the event on the basis of only single plane images is a difficult task.
1.2 Movement estimation techniques Artery segmentation and/or contour and central line detection methods are frequently implemented as a preliminary, but not mandatory step, in the movement detection algorithms described in literature [Coatrieux, 1995; Rus, 1995; Benayoun & Ayache, 1998; Konrad, 2000]. These methods can be divided into two categories:
• those limited to the area being a subject of segmentation only, tracing the artery assuming the continuity of the arteries tree structure, and
• those analyzing the complete image and sharpening the structures investigated, so that the background can be removed.
The first step of the analysis utilizing the methods of the first category is manual positioning of the point of the center line or on the contour of the element investigated. Then the operator proceeds in certain direction according to some criteria, and positions the next points of the line or contour. An example of such a criterion may be the maximum gradient of the grayscale. The methods of the second category are generally two types of filtration - linear and nonlinear.
The linear filters utilized for contour detection are based on testing two-dimensional
derivatives of the first degree (Sobel or Roberts operators) or the second degree (Marr-Hildreth
and Laplace operators) for the brightness change function within the selected neighborhood of
an indicated point or, in a more general way, on the operation analysis between the defined
operator mask and the neighborhood of a certain point. The adaptive linear filters, meaning
those in which a mask is adapted to the shape of the object tested, maximize the output value
for the central line of the object. The morphological filters belonging to the nonlinear filter class
are based on the comparison of the object tested with a structuring element. For segmentation
purposes, opening operation i.e. erosion and dilation is usually used. Some other methods
may be mentioned here like image decomposition by eigenvalues, a curvature analysis, vector
detection of the central line and the method of geometric moments.
The non-subtractive images, in opposite to subtractive ones are distinguished by high non-homogeneity of the background, which causes the artery segmentation to be a very difficult task. Due to this difficulty the main criterion for estimation of the results provided by filters
www.intechopen.com

Tracking of Moving Coronary Artery Segment in Sequence of X-Ray Images
271
is their ability to equalize the background level. The artery segmentation phase, setting their contours and central lines increases the effectiveness of movement detection methods implemented in the solutions, which are more sensitive to the structure and less sensitive to the brightness. Unfortunately it also increases the time of the movement analysis process. The local movement detection methods or movement measurement methods in images may be generally divided into two categories: an optical flow procedure, based on the brightness gradient analysis, and a template matching procedure, based on image similarity measures. The first procedure, suggested by Horn and Schnuck [Horn, 1981], is based on the continuity principle, also known in physics, in the movement analysis of the frame sequence is described by the formula:
0x y
I I Iv v
t x y
∂ ∂ ∂+ + =∂ ∂ ∂ (2)
where I is the brightness of the pixel tested, vx is the x component of the tested pixel velocity, and vy is the y component of the pixel tested velocity. The pixel velocity is determined according to the spatial and time resolution of the image tested sequence. By such processing we obtain the estimation of the apparent movement at every point of the frame. Application of differential techniques based on this method results in a relatively fast algorithm. There are two important conditions (considered disadvantages) that have to be met: the brightness of the moving object should be constant in time and the movement of the object between two consecutive frames should be relatively small. In the case of arteries, both of the mentioned conditions are not fulfilled for the entire frame sequence. Based on some presumptions, this technique may provide acceptable results for the estimation of the general myocardium shape change during its working cycle [Meunier et al, 1989]. In the next chapter we will describe a method of automatic movement trajectory estimation for an artery segment based on template matching.
2. Method
In the frame sequence studied for marked artery segment three stages can be indicated:
• before contrast medium appearance - Ta, • with contrast medium filling - Tc and
• the contrast medium wash-out period - Tp. The movement analysis of a fragment of the artery under investigation was divided into three steps:
• movement estimation for the marked fragment of the artery during contrast medium filling period Tc, • correction of faulty detections,
• movement estimation in stages Ta and Tp.
2.1 Estimation of movement of an artery segment in the indicator filling period Tc
Below a method of automatic data collection based on a popular block-matching technique is described [Gonzalez & Wintz, 1987; Rong, 1989; Maragos & Pessoa, 2000; Buzug, 1998]. This method was used in the similarity analysis of a few selected fragments of original frames sequence (without performing any pre-processing) with a chosen template, i.e. the fragment of an artery as it was shown on the frame where the arteries are clearly visible (which means the
www.intechopen.com

Object Tracking
272
end of the contrast medium injection phase). The sum of difference squares CSSD was used (R, S denotes the compared fragments of the images in the area of m, n dimensions):
1 1
2
0 0
( ( , ) ( , ))m n
S S Di j
C R i j S i j− −= =
= −∑ ∑ (3)
In order to find the area in frame I(t+1) which is similar to the given area R in frame I(t), the
area S is defined in frame I(t+1) with the same coordinates and size as the area R in frame
I(t). The next step is the area enlargement by values kmax and lmax which are greater or equal
to the maximum movement of the selected fragment between the two frames (Fig. 4).
Fig. 4. Determining the template and investigation windows
The search for the area in frame I(t+1) which is most similar to the chosen area R in frame
I(t) involves moving the reference area R on the magnified area S and computing the
coefficient of mutual correlation (0 ≤ k ≤ kmax, 0 ≤ l ≤ lmax):
1 1
0 0
1 1 1 12 2
0 0 0 0
( , ) ( , )
( , )
( , ) ( , )
m n
i j
m n m n
i j i j
R i j S i k j l
C k l
R i j S i k j l
− −= =
− − − −= = = =
∗ + +=
∗ + +∑ ∑
∑ ∑ ∑ ∑ (4)
The maximum value Cmax of this coefficient tells the location of the area most similar to the
reference area. The indexes k and l corresponding to the maximum value of the coefficient
determine the coordinates of the area investigated (Fig. 4).
Other measures of similarity have been also proposed:
• variance normalized correlation:
1 1
0 0
1 1 1 12 2
0 0 0 0
( ( , ) ) ( ( , ) )
( ( , ) ) ( ( , ) )
m n
R Si j
m n m n
R Si j i j
R i j I S i j I
C
R i j I S i j I
− −= =
− − − −= = = =
− ∗ −=
− ∗ −∑ ∑
∑ ∑ ∑ ∑ (5)
www.intechopen.com
Tracking of Moving Coronary Artery Segment in Sequence of X-Ray Images
273
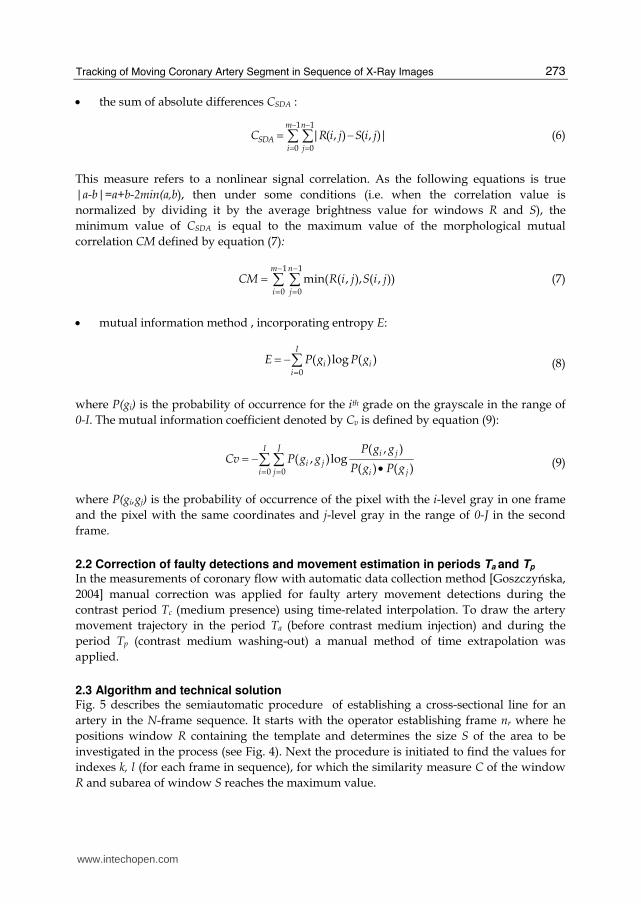
• the sum of absolute differences CSDA :
1 1
0 0
| ( , ) ( , )| m n
SDAi j
C R i j S i j− −= =
= −∑ ∑ (6)
This measure refers to a nonlinear signal correlation. As the following equations is true
|a-b|=a+b-2min(a,b), then under some conditions (i.e. when the correlation value is
normalized by dividing it by the average brightness value for windows R and S), the
minimum value of CSDA is equal to the maximum value of the morphological mutual
correlation CM defined by equation (7):
1 1
0 0
min( ( , ), ( , )) m n
i j
CM R i j S i j− −= =
= ∑ ∑ (7)
• mutual information method , incorporating entropy E:
0
( )log ( )I
i ii
E P g P g=
= −∑ (8)
where P(gi) is the probability of occurrence for the ith grade on the grayscale in the range of
0-I. The mutual information coefficient denoted by Cv is defined by equation (9):
0 0
( , )( , )log
( ) ( )
JIi j
i ji j i j
P g gCv P g g
P g P g= == − •∑∑ (9)
where P(gi,gj) is the probability of occurrence of the pixel with the i-level gray in one frame
and the pixel with the same coordinates and j-level gray in the range of 0-J in the second
frame.
2.2 Correction of faulty detections and movement estimation in periods Ta and Tp In the measurements of coronary flow with automatic data collection method [Goszczyńska,
2004] manual correction was applied for faulty artery movement detections during the
contrast period Tc (medium presence) using time-related interpolation. To draw the artery
movement trajectory in the period Ta (before contrast medium injection) and during the
period Tp (contrast medium washing-out) a manual method of time extrapolation was
applied.
2.3 Algorithm and technical solution Fig. 5 describes the semiautomatic procedure of establishing a cross-sectional line for an
artery in the N-frame sequence. It starts with the operator establishing frame nr where he
positions window R containing the template and determines the size S of the area to be
investigated in the process (see Fig. 4). Next the procedure is initiated to find the values for
indexes k, l (for each frame in sequence), for which the similarity measure C of the window
R and subarea of window S reaches the maximum value.
www.intechopen.com

Object Tracking
274
• image sequence reading n: 1 - N • pattern window R marking in image nr • searching window S marking in image nr • n=1 • for N images in sequence:
o finding of index kmax , lmax o determining the tables of index value: k[n]=kmax, l[n]=l max
• manual determining of the cross-sectional line l with p pixels of lenght in image nr: l[x1,y1...xp,yp] • calculation the coordinates of cross-sectional lines in N images in sequence:
o line_1[...] o line_n[x1-k[nr]+k[n], y1-l[nr]+l[n]... xp-k[nr]+k[n], yp-l[nr]+l[n] o line_N[...]
Fig. 5. Procedure for determining semiautomatic cross-sectional lines.
Fig. 6. User interface of YFlow software package
After the operator positioned the cross-section line l with k pixels in the frame nr, the procedure determining the coordinates of cross-sectional lines on N frames of the sequence is initiated according to the index table computed in the previous stage. The next stage is the automatic brightness data collection along the preset lines (Fig. 3a – line Da(x)). The MS Windows application YFlow (Fig. 6) implementing the automatic movement tracking of a chosen artery fragment using the method of template matching has been developed (the C++ language, authors: H. Goszczyńska and L. Kowalczyk) [Goszczynska et al., 2006].
www.intechopen.com

Tracking of Moving Coronary Artery Segment in Sequence of X-Ray Images
275
3. Results
Fig. 7 shows an example of a proper matching performed with mutual correlation method for all frames in the interesting range of frames, that is from the moment of contrast appearance until it is washed-out from the chosen artery segment.
1-25 26-50
51-75 76-100
Fig. 7. Parts of 100 images from a negative coronarographic film with an automatically marked cross-sectional line
There were seventy coronarographic sequences analyzed in [Goszczynska, 2004] (for 16 patients, 4-5 sequences per patient). A single case of faulty matching in the analyzed material was observed. In [Goszczynska, 2008], examples of mismatch of template R with window S in a coronarographic sequence (Fig. 8) and the comparison of the matching results calculated for the matching concordance measurements listed in Section 2.1 are presented (Fig. 9).
Fig. 8. Example of mismatch of template R with window S in image 59
www.intechopen.com
Object Tracking
276
100
120
140
160
1 15 29 43 57 71
mutual
nor mutual
morphologic
al
manual
30
50
70
90
1 15 29 43 57 71
mutual
nor mutual
morphological
manual
0
0,3
0,6
0,9
1 2 3
x
y
a) b) c)
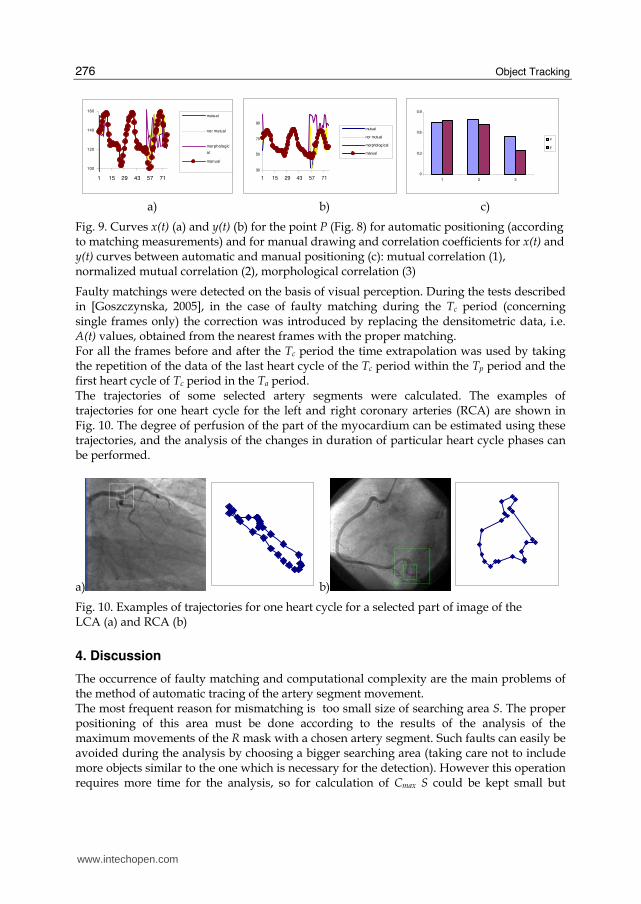
Fig. 9. Curves x(t) (a) and y(t) (b) for the point P (Fig. 8) for automatic positioning (according to matching measurements) and for manual drawing and correlation coefficients for x(t) and y(t) curves between automatic and manual positioning (c): mutual correlation (1), normalized mutual correlation (2), morphological correlation (3)
Faulty matchings were detected on the basis of visual perception. During the tests described in [Goszczynska, 2005], in the case of faulty matching during the Tc period (concerning single frames only) the correction was introduced by replacing the densitometric data, i.e. A(t) values, obtained from the nearest frames with the proper matching. For all the frames before and after the Tc period the time extrapolation was used by taking the repetition of the data of the last heart cycle of the Tc period within the Tp period and the first heart cycle of Tc period in the Ta period. The trajectories of some selected artery segments were calculated. The examples of trajectories for one heart cycle for the left and right coronary arteries (RCA) are shown in Fig. 10. The degree of perfusion of the part of the myocardium can be estimated using these trajectories, and the analysis of the changes in duration of particular heart cycle phases can be performed.
a) b)
Fig. 10. Examples of trajectories for one heart cycle for a selected part of image of the LCA (a) and RCA (b)
4. Discussion
The occurrence of faulty matching and computational complexity are the main problems of the method of automatic tracing of the artery segment movement. The most frequent reason for mismatching is too small size of searching area S. The proper positioning of this area must be done according to the results of the analysis of the maximum movements of the R mask with a chosen artery segment. Such faults can easily be avoided during the analysis by choosing a bigger searching area (taking care not to include more objects similar to the one which is necessary for the detection). However this operation requires more time for the analysis, so for calculation of Cmax S could be kept small but
www.intechopen.com

Tracking of Moving Coronary Artery Segment in Sequence of X-Ray Images
277
displaced slightly for each consecutive frame, based on the previously estimated movement. This solution, unfortunately falls into the same trap as that described below. The changing template algorithm has also been tested. As a primary template a fragment of an artery from the frame at the end of injection was selected. In such case, it works as a template only for comparison with the previous and the next frame. For the remaining frames the template is a result of the previous searching. Such an algorithm, intuitively better, still has a trap: due to an accidental mismatching the template may change entirely. Various solutions of this problem are proposed in the literature, mainly based on the reliability of the match [Guest, 1999]. Besides the problem of finding the best template or templates when choosing an optimal window size (m, n) containing the template and an optimal size of the searching area kmax and lmax, the detection faults may also be reduced by adopting a stronger criterion of similarity. The tests we have conducted showed that the best correlation coefficient is a normalized one. A morphological mutual correlation (a sharper matching peak) works better than a linear mutual correlation in detection of the area R within area S. Moreover, the morphological correlation algorithm (the sum of minima) is faster than the linear correlation algorithm (sum of products). Yet it is not determined by our tests what are the advantages of one algorithm over the other in regards to the precision of the matching. The results obtained with our method should be compared with those based on other criteria, when for example two templates are used or other similarity measures, i.e. those based on histogram analysis applied for the difference (subtraction) of two adjacent frames [Buzug et al., 1998]. Our algorithm inability to analyze fragments of the object with no characteristic morphological details such as bifurcations or curvatures is a known issue. The solution here would be the incorporation of 3D interpolation methods [Schrijver, 2002]. Regarding the problem of faulty matching correction a 2D interpolation for the template positioning based on the neighbor proper matching seems to be a better solution than the one suggested in the present study. Yet specifying the point for which the automatic template matching was performed, the process of replacing densitometric data was easier and led to a smaller error (this is due to the continuity of the process of changing the indicator concentration in the artery cross-section investigated). Controlling of the faulty matching can be computer-assisted, e.g. by comparing the values of indexes (ln,kn) obtained with the range limit, and finding the maximum movement of the artery fragment during the heart cycle, or by the analysis of movement direction, i.e. the direction of the vector defined by indexes (ln-1,kn-1) and (ln,kn). A proper matching for the Tp period is essential in the case when a part of the myocardium perfusion is estimated, which movement, on the basis of the closest artery displacement, is calculated. The degree of perfusion can be estimated from the image brightness changes of the part of the myocardium. The analysis of an artery movement trajectory may also allow to estimate changes in duration of the heart cycle phases and may serve as a basis for modeling epicardial strains [Young & Hunter, 1992]. In the next section described is the estimation of the error in the densitometric curve calculation caused by the use of the automatic procedure for data collection.
4.1 Method of error estimation The presented here application of the correspondence finding technique was used in coronary flow estimation by computer analysis of angiographic image sequences. For the
www.intechopen.com

Object Tracking
278
estimation of the error caused by the automatic artery tracking method one may define as the reference either the values of the coordinates obtained during manual cross-sectional line drawing or other values calculated during the estimation of the flow rate. The following options for the reference value were analyzed:
• the coordinates of the P1 and P2 ends of the cross-sectional line (Fig. 11a)
• the value of the A field defined by equation (1) (Fig. 11b)
• the value of the field under the curve A(t) as defined by equation (A11) (Fig. 11c) The Fig.11 below depicts the three above-mentioned values.
a) b) c)
Fig. 11. Examples of the reference values for estimation of the error caused by automatic cross-sectional line positioning (description in the text)
The following section discusses the analysis of the error caused by the automatic drawing of the cross-sectional line for the three above listed reference values.
4.1.1 The coordinates of cross-sectional line ends The coordinates of the cross-sectional line end values were used for the estimation of the slope angle of the positioned cross-sectional line and for the construction of the movement trajectory. For image sequence of RCA (Fig. 10b), the changes in the slope angle of a manually positioned cross-sectional line with the axis of the artery segment were measured. It allowed to determine the error level of the automatic analysis caused by the fact that for the implemented algorithm the cross-sectional line has the same slope. For the example
tested the difference between the two methods was not greater than 14° (Fig. 12a). There was also the influence of those changes on the length of the cross-sectional line for one pixel (Fig. 12b) calculated (with a unit being the pixel size).
a) b) c)
Fig. 12. The changes in the slope angle for the manually positioned cross-sectional line in the Tc period: a) the slope angle, b) the line length / (number of pixels – 1), c) a diagram of the influence of the cross-sectional line slope with the axis of an artery fragment on the line length in pixels.
www.intechopen.com

Tracking of Moving Coronary Artery Segment in Sequence of X-Ray Images
279
As presented in Fig. 12c for the three positions of the line its length expressed in pixels is constant. This is due to the line generation algorithm in the discrete space (for the simplest position of the artery axis on the digitized plane). Thus in our case the fact that a constant slope of the cross-sectional line is assumed has no influence on the calculation results, that is on the range of the integration in equation (1). Despite the number of pixels in the segment remaining constant, the pixels that create the segment are not identical, which is also a source of error. The only exception to the above results would be such a positioning of the cross-sectional line that the range of change of 14° covers the line drawn at 45° with the artery axis, which in practice means a wrong positioning of the cross-sectional line.
4.1.2 The value of field A The changes in the background of the artery fragment investigated make the value of the A field sensitive to the slope angle of the cross-sectional line and the artery axis and to the interpolation method of the background lines [Goszczynska, 2004]. Fig. 13 shows two densitometric curves for the same cross-section of a catheter filled with a contrast medium, computed with two background line interpolation algorithms. Although method I (Fig. 13a) gives larger errors compared with method II (Fig. 13b), the final result, that is for the field under the A(t) curve, is computed with significantly smaller error. The conclusion based on the above results was to use the calculation of the field under the A(t) curve as the reference values for the estimation of accuracy of automatic cross-sectional line positioning.
a) b)
Fig. 13. Densitometric curves A(t) and their low pass version for the same cross-sectional line of the catheter calculated for two background line interpolation algorithms: a) method I, b) method II
4.1.3 The area under the densitometric curve A(t) To estimate the error resulting from automatic data collection, densitometric analyses of the same artery segment were performed for automatic and manual positioning of the cross-sectional lines. The lines were positioned in three ways: automatically correctly (i.e. perpendicularly to the artery axis) on the pattern image, automatically purposely incorrectly (i.e. not perpendicularly to the artery axis) and manually correctly (Fig. 14).
a) b)
Fig. 14. The position of the artery cross-sectional line on the reference image: a) correct position (visual estimation), b) incorrect position (intentional)
www.intechopen.com

Object Tracking
280
There were analysed three widths of the cross-sectional line and three algorithms of the value A calculation [Goszczynska, 2004]. Fig. 15 presents the ranges of the calculated area values with marked maximum and minimum values. Two types of errors were assessed. Error of type 1 caused by the automatic data collection was defined as:
-max min
1min
c c
m
er = (10)
where maxc, minc are the maximum and minimum values of the area for “correct” lines, minm is the minimum area value for “manual” lines. Error of type 1 was estimated as less than 11%. This type of error is associated with the imperfection of the matching algorithm, e.g. when rotation is disregarded in equation (4). Error of type 2 (also called the total error of the flow estimation method) calculated for all the measurements performed was defined as:
-max min
2min
T T
T
er = (11)
where maxT , minT are the maximum and minimum values of the area for all lines. The estimation of this error, including both the previous error and the error caused by the operator, was assessed to less than 24%. The results of the error calculation of the maximum possible error for the results of the measurements are presented in Fig. 15.
Fig. 15. Ranges of values of the area ∑ )t(A for automatic correct, automatic incorrect and
manual positioning of the cross-sectional line
5. Conclusion
The algorithm described makes it possible to automatically collect the data used for the coronary blood flow measurement based on the analysis of a diluted indicator; though some occurrences of mismatch happen. The assessed error of the method did not exceed 11%. The algorithm of automatic data collection for the coronary flow estimation significantly accelerates the collection of the data without deteriorating the accuracy of the results obtained. Our method of automatic tracing of the measurement area not only reduces the manual
effort of the operator involved in positioning the cross-sectional line in the frame sequence,
but also provides a simple method of obtaining a densitometric curve with the time
resolution equal to that of the timeline of the sequence investigated. Most of the other
approaches to the measurements of coronary flow are based on the analysis of densitometric
curves calculated from the frames referring to a particular phase of heart cycle and are later
interpolated with a preset fitting curve. The presented algorithm makes it also possible to
www.intechopen.com

Tracking of Moving Coronary Artery Segment in Sequence of X-Ray Images
281
correct mismatching and incorporation of movement trajectories obtained to analyze the
sequence range in which there is no contrast medium in the artery segment investigated
(invisible in the frame). This permits perfusion estimation of the part of the myocardium
which surrounds the artery segment. For the artery (LCA and RCA) analyzed segments not
taking the rotations into consideration has no influence on the accuracy of the collected data
due to the relatively small (<45°) rotation movement of the cross-section investigated during
the heart cycle and the features of algorithms generating straight lines in the digitized space.
It seems that this relatively simple algorithm can be accepted even in routine clinical tests
due to a short time (few minutes) of the sequence analysis.
Some other ideas related to the solutions of the problem of effective artery segment tracing can be mentioned here:
• Inclusion of some searching strategy into the matching algorithm to reduce the number of positions of the template for comparison with a selected fragment [Orkisz, 1999].
• Investigation of the efficiency of the Fourier transform [Fei, 1999],
• Use of specialized signal processors [Bogorodzki, 2000],
6. Appendix A
Coronary flow estimation using densitometric measurements The calculation of the indicator concentration from a radiographic image is based on image
brightness measurements. The differences in brightness in X-ray images are caused by
spatially different attenuations of the X-ray beam by the tissue, as described by the Lambert-
Beer law:
1 0slI I e−= (A1)
where Io is the intensity of the monochromatic input beam, I1 is the intensity of the attenuated beam at a distance l [cm], and s is the linear X-ray attenuation coefficient [cm-1]. In angiographic images, morphometric and haemodynamic measurements are performed mainly on some parts of the image in the region of uptake of the contrast medium, i.e. in arteries or the myocardium filled with an X-ray indicator, whose attenuation coefficient s is significantly higher than that of the blood (the blood attenuation coefficient is neglected). The value of the distance l can be expressed as:
0
1 Il ln
Is= − (A2)
Assuming a linear relationship between the X-ray intensities I and I0 and the corresponding
image brightness D and D0 (image value without the indicator on the same site for the same
exposure parameters , i.e. a background value) respectively, the value Vpi of the indicator in
the volume along the distance l, viewed as an area of one pixel a [cm2], can be expressed as:
pi0
DV ln
D
a
s= − (A3)
For the region of interest (ROI) consisting of PROI pixels, VROIi, equation (A4) becomes a
summation calculated for each pixel with coordinates m,n ⊂ ROI:
www.intechopen.com

Object Tracking
282
ROIim,n ROI 0
a D(m,n)V =- ln
s D ( , )m n∈∑ (A4)
Introducing
ROIm,n ROI 0
D(m,n,t)A (t)=- ln
D ( , , )m n t∈∑ (A5)
an equation for the densitometric curve in the time domain is obtained. Equations (A4) and (A5) provide a basis for densitometric measurements performed on angiographic images. Using the Stewart-Hamilton equation from the indicator-dilution theory, the coronary blood
flow Q can be expressed as a ratio of the mass M [g] of the injected indicator to the area
under the curve of the indicator concentration c [g/cm3] versus time:
0
( )
MQ
c t dt∞=∫
(A6)
This equation was a basis for different measurement techniques, e.g. thermodilution, used
since the early eighties for densitometric purposes. The indicator concentration in the
volume VROI represented in the image by the region of interest ROI can be calculated as
follows:
ROIii
ROI ROI
V (t)m (t) c(t)
V Vg= = (A7)
where mi is the mass of the undiluted indicator of volume VROIi, g is the density of the
undiluted indicator [g/cm3]. Using equation (A4) for densitometric measurements, equation
(A7) can be rewritten as:
, 0
ROI
a I(m,n,t)ln
s I (m,n,t) c(t) g
V
m n ROI∈−
= ⋅∑
(A8)
and using equation (A5) we obtain
ROI
a( )
s c(t) gV
ROIA t−= ⋅ (A9)
Denoting
k R O IsV
ga= − (A10)
ROI0
A (t)Area dt∞= ∫ (A11)
www.intechopen.com

Tracking of Moving Coronary Artery Segment in Sequence of X-Ray Images
283
and using equation (A9), equation (A6) can be rearranged as:
0
0
ROI
ROI ROI
ROI
sVM M MQ k
a ga AreaA (t) A (t))dtsgV
∞∞
= = − ⋅ =−⋅ ∫∫
(A12)
Published in part in Machine Graphics & Vision (2008) 17: 69-90 (with permission).
7. References
Benayoun, S.; Ayache N. (1998). Dense Non-Rigid Motion Estimation In Sequence of Medical Images Using Differential Constraints. International Journal of Computer Vision 26(1), Kluwer Academic Publishers, 25-40.
Bogorodzki, P.; Wolak, T.; Piątkowski, A. (2000). Real Time Implementation of the Parametric Imaging Correlation Algorithms, 59th ICB Seminar on Recent Development in MR Imaging, Warsaw
Buzug, T. M.; Weese J.; Strasters K.C. (1998). Motion detection and motion compensation for digital subtraction angiography image enhancement, Philips J. Res. 51, 203-229
Buzug, T.M.; Weese J. (1998). Voxel-Based Similarity Measures for Medical Image Registration in Radiological Diagnosis and Image Guided Surgery, Journal of Computing and Information Technology – CIT 6, 2, 165-179.
Coatrieux, J.-L. et al. (1995). 2D et 3D Motion Analysis in Digital Subtraction Angiography. Computer Vision, Virtual Reality and Robotics in Medicine, (Ayache N. ed.), Springer, CVRMed
Fei, R.; Gui, L.; Merzkirch, W. (1999). Comparative study of correlation-based PIV evaluation methods, Machine Graphics & Vision, 8( 4), 572-578.
Gonzalez, R.C.; Wintz P. (1987). Digital Image Processing, Addison-Wesley Publishing Company.
Goszczyńska, H. (2004). Computer analysis of coronarographic images for coronary flow calculation (in Polish) PhD Thesis, Institute of Biocybernetics and Biomedical Engineering Polish Academy of Sciences, Warsaw
Goszczyńska H. (2008). Method for Densitometric Analysis of Moving Object Tracking in Medical Images Machine Graphics & Vision 17:69-90,
Goszczyńska, H.; Rewicki M. (2008). Coronary Flow Evaluation by Densitometric Analysis of Sequences of Coronarographic Images, Med Bio Eng Comput, 46:199-204, DOI 10.1007/s11517-007-0288-5
Goszczyńska, H; Kowalczyk L, Rewicki M.: Clinical study of the coronary flow measurements method based on coronagrographic image sequences. Biocybernetics and Biomedical Engineering (Polish Academy of Sciences) 26:63-73
Guest, E.; Fidrich, M.; Kelly, S.; Berr, E. (1999). Robust surface matching for registration, 3-D Digital Imaging and Modeling, 1999. Proceedings. Second International Conference on, 169 – 177
Hildreth, E. C. (1987). The analysis of visual motion: from computational theory to neural mechanism, Annual Review of Neuroscience, 10, 477-533.
Horn, B. K. P.; Schunck B. G. (1981). Determining Optical Flow, Artificial Intelligence 17, 185-203.
www.intechopen.com

Object Tracking
284
Konrad, J. (2000). Motion Detection and Estimation, Handbook of Image&Video Processing, ed. Al Bovik, Academic Press, San Diego, 207-225.
Maragos, P.; Pessoa, L.F.C. (2000). Morphological Filtering for Image Enhancement and Detection, in. Handbook of Image&Video Processing, ed. Al Bovik, Academic Press, San Diego, 108-110
Meijering, E. (2000). Image Enhacement in digital X-ray angiography, PhD thesis, University Medical Center, Utrecht.
Meijering, E.H.W.; Nissen, W.J. & Viergever, M.A. (1999). Retrospective motion correction in digital subtraction angiography: a review, IEEE Trans. Med. Imaging, 18(1), 2-21.
Meijering, E.H.W.; Zuiderveld, K.J. & Viergever, M.A. (1999). Image registration for digital subtraction angiography, Int. J. Comput. Vision, 31(2), 227-246
Meunier J. et al. (1989). Analysis of cardiac motion from coronary cineangiograms: Velocity field computation and decomposition, SPIE Vol.1090, Medical Imaging III, Image Formation
Nissen S.E. & Gurley J.C. (1991). Application of indicator dilution principles to regional assessment of coronary flow reserve from digital angiography. In: Reiber JHC and Serruys PW (eds) Quantitative Coronary Angiography. Kluver Academic Publishers 117:245-263
Orkisz, M.; Bourlion, M.; Gimenez, G.; Flam, T. A. (1999). Real-time target tracking applied to improve fragmentation of renal stones in extra-corporeal lithotripsy, Machine Vision and Applications, vol.11, 138-144
Rong J.H. (1989). Estimation et caracterisation du mouvement en coronarographie. These de doctorat, l’Universite de Rennes I
Rus J.C. (1995). The image processing handbook, CRC Press, Florida. Schrijver, M. (2000). Angiographic Image Analysis to Assess the Severity of Coronary Stenoses,
Twente University Press, Enschede, Netherlande. Wang, Y.; Erez Vidan, E.; Bergman, W. (1999). Cardiac Motion of Coronary Arteries: Variability
in the Rest Period and Implications for Coronary MR Angiography, Radiology, 213:751-758.
Young, A.A.; Hunter, P.J.; Smaill B.H. (1992). Estimation of epicardial strain using the motions of coronary bifurcations in biplane cineangiography, IEEE Trans. Biomed. Eng., 39 (5), 526-531
www.intechopen.com

Object TrackingEdited by Dr. Hanna Goszczynska
ISBN 978-953-307-360-6Hard cover, 284 pagesPublisher InTechPublished online 28, February, 2011Published in print edition February, 2011
InTech EuropeUniversity Campus STeP Ri Slavka Krautzeka 83/A 51000 Rijeka, Croatia Phone: +385 (51) 770 447 Fax: +385 (51) 686 166www.intechopen.com
InTech ChinaUnit 405, Office Block, Hotel Equatorial Shanghai No.65, Yan An Road (West), Shanghai, 200040, China
Phone: +86-21-62489820 Fax: +86-21-62489821
Object tracking consists in estimation of trajectory of moving objects in the sequence of images. Automation ofthe computer object tracking is a difficult task. Dynamics of multiple parameters changes representing featuresand motion of the objects, and temporary partial or full occlusion of the tracked objects have to be considered.This monograph presents the development of object tracking algorithms, methods and systems. Both, state ofthe art of object tracking methods and also the new trends in research are described in this book. Fourteenchapters are split into two sections. Section 1 presents new theoretical ideas whereas Section 2 presents real-life applications. Despite the variety of topics contained in this monograph it constitutes a consisted knowledgein the field of computer object tracking. The intention of editor was to follow up the very quick progress in thedeveloping of methods as well as extension of the application.
How to referenceIn order to correctly reference this scholarly work, feel free to copy and paste the following:
Goszczynska Hanna and Kowalczyk Leszek (2011). Tracking of Moving Coronary Artery Segment inSequence of X-Ray Images, Object Tracking, Dr. Hanna Goszczynska (Ed.), ISBN: 978-953-307-360-6,InTech, Available from: http://www.intechopen.com/books/object-tracking/tracking-of-moving-coronary-artery-segment-in-sequence-of-x-ray-images