TRACKING EVERY STUDENT’S LEARNING EVERY … · licensure exams and student math achievement gains...
57
WORKING PAPER 1 58 • December 201 6 What's in a Teacher Test? Assessing the Relationship Between Teacher Licensure Test Scores and Student STEM Acievement and Course-Taking Dan Goldhaber Trevor Gratz Roddy Theobald NATIONAL CENTER for ANALYSIS of LONGITUDINAL DATA in EDUCATION RESEARCH A program of research by the American Institutes for Research with Duke University, Northwestern University, Stanford University, University of Missouri-Columbia, University of Texas at Dallas, and University of Washington TRACKING EVERY STUDENT’S LEARNING EVERY YEAR
Transcript of TRACKING EVERY STUDENT’S LEARNING EVERY … · licensure exams and student math achievement gains...

W O R K I N G P A P E R 1 5 8 • D e c e m b e r 2 0 1 6
What's in a Teacher Test? Assessing the
Relationship Between Teacher Licensure Test
Scores and Student STEM Acievement and
Course-Taking
D a n G o l d h a b e r
T r e v o r G r a t zR o d d y T h e o b a l d
NATIONAL CENTER for ANALYSIS of LONGITUDINAL DATA in EDUCATION RESEARCH
A program of research by the American Institutes for Research with Duke University, Northwestern University, Stanford University, University of Missouri-Columbia, University of Texas at Dallas, and University of Washington
TRACKING EVERY STUDENT’S LEARNING EVERY YEAR

What’s in a Teacher Test? Assessing the Relationship Between Teacher Licensure Test Scores and Student STEM Achievement and Course-Taking
Dan Goldhaber American Institutes for Research
Trevor Gratz
University of Washington Bothell
Roddy Theobald American Institutes for Research

Contents Acknowledgements…………………………………………………………………….……..ii Abstracts……………………………………………………………………………….……..iii
I. Introduction……………………………………………………. ……………………..1
II. Background……………………………………………………. …………….……….2
III. Data and Summary Statistics……...…………………………………………………..7
IV. Analytic Approach…………………………………………………………………...17
V. Results…………………………... …………………………………………….…….25
VI. Conclusion……………………………. …………………………………….…….....33
References…………………………………………………………………………….……...35
Tables.………………………………………………………………………………….….....41 Figures……………………………………………………………………………………......46

ii
Acknowledgements This work is supported by the National Science Foundation (grant #1555678) and by the National Center for the Analysis of Longitudinal Data in Education Research (CALDER) (IES grant #R305C120008). The views expressed in this paper do not necessarily reflect those of the American Institutes for Research or the University of Washington Bothell.
We wish to thank Gerhard Ottehenning, Vanessa Quince, and Melanie Rucinski for research assistance, as well as James Cowan, Eric Larson, and participants at the 2016 NSF STEM PI Convening, 2016 AERA Conference, and 2016 APPAM Conference for helpful comments.
CALDER working papers have not undergone final formal review and should not be cited or distributed without permission from the authors. They are intended to encourage discussion and suggestions for revision before final publication.
CALDER • American Institutes for Research 1000 Thomas Jefferson Street N.W., Washington, D.C. 20007 202-403-5796 • www.caldercenter.org

iii
What’s in a Teacher Test? Assessing the Relationship Between Teacher Licensure Test Scores and Student STEM Achievement and Course-Taking Dan Goldhaber, Trevor Gratz, & Roddy Theobald CALDER Working Paper No. 158 December 2016
Abstract
We investigate the relationship between teacher licensure test scores and student test achievement and high school course-taking. We focus on three subject/grade combinations—middle school math, ninth-grade algebra and geometry, and ninth-grade biology—and find evidence that a teacher’s basic skills test scores are modestly predictive of student achievement in middle and high school math and highly predictive of student achievement in high school biology. A teacher’s subject-specific licensure test scores are a consistent and statistically significant predictor of student achievement only in high school biology. Finally, we find little evidence that students assigned to middle school teachers with higher basic-skills test scores are more likely to take advanced math and science courses in high school.

1
An educated, innovative, motivated workforce—human capital—is the most precious resource of any country in this new, flat world. Yet there is widespread concern about our K–12 science and mathematics education system, the foundation of that human capital in today's global economy (National Academies of Sciences, 2007).
I. INTRODUCTION
There is significant policy focus on the human capital of the nation's STEM teachers. This
is motivated both by a desire to improve STEM outcomes for students in K–12 schools and
college (e.g., President's Council of Advisors on Science and Technology, 2010) and by the vast
body of empirical evidence showing the importance of teacher quality for student achievement
(Aaronson et al., 2007; Goldhaber & Hansen, 2013; Rivkin et al., 2005).1 One way that states try
to ensure a high-quality teacher workforce is by requiring teacher candidates to pass licensure
tests, often of both their basic skills and content knowledge, as a requirement for receiving a
teaching license. Although several studies (e.g., Clotfelter et al., 2007; Goldhaber & Hansen,
2010; Goldhaber, 2007) find modest positive correlations between teacher performance on
licensure exams and student math achievement gains in elementary grades, there is little
evidence on whether licensure tests provide a useful “signal” of the future quality of secondary
STEM teachers. Moreover, there is no existing evidence about whether teacher licensure test
scores are predictive of longer-term student outcomes like course taking in STEM fields.
In this paper we use data from Washington State to investigate whether STEM teachers
with higher licensure test scores are also more effective at improving student outcomes. We
focus on three subject/grade combinations—middle school (seventh–eighth grade) math,
1 This focus on the human capital of STEM teachers is not new. In fact, there exists an extensive body of literature tracking the progress that the nation is (or is not) making toward having a high-capacity STEM teacher workforce. Unfortunately, the indicators often used to evaluate this progress—e.g., teacher credentials and degree type—have not been found to be highly predictive of student achievement (e.g., Wilson et al., 2001).
2
ninth-grade algebra and geometry, and ninth-grade biology—and estimate whether a teacher’s
score on licensure tests required to teach these subjects are predictive of student test
achievement and high school course taking. To our knowledge this is one of the first papers to
assess the predictive validity of teacher licensure test scores in secondary math and science
classrooms, and the first to investigate the potential longer-term impacts of exposure to
teachers with different licensure test scores.
We find that basic skills licensure test scores are modestly predictive of student
achievement in middle and high school math (though only statistically significant in middle
school math) and highly predictive of student achievement in high school biology. The
relationships between teacher candidate performance on subject-specific licensure test scores
and student performance are similar in magnitude to the relationships for basic skills tests,
though less consistently statistically significant. Finally, we find little evidence that students
assigned to middle school math teachers with higher basic-skills test scores are more likely to
take advanced math and science courses in high school.
The paper proceeds as follows. In section 2, we provide background and context for this
study. We introduce our data and discuss summary statistics in section 3, outline our analytic
models in section 4, and describe our results in section 5. We then offer some concluding
thoughts in section 6.
II. BACKGROUND
There is overwhelming policy interest in improving student outcomes in STEM fields,
exemplified by a Report to the President (President's Council of Advisors on Science and

3
Technology, 2010) stating that “STEM education will determine whether the United States will
remain a leader among nations and whether we will be able to solve immense challenges in
such areas as energy, health, environmental protection, and national security” (p. v). This focus
on STEM outcomes has in turn prompted calls to improve the quality of the nation’s STEM
teacher workforce (e.g., White House Office of Science and Technology Policy, 2012), since
teacher quality has repeatedly been shown to be one of the most important school-related
influences on student achievement (Aaronson et al., 2007; Coleman et al., 1966; Rivkin et al.,
2005; Rockoff, 2004). Unfortunately, relatively few teacher credentials (like degree level or
licensure status) appear to predict whether teachers affect student outcomes in ways that are
detectible by student test performance (e.g. Aaronson et al., 2007; Goldhaber and Brewer,
1997, 2000; Harris and Sass, 2011).2
That said, there is evidence that more nuanced measures of teachers’ content
knowledge predict student achievement. Monk and King (1994), for instance, find that the
number of undergraduate mathematics and physical science courses a teacher takes is
positively related with how well students perform on math and science tests, respectively.
Goldhaber and Brewer (1997) find that teachers with Baccalaureate and Master’s degrees in
math are more effective at improving the math performance of their students. Hill et al. (2005)
find that a survey-based measure of teachers’ content knowledge for teaching is predictive of
student achievement gains in first and third grades. Boyd et al. (2009) find that first-year
2 For instance, most studies find no relationship between generic teacher degree type (e.g., masters vs. bachelor’s) and student achievement in mathematics (e.g., Monk & King, 1994; Aaronson et al., 2007).
4
elementary teachers from teacher education programs that require mathematics courses are
more effective at improving student performance math.
One way that states try to ensure that prospective teachers have sufficient content
knowledge for teaching is through requirements that they pass various licensure tests designed
to assess both basic skills and subject area knowledge. Licensure tests have a long history,
dating back to the 1930s when the first national licensure exam, the National Teacher
Examination, was developed (Ravitch, 2003). Today all but one state require teachers to pass
various licensure tests to participate in the public school labor market.
Public debates about teacher licensure often center on the extent to which traditional
licensure exams are a useful screen as opposed to an inefficient barrier to entry to the teacher
workforce (e.g., Angrist & Guryan, 2008). Advocates argue that teacher licensure tests are an
important quality screen needed to professionalize teaching, often comparing them to tests
taken by lawyers and doctors before they are certified to practice (Maeroff, 1985). On the other
side, critics often point to empirical evidence that licensure tests may negatively impact efforts
to diversify the teacher workforce (e.g., Goldhaber & Hansen, 2010).
Beyond their use in teacher licensing (as a “pass/fail” screen), teacher licensure test
scores are typically not used for any additional personnel decisions (e.g., hiring or professional
development). Indeed, test developers actively discourage the use of licensure tests for
decisions other than licensure itself, despite the fact that teacher test scores may be predictive
of student achievement away from the high-stakes cut-point used to determine employment
eligibility.3 In fact, empirical evidence at the elementary level shows positive and significant
3 The test developer (Pearson) for the WEST-B (a basic skills test used in Washington state), for instance, states:

5
relationships between teachers' performance on some licensure exams and student test scores
throughout the teacher test score distribution (Clotfelter et al., 2006, 2007; Goldhaber &
Hansen, 2010; Goldhaber, 2007; Hendricks, 2014). Goldhaber (2007), for instance, analyzes
data from North Carolina and finds that having a teacher who passed the Praxis II tests rather
than one who failed is correlated with an increase in a student's mathematics achievement of
about 6% of a standard deviation, and that a one standard deviation increase in a teacher’s test
score is predictive of an increase in student mathematics achievement of about 3% of a
standard deviation. Most recently, Hendricks (2014) documents increases in student
achievement associated with the movement of a teacher with a high licensure score into the
student’s grade and school.
Most of the existing evidence about the predictive validity of licensure tests for student
achievement is focused at the elementary level. But the relative importance of teachers'
content knowledge may increase as teachers are expected to teach more complex material in
higher grades (Appleton, 2013). This is supported by results in Sass (2015), who finds that
teachers who entered Florida’s teaching workforce by passing a professional teaching
knowledge exam and a subject area exam administered by ABCTE are more effective than the
average teacher in the state, and that this result is strongest when the sample is restricted to
students in grades 6-10.
To our knowledge, Clotfelter et al. (2010) is the only existing evidence about the
predictive validity of traditional teacher licensure test scores at the secondary level, but due to
“The subtest scores indicated on this report are only for the purposes of admission to state-approved teacher preparation programs and for teacher certification. They are NOT intended to be used for employment decisions, other college admissions decisions, or any other purpose.” http://www.west.nesinc.com/Content/Docs/WESTB_ScoreReport_backer.pdf

6
data limitations, they use a very different methodology than prior work at the elementary
level.4 Specifically, Clotfelter et al. (2010) estimate a student fixed-effects model that relies on
within-student, cross-subject comparisons (e.g., they find that students in high school math
classrooms score higher on a subject test relative to tests in other subjects when they have a
teacher in that subject who has high licensure test scores relative to their teachers in other
subjects).5 In the next section, we describe the data that will allow us to build on this existing
work and estimate models predicting student achievement that rely on cross-student, within-
subject comparisons (e.g., do students in secondary math classrooms score higher on math
tests, all else equal, when they have a math teacher who has higher licensure test scores than a
math teacher with lower licensure test scores?) and produce separate estimates for different
course levels and subjects.
In addition to concerns about student STEM achievement, there is also considerable
policy interest in pushing more students towards STEM pathways. As noted by the President's
Council of Advisors on Science and Technology (2010), “It is important to note that the problem
is not just a lack of proficiency among American students; there is also a lack of interest in STEM
fields among many students” (p. vi). There is some survey evidence relating teacher quality to
future student interest in STEM fields (Gross, 1988), suggesting that focusing on STEM teachers
may be fruitful.
4 Sass (2015) also finds that teachers who entered Florida’s teaching workforce by passing a professional teaching knowledge exam and a subject area exam administered by ABCTE are more effective than the average teacher in the state, and this result holds when the sample is restricted to students in grades 6-10. 5 Clotfelter et al. (2010) consider the average of a teacher’s normalized licensure test scores across all tests the teacher has taken.

7
The impact of teachers on future student STEM pathways could come in one of two
forms. First, there is clear evidence that higher-achieving students are more likely to pursue
STEM pathways (Gottfried et al., 2016), so teachers may have an indirect effect on the future
STEM interest of their students through their impacts on student achievement. Second, there is
a growing literature documenting that teachers have significant impacts on student non-
cognitive outcomes independent of their impacts on student achievement (e.g., Blazar & Kraft,
2016; Gershenson, 2016; Jackson, 2012; Petek & Pope, 2016), so teachers may similarly have a
direct effect on the future STEM interest of their students. We test each of these hypotheses in
our investigation of the relationship between teacher licensure test scores and future student
course taking in STEM fields.
III. DATA AND SUMMARY STATISTICS
III.I Data
This study combines four databases, all maintained and supplied by the Washington
State Office of the Superintendent of Public Instruction (OSPI), to construct one panel data set
containing student-teacher-classroom-year observations. These databases are the Washington
State Credentials Database, the Washington State S-275 personnel report, the Comprehensive
Education Data and Research System (CEDARS), and the State Testing database.
The Washington State Credentials Database contains a complete history of scores on
the state's teacher licensure tests. In this study, we focus on two tests that have been required
for teacher licensing in Washington State in recent years. Since 2002, prospective teachers in
Washington have had to pass the Washington Educator Skills Test-Basic (WEST-B)—an
assessment of basic skills in reading, writing, and mathematics—as a requirement for admission

8
into teacher education programs. The test is designed to reflect knowledge and skills described
in textbooks, the Washington Essential Academic Learning Requirements, curriculum guides,
and licensure standards. Because the state accepts a number of alternative tests that meet the
WEST-B testing requirement for receiving a teaching credential,6 only 82% of new teachers
from 2006 through 2015 have taken the WEST-B. For these individuals, we observe their scores
on the math, reading, and writing subtests for each time they took the test.
From 2010 to 2014, all teacher education program graduates also had to pass the
Washington Educator Skills Test-Endorsements (WEST-E), a subject knowledge test for
individual teaching endorsements, as a requirement for receiving a teaching credential.7
Different WEST-E exams were required for teachers to become certified in different subject
areas and grade levels, but every credentialed teacher had to pass at least one of these tests as
a requirement for licensure. For this study, we focus on scores on four WEST-E tests observed
most frequently for teachers in our sample: Mathematics, Middle Level Mathematics (MLM),
Science, and Biology.
The licensure exam data set is linkable to the state's S-275 database, which contains
information from the state's personnel-reporting process. It includes a record of all certified
employees in school districts and educational service districts (ESDs), their place(s) of
employment, annual compensation, and demographic characteristics. The data set also
6 Passing scores for Praxis I, California Basic Educational Skills Test (CBEST), or the Pearson NES Essential Academic Skills test, as well as scores on the SAT and ACT above certain cutoffs (e.g., 515 on the math SAT) can be submitted as alternatives to the WEST-B exam (RCW 28A.410.220 & WAC 181-01-002). 7 Prior to the WEST-E, the state required a passing score on the Praxis-II tests. Beginning in September 2014, the state replaced some WEST-E tests with assessments from the National Evaluation Series (NES). For parsimony, we only consider WEST-E scores in this paper.

9
includes highest degree earned and experience, which we consider as other potential
predictors of teacher effectiveness.
Since the 2009–10 school year, teachers can be linked to the students in their
classrooms using a unique classroom ID in the state's CEDARS database.8 For the 2009–10
through 2014–15 school years, the CEDARS database contains information on individual
student background variables including gender, race/ethnicity, learning disability status, and
free or reduced-priced lunch eligibility, as well as participation in the following programs:
gifted/highly capable; limited English proficiency (LEP); and special education. These student-
level variables are used as control variables in all our models. From this data set, we are also
able to create indicators for different course “tracks” (basic, average, or advanced).9
Student test score data come from the State Testing database. The database contains
annual student test scores on the Measures of Student Progress (MSP) exams for 2009–10
through 2013–14 in reading (Grades 3–8), math (Grades 3–8), and science (Grades 5 and 8), as
well as high school End-of-Course (EOC) exams in Algebra, Geometry, and Biology.10 For 2014–
15, the state transitioned to the Smarter Balance Assessment (SBA) for Grades 3–8 in both
math and reading. Our student achievement analysis focuses on middle school math (seventh
8 CEDARS data includes fields designed to link students to their individual teachers, based on reported schedules. However, limitations of reporting standards and practices across the state may result in ambiguities or inaccuracies around these links. 9 Tracks are classified by the use of course names and grade levels in the CEDARS schedule files. In middle school, courses in a “basic” track are courses below grade level and math courses labeled “Basic”, “Remedial”, or “LAP”. Courses in an “average” track are all general math courses at grade level, while courses in an “advanced” track are math courses above grade level or courses at or above algebra 1. In high school algebra, geometry, and biology, courses are considered in an “average” track unless labeled as “Honors”, “Advanced”, “Accelerated ”, or “IB”, in which case they are considered in an “advanced” track, or are labeled as “Basic”, “Support”, and“Remedial”, in which case they are considered in a “basic” track. 10Approximately one-third of Washington state schools serving Grades 3–8 participated in a pilot of the SBA in the 2013–2014 school year, and the state did not collect student test scores from these schools. Students from these schools therefore are not included in the 2013–14 data (because they are missing current-year test scores) or the 2014–15 data (because they are missing prior-year test scores).

10
and eighth grade), ninth-grade math (algebra and geometry), and ninth-grade biology, all
grades in which both current and same-subject prior-year test scores are available.
The range of years we can consider varies across these different subject/year
combinations. Because sixth through eighth grade math test scores are available for the entire
range of years that students may be linked to teachers, 2009–10 through 2014–15, and scores
from the predecessor to the MSP exam—the Washington Assessment of Student Learning
(WASL)—are also available for the 2008–09 academic year (i.e., a prior-year math score for
2009–10), we can estimate models for middle school math in all years of available CEDARS data
(2009–10 through 2014–15). On the other hand, the Algebra and Geometry EOC exams were
introduced in the 2010–2011 academic year, and the Biology EOC exam started in the 2011–12
school year. Thus we can only estimate models for ninth-grade algebra and geometry for 2010–
11 through 2014–15, and for ninth-grade biology for 2011–12 and 2014–15. Across the
different years, subjects, and tests, our analytic datasets include 204,549 student-teacher-year
observations (156,210 unique students and 1,687 unique teachers).11
We also use the CEDARS data to create several variables that describe student course
taking in STEM fields in high school. First, we identify students who take at least one advanced
math and science courses in high school by considering all math and science courses taken by
students between ninth and twelfth grade as reported in the CEDARS data. We define high
school courses as “advanced” following the procedure described in Gottfried (2015), which
11 We make a number of additional restrictions to the data set to derive these analytic datasets. Specifically, we only include student/teacher/year combinations in which the student has valid current and prior-year test scores, received instruction from a single teacher in that subject and year, and (in the case of ninth-graders) was enrolled in the course aligned with the EOC test we consider (Algebra, Geometry, or Biology). Likewise, for each combination of grade level and teacher licensure test, we only consider student/teacher/year combinations in which the teacher has at least one valid licensure test score.

11
relies on a taxonomy outlined in Burkham et al. (2003).12 In our primary results, advanced math
courses include trigonometry, statistics, pre-calculus, and higher courses, while advanced
science courses include chemistry, physics, and higher courses. We also experiment with other
definitions of advanced courses, including the full taxonomy described in Burkham et al. (2003).
Finally, we calculate the total number of advanced math courses and advanced science courses
each student took over the course of their time in high school.
III.II Summary Statistics
The grades and subjects considered in this paper vary considerably both in terms of the
number and characteristics of the students and teachers. Table 1 presents student-year-level
summary statistics for each of the grade level and subject combinations considered in this
analysis. The first column of Table 1, for example, provides summary statistics for all seventh
and eighth-grade students in the analytic dataset whose math teacher has at least one valid
WEST-B Math score. We standardize all student test scores within grade and year, so the means
in column 1 of Table 1 for “Lagged Math” and “Lagged Reading” mean that students in this
sample scored about 10% of a standard deviation higher on last year’s tests than the average
student in the same grade and year. The other summary statistics in column 1 are broadly
representative of the demographics of public school students in Washington state, about 50%
of whom are eligible for free/reduced priced lunch and about 25% of whom are
underrepresented minorities (American Indian, Black, or Hispanic).
12 At the high school level, courses are classified via state course codes and state course names. In cases where a course is not mentioned in Burkham et al. (2003) we use out best judgment to determine which level a course aligns with, and delete observations in schools with all missing state course names.

12
Columns 2 and 3 of Table 1 illustrate some important differences between the ninth-
grade algebra/geometry sample and the ninth-grade biology sample. Specifically, far fewer
students in the ninth grade are enrolled in biology than in one of the ninth-grade math courses,
and these students tend to be both more advantaged and higher performing.13 Roughly 24% of
students take biology in 9th grade compared to about 88% of students who take algebra or
geometry. This is likely because higher-performing students often take biology (and the biology
EOC) in 9th grade rather than wait until 10th grade when students are required to take the
biology EOC14. That students enrolled in different courses appear quite different from each
other along observable dimensions suggests the need to carefully consider the implications of
tracking (Jackson, 2014) for the estimated achievement and course-taking models described
below.
In Table 1 (and in the analytic models described in the next section), teacher licensure
test scores come from the first time each teacher took the test and are standardized across all
teacher candidates who have ever taken these tests. For example, the mean for “WEST-B
Math” in column 1 of Table 1 implies that the average student in the WEST-B Math middle
school sample has a teacher who scored over 50% of a standard deviation higher on their first
WEST-B Math test than the average teacher candidate who took this test.
Our decision to standardize licensure test scores across all years of data is important
because, as shown in Figure 1, average scores on all three WEST-B tests have been increasing
steadily over time. These trends could be explained by the increased availability and use of test
13 The most common science courses taken in 9th grade are “Physical Science” (39.9%) followed by “General Science” (24.2%) and then “Biology” (23.8%). The most common math courses taken in 9th grade are “Algebra” (61.1%), “Geometery” (28.1%), and “General Math” (15.5%). 14 www.k12.wa.us/assessment/StateTesting/BiologyEnd-of-CourseExams.aspx

13
preparation materials, a drop in test difficulty, or an increase in the average qualifications of
teachers. The first two explanations would suggest that we should only standardize teacher test
scores within years (since the time trends would have nothing to do with the qualifications of
different cohorts of teacher candidates), while the latter explanation would suggest that we
should standardize teacher test scores across years (as the time trends would reflect
differences in average qualifications across test cohorts).
We test these explanations directly by estimating predictive validity models (described
in the next section) with and without teacher licensure test-year (or “cohort”) fixed effects. The
year in which candidates take the WEST-B is highly predictive of the performance of their
students (F = 36.20), and there is little evidence that the within-cohort relationship between
WEST-B scores is any different than the cross-cohort relationship (t = 0.19).15 This suggests that
changes in average WEST-B scores over time do reflect true differences in teacher candidate
quality. This is consistent with evidence from other studies showing that average SAT scores of
prospective teachers have increased over the past two decades (Goldhaber & Walch, 2014;
Lankford et al., 2014),16 recent cohorts of prospective teachers have higher undergraduate
GPAs than their predecessors (Gitomer, 2007), and new teachers are now coming from more
competitive undergraduate institutions than in past years (Lankford et al., 2014). Finally, the
developer of the WEST-B and WEST-E (Pearson) describes the tests as “criterion-referenced,”
meaning that they are “designed to measure a candidate's knowledge and skills in relation to
15 We note that recent cohorts of teachers appear to be more effective conditional on other observed covariates, which does not support the narrative that the “war on teachers” (e.g., Gamson, 2015) is having detrimental impacts on the teacher workforce. 16 The increase in SAT scores documented in Lankford et al. (2014) is 0.10 standard deviations from 2002 to 2010, which is not as dramatic as the 0.19 standard deviation increase in WEST-B scores over the same time period.

14
an established standard (a criterion), rather than in relation to the performance of other
candidates.”17 For these reasons, we standardize licensure test scores across all years in our
primary analysis.18
Means of the standardized teacher licensure test scores in Table 1 permit some
comparisons across different kinds of teachers, but we summarize the complete distribution of
scores for each sample with kernel density plots of WEST-B scores (on the original scoring scale)
for six mutually exclusive groups of test takers in Figure 2. The first three groups are considered
in this study: middle school math teachers, ninth-grade algebra and geometry teachers, and
ninth-grade biology teachers.19 For comparison, we also include elementary teachers in tested
grades and subjects (analogous to teachers considered in prior studies of teacher licensure
tests), all other teachers (i.e., those who are in the workforce but not in one of these other
samples), and all test takers who never become teachers in Washington State public schools.
The figure shows that ninth-grade teachers tend to score higher on all three WEST-B tests than
middle school math teachers, and both groups of teachers tend to score dramatically higher on
the WEST-B Math test than elementary teachers, other teachers, and test takers who are never
observed in the teaching workforce.
Figure 3 shows similar kernel density plots for WEST-E tests; again, we include the
WEST-E tests required for elementary teachers for comparison purposes. The first two panels of
Figure 3 show that ninth-grade algebra and geometry teachers tend to score considerably
17 https://www.west.nesinc.com/PageView.aspx?f=GEN_AboutTheTests.html 18 We also experiment with models that consider test scores standardized within year, and the results are qualitatively similar (results available from authors upon request). 19 For the purposes of this figure, teacher type was determined by the number of students in each subject–grade combination taught in the analytic sample or elementary sample.

15
higher than middle school math teachers on both WEST-E Math tests, though both groups
perform better, on average, than test takers who are not observed in the state’s teaching
workforce.20 For the other WEST-E tests, teachers in our samples do not perform much better,
on average, than other teachers or test takers not observed in the workforce. The fact that
ninth-grade teachers tend to score higher on both the WEST-B tests and WEST-E tests
compared to other teachers is not surprising given the high degree of correlation between
these tests; for instance, the correlation between the WEST-B math test and the WEST-E Middle
Level Math test is 0.59.21
The “Cut Score” line in each plot within Figures 2 and 3 illustrates that, while the passing
score is nominally set to the same scale score (240) for all tests, some of these licensure tests
appear much more difficult to pass than others. Figures 4 and 5 show overall passing rates for
these tests across all teacher candidates in Washington state and compares these passing rates
to those in other states (California, Florida, and Michigan) that report these numbers. Generally
speaking, the passing rates on the WEST-B tests are much higher than the passing rates for
basic skills licensure tests in these other states, while the passing rates on the WEST-E tests
considered in our primary analysis are more in line with (and even lower than in some cases)
the passing rates for subject-specific licensure tests in these other states. Figures 4 and 5
illustrate that, unless the underlying skillsets of teacher candidates in these states are wildly
different, cut scores for passing licensure tests are set at very different levels in different
settings.
20 39.6% of teacher candidates who fail the WEST-E Math on their first test administration eventually pass it, while another 31.8% eventually pass the WEST-E MLM test. 21 Correlations between the licensure tests we consider range from 0.44 (between the WEST-E Biology and Middle Level Math test) to 0.80 (between the WEST-E Math and the Middle Level Math test).

16
We can also directly compare the difficulty of different WEST-E tests by comparing the
WEST-E performance of candidates who took different WEST-E tests but had similar scores on
the WEST-B. We find that candidates tend to perform 16–20 points (or about one standard
deviation) higher on the Elementary Education WEST-E tests than candidates with similar
WEST-B scores perform on the Middle Level Math, Science, or Biology WEST-E exam, and 40
points (or about two standard deviations) higher than candidates with similar WEST-B scores
perform on the Mathematics WEST-E test. These differences in test difficulty have important
policy implications that we discuss in the conclusion.22
As a final exploration, we explore the extent to which there is non-random sorting of
different students to teachers with different licensure test scores. Table 2 focuses on the
middle school sample, and presents summary statistics of students assigned to a teacher in
different quartiles of the distribution of WEST-B Math scores (where Q1 in column 1 represents
the lowest quartile). We see clear evidence that students with higher prior performance and in
advanced tracks are more likely to be assigned to teachers in the highest quartile of WEST-B
scores; for example, the average student assigned to a top quartile teacher scored over 20% of
a standard deviation higher on the previous year’s math test than the average student assigned
to a bottom quartile teacher. As discussed in Section 4c, this evidence of non-random sorting
strongly informs the analytic approach we describe in the next section and the robustness
checks outlined in Section 5.
22 These comparisons are calculated from predicted values from separate regressions of each individual WEST-E score against WEST-B scores in math, reading, and writing.

17
IV. ANALYTIC APPROACH
IV.I Student Achievement Models
Our student achievement models can be situated within a larger literature that attempts
to separate the impact of various interventions (including teacher characteristics) from other
variables that influence student test performance.23 Following the existing literature about the
predictive validity of teacher licensure tests at the elementary level (e.g., Clotfelter et al., 2007;
Goldhaber & Hansen, 2010; Goldhaber, 2007), we estimate variants of the following student
achievement model for each subject/grade combination (middle school math, ninth-grade
algebra and geometry, and ninth-grade biology):
𝑌𝑌𝑖𝑖𝑖𝑖𝑖𝑖𝑖𝑖𝑖𝑖 = 𝛽𝛽0 + 𝛽𝛽1𝑌𝑌𝑖𝑖,𝑖𝑖−1,𝑖𝑖−1′ + 𝛽𝛽2𝑋𝑋𝑖𝑖𝑖𝑖𝑖𝑖 + 𝛽𝛽3𝑍𝑍𝑖𝑖𝑖𝑖 + 𝛽𝛽4𝑆𝑆𝑆𝑆𝑆𝑆𝑆𝑆𝑆𝑆𝑖𝑖 + 𝜀𝜀𝑖𝑖𝑖𝑖𝑖𝑖𝑖𝑖𝑖𝑖 (1)
In equation (1), 𝑌𝑌𝑖𝑖𝑖𝑖𝑖𝑖𝑖𝑖𝑖𝑖 is the test score (MSP, SBA, or EOC) of student i in grade g, subject
s, and year t, while in teacher j’s classroom. 𝑌𝑌𝑖𝑖,𝑖𝑖−1,𝑖𝑖−1′ is a vector of student i's prior test scores
in reading, mathematics, and (for ninth-graders) science. The student test scores in both 𝑌𝑌𝑖𝑖𝑖𝑖𝑖𝑖𝑖𝑖𝑖𝑖
and 𝑌𝑌𝑖𝑖,𝑖𝑖−1,𝑖𝑖−1′ are standardized by test, grade, and year across all test takers. Therefore, the
units of the coefficients on the right hand side of equation (1) are standard deviations of
student performance (relative to other scores on the same test in the same grade and year).
𝑋𝑋𝑖𝑖𝑖𝑖𝑖𝑖 is a vector of student covariates for student i, in grade g, and year t, which includes
indicators for student race/ethnicity, gender, free or reduced-priced lunch eligibility,
23 In the case of individual teacher evaluation, estimates from these models—commonly called “value-added models”, or VAMs—have been shown to be unbiased despite the presence of student sorting (Chetty et al. 2014a; Kane & Staiger, 2008), and a recent review of the literature surrounding value-added methodologies concluded, “To date, the studies that have used the strongest research designs provide compelling evidence that estimates of teacher value-added from standard models are not meaningfully biased by student-teacher sorting along observed or unobserved dimensions” and that “there is not any direct counter evidence indicating that value-added estimates are substantially biased” (Koedel et al., 2015).

18
gifted/highly capable, limited English proficiency (LEP), special education, and learning disabled.
In some specifications, we include a vector 𝑍𝑍𝑖𝑖𝑖𝑖 of additional teacher covariates that includes
indicators for teacher experience level in year t and an indicator for whether or not the teacher
possesses an advanced degree in year t. We estimate the model in equation (1) by ordinary
least squares (OLS) and cluster the error terms 𝜀𝜀𝑖𝑖𝑖𝑖𝑖𝑖𝑖𝑖𝑖𝑖 at the teacher level to account for
correlation between the errors of students taught by the same teacher.
In our primary specifications of the model in equation (1), 𝑆𝑆𝑆𝑆𝑆𝑆𝑆𝑆𝑆𝑆𝑖𝑖 is the licensure test
score of teacher j standardized across all years of test takers. The coefficient 𝛽𝛽4 in these
specifications can be interpreted as the extent to which continuous licensure test scores
provide a “signal” of future teacher effectiveness (i.e., the expected increase in student
performance associated with a one standard deviation increase in the licensure test score of
teacher j). We can also mitigate concerns about nonlinearities and ceiling effects in test scores
(see Figure 2) by estimating additional specifications that replace 𝑆𝑆𝑆𝑆𝑆𝑆𝑆𝑆𝑆𝑆𝑖𝑖 with a vector of
indicators for the quartile of the distribution of test scores for teachers in that sample (Q2, Q3,
or Q4, with the reference category being Q1) that the test score of teacher j falls into.24 In these
specifications, 𝛽𝛽4 is actually a vector of coefficients, each of which represents the expected
increase in a student's test score associated with having a teacher with a test score in the
second, third, or fourth quartile (respectively), relative to having a teacher with a test score in
the lowest quartile.25
24 We calculate quartiles within each sample because very few teachers in the analytic sample scored in the bottom quartile of the overall distribution of WEST-B Math scores. 25 As a further check for nonlinearities, we also estimate models that replace the licensure scores with a teacher fixed effect and plot the resulting value-added estimates against teacher licensure scores.

19
We estimate a number of different specifications of the model in equation (1). We first
estimate a specification without any teacher covariates, so teachers are compared to all other
teachers in the sample, and then a specification that adds teacher covariates, so teachers are
compared to all other teachers in the sample with the same experience and degree level. We
also estimate a specification that controls for student “track” (basic, regular, or advanced), so
comparisons are only made within the same types of courses; note that this makes
comparisons between teachers and students in the same track but across schools.
Finally, we consider a number of specifications that add various fixed effects intended to
account for potential sources of bias (discussed in Section 4c). We estimate one specification
with school fixed effects (so teachers are compared to other teachers in the sample in the same
school), and another with school-by-year fixed effects (so teachers are compared to other
teachers in the same school and year). Finally, we follow Jackson (2014) and Protik et al. (2013)
and estimate models that explicitly control for student tracking within schools by including
school-year-grade-track fixed effects. These specifications only make comparisons within the
same track within the same grade, year, and school.26
As a preliminary check on the extent to which the different model specifications above
control for non-random sorting of students to teachers by student performance and teacher
licensure test scores, we estimate the specifications of the model in equation (1) but using
student prior performance as the outcome variable (and dropping it from the list of predictor
26 We also experiment with the models described in Hendricks (2014) that are identified by the movement of teachers between school-grade-year-subject combinations. However, our relatively sparse data on licensure test scores means that these cells do not capture the average licensure test score for all teachers within the cell, so within-cell changes could be due to true changes in teacher skills or changes in the composition of teachers with an observed licensure test score.

20
variables). We find that teacher WEST-B scores are a statistically-significant predictor of student
prior performance in all specifications in middle school math, but are not consistently
statistically-significant in ninth-grade algebra and geometry or ninth-grade biology. This
suggests that there is more non-random sorting by student performance and teacher licensure
test scores in our middle school sample than in our high school sample. This is likely because
our high school samples focus on students in specific courses (i.e., Algebra, Geometry, and
Biology) because the high-school tests are course-specific, and much of the non-random sorting
at the high school level is likely to be between different kinds of courses.
IV.II Student Course Taking Models
To investigate the relationships between teacher licensure test scores and STEM course
taking in high school, we first estimate variants of the following model predicting whether
seventh grade students in 2009-2010 and eighth grade students in 2009-10 and 2010-11 take
an advanced math or science course in high school27:
𝑓𝑓�𝑝𝑝𝑖𝑖𝑖𝑖𝑖𝑖𝑖𝑖𝑖𝑖� = 𝛾𝛾0 + 𝛾𝛾1𝑌𝑌𝑖𝑖,𝑖𝑖−1′ + 𝛾𝛾2𝑋𝑋𝑖𝑖𝑖𝑖𝑖𝑖 + 𝛾𝛾3𝑍𝑍𝑖𝑖𝑖𝑖 + 𝛾𝛾4𝑆𝑆𝑆𝑆𝑆𝑆𝑆𝑆𝑆𝑆𝑖𝑖 + 𝛾𝛾5𝑆𝑆𝑖𝑖 + 𝜀𝜀𝑖𝑖𝑖𝑖𝑖𝑖𝑖𝑖 (2)
In equation (2), 𝑝𝑝𝑖𝑖𝑖𝑖𝑖𝑖𝑖𝑖 is an indicator for whether student i who has teacher j in eighth
grade in year t takes an advanced course in high school k, while 𝑆𝑆𝑖𝑖 is the number of advanced
math or science courses offered by high school k (to control for differential opportunities to
take advanced STEM courses for students in different high schools). All other control variables
are the same as the model in equation (1), and we also consider similar specifications for
27 We focus on seventh and eighth graders in these years because we observe all four years of high school for these students.

21
equation (2) as those described above. For example, we estimate models in which 𝑆𝑆𝑆𝑆𝑆𝑆𝑆𝑆𝑆𝑆𝑖𝑖 is the
licensure test score of teacher j standardized across all years of test takers. The coefficient 𝛾𝛾4 in
these specifications can be interpreted as the expected increase in the probability that student i
takes an advanced course in subject s in high school associated with a one standard deviation
increase in the licensure test score of teacher j. Our primary specifications of the model in
equation (2) is a linear probability model (i.e., 𝑓𝑓�𝑝𝑝𝑖𝑖𝑖𝑖𝑖𝑖𝑖𝑖𝑖𝑖� = 𝑝𝑝𝑖𝑖𝑖𝑖𝑖𝑖𝑖𝑖𝑖𝑖 ) because this allows us to
isolate teacher effects by grade as outlined by Chetty et al. (2014b), but we also experiment
with logistic regression models (i.e., 𝑓𝑓�𝑝𝑝𝑖𝑖𝑖𝑖𝑖𝑖𝑖𝑖𝑖𝑖� = log � 𝑝𝑝𝑖𝑖𝑖𝑖𝑖𝑖𝑖𝑖𝑖𝑖1−𝑝𝑝𝑖𝑖𝑖𝑖𝑖𝑖𝑖𝑖𝑖𝑖
�) and find qualitatively similar
results.
Finally, we estimate variants of a model predicting the number of advanced math and
science courses taken by the same cohorts of seventh and eighth-grade students once they get
to high school:
𝑓𝑓(𝐶𝐶𝑖𝑖𝑖𝑖𝑖𝑖𝑖𝑖𝑖𝑖) = 𝛼𝛼0 + 𝛼𝛼1𝑌𝑌𝑖𝑖,𝑖𝑖−1,𝑖𝑖−1′ + 𝛼𝛼2𝑋𝑋𝑖𝑖𝑖𝑖𝑖𝑖 + 𝛼𝛼3𝑍𝑍𝑖𝑖𝑖𝑖 + 𝛼𝛼4𝑆𝑆𝑆𝑆𝑆𝑆𝑆𝑆𝑆𝑆𝑖𝑖 + 𝛾𝛾5𝑆𝑆𝑖𝑖 + 𝜀𝜀𝑖𝑖𝑖𝑖𝑖𝑖𝑖𝑖 (3)
In equation (3), 𝐶𝐶𝑖𝑖𝑖𝑖𝑖𝑖𝑖𝑖 is the number of advanced STEM courses taken in high school by
student i who has teacher j in eighth grade in year t. As with the model in equation (2), our
primary specifications of the model in equation (3) is an OLS model (i.e., 𝑓𝑓�𝐶𝐶𝑖𝑖𝑖𝑖𝑖𝑖𝑖𝑖𝑖𝑖� = 𝐶𝐶𝑖𝑖𝑖𝑖𝑖𝑖𝑖𝑖𝑖𝑖 ) so
we can isolate teacher effects by grade (Chetty et al. (2014b), but we also experiment with
Poisson regression models for count data (i.e., 𝑓𝑓�𝑝𝑝𝑖𝑖𝑖𝑖𝑖𝑖𝑖𝑖𝑖𝑖� = log�𝑝𝑝𝑖𝑖𝑖𝑖𝑖𝑖𝑖𝑖𝑖𝑖� ) and find qualitatively
similar results.
An important issue in both sets of course-taking models is modeling the error terms in
equations (2) and (3). While in the achievement models our primary concern was with

22
dependence between students taught by the same teacher (so we clustered errors at the
teacher level), in the course-taking models we are concerned both with dependence between
students taught by the same teacher and dependence between students who attend the same
high school. We therefore cluster the error terms 𝜀𝜀𝑖𝑖𝑖𝑖𝑖𝑖𝑖𝑖𝑖𝑖 in equations (2) and (3) at both the
teacher and high school level using two-way cluster robust standard errors described in
Cameron & Miller (2015).
IV.III Potential Sources of Bias
We conclude this section by discussing four potential sources of bias in the estimates
from the models described above. First, as we discuss in Section 3, candidates can submit
scores on other tests (e.g., PRAXIS or SAT) to satisfy the state’s WEST-B requirement, and not all
teacher candidates go on to take the WEST-E to get a teaching credential in Washington. In
each case, this means that a nonrandom subset of teacher candidates in Washington State has
taken each test. This could lead to bias if the relationship between licensure test scores and
student outcomes for the group of test takers is different than it would have been for non-test
takers. We have no way to account for the potential source of bias, so all results reported in
this paper are only generalizable to the population of candidates who take these licensure
tests.
Second, teacher candidates who take these tests are non-randomly selected into the
public teaching workforce, raising the concern that candidates with a given licensure score who
enter the workforce are not representative of all teacher candidate with that score. It is not

23
clear that there is a convincing way to account for this potential source of bias.28 Indeed, it is
quite plausible that there is considerable selection in the case of tests with low passing rates
(such as the WEST-E tests shown in Figure 3), given that teacher candidates who fail the test the
first time may be more likely to re-take the test and ultimately enter the workforce if they have
a greater commitment to teaching.29 If these individuals become more effective teachers than
teacher candidates with similar WEST-E scores but who did not enter the workforce would have
been had they entered the workforce, this would cause a downward bias in the estimated
relationships between WEST-E scores and student outcomes. We are less concerned about
sample selection bias in the WEST-B results because so few teachers in the analytic samples
failed any of these tests.
Third, ample evidence suggests that teacher candidates who enter the teaching
workforce are non-randomly sorted into different schools and classrooms (e.g., Clotfelter et al.,
2005; Goldhaber et al., 2015b; Kalogrides and Loeb, 2013).30 While this sorting on observables
does not bias our estimates (since we explicitly control for a suite of observables), our
estimates will be biased if there are unobserved variables that are correlated both with
teachers’ licensure scores and the student outcomes we investigate. A broad literature has
considered this potential source of bias in estimating the impacts of individual teachers on
28 For instance, while attempts have been made to account for sample selection of this type in prior work in Washington State (e.g. Goldhaber et al., 2014, 2016), there is not an obvious instrumental variable in this context that could be used to predict workforce entry for teacher candidates. 29 Along observable dimensions, candidates who pass the WEST-E Math test on the first attempt scored 31% of a standard deviation higher on the WEST-B math test than candidates who fail the first time and eventually pass, and 56% of a standard deviation higher on the WEST-B math test than candidates never pass the test. 30 In particular, prior work in Washington (Goldhaber et al., 2015b) has shown that low-performing students are more likely to be assigned to teachers with low WEST-B scores than higher-performing students in other districts, in other schools in the same district, and—particularly in middle school math—in other classrooms within the same school. This is borne out in the specification checks described in Section 4a.

24
student test performance (e.g., Bacher-Hicks et al., 2014; Chetty et al., 2014a; Jackson, 2014;
Kane & Staiger, 2008; Kane et al., 2013; Koedel et al., 2015; Rothstein, 2010, 2014) and
generally suggests that the student achievement models described above are sufficient to
control for non-random sorting, though the evidence is more tenuous at the higher grade levels
considered in this paper. Jackson (2014), for instance, illustrates that the prevalence of ability
tracking at the high school level can bias the estimates from models that do not explicitly
account for these tracks.
We aim to minimize and/or bound this potential source of bias in four ways. First, the
specifications with school and school-by-year fixed effects compare students and teachers
within the same school, and thus minimize the impact of sorting across different schools.
Further, the models that include school-year-grade-track fixed effects help account for
potential bias due to non-random sorting across tracks within schools. Third, we follow
Clotfelter et al. (2006) and Horvath (2015) and estimate models restricted to schools in which
students are distributed relatively equitably across classrooms according to observable
characteristics, on the assumption that these schools are also the least likely to non-randomly
sort students to classrooms along unobserved dimensions. Finally, we follow the approach of
Altonji et al. (2005, 2008) and estimate the relative amount of sorting on unobservables that is
required to explain the relationships we find. Our general conclusion (discussed in Section 5c) is
that, given the extent of non-random sorting in middle school grades, our results in middle
school may be more sensitive to this potential source of bias than the high school results.
A final potential source of bias arises from non-random teacher attrition. A relationship
between licensure tests, unobserved teacher traits associated with effectiveness, and the

25
propensity of teachers to leave the profession would bias our findings.31 We check for this
potential source of bias in two ways. First, we estimate models predicting teacher attrition as a
function of experience, degree level, prior estimated effectiveness, WEST-B scores, and an
interaction between prior effectiveness and WEST-B scores. If there exists a relationship
between attrition, licensure tests, and teacher effectiveness, we would expect a significant
interaction term. However, we do not find evidence that teachers with different WEST-B scores
are any more or less likely to leave the workforce as a function of their prior estimated
effectiveness. We also estimate models solely for first-year teachers (before any teachers have
left the workforce), and generally find stronger relationships between licensure test scores and
student outcomes.32 This could reflect the decreasing importance of teachers’ preservice
experiences and skills as they gain teaching experience (see Goldhaber et al., 2013), but could
also suggest that non-random teacher attrition biases the estimates discussed in the next
section downwards.
V. RESULTS
Before describing the results relating teacher licensure test scores to student
achievement in secondary STEM subjects, we note two peripheral estimates from the models in
equation (1) that lend context to our findings. First, our models predict that students taught by
a first-year teacher will score 0.08 standard deviations lower in middle school math, 0.07
standard deviations lower in high school math, and 0.02 standard deviations lower in ninth-
31 Goldhaber et al. (2011) find that teachers who leave the profession tend to have higher licensure scores but lower prior estimates of value-added. See also Feng and Sass (2016) and Hanushek et al. (2016). 32 This parallels findings from Goldhaber (2007).

26
grade biology, all else equal, than students taught by teachers with 5 or more years of
experience. Second, when we estimate models with a teacher fixed effect and calculate the
standard deviation of these estimated teacher effects (the teacher “effect size”), we find that
the teacher effect size is 0.17 in middle school math, 0.39 in high school math, and 0.29 in
ninth-grade biology.33
V.I Licensure Tests and Student Achievement
Table 3 shows the estimated relationships between different licensure test scores and
student performance in middle school math (Panel A), ninth-grade algebra and geometry (Panel
B), and ninth-grade biology (Panel C).34 We first focus on the results for the basic-skills tests
(the WEST-B Math). The results in middle school math and ninth-grade algebra and geometry
are broadly consistent with the findings from the existing literature discussed in Section 2, and
quite robust across different specifications of our student achievement model, though only the
results in middle school math are statistically significant. Specifically, a one standard deviation
increase in a teacher’s WEST-B Math score is correlated with a 0.01-0.03 standard deviation
increase in student math performance. Thus, the expected increase in student performance
associated with a one standard deviation increase in the teacher’s WEST-B score is roughly
equivalent to one-seventh to one-third of the expected increase in student performance
associated with having a teacher with 5 or more years of experience relative to a first-year
33 These statistics come from Empirical Bayes shrunken VAM estimates. The middle school effect size is comparable to earlier estimates from the elementary level in Washington State (Goldhaber et al., 2012), while the high school effect sizes are about twice as large as comparable effect sizes reported in Mansfied (2015). The effect sizes calculated from a model with school fixed effects is 0.32 for middle school math, 0.45 for 9th grade Algebra and Geometry, and 0.27 for 9th grade Biology teachers. 34 We also estimate models that consider other WEST-B tests, separately and jointly, the mean WEST-B score across subtests, and the maximum WEST-B score rather than the first WEST-B score. These results are available from the authors upon request.

27
teacher. Though we would characterize these relationships as modest, they are quite
comparable to relationships reported at the elementary level (e.g., Goldhaber, 2007) and
greater than the only reported relationship at the secondary level (Clotfelter et al., 2010).35
We plot estimated effects on student achievement by quartile of teacher WEST-B Math
score in Figure 6, illustrating that the expected difference in student performance associated
with having a teacher who scored in the top quartile of the WEST-B Math relative to the bottom
quartile is 0.05 standard deviations of student performance in middle school math.36 This is
roughly one-third of a standard deviation of teacher performance in these grades. On the other
hand, the comparable different in ninth-grade algebra and geometry is just 0.01 standard
deviations of student performance (see Figure 6).37
Perhaps surprisingly, the relationships in Table 3 between WEST-B Math scores and
student performance in ninth-grade biology are considerably stronger than in other grade
levels; a one standard deviation increase in a teacher’s WEST-B Math score is correlated with a
.072 to .161 standard deviation increase in student biology performance.38 As illustrated in
Figure 6, the expected difference in student performance associated with having a teacher who
scored in the top quartile of the WEST-B Math relative to the bottom quartile is 0.19 standard
deviations of student performance, which is almost four times as large as the comparable
35 The coefficient on teacher test score from the base model in Clotfelter et al. (2010) is 0.0071. 36 The quartile models estimated for Figure 6 include the same suite of of covariates in the models estimated in column 3 of Table 3. 37 Estimates from a student fixed-effects model in middle school math are broadly consistent with these results (available from the authors upon request). 38 The stronger results in biology may suggest that the lagged science test score does not adequately control for prior performance when compared to the lagged math score in the 9th grade Algebra and Geometry models. By comparing the correlation between prior performance and performance on the EOC, we do not find this to be the case. The correlation of a student’s lagged science test and his or her EOC biology exam is 0.759, and the correlation between a student’s lagged math score and their EOC algebra exam is 0.633. Similarly, the correlation between a student’s lagged math score and their EOC geometry exam is 0.627.

28
relationship in middle school. To put this in context, this means that the expected difference in
student biology performance associated with having a teacher in the top quartile of the WEST-B
Math distribution relative to the bottom quartile is about two thirds a standard deviation of
teacher effectiveness in ninth-grade biology, or roughly equivalent to the expected difference
associated with having a teacher at the 75th percentile of the ninth-grade biology value-added
distribution relative to an average teacher.
We now turn our attention to the estimated relationships between WEST-E (the subject-
specific licensure tests) scores and student performance in middle and high school math. The
estimates in Panel A of Table 3 give somewhat mixed evidence about the relationship between
WEST-E Middle-Level Math (MLM) scores and student performance in middle school math
(note that we do not consider MLM scores in high school math due to low sample sizes).
Specifically, the relationships between WEST-E MLM scores and student performance tend to
be statistically significant (and comparable in magnitude to the WEST-B estimates) when
comparisons are made within schools, but not in the models without school or school-by-year
fixed effects. The estimates in Panels A and B of Table 3 show little evidence that WEST-E Math
scores are predictive of student performance in middle school math or ninth-grade algebra and
geometry, although the magnitude of the cross-school estimates for ninth-grade algebra and
geometry—shown in the margin plots in Figure 7—are positive, relatively large, and marginally
statistically significant.39
Finally, Panel C of Table 3 presents estimates of the relationships between each of the
WEST-E tests that teachers can pass to teach high school biology (the Science and Biology tests)
39 We do not present results for the WEST-E MLM test in ninth-grade algebra because of small sample sizes.

29
and student biology performance in ninth grade. Echoing the results for the WEST-B Math, the
relationships between these test scores and student performance in ninth-grade biology tend
to be large and statistically significant. The magnitudes of these coefficients are striking; for
example, the expected increase in student test scores associated with a one standard deviation
increase in a Biology teacher’s WEST-E Science score is over one third of a standard deviation of
teacher effectiveness in ninth-grade biology (.29). Figure 7 reinforces that, as for the WEST-B
Math, the WEST-E tests are a much stronger predictor of student performance in ninth-grade
biology than in the other grade levels we consider.
V.II. Licensure Tests and Student High School Course Taking
We next consider relationships between teacher licensure test scores and the
probability that students take advanced STEM courses in high school by variants of the linear
probability model described in equation (2). The estimates from these models are presented in
Table 4. In Panel A, we consider the relationship between the WEST-B score of the student’s
middle school math teacher and the probability that the student takes an advanced math
course in high school, while Panel B considers the probability that the student takes an
advanced science course in high school. Since none of these coefficients are statistically
significant, our interpretation is that the results in Table 4 provide little to no evidence of a
relationship between middle school teachers’ licensure test scores and the probability that
their students take an advanced math or science course in high school.
Finally, Table 5 explores estimated relationships between a middle school math
teacher’s WEST-B math test and the number of advanced science or math courses taken in high
school by their students from the OLS regression in equation (3). Though basic skills test scores
30
are marginally predictive of taking more advanced math courses when school-year and school-
year-track controls are included, the general conclusion from Table 5 is that there is also little
evidence of a relationship between middle school teachers’ licensure test scores and the
number of advanced math or science courses that their students take in high school.
V.III Extensions and Robustness Checks
We pursue a number of extensions and robustness checks to the results described in
Sections 5a and 5b. First, given that the achievement results for the subject-specific WEST-E
tests are quite similar to the results for the basic skills WEST-B tests, a natural question is
whether WEST-E test scores provide any more signal about future teacher effectiveness than is
already contained in the WEST-B test scores. To investigate this, we estimate models of the
relationships between WEST-E scores and student performance in middle and high school math
controlling for each teacher’s WEST-B scores. In middle school math, estimates from models
based on within-school comparisons suggest that WEST-E MLM and WEST-E Math test scores
do provide additional signal about future teacher effectiveness beyond WEST-B scores. That
said, this does not appear to be the case in high school math, and perhaps more surprisingly, it
does not appear to be the case when we investigate relationships between WEST-E scores and
student performance in ninth-grade biology controlling for each teacher’s WEST-B scores. This
suggests that the large and statistically significant relationships between WEST-E scores and
student performance in ninth-grade biology can largely be explained by the relationships with
WEST-B scores.
In another extension of the achievement results in Table 3, we consider models that
interact teacher licensure test scores with different student characteristics (e.g., prior

31
performance, participation in FRL, student URM indicator) to test whether licensure test scores
are differentially predictive of student performance for different types of students.40 We find
little evidence of differential effects by student prior performance or demographics. Likewise,
to test whether the predictive power of subject-specific licensure tests for student achievement
might matter more depending on the track of the course, we estimate models that interact
teacher licensure test scores with the track indicators discussed in Section 3. Due to sample size
limitations, we were able to estimate these models only for middle and high school math
classes. We find little evidence of differential impacts between course track and subject-specific
licensure exams.
As discussed in Section 4c, we also perform several robustness checks of the
achievement results designed to investigate whether the estimates described above may be
biased by the non-random assignment of students to teachers (Rothstein, 2009, 2010). Because
both robustness checks require large sample sizes, we restrict these checks to the WEST-B
models. We first pursue the approaches of Clotfelter et al. (2006) and Horvath (2015), who
create “apparently random samples” by dropping students and teachers in schools that display
considerable tracking of students to classroom along observed dimensions.41 This approach
works well in the ninth-grade samples (both algebra/geometry and biology), and we find that
all statistically-significant coefficients reported in Table 3 are still statistically-significant when
the models are estimated in the apparently random sample. This suggests that the ninth-grade
40 These estimates are available from the authors upon request. 41 In our application of the Clotfelter et al. (2006) approach, we drop all schools in which at least one Chi-square test rejects the null hypothesis that classrooms within schools do not predict student gender, race, FRL status, or an indicator for scoring above the mean on the prior year test. In our application of the Horvath (2015) approach, we drop all schools in which an F-test rejects the null hypothesis that classrooms within schools do not predict student prior performance. In both approaches, we reject at the α = 0.05 level.

32
results are not driven solely by the nonrandom sorting of students to classrooms.
Unfortunately, as discussed in Section 4a, apparent within-school sorting of students with low
prior performance to teachers with low WEST-B scores is more prevalent in the middle school
math sample than in the ninth-grade samples. As a consequence, both the Clotfelter et al.
(2006) and Horvath (2015) approaches drop at least 90% of the middle schools in the sample,
meaning that the apparently random sample in middle school is not large enough to make a
meaningful comparison to the results in Table 3.42
As a second robustness check we adopt the approach of Altonji et al. (2005, 2008), who
calculate the relative amount of selection on unobservables required to explain a given effect.
Given that this approach requires a dichotomous treatment variable, we first create a binary
indicator for whether a teacher scored in the lowest quartile of the distribution of WEST-B
scores, and estimate the model in equation (1) with this indicator as the variable of interest
(𝑆𝑆𝑆𝑆𝑆𝑆𝑆𝑆𝑆𝑆𝑖𝑖).43 We then use the Altonji et al. (2005, 2008) approach to estimate that the magnitude
of sorting on unobservables would need to be at least 13% of the magnitude of the observed
sorting on observables to explain the estimated relationship between WEST-B Math scores and
student math performance reported in Table 3.44 While this may seem like a small percentage,
the magnitude of sorting on observables is quite large in middle school grades due to the
relationship between teacher WEST-B scores and student prior performance, so there would
42 Both the Clotfelter et al. (2006) approach and the Horvath (2015) approach drop 91% of middle schools. 43 The estimated coefficient of interest in this model is 0.025. 44 This estimate uses the specification from column 3 of Panel A of Table 3. For reference, the corresponding estimates from the analogous specification is 50% in ninth-grade Algebra/Geometry and 70% in ninth-grade Biology. See Altonji et al. (2008), pp. 348-349, for a succinct summary of this methodology.

33
still need to be considerable non-random sorting on unobserved variables that are not captured
by prior performance to explain away the middle school math finding.
VI. CONCLUSIONS
The results from this study suggest several broad conclusions and directions for future
research. First, the achievement findings from middle and high school math about the modest,
positive relationships between WEST-B Math scores and student math performance reinforce
conclusions from the existing literature (e.g., Clotfelter et al., 2007; Goldhaber, 2007;
Hendricks, 2014) that basic skills licensure test scores provide a significant, if modest, signal
about future math teacher effectiveness. Given the very limited evidence about pre-service
predictors of future teacher effectiveness (e.g., Harris & Sass, 2011), this suggests that basic
skills test scores could be used for reasons beyond the pass/fail requirement for initial teacher
credentialing (for example, as a measure of content knowledge for teaching for hiring and other
personnel decisions).
The second broad conclusion is that subject-specific licensure test scores provide some
additional signal about student achievement in some subjects, although the relationships are
not always statistically significant. The key policy question, then, is whether these results justify
the barrier to entry they represent to potential STEM teachers. Our preliminary analysis in
Section 3 suggests that the WEST-E tests in STEM fields are much more difficult to pass than the
WEST-E tests in other fields like elementary education. Moreover, teachers who fail the WEST-E
the first time they take it are about 10 percentage points less likely to enter the workforce, and
teacher candidates of color tend to be more likely to fail these tests than white teacher

34
candidates (Goldhaber & Hansen, 2010), so are disproportionately impacted by this barrier to
entry. These trends could be particularly problematic given the well-documented difficulty of
school districts, and districts in Washington State in particular, to attract STEM teachers and
teachers of color (Goldhaber et al., 2015a, 2015c).
Another conclusion, and a unique contribution of this paper, relates to our investigation
of the impact of teachers on science test scores and, specifically, the finding that relationships
between licensure test scores and student performance in ninth-grade biology are considerably
stronger than in math classrooms. One possible explanation is that teacher content knowledge
(as measured by licensure tests) is simply more important to student performance in science
than in math, but given that there is so little evidence about what predicts the effectiveness of
science teachers, we caution against such a broad interpretation based on the relatively small
ninth-grade biology sample sizes in this paper.
Finally, our investigation of the relationship between teacher licensure test scores and
student high school STEM course taking suggests little relationship between basic licensure test
performance and students’ STEM course taking in high school. That said, the development of P-
20 data warehouses across the country might allow researchers to investigate the role of STEM
teachers in influencing other important (Long et al., 2012; Federman, 2007, Schneider et al.,
1998) long-term student outcomes, such as majoring in STEM fields and employment in STEM
industries.

35
References
Aaronson, D., Barrow, L., and Sander, W. (2007). Teachers and student achievement in the Chicago public high schools. Journal of Labor Economics, 25(1):95-135.
Altonji, J. G., Elder, T. E., & Taber, C. R. (2005). Selection on Observed and Unobserved
Variables: Assessing the Effectiveness of Catholic Schools. Journal of Political Economy, 113(1).
Altonji, J. G., Elder, T. E., & Taber, C. R. (2008). Using selection on observed variables to assess
bias from unobservables when evaluating Swan-Ganz catheterization. The American Economic Review, 98(2), 345-350.
Appleton, K. (2013). Elementary science teacher education: International perspectives on
contemporary issues and practice. Routledge. Angrist, J. D., & Guryan, J. (2008). Does teacher testing raise teacher quality? Evidence from
state certification requirements. Economics of Education Review, 27(5), 483–503. Bacher-Hicks, A., Kane, T. J., & Staiger, D. O. (2014). Validating Teacher Effect Estimates using
Changes in Teacher Assignments in Los Angeles (No. 20657). Cambridge, MA: National Bureau of Economic Research.
Blazar, D., & Kraft, M. A. (2016). Teacher and teaching effects on students’ attitudes and
behaviors. Educational Evaluation and Policy Analysis, 0162373716670260. Boyd, D. J., Grossman, P. L., Lankford, H., Loeb, S., and Wyckoff, J. (2009). Teacher preparation
and student achievement. Educational Evaluation and Policy Analysis, 31(4):416-440. Burkam, D. T., Lee, V. E., & Smerdon, B. A. (2003). Mathematics, foreign language, and science
coursetaking and the NELS: 88 transcript data. US Department of Education, Institute of Education Statistics, National Center for Education Statistics.
Cameron, C., & Miller, D. L. (2015). A practitioner’s guide to cluster-robust inference. The
Journal of Human Resources, 50(2), 317–372. Chamberlain, G. (1980). Analysis of covariance with qualitative data. Review of Economic
Studies, 60, 585–612. Chetty, R., Friedman, J. N., & Rockoff, J. E. (2014a). Measuring the impacts of teachers I:
Evaluating bias in teacher value-added estimates. American Economic Review, 104(9), 2593–2632.

36
Chetty, R., Friedman, J. N., & Rockoff, J. E. (2014b). Measuring the impacts of teachers II: Teacher value-added and student outcomes in adulthood. American Economic Review, 104(9), 2633–2679.
Clotfelter, C. T., Ladd, H. F., & Vigdor, J. (2005). Who teaches whom? Race and the distribution
of novice teachers. Economics of Education Review, 24(4), 377-392. Clotfelter, C. T., Ladd, H. F., & Vigdor, J. L. (2006). Teacher-student matching and the
assessment of teacher effectiveness. Journal of Human Resources, 41(4), 778-820. Clotfelter, C. T., Ladd, H. F., and Vigdor, J. L. (2007). Teacher credentials and student
achievement: Longitudinal analysis with student fixed effects. Economics of Education Review, 26(6): 673-682.
Clotfelter, C., Ladd H. F., and Vigdor, J. (2010). Teacher Credentials and Student Achievement in
High School a Cross-Subject Analysis with Student Fixed Effects. Journal of Human Resources, 45 (3):655-681.
Coleman, J. S., Campbell, E. Q., Hobson, C. J., McPartland, J., Mood, A. M., Weinfeld, F. D., and
York, R. (1966). Equality of Educational Opportunity. Washington, DC, pages1066–5684. Federman, M. (2007) State graduation requirements, high school course taking, and choosing a
technical college major. The B.E. Journal of Economic Analysis and Policy, 7, 4. Feng, L., & Sass, T. R. (2016). Teacher quality and teacher mobility. Education Finance and
Policy. Gamson, D. (2015). The dismal toll of the war on teachers. Newsweek, October 5, 2015. Gershenson, S. (2016). Linking teacher quality, student attendance, and student achievement.
Education Finance and Policy. Gitomer, D. H. (2007). Teacher Quality in a Changing Policy Landscape: Improvements in the
Teacher Pool. Education Testing Service. Goldhaber, D. (2007). Everyone’s Doing It, but What Does Teacher Testing Tell Us About
Teacher Effectiveness? Journal of Human Resources 42 (4): 765–94. Goldhaber, D., and Brewer, D. J. (1997). Why Don’t Schools and Teachers Seem to Matter?
Assessing the Impact of Unobservables on Educational Productivity. Journal of Human Resources, 505–23.

37
Goldhaber, D., and Brewer, D. J. (2000). Does Teacher Certification Matter? High School Teacher Certification Status and Student Achievement. Educational Evaluation and Policy Analysis 22 (2): 129–45.
Goldhaber, D., Gross, B., & Player, D. (2011). Teacher career paths, teacher quality, and
persistence in the classroom: Are public schools keeping their best? Journal of Policy Analysis and Management, 30(1), 57-87.
Goldhaber, D., Grout, C., & Huntington-Klein, N. (2014). Screen twice, cut once: Assessing the
predictive validity of teacher selection tools. CEDR Working Paper 2014-9. University of Washington, Seattle, WA.
Goldhaber, D., & Hansen, M. (2010). Race, gender, and teacher testing: How informative a tool
is teacher licensure testing? American Educational Research Journal, 47(1), 218–251. Goldhaber, D., and Hansen, M. (2013). Is It Just a Bad Class? Assessing the Long-Term Stability
of Estimated Teacher Performance. Economica 80 (319): 589–612. Goldhaber, D., Krieg, J., and Theobald, R. (2016). Does the match matter? Exploring whether
student teaching experiences affect teacher effectiveness and career paths. CALDER Working Paper 149.
Goldhaber, D., Krieg, J., Theobald, R., and Brown, N. (2015a). Refueling the STEM and special
education teacher pipelines. Phi Delta Kappan 97, pp. 56-62. Goldhaber, D., Lavery, L., and Theobald, R. (2015b). Uneven playing field? Assessing the teacher
quality gap between advantaged and disadvantaged students. Educational Researcher, 44(5), 293-307.
Goldhaber, D., Liddle, S., and Theobald, R. (2013). The gateway to the profession: Evaluating
teacher preparation programs based on student achievement. Economics of Education Review 34: 29-44.
Goldhaber, D., Liddle, S., Theobald, R., and Walch, J. (2012). Teacher effectiveness and the
achievement of Washington’s students in mathematics. WERA Educational Journal 4(2), 6-12.
Goldhaber, D., Theobald, R., and Tien, C. (2015c). Educator and student diversity in Washington
State: Gaps and historical trends. CEDR Policy Brief 2015-10. Goldhaber, D., and Walch, J. (2014). Gains in Teacher Quality: Academic Capabilities of the US
Teaching Force Are on the Rise. Education Next 14 (1): 38.

38
Gottfried, M. A. (2015). The Influence of Applied STEM Coursetaking on Advanced Mathematics and Science Coursetaking. The Journal of Educational Research, 108(5), 382-399.
Gottfried, M. A., Bozick, R., Rose, E., & Moore, R. (2016). Does Career and Technical Education
Strengthen the STEM Pipeline? Comparing Students With and Without Disabilities. Journal of Disability Policy Studies, 26(4), 232-244.
Gross, S. (1988). Participation and performance of women and minorities in mathematics:
Volume II: Findings related to mathematics instruction for all students. Rockville, Maryland: Department of Educational Accountability.
Hanushek, E. A., Rivkin, S. G., & Schiman, J. C. (2016). Dynamic Effects of Teacher Turnover on
the Quality of Instruction. Economics of Education Review. Harris, D. N., and Sass, T. R. (2011). Teacher Training, Teacher Quality and Student
Achievement. Journal of Public Economics 95 (7): 798–812. Hendricks, M. D. (2014). Public Schools Are Hemorrhaging Talented Teachers. Can Higher
Salaries Function as a Tourniquet? Association for Education Finance and Policy. Hill, H.C., Rowan, B., & Ball, D. L. (2005). Effects of teachers’ mathematical knowledge for
teaching on student achievement. American educational research journal, 42(2), 371-406.
Horvath, H. (2015). Classroom Assignment Policies and Implications for Teacher Value-Added
Estimation. Unpublished manuscript. Jackson, C. K. (2012). Non-cognitive ability, test scores, and teacher quality: Evidence from 9th
grade teachers in North Carolina (No. w18624). National Bureau of Economic Research. Jackson, C. K. (2014). Teacher quality at the high school level: The importance of accounting for
tracks. Journal of Labor Economics, 32(4), 645–684. Kalogrides, D., & Loeb, S. (2013). Different teachers, different peers: The magnitude of student
sorting within schools. Educational Researcher, 42(6), 304-316. Kane, T. J, and Staiger, D. O. (2008). Estimating Teacher Impacts on Student Achievement: An
Experimental Evaluation. Technical report, National Bureau of Economic Research. Kane, T. J., McCaffrey, D. F., Miller, T., & Staiger, D. O. (2013). Have We Identified Effective
Teachers? Seattle, WA: Bill and Melinda Gates Foundation. Koedel, C., Mihaly, K., and Rockoff, J. E. (2015). Value-Added Modeling: A Review. Economics of
Education Review.
39
Lankford, H., Loeb, S., McEachin, A., Miller, L. C., and Wycoff, J. (2014). Who Enters Teaching?
Encouraging Evidence That the Status of Teaching Is Improving. Educational Researcher 43 (9): 444–53.
Long, M. C., Conger, D., & Iatarola, P. (2012). Effects of high school course-taking on secondary
and post-secondary success. American Educational Research Journal, 49, 285-322. Maeroff, G. I. (1985). Improving our teachers. The New York Times, Education Section Mansfield, R. K. (2015). Teacher quality and student inequality. Journal of Labor Economics,
33(3 Part 1), 751-788. Meskauskas, J.A. (1976) Evaluation models for criterion-referenced testing: Views regarding
mastery and standard-setting. Review of Educational Research, 46(1), 133-158. Monk, D. H., and King, J. A. (1994). Multilevel Teacher Resource Effects in Pupil Performance in
Secondary Mathematics and Science. The Case of Teacher Subject Matter Preparation. Choices and Consequences: Contemporary Policy Issues in Education. Pages 29–58.
Petek, N. & Pope, N. (2016). The multidimensional impact of teachers on students. University of
Chicago Working Paper. President’s Council of Advisors on Science and Technology (US). (2010). Prepare and Inspire: K-
12 Education in Science, Technology, Engineering, and Math (STEM) for America’s Future. Executive Office of the President.
Protik, A., Walsh, E., Resch, A., Isenberg, E., & Kopa, E. (2013). Does tracking of students bias
value-added estimates for teachers? Washington D.C.: Mathematica Policy Research. Ravitch, D. (2003, August). A brief history of teacher professionalism. In Speech presented at the
White House Conference on Preparing Tomorrow's Teachers. Retrieved November (Vol. 13, p. 2010).
Rivkin, S. G., Hanushek, E. A., and Kain, J. F. (2005). Teachers, Schools, and Academic
Achievement. Econometrica 73 (2): 417–58. Rockoff, J. E. (2004). The Impact of Individual Teachers on Student Achievement: Evidence from
Panel Data. American Economic Review: 247–52. Rothstein, J. (2009). Student sorting and bias in value-added estimation: Selection on observables
and unobservables. Education, 4(4), 537-571. Rothstein, J. (2010). Teacher Quality in Educational Production: Tracking, Decay, and Student
Achievement. The Quarterly Journal of Economics, 125(1), 175-214.
40
Rothstein, J. (2014). Revisiting the impacts of teachers. UC-Berkeley Working Paper. Sass, T. (2015). Certification requirements and teacher quality: A comparison of alternative
routes to teaching. Journal of Law and Economics, 58(1), 1-35. Schneider, B., Swanson, C., & Riegle-Crumb, C. (1998). Opportunities for learning: Course
sequences and positional advantages. Social Psychology of Education, 2, 25-53. White House Office of Science and Technology Policy (2012). Preparing a 21st century
workforce: Science, Technology, Engineering, and Mathematics (STEM) education in the 2013 Budget. Retrieved from https://www.whitehouse.gov/sites/default/files/microsites/ostp/fy2013rd_stem.pdf.
Wilson, S. M., Floden, R. E., and Ferrini-Mundy, J. (2001). Teacher Preparation Research: Current
Knowledge, Gaps, and Recommendations: A Research Report Prepared for the US Department of Education and the Office for Educational Research and Improvement, February 2001. Center for the Study of Teaching and Policy

41
Tables
Table 1. Student-Year Level Summary Statistics by Course
7th & 8th Grade 9th Grade 9th Grade Middle Sch. Math Alg./Geo. Biology Student Variables
Lagged Math 0.105 -0.017 0.425 (0.928) (0.808) (0.988)
Lagged Reading 0.095 0.032 0.356 (0.920) (0.859) (0.914)
Lagged Science
-0.009 0.378 (0.862) (0.970)
Female 0.496 0.501 0.516 Multi-racial 0.048 0.044 0.043 Am. Ind./ Alaska Nat. 0.017 0.018 0.017 Asian/ Pac. Isl. 0.109 0.090 0.132 Black 0.059 0.060 0.052 Hispanic 0.213 0.216 0.160 Gifted 0.074 0.027 0.075 LEP 0.050 0.044 0.023 Spec. Ed. 0.061 0.051 0.058 FRL 0.483 0.486 0.376 Learning Disability 0.033 0.028 0.033 Basic Track 0.009 0.020 0.000 Average Track 0.724 0.943 0.846 Advanced Track 0.266 0.037 0.136 Advanced H.S. Math Course* 0.539 Advanced H.S. Science Course* 0.257
Number of High School Math Courses* 0.854
(0.963)
Number of High School Science Courses* 0.925
(0.861)
Teacher Variables
Standardized WEST-B Math 0.567 0.687 0.635 (0.553) (0.533) (0.506)
Standardized WEST-B Reading 0.234 0.189 0.593 (0.820) (0.870) (0.641)
Standardized WEST-B Writing 0.207 0.189 0.584 (0.801) (0.860) (0.672)
Proportion with a WEST-E score 0.375 0.367 0.413
Standardized WEST-E MLM 0.129
(0.788)
Standardized WEST-E Math -0.024 0.241
(0.812) (0.722)
Standardized WEST-E Science
-0.020 (0.930)
Standardized WEST-E Biology
0.189 (0.956)
Observations 135,079 54,354 15,116 NOTE: Each sample is defined as student-year observations by course type linked to teachers with WEST-B
scores. Blank cells are ommited due to small sample sizes. *Summary statistics from advanced course models (see Table 4).

42
Table 2. Summary Statistics by Teacher Quartile of Basic Skills Math Licensure Test Teacher Q1 Teacher Q2 Teacher Q3 Teacher Q4
Lagged Math 0.015 0.078 0.082 0.235 (0.919) (0.906) (0.914) (0.954)
Lagged Reading 0.027 0.079 0.081 0.188 (0.930) (0.911) (0.909) (0.920)
Female 0.497 0.499 0.497 0.492 Multi-racial 0.047 0.052 0.047 0.048
Am. Ind./ Alaska Nat. 0.017 0.014 0.017 0.019 Asian/ Pac. Isl. 0.095 0.106 0.108 0.127
Black 0.056 0.063 0.060 0.057 Hispanic 0.233 0.215 0.231 0.176
Gifted 0.047 0.064 0.071 0.111 LEP 0.057 0.049 0.055 0.038
Spec. Ed. 0.066 0.057 0.061 0.060 FRL 0.504 0.486 0.502 0.444
Learning Disability 0.036 0.031 0.032 0.030 Advanced Track 0.236 0.244 0.256 0.325 Average Track 0.755 0.749 0.727 0.672
Basic Track 0.009 0.008 0.018 0.004 Observations 34,410 30,813 33,858 35,998
Note: The summary statistics reported here are from the middle school math sample and are student-year averages.

43
Table 3: OLS Student Achievement Models Panel A: Predicting student achievement in middle school math WEST-B Math Standardized Score
.024* .026* .027* .031** .026** .033** (.012) (.012) (.011) (.010) (.010) (.011)
WEST-E MLM Standardized Score
.017 .017 .029** .029* .026 (.011) (.011) (.011) (.014) (.018)
WEST-E Math Standardized Score
-.004 -.011 -.000 -.015 .020 (.013) (.012) (.013) (.015) (.017)
Teacher controls No Yes Yes Yes Yes Yes Yes Yes Yes Yes Yes Yes Yes Yes Yes Yes Course track No No Yes Yes Yes No No Yes Yes Yes No No Yes Yes Yes No School fixed effects No No No Yes No No No No Yes No No No No Yes No No School-year fixed effects No No No No Yes No No No No Yes No No No No Yes No Schl-track-yr fixed effects No No No No No Yes No No No No Yes No No No No Yes Number of unique teachers 914 914 914 820 701 595 387 387 285 223 163 256 256 161 106 83 Number of unique students 119,411 119,411 119,411 109,323 84,430 54,574 47,011 47,011 33,656 20,444 11,326 34,273 34,273 21,061 11,445 7,072 Panel B: Predicting student achievement in ninth grade math WEST-B Math Standardized Score
.033 .031 .031 .013 .012 .018 (.022) (.023) (.023) (.016) (.015) (.016)
WEST-E Math Standardized Score
.040+ .040+ .010 .013 .013 (.022) (.022) (.013) (.014) (.016)
Teacher controls No Yes Yes Yes Yes Yes Yes Yes Yes Yes Yes Course track No No Yes Yes Yes No No Yes Yes Yes No School fixed effects No No No Yes No No No No Yes No No School-year fixed effects No No No No Yes No No No No Yes No Schl-track-yr fixed effects No No No No No Yes No No No No Yes Number of unique teachers 767 767 767 686 596 516 425 425 331 248 211 Number of unique students 53,794 53,794 53,794 48,650 39,147 30,651 24,689 24,689 19,680 12,363 9,925 Panel C: Predicting student achievement in ninth grade biology WEST-B Math Standardized Score
.161*** .155*** .152*** .072* .081*** .085*** (.033) (.033) (.032) (.028) (.018) (.017)
WEST-E Biology Standardized Score
.067+ .072+ .018 .038* .047* (.040) (.040) (.021) (.018) (.019)
WEST-E Science Standardized Score
.100** .106** .010 -.002 -.005 (.033) (.035) (.048) (.079) (.078)
Teacher controls No Yes Yes Yes Yes Yes Yes Yes Yes Yes Yes Yes Yes Yes Yes Yes Course track No Yes Yes Yes Yes No No Yes Yes Yes No No Yes Yes Yes No School fixed effects No No No Yes No No No No Yes No No No No Yes No No School-year fixed effects No No No No Yes No No No No Yes No No No No Yes No Schl-track-yr fixed effects No No No No No Yes No No No No Yes No No No No Yes Number of unique teachers 185 185 185 141 113 113 92 92 48 39 39 90 90 47 25 25 Number of unique students 15,116 15,116 15,116 11,391 8,302 8,075 6,046 6,046 3,692 2,705 2,592 5,141 5,141 3,042 1,543 1,460 NOTE: p-values from two-sided t-test : *p<0.05, **p<0.01, ***p<0.001. All models control for prior year test scores, gender, race/ethnicity, learning disability status, and free or reduced-priced lunch eligibility, along with program indicators for gifted/highly capable, limited English proficiency (LEP), and special education. Teacher controls include experience level and degree type. Standard errors are clustered at the teacher level.

44
Table 4. Linear Probability Model of Advanced STEM Course Taking in High School Panel A: Middle School Math Teacher Predicting Probability of Advanced High School Math Course
WEST-B Math Standardized Score .014 .017 .019 .012 .008 .016 (.030) (.028) (.026) (.024) (.026) (.031)
Teacher controls No Yes Yes Yes Yes Yes Course Track No No Yes Yes Yes No School fixed effects No No No Yes No No School-year fixed effects No No No No Yes No School-track-year fixed effects No No No No No Yes Number of unique teachers 357 357 357 238 214 161 Number of unique students 19,994 19,994 19,994 14,679 12,276 7,415 Panel B: Middle School Math Teacher Predicting Probability of Advanced High School Science Course
WEST-B Math Standardized Score .021 .023 .023 .007 .003 .002 (.027) (.027) (.026) (.018) (.019) (.025)
Teacher controls No Yes Yes Yes Yes Yes Course Track No No Yes Yes Yes No School fixed effects No No No Yes No No School-year fixed effects No No No No Yes No School-track-year fixed effects No No No No No Yes Number of unique teachers 359 359 359 241 213 157 Number of unique students 20,223 20,223 20,223 14,955 12,236 7,356 NOTE: p-values from two-sided t-test : *p<0.05, **p<0.01, ***p<0.001. All models control for prior year test scores, gender, race/ethnicity, learning disability status, and free or reduced-priced lunch eligibility, along with program indicators for gifted/highly capable, limited English proficiency (LEP), special education, and number of advanced courses offered in the student's high school. Teacher controls include experience and degree type. Coefficients are reported as average marginal effects. Standard errors are clustered at the middle school teacher level and the high school level.

45
Table 5. OLS Model of Number of Advanced STEM Courses Taken in High School Panel A: Middle School Math Teacher Predicting Number of High School Math Courses
WEST-B Math Standardized Score .034 .038 .045 .064 .078+ .154* (.057) (.053) (.050) (.042) (.047) (.082)
Teacher controls No Yes Yes Yes Yes Yes Course Track No No Yes Yes Yes No School fixed effects No No No Yes No No School-year fixed effects No No No No Yes No School-track-year fixed effects No No No No No Yes Number of unique teachers 357 357 357 238 214 161 Number of unique students 19,994 19,994 19,994 14,679 12,276 7,415 Panel B: Middle School Math Teacher Predicting Number of High School Science Courses WEST-B Math Standardized Score .019 .024 .023 .014 .004 .019
(.053) (.054) (.053) (.031) (.034) (.038) Teacher controls No Yes Yes Yes Yes Yes Course Track No No Yes Yes Yes No School fixed effects No No No Yes No No School-year fixed effects No No No No Yes No School-track-year fixed effects No No No No No Yes Number of unique teachers 359 359 359 241 213 157 Number of unique students 20,223 20,223 20,223 14,955 12,236 7,356 NOTE: p-values from two-sided t-test : *p<0.05, **p<0.01, ***p<0.001. All models control for prior year test scores, gender, race/ethnicity, learning disability status, and free or reduced-priced lunch eligibility, along with program indicators for gifted/highly capable, limited English proficiency (LEP), special education, and number of advanced courses offered in the student's high school. Teacher controls include experience and degree type. Coefficients are reported as average marginal effects. Standard errors are clustered at the middle school teacher level and the high school level.

46
Figures Figure 1. Average WEST-B Scores by Subtest and Testing Year

47
Figure 2. WEST-B Scores by Subtest and Teacher Type

48
Figure 3. WEST-E Scores by Subtest and Teacher Type

49
Figure 4. Basic Skills Licensure Test Passing Rates by Subtest and State

50
Figure 5. Subject-Specific Licensure Test Passing Rates by Subtest and State

51
Figure 6. Estimated Effects on Student Achievement by Sample and Quartile of WEST-B Math Score
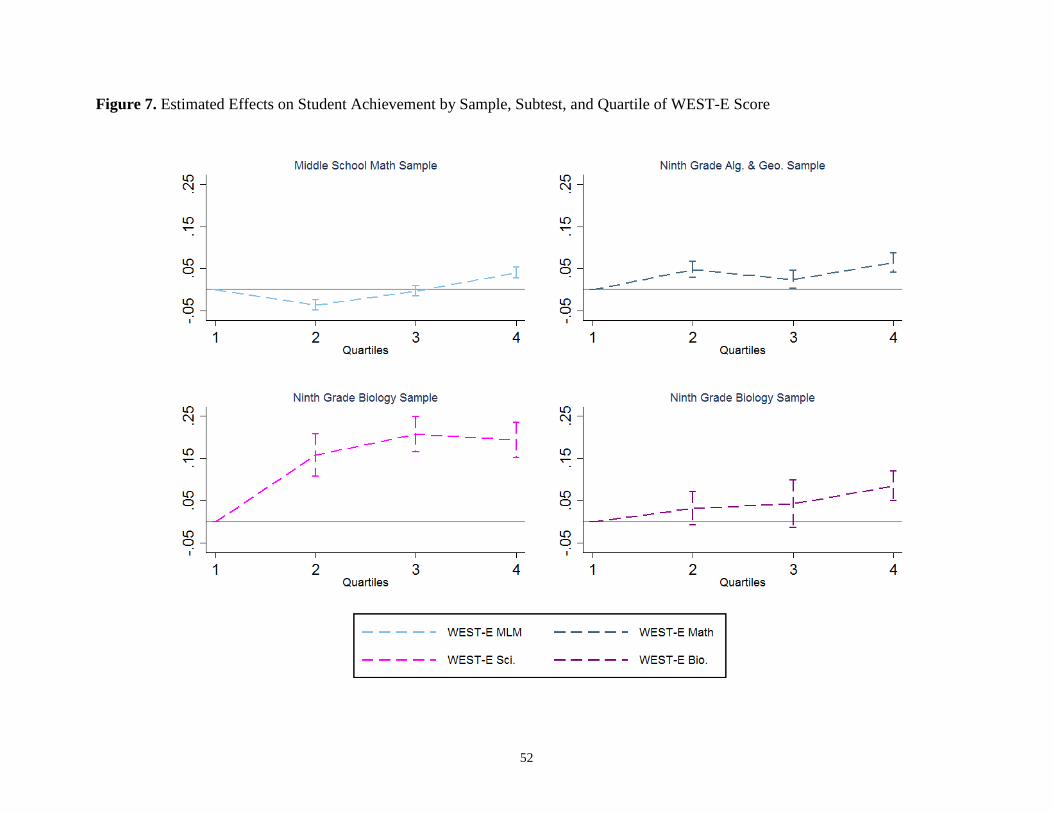
52
Figure 7. Estimated Effects on Student Achievement by Sample, Subtest, and Quartile of WEST-E Score