
Tracking Disease Outbreaks and Health Disparities...
43
Dr. Ming-Hsiang Tsou [email protected] Director of the Center for Human Dynamics in the Mobile Age Professor, Department of Geography San Diego State University February 20, 2015 Tracking Disease Outbreaks and Health Disparities using Big Data, Social Media, GIS, and Social Network Analysis
Transcript of Tracking Disease Outbreaks and Health Disparities...
Dr. Ming-Hsiang Tsou
[email protected] of the Center for Human Dynamics in the Mobile Age
Professor, Department of Geography San Diego State University
February 20, 2015
Tracking Disease Outbreaks and Health Disparities using Big Data, Social Media, GIS, and Social
Network Analysis

What is Big Data?
Image source: http://visual.ly/big-data (definition from IBM, and WIPRO) Is this a good definition of “Big Data”?
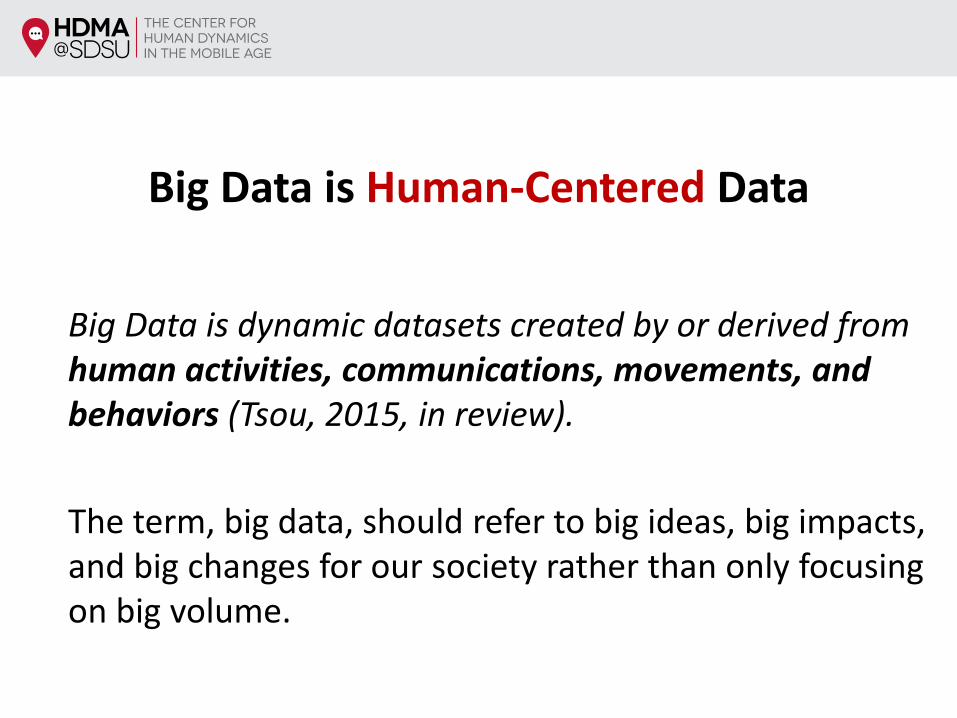
Big Data is Human-Centered Data
Big Data is dynamic datasets created by or derived from human activities, communications, movements, and behaviors (Tsou, 2015, in review).
The term, big data, should refer to big ideas, big impacts, and big changes for our society rather than only focusing on big volume.

Big Data Category (Tsou, 2015).
Social life data include popular social media services (Twitter, Flickr, Snapchat, YouTube, Foursquare, etc.), online forums, online video games, and web blogs.
Health data include electronic medical records (EMR) from hospitals and health centers, cancer registry data from state and local communities, official disease outbreak tracking and epidemiology data
Business and commercial data include credit card transactions, online business reviews (such as Yelp and Amazon reviews), supermarket membership records, shopping mall transaction records per store, credit card fraud examination data, enterprise management data, and marketing analysis data.
Transportation and traffic data include GPS tracks (from taxi, buses, Uber, bike sharing programs, and mobile phones), traffic censor data (from subways, trolleys, buses, bike lanes, highways), social media data (from check-ins, Waze, and other social media platforms), and mobile phone data (from data transmission records and cellular network data).
Scientific research data include earthquakes sensors, weather sensors, satellite images, crowd sourcing data for biodiversity research, volunteered geographic information, and census data.

Health Data Layer
Data Integration / Data Fusion
Explore their spatiotemporal relationships in both network space and geographical space.
Image provided by Dr. Atshushi Nara (Associate Director of HDMA Center).
Human Dynamic in the Mobile Age (HDMA)
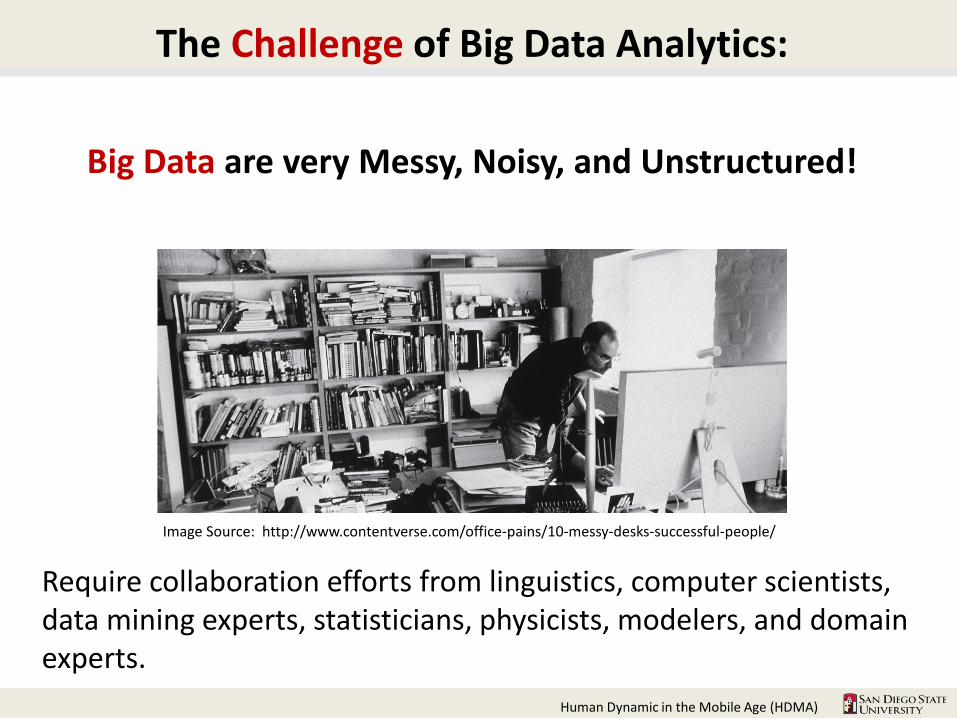
The Challenge of Big Data Analytics:
Big Data are very Messy, Noisy, and Unstructured!
Require collaboration efforts from linguistics, computer scientists, data mining experts, statisticians, physicists, modelers, and domain experts.
Image Source: http://www.contentverse.com/office-pains/10-messy-desks-successful-people/

PlaceTime
Big Data
(information)
Geography (place and time) is the KEY for Understanding and Integrating Big Data
(Tsou and Lietner, 2013)
Research Showcase #1:
Geo-Targeted Social Media Analytics for Tracking Flu Outbreaks in U.S.
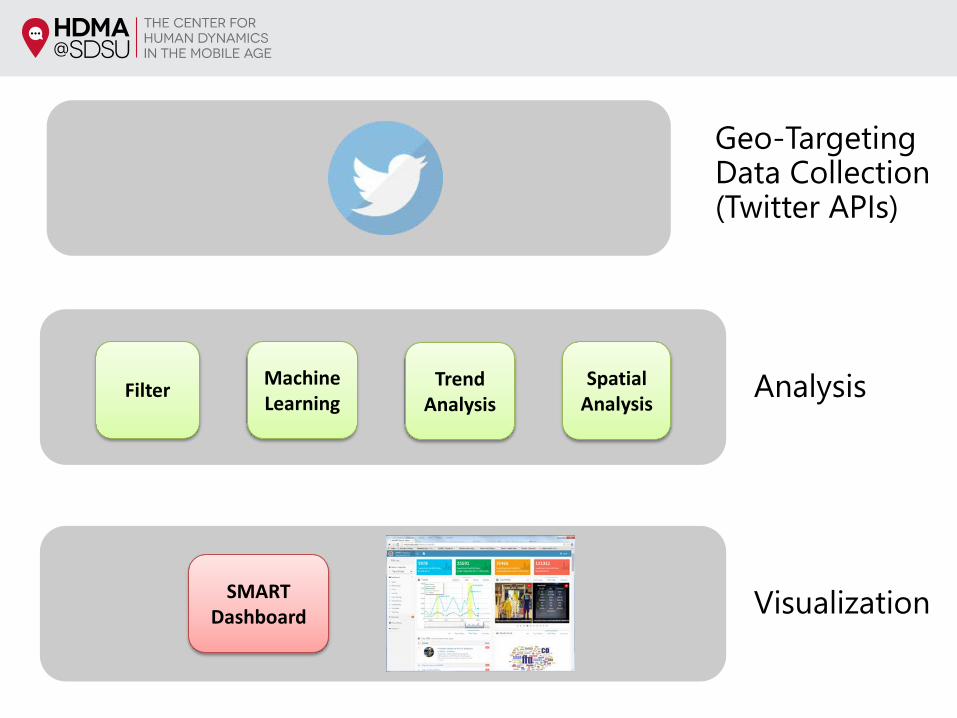
Geo-TargetingData Collection(Twitter APIs)
Analysis
Visualization
Filter Machine Learning
Trend Analysis
Spatial Analysis
SMARTDashboard
Human Dynamic in the Mobile Age (HDMA)
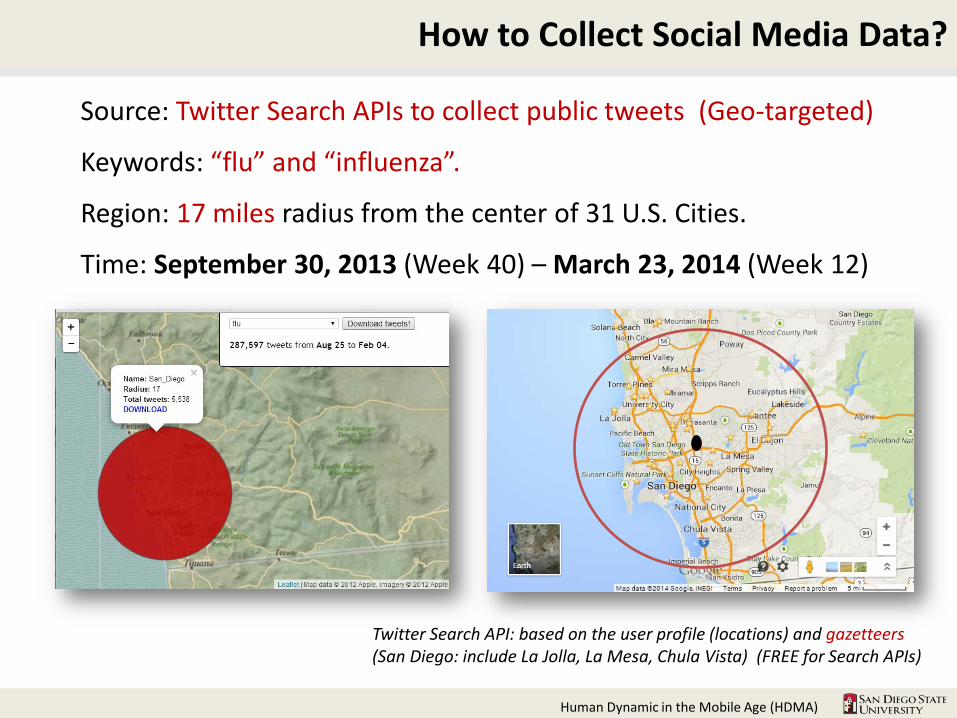
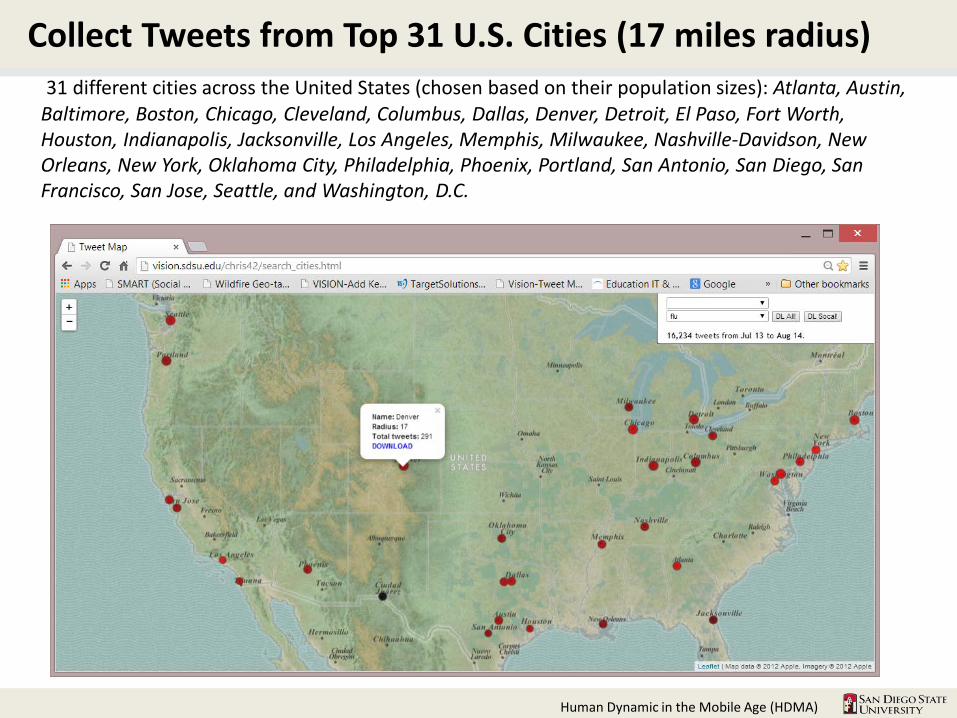
Source: Twitter Search APIs to collect public tweets (Geo-targeted)
Keywords: “flu” and “influenza”.
Region: 17 miles radius from the center of 31 U.S. Cities.
Time: September 30, 2013 (Week 40) – March 23, 2014 (Week 12)
Twitter Search API: based on the user profile (locations) and gazetteers(San Diego: include La Jolla, La Mesa, Chula Vista) (FREE for Search APIs)
How to Collect Social Media Data?
Human Dynamic in the Mobile Age (HDMA)
Collect Tweets from Top 31 U.S. Cities (17 miles radius)31 different cities across the United States (chosen based on their population sizes): Atlanta, Austin,
Baltimore, Boston, Chicago, Cleveland, Columbus, Dallas, Denver, Detroit, El Paso, Fort Worth, Houston, Indianapolis, Jacksonville, Los Angeles, Memphis, Milwaukee, Nashville-Davidson, New Orleans, New York, Oklahoma City, Philadelphia, Phoenix, Portland, San Antonio, San Diego, San Francisco, San Jose, Seattle, and Washington, D.C.
Human Dynamic in the Mobile Age (HDMA)
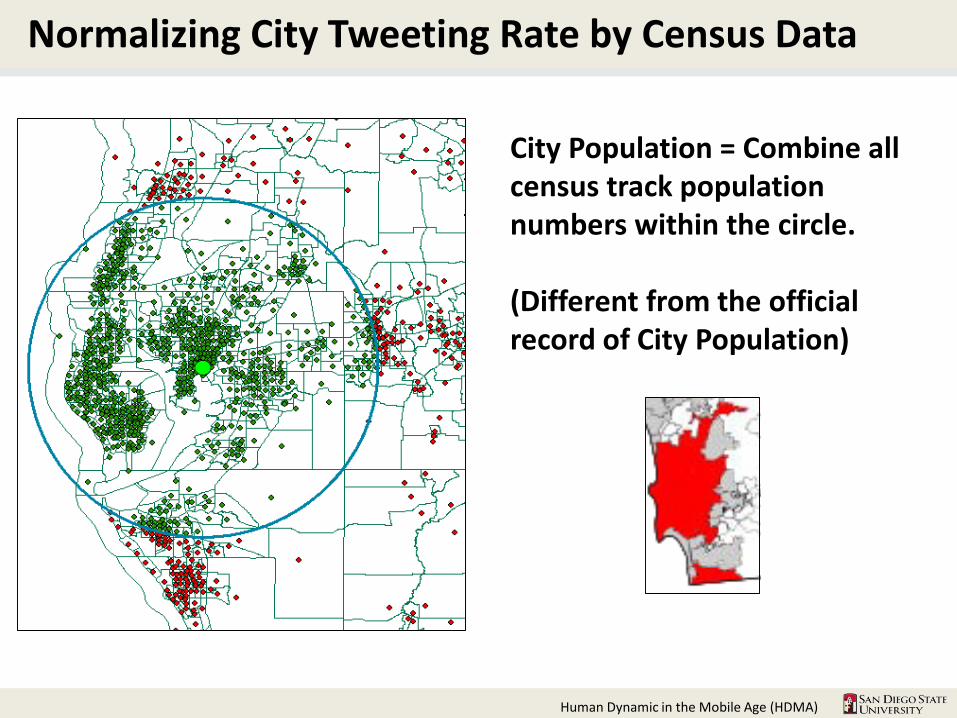
Normalizing City Tweeting Rate by Census Data
City Population = Combine all census track population numbers within the circle.
(Different from the official record of City Population)
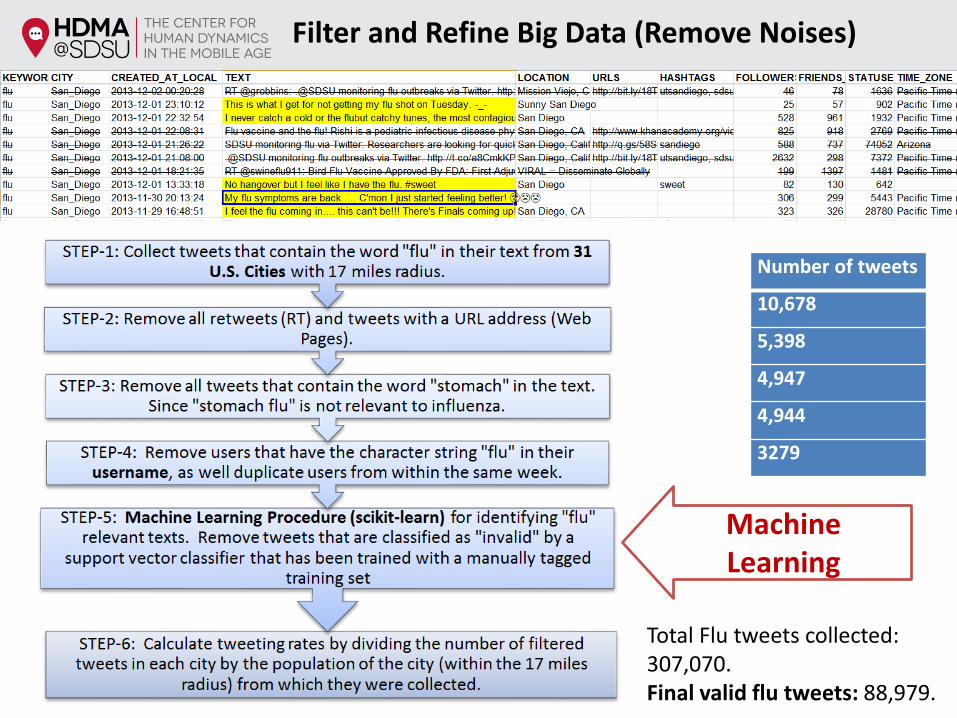
Machine Learning
Number of tweets
10,678
5,398
4,947
4,944
3279
Total Flu tweets collected: 307,070.Final valid flu tweets: 88,979.
Filter and Refine Big Data (Remove Noises)
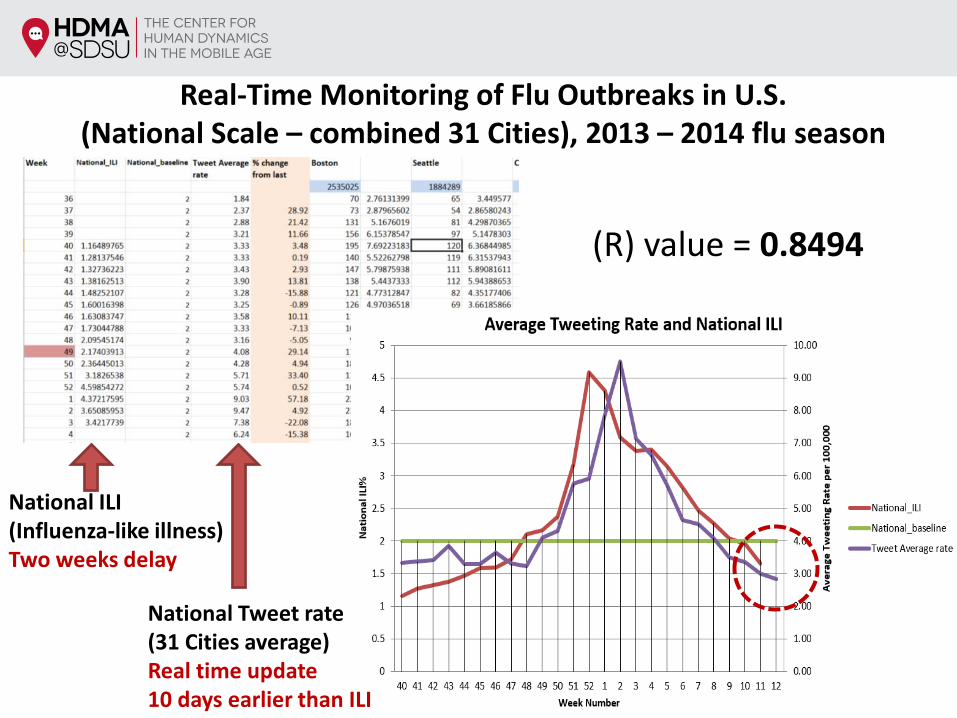
National ILI(Influenza-like illness)Two weeks delay
Real-Time Monitoring of Flu Outbreaks in U.S. (National Scale – combined 31 Cities), 2013 – 2014 flu season
(R) value = 0.8494
National Tweet rate(31 Cities average) Real time update10 days earlier than ILI
Human Dynamic in the Mobile Age (HDMA)
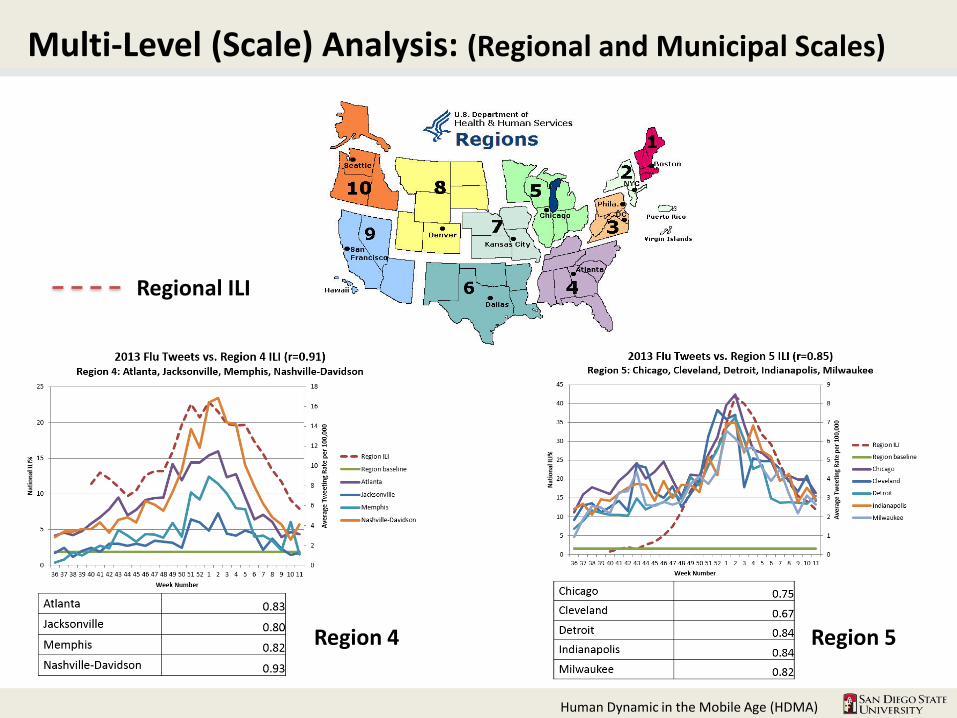
Multi-Level (Scale) Analysis: (Regional and Municipal Scales)
Regional ILI
Region 4 Region 5
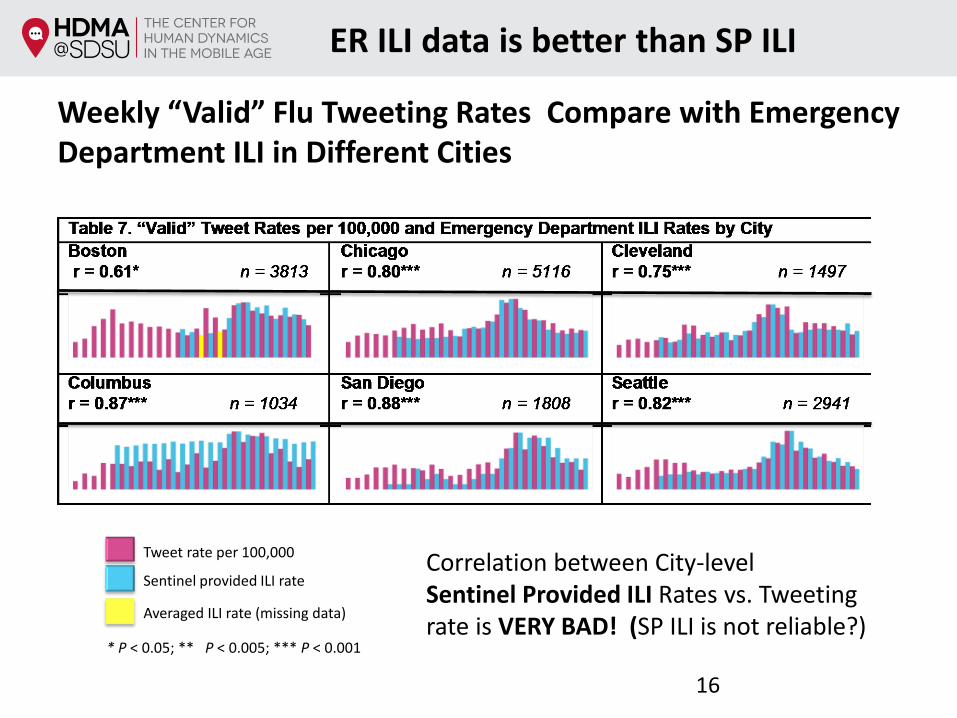
Weekly “Valid” Flu Tweeting Rates Compare with Emergency Department ILI in Different Cities
* P < 0.05; ** P < 0.005; *** P < 0.001
Tweet rate per 100,000
Sentinel provided ILI rate
Averaged ILI rate (missing data)
Correlation between City-level Sentinel Provided ILI Rates vs. Tweeting rate is VERY BAD! (SP ILI is not reliable?)
ER ILI data is better than SP ILI
16
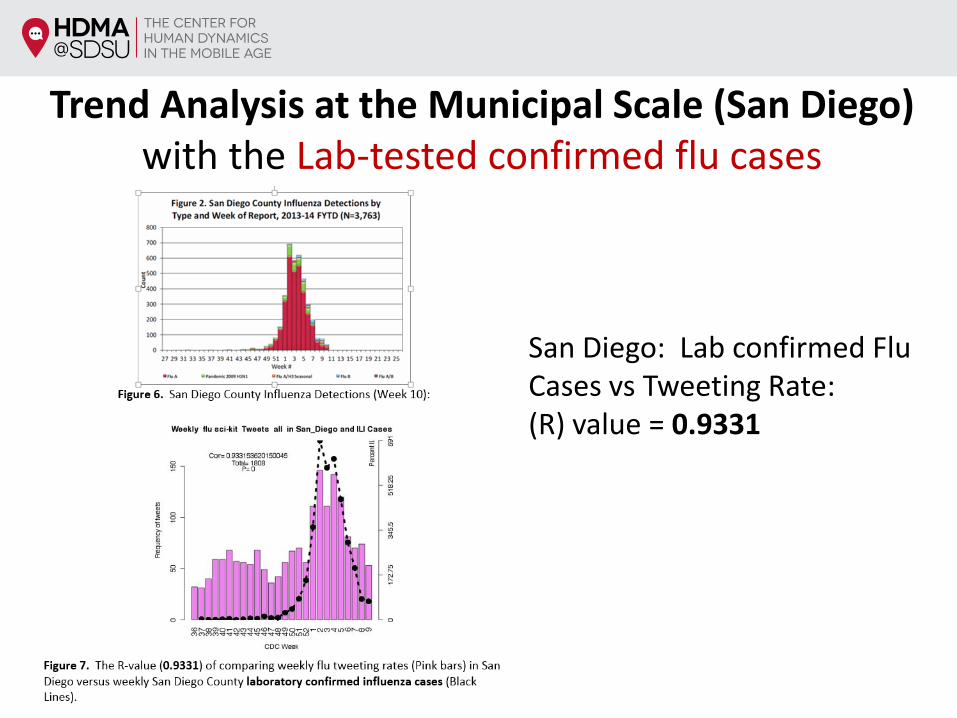
Trend Analysis at the Municipal Scale (San Diego)with the Lab-tested confirmed flu cases
San Diego: Lab confirmed Flu Cases vs Tweeting Rate:(R) value = 0.9331
Human Dynamic in the Mobile Age (HDMA)
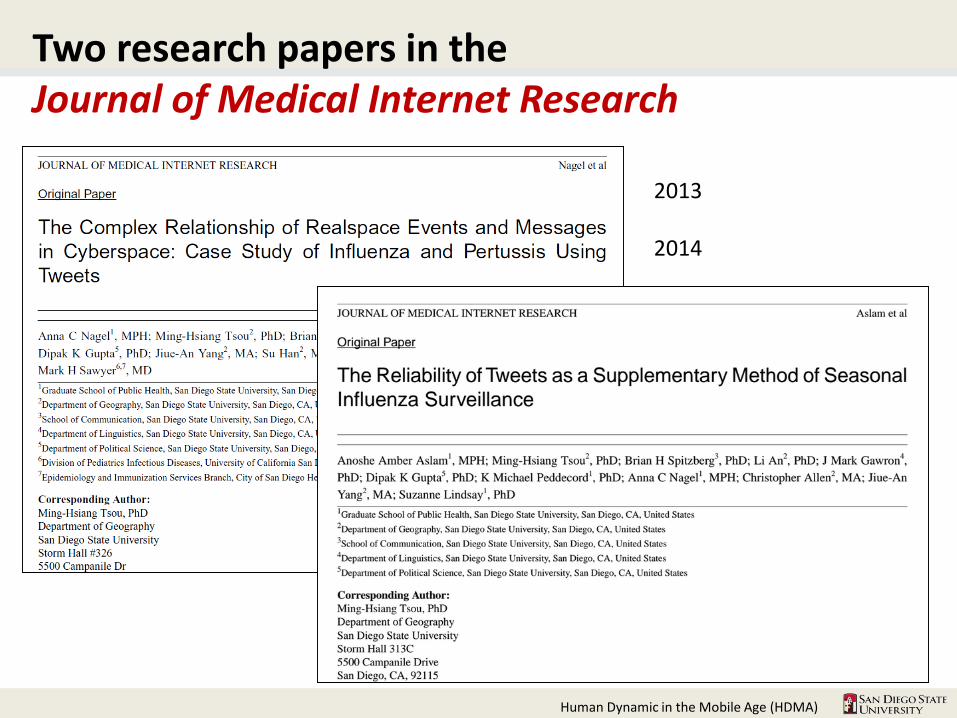
Two research papers in the Journal of Medical Internet Research
2013
2014

Next Step:
Monitor Flu Outbreaks in Real-Time?
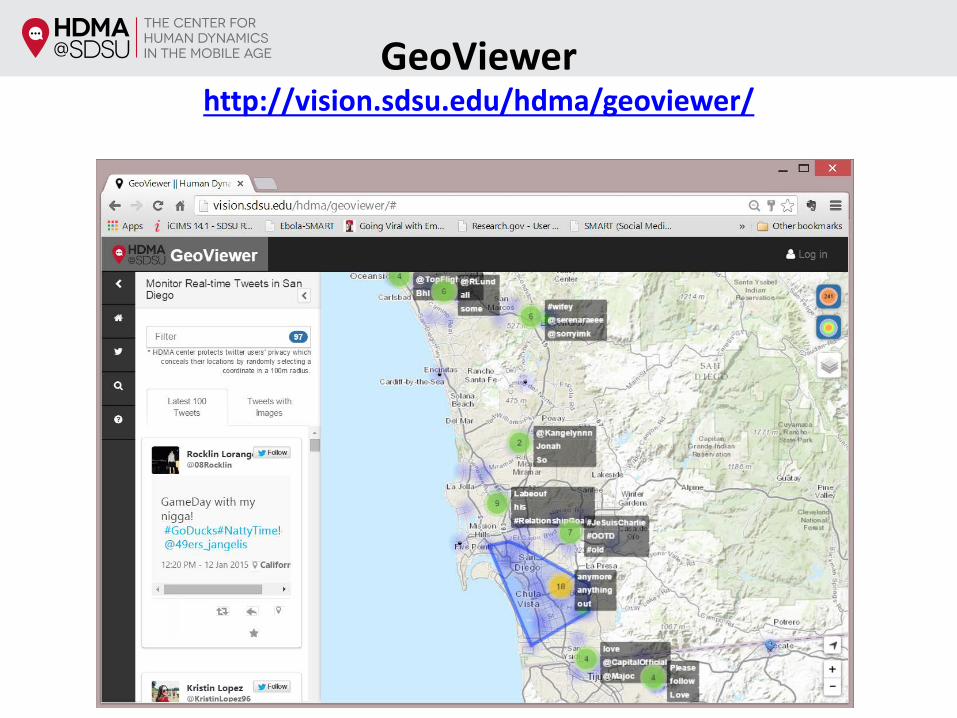
The HDMA Center is developing the SMART Dashboard:
SMART Dashboard: Social Media Analytic and Research Testbedhttp://vision.sdsu.edu/hdma/smart/ (Beta)

SMART Dashboard
Real-time social media analytics (Trend Analysis, Word Clouds, Top URL, web pages, Top Hashtages/Mentions/Stories).
Social Media Analytic and Research Testbedhttp://vision.sdsu.edu/hdma/smart/
Live DemoFor 5 mins
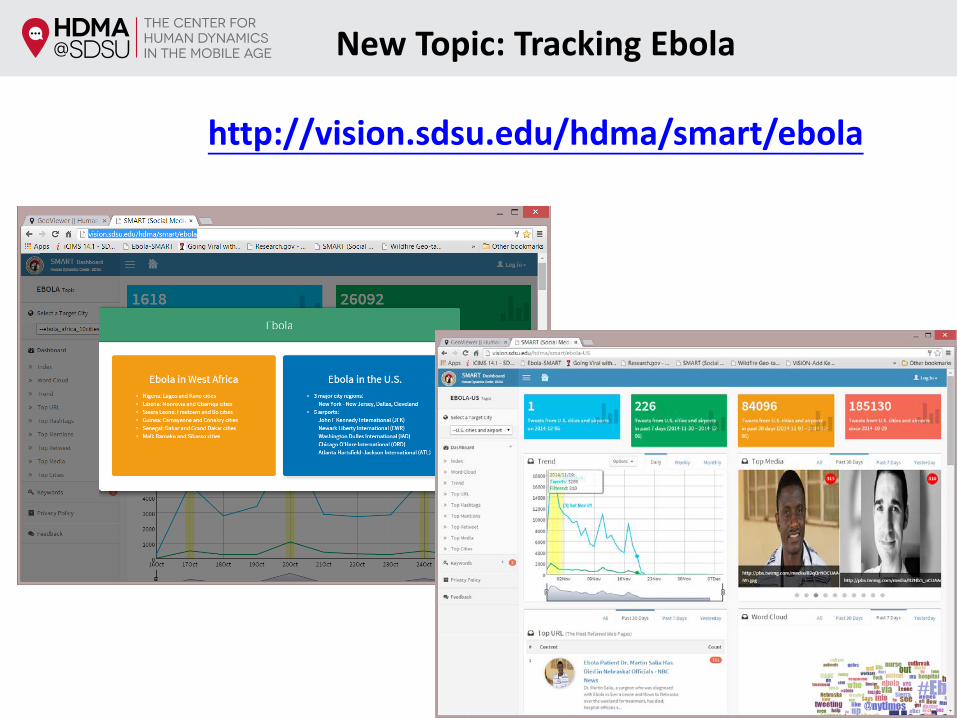
New Topic: Tracking Ebola
http://vision.sdsu.edu/hdma/smart/ebola

Tracking Flu Outbreaks in 2014/2015 Flu Season
(Not as smooth as 2013 or 2012)

CDC Influenza Positive Tests, National Data Summary, through Weeks 40-3, 2014-2015 Season
# of Filtered ILI Tweets, Top 30 US Cities, as of February 9, 2015(from SMART dashboard)
Only 1% -4% tweets has GPS coordinates.
Problems!!! Twitter broke its Search APIs on 11/20/2014 and only returned GPS-tagged tweets only. (Reduce 90% -95% of tweets collected)
Only GPS-tagged Tweets Collected Now
Human Dynamic in the Mobile Age (HDMA)
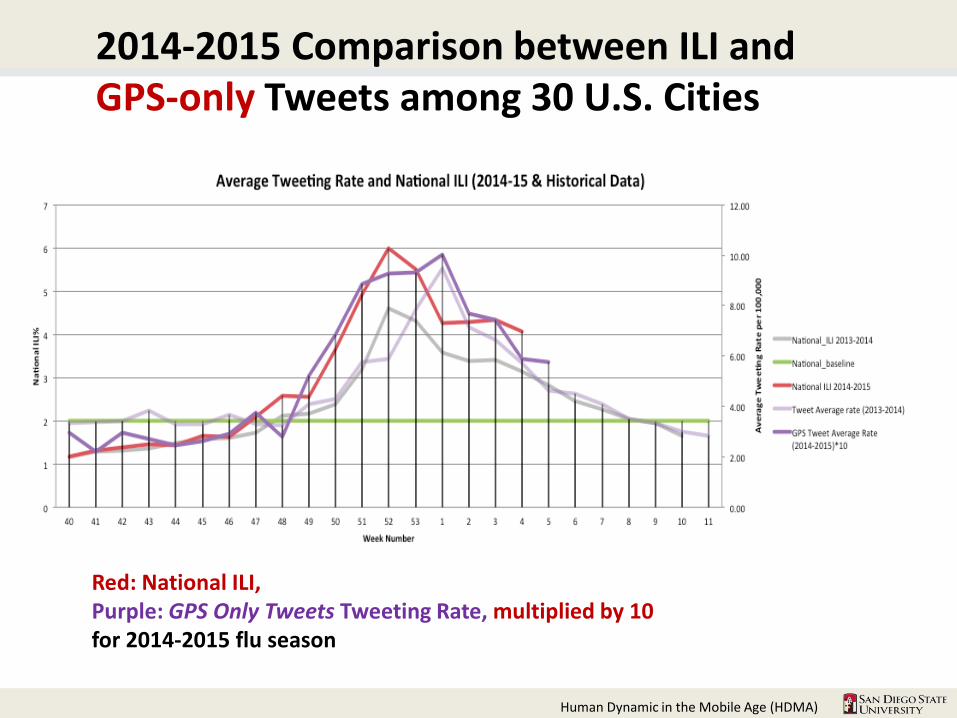
2014-2015 Comparison between ILI and GPS-only Tweets among 30 U.S. Cities
Red: National ILI, Purple: GPS Only Tweets Tweeting Rate, multiplied by 10 for 2014-2015 flu season

The Limitation of Social MediaFor Flu Outbreak Monitoring
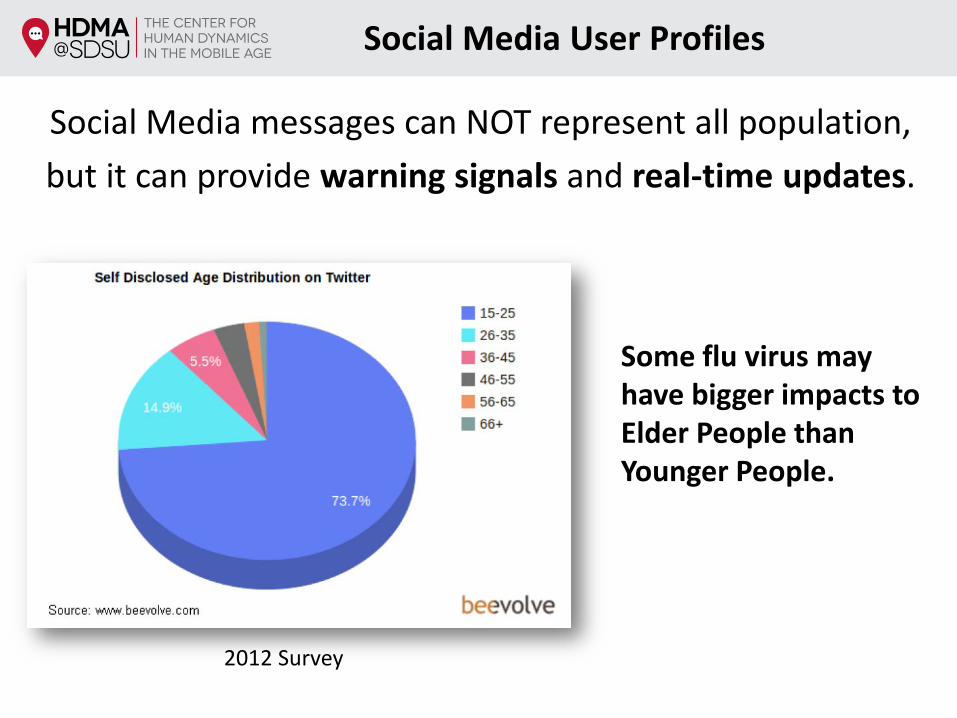
Social Media User Profiles
Social Media messages can NOT represent all population, but it can provide warning signals and real-time updates.
Some flu virus may have bigger impacts to Elder People than Younger People.
2012 Survey
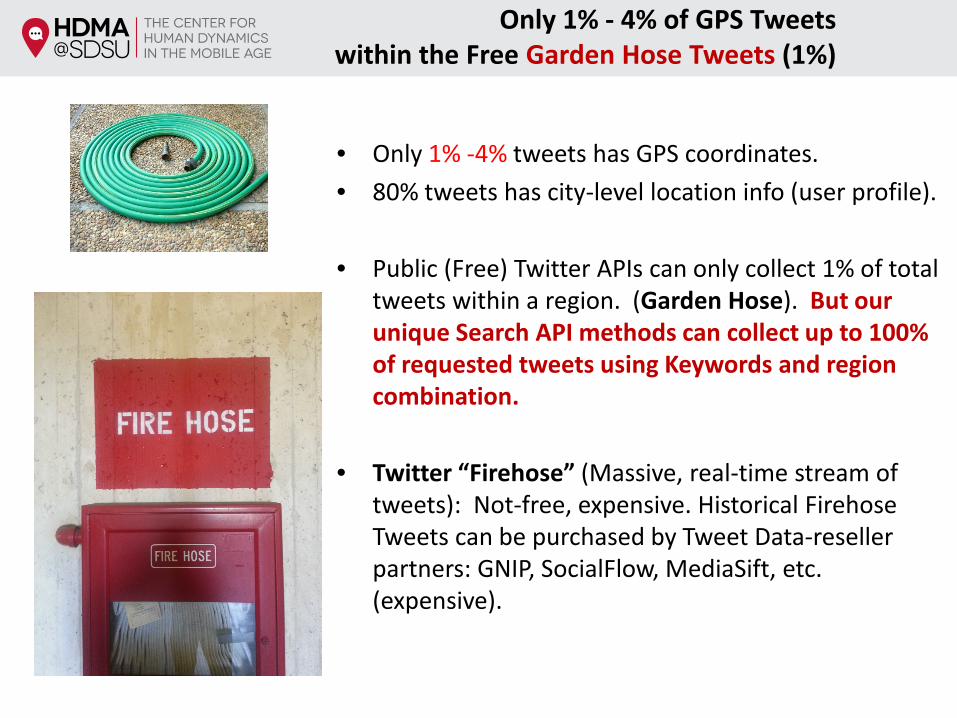
Only 1% - 4% of GPS Tweets within the Free Garden Hose Tweets (1%)
• Only 1% -4% tweets has GPS coordinates.• 80% tweets has city-level location info (user profile).
• Public (Free) Twitter APIs can only collect 1% of total tweets within a region. (Garden Hose). But our unique Search API methods can collect up to 100% of requested tweets using Keywords and region combination.
• Twitter “Firehose” (Massive, real-time stream of tweets): Not-free, expensive. Historical FirehoseTweets can be purchased by Tweet Data-reseller partners: GNIP, SocialFlow, MediaSift, etc. (expensive).
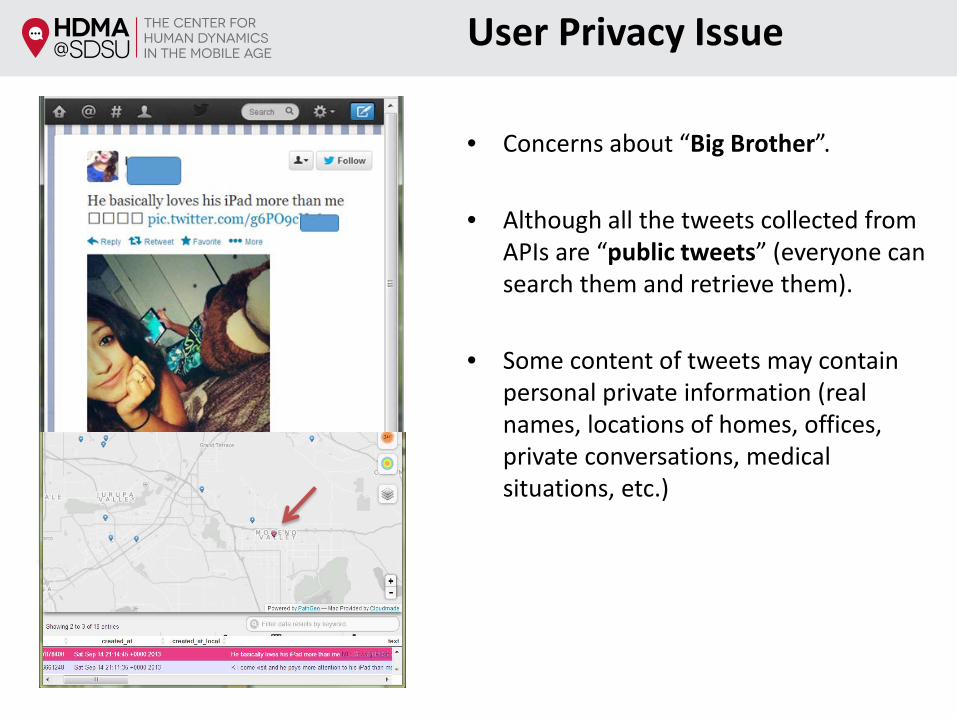
User Privacy Issue
• Concerns about “Big Brother”.
• Although all the tweets collected from APIs are “public tweets” (everyone can search them and retrieve them).
• Some content of tweets may contain personal private information (real names, locations of homes, offices, private conversations, medical situations, etc.)

The top 30 U.S. city “Whooping cough” Twitter message networks (mentions networks) : Social Network Nodes – User ProfilesData collection temporal coverage July 22 to December 9, 2014
• SharylAttikson: Investigative Journalist. Author of Stonewalled. Dreaming of a day when public officials answer questions as if they know they work for the public.
• NFIDvaccines: National foundation for infectious diseases. Non-profit organization dedicated to educating the public and healthcare professionals about the causes, treatment, and prevention of infectious diseases.
• Roseperson: Regional Support manager, aligning force for quality at the AF4Q National Program Office (at George Washington University)
• Jonrappoport: Free-lance investigative reporter for over 30 years.• Acognews: the American Congress of Obstetricians and Gynecologists. The leading
authority on women’s health care.• CDCgov: CDC's official Twitter source for daily credible health & safety updates from
the Centers for Disease Control & Prevention.
• Laurie_Garrett: is a Pulitzer prize-winning science journalist and writer of two bestselling book: I Heard the Sirens Scream (2011), The Coming Plague & Betrayal of Trust
• CFR_org: The Council on Foreign Relations is a resource for foreign policy news and analysis.
Social Network Analysis (SNA)
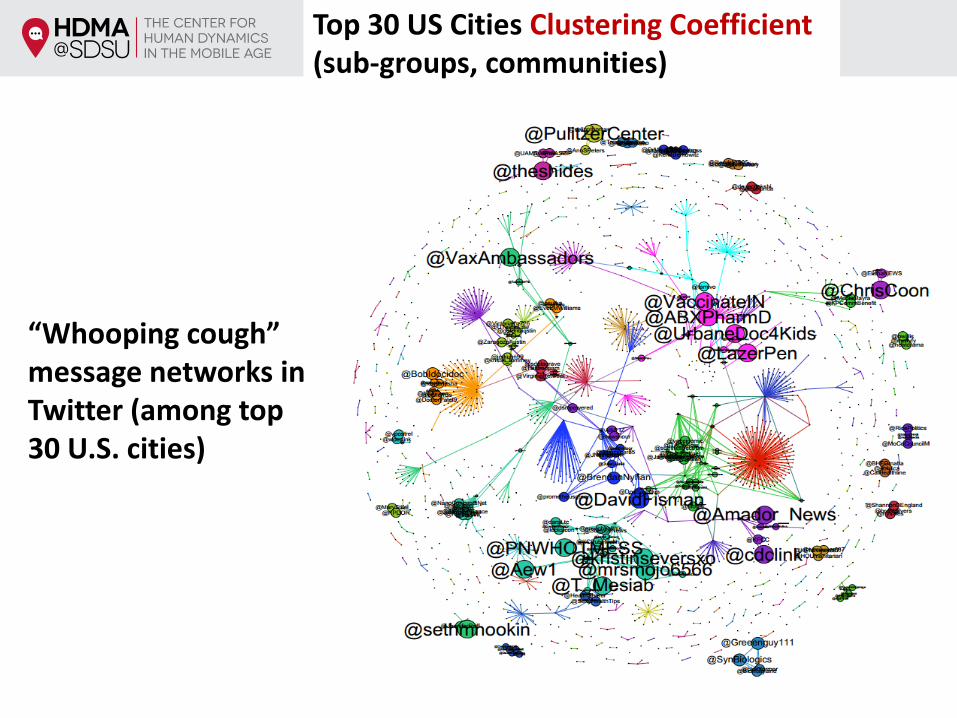
Top 30 US Cities Clustering Coefficient(sub-groups, communities)
“Whooping cough” message networks in Twitter (among top 30 U.S. cities)

SharylAttkisson
NFIDvaccinesJonrappoport
CDCgov roseperson
acognews
Laurie_garrett
CFR_org
LJbeil
Top 30 US Cities Whooping Cough Grouping Major Nodes (information flow)
“Whooping cough” message flows in Twitter (among top 30 U.S. cities)
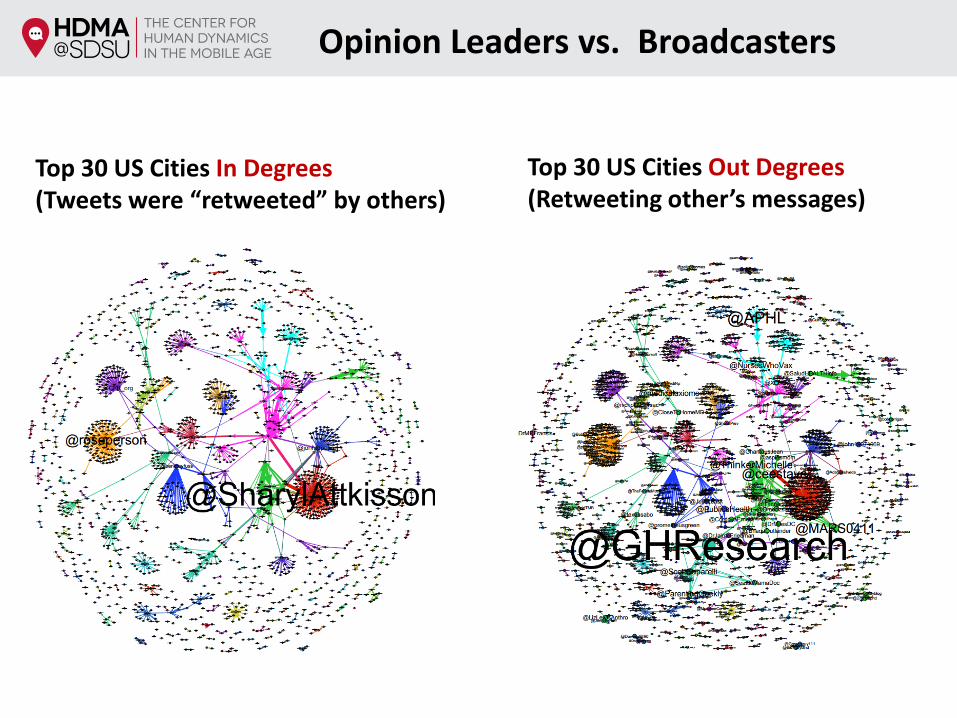
Top 30 US Cities In Degrees (Tweets were “retweeted” by others)
Top 30 US Cities Out Degrees(Retweeting other’s messages)
Opinion Leaders vs. Broadcasters
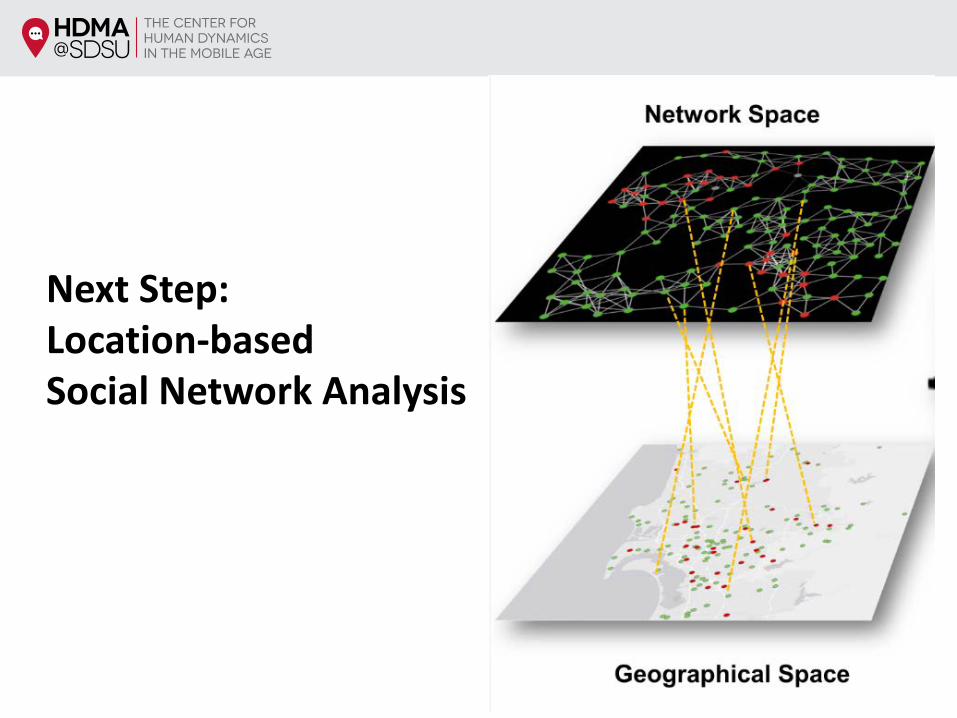
Next Step: Location-based Social Network Analysis

Big Data Research Agenda:
Health Disparities and GIS (Geographic Information Systems)
Human Dynamic in the Mobile Age (HDMA)
Two Important Public Health Challenges
• Cancer
• Obesity

Human Dynamic in the Mobile Age (HDMA)
Health Disparities: Cancer Mortality Rates
Source: http://ratecalc.cancer.gov/archivedatlas/pdfs/maps/acc-maps.pdf
Human Dynamic in the Mobile Age (HDMA)
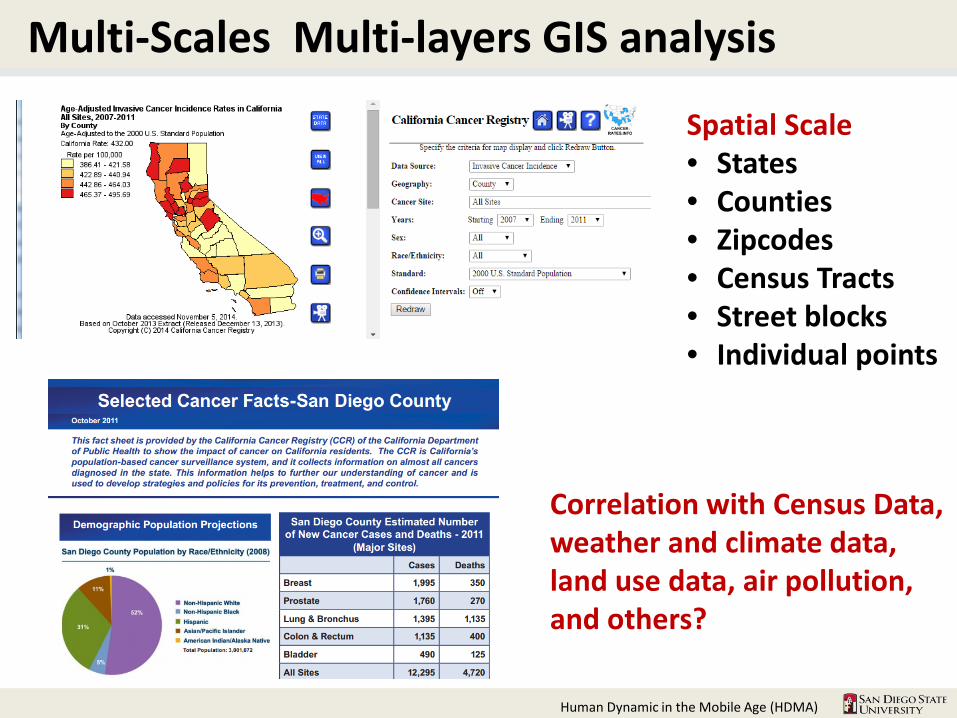
Multi-Scales Multi-layers GIS analysis
Correlation with Census Data, weather and climate data, land use data, air pollution, and others?
Spatial Scale• States• Counties• Zipcodes• Census Tracts• Street blocks• Individual points
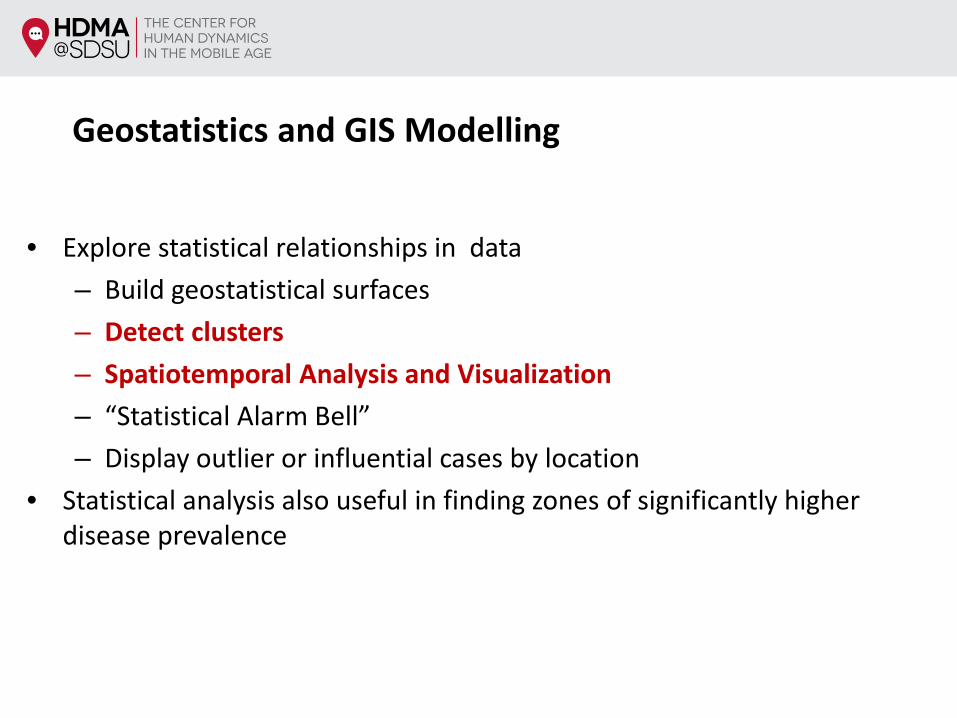
• Explore statistical relationships in data– Build geostatistical surfaces– Detect clusters– Spatiotemporal Analysis and Visualization– “Statistical Alarm Bell”– Display outlier or influential cases by location
• Statistical analysis also useful in finding zones of significantly higher disease prevalence
Geostatistics and GIS Modelling
Human Dynamic in the Mobile Age (HDMA)
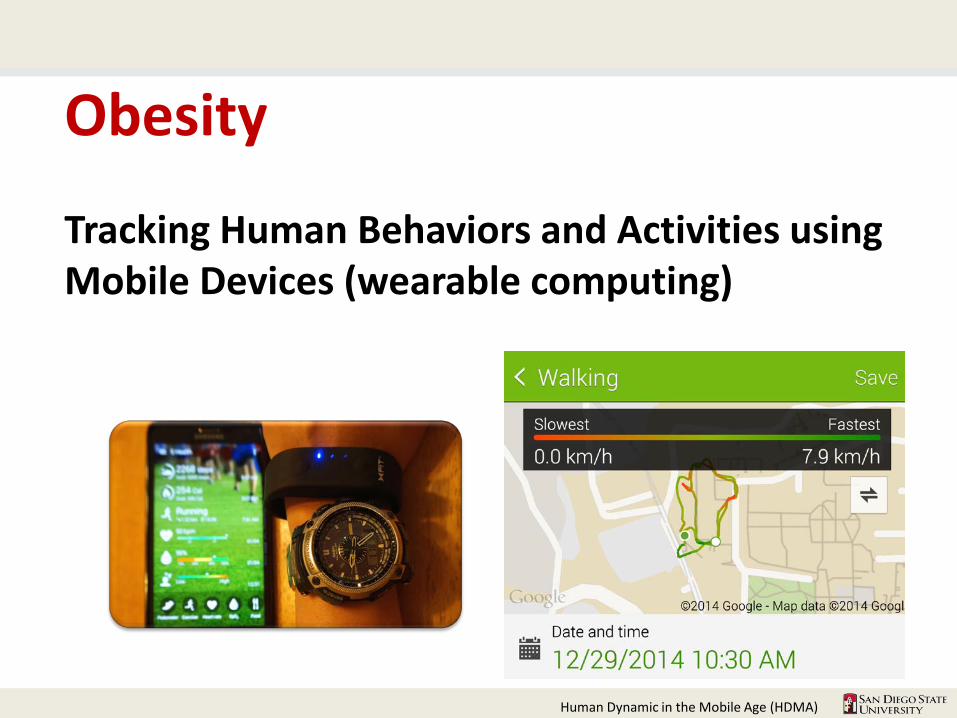
Obesity
Tracking Human Behaviors and Activities using Mobile Devices (wearable computing)
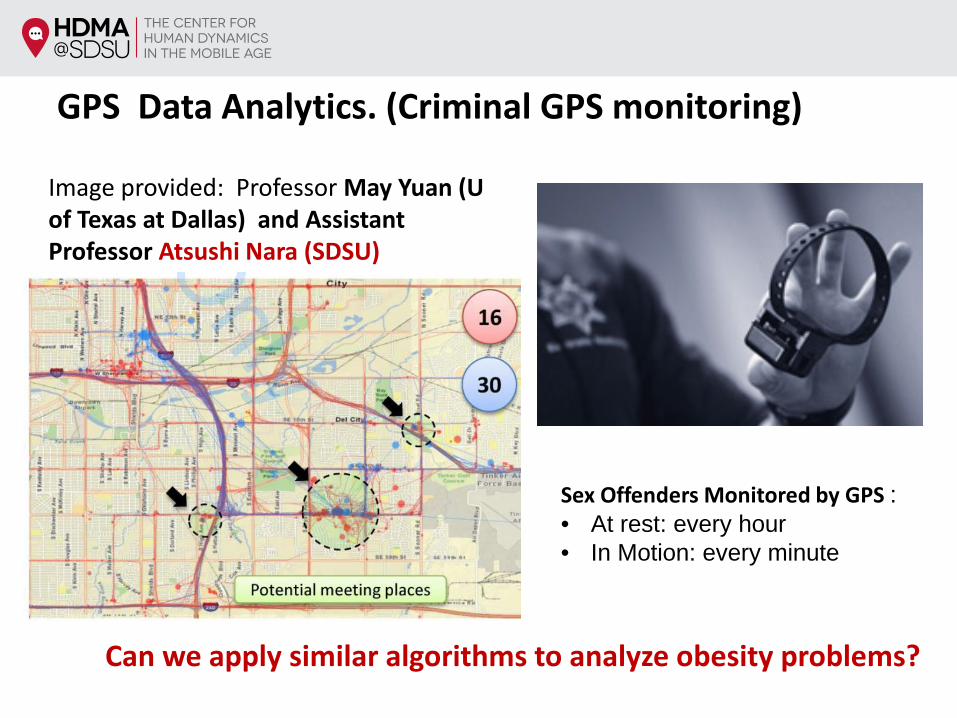
GPS Data Analytics. (Criminal GPS monitoring)
Sex Offenders Monitored by GPS :• At rest: every hour• In Motion: every minute
Image provided: Professor May Yuan (U of Texas at Dallas) and Assistant Professor Atsushi Nara (SDSU)
Can we apply similar algorithms to analyze obesity problems?

Human Dynamics
Mobile Technology
Spatial Science
Human Dynamics in the Mobile Age (HDMA)
Center of Research Excellence at San Diego State University
Established in May 2014
Human Dynamic in the Mobile Age (HDMA)
Thank You Q & A
Director: Dr. Ming-Hsiang [email protected]
http://humandynamics.sdsu.edu/
Funded by • NSF Cyber-Enabled Discovery and Innovation (CDI) program. Award # 1028177. (2010-
2015) http://mappingideas.sdsu.edu/• NSF Interdisciplinary Behavioral and Social Science (IBSS) Program, Award #1416509
(2014-2018): “Spatiotemporal Modeling of Human Dynamics Across Social Media and Social Networks”. http://socialmedia.sdsu.edu/