Fast-tracking Fast-tracking Victoria’s clean energy future to replace the Hazelwood Power Station
Tracking clean energy innovation - .NET Framework
85
Tracking clean energy innovation A framework for using indicators to inform policy
Transcript of Tracking clean energy innovation - .NET Framework

Tracking clean energy innovationA framework for using indicators to inform policy

Tracking Clean Energy Innovation: A framework for using indicators to inform policy
PAGE | 1
IEA
. All
right
s re
serv
ed.
Tracking clean energy innovation
A framework for using indicators to inform policy

Tracking Clean Energy Innovation: A framework for using indicators to inform policy
PAGE | 2
IEA
. All
right
s re
serv
ed.
Abstract
Abstract
The world needs more, better and cheaper technologies to achieve clean energy transitions, despite some progress in recent years. There is an opportunity to strengthen support for clean energy innovation as part of sustainable recovery plans and counteract the potential threats to energy technology development from the Covid-19 pandemic.
Tracking clean energy innovation progress encompasses several critical elements of effective energy innovation policy: identifying gaps and opportunities, evaluating the effectiveness of programmes and policies, and understanding the market readiness of key technologies, nationally and globally.
Drawing from available research and real-world policy examples, we use a four-pillar framework to present a set of metrics for tracking progress across clean energy innovation systems. A broad range of metrics are described for each of the pillars and key examples are illustrated with available data.
This report aims to support public and private decision makers’ efforts to accelerate clean energy innovation. Strategies for tracking progress and embedding innovation policy within energy policy are long-term commitments, and data collection can be challenging. However, tracking progress is an important element of policy good practice, and all countries have quick-win opportunities to improve. In emerging economies aiming to enhance their innovation policies, innovation system mapping and experience sharing can help make progress.

Tracking Clean Energy Innovation: A framework for using indicators to inform policy
PAGE | 3
IEA
. All
right
s re
serv
ed.
Table of contents
Table of contents
Executive summary ..................................................................................... 4
Introduction: Tracking clean energy innovation progress ....................... 6
Examining successful energy innovation systems with four pillars ....... 10
First pillar: Tracking resource push ........................................................... 13
Second pillar: Tracking knowledge management .................................. 24
Third pillar: Tracking market pull ............................................................... 41
Fourth pillar: Tracking socio-political support ........................................ 53
Using innovation metrics ........................................................................... 61
Annex ........................................................................................................... 71

Tracking Clean Energy Innovation: A framework for using indicators to inform policy
PAGE | 4
IEA
. All
right
s re
serv
ed.
Executive summary
Executive summary

Tracking Clean Energy Innovation: A framework for using indicators to inform policy
PAGE | 5
IEA
. All
right
s re
serv
ed.
Executive summary
Executive summary
The world needs more energy innovation Global policy discussions increasingly emphasise the critical role of innovation to meet long-term energy and climate targets. The world needs faster scale-up of low-carbon technologies for clean energy transitions, according to IEA analysis. However, many technologies are not yet ready for all the markets in which they will be needed. They require performance and cost improvements, even though the last few decades have seen unprecedented efforts to accelerate clean energy development, such as in the use of renewable sources of energy or low-carbon mobility. Many of these technologies will need adapting to local needs and specificities, particularly in emerging economies, which are expected to account for much of future energy demand growth.
Covid-19 can further catalyse innovation Innovation efforts are threatened by the unfolding economic crisis due to the Covid-19 pandemic. Entrepreneurs face greater challenges and uncertainty, public and private research and development (R&D) budgets are under pressure, and shifting policy focus may hinder long-term thinking on innovation needs. However, as decision makers work on Covid-19 recovery plans, there are opportunities to accelerate innovation, develop medium-term structural growth and create jobs.
Maintaining clean energy R&D budgets in the short term and increasing them in coming years is necessary to stimulate innovation. The histories of solar and biofuels technologies show that increasing R&D budgets
will be most effective if part of a broader policy strategy that primes the market, ensures flow of ideas and manages the risks of scale-up. Momentum must be kept in emerging economies, which will be crucial to clean energy deployment in the years ahead.
Throughout, rigorous data are essential to assess progress, reorient technology portfolios, provide benchmarks internationally and enhance policy effectiveness. However, tracking progress of clean energy innovation is difficult, with time lags between inputs (e.g. R&D spending), outputs (e.g. patents) and their outcomes in markets and society (e.g. jobs, exports, environmental health and prosperity).
Robust metrics are critical to track innovation progress This report introduces a set of metrics to help public and private decision makers navigate the options for tracking and evaluating clean energy innovation. We hope these can guide thinking and support the development of energy innovation tracking strategies. The approach is intentionally broad and embraces the complexity of the topic, but it is also simply structured, with indicators relevant to four pillars of successful innovation systems: 1) resource push, 2) knowledge management, 3) market pull and 4) socio-political support.
The indicators presented are those that governments and companies have proposed or implemented, as identified from a variety of sources and conversations with practitioners. These examples show insights from existing data. However, a much larger opportunity lies in building new tracking strategies and capabilities into clean energy innovation policy, which should lie at the core of energy policy making.

Tracking Clean Energy Innovation: A framework for using indicators to inform policy
PAGE | 6
IEA
. All
right
s re
serv
ed.
Chapter 1
Introduction: Tracking clean energy innovation progress

Tracking Clean Energy Innovation: A framework for using indicators to inform policy
PAGE | 7
IEA
. All
right
s re
serv
ed.
Chapter 1
Faster clean energy innovation is vital for energy policy goals, but it is not easy to track
Achieving global energy and climate policy goals will require more, better and cheaper technologies
Most energy technologies are not on track to provide the clean energy transitions targeted by governments, according to IEA annual tracking (IEA, 2020a). Deployment challenges for mature technologies hinder mass-scale market uptake in many instances. Technology performance improvements and cost reductions are needed in other cases. Many technologies required to lower emissions to so-called “net-zero” levels either do not exist or are not ready for markets, notably in sectors such as heavy industry and long-distance transportation, for which large-scale low-carbon solutions are not widely available (IEA, 2020b).
Governments are central to the success of clean energy innovation, and global policy support needs strengthening. The role of private-sector actors is critical to bringing emerging technologies to market, but governments play an outsized role in funding and supporting early-stage, high-risk research and development (R&D). As lead investors in novel and risky projects and sometimes in start-ups, the “entrepreneurial” role of governments is most evident in the earlier stages of development for which uncertainty and market values discourage corporates (Mazzucato & Semieniuk, 2017). Dedicated policy is generally accepted as necessary for clean energy innovation, as it is for areas of medical research, due to its long-term “public good” objectives that are often undervalued by private markets.
Countries with high rates of success tend to act across the whole system, promoting innovation through funding, institutions, industry collaboration, markets and intellectual property (IP) protection, among others. This report therefore uses the four pillars of the IEA energy innovation framework – 1) resource push, 2) knowledge management, 3) market pull, and 4) socio-political support – adapted from the insights of numerous experts in the field (IEA, 2020b).
The Covid-19 crisis adds new uncertainties and risks to global clean energy efforts (IEA, 2020b, 2020c). Its impact is likely to be felt strongly and in differentiated ways in emerging economies such as those of Brazil, the People’s Republic of China (“China” hereafter) and India, although there may be greater opportunities to avoid future emissions there given the prospects for large scale infrastructure development.
Why and how to track clean energy innovation Tracking progress is essential to design effective policies and strategies, including support programmes for R&D and demonstration, and align them with long-term ambitions (Cunliff & Hart, 2019; Kim & Wilson, 2019; OECD, 2015; OECD/Eurostat, 2018; Wilson, 2012). Tracking and evaluation are accepted as central elements of other areas of energy policy but are often overlooked in innovation policies, and coherent annual reporting is not widespread (Pless, Hepburn & Farrell, 2020).
Tracking energy innovation progress is not straightforward (Miremadi, Saboohi & Jacobsson, 2018). The objectives of energy innovation policy – including a cleaner environment, international competitiveness, a
Tracking Clean Energy Innovation: A framework for using indicators to inform policy
PAGE | 8
IEA
. All
right
s re
serv
ed.
Chapter 1
stronger economy, less energy poverty and a more resilient energy system – often cannot be measured for years if not decades afterwards, and are hard to link directly to policy interventions. The outputs of innovation – including knowledge, products, lower costs and higher efficiencies, or long-term achievement of sustainable development goals – have significant time lags that obscure correlations between policy changes and macro-level results. Inputs to innovation are less complex to track, and include funding, education, fiscal policy, IP regimes and market instruments. However, inputs trends are unlikely to yield information about the performance of the entire system, or progress in a narrow technology area, given the inherent uncertainty of innovation.
Therefore, we propose governments adopt a suite of metrics that can help answer and monitor the following questions:
Are the resources devoted to energy innovation increasing?
Is the allocation of resources aligned with strategic priorities?
What/where are the weaknesses in the energy innovation system?
How does the country or region compare with international peers?
Are inputs translated into outputs that support policy objectives?
Which combinations of policies have the highest impact?
Like governments, companies track energy innovation progress, for similar reasons that are aligned with corporate performance. These include competitive advantage, development of an entrepreneurial culture, and appeal to shareholders and investors. Their metrics are often readily available, including: ratios of R&D spending to revenue, royalties from IP, R&D personnel and technical improvements such as
performance, costs or output volumes. However, benchmarking these against competition remains challenging due to the confidential nature of much information.
The relevant metrics cover more than funding alone in the public and private sectors. This report seeks to guide decision makers, in particular in the public sector, through the options for tracking progress to inform policy and benchmark internationally. It proposes insights on tracking strategies based on available evidence; further research on practical implications for emerging economies may be needed in complement.
What is energy technology innovation? This report is concerned with how energy technologies are invented, turned into products and modified throughout their lives. Technology innovation is defined as “the process of generating ideas for new products or production processes and guiding their development all the way from the lab to their mainstream diffusion into the market” (IEA, 2020b). Equipment and processes that change how or how much energy is consumed are included (e.g. in power, buildings, industry, transport).
There are four main stages of development for emerging technologies: prototype, demonstration, early adoption and maturity (IEA, 2020b). Each requires different policy support programmes and stakeholders. The ETP Clean Energy Technology Guide tracks progress of innovation of over 400 energy technologies, and maps their stage of development and ongoing activities and demonstration (IEA, 2020d).

Tracking Clean Energy Innovation: A framework for using indicators to inform policy
PAGE | 9
IEA
. All
right
s re
serv
ed.
Chapter 1
Energy technology innovation is an evolutionary process through four development stages
Four stages of technology innovation and the feedbacks and spillovers that improve successive generations of designs
IEA 2020. All rights reserved.
Notes: No technology passes all the way from idea to market without being modified. Their trajectories are influenced by feedback loops and spillovers at different stages of maturity and often involve setbacks and redesign. Nevertheless, it is worth considering the four distinct stages through which all successful technologies eventually pass, because each stage has different characteristics and requirements. Source: IEA (2020b).

Tracking Clean Energy Innovation: A framework for using indicators to inform policy
PAGE | 10
IEA
. All
right
s re
serv
ed.
Chapter 2
Examining successful energy innovation systems with four pillars

Tracking Clean Energy Innovation: A framework for using indicators to inform policy
PAGE | 11
IEA
. All
right
s re
serv
ed.
Chapter 2
A conceptual framework based on the four pillars of successful energy innovation systems
Policy and decision makers may seek to cover all important components that underpin successful energy innovation systems
IEA 2020. All rights reserved.
Notes: This framework offers a conceptual entry point for understanding energy innovation systems and policy options, based on four core components of successful innovation systems. The “black box” indicates the uncertainty and complexity of the processes that sit between the “inputs” and “outputs” of an innovation system. Source: IEA (2020b).

Tracking Clean Energy Innovation: A framework for using indicators to inform policy
PAGE | 12
IEA
. All
right
s re
serv
ed.
Chapter 2
The importance of considering energy innovation systems across four pillars
A wide range of factors affect energy innovation The innovation journey is complex, lengthy, uncertain, and often ends in failure (Grubler & Wilson, 2014a; Grubler et al., 2012). Each stage comes with new risks, the selection environment is dynamic and a broad range of actors need to be aligned. Emerging technologies are modified as feedback loops and experiences from other sectors or countries help shape new R&D activities, as investor or consumer preferences shift, as competing technologies improve (Suurs & Hekkert, 2009). In addition to endogenous mechanisms, exogenous factors shape the innovation journey and chance of success, such as past policy choices, macroeconomic developments, incumbent power and infrastructure, as well as history, culture and social norms (e.g. Bennett & Pearson, 2009; de Oliveira & Negro, 2019; de Oliveira, Lacerda & Negro, 2020). New ideas for energy technologies attract billions of dollars of funding despite the risk and complexity (IEA, 2020e). It is important to consider all the factors that influence innovation to understand why some technologies attract more funding or are more successful than others.
The “energy innovation system” is a concept that places innovation processes within a broader system of people, institutions, technologies, policies, resources, time and space. It is used to stress to policy makers that firms (manufacturers, energy suppliers and users) are embedded in a network of socio-economic agents that also includes researchers, final consumers and regulators (Grubler & Wilson, 2014b). The choices made by these actors when supporting or adopting new technologies
are guided by incentives formed by much more than static cost-benefit analyses and include: institutional and governance structures, policies, prior investments, resources, positioning in value chains, relationships and personal preferences, market expectations and business models.
Four pillars of successful energy innovation systems This report is structured around four core functions of successful energy innovation systems (IEA, 2020b). It provides a condensed adaptation of comprehensive studies of all the functions needed to provide favourable conditions for innovation, noting these also interact with one another (see Annex A; Bergek, 2011; Bergek, Hekkert & Jacobsson, 2008; Bergek et al., 2008; Hekkert et al., 2007).
1. Resource push. The energy innovation system requires a sustained flow of R&D funding, a skilled workforce, research infrastructure and clear priorities to guide the search of innovation activities.
2. Knowledge management. The energy innovation system needs incentives and IP systems for inventors, and must enable knowledge exchange among stakeholders.
3. Market pull. The energy innovation system needs to make R&D risks worthwhile, which may depend on market rules and incentives.
4. Socio-political support. The support of a broad range of actors may be required to enable new ideas to emerge and reach markets.

Tracking Clean Energy Innovation: A framework for using indicators to inform policy
PAGE | 13
IEA
. All
right
s re
serv
ed.
Chapter 3
First pillar: Tracking resource push

Tracking Clean Energy Innovation: A framework for using indicators to inform policy
PAGE | 14
IEA
. All
right
s re
serv
ed.
Chapter 3
Resource push: Providing sustained flows of inputs and guiding the “direction of the search”
“Resource push” refers to the provision of inputs into the energy innovation system with the intention of raising the chance of innovation success. This pillar generally receives the most attention. For example, 25 countries or regions committed to doubling clean energy R&D spending in 2015 under the Mission Innovation (MI) initiative (MI, 2017).
Resources for energy innovation systems Governments may track the input of two main resources to energy innovation activities: funding and human capital.
Governments can provide funding using a variety of instruments, depending on the technology and stage of development. Even the best clean energy technologies may be undervalued by the private sector in the period before markets definitively shift to pricing the social and environmental benefits (directly or indirectly, via standards or regulation) or if other barriers to market entry are lowered (e.g. infrastructure that favours incumbents). This is of particular relevance for technologies that have high development costs or in countries with limited availability of private risk capital, such as that from companies or venture investors.
Governments may provide direct funding (e.g. multiannual R&D projects or grants) or indirect funding (e.g. tax breaks for business R&D), targeted to a specific innovation gap or technology neutral, in the earlier stages of R&D. In intermediate stages of development such as demonstration, emerging technologies may face challenges to
mobilise much larger capital sums and the public sector can provide financial support (e.g. grants, loans or equity) to mitigate the higher risks associated with this so-called “valley of death”.
Success also depends on the availability of human capital (e.g. inventors, researchers, R&D support personnel, graduates, entrepreneurs, financiers and industry actors). Efforts to promote high-quality education, scientific and engineering programmes, and entrepreneurship, and to attract and retain talent, contribute to a healthy innovation ecosystem and can be tailored to clean energy.
The importance of priority setting to allocate resources Priority setting guides the direction of innovators’ search strategies, usually to align R&D activities with long-term goals and to address pressing innovation gaps (IEA, 2020b, 2020d). Technology needs assessments (TNAs) can help governments identify priorities, and flesh out innovation missions and technology roadmaps in partnership with all relevant stakeholders.
Local context is a big factor in developing innovation priorities that respond to technical and economic opportunities. This includes the suitability of existing technologies for local geography or infrastructure, existing capabilities, comparative advantage, sectoral emissions and the size of local markets. Such an approach could prioritise, for example, low-carbon hydrogen and specific roles in its value chain.

Tracking Clean Energy Innovation: A framework for using indicators to inform policy
PAGE | 15
IEA
. All
right
s re
serv
ed.
Chapter 3
Resource-push subfunctions, and how governments can support them Main function Subfunction Subfunction description Policy option examples
1. Resource push Providing a sustained flow of resources to RD&D activities, including from public and private sources
1a. Set priorities and guide the search to address innovation gaps
Identify strengths, weaknesses and technology innovation gaps, and set priorities to guide the direction of the system’s activities
• Identify technology needs and innovation gaps to achieve clean energy transitions (e.g. by conducting TNAs) • Establish and publicise clean energy visions for key sectors in the long term and at interim milestones (e.g. by carrying out consultation processes, R&D policy reviews, scenario modelling and technology roadmaps) • Prioritise a set of R&D topics while supporting exploration, diversity and competition, and taking into account local expertise, R&D capacity, comparative industrial advantage and potential spillovers • Track progress towards stated policy goals, embed evaluation ex ante into policy design and establish processes for regular review of priorities • Embed R&D components in broader energy policies • Set performance objectives or targets for publicly funded energy R&D programmes to steer innovation towards national priorities
1b. Mobilise funding
Mobilise public funds and incentivise private capital to ensure stable support for innovation activities over time, as well as for quality infrastructure for researchers and innovators
• Provide public multiannual grants for energy R&D in research institutions (e.g. over 5-10 years) and innovative companies • Offer public loans for R&D and start-up growth, public equity or government-backed venture capital (VC) • Set corporate R&D tax incentives for companies active in clean energy technology development, either technology neutral or targeted (e.g. to young entrepreneurs or specific sectors) • Provide funding to enable demonstration projects to reach financial close, including capital-intensive and complex technologies (e.g. advanced nuclear, carbon capture, utilisation and storage (CCUS) or biorefineries) • Provide funding (public or private) for high-quality R&D facilities and laboratories, testing infrastructure open to all innovation actors, incubators and accelerators
1c. Develop human capital
Train, hire and retain a talented pool of skilled workforce (technicians, engineers, researchers, support staff)
• Provide funding for higher education, vocational training, and technical and engineering tracks with relevance to clean energy technologies • Set up scholarships, awards, grants, and regional and international exchange programmes for researchers and academics in clean energy • Offer training, funding, tax incentives for R&D staff including support personnel for research institutions focusing on clean energy

Tracking Clean Energy Innovation: A framework for using indicators to inform policy
PAGE | 16
IEA
. All
right
s re
serv
ed.
Chapter 3
Resource-push metrics to track inputs provided to the energy innovation system Energy innovation metric Possible use cases for tracking metrics Public funding for energy R&D and demonstration, technology area break-down
• Track levels of public support for RD&D • Assess the stability of public support over time • Reveal technology priorities and identify areas that may be underserved • Set priorities to guide innovation activities
… as a share of GDP, per inhabitant or number of researchers Share of low-carbon energy R&D spending Demonstration budgets for energy technologies Volatility of public energy R&D funding (e.g. standard deviation of growth rates)
Public gross expenditure on R&D (GERD) Share of public energy R&D in GERD Share of GERD in basic vs. applied sciences
Public spending on higher education, in programmes relevant to clean energy
• Track availability of human capital for energy R&D • Assess ability to train, attract, hire and retain talents • Benchmark the relative importance of science, technology and engineering programmes
… as a share of GDP, per million inhabitants, per student Number of public institutions involved in energy R&D Number of higher education institutions offering programmes relevant to clean energy
Share of these that are of regional or global significance Availability and qualification of human capital for energy innovation
Number of researchers and professors in energy-related fields (e.g. per million inhabitants) Number of graduates and postgraduates in energy-related fields (e.g. per million inhabitants) Availability of R&D support personnel for energy innovation (e.g. staff-to-research ratio) Number of knowledge migrant visas delivered for foreign students or staff
Private energy R&D spending, technology area break-down
• Track levels of private support for R&D • Reveal corporate and investor preferences • Set priorities to guide innovation activities
Share of low-carbon energy R&D spending Industry-financed R&D expenditure in higher education or research institutions
Existence and strength of incentives for energy R&D (e.g. level of fiscal incentives) Number of private companies involved in energy innovation
Share of domestic incumbents vs. new companies active in the clean energy space Share of foreign actors active in domestic energy innovation
Foreign direct investments (FDIs) in energy innovation activities and infrastructure Existence of energy TNAs and energy R&D strategies
• Identify technology innovation gaps • Set priorities to guide innovation activities • Promote collaboration and common expectations
Frequency of updates to TNAs Durability of energy R&D roadmaps and policies Variety of stakeholders signing off on energy technology roadmaps

Tracking Clean Energy Innovation: A framework for using indicators to inform policy
PAGE | 17
IEA
. All
right
s re
serv
ed.
Chapter 3
Public spending on low-carbon energy R&D has increased in recent years and accounts for 80% of all public energy R&D, but it stagnates as a share of GDP
Global public spending in clean energy R&D and demonstration (left) and as a share of GDP (right) in selected countries or regions
IEA 2020. All rights reserved.
Note: Data based on official data submissions by countries to the IEA, data reported under MI and IEA estimates. “IEA Europe” includes the European Union. Sources: IEA (2020e, 2020f). See also IEA (2020b).
0
5
10
15
20
25
30
2014 2015 2016 2017 2018 2019
USD
(201
9) b
ln
Canada, Mexico and United States IEA EuropeJapan and Korea Rest of WorldChina
0.00%
0.02%
0.04%
0.06%
0.08%
0.10%
2012 2014 2016 2018
Shar
e of
GD
P (U
SD 2
019
PPP)
China European UnionIndia JapanUnited States

Tracking Clean Energy Innovation: A framework for using indicators to inform policy
PAGE | 18
IEA
. All
right
s re
serv
ed.
Chapter 3
Despite a small up-tick in some countries in recent years, a much smaller share of R&D spending goes to energy today compared to 30 years ago
Share of government budget appropriations or outlays for R&D allocated to energy in selected countries (left) and average share allocated to selected societal objectives in IEA countries (right)
IEA 2020. All rights reserved.
Note: T&T = transport and telecommunications. Five-year moving averages are used. Source: IEA analysis (2020) based on Organisation for Economic Co-operation and Development (OECD) data on government budget appropriations or outlays for R&D (OECD, 2020a). See also IEA (2020b).
0%
5%
10%
15%
20%
25%
1985 1990 1995 2000 2005 2010 2015 2020
Japan France CanadaAustralia Germany ItalyUnited Kingdom United States SpainIndia
0%
10%
20%
30%
40%
50%
1985 1990 1995 2000 2005 2010 2015 2020
Defence Health Space
Energy Agriculture T&T

Tracking Clean Energy Innovation: A framework for using indicators to inform policy
PAGE | 19
IEA
. All
right
s re
serv
ed.
Chapter 3
Corporate energy R&D spending has increased steadily since 2016 after a few years of stagnation, but budgets may come under pressure in 2020 and beyond in the wake of Covid-19
Estimated global corporate spending in energy RD&D, by technology area
IEA 2020. All rights reserved.
Notes: “Other” comprises CCUS, electricity storage, insulation, lighting, other fossil fuels and smart energy systems. Corporate energy R&D spending includes reported R&D spending by companies in sectors dependent on energy technologies, including energy efficiency where possible. Classifications are based on the Bloomberg Industry Classification System. “Automotive” includes technologies for fuel economy, alternative fuels and alternative drive-trains from main manufacturers. To allocate R&D spending for companies active in multiple sectors, shares of revenue per sector are used in the absence of other information. All publicly reported R&D spending is included, though companies domiciled in countries that do not require disclosure of R&D spending are under-represented. Depending on the jurisdiction and company, publicly reported corporate R&D spending can include a range of capitalised and non-capitalised costs, from basic research to product development, and, in some cases, resource exploration. Numbers over the period 2017-19 are updated compared to those in the World Energy Investment 2020 (IEA, 2020e). Source: IEA analysis (2020) based on Bloomberg data.
0
20
40
60
80
100
2010 2011 2012 2013 2014 2015 2016 2017 2018 2019
USD
(201
9) b
ln Other
Oil and gas
Thermal power andcombustion equipment
Nuclear
Electricity generation andnetworks
Renewables
Automotive
Tracking Clean Energy Innovation: A framework for using indicators to inform policy
PAGE | 20
IEA
. All
right
s re
serv
ed.
Chapter 3
Tracking private-sector spending in energy R&D: Different methodologies
Resources for innovation are mobilised by public and private actors, with public funds spent by researchers and entrepreneurs in either sector, including state-owned enterprises. Estimates for the shares of spending find private energy R&D spending exceeds public spending by at least three to one globally. Public and private spending is not directly substitutable because companies tend to focus more on incremental improvements and product development, but an overview of innovation inputs remains incomplete without estimating corporate contributions.
Better data can help reveal underserved technology areas, guide the design of public-private partnerships and assess policy effectiveness. In emerging economies, tracking private-sector innovation activities and spending may help better understand the role of multinationals in cross-country learning and technology adoption.
Tracking corporate R&D spending is challenging Tracking aggregate private-sector R&D spending is more challenging than for public budgets. A primary reason is confidentiality, with details of research, especially at the project level, being considered part of a firm’s competitive advantage. Companies have low incentives to share data unless they receive valuable insights into competitors’ behaviour in return. Another reason is definitional: sectoral categories do not always align with energy technology classifications, and the boundaries of R&D differ among companies and countries. For example, for tax purposes, exploration for energy resources can sometimes be included within R&D, while research
infrastructure, digital projects, demonstrations or supporting start-ups may not be included. The potential to double-count public funds spent by private-sector recipients must also be considered.
Firm-level surveys Some countries have developed firm-level questionnaires to estimate domestic corporate energy R&D spending. Canada and Italy collect data annually on corporate spending per energy technology area. Canada’s survey identified 1.5 billion Canadian dollars of energy-related R&D by Canadian firms, and a trend towards outsourcing for fossil fuel R&D (STATCAN, 2020, 2019). Italy’s survey estimated EUR 1.1 billion of spending by surveyed entities for 2018. Many other countries have surveys of corporate R&D across all sectors. In countries such as the United States, these also ask companies for their spending on energy R&D, which helps to reveal spending from outside the energy sector. To enable benchmarking, these surveys generally follow a common methodology promoted by the OECD and the United Nations Education, Scientific and Cultural Organization (UNESCO, 2014). Developing and emerging countries also undertake these exercises, with India’s latest R&D statistics published in March 2020 as an example (NSTMIS, 2020).
National surveys are often based on regulatory mandates, to ensure high response rates and consistent data over time. However, other approaches built on trust and mutual benefit have also provided insights, such as joint industry initiatives in Germany (Stifterverband, 2020).

Tracking Clean Energy Innovation: A framework for using indicators to inform policy
PAGE | 21
IEA
. All
right
s re
serv
ed.
Chapter 3
Using corporate financial reports Many companies publicly report annual R&D spending data to meet the needs of shareholders and regulators. Various methods have been used to translate these reports into estimates of corporate energy R&D spending by technology area. These approaches generally rely on commercial databases that aggregate corporate filings.
The IEA identified over USD 90 billion of global energy R&D by reporting companies in 2019, with about 60% directed towards clean energy technologies (IEA, 2020e). This used a method that reallocated reported spending not already assigned to specific technologies based on companies’ industrial classifications and sectoral shares of revenue. The European Commission coupled similar data with details of clean energy technology patents filed in the European Union as well as other inputs. Around EUR 15 billion of spending in 2016 was estimated by this approach, which covered the significant aggregate efforts of non-listed companies, such as small and medium-sized enterprises (SMEs) (Fiorini et al., 2017). The UN Environment Programme published an estimate that included the reported spending of companies working exclusively on technologies for renewable sources of energy, and tracked USD 7.7 billion globally in 2019 (UNEP, 2020).
These estimates provide valuable insights about trends and attention given to different technology areas in different countries. However, the lack of comprehensive data presents challenges such as: an absence of data on non-listed companies, including state-owned enterprises, family businesses and SMEs; time lags of up to three years in data availability for methods using patents to allocate
spending by technology; lack of visibility on the location of R&D activities, with reporting only at the level of corporate headquarters in most cases; and a particular challenge for estimating energy efficiency R&D undertaken in product development in non-energy sectors such as construction, transport and industry.
Building tracking into other policy practices Surveys of corporate energy R&D can take time to develop, but generate high-quality data. Governments may use established processes as a starting point and then build on them. Estimates based on tax returns for claimants of R&D tax credits are possible and can provide tailored insights if taxes are differentiated by activity or sector. In India, the formal recognition of private R&D centres by the Department of Science and Technology yields a dataset that could be used for work in this area. In China, state-owned enterprise R&D data are reported for the annual statistics of science and technology activities of industrial enterprises.
Other “carrot” or “stick” approaches could be adopted to improve data availability for policy making, depending on the objective. A certain level of information disclosure could be made a requirement of receipt of public funds. Alternatively, firms might volunteer to report updates to third parties for corporate governance purposes. For example, companies share some material on their low-carbon energy R&D with CDP Global, a non-profit organisation working with investors and companies on environmental disclosure, creating peer pressure for transparency. CDP Global estimated EUR 65 billion in low-carbon R&D in Europe in 2019 (CDP & Oliver Wyman, 2020).

Tracking Clean Energy Innovation: A framework for using indicators to inform policy
PAGE | 22
IEA
. All
right
s re
serv
ed.
Chapter 3
The stock of trained workforce in the global energy innovation system is steadily growing
Share of 25-34 year-old adults with tertiary education, in selected countries and regions
IEA 2020. All rights reserved.
Notes: Three-year moving averages and linear trends to fill data gaps are used. In this figure, “Europe” includes EU member countries (except Bulgaria, Croatia, Cyprus, Malta and Romania due to lack of data), Norway and Switzerland. Population with tertiary education is defined as those having completed the highest level of education, including theoretical programmes leading to advanced research or high skill professions and more vocational programmes leading to the labour market. Source: IEA analysis (2020) based on OECD data on educational attainment (OECD, 2020b).
0%
25%
50%
75%
1995 2000 2005 2010 2015 2020
Japan, Korea
Canada, United States
Europe
OECD average
Brazil, Chile, Mexico
China, India
Indonesia, South Africa

Tracking Clean Energy Innovation: A framework for using indicators to inform policy
PAGE | 23
IEA
. All
right
s re
serv
ed.
Chapter 3
The availability of skilled R&D personnel is critical to support energy innovation activities, and emerging economies are ramping up efforts to bridge the gap
Estimated number of personnel for energy R&D per million inhabitants in selected countries and regions
IEA 2020. All rights reserved.
Note: In this figure, “Europe” includes EU member countries (except Bulgaria, Croatia, Cyprus and Malta due to lack of data), Norway and Switzerland. Source: IEA analysis (2020) based on OECD data on R&D personnel (OECD, 2020c) and national documents.
0 250 500 750 1 000
Japan, Korea
Europe
Canada, United States
Brazil, Mexico
China, India

Tracking Clean Energy Innovation: A framework for using indicators to inform policy
PAGE | 24
IEA
. All
right
s re
serv
ed.
Chapter 4
Second pillar: Tracking knowledge management

Tracking Clean Energy Innovation: A framework for using indicators to inform policy
PAGE | 25
IEA
. All
right
s re
serv
ed.
Chapter 4
Knowledge management: Generating, protecting and disseminating new knowledge
Energy innovation systems generate new ideas and products and lead to incremental technology improvements, step changes in performance and radical new solutions to problems. “Knowledge management” refers to the processes that enable new knowledge to be created, protected, and flow among innovation actors and across stages of development.
Protecting and sharing new knowledge The primary output of innovation – new knowledge – must be protected. Knowledge protection programmes seek to reward inventors (e.g. through career advancement, financial returns and royalties, prestige or competitive advantage) and provide incentives to innovate. This may be achieved through academic publications, patents and more generally under IP regimes (Shane, 2004). Policy makers may seek to avoid burdensome and costly administrative procedures, long-term IP monopolies and new incumbency problems.
The more knowledge that flows among innovation actors, the quicker it can be incorporated into new ideas or used to identify dead ends. While some competition is healthy, information sharing and collaboration are also beneficial and may trigger spillovers (Fleming, Mingo & Chen, 2007; March, 1991; Powell, 1990). This may take place through “horizontal” knowledge networks disseminating ideas among different applications of the same technology (e.g. using Li-ion batteries for automotive and grid storage), “vertical” networks along the development stages of one of these applications (e.g. feedback of results from field experience to researchers, or from researchers to
policy makers) or “nodal” networks of organisations working on the same applications of the same technology (e.g. international group of researchers sharing results on the efficiency of CO2 capture). The gap between laboratories and markets may be particularly challenging to bridge (e.g. due to different mandates, incentives and working culture) and require dedicated policy efforts (ITIF, 2020). In large countries, regional may support national efforts. Engagement with global networks such as the IEA Technology Collaboration Programmes (TCPs) and MI should be promoted, including for emerging economies where international co-invention trends are observed (Branstetter, Li & Veloso, 2015; IEA, 2019).
Knowledge spillovers and knowledge depreciation New knowledge for a given technology may help improve performance or reduce costs for other technology applications. This “spillover” effect accelerates innovation (IEA, 2020b). For example, new electrochemical approaches to CO2 capture benefit from knowledge spillovers from more mature devices such as electrochemical batteries, including from mass manufacturing and design. Networks can help trigger such spillovers.
Conversely, technological knowledge can depreciate over time due to obsolescence or unstable “stop-and-go” support for innovation (Grubler & Nemet, 2012). Evidence suggests stability may be as important as the level of support to avoid the deterioration of innovation capabilities, proposing “small and stable” mechanisms over “boom and bust” ones.

Tracking Clean Energy Innovation: A framework for using indicators to inform policy
PAGE | 26
IEA
. All
right
s re
serv
ed.
Chapter 4
Knowledge management subfunctions, and how policy makers can support them Main function Subfunction Subfunction description Policy option examples
2. Knowledge management Protecting and sharing new knowledge, building on effective collaboration and strong networks
2a. Protect new knowledge
Enable and incentivise innovators to make their knowledge explicit and, especially for potentially high-impact ideas, protected
• Streamline procedures to file clean energy patents, and fund IP offices to provide administrative support to inventors, including innovative SMEs • Set tax incentives for filing patents (e.g. domestic patent boxes) and other support projects to protect IP internationally
2b. Strengthen knowledge networks
Promote domestic and international collaboration, facilitate access to knowledge and promote R&D networks
• Set incentives for collaborative energy R&D and demonstration, or minimum requirements for collaboration, including with private actors and across different regions domestically • Launch open calls for public-private collaborations, especially for large-scale complex demonstration projects • Set up centres of excellence in clean energy and technology clusters, including at the regional level, notably in large countries • Support networking and collaborative platforms, such as: scientific conferences and workshops on emerging topics, matchmaking among potential research partners, technology platforms, science and technology parks, technology transfer offices and co-location in incubators • Promote mobility among researchers, developers and users, for example via funding or tax incentives for personnel exchanges among and within academia, business and government, including internationally • Engage with international partners, bilaterally (e.g. joint R&D or academic exchanges) and through global networks such as IEA TCPs or MI • Promote sharing of knowledge arising from publicly funded projects (e.g. requirements to publish “open access” or make data available to peers)
2c. Prevent knowledge depreciation
Avoid deterioration of innovation capabilities and knowledge stocks
• Identify energy technology areas where a gap could open between two generations of scientists (e.g. long periods without building new plants in nuclear power), and ensure a base level of R&D funding and support for education in strategic fields for the clean energy transition • Earmark budgets for R&D and demonstration activities for 5-10 years (with room for adjustments every few years) to avoid boom and bust cycles

Tracking Clean Energy Innovation: A framework for using indicators to inform policy
PAGE | 27
IEA
. All
right
s re
serv
ed.
Chapter 4
Knowledge management metrics to track the energy innovation system’s primary outputs Energy innovation metric Possible use cases for tracking metrics Share of energy sector in scientific output volumes (publications or patents)
• Identify strengths, weaknesses and revealed preferences or priorities in domestic knowledge creation capabilities • Assess the ability to create and protect new knowledge relevant to the development of clean energy technologies • Track the success of energy innovation policies
Number (and share) of publications or patents related to priority energy technology areas Number of peer-reviewed publications in core journals relevant to energy Share of world scientific output Share of publications by publicly funded R&D projects, institutions and academia Share of publications among the top 10% most cited in the field, and other citation weights Citation-weighted publication impact, academic citations in patents Number of patents filed and granted, citation-weighted patent counts Share of patenting activity in global patenting and relative to other sectors Share of patenting activity by publicly funded R&D projects and institutions, relative to “control group” (non-publicly funded, corporate and foreign entities) Revealed technological advantage (RTA) for energy technologies, based on patents analysis Cost of filing a patent and average time between filing and granting Trends for “utility models” when data for “patents of invention” are not available Collaboration: number of domestic partnerships in energy R&D and demonstration programmes
• Assess the ability to disseminate knowledge among relevant innovation stakeholders • Promote collaborative work and multilateral RD&D activities, including with academia and industry • Promote open access to new knowledge • Review participation in energy innovation knowledge networks to ensure effective use and to identify engagement opportunities (e.g. regionally and globally such as IEA TCPs)
Share of programmes including at least one private-sector company Average number of parties in publicly funded R&D and demonstration programmes Leadership role in collaborative partnerships Existence and intensity of private-private energy R&D partnerships Collaboration: number of international partnerships (bilateral, regional and global) in energy RD&D Co-authorship and co-patenting: number of publications and patents with international parties Participation of overseas partners in domestic clean energy R&D programmes Participation in IEA TCPs Participation in MI, the Clean Energy Ministerial, United Nations mechanisms, etc. Participation in co-operation and networks for like-minded countries, such as emerging economies Range of energy sectors or technology areas covered by collaborative partnerships Networks: geographic coverage, size and intensity (number of researchers, institutions and regions) Diversity of participation in research networks (e.g. industry or policy makers) Number of annual scientific events relevant to energy (workshops or conferences) Members of Academy of Science (or equivalent) specialised in energy Knowledge sharing: share of academic publications that are open access

Tracking Clean Energy Innovation: A framework for using indicators to inform policy
PAGE | 28
IEA
. All
right
s re
serv
ed.
Chapter 4
Sustained public support is correlated with knowledge creation in Denmark and enabled the emergence of wind energy technologies
Sustained public funding for wind energy R&D in Denmark (left) is associated with increasingly dynamic low-carbon energy patenting activity in wind technologies by inventors residing in Denmark (right) since the 1990s
IEA 2020. All rights reserved.
Notes: Three-year moving averages are used to smooth curves. Counts of patents filed by inventors residing in Denmark in one or more geographical patent offices Source: IEA analysis (2020) based on OECD data on patents (OECD, 2020D). See also Neij & Andersen (2012) and Rohe (2020).
0
100
200
300
400
0
10
20
30
40
1990 1992 1994 1996 1998 2000 2002 2004 2006 2008 2010 2012 2014 2016
USD
(201
9) m
ln
Public funding for windenergy R&D (left)
Low-carbon energypatent counts in windtechnologies (right)
Period of 10+ years with patient public funding for R&D before new
knowledge generation uptake

Tracking Clean Energy Innovation: A framework for using indicators to inform policy
PAGE | 29
IEA
. All
right
s re
serv
ed.
Chapter 4
Patents: Are they a good proxy for knowledge creation?
A patent is an exclusive right granted for an invention by national, regional or global patent offices. There are various reasons why innovation actors may patent, such as building a competitive advantage and preventing imitations or generating revenues through licensing.
Priority reasons for patenting for selected innovation actors
Source: European Commission (2015) based on an Everis survey (2013).
The most common type of patent is a “patent of invention” (also “utility patent” under the US Patent and Trademark Office). Requirements for patents of invention are more stringent than for other types – such as utility models which have lower levels of novelty and can protect minor improvements of existing products – and they benefit from stronger and broader protection. There is general consensus that patents may be used as a proxy for knowledge
creation capacity, including in the energy sector, and increasingly also for emerging economies (Acs, Anselin & Varga, 2002; Acs, 1989; Hu, 2018; Johnstone, Hascic & Popp, 2010; Johnstone et al., 2011; Lam, Branstetter & Azevedo, 2017; Lee, 2013).
However, there are some caveats. First, not all patents are equal, notably because novelty requirements may vary across patent offices. Proxies for quality may be used to address this, such as international patents (see next page), citations or renewals. Second, inventors may, in some instances, keep industrial secrecy to avoid public disclosure of technical information, for example if the invention is too valuable to risk IP theft, or if it relates to sensitive technologies, such as in the early days of nuclear power (Goldschmidt, 1995, 1989; Laurence, 1980). Third, some inventions may not be patentable under traditional IP regimes (e.g. algorithms); hence, differences in patenting across technology areas may not be conclusive. Finally, other reasons not to patent may include costly, burdensome or lengthy procedures, or a lack of enforcement and legal protection, especially in emerging economies. Utility models may be informative in these instances.
Analysing patents generally involves selecting technology focus areas and examining the aggregate number of patents filed or granted over time. Normalising patent counts per units of GDP or R&D spending, or per number of inhabitants or researchers, may be helpful to benchmark different energy innovation systems. This report features illustrative metrics, using international patents as a proxy for quality, with data compiled and made readily available for analysis by the OECD.
Lower priority Higher priority
Prevent imitations
Preserve freedom of operations
Positive image of institution
Raise institution's monetary value
License out
Block competitor access
SMEs Public research organisations Universities

Tracking Clean Energy Innovation: A framework for using indicators to inform policy
PAGE | 30
IEA
. All
right
s re
serv
ed.
Chapter 4
Energy patenting trends: Using international patents
Patents are called international when patent offices in at least two countries have protected the invention. Patenting in several offices requires more time and resources, and often implies additional obstacles such as translation and navigating different legal systems, which is why internationalisation may proxy patent quality (Harhoff, Scherer & Vopel, 2013; Squicciarni, Dernis & Criscuolo, 2013; van Zeebroeck, 2010).
The main patent offices by number of patents granted are the US Patent and Trademark Office, the European Patent Office (EPO) and the Japanese Patent Office, followed by the China National Intellectual Property Administration. Each office offers specific procedures with different costs. The Patent Cooperation Treaty, run by the World Intellectual Property Organization (WIPO), enables protection of an invention in multiple countries at once (Lam, Branstetter & Azevedo, 2017). Patent families are useful when carrying out analysis of international patents – N or more offices have granted a patent of “Family N”. Four families are typically considered, referring to the three major offices, plus a local one.
Patent data may be accessed in different ways. Raw data are available on the EPO global patent statistical database, PATSTAT. This source references over 100 million patent documents and is widely used for research purposes, although it requires some knowledge in database interaction. The EPO’s “Y02” classification for climate change mitigation technologies (CCMTs) can examine clean energy technologies (Angelucci, Hurtado-Albir & Volpe, 2018; Fiorini et al., 2017). The classification is reviewed periodically, with parallel efforts
to develop metrics for non-CCMT (e.g. fossil fuel) energy technologies for benchmarking purposes. The OECD open-access patents platform that extracts and classifies PATSTAT data also includes a search filter for CCMTs (OECD, 2020D). Another global source is WIPO (WIPO, 2020).
Different institutions may use different technology filters to structure patent data extracted from PATSTAT or other sources; hence published numbers may differ even when the same source is used. Institutions may use other definitions for patent families, or other methodologies to count patents with several inventors (Fiorini et al., 2017). Therefore, trends are more reliable than absolute numbers.
International patenting strategies to reach global markets: The case of solar PV (China) and wind energy (Denmark)
Note: Patent counts in CCMTs related to solar PV and wind technologies, by inventor country of residence. Source: IEA analysis (2020) based on OECD data (OECD, 2020D).
0
100
200
300
400
2000 2005 2010 2015 2000 2005 2010 2015China (solar PV) Denmark (wind)
Family 1 Family 2 Family 3 Family 4

Tracking Clean Energy Innovation: A framework for using indicators to inform policy
PAGE | 31
IEA
. All
right
s re
serv
ed.
Chapter 4
There is a concerning decrease since the early 2010s in patenting activity for clean energy technologies, including relative to technologies in other sectors
Number of international low-carbon energy patents (left) and as a share of all technology patenting (right) in selected countries
IEA 2020. All rights reserved.
Notes: Patents in a selection of CCMTs related to low-carbon energy technologies (e.g. renewables, hydrogen, CCUS, storage and batteries, electric vehicles (EVs), biofuels, buildings energy efficiency and nuclear), filed in two or more geographical offices. Right-hand figure: three-year moving averages. Geographical distribution by inventor country of residence. In this figure, “Europe” includes EU member countries and Norway. Source: IEA analysis (2020) based on OECD data (OECD, 2020D). See also IEA (2020b).
0
200
400
600
800
1 000
1 200
1990 1994 1998 2002 2006 2010 2014
Pate
nt c
ount
s (p
er tr
l GD
P)
Japan EuropeUnited States ChinaIndia
0%
5%
10%
15%
20%
25%
1990 1994 1998 2002 2006 2010 2014
Shar
e in
tota
l pat
entin
gBrazil China DenmarkEurope India JapanKorea Mexico United States

Tracking Clean Energy Innovation: A framework for using indicators to inform policy
PAGE | 32
IEA
. All
right
s re
serv
ed.
Chapter 4
Some emerging economies are playing an increasingly important role in global low-carbon energy innovation, such as in solar technologies and electric mobility
Share of selected countries or regions in global international patenting for all low-carbon energy technologies (top), in solar technologies (middle), and in battery and EV technologies (bottom) over time
IEA 2020. All rights reserved.
Notes: Patents in a selection of CCMTs related to low-carbon energy technologies (e.g. renewables, hydrogen, CCUS, storage and batteries, EVs, biofuels, buildings energy efficiency and nuclear) filed in two or more geographical offices. Middle figure includes solar PV and thermal. Bottom figure includes EVs, EV charging and batteries. Geographical distribution by inventor country of residence. Source: IEA analysis (2020) based on OECD data (OECD, 2020D).
1990-99
2000-09
2010-15
2016
0% 10% 20% 30% 40% 50% 60% 70% 80% 90% 100%
Japan European Union United States Korea China India Rest of world
1990-99
2000-09
2010-15
2016
1990-99
2000-09
2010-15
2016

Tracking Clean Energy Innovation: A framework for using indicators to inform policy
PAGE | 33
IEA
. All
right
s re
serv
ed.
Chapter 4
Non-resident patenting can help bring new technologies from abroad, but may also induce risks of local market capture by foreign actors
Share of residents in granted patents for a selection of technologies, by filing office in selected countries or regions
IEA 2020. All rights reserved.
Note: Patent technology areas include (in order of WIPO categories): Electrical machinery, apparatus, energy; Semiconductors; Optics; Organic fine chemistry; Biotechnology; Macromolecular chemistry, polymers; Basic materials chemistry; Materials, metallurgy; Surface technology, coating; Micro-structural and nano-technology; Chemical engineering; Environmental technology; Engines, pumps, turbines; Thermal processes and apparatus; and Transport. In this figure, “Europe” includes EU member countries (except Cyprus and Malta due to lack of data), Norway and Switzerland. Source: IEA analysis (2020) based on WIPO patents data (WIPO, 2020)
0%
25%
50%
75%
100%
2000 2002 2004 2006 2008 2010 2012 2014 2016 2018
Shar
e of
resi
dent
s Europe
China
Japan, Korea
World average
EPO average
United States
Brazil, Mexico
South Africa

Tracking Clean Energy Innovation: A framework for using indicators to inform policy
PAGE | 34
IEA
. All
right
s re
serv
ed.
Chapter 4
India’s energy patenting has risen sharply since the 1990s, with a strong focus on renewables, smart grids and electric mobility
Number of Indian patents granted in selected low-carbon energy technologies (left) and benchmark against global trends (right)
IEA 2020. All rights reserved.
Notes: Patents granted in a selection of CCMTs related to low-carbon energy technologies (e.g. renewables, hydrogen, batteries and EVs, and efficiency), filed in two or more geographical offices. Geographical distribution by inventor country of residence. Right-hand graph: index (2005 = 100) of three-year moving average; dotted lines for global trends; solid lines for India. Source: IEA analysis (2020) based on OECD data (OECD, 2020D).
0
50
100
150
200
1990-99 2000-04 2005-09 2010-11 2012-13 2014-15 2016
Solar WindOther renewables Smart grids and buildingsHydrogen and CCUS Energy storage and EVsBiofuels
300
600
900
1 200
2000 2004 2008 2012 2016
Inde
x (2
005
= 10
0)
Renewables and biofuelsSmart grids and buildingsEnergy storage and EVs

Tracking Clean Energy Innovation: A framework for using indicators to inform policy
PAGE | 35
IEA
. All
right
s re
serv
ed.
Chapter 4
Relative to other low-carbon technologies, Japan’s innovation system is specialised in storage, electric mobility, hydrogen, smart grids and solar PV
Revealed technology advantage for selected low-carbon energy technologies in Japan
IEA 2020. All rights reserved.
Notes: The revealed technology advantage is calculated here as a unitless ratio between the share of patents in a given technology within all low-carbon energy technologies in Japan, and Japan’s share in global low-carbon energy patents that year. A ratio above 1 implies a relative specialisation of Japan’s innovation system in the given technology relative to other low-carbon energy technologies. International patents in two or more offices are used. Source: IEA analysis (2020) based on OECD data (OECD, 2020D).
0
0.5
1.0
1.5
2.0
2.5
1990 1995 2000 2005 2010 2015
Uni
tless
ratio EVs and charging
Energy storage and batteries
Smart grids
Solar PV
Hydrogen and fuel cells
Nuclear
Wind

Tracking Clean Energy Innovation: A framework for using indicators to inform policy
PAGE | 36
IEA
. All
right
s re
serv
ed.
Chapter 4
Assessing the impact of top universities and their collaboration with international partners
Number of academic publications in fields related to physical sciences and engineering per million inhabitants (bubbles); publication impact measured by the share in top 10% most cited (x-axis); and share of publications through international
collaboration (y-axis)
IEA 2020. All rights reserved.
Notes: Includes all universities in each country over the 2014-17 period. Average population over the period was used to normalise per million inhabitants. BRA = Brazil, CHN = China, DEU = Germany, DNK = Denmark, ESP = Spain, FRA = France, GBR = United Kingdom, IND = India, ITA = Italy, JPN = Japan, KOR = Korea, MEX = Mexico, NLD = the Netherlands, USA = United States, ZAF = South Africa. Source: IEA analysis (2020) based on CWTS Leiden Ranking 2019 data (CWTS, 2019).
CHN
FRA
DEU
IND
ITA
JPN
NLD
ESP
USA
BRAMEX
ZAF
KOR
DNK
GBR
500
1 500
0%
20%
40%
60%
80%
0% 5% 10% 15% 20%
Inte
rnat
iona
l co-
publ
ishi
ng ra
te
Share of publications among top 10% most cited in their field

Tracking Clean Energy Innovation: A framework for using indicators to inform policy
PAGE | 37
IEA
. All
right
s re
serv
ed.
Chapter 4
Top universities increasingly collaborate with international partners and provide open access to knowledge, but co-publishing with industry lags behind
Trends in international collaboration (top), open access of publications (middle) and co-publishing with industry (bottom)
IEA 2020. All rights reserved.
Note: AUS = Australia, AUT = Austria, BEL = Belgium, CAN = Canada, CHE = Switzerland, FIN = Finland, ISR = Israel, NOR = Norway, PRT = Portugal, SAU = Saudi Arabia, SGP = Singapore, SWE = Sweden Source: IEA analysis (2020) based on CWTS Leiden Ranking 2019 data (CWTS, 2019).
0%20%40%60%80%
Inte
rnat
iona
l
2006-09baseline
2014-17increase
0%20%40%60%80%
Ope
n ac
cess
2006-09baseline
2014-17increase
0%
4%
8%
12%
Indu
stry
2006-09
2014-17
2014-17

Tracking Clean Energy Innovation: A framework for using indicators to inform policy
PAGE | 38
IEA
. All
right
s re
serv
ed.
Chapter 4
International collaboration strategies can enable inventors to work with peers, generate new ideas and adapt technologies to local contexts
Co-patenting: Share of patents in low-carbon transport technologies filed jointly with an international inventor
IEA 2020. All rights reserved.
Notes: Patents in a selection of CCMTs related to low-carbon transport technologies, filed in two or more geographical offices. Geographical distribution by inventor country of residence. Source: IEA analysis (2020) based on OECD data (OECD, 2020D).
0%
25%
50%
75%
100%
2005 2006 2007 2008 2009 2010 2011 2012 2013 2014 2015 2016
Shar
e of
co-
pate
ntin
g Brazil
China
European Union
India
Japan
Mexico
United States

Tracking Clean Energy Innovation: A framework for using indicators to inform policy
PAGE | 39
IEA
. All
right
s re
serv
ed.
Chapter 4
Emerging economies increasingly engage with international partners through knowledge networks such as IEA TCPs
Number of current and prospective memberships in IEA TCPs, in a selection of IEA Family countries
IEA 2020. All rights reserved.
Notes: Prospective engagement refers to a survey carried out by the IEA in 2019 to identify priority countries with which TCPs would seek engagement. Participation numbers as of 29 September 2020. Source: IEA analysis (2020) adapted from Le Marois & Hilton (2019).
0 10 20 30 40
United StatesJapanKorea
CanadaChina
European CommissionGermanyAustralia
FranceSweden
SwitzerlandItaly
AustriaFinlandNorway
United KingdomDenmark
Currentparticipation
Prospectiveparticipation
0 10 20 30 40
SpainNetherlands
BelgiumIndia
MexicoIreland
New ZealandSouth Africa
PortugalBrazil
GreeceTurkey
ChileSingapore
MoroccoPoland
Thailand

Tracking Clean Energy Innovation: A framework for using indicators to inform policy
PAGE | 40
IEA
. All
right
s re
serv
ed.
Chapter 4
International collaboration through IEA TCPs enables knowledge sharing and joint research in a wide range of key technologies for clean energy transitions
Number of memberships in IEA TCPs in a selection of IEA Family countries, by technology focus area
IEA 2020. All rights reserved.
Notes: EC = European Commission. Participation numbers as of 30 July 2020. Source: IEA analysis (2020) based on TCP membership as of 29 September 2020.
0
10
20
30
40
UnitedStates
Japan Korea Canada China EC Australia France Germany Italy UnitedKingdom
India Mexico SouthAfrica
Brazil
Renewable energy and hydrogen Fusion power BuildingsElectricity Industry TransportCross-cutting Fossil fuels

Tracking Clean Energy Innovation: A framework for using indicators to inform policy
PAGE | 41
IEA
. All
right
s re
serv
ed.
Chapter 5
Third pillar: Tracking market pull

Tracking Clean Energy Innovation: A framework for using indicators to inform policy
PAGE | 42
IEA
. All
right
s re
serv
ed.
Chapter 5
Market pull: Making the business case for emerging technologies and generating new ideas
“Market pull” refers to the incentives for investment in R&D and product development that arise when there is growing demand for a new product or process, or perceived potential for demand growth. There are several important ways in which market forces “pull” ideas along the innovation process: the expectation of future revenue raises innovators’ interest in developing new products; product sales provide revenue to pay debts, reward investors and reinvest in R&D, helping to bridge the “valley of death”; and commercial scale-up leads to “learning by doing” and feeds innovators with new ideas for improvements and products.
Governments’ role in market creation Governments have helped create markets for clean energy technologies such as solar PV, biofuels and EVs. By helping to establish sheltered, or “niche”, parts of the market in which new products do not face full competition with incumbent technologies, the risks of investing in the first manufacturing plants or production facilities can be lowered enough to attract financing (Bennett, 2019). Policies such as portfolio standards, obligations and purchase incentives can be used to create successive niche markets of increasing size. These adjust over time as they initially target early adopters (those with a high willingness to pay for the product) and then, as costs fall, more cost-conscious buyers.
Various market-pull options are available to policy makers, which may be combined and adjusted over time. Relevant policy instruments include public procurement, purchase incentives, tax
credits, tax breaks, accelerated depreciation, tradeable certificates and monopoly rights.
Performance standards and certificates also create markets. For example, the development of high-efficiency heating, ventilation and air-conditioning systems in buildings may be supported by sectoral performance standards becoming more stringent over time, combined with targeted subsidies decreasing over time. Similarly, tighter fuel efficiency standards for car sales may help create markets for alternatives and can be combined with procurement for government fleets and municipal transport, or consumer subsidies. Carbon pricing can also help create favourable conditions for emerging energy technologies in some instances (Cunliff, 2019; IEA, 2020g, 2017).
Attracting private finance Market-pull approaches are instrumental in attracting private capital, as a complement to other innovation policies. For costly and complex energy technology demonstration projects (e.g. CCUS, biorefineries, advanced nuclear and certain industrial processes), commercial markets for their output ensure their sustainable operation and direct public grants. If market signals are weak or uncertain, complementary measures may help the flow of capital to products under development. Governments can promote the broader “doing innovation” environment, including through tailored support for entrepreneurs to access finance and building enabling infrastructure (IEA, 2020b).

Tracking Clean Energy Innovation: A framework for using indicators to inform policy
PAGE | 43
IEA
. All
right
s re
serv
ed.
Chapter 5
Market-pull subfunctions, and how policy makers can support them Function Subfunction Subfunction description Policy option examples
3. Market pull
Creating markets and supporting long-term growth to incentivise product development and help emerging technologies reach consumers
3a. Enable markets (short term)
Support niche market creation and seek market validation for new energy technologies
• Publicly procure pre-commercial nascent energy technologies, aligned with national R&D priorities (e.g. low-carbon mobility) • Provide subsidies and tax incentives for emerging technologies • Set preferential tax treatment for local procurement to stimulate the domestic energy innovation system • Carry out awareness campaigns, labelling
3b. Enable markets (long term)
Align market incentives to make the long-term business case for emerging energy technologies
• Set standards (e.g. performance, environmental or manufacturing) for all products on the market, with rising ambition over time • Set performance-based incentives for regulated energy entities • Set carbon pricing mechanisms to increase the incentives for clean energy innovation, notably among incumbents • Build enabling infrastructure needed for the deployment of emerging energy technologies (e.g. EV charging, hydrogen networks or smart grids) • Set incentives for exports (e.g. export credits) of clean technologies • Diversify and secure local, regional and global supply chains for key resources underpinning emerging clean energy technologies
3c. Promote the “doing innovation” business environment
Provide favourable and consistent market signals, ensure healthy access to finance, attract patient investors and address undue risks for energy entrepreneurs
• Ensure stability, duration and consistency of policies • Streamline business registration, certification and other administrative procedures for entrepreneurs and SMEs active in the clean energy space • Address permitting and other regulatory bottlenecks • Mitigate risks associated with access to finance (e.g. public development bank loans, state guarantees for commercial bank loans, grants, awards and prizes) • Stimulate and address weaknesses in clean energy VC (e.g. establish public venture funds, “match funds” schemes, tax measures, co-investments, accept higher risks or explore new business models) • Establish regulatory sandboxes to test new rules and gain experience • Facilitate norms, standards and safety regulations

Tracking Clean Energy Innovation: A framework for using indicators to inform policy
PAGE | 44
IEA
. All
right
s re
serv
ed.
Chapter 5
Market-pull metrics to assess conditions for new energy technologies and track market results
Energy innovation metric Possible use cases for tracking metrics
Public spending in early deployment and diffusion
• Mobilise public resources to develop demonstration, late-stage R&D and early market diffusion • Identify and target emerging energy technologies with public procurement or subsidy programmes • Assess ability to mobilise private-sector capabilities • Examine investments from foreign actors and their role in emerging technology development
Public procurement for emerging technologies Public subsidies for emerging technologies Public equity in energy start-ups or funds Number of publicly funded demonstration projects with private-sector co-financing Share of projects that reach operation within technology areas (e.g. CCUS projects) Private spending in early deployment of emerging energy technologies Share of low-carbon technologies Existence and strength of incentives for emerging technology deployment (e.g. fiscal incentives) Number of private companies involved in energy markets and active in emerging technologies Share of domestic incumbent vs. new companies Share of foreign actors active in domestic energy innovation FDIs in emerging technology deployment activities FDIs in enabling infrastructure (e.g. project finance for EV charging or hydrogen infrastructure) Relative market shares of emerging technologies (e.g. EVs in the automotive industry)
• Assess market shares for emerging technologies, and the existence and size of niche markets over time • Measure the improvements of selected emerging technologies over time (e.g. performance, costs, uses) • Design targeted policies to promote early diffusion of emerging technologies
Number of new entrants (e.g. firms, SMEs and start-ups) on the market Of which, non-traditional energy actors (e.g. digital companies in energy) Diversification of innovation activities from incumbents Share of energy incumbents’ R&D projects in emerging low-carbon technologies Productivity improvements in the clean energy industry linked to innovation activities Number and nature of new energy products on the market (e.g. in hard-to-abate sectors) Sales, turnover, and capacity of technologies sold and used Return on investment (average) for investors on companies in general or new product lines Diversity of new products and services Number of new plants, production lines, process improvements, etc. Medium-term market growth (penetration) forecast for emerging energy technologies Resilience of supply chains for emerging technologies (e.g. diversity of suppliers or location) Export prospects for strategic energy technologies Rate of cost reduction for key energy technologies (e.g. market price trends or learning curves)
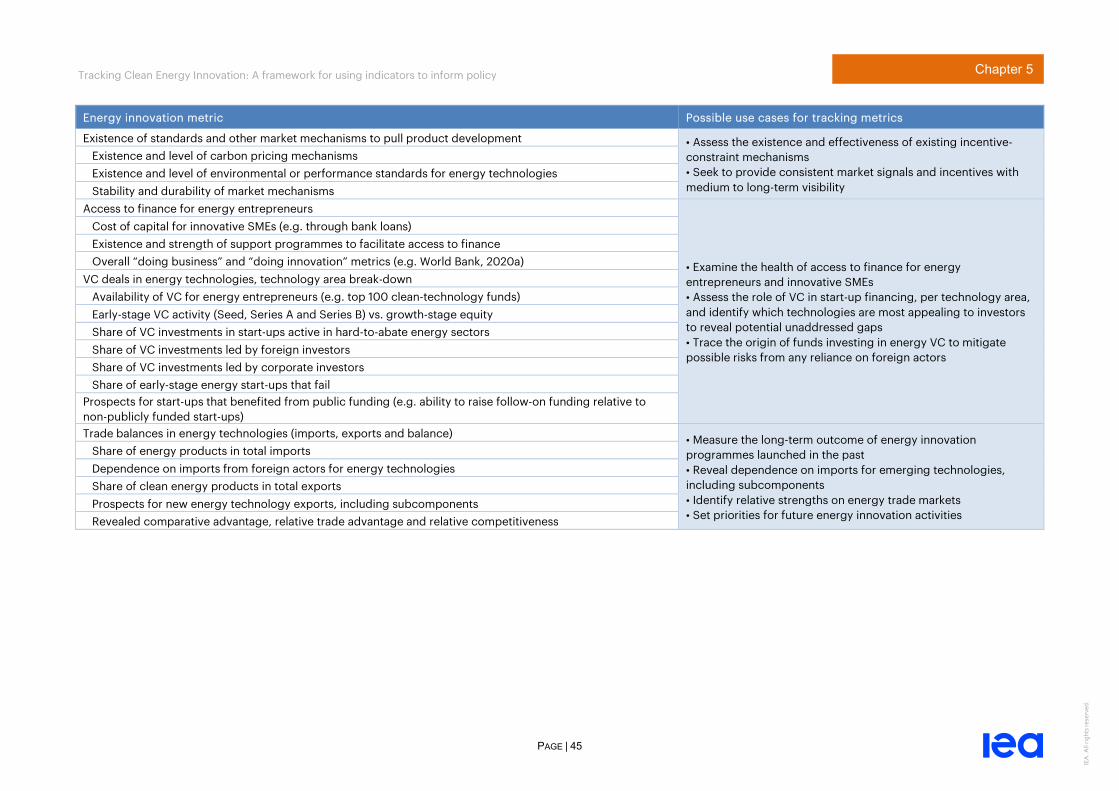
Tracking Clean Energy Innovation: A framework for using indicators to inform policy
PAGE | 45
IEA
. All
right
s re
serv
ed.
Chapter 5
Energy innovation metric Possible use cases for tracking metrics
Existence of standards and other market mechanisms to pull product development • Assess the existence and effectiveness of existing incentive-constraint mechanisms • Seek to provide consistent market signals and incentives with medium to long-term visibility
Existence and level of carbon pricing mechanisms Existence and level of environmental or performance standards for energy technologies Stability and durability of market mechanisms Access to finance for energy entrepreneurs
• Examine the health of access to finance for energy entrepreneurs and innovative SMEs • Assess the role of VC in start-up financing, per technology area, and identify which technologies are most appealing to investors to reveal potential unaddressed gaps • Trace the origin of funds investing in energy VC to mitigate possible risks from any reliance on foreign actors
Cost of capital for innovative SMEs (e.g. through bank loans) Existence and strength of support programmes to facilitate access to finance Overall “doing business” and “doing innovation” metrics (e.g. World Bank, 2020a) VC deals in energy technologies, technology area break-down Availability of VC for energy entrepreneurs (e.g. top 100 clean-technology funds) Early-stage VC activity (Seed, Series A and Series B) vs. growth-stage equity Share of VC investments in start-ups active in hard-to-abate energy sectors Share of VC investments led by foreign investors Share of VC investments led by corporate investors Share of early-stage energy start-ups that fail Prospects for start-ups that benefited from public funding (e.g. ability to raise follow-on funding relative to non-publicly funded start-ups) Trade balances in energy technologies (imports, exports and balance) • Measure the long-term outcome of energy innovation
programmes launched in the past • Reveal dependence on imports for emerging technologies, including subcomponents • Identify relative strengths on energy trade markets • Set priorities for future energy innovation activities
Share of energy products in total imports Dependence on imports from foreign actors for energy technologies Share of clean energy products in total exports Prospects for new energy technology exports, including subcomponents Revealed comparative advantage, relative trade advantage and relative competitiveness

Tracking Clean Energy Innovation: A framework for using indicators to inform policy
PAGE | 46
IEA
. All
right
s re
serv
ed.
Chapter 5
VC activity in clean energy start-ups remains dominated by US and European markets, with a growing presence of emerging economies
Global VC investments (early and late stage) in clean energy start-ups, by country or region
IEA 2020. All rights reserved.
Notes: Deals with undisclosed deal value are not reported. Outlier deals of above USD 1 billion that distort year-on-year trends are excluded. These aggregated to USD 3.5 billion in 2011, 4.8 in 2012, 8.0 in 2013, 5.4 in 2014, 1.3 in 2015, 1.6 in 2016, 2.9 in 2017, 6.3 in 2018 and 1.3 in 2019. Early stages include seed, series A and series B deals. Other stages include grants, growth equity, private investment in public equity, late-stage, buy-out, and coin/token offering. In this figure, “Europe” includes EU member countries, Norway and Switzerland. Source: IEA analysis (2020) based on Cleantech Group i3 database. See also IEA (2020e).
0
5
10
15
20
2010 2011 2012 2013 2014 2015 2016 2017 2018 2019
USD
(201
9) b
ln
Rest of world
India
China
Europe
United States

Tracking Clean Energy Innovation: A framework for using indicators to inform policy
PAGE | 47
IEA
. All
right
s re
serv
ed.
Chapter 5
Assessing access to finance options for innovators and the ease of starting a business as proxies for the broader “doing innovation” environment
Availability of VC (left), ease of access to loans for SMEs (middle) and ease of starting a business (right) in selected countries
IEA 2020. All rights reserved.
Notes: Left and middle graphs are based on survey question scores (1-7) by the World Economic Forum that measure the ease of access to finance for businesses. Right graph is based on World Bank assessments (1-100) of costs, time and constraints related to registering a new business. In this figure, “Europe” includes EU member countries, Norway and Switzerland. Source: IEA analysis (2020) based on World Bank data (WB, 2020a) and World Economic Forum data (WEF, 2019).
1
2
3
4
5
6
7
2007 2011 2015 2019
Scor
e (1
-7 o
r 1-1
00)
VC availability
Brazil, Chile, Mexico China Europe India, Indonesia
Japan Korea South Africa United States
50
75
100
2005 2010 2015 2020
Starting a business
1
2
3
4
5
6
7
2007 2011 2015 2019
SME loan access

Tracking Clean Energy Innovation: A framework for using indicators to inform policy
PAGE | 48
IEA
. All
right
s re
serv
ed.
Chapter 5
Ensuring a favourable “doing innovation” environment and healthy access to finance
The health of the “doing innovation” ecosystem in which innovators evolve matters. For example, start-ups and innovative SMEs may be hindered by limited access to finance (e.g. access to grants, VC, bank loans and public equity).
Barriers to entry are high for newcomers in energy. The energy sector is more regulated than most economic segments and sometimes dominated by large incumbents, including state-controlled enterprises, in many countries. Many energy technologies are complex, capital intensive and take a long time to develop, which increases technical and financial risks. These factors may also decrease incentives for incumbents to carry out cutting-edge innovation.
One way entrepreneurs may seek financing for technology innovation is through VC. The IEA tracks global VC investments in clean energy start-ups, which encouragingly increased to USD 16 billion in 2019 (IEA, 2020e). However, a drop is expected in 2020 as the Covid-19 economic crisis induces new uncertainties and risks (IEA, 2020b). Tracking early-stage deals may be a proxy for nascent technologies, and growth equity for the ability to scale up and diffuse in larger markets. Breaking down VC investments into technology areas may reveal where investors consider market conditions and prospects most appealing. Examining the origin of funds may point to the ability to attract, or conversely a reliance on, foreign investments.
Financing may come through bank loans in many areas of the world. The cost of and ease of access to these may be tracked. In Asia, where 96% of businesses are SMEs, 70% of India’s and 80% of China's financial system consist of bank loans (Yoshino & Taghizadeh-Hesary, 2018, 2015). Capital markets including energy VC are less developed in those countries as well as in Japan or Korea. Research suggests that riskier SMEs and start-ups face difficulty in borrowing money, which may limit innovation. Policy approaches such as Japan’s network of over 50 Credit Guarantee Corporations or Korea’s Credit Guarantee Fund may be used to mitigate this risk. The OECD also provides a compilation of instruments to develop SME access to finance (OECD, 2020e).
The availability, affordability and ease of access to specific public services (e.g. register and close a business, file IP or tax documents) may be tracked, in addition to access to finance. These enable innovators to focus on core activities (OECD, 2010). Such services may become increasingly important in the wake of Covid-19 (OECD, 2020f). Survey data and other metrics are made available for example by the World Bank (WB, 2020a) and the World Economic Forum (WEF, 2019).

Tracking Clean Energy Innovation: A framework for using indicators to inform policy
PAGE | 49
IEA
. All
right
s re
serv
ed.
Chapter 5
VC activity in clean energy start-ups in Europe recovered well after the slowdown in the 2010s, but entrepreneurs may face difficulties raising funds in 2020 and beyond
Early-stage (left) vs. all stages (right) VC activity in energy start-ups headquartered in Europe, by technology area
IEA 2020. All rights reserved.
Notes: Deals with undisclosed deal value are not reported. Outlier deals of above USD 1 billion that distort year-on-year trends are excluded. Early stages include seed, series A and series B deals. Other stages include grants, growth equity, private investment in public equity, late-stage, buy-out, and coin/token offering. In this figure, “Europe” includes EU member countries and Norway. Source: IEA analysis (2020) based on Cleantech Group i3 database. See also IEA (2020e).
0
30
60
90
120
0
200
400
600
800
2010 2013 2016 2019
USD
(201
9) m
ln
Low-carbon transport Solar BioenergyOther renewables Other low-carbon energy Energy storage, hydrogen, fuel cellsEnergy efficiency Conventional fuels Number of deals (right)
0
50
100
150
200
250
0
1
2
3
4
5
2010 2013 2016 2019
USD
(201
9) b
ln

Tracking Clean Energy Innovation: A framework for using indicators to inform policy
PAGE | 50
IEA
. All
right
s re
serv
ed.
Chapter 5
Energy and transport start-ups in the Asia Pacific region have grown quickly since 2015, but overall activity remains dominated by finance and services, information and communications technology, and consumer goods
Sectoral distribution of top 500 Asia Pacific start-ups (bars, x-axis) and associated average compound annual growth rate over 2015-18 (circles, percentages), with a focus on energy-relevant sectors (gold colour)
IEA 2020. All rights reserved.
Notes: “Top 500” refers to start-ups with highest cumulative growth in the region. Source: IEA analysis (2020) based on Financial Times data (FT, 2020).
75%
63%
73%
59%
31%
37%
60%
53%
82%
111%
40%
33%
133%
0 25 50 75 100 125 150
Finance and services
Information and communications technology
Consumer goods
Health
Industry
Agriculture and food
Education and media
Buildings
Transport
Energy
Waste and recycling
Chemicals
Space and defence

Tracking Clean Energy Innovation: A framework for using indicators to inform policy
PAGE | 51
IEA
. All
right
s re
serv
ed.
Chapter 5
India’s VC market for clean energy technologies is increasingly dynamic, but its reliance on foreign investors may trigger instability in the wake of Covid-19
Early-stage VC activity in energy start-ups headquartered in India, by technology area (left) and origin of investor (right)
IEA 2020. All rights reserved.
Note: Deals with undisclosed deal value or investors are not reported. Source: IEA analysis (2020) based on Cleantech Group i3 database. See also IEA (2020e).
0
3
6
9
12
15
0
100
200
300
400
500
2010 2011 2012 2013 2014 2015 2016 2017 2018 2019
USD
(201
9) m
ln
Low-carbon transport SolarBioenergy Other renewablesOther low-carbon energy Energy storage, hydrogen, fuel cellsEnergy efficiency Number of deals (right)
0
100
200
300
400
500
2015 2016 2017 2018 2019
India United States
United Arab Emirates Japan
Europe
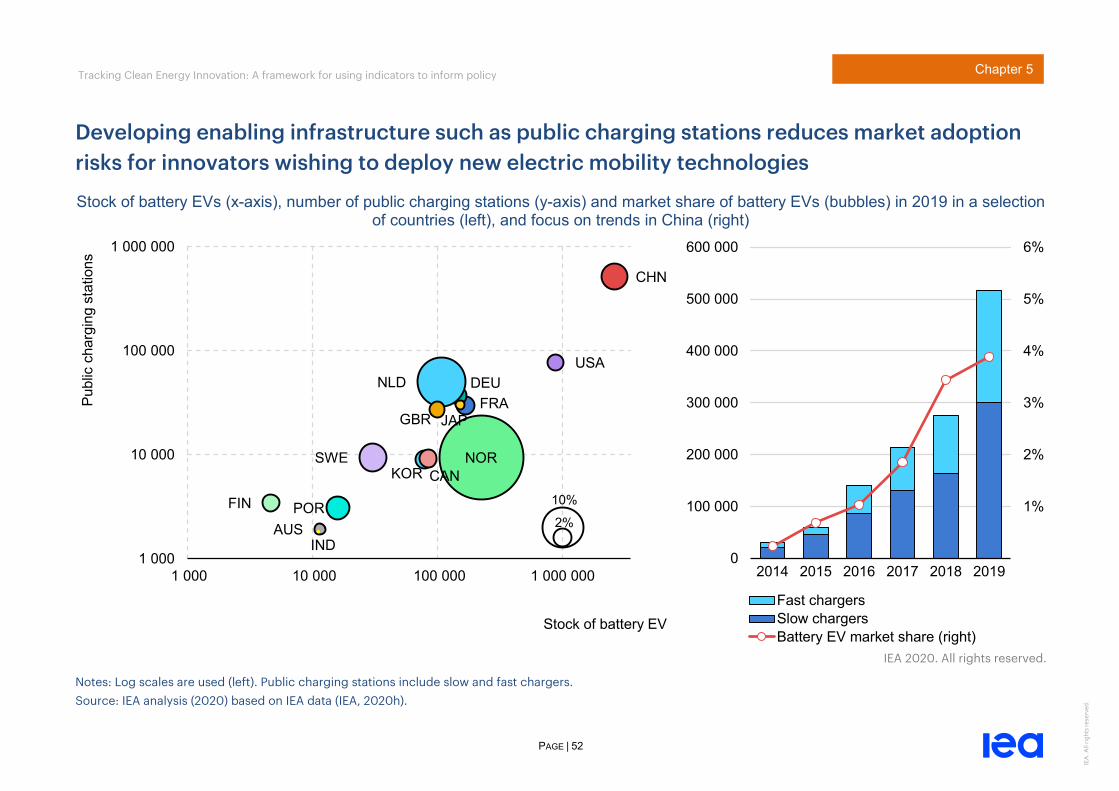
Tracking Clean Energy Innovation: A framework for using indicators to inform policy
PAGE | 52
IEA
. All
right
s re
serv
ed.
Chapter 5
Developing enabling infrastructure such as public charging stations reduces market adoption risks for innovators wishing to deploy new electric mobility technologies
Stock of battery EVs (x-axis), number of public charging stations (y-axis) and market share of battery EVs (bubbles) in 2019 in a selection of countries (left), and focus on trends in China (right)
IEA 2020. All rights reserved.
Notes: Log scales are used (left). Public charging stations include slow and fast chargers. Source: IEA analysis (2020) based on IEA data (IEA, 2020h).
AUS
CAN
CHN
FIN
FRADEU
IND
JAP
KOR
NLD
NOR
POR
SWE
GBR
USA
2%
10%
1 000
10 000
100 000
1 000 000
1 000 10 000 100 000 1 000 000
Publ
ic c
harg
ing
stat
ions
Stock of battery EV
1%
2%
3%
4%
5%
6%
0
100 000
200 000
300 000
400 000
500 000
600 000
2014 2015 2016 2017 2018 2019
Fast chargersSlow chargersBattery EV market share (right)

Tracking Clean Energy Innovation: A framework for using indicators to inform policy
PAGE | 53
IEA
. All
right
s re
serv
ed.
Chapter 6
Fourth pillar: Tracking socio-political support

Tracking Clean Energy Innovation: A framework for using indicators to inform policy
PAGE | 54
IEA
. All
right
s re
serv
ed.
Chapter 6
Socio-political support: Mobilising citizens and industry for technological change
Energy innovation is rooted in actors, institutions and norms. It may be accelerated or hindered by society’s readiness for change, including that of citizens, firms, politicians and other legitimate vested interests (Grubler et al., 2012; Hekkert et al., 2007). “Socio-political support” refers to the processes through which actors are mobilised, and support or oppose the direction or outcomes of innovation.
Direction and common expectations are important Providing a guiding direction for technological change may be needed to focus stakeholder efforts as new knowledge or alternatives arise while final performance or cost remain uncertain (Boon & Edler, 2018; Ford & Hardy, 2020; Grubler et al., 2012; Hekkert et al., 2020; Kuhlmann & Rip, 2018; Mazzucato, 2018a; Sinsel, Markard & Hoffmann, 2020). Establishing shared expectations may help reduce uncertainty, mitigate risks associated with technology “hype”, shape consumer behaviour, and understand and lessen any possible resistance from incumbents. A culture of risk taking and experimentation may need developing to promote support and excitement for more dynamic innovation, although it may already be familiar in some national and corporate cultures.
Governments can promote collaborative approaches Policy makers might use energy planning agencies or long-term technology roadmaps, consulting technology experts, academia, industry and citizens. Citizens’ assemblies have emerged in recent
years as tools for exploring social preferences and establishing a bottom-up foundation for debate. Communication can also help to test and shape societal preferences such as emissions reduction objectives.
Building trust through an inclusive and collaborative process will help secure buy-in from key stakeholders. This includes within governments, if various institutions are involved in innovation with different mandates, resources and interests (Kretschmer, Grimm & Mehl, 2020; Mazzucato, 2018b). If well designed, mission-oriented innovation schemes can help build momentum for joint action and accelerate clean energy development, such as Norway’s cross-agency PILOT-E project (OECD, 2020h). As the role of corporate actors typically increases as the system matures, a balanced public-private collaboration may also be needed, including to anticipate possible resistance from those who could lose out, such as existing incumbents (Grubler et al., 2012). Strong networks also support innovation through dissemination and openness.
Surveys can be used to track against a baseline Informal expectations about policy, society and technology (e.g. consumer and industry sentiment) can be surveyed to reveal socio-political issues to be addressed in complement to technology roadmaps (Pettifor et al., 2020; Upham et al., 2020). Tracking of public, political or investor attitudes can be performed against a known baseline, if surveys are established early in the process and repeated regularly, as is the case with the European Commission’s Eurobarometer surveys.

Tracking Clean Energy Innovation: A framework for using indicators to inform policy
PAGE | 55
IEA
. All
right
s re
serv
ed.
Chapter 6
Socio-political support subfunctions, and how policy makers can support them Function Subfunction Subfunction description Policy option examples
4. Socio-political support Promoting public and industry buy-in, readiness for change and acceptability of disruptive energy technologies
4a. Inform decision-making through consultation
Seek expert advice and socio-political buy-in, provide clear and common expectations to focus efforts, and develop readiness for technological change
• Conduct TNAs in consultation with technology experts to identify pressing local innovation gaps (e.g. performance and cost) • Conduct public consultations to determine national energy innovation priorities (e.g. with technology experts and academics, policy makers, non-governmental organisations and advocacy groups, citizens, industry or start-up finance) • Conduct surveys to identify socio-technological issues that need addressing (e.g. consumer behaviour or industry sentiment) • Organise citizens’ assemblies, and set requirements for stakeholder consultation for large projects
4b. Build trusted and collaborative processes
Ensure transparency, communicate publicly about innovation decisions and strategies, promote collaboration and provide a feeling of ownership to innovation actors
• Embed monitoring and evaluation frameworks within energy R&D programmes and policies, and publish progress reports annually • Ensure independence and inclusiveness of governance structures for public research institutions, policy advisory and co-ordination bodies, and publish annual reports for publicly funded R&D programmes • Publish technology roadmaps with medium to long-term horizons, and update targets as innovation activities unfold • Set clear and forward-looking long-term objectives (e.g. emissions reductions, standards, nationally determined contributions, carbon pricing) • Organise public debates and media strategies to inform citizens of energy and innovation decisions and vision • Strengthen linkages among knowledge networks, policy makers and energy R&D funding decisions, and publish reports accordingly • Communicate intentions underpinning large-scale public-private partnerships, track outcomes and make these publicly available • Promote collaborative energy R&D and demonstration programmes, including across different regions and sectors • Promote engagement with industry associations, and strengthen links among industry and energy research networks • Promote a culture of entrepreneurship in the public discourse, and set incentives to innovate (e.g. performance targets for regulated incumbent entities or innovation prizes in education)

Tracking Clean Energy Innovation: A framework for using indicators to inform policy
PAGE | 56
IEA
. All
right
s re
serv
ed.
Chapter 6
Socio-political support metrics to track societal readiness for technological change
Energy innovation metric Possible use cases for tracking metrics
Existence of and support for energy technology roadmaps
• Provide long-term signalling and expectations to the innovation system • Ensure policy signals and programmes are credible, consistent and durable • Ensure transparency and open access to results from public energy innovation programmes • Publish results of energy R&D activities and policies
Number of energy subsectors or technology areas covered by technology roadmaps Frequency of updates (e.g. in years) Share of milestones achieved in past technology roadmaps (e.g. performance targets) Existence and credibility of long-term clean energy transition targets and objectives Share of emissions covered by long-term mitigation objectives Policy target density (e.g. number of targets or action plans) Policy target durability (e.g. average cumulative number) Effectiveness of government institutions in introducing energy innovation mechanisms Policy density (e.g. number of instruments) Policy durability (e.g. average number of cumulative instruments) Policy diversity (e.g. Shannon index) Policy stability (e.g. average of cumulative years) Existence of independent monitoring and evaluation mechanisms for R&D programmes and policies Share of public R&D programmes disclosing results publicly Share of public bodies involved in energy innovation that publish annual reports Public availability of the results of public-private collaborative projects Public spending on fossil fuels relative to clean energy technologies
• Assess public readiness for technological change and clean energy transitions • Evaluate support for clean energy transitions and individual technologies
Public spending in fossil fuel energy R&D and demonstration Subsidies for fossil fuels Public opinion (e.g. web searches, social media mentions and other digital metrics) on … … clean energy transitions and climate change … selected energy technologies (e.g. onshore wind, small modular nuclear reactors or CCUS) … innovation in general (e.g. technological change, experimentation or risk taking) … failure (e.g. decline in interest following a technology failure) Number of major companies with environmental statements Strength and credibility of corporate climate targets Energy incumbent investments in low-carbon energy technologies Involvement of financial actors (e.g. banks and pension funds) in the clean energy discourse

Tracking Clean Energy Innovation: A framework for using indicators to inform policy
PAGE | 57
IEA
. All
right
s re
serv
ed.
Chapter 6
Energy innovation metric Possible use cases for tracking metrics
Diversity and collaboration in energy innovation activities
• Promote collaboration in energy R&D projects Diversity of actors in scientific publications Diversity of actors in energy-related patents Diversity of actors in research collaborations Share of public energy RD&D projects that involve collaboration Existence, participation and strength of industry associations
• Engage with industry stakeholders and advocacy groups, and identify possible lobbying power • Promote collaboration in decision-making related to energy innovation priorities and activities
Public affairs activities (budgets, events) in favour of different technology options Involvement of energy innovation actors in decision-making Existence and independence of consultation processes and high-level policy advisory committees (e.g. to determine energy innovation priorities or to guide energy policy) Diversity of actors involved in decision-making (e.g. industry, advocacy groups or universities) Involvement of citizens groups and non-governmental organisations

Tracking Clean Energy Innovation: A framework for using indicators to inform policy
PAGE | 58
IEA
. All
right
s re
serv
ed.
Chapter 6
Society’s inclination to pursue disruptive ideas and reward entrepreneurial risk contributes to the effectiveness of energy innovation systems
Business opinion survey results related to societal appetite for entrepreneurial risk (blue), firm inclination to embrace risky or disruptive ideas (green) and ability of new innovative firms to grow (gold), in selected countries
IEA 2020. All rights reserved.
Note: Survey scores range from 1 (“not at all”) to 100 (“to a great extent”). In this figure, “Europe” includes EU member countries, Norway and Switzerland. Source: IEA analysis (2020) based on World Economic Forum data (WEF, 2019).
0
20
40
60
80
100
Brazil, Chile,Mexico
China Europe India,Indonesia
Japan Korea South Africa United States
Scor
e (1
-100
)
Appetite for entrepreneurial risk Firms with disruptive ideas Growth of innovative firms

Tracking Clean Energy Innovation: A framework for using indicators to inform policy
PAGE | 59
IEA
. All
right
s re
serv
ed.
Chapter 6
Collaboration among innovation stakeholders to share ideas
Business opinion survey results related to collaboration between universities and industry in R&D (left) and among firms in sharing ideas and innovation (right), in selected countries
IEA 2020. All rights reserved.
Note: Survey scores range from 1 (“not at all”) to 7 (“to a great extent”) and scales are adjusted for clarity. In this figure, “Europe” includes EU member countries, Norway and Switzerland. Source: IEA analysis (2020) based on World Economic Forum data (WEF, 2019).
3
4
5
6
2007 2011 2015 2019
Scor
e (1
-7)
University-industry collaboration in R&D
Brazil, Chile, Mexico China Europe India, Indonesia
Japan Korea South Africa United States
1
2
3
4
5
6
7
2017-19 average
Firm-firm collaboration in innovation

Tracking Clean Energy Innovation: A framework for using indicators to inform policy
PAGE | 60
IEA
. All
right
s re
serv
ed.
Chapter 6
Domestic support for energy technologies can develop (or hinder) technological change
Public opinion on whether countries should use more or less of selected energy technologies (survey results, 2017)
IEA 2020. All rights reserved.
Notes: Avg = average. The survey polled 26 000+ citizens across selected countries. Values show the difference between the share of proponents and of opponents for each energy technology, based on the following question: “do you think your country should use more, or less, of each of these types of energy?” UK and US respondents were not polled on coal. Source: IEA analysis (2020) based on Orsted data (Orsted, 2017).
-100%
-50%
0%
50%
100%
Avg CAN CHN DNK FRA DEU JPN NLD POL KOR SWE GBR USA
Supp
ort f
or m
ore
use
Solar Offshore wind Onshore wind Tidal power Bioenergy Nuclear Natural gas Coal

Tracking Clean Energy Innovation: A framework for using indicators to inform policy
PAGE | 61
IEA
. All
right
s re
serv
ed.
Chapter 7
Using innovation metrics

Tracking Clean Energy Innovation: A framework for using indicators to inform policy
PAGE | 62
IEA
. All
right
s re
serv
ed.
Chapter 7
Tracking clean energy innovation requires a range of indicators
This report’s review of clean energy innovation indicators shows there is no single metric that effectively tracks policy or technology progress. Rather, there is a full list of metrics under the four pillars of successful innovation systems. Only by employing a range of indicators can the system’s health be assessed and a link made between policy and outcomes. Governments at all levels can select indicators and construct tracking strategies based on policy objectives and resources. They may also focus on putting in place the processes needed to start establishing time series data that will be the foundation for future efforts, since data for many metrics may not be available.
This section reviews the energy policy purposes for which innovation indicator strategies can be employed and concludes with several insights for public policy makers and private-sector leaders.
How governments can use innovation indicators Seven possible uses of energy innovation indicators are identified in the table on the next page. Innovation indicator strategies may need to evolve dynamically with the technologies or sectors they seek to track. For example, in Brazil, the set of policies that supported bioethanol innovation changed over four decades, and adapted to external economic and socio-political factors (Furtado, Hekkert & Negro, 2020; Meyer et al., 2012). Tracking progress of bioethanol innovation in Brazil would thus require monitoring a range of metrics over long periods of time. Similarly, solar and wind emerged over several decades and countries, requiring a mixture of supporting policies (Neij & Andersen, 2012; Nemet, 2012; Rohe, 2020; Zhang & Gallagher, 2016).
Policies to stimulate bioethanol innovation in Brazil
Selected policy tool or mechanism RP KM MP SPS
1975-79: Stimulating the bioethanol industry Low-interest loans to expand mills and distilleries Guaranteed purchase prices Blending mandates for corporate actors R&D funding for biofuels and agriculture Collaborative programmes with industry Subsidies for car manufacturing industry 1979-85: Accelerating innovation and scaling up Fixed guaranteed purchase prices Lower sales taxes and licensing fees for vehicles Distribution and pump infrastructure 1985-2003: Uncertainty and relative stagnation A range of factors hindered market uptake and innovation (e.g. political regime transition, debt crisis, hyperinflation and oil price deflation)
2003-10: Flex-fuel vehicles and consolidation Favourable tax treatments Reduced annual licensing fees Co-operation with car industry multinationals Promotion of collaboration, including internationally Revamp of bioethanol R&D programmes
Notes: KM = knowledge management; MP = market pull; RP = resource push; SPS = socio-political support. Green-coloured cells indicate that the policy tool or mechanism may fall under the corresponding pillar(s) of the IEA energy innovation framework. Source: IEA analysis based on Furtado (2020), Hekkert & Negro (2020), Meyer et al. (2012)

Tracking Clean Energy Innovation: A framework for using indicators to inform policy
PAGE | 63
IEA
. All
right
s re
serv
ed.
Chapter 7
Seven possible uses for energy innovation indicators in energy policy Use Objective Possible indicators that could be “quick wins” for tracking Examples
1. Baseline definition
Establish the status quo for an indicator before policy intervention
• Public opinion on clean energy transitions and technologies • Number of private companies involved in clean energy innovation • VC activity for energy start-ups, and type and origin of investors • Number of domestic collaborations and international partnerships • Policy stability and volatility of public funding for energy R&D
EU Eurobarometer surveys; IEA country Energy Policy Reviews (e.g. India 2020)
2. Gaps and opportunities
Identify areas of clean energy innovation that are underserved or have synergies with policy objectives and existing capacity
• Public funding for R&D and demonstration per energy technology • Number of subsectors or technologies covered by roadmaps • Domestic patenting trends in priority technology areas • Long-term clean energy objectives and targets
EU Progress of Clean Energy Competitiveness; US Quadrennial Energy Review
3. International benchmarking
Analyse and benchmark national performance and opportunities to share good practices with other countries
• Revealed technology advantage based on patent analysis • Cost of filing a patent and average time before granting • Ability of energy entrepreneurs and start-ups to access finance
EPO or OECD analyses
4. Innovation system tracking
Track the overall performance of the innovation system against policy objectives
• Public and private R&D spending in priority energy technologies • Share of clean energy products in exports and imports • FDIs in energy innovation activities or infrastructure • Number of new entrants (firms, SMEs or start-ups) on the market
Italy Istat survey; Canada industry energy R&D expenditure survey
5. Technology progress
Track the performance and costs of priority technology areas against stated goals
• Cost reductions (e.g. market price trends) • Success rate of demonstration projects within technology areas • Number of new plants, lines and process improvements • Achievement of past targets (e.g. performance, cost, readiness)
Japan Progressive Environment Innovation Strategy; EU SET-Plan key performance indicators
6. Policy evaluation
Track the performance of an individual policy measure or funding programme, ideally in comparison to a counterfactual
• Knowledge sharing: share of publications that are open access • Share of patenting in global activity and relative to other sectors • Patenting and publishing by funded entities • Ability of funded projects and companies to raise follow-on funds • Number of new products brought to markets
National Academy of Sciences’ ARPA-E review; EU Court of Auditors reports; Norway Research Council 2019 review of energy programmes
7. Global overview Communicate the impact of national endeavours, and identify global weaknesses or imbalances of resources
• Energy R&D spending by technology area break-down • Early-stage vs. growth-stage VC activity, sectoral break-down • International patenting trends, regional break-down • Global market shares and evolving outlooks for technologies
IEA World Energy Investment; MI annual reports

Tracking Clean Energy Innovation: A framework for using indicators to inform policy
PAGE | 64
IEA
. All
right
s re
serv
ed.
Chapter 7
Tracking outcomes of the energy innovation system: The example of technology trade
In addition to metrics that can track the four pillars of the energy innovation system, higher-level indicators can show progress against the overall objectives of innovation policy. While these “outcome” metrics are generally harder to relate directly to policy interventions, they are a litmus test for whether the outcomes of the innovation system are impacting the wider world. Trade is one such metric.
Trade balances can generate several insights. Strong exports of emerging energy technologies (or components) indicate that domestic innovators successfully reap benefits from earlier investments in innovation. Similarly, highly innovative countries with delocalised manufacturing may generate revenues from FDI or technology licensing abroad. Future innovation priorities might be identified from such areas of innovation success and comparative advantage or, conversely, from areas of growing spending on imports. Trade balance metrics can also help anticipate how and where domestic market-pull policies will stimulate innovation and investment.
Trade as a market-pull mechanism Trade is not only an outcome of innovation. It can also stimulate follow-on innovation as knowledge about new ideas and technologies diffuses (Grossman & Helpman, 1991). Trade in new technologies diversifies and expands market feedback and broadens the scope for knowledge spillovers, as the technology interacts with different users and contexts. It also enables countries to develop comparative advantages in certain areas and, by diversifying export destinations
can reduce policy and markets risks for entrepreneurs. If trade brings higher revenues, this can enhance incentives for domestic innovators and decrease the risks of R&D spending in smaller or emerging economies (OECD, forthcoming, 2012; Pigato et al., 2020; van der Loos, Negro & Hekkert, 2020).
How to track trade in emerging energy technologies The OECD has pre-selected certain categories of trade data that correspond to so-called environmental goods (OECD, 2020g). These categories are based on Harmonized System (HS) codes, standardised by the World Customs Organization. Countries report the value (in USD) and quantity (in tonnes) of imports and exports to all other countries for each HS code, which can provide a high degree of granularity in cases such as battery or vehicle types (CEPII, 2020). While HS codes are not detailed enough to separate new energy technologies from related equipment in some cases – for example, solar PV modules and LEDs fall under the same category in international statistics – some countries provide more itemisation in national data, including China. Additionally, innovation that increases exports of critical intermediate components for low-carbon technologies – inverters, efficient construction materials, motors or gears – cannot easily be tracked with international data as the products are indistinguishable from those for non-clean energy uses.
To identify trends, trade can tracked as a share of GDP or total trade, or used to derive metrics such as revealed comparative advantage.
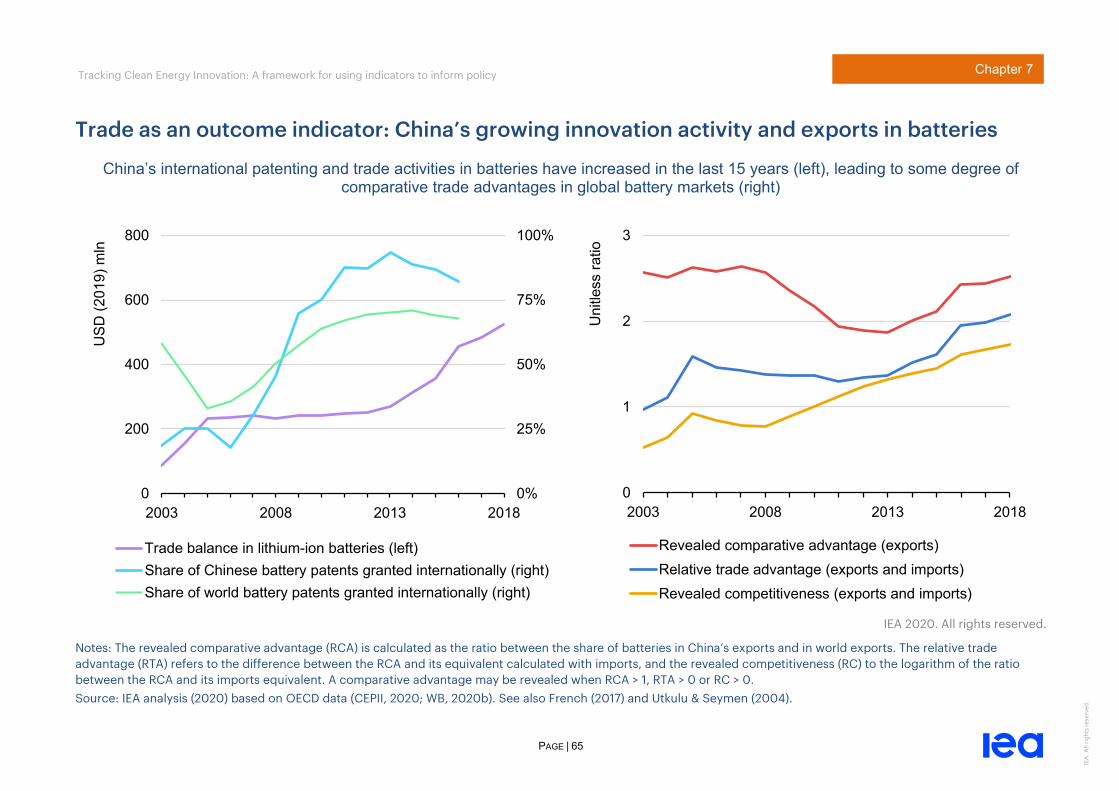
Tracking Clean Energy Innovation: A framework for using indicators to inform policy
PAGE | 65
IEA
. All
right
s re
serv
ed.
Chapter 7
Trade as an outcome indicator: China’s growing innovation activity and exports in batteries
China’s international patenting and trade activities in batteries have increased in the last 15 years (left), leading to some degree of comparative trade advantages in global battery markets (right)
IEA 2020. All rights reserved.
Notes: The revealed comparative advantage (RCA) is calculated as the ratio between the share of batteries in China’s exports and in world exports. The relative trade advantage (RTA) refers to the difference between the RCA and its equivalent calculated with imports, and the revealed competitiveness (RC) to the logarithm of the ratio between the RCA and its imports equivalent. A comparative advantage may be revealed when RCA > 1, RTA > 0 or RC > 0. Source: IEA analysis (2020) based on OECD data (CEPII, 2020; WB, 2020b). See also French (2017) and Utkulu & Seymen (2004).
0%
25%
50%
75%
100%
0
200
400
600
800
2003 2008 2013 2018
USD
(201
9) m
ln
Trade balance in lithium-ion batteries (left)Share of Chinese battery patents granted internationally (right)Share of world battery patents granted internationally (right)
0
1
2
3
2003 2008 2013 2018
Uni
tless
ratio
Revealed comparative advantage (exports)Relative trade advantage (exports and imports)Revealed competitiveness (exports and imports)

Tracking Clean Energy Innovation: A framework for using indicators to inform policy
PAGE | 66
IEA
. All
right
s re
serv
ed.
Chapter 7
Trade as an outcome indicator: India’s potential to capture more of its battery and motor markets through innovation
Indian imports (-) and exports (+) of a selection of energy technologies relevant to electric buses
IEA 2020. All rights reserved.
Notes: Up to 2018, India’s exports of hybrid, natural gas and electric buses mostly consisted of hybrid models. Harmonized system trade balance codes used in this figure are 850650, 870290 and 850153. Source: IEA analysis (2020) based on CEPII data (CEPII, 2020).
- 150
- 100
- 50
0
50
2012-14 2015-17 2018 2012-14 2015-17 2018 2012-14 2015-17 2018Lithium-ion batteries Hybrid, natural gas and electric buses Electric motors of over 75 kW
USD
(201
9) m
ln
Imports (China) Imports (France, Germany and Italy)Imports (Japan and Korea) Imports (Rest of world)Exports

Tracking Clean Energy Innovation: A framework for using indicators to inform policy
PAGE | 67
IEA
. All
right
s re
serv
ed.
Chapter 7
Embedding evaluation in policy design to ensure interventions are effective and of good value
Energy innovation indicators are essential for answering core questions that remain under-researched, such as: “which policy instruments most effectively support clean energy technology innovations?” and “how could policy be more effective and efficient in the future?” Many ex post evaluations focus on administrative efficiency, are narrow in scope, early in their execution or hampered by a lack of data – especially baseline data. Some evaluations are also overseen by the implementing institution itself, rather than independent auditors (IEA, 2020i).
The Covid-19 pandemic has strengthened the case for better understanding how additional spending could translate into real-world outcomes and whether existing programmes can be made more efficient. Different approaches can be tested and experiences shared internationally to benefit practitioners, policy makers and taxpayers.
Policy evaluation against objectives Fundamental questions for evaluators are “what were the objectives?”, “what aspects of the policy drove innovation?” and “which proxies can reflect them?” To identify relevant metrics, mapping interactions between innovation activities and policies is a prerequisite to establish a baseline. As there are pitfalls to relying heavily on metrics for evaluation, they should support rather than replace qualitative inputs (Hicks et al., 2015). For example, approaches that evaluate socio-political influences on innovation outcomes will be more helpful for future policy making.
If chosen wisely, embedding metrics in policy design can establish a framework for evaluation and ensure that administrative costs are covered. Regulatory impact assessments in some jurisdictions compel policy makers to adopt proxies and can enshrine these in future appraisals. An impact assessment for new demonstration funds might establish metrics for the number of successful projects in a given time frame and the private co-financing and follow-on investment needed.
Identifying causal effects A core challenge lies in quantifying how much of the innovation outputs and outcomes can be attributed to a policy, relative to a counterfactual without intervention. Various approaches have been used to compare outcomes with those of “control groups”, but true randomised trial equivalents are hard to find (Pless, Hepburn & Farrell, 2020). In all cases, evaluation will be enhanced by tracking “failures” and successes, for example by surveying unsuccessful applicants or abandoned ideas (Goldstein et al., 2020). This can be embedded in policy design ex ante.
The right time to evaluate a policy Uncertain time delays exist between R&D funding and deployment, particularly in the energy sector. A phased approach to evaluation might include an initial baseline, an administrative assessment after a year, an output assessment after five years and an outcome assessment after ten years or more. Findings can be reintegrated into subsequent design.

Tracking Clean Energy Innovation: A framework for using indicators to inform policy
PAGE | 68
IEA
. All
right
s re
serv
ed.
Chapter 7
The specific challenges and opportunities for innovation indicators in emerging economies
Most future energy demand growth will come from emerging economies, (IEA, 2020j). China shapes a significant number of energy decisions and is a top investor in new technologies. Africa, Brazil, India and Southeast Asia are also expected to exert a growing influence. These countries have patterns of infrastructure, geography, climate and society that place new demands on the design and adaptation of energy technologies. There is an opportunity for them to lead clean energy development in some technology areas as they focus on investing in local clean energy innovation for short and long-term economic benefits, in terms of jobs, wealth creation and environmental goals.
Are emerging economies different? Emerging countries do not generally have long legacies of indigenous technology development and deployment, and are often importers of energy technology. Their energy R&D spending in absolute terms and as a share of GDP is lower than in IEA member countries, with the notable exception of China. Series of economic crises and “stop-and-go” support have hindered innovation in many regions.
Data collection and administrative capacities for tracking progress remain weak, although several emerging economies are developing new policies to propel R&D outputs to market. There may be contested institutional ownership of innovation portfolios in some instances (IEA, 2020k). Participation of local private firms in energy R&D tends to be lower and the share of state-owned enterprises higher, which presents challenges for tracking due to blurred boundaries between public and
private sectors. Each of these disparities could be widened by the Covid-19 crisis unless targeted by dedicated actions.
How to get a head start in tracking innovation progress The best time to develop an energy innovation indicator strategy is when new policies, budgets and policy objectives are defined, because it offers the opportunity to create the institutional frameworks to collect and make data available in the future, such as in coherent annual reporting. It need not be based solely on existing data.
Innovation indicator strategies can first focus on priority areas where policy success has most political attention, for example by capitalising on existing capacity (ClimateWorks, 2019). Mapping exercises to identify key public and private innovation actors, and their roles and incentives can be helpful. The IEA and other organisations can support efforts to benchmark against emerging markets and other like-minded peers. Good practice sharing can flow both ways since many countries do not have strategies to track innovation progress. Existing regulations can be a foundation for building new evaluation capacities and “patched” without waiting for them to be replaced or expire (e.g. Howlett & Rayner, 2013). For example, India’s approval process for private research organisations and Brazil’s regulation on energy company R&D can provide an initial basis for data gathering. Existing surveys of R&D practitioners are another starting point (UNESCO, 2014).

Tracking Clean Energy Innovation: A framework for using indicators to inform policy
PAGE | 69
IEA
. All
right
s re
serv
ed.
Chapter 7
Tracking clean energy innovation in the corporate sector
The private sector has strong incentives to track and evaluate energy innovation progress. The need to ensure revenue is reinvested wisely in pursuit of a competitive edge is ever present, similar to the pressure on the government to justify investments made on behalf of the taxpayer. However, many corporate strategists in the energy sector struggle to identify leading indicators of performance relative to competitors, despite access to detailed information on company activities. It can take years to bring new energy hardware to market, unlike in the digital technology sector. Hence, firms must be highly selective about which projects to take forward.
Pillars of the corporate energy innovation system The pillars of the clean energy innovation system also apply to corporate R&D. Funds, infrastructure and recruitment are needed for “resource push”; partnerships, IP and management systems are needed for “knowledge management”; marketing and proprietary platforms can create “market pull” from consumers; and maintaining a strong brand and “socio-political support” guide technology choices and advocacy.
Advantages and limits of proprietary data One advantage of corporate innovation tracking is internal visibility over all spending and a direct link to innovation outputs. Measures like R&D spending per unit of revenue and share of prototypes that become bestsellers are straightforward to calculate. However, benchmarking often remains elusive without knowing how competitors perform. Consultants have been given permission to undertake comparative
analysis of confidential data in some cases, but there is often little visibility of all the pillars, including key factors such as corporate culture.
Tracking progress towards an open innovation culture Attempts have been made since the 1990s to apply tracking frameworks and indicators to corporate innovation. Approaches such as the “stage gate” method, “portfolio theory” and “third generation R&D management” were widely adopted by large energy companies, which put in place new management structures to administer them. Many of these approaches sought to align the incentives of corporate R&D laboratories with the strategies of business units, and use output indicators to decide which projects should progress through defined stages of development.
More recently, mismatches among the changing technological landscape of the energy sector, the expertise of corporate R&D laboratories and the near-term incentives of business unit managers have led to increased strategic focus on “open innovation”, “intrapreneurship” and business experiments. More emphasis is being placed on “knowledge management” metrics and reallocation of “resource push” via corporate VC investing. Tracking progress towards new working cultures and partnerships is an ongoing challenge for companies seeking to thrive throughout clean energy transitions.

Tracking Clean Energy Innovation: A framework for using indicators to inform policy
PAGE | 70
IEA
. All
right
s re
serv
ed.
Chapter 7
Conclusion: Five insights for policy and future work
1. Innovation policy should be a core part of energy policy. Technology innovation may be uncertain, but it is key to clean energy transitions and can be tracked alongside other energy policy objectives with more immediate and tangible measures. This report has provided an introduction to some of the options available to policy makers to identify technology needs and opportunities, allocate resources, adjust portfolios and learn from experience.
2. There is no single indicator for tracking clean energy innovation progress. Clean energy innovation indicators can do much more than survey inputs to the innovation system. By making the four pillars of the clean energy innovation system explicit, this report highlights the benefits of tracking a broader set of indicators, which may be chosen from the long lists in preceding chapters, or others not yet encountered. The history of innovation in the energy sector shows it has always been a collaborative and global process, with successive researchers and business leaders refining and adapting the most promising solutions over decades. To the extent possible, indicators should be chosen to accommodate the emergence of new ideas and products from unexpected sources, including knowledge spillovers from outside the sector.
3. Strategies for tracking clean energy innovation are long-term commitments that evolve over time. Tracking clean energy innovation in detail is rarely possible using existing data.
Therefore, indicator strategies should include developing the administrative capacities to gather, process and share data. Tracking metrics may need to adapt to the changing roles of the four pillars as technologies mature, when tracking the progress of specific technologies such as biofuels, CCUS and hydrogen.
4. Policy evaluation remains underdeveloped, but embedding indicators in policy design can start to address this weakness. There is considerable scope for governments to improve policy evaluation and embed indicators in relevant regulations and R&D programmes from the outset. It is important to evaluate against stated policy objectives, for example those set out in regulatory impact assessments. International exchanges of experience could be particularly valuable in this area, given the need to accelerate clean energy innovation and ensure public funds are used to maximise the chances of innovation success.
5. Innovation system mapping and best practice sharing are ways to get started quickly, especially for emerging economies. Emerging economies face challenges in scaling up administrative tracking capabilities in line with their potential to lead future clean energy technology development. The Covid-19 crisis has exacerbated this situation just as stimulus funds, including from international donors, could inject new capital. Countries could stand better chances of making good policy choices as economic recovery gathers pace, by starting to put in place tracking systems and mapping existing capabilities.

Tracking Clean Energy Innovation: A framework for using indicators to inform policy
PAGE | 71
IEA
. All
right
s re
serv
ed.
Annexes
Annex

Tracking Clean Energy Innovation: A framework for using indicators to inform policy
PAGE | 72
IEA
. All
right
s re
serv
ed.
Annexes
Annex A: Matching the four pillars with literature on technology innovation systems
This report uses a four-pillar representation of successful technology innovation systems, which draws upon a broad range of functions identified by researchers (Bergek, 2011; Bergek, Hekkert & Jacobsson, 2008; Bergek et al., 2008; Hekkert et al., 2007). To keep the framework as concise as possible without losing the value of a broad, systemic perspective, functions have been allocated in the way that we think is most practically useful for policy makers. We have, for example, included functions related to “guidance of the search” alongside other resource push functions that seek to direct research efforts and routines.
As noted by others, the functions of the four pillars are interrelated and interact with one another. It is often the case that private investments in R&D could be linked to either resource push or the market pull incentives that motivate them. A strong signal from any single pillar – such as a surge in market demand, societal expectations or capital allocations – will have an effect on the others, by stimulating a change in the direction of the search, availability of knowledge or resources available.
Innovation indicators may provide insights in relation to more than one pillar. For example, those that represent changes in the networks that connect stakeholders are relevant to both the support for information flows (knowledge management) and promotion of shared expectations (socio-political support). Trends in VC deals, especially if supported by public policy, can reflect both resource availability for innovators (resource push) as well as the market’s appetite for the new technology (market pull). The metrics presented in this report can therefore be adapted to their intended purposes.
Matching the four pillars with functional analysis literature
IEA innovation framework Functions from the literature
1. Resource push Providing sustained flows of inputs and guiding the direction of the search
• Identify problems (functional failures, imbalances, bottlenecks) • Guide the direction of search (problem definition, priority setting, regulation) • Supply resources (funding, competence, incentives for companies)
2. Knowledge management Generating, protecting and disseminating new knowledge
• Create and protect new knowledge (R&D, search and experimentation, learning by doing, IP regimes) • Guide the direction of search (selection process for new ideas and concepts) • Facilitate the exchange of information (feedback, networks, spillovers)
3. Market pull Making the business case for emerging technologies and generating new ideas
• Supply incentives for companies • Stimulate and create markets (support entrepreneurial activities, market formation) • Recognise the potential for growth (attract resources, recognise commercial viability) • Guide the direction of search (standards) • Facilitate exchange of information and knowledge (market feedback loops, internal co-ordination within companies or sectors)
4. Socio-political support Mobilising citizens and industry for technological change
• Reduce social uncertainty (prevent or solve conflicts, set shared expectations) • Counteract resistance to change (provide legitimacy, stimulate enthusiasm) • Guide the direction of search (norms) • Facilitate exchange of information and knowledge (promote collaboration)
Notes: Includes a selection of possible functions (e.g. Bergek, 2011; Hekkert et al., 2007). Others may be relevant to functional analysis of technology innovation systems.

Tracking Clean Energy Innovation: A framework for using indicators to inform policy
PAGE | 73
IEA
. All
right
s re
serv
ed.
Annexes
References
Acs, Z.J., L. Anselin & A. Varga (2002), Patents and innovation counts as measure of regional production of new knowledge, https://doi.org/10.1016/S0048-7333(01)00184-6
Acs, Z.J. & D.B. Audretsch (1989), Patent as a measure of innovative activity, https://doi.org/10.1111/j.1467-6435.1989.tb00186.x
Angelucci, S., F.J. Hurtado-Albir & A. Volpe (2018), Supporting global initiatives on climate change: The EPO's “Y02-Y04S” tagging scheme, https://doi.org/10.1016/j.wpi.2017.04.006
Bennett, S., Accelerating clean energy innovation means tailoring R&D policy to technology scale and risk (IEA Article) (2019), https://www.iea.org/articles/accelerating-clean-energy-innovation-means-tailoring-r-and-d-policy-to-technology-scale-and-risk
Bennett, S.J. & P.J.G. Pearson (2009), From petrochemical complexes to biorefineries? The past and prospective co-evolution of liquid fuels and chemicals production in the UK, https://doi.org/10.1016/j.cherd.2009.02.008
Bergek, A. (2011), Functions in innovation system approaches, https://www.researchgate.net/publication/253725869_Functions_in_Innovation_System_Approaches
Bergek, A., M.P. Hekkert & S. Jacobsson (2008), Functions in innovation systems: A framework for analysing energy system dynamics and identifying goals for system building activities by entrepreneurs and policy makers, https://www.researchgate.net/publication/46678191_Functions_in_Innovation_Systems_a_framework_for_analysing_energy_system_dynamics_and_identifying_goals_for_system_building_activities_by_entrepreneurs_and_policy_makers
Bergek, A., S. Jacobsson, B. Carlsson, S. Lindmark & A. Rickne (2008), Analyzing the functional dynamics of technological innovation systems: A scheme of analysis, https://doi.org/10.1016/j.respol.2007.12.003
Boon, W. & J. Edler (2018), Demand, challenges, and innovation. Making sense of new trends in innovation policy, https://doi.org/10.1093/scipol/scy014
Branstetter, L., G. Li & F. Veloso (2015), The rise of international coinvention. In: A.B. Jaffe and B.F. Jones (eds.), The Changing Frontier: Rethinking Science and Innovation Policy, p. 135–168. University of Chicago Press, http://doi.org/10.7208/chicago/9780226286860.003.0006
CDP & Oliver Wyman (2020), Doubling down: Europe’s low-carbon investment opportunity, https://www.cdp.net/en/research/global-reports/doubling-down
CEPII (Centre d’Études Prospectives et d’Informations Internationales) (2020), Base pour l’Analyse du Commerce International, http://www.cepii.fr/cepii/en/bdd_modele/presentation.asp?id=37 (accessed May 2020)
ClimateWorks (2019), Low carbon opportunities for Indonesia, the Philippines and Vietnam, https://www.climateworksaustralia.org/resource/low-carbon-opportunities-for-se-asia/
Cunliff, C. (2019), Omission Innovation 2.0: Diagnosing the global clean energy innovation system, https://itif.org/publications/2019/09/23/omission-innovation-20-diagnosing-global-clean-energy-innovation-system
Cunliff, C. & D.M. Hart (2019), Global energy innovation index: National contributions to the global clean energy innovation system, https://itif.org/publications/2019/08/26/global-energy-innovation-index-national-contributions-global-clean-energy

Tracking Clean Energy Innovation: A framework for using indicators to inform policy
PAGE | 74
IEA
. All
right
s re
serv
ed.
Annexes
CWTS (Centre for Science and Technology Studies) (2019), CWTS Leiden Ranking 2019 (database, 17 July 2019 version), Leiden University, https://www.leidenranking.com/ranking/2019/list (accessed 31 December 2019)
de Oliveira, L.G.S. & S.O. Negro (2019), Contextual structures and interaction dynamics in the Brazilian Biogas Innovation System, https://doi.org/10.1016/j.rser.2019.02.030
de Oliveira, L.G.S., J.S. Lacerda & S.O. Negro (2020), A mechanism-based explanation for blocking mechanisms in technological innovation systems, https://doi.org/10.1016/j.eist.2020.07.006
European Commission (2020), Report on progress of clean energy competitiveness, https://ec.europa.eu/energy/sites/ener/files/report_on_clean_energy_competitiveness_com_2020_953.pdf
European Commission (2015), Patent costs and impact on innovation: International comparison and analysis of the impact on the exploitation of R&D results by SMEs, Universities and Public Research Organisations, http://ec.europa.eu/research/innovation-union/pdf/patent_cost_impact_2015.pdf
Fiorini, A., A. Georgakaki, F. Pasimeni & E. Tzimas (2017), Monitoring R&I in low-carbon energy technologies, https://op.europa.eu/s/oiHg, and associated country dashboards, http://dx.doi.org/10.2760/519466 (more information at: https://setis.ec.europa.eu/publications/setis-research-innovation-data)
Fleming, L., S. Mingo & D. Chen (2007), Collaborative brokerage, generative creativity, and creative success, https://doi.org/10.2189%2Fasqu.52.3.443
Ford, R. & J. Hardy (2020), Are we seeing clearly? The need for aligned vision and supporting strategies to deliver net-zero electricity systems, https://doi.org/10.1016/j.enpol.2020.111902
French, S. (2017), Revealed comparative advantage: What is it good for?, https://doi.org/10.1016/j.jinteco.2017.02.002
FT (Financial Times) (2020), FT ranking: Asia-Pacific high-growth companies (web page), https://www.ft.com/high-growth-asia-pacific-ranking-2020
Furtado, A.T., M.P. Hekkert & S.O. Negro (2020), Of actors, functions, and fuels: Exploring a second generation ethanol transition from a technological innovation systems perspective in Brazil, https://www.sciencedirect.com/science/article/pii/S2214629620302814
Goldschmidt, B. (1995), The supplies of Norwegian heavy water to France and the early development of atomic energy. In: The Race for Norwegian Heavy Water, 1940-1945, https://fhs.brage.unit.no/fhs-xmlui/bitstream/handle/11250/99533/INF0495.pdf
Goldschmidt, B. (1989), How it all began in Canada - The role of the French scientists. In: 50 Years of Nuclear Fission in Review, http://cns-snc.ca/media/history/fifty_years/goldschmidt.html
Goldstein, A., C. Doblinger, E. Baker & L.D. Anadon (2020), Patenting and business outcomes for cleantech start-ups funded by the Advanced Research Projects Agency-Energy, https://doi.org/10.1038/s41560-020-00683-8
Grossman, G.M. & E. Helpman (1991), Innovation and growth in the global economy, https://mitpress.mit.edu/books/innovation-and-growth-global-economy
https://ec.europa.eu/energy/sites/ener/files/report_on_clean_energy_competitiveness_com_2020_953.pdf

Tracking Clean Energy Innovation: A framework for using indicators to inform policy
PAGE | 75
IEA
. All
right
s re
serv
ed.
Annexes
Grubler, A. & G. Nemet (2012), Historical case studies of energy technology innovation, Sources and consequences of knowledge depreciation. In: The Global Energy Assessment, Cambridge University Press, Cambridge, United Kingdom
Grubler, A. & C. Wilson (2014a), Energy Technology Innovation: Learning from Historical Successes and Failures, Cambridge University Press, Cambridge, United Kingdom, https://books.google.fr/books?id=HNkaAgAAQBAJ
Grubler, A. & C. Wilson (2014b), Policies for energy technology innovation. In: Energy Technology Innovation: Learning from Historical Successes and Failures, Cambridge University Press, Cambridge, United Kingdom, p. 371–387
Grubler, A., F. Aguayo, K.S. Gallagher, M. Hekkert, K. Jiang, L. Mytelka, L. Neij, G. Nemet & C. Wilson (2012), Policies for the energy technology innovation system (ETIS). In: The Global Energy Assessment, Cambridge University Press, Cambridge, United Kingdom
Harhoff, D., R. M. Scherer & K. Vopel (2013), Citations, family size, opposition and the value of patent rights, https://www.sciencedirect.com/science/article/abs/pii/S0048733302001245
Hekkert, M.P., M.J. Janssen, J.H. Wesseling & S.O. Negro (2020), Mission-oriented innovation systems, https://doi.org/10.1016/j.eist.2019.11.011
Hekkert, M.P., R.A.A. Suurs, S.O. Negro, S. Kuhlmann & R.E.H.M. Smits (2007), Functions of innovation systems: A new approach for analysing technological change, https://doi.org/10.1016/j.techfore.2006.03.002
Hicks, D., P. Wouters, L. Waltman, S. de Rijcke & I. Rafols (2015), Bibliometrics: The Leiden Manifesto for research metrics, https://doi.org/10.1038/520429a
Howlett, M. & J. Rayner (2013), Patching vs packaging in policy formulation: Assessing policy portfolio design, https://doi.org/10.17645/pag.v1i2.95
Hu, R, J. Skea & M.J. Hannon. (2018), Measuring the energy innovation process: An indicator framework and a case study of wind energy in China, https://doi.org/10.1016/j.techfore.2017.09.025
IEA (International Energy Agency) (2020a), Tracking clean energy progress 2020, https://www.iea.org/topics/tracking-clean-energy-progress
IEA (2020b), Energy technology perspectives 2020: Special report on clean energy technology innovation, https://www.iea.org/reports/clean-energy-innovation
IEA (2020c), Sustainable recovery, World energy outlook special report, https://www.iea.org/reports/sustainable-recovery
IEA (2020d), ETP clean energy technology guide, https://www.iea.org/articles/etp-clean-energy-technology-guide
IEA (2020e), World energy investment 2020, https://www.iea.org/reports/world-energy-investment-2020/rd-and-technology-innovation#abstract
IEA (2020f), Energy technology RD&D budgets 2020, https://www.iea.org/reports/energy-technology-rdd-budgets-2020
IEA (2020g), Implementing effective emissions trading systems, https://www.iea.org/reports/implementing-effective-emissions-trading-systems

Tracking Clean Energy Innovation: A framework for using indicators to inform policy
PAGE | 76
IEA
. All
right
s re
serv
ed.
Annexes
IEA (2020h), Global EV outlook 2020, https://www.iea.org/reports/global-ev-outlook-2020
IEA (2020i), European Union 2020: Energy policy review, https://www.iea.org/reports/european-union-2020
IEA (2020j), World energy outlook 2020, https://www.iea.org/reports/world-energy-outlook-2020
IEA (2020k), India 2020: Energy policy review, https://www.iea.org/reports/india-2020
IEA (2019), Energy technology innovation partnerships, https://www.iea.org/reports/energy-technology-innovation-partnerships
IEA (2017), Real-world policy packages for sustainable energy transitions, https://www.iea.org/reports/real-world-policy-packages-for-sustainable-energy-transitions
ITIF (Information Technology & Innovation Foundation) (2020), Mind the gap: A design for a new energy technology commercialization foundation, https://itif.org/sites/default/files/2020-mind-gap-energy-technology.pdf
Johnstone, N., I. Hascic, J. Poirier, M. Hemar & C. Michel (2011), Environmental policy stringency and technological innovation: Evidence from survey data and patent counts, https://doi.org/10.1080/00036846.2011.560110
Johnstone, N., I. Hascic & D. Popp (2010), Renewable energy policies and technological innovation: Evidence based on patent counts, https://doi.org/10.1007/s10640-009-9309-1
Kim, Y.J. & C. Wilson (2019), Analysing energy innovation portfolios from a systemic perspective, https://doi.org/10.1016/j.enpol.2019.110942
Kretschmer, S., V. Grimm & S. Mehl (2020), Green innovations: The organizational setup of pilot projects and its influence on consumer perceptions, https://doi.org/10.1016/j.enpol.2020.111474
Kuhlmann, S. & A. Rip (2018), Next-generation innovation policy and grand challenges, https://doi.org/10.1093/scipol/scy011
Lam, L.T., L. Branstetter & I.M.L. Azevedo (2017), China's wind industry: Leading in deployment, lagging in innovation, http://dx.doi.org/10.1016/j.enpol.2017.03.023
Laurence, G.C. (1980), Early years of nuclear energy research in Canada, https://www.ieee.ca/millennium/nuclear_power/NuclEnerg.PDF
Le Marois, J.-B. & C. Hilton, C. (2019), Three priorities for energy technology innovation partnerships (IEA Commentary), https://www.iea.org/commentaries/three-priorities-for-energy-technology-innovation-partnerships
Lee, K. & S. Lee (2013), Patterns of technological innovation and evolution in the energy sector: A patent-based approach, https://doi.org/10.1016/j.enpol.2013.03.054
March, J.G. (1991), Exploration and exploitation in organizational learning, https://www.jstor.org/stable/2634940
Mazzucato, M. (2018a), Mission-oriented research & innovation in the European Union, https://ec.europa.eu/info/sites/info/files/mazzucato_report_2018.pdf
Mazzucato, M. (2018b), Mission-oriented innovation policies: Challenges and opportunities, https://doi.org/10.1093/icc/dty034
Mazzucato, M. & G. Semieniuk (2017), Public financing of innovation: New questions, Oxford Review of Economic Policy, Vol. 33, No. 1, p. 24–48, https://doi.org/10.1093/oxrep/grw036

Tracking Clean Energy Innovation: A framework for using indicators to inform policy
PAGE | 77
IEA
. All
right
s re
serv
ed.
Annexes
Meyer, D., L. Mytelka, R. Press, E.L. Dall’Oglio, P.T. de Sousa Jr & A. Grubler (2012), Brazilian ethanol: Unpacking a success story of energy technology innovation. Historical case studies of energy technology innovation. In: A. Grubler, F. Aguayo, K.S. Gallagher, M. Hekkert, K. Jiang, L. Mytelka, L. Neij, G. Nemet & C. Wilson (eds.), The Global Energy Assessment, Cambridge University Press, Cambridge, United Kingdom
MI (Mission Innovation) (2017), Accelerating the clean energy revolution: Mission Innovation action plan, http://mission-innovation.net/wp-content/uploads/2017/06/MI-Action-Plan.pdf
Miremadi, I., Y. Saboohi & S. Jacobsson (2018), Assessing the performance of energy innovation systems: Towards an established set of indicators, https://doi.org/10.1016/j.erss.2018.01.002
Neij, L. & P.D. Andersen (2012), A comparative assessment of wind turbine innovation and diffusion policies. Historical case studies of energy technology innovation. In: A. Grubler, F. Aguayo, K.S. Gallagher, M. Hekkert, K. Jiang, L. Mytelka, L. Neij, G. Nemet & C. Wilson (eds.), The Global Energy Assessment, Cambridge University Press, Cambridge, United Kingdom
Nemet, G. (2012), Solar photovoltaics: Multiple drivers of technological improvement. Historical case studies of energy technology innovation. In: A. Grubler, F. Aguayo, K.S. Gallagher, M. Hekkert, K. Jiang, L. Mytelka, L. Neij, G. Nemet & C. Wilson, Cambridge University Press, Cambridge, United Kingdom
NSTMIS (National Science and Technology Management Information System India) (2020), Research & development statistics at a glance 2019-20, https://dst.gov.in/sites/default/files/R%26D%20Statistics%20at%20a%20Glance%202019-20.pdf
OECD (Organisation for Economic Co-operation and Development) (forthcoming), Trade as a channel for environmental technologies diffusion: The case of the wind turbines manufacturing industry, OECD Publishing, Paris
OECD (2020a), Research and Development Statistics: Government budget appropriations or outlays for RD, OECD Science, Technology and R&D Statistics (database), https://doi.org/10.1787/data-00194-en (accessed 31 March 2020)
OECD (2020b), Trends in educational attainment by educational attainment and age group, in: Education at a Glance 2020: OECD Indicators, OECD Publishing, Paris, https://doi.org/10.1787/69096873-en (accessed 27 October 2020)
OECD (2020c), Research and Development Statistics: R-D personnel by sector of employment and occupation (Edition 2019), OECD Science, Technology and R&D Statistics (database), https://doi.org/10.1787/5a746fa4-en (accessed June 2020)
OECD (2020d), Patents by main technology and by International Patent Classification (IPC), OECD Patent Statistics (database), https://doi.org/10.1787/data-00508-en (accessed 18 February 2020)
OECD (2020e), Financing SMEs and entrepreneurs series (2020 and 2019), OECD Publishing, Paris, https://www.oecd.org/cfe/smes/financing-smes-and-entrepreneurs-23065265.htm
OECD (2020f), Start-ups in the time of COVID-19: Facing the challenges, seizing the opportunities, OECD Publishing, Paris, http://www.oecd.org/coronavirus/policy-responses/start-ups-in-the-time-of-covid-19-facing-the-challenges-seizing-the-opportunities-87219267/

Tracking Clean Energy Innovation: A framework for using indicators to inform policy
PAGE | 78
IEA
. All
right
s re
serv
ed.
Annexes
OECD (2020g), Trade in environmentally related goods (database), https://stats.oecd.org/Index.aspx?DataSetCode=TRADEENV_IND10 (accessed May 2020)
OECD (2020h), The design and implementation of mission-oriented innovation policies, OECD Publishing, Paris
OECD (2015), Frascati manual 2015: Guidelines for collecting and reporting data on research and experimental development, The measurement of scientific, technological and innovation activities, OECD Publishing, Paris, https://doi.org/10.1787/9789264239012-en
OECD (2012), Trade and innovation, OECD Publishing, Paris, https://doi.org/10.1787/5k9gwprtbtxn-en
OECD (2010), Why is administrative simplification so complicated?, OECD Publishing, Paris, https://www.oecd.org/regreform/regulatory-policy/cuttingredtapeseries.htm
OECD/Eurostat (2018), Oslo manual 2018: Guidelines for collecting, reporting and using data on innovation, 4th edition, The measurement of scientific, technological and innovation activities, OECD Publishing, Paris/Eurostat, Luxembourg, https://doi.org/10.1787/9789264304604-en
Orsted (2017), Green energy barometer 2017, https://orsted.tw/en/news/2017/11/green-energy-barometer
Pettifor, H., C. Wilson, S. Bogelein, E. Cassar, L. Kerr & M. Wilson, M. (2020), Are low-carbon innovations appealing? A typology of functional, symbolic, private and public attributes, https://doi.org/10.1016/j.erss.2019.101422
Pigato, M., S.J. Black, D. Dussaux, Z. Mao, M. McKenna, R. Rafaty & S. Touboul (2020), Technology transfer and innovation for low-carbon development, World Bank, Washington, DC, http://hdl.handle.net/10986/33474
Pless, J., C. Hepburn & N. Farrell (2020), Bringing rigour to energy innovation policy evaluation, https://doi.org/10.1038/s41560-020-0557-1
Powell, W.W. (1990), Neither market nor hierarchy: Network forms of organization, Research in Organizational Behaviour, Vol. 12, p. 295–336, https://www.researchgate.net/publication/301840604_Neither_Market_Nor_Hierarchy_Network_Forms_of_Organization
Rohe, S. (2020), The regional facet of a global innovation system: Exploring the spatiality of resource formation in the value chain for onshore wind energy, https://doi.org/10.1016/j.eist.2020.02.002
Shane, S. (2004), Encouraging university entrepreneurship? The effect of the Bayh-Dole Act on university patenting in the United States, https://doi.org/10.1016/S0883-9026(02)00114-3
Sinsel, S.R., J. Markard & V.H. Hoffmann (2020), How deployment policies affect innovation in complementary technologies—evidence from the German energy transition, https://doi.org/10.1016/j.techfore.2020.120274
Squicciarini, M., H. Dernis & C. Criscuolo (2013), Measuring patent quality: Indicators of technological and economic value, OECD Science, Technology and Industry Working Papers, OECD Publishing, Paris, https://doi.org/10.1787/5k4522wkw1r8-en
STATCAN (Statistics Canada) (2020), Annual survey of research and development in Canadian industry (RDCI), https://www.statcan.gc.ca/eng/survey/business/4201 (accessed 14 September 2020)
STATCAN (2019), Energy-related research and development expenditures by area of technology, 2017, https://www150.statcan.gc.ca/n1/daily-quotidien/190826/dq190826b-eng.htm (accessed 16 September 2020)

Tracking Clean Energy Innovation: A framework for using indicators to inform policy
PAGE | 79
IEA
. All
right
s re
serv
ed.
Annexes
Stifterverband (2020), Survey on research and development of the German business enterprise sector, https://www.stifterverband.org/research_and_development (accessed 16 September 2020)
Suurs, R.A.A. & M.P. Hekkert (2009), Competition between first and second generation technologies: Lessons from the formation of a biofuels innovation system in the Netherlands, Energy, Vol. 34, No. 5, p. 669–679, https://doi.org/10.1016/j.energy.2008.09.002
UNEP (United Nations Environment Programme) (2020), Clean energy investment trends, https://about.bnef.com/clean-energy-investment/ (accessed 14 September 2020)
UNESCO (United Nations Education, Scientific and Cultural Organization) (2014), Guide to conducting an R&D survey: For countries starting to measure research and experimental development, http://uis.unesco.org/sites/default/files/documents/guide-to-conducting-an-rd-survey-for-countries-starting-to-measure-research-and-experimental-development-2014-en.pdf
Upham, P., P. Bögel, E. Dütschke, U. Burghard, C. Oltra, R. Sala, M. Lores & J. Brinkmann (2020), The revolution is conditional? The conditionality of hydrogen fuel cell expectations in five European countries, https://doi.org/10.1016/j.erss.2020.101722
Utkulu, U. & D. Seymen (2004), Revealed comparative advantage and competitiveness: Evidence for Turkey vis-à-vis the EU/15, https://www.researchgate.net/publication/228697204_Revealed_Comparative_Advantage_and_Competitiveness_Evidence_for_Turkey_vis-a-vis_the_EU15
van der Loos, H.Z.A., S.O. Negro & M.P. Hekkert (2020), International markets and technological innovation systems: The case of offshore wind, https://doi.org/10.1016/j.eist.2019.12.006
van Zeebroeck, N. (2010), The puzzle of patent value indicators, https://www.researchgate.net/publication/24131115_The_puzzle_of_patent_value_indicators
WB (World Bank) (2020a), Doing business (database), https://www.doingbusiness.org/en/data/doing-business-score (accessed 23 March 2020)
WB (2020b), Net trade in goods and services (database) (compiled from International Monetary Fund, Balance of Payments Statistics Yearbook and data files), https://data.worldbank.org/indicator/BN.GSR.GNFS.CD (accessed March 2020)
WEF (World Economic Forum) (2019), Global competitiveness report series (2019 through to 2010), https://www.weforum.org/reports/how-to-end-a-decade-of-lost-productivity-growth
Wilson, C. (2012), Input, output & outcome metrics for assessing energy technology innovation. Historical case studies of energy technology innovation. In: A. Grubler, F. Aguayo, K.S. Gallagher, M. Hekkert, K. Jiang, L. Mytelka, L. Neij, G. Nemet & C. Wilson (eds.), The Global Energy Assessment, Cambridge University Press, Cambridge, United Kingdom
WIPO (World Intellectual Property Office) (2020), WIPO IP Statistics Data Centre, April 2020 update, Indicator 5: Patent grants by technology, Resident and non-resident count by filing office (database), https://www3.wipo.int/ipstats/index.htm (accessed September 2020)
Yoshino, N. & F. Taghizadeh-Hesary (2018), The role of SMEs in Asia and their difficulties in accessing finance, Asian Development Bank Institute Working Paper,

Tracking Clean Energy Innovation: A framework for using indicators to inform policy
PAGE | 80
IEA
. All
right
s re
serv
ed.
Annexes
https://www.adb.org/sites/default/files/publication/474576/adbi-wp911.pdf
Yoshino, N. & F. Taghizadeh-Hesary (2015), Analysis of credit ratings for small and medium-sized enterprises: Evidence from Asia, https://www.mitpressjournals.org/doi/full/10.1162/ADEV_a_00050
Zhang, F. & K.S. Gallagher (2016), Innovation and technology transfer through global value chains: Evidence from China's PV industry, https://doi.org/10.1016/j.enpol.2016.04.014

Tracking Clean Energy Innovation: A framework for using indicators to inform policy
PAGE | 81
IEA
. All
right
s re
serv
ed.
Annexes
Abbreviations and acronyms CCMT climate change mitigation technology CCUS carbon capture, utilisation and storage CEPII Centre d’Études Prospectives et d’Informations
Internationales CO2 carbon dioxide EC European Commission EPO European Patent Office EUR euro EV electric vehicle FDI foreign direct investment GDP gross domestic product GERD gross expenditure on R&D HS Harmonized System (trade balance codes) IEA International Energy Agency IP intellectual property MI Mission Innovation OECD Organisation for Economic Co-operation and Development PPP purchasing power parity PV photovoltaics R&D research and development RC revealed competitiveness RCA revealed comparative advantage RTA relative trade advantage SME small and medium-sized enterprise TCP Technology Collaboration Programme TNA technology needs assessment USD United States dollar VC venture capital WIPO World Intellectual Property Organization
Country codes AUS Australia AUT Austria BEL Belgium BRA Brazil CAN Canada CHE Switzerland CHN China DEU Germany DNK Denmark ESP Spain EU European Union FRA France FIN Finland GBR United Kingdom IND India ISR Israel ITA Italy JPN Japan KOR Korea MEX Mexico NLD the Netherlands NOR Norway PRT Portugal SAU Saudi Arabia SGP Singapore SWE Sweden UK United Kingdom USA or US United States ZAF South Africa

Tracking Clean Energy Innovation: A framework for using indicators to inform policy
PAGE | 82
IEA
. All
right
s re
serv
ed.
Annexes
Acknowledgements
This report was prepared under the leadership of Dave Turk, the IEA’s Deputy Executive Director and Head of the Strategic Initiatives Office and of Mechthild Wörsdörfer, Director for Sustainability, Technology and Outlooks.
The report’s principal authors were Jean-Baptiste Le Marois of the Strategic Initiatives Office and Simon Bennett of the Energy Supply and Investment Division. We are grateful to Louis Blanluet, who carried out analytical research and provided significant contributions.
The report is indebted to the high calibre of advice, data and support provided by other colleagues in the Directorate of Sustainability, Technology and Outlooks (Mechthild Wörsdörfer); the Energy Data Centre (Louis Chambeau, Nick Johnstone, Domenico Lattanzio and Roberta Quadrelli); the Energy Technology and Policy Division (Araceli Fernandez Pales, Claire Hilton, Leonardo Paoli and Tiffany Vass); the Energy Supply and Investment Division (Tim Gould, Rebacca Schulz and Michael Waldron); the Global Energy Relations Division (Luiz GS de Oliveira) and the Strategic Initiatives Office (Simone Landolina and Luis Munuera). Thanks also to Astrid Dumond, Therese Walsh and Isabelle Nonain-Semelin from the Communications and Digital Office. Caren Brown edited the manuscript.
External contributors provided inputs throughout the research and reviews, including: Barbara Bressan and Jackson Maia (Centro de Gestão e Estudos Estratégicos, Brazil); Grégoire Garsous, Michael Keenan, Philippe Larrue and Stephan Worack (OECD); Professor Kelly
Sims Gallagher and Zdenka Myslikova (Tufts University); Professor Andre Furtado (Unicamp, Brazil); and Nandini Sharma.
The IEA Secretariat also wishes to acknowledge the support from Japan’s Ministry of Economy, Trade and Industry (METI) for IEA’s broader efforts and analysis relating to clean energy innovation.
The preparation of this report was made possible through the Clean Energy Transitions in Emerging Economies programme, which received funding from the European Commission’s Horizon 2020 research and innovation programme under grant agreement no. 952363.

This publication reflects the views of the IEA Secretariat but does not necessarily reflect those of individual IEA member countries. The IEA makes no representation or warranty, express or implied, in respect of the publication’s contents (including its completeness or accuracy) and shall not be responsible for any use of, or reliance on, the publication. Unless otherwise indicated, all material presented in figures and tables is derived from IEA data and analysis.
This publication and any map included herein are without prejudice to the status of or sovereignty over any territory, to the delimitation of international frontiers and boundaries and to the name of any territory, city or area.
IEA Publications
International Energy Agency
Website: www.iea.org
Contact information: www.iea.org/about/contact
IEA. All rights reserved.
Typeset in France by IEA – November 2020
Cover design: IEA.