Tracing changes in the community structure in … · Volcano (HMMV) by molecular and biogeochemical...
63
Tracing changes in the community structure in sediments of the Håkon Mosby Mud Volcano (HMMV) by molecular and biogeochemical methods Masters Thesis Master of Marine Microbiology at the Department 2 (Biology/Chemistry) of the University Bremen submitted by Janine Felden conducted in the Max Planck Institute for Marine Microbiology Bremen April 2005
Transcript of Tracing changes in the community structure in … · Volcano (HMMV) by molecular and biogeochemical...
Tracing changes in the community structure
in sediments of the Håkon Mosby Mud
Volcano (HMMV) by molecular and
biogeochemical methods
Masters Thesis Master of Marine Microbiology
at the Department 2 (Biology/Chemistry) of the University Bremen
submitted by
Janine Felden
conducted in the
Max Planck Institute for Marine Microbiology
Bremen
April 2005
1. Reviewer: Prof. Dr. Antje Boetius
Department of Microbial Habitat
Max Planck Institute for marine Microbiology
Bremen
2. Reviewer: Dr. Katrin Knittel
Department of Molecular Ecology
Max Planck Institute for marine Microbiology
Bremen
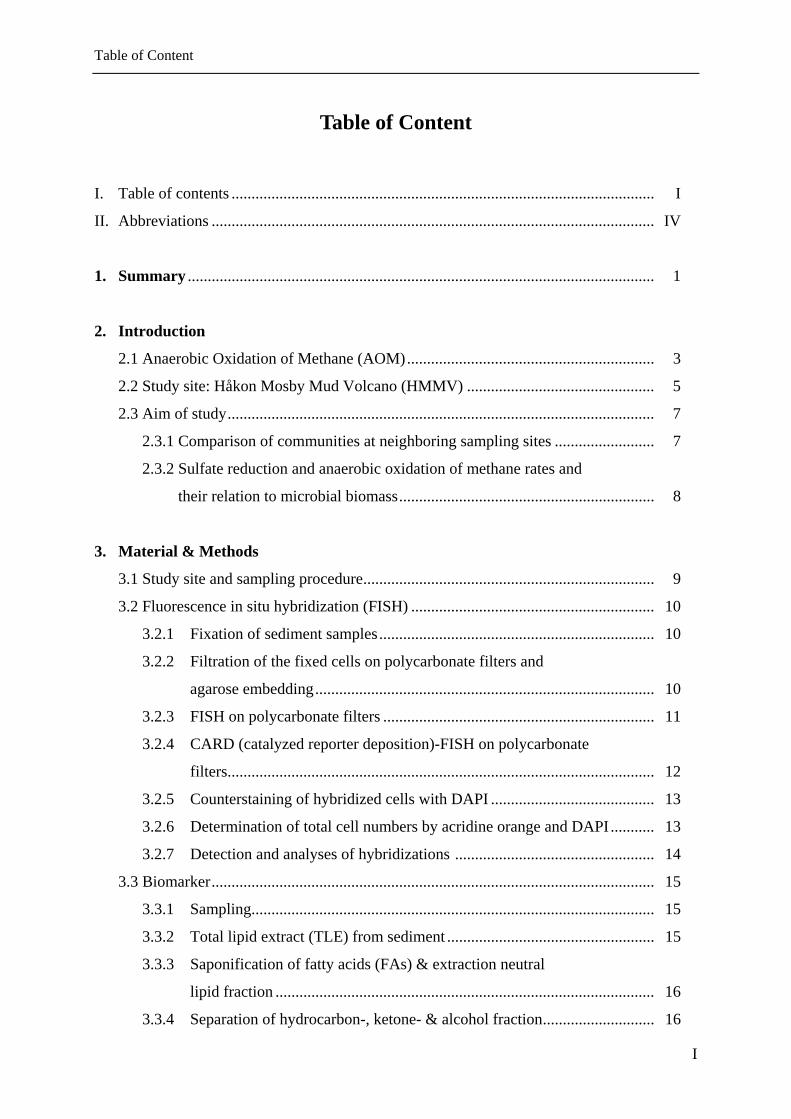
Table of Content
I
Table of Content
I. Table of contents .......................................................................................................... I
II. Abbreviations ............................................................................................................... IV
1. Summary ..................................................................................................................... 1
2. Introduction
2.1 Anaerobic Oxidation of Methane (AOM).............................................................. 3
2.2 Study site: Håkon Mosby Mud Volcano (HMMV) ............................................... 5
2.3 Aim of study........................................................................................................... 7
2.3.1 Comparison of communities at neighboring sampling sites ......................... 7
2.3.2 Sulfate reduction and anaerobic oxidation of methane rates and
their relation to microbial biomass................................................................ 8
3. Material & Methods
3.1 Study site and sampling procedure......................................................................... 9
3.2 Fluorescence in situ hybridization (FISH) ............................................................. 10
3.2.1 Fixation of sediment samples..................................................................... 10
3.2.2 Filtration of the fixed cells on polycarbonate filters and
agarose embedding..................................................................................... 10
3.2.3 FISH on polycarbonate filters .................................................................... 11
3.2.4 CARD (catalyzed reporter deposition)-FISH on polycarbonate
filters........................................................................................................... 12
3.2.5 Counterstaining of hybridized cells with DAPI ......................................... 13
3.2.6 Determination of total cell numbers by acridine orange and DAPI........... 13
3.2.7 Detection and analyses of hybridizations .................................................. 14
3.3 Biomarker............................................................................................................... 15
3.3.1 Sampling..................................................................................................... 15
3.3.2 Total lipid extract (TLE) from sediment .................................................... 15
3.3.3 Saponification of fatty acids (FAs) & extraction neutral
lipid fraction ............................................................................................... 16
3.3.4 Separation of hydrocarbon-, ketone- & alcohol fraction............................ 16
Table of Content
II
3.3.5 Gas chromatograph, gas chromatograph-mass spectrometry
and gas chromatograph -isotope mass spectrometry.................................. 16
3.4 Sampling II............................................................................................................. 17
3.5 Microsensor measurement in a reference HMMV core ......................................... 17
3.6 Tracer experiments with sediments of HMMV...................................................... 18
3.6.1 Preparation of the sediment slurries and re-activation
of the sediment ........................................................................................... 18
3.6.2 Incubation of radiotracer ............................................................................ 19
3.6.3 Sulfate reduction analyses.......................................................................... 19
3.6.4 Determination of AOM rates...................................................................... 20
3.6.5 Determination of sediment dry weight and porosity.................................. 21
4. Results
4.1 Comparison of communities at neighboring sampling sites .................................. 22
4.1.1 Identification of methanotrophic communities ............................................. 22
4.1.2 Distribution of bacterial biomass .................................................................. 27
4.1.3 Rates of methane oxidation and sulfate reduction ........................................ 29
4.2 Rates of sulfate reduction and anaerobic methane oxidation................................ 31
4.2.1 Sulfide profiles in a bacterial mat core of HMMV ....................................... 31
4.2.2 Tracer experiments with sediments of HMMV............................................. 32
5. Discussion
5.1 Comparison of communities at neighboring sampling sites .................................. 36
5.1.1 Composition of methanotrophic communities .............................................. 36
5.1.2 Distribution of AOM aggregates and aerobic methanotrophs ...................... 38
5.1.3 Ecology of the transition zone at HMMV..................................................... 41
5.2 Sulfate reduction and anaerobic oxidation of methane rates
and their relation to microbial biomass .................................................................. 42
5.2.1 Sulfide profiles in a bacterial mat core of HMMV ....................................... 42
5.2.2 Tracer experiments with sediments of HMMV............................................. 42
5.3 Conclusion and further prospects .......................................................................... 44
6. References ................................................................................................................... 45
Table of Content
III
Appendix
A1 Solutions & Materials............................................................................................. 49
A1.1 FISH ........................................................................................................... 49
A1.2 Hybridization- and washing buffer of FISH .............................................. 50
A1.3 Hybridization- and washing buffer of CARD-FISH.................................. 51
A1.4 Biomarker analyses .................................................................................... 52
A1.5 Tracer experiments ..................................................................................... 52
Acknowledgement
Statement
List of Abbreviations
IV
List of Abbreviations
ANME anaerobic methanotrophs
AO acridine orange
AODC acridine orange direct counts
AOM anaerobic oxidation of methane
BF3-methanol boron-trifluorid-methanol
BSTFA bis-(trimethylsilyl) triflouroacetamide
CARD-FISH Catalyzed Reported Deposition - FISH
Cy3 5,5´-Disuldo-1,1´-(γ-carbopentynyl)-3,3´,3´tetramethyl-
indolocarbocyanin-N-hydroxysuccinimidester
d day
DAPI 4´,6-Diamidino-2-phenyl-indol-dihydrochloride
DBB Desulfobulbus species
DCM dichlormethane
dw dry weight
EDTA ethylendiamintetraacetat
equ. equation
et al. lat. et alii, and others
FA fatty acids
FA formamide
FAMES fatty acid methyl esters
Fig. figure
FISH Floureszenz - in situ - Hybridization
GC gas chromatography
GC-IRMS gas chromatography-isotope ratio mass spectrometry
GC-MS gas chromatography-mass spectrometry
°C grad celsius
h hours
HMMV Håkon Mosby mud volcano
HRP horseradish peroxidase
J joule
K Kelvin

List of Abbreviations
V
k kilo
kBq kilobecquerel
λ lambda
l liter
m milli (10-3), meter
M molarity
m/v weight/volume
µ micro (10-6)
Milli-Q water filtrated, distilled with ion exchanger cleaned water
min minutes
min minutes
ml milliliter
MOx methane oxidation
n nono (10-9)
PBS phosphate buffer sodium chloride solution
PFA paraformaldehyde
pH negative log10 of the proton concentration
PMI 2,6,10,15,19-pentamethylicosane
rDNA ribosomal DNA
ROV remotely operated vehicle
rpm rounds per minute
rpm rounds per minute
rRNA ribosomal ribonucleoacide
RT room temperature
S salinity
s seconds
SDS sodiumdodecylsulfate
spp. species
SR sulfate reduction Rate
SRB sulfate reducing bacteria
tab. table
TLE total lipid extract
TLE total lipid extract
TMS trimethylsilyl

List of Abbreviations
VI
Tris trishydroxymethylaminomethane
V Volt
v/v volume/volume
ww wet weight
Summary
1
1. Summary
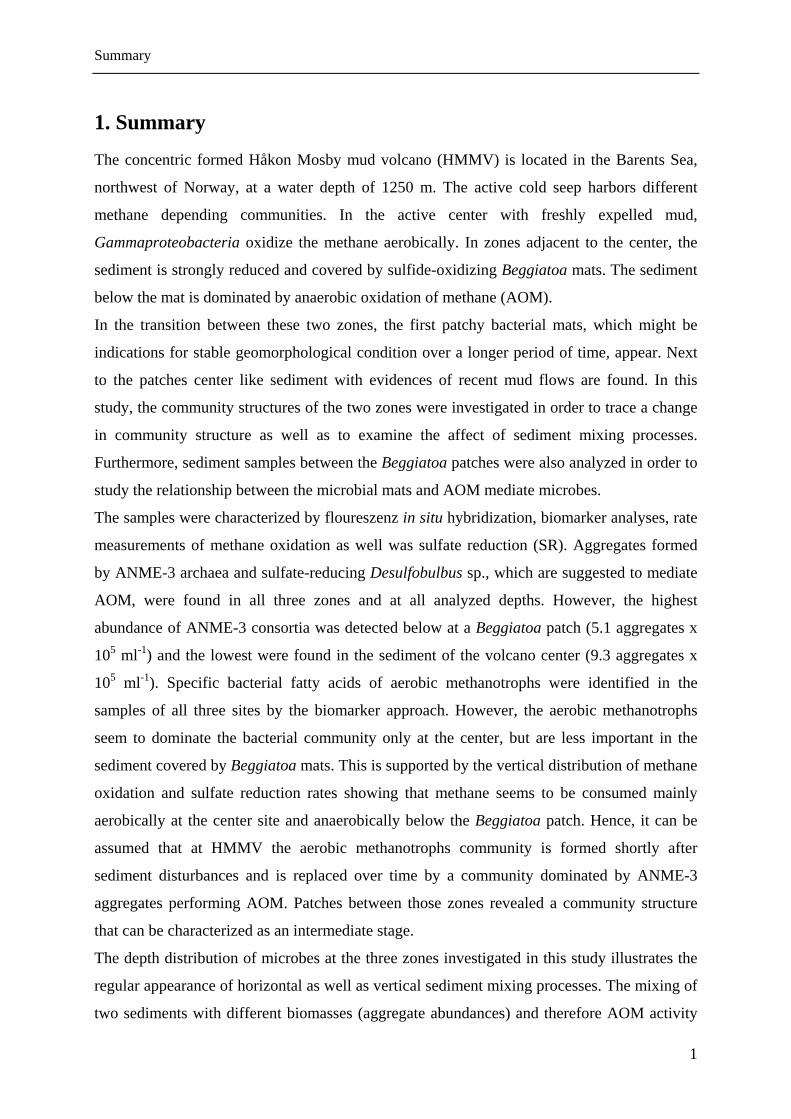
The concentric formed Håkon Mosby mud volcano (HMMV) is located in the Barents Sea,
northwest of Norway, at a water depth of 1250 m. The active cold seep harbors different
methane depending communities. In the active center with freshly expelled mud,
Gammaproteobacteria oxidize the methane aerobically. In zones adjacent to the center, the
sediment is strongly reduced and covered by sulfide-oxidizing Beggiatoa mats. The sediment
below the mat is dominated by anaerobic oxidation of methane (AOM).
In the transition between these two zones, the first patchy bacterial mats, which might be
indications for stable geomorphological condition over a longer period of time, appear. Next
to the patches center like sediment with evidences of recent mud flows are found. In this
study, the community structures of the two zones were investigated in order to trace a change
in community structure as well as to examine the affect of sediment mixing processes.
Furthermore, sediment samples between the Beggiatoa patches were also analyzed in order to
study the relationship between the microbial mats and AOM mediate microbes.
The samples were characterized by floureszenz in situ hybridization, biomarker analyses, rate
measurements of methane oxidation as well was sulfate reduction (SR). Aggregates formed
by ANME-3 archaea and sulfate-reducing Desulfobulbus sp., which are suggested to mediate
AOM, were found in all three zones and at all analyzed depths. However, the highest
abundance of ANME-3 consortia was detected below at a Beggiatoa patch (5.1 aggregates x
105 ml-1) and the lowest were found in the sediment of the volcano center (9.3 aggregates x
105 ml-1). Specific bacterial fatty acids of aerobic methanotrophs were identified in the
samples of all three sites by the biomarker approach. However, the aerobic methanotrophs
seem to dominate the bacterial community only at the center, but are less important in the
sediment covered by Beggiatoa mats. This is supported by the vertical distribution of methane
oxidation and sulfate reduction rates showing that methane seems to be consumed mainly
aerobically at the center site and anaerobically below the Beggiatoa patch. Hence, it can be
assumed that at HMMV the aerobic methanotrophs community is formed shortly after
sediment disturbances and is replaced over time by a community dominated by ANME-3
aggregates performing AOM. Patches between those zones revealed a community structure
that can be characterized as an intermediate stage.
The depth distribution of microbes at the three zones investigated in this study illustrates the
regular appearance of horizontal as well as vertical sediment mixing processes. The mixing of
two sediments with different biomasses (aggregate abundances) and therefore AOM activity
Summary
2
was simulated by in vitro dilution series of HMMV sediment underlying Beggiatoa mats. The
activity of AOM and SR was determined applying radiotracer techniques. AOM as well as SR
rates correlated methanotrophic microbial biomass of the dilution steps. The dilution
experiment confirmed the assumption that mixing processes of sediment at HMMV affect the
microbial community as well as the AOM and SR rates.

Introduction
3
2. Introduction
2.1 Anaerobic Oxidation of Methane (AOM)
Global warming has made it necessary to understand processes that are controlling the
distribution and abundances of green house gases like methane. Large natural methane
reservoirs are situated beneath the seafloor. Methane can occur dissolved in pore fluid,
crystallized as methane hydrate, or as free gas (Orphan et al., 2002). Most of the gas is
consumed by anaerobic oxidation of methane (AOM) in ocean sediments before it reaches the
oxygenated water column (Reeburgh, 1996). Hinrichs & Boetius (2002) estimated that the
AOM net rate is up to 300 Tg of methane per year in marine sediments. AOM is therefore
crucial for balancing our atmosphere’s methane content.
The first geochemical evidences of AOM were found more than 25 years ago. Since then, the
process was investigated by radiotracer studies, stable isotope distribution and diagenetic
models (Valentine, 2002 and references therein). Nowadays, it is widely accepted that AOM
is coupled to sulfate reduction (SR) and is described by the reaction given in equation (1). The
ratio of AOM and SR seems to be close to one, which indicates direct coupling of the two
processes (Nauhaus et al., 2002; Niemann et al., unpublished-b).
CH4 + SO42- HCO3
- + HS- + H2O (1)
Molecular ecological studies have proven that AOM is performed mainly by consortia of
archaea and bacteria (Boetius et al., 2000; Orphan et al., 2001, Michaelis et al., 2002;
Lösekann et al., unpublished). The very light isotopic signature of methane can be used to
trace methane-derived carbon in the environment. It has been concluded that within microbial
consortia, the archaea directly oxidize the methane and the bacteria are the syntrophic partners
due to the consistent isotopic differences between 13C-depleted bacterial and archaeal lipids
(Valentine, 2002 and references therein).
To date, three different groups of anaerobic methanotrophs (ANME) are distinguished: 16S
DNA sequences of ANME-1 were initially isolated from methane-rich sediments of the Eel
River basin, California (Hinrichs et al., 1999; Boetius et al., 2000). This archaeal group is
distantly related to the Methanosarcinales and Methanomicrobiales (Hinrichs et al., 1999;
Orphan et al., 2002). The ANME-1 cells are more frequently found in monospecific
aggregations or as single filaments, apparently not directly associated with bacterial partner.
However, in a microbial mats from the Black Sea ANME-1 dominates the biomass and
Introduction
4
archaeal cells are closely associated with sulfate reducing bacteria of the
Desulfosarcina/Desulfococcus group (Michaelis et al., 2002).
Archaea of ANME-2 group are closely affiliated with methanogenic archaea of the order
Methanosarcinales and are associated with sulfate-reducing bacteria of the
Desulfosarcina/Desulfococcus group (Orphan et al., 2001). For the first time, ANME-2
aggregates were found in sediments of the Eel River basin but they were also detected in
sediment samples of the Santa Barbara basin (Orphan et al., 2001; Boetius et al., 2000;
Hinrichs et al., 1999). Recently, Lösekann et al. (unpublished) described a new archaeal
group (ANME-3), which is most closely related to cultured genera of Methanosarcinales.
Sulfate-reducing Desulfobulbus sp. is the syntrophic partners of ANME-3 archaea. The
aggregates formed by ANME-3 and Desulfobulbus sp. were discovered in sediments of the
Håkon Mosby mud volcano (Lösekann et al., unpublished).
So far, enzymes and biochemical pathways participating in the process of AOM remain
uncertain. The investigation of the pathways remains difficult, because pure cultures of the
organism are still missing. Nevertheless, different pathways have been discussed and several
compounds have been tested to be intermediates between the two partners in the consortia
(Nauhaus et al., 2002; Hinrichs & Boetius, 2002; Valentine, 2002). The most favorable
hypothesis seems to be that archaea oxidize methane with water (equ.2) and the bacteria
reduce sulfate (equ. 3) by using the intermediate molecular hydrogen. Experiments of Hoehler
et al. (1994) indicated that these reactions would energetically feasible unless the
concentration of hydrogen is low. Nevertheless, conclusive experiments to finally identify the
intermediate between the syntrophic partners have not been done. The hypothesis of “reverse
methanogensis” in ANME cells is supported by the identification of a candidate enzyme (Ni-
protein) that could catalyze the methane activation in a reverse terminal methyl-coenzyme M
reductase reaction (Kruger et al., 2003). Furthermore, most genes associated with
methanogenesis were identified in methanotrophic Archaea at the Eel River Basin and of
ANME 1 in samples of the black sea by metagenomic studies (Hallam et al., 2003, Anke
Meyersdierks personal communication).
It is also still uncertain if the archaea of the ANME group need essentially sulfate reducing
bacteria to perform AOM. As mentioned before, ANME-1 can also occur without directly
associated partner, that could be an indication that this Archaea might be able to reduce
sulfate on their own and require direct association only under certain circumstances. Another
possible explanation could be that ANME-1 exchange intermediates with other occurring
Introduction
5
sulfate reducing bacteria in the sediment, which are not directly associated with the archaeal
cells.
CH4 + 3H2O CO2 + 4H2 (2)
SO42- + 4H2 + H+ HS- + 4 H2S (3)
2.2 Study site: Håkon Mosby Mud volcano (HMMV)
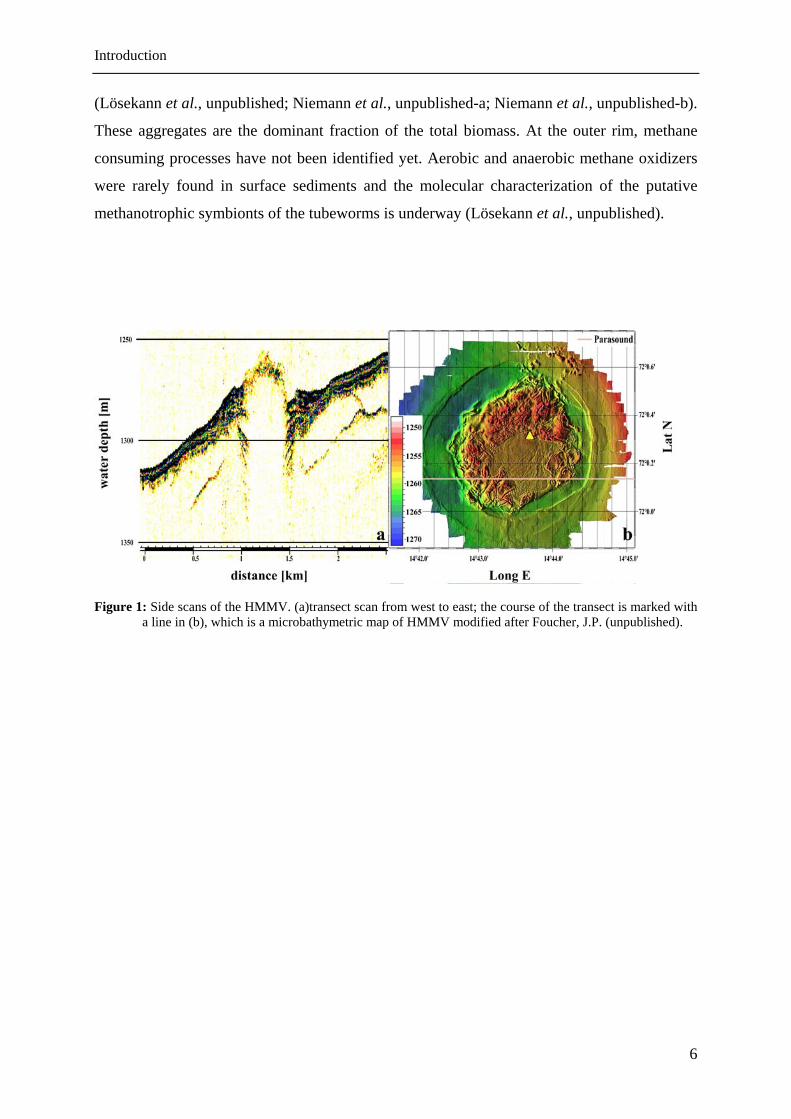
The Håkon Mosby mud volcano (HMMV) was first detected as a circular strong backscatter
feature during regional side-scan sonar mapping in 1989 (Vogt et al., 1997). HMMV is the
only polar mud volcano that has been studied in greater detail by photo and video observation
(Milkov et al., 1999). It is located on the continental slope northwest of Norway in the
Barents Sea (72°N 14°E) at a water depth of 1250 m. HMMV has a concentric zoned
structure (Fig. 1) with a diameter of about 2 km and a height of 10 m (Hjelstuen et al., 1999
and references therein).
The HMMV is regarded as a deep-sea habitat (bathyal), which is characterized, by total
darkness, low temperature (~1.5°C) and pressure according to the water depth. The input of
organic carbon by sedimentation is rather low due to recycling processes in the water column.
Small fractions of organic matter are transported from near shore to the HMMV. As result,
methane rising with the volcano fluids from the deep geosphere is the main carbon source for
the organisms at the mud volcano and supports a cold seep community (Lösekann, 2002).
Three main habitats at HMMV were distinguished during pervious studies: (i) In the thermal
center, where fresh mud is expelled, the sediments are uncovered, methane rich and highly
reduced.; (ii) Strongly reduced and methane rich sediments are also found in the adjacent
concentric zone to the center. These sediments are densely covered by white bacterial mats,
consisting of filamentous, sulfide oxidizing bacteria (Beggiatoa spo.).; (iii) The sediments at
the outer rim of the volcano are oxidized from the surface. The benthic fauna of this zone is
dominated by two pogonophoran (tubeworms) species, Sclerolinum contortum and
Oligobrachia haakonmosbiensis (Milkov et al., 2004; Smirnov, 2000; Pimenov et al., 1999).
In the center of HMMV the rising methane is oxidized aerobically by methanotrophic
Gammaproteobacteria that are closely affiliated with Methylobacter and Mythylophaga
species (Lösekann et al., unpublished; Niemann et al., unpublished-a). In the anoxic
sediments below the Beggiatoa mats a novel group of Archaea (ANME-3) was identified to
perform AOM in association with sulfate-reducing bacteria of the genus Desulfobulbus
Introduction
(Lösekann et al., unpublished; Niemann et al., unpublished-a; Niemann et al., unpublished-b).
These aggregates are the dominant fraction of the total biomass. At the outer rim, methane
consuming processes have not been identified yet. Aerobic and anaerobic methane oxidizers
were rarely found in surface sediments and the molecular characterization of the putative
methanotrophic symbionts of the tubeworms is underway (Lösekann et al., unpublished).
Figure 1: Side scans of the HMMV. (a)transect scan from west to east; the course of the transect is marked with
a line in (b), which is a microbathymetric map of HMMV modified after Foucher, J.P. (unpublished).
6

Introduction
2.3 Aim of study
In this study the distribution of biomass, methane oxidizing processes, and the relationship
between rates of AOM as well as SR and biomass in sediments of HMMV were investigated.
The main focus was thereby on sediment mixing processes at the mud volcano and their
influence on the previously mentioned aspects. The influence of aggregates on the distribution
of bacterial mats was of major interest as well.
2.3.1 Comparison of communities at neighboring sampling sites
7
from a site between patches as well as close to the center (Fig. 2 B-D).
d flow next to each other. es", D- "bacterial patch";
The HMMV was investigated in the cruise ARK XIX1b of the “RV Polarstern”. Different
surface structures of the mud volcano were observed during ROV diving. In the transition
zone between the center and Beggiatoa mats, patchy white bacterial mats were adjacent to
sediment that showed recent mudflows (Fig. 2 A). The appearance of these bacterial patches
was a first indication that AOM is performed. In order to investigate the AOM aggregates
influence on the distribution of bacterial mats push cores were taken from bacterial patch,
Figure 2: A – transition zone with patchy bacterial mats (left corner) and recent muB-C: sampling of the push cores; B- "center"; C- between the "bacteria patch
C D
BA
in D the remaining hole of the "bacteria patch" core is still visible (red arrow)
Introduction
8
.3.2 Sulfate reduction and anaerobic oxidation of methane rates and their relation to
One single aggregate can consist E-3 cells not including the sulfate
ent surface structures of center and
stigate the effect of such disturbing events on a time scale of weeks, HMMV sediment
2
microbial biomass
of over 1000 ANM
reducing bacteria. Hence, in comparison to the distribution of other microbes in sediments the
aggregates represent an accumulation of biomass in a very small volume. By assuming a
direct relationship between biomass and rates, slight changes in the abundance of aggregates
might have significant effects on SR and AOM rates.
During the research cruise at HMMV irregular sedim
adjacent areas were observed. It can be assumed that these hummocks are indicators for recent
mud and fluid flows. The result of such movements could be that sediments including
microbes of different depths are mixed with each other, which should affect AOM and SR
rates.
To inve
of two different depths were mixed and AOM as well as SR rates were determined by
applying radiotracer methods. Until now, slurry experiments have only been conducted by
mixing sediment with seawater medium (Nauhaus et al., 2002; Nauhaus et al., 2004). In order
to test the assumption that the biomasses determine the rates, for the first time active (surface)
sediment was diluted with less-active sediment. In sediments of the HMMV Beggiatoa spp.
mat zone, the abundance of aggregates is decreasing with depth and hence the rates decrease
as well (Lösekann et al., unpublished; Niemann et al., unpublished-b). Therefore, it was
assumed that sub-surface sediment below 15 cm is useable for the dilution as less-active
sediment. Furthermore, the surface sediment was diluted with sub-surface sediment in order
to reduce also any kinds of potential physical changes and to mimic the natural circumstances.
After incubation, the communities of the dilution steps were analyzed by FISH and counting
total cell numbers. These parameters were used to estimate biomasses and therefore to
examine the relationship between biomass and measured rates.
Material & Methods
3. Material & Methods
3.1 Study site and sampling procedure
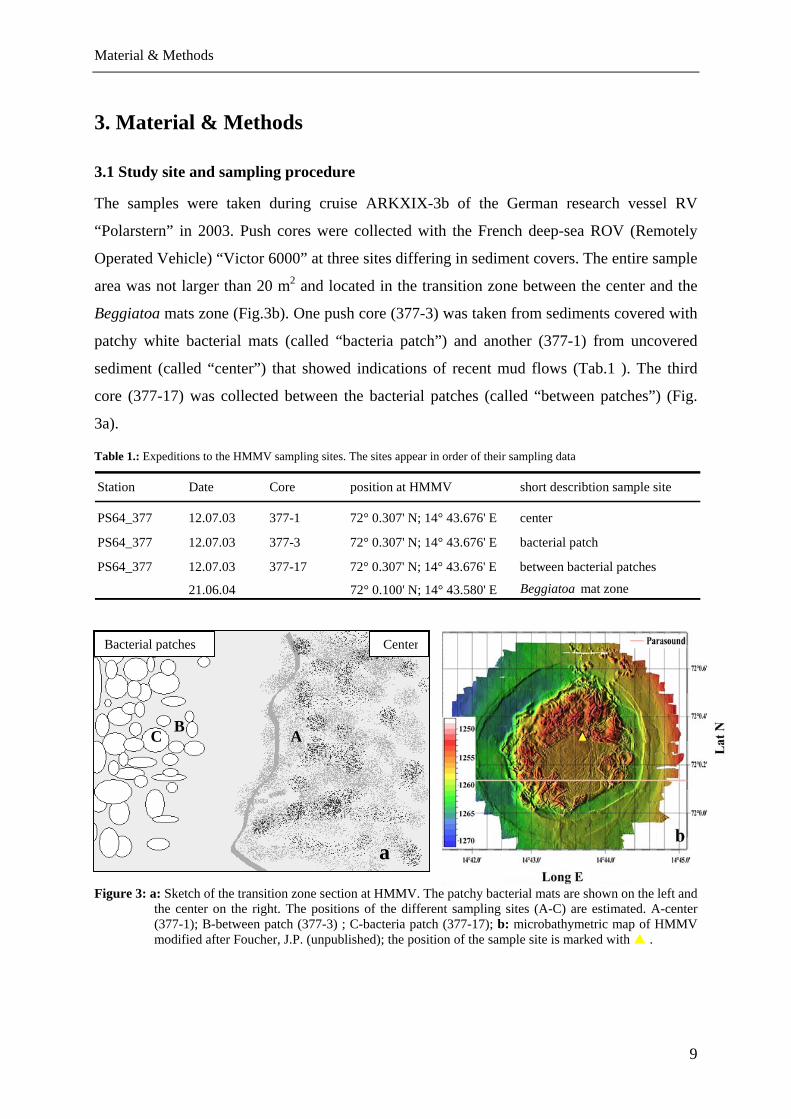
The samples were taken during cruise ARKXIX-3b of the German research vessel RV
“Polarstern” in 2003. Push cores were collected with the French deep-sea ROV (Remotely
Operated Vehicle) “Victor 6000” at three sites differing in sediment covers. The entire sample
area was not larger than 20 m2 and located in the transition zone between the center and the
Beggiatoa mats zone (Fig.3b). One push core (377-3) was taken from sediments covered with
patchy white bacterial mats (called “bacteria patch”) and another (377-1) from uncovered
sediment (called “center”) that showed indications of recent mud flows (Tab.1 ). The third
core (377-17) was collected between the bacterial patches (called “between patches”) (Fig.
3a).
Table 1.: Expeditions to the HMMV sampling sites. The sites appear in order of their sampling data
Station Date Core position at HMMV short describtion sample site
PS64_377 12.07.03 377-1 72° 0.307' N; 14° 43.676' E center
PS64_377 12.07.03 377-3 72° 0.307' N; 14° 43.676' E bacterial patch
PS64_377 12.07.03 377-17 72° 0.307' N; 14° 43.676' E between bacterial patches
21.06.04 72° 0.100' N; 14° 43.580' E Beggiatoa mat zone
a
CenterBacterial patches
C B A
Figure 3: a: Sketch of the transition zone section at HMMV. The patchy bacterial mats are shown on the left and the center on the right. The positions of the different sampling sites (A-C) are estimated. A-center (377-1); B-between patch (377-3) ; C-bacteria patch (377-17); b: microbathymetric map of HMMV modified after Foucher, J.P. (unpublished); the position of the sample site is marked with .
9
Material & Methods
10
3.2 FISH
Fluorescence in situ hybridization (FISH) is a powerful tool for quantitative analysis of
community compositions without cultivation. Fluorescently labeled oligonucleotide probes
hybridize with the ribosomal 16S RNA inside the cells. The sensitivity and specificity of
FISH depend on the hybridization and washing conditions. The hybridized cells can be
detected by epifluorescence microscopy.
Due to the fact that signals of some monolabeled probes were too weak, CARD (Catalyzed
Reporter Deposition)-FISH was applied. In this method oligonucleotide probes labeled with
horseradish peroxidase (HRP) instead of a fluorocrome are used. After hybridization, the
signal intensity is increased by deposition of fluorochrome labeled tyramides. CARD-FISH is
based on the accumulation of high numbers of tyramide molecules by the peroxidase activity.
The phenol like part of the tyramide is reacting with the HRP and H2O2 to form a chinon like
structure that has a radical at the C2 group. The “activated“ tyramide binds covalently at
tyrosine residues of cellular proteins. Each HRP molecule catalyses the deposition of many
tyramide molecules and in this way increases the signal intensity (Pernthaler et al., 2002).
The in fallowing used chemicals as well as solutions and buffers are listed with their
composition in the appendix (A 1.1-A 1.3).
3.2.1 Fixation of sediment samples
The collected cores were cut in 1 cm thick slices and sediment was mixed 1:4 with 4%
formaldehyde. Samples were incubated for 2-4 hours at 4°C. Afterwards, the fractions for
FISH analyses were transferred into new tubes and centrifuged. The remaining portions of the
samples were stored and later used for determination of total cell numbers (AODC).
After centrifugation the supernatants of the FISH samples were discarded and the sediments
washed twice with 1xPBS. Finally, pellets were resuspended with appropriate volumes of 1:1
mix (v/v) 96% ethanol and 1xPBS. The samples were stored at - 20°C until further proceeding
in the laboratory.
3.2.2 Filtration of the fixed cells on polycarbonatfilter and agarose embedding
The fixed samples were further diluted (1:10) with 1:1 mix (v/v) 96% ethanol and 1xPBS.
Afterwards, aliquots were sonicated for 20 seconds with one pulse per second and 20%
intensity (Sonoplus Homogenisator H1070, HD 200, Berlin).
Appropriate volumes of aliquots were diluted with 5-10 ml 1xPBS. The cellulose nitrate
filters were placed beneath the polycarbonate filter to ensure an equal distribution of cells on
Material & Methods
11
the filters. The dilutions of the aliquots were loaded into filtration towers and the samples
were sucked through by applying a weak vacuum. Filters were air dried.
In order to fix cells on the filters and to minimize cell loss during hybridization the filters
were embedded in 0.2% agarose. Therefore, agarose was boiled and 50 µl drops were placed
on a glass plate. Filters were dipped upside down into the agarose and placed upside up. The
filters dried for approximately 15 minutes at 46°C. To remove filters from the glass plate,
they were soaked with 96% ethanol and carefully peeled off. Filters were air dried and stored
at 4°C until further processing.
3.2.3 FISH on polycarbonate filters
The prepared filters were cut into several pieces. 18 µl hybridization buffer (see A 1.2),
containing 5 ng µl-1 probe (tab. 2), was put on a glass slide. Filter pieces were placed upside
down on the drops. A piece of cellulose was put into a polyethylene tube and was soaked with
the remaining hybridization buffer. Glass slides were positioned horizontally inside the tube.
The filters were incubated for 1.5-3 hours at 46°C. After the incubation, the filter pieces were
removed from the glass slides and transferred to tubes with preheated washing buffer (see A
1.2). The pieces were washed for 15 minutes at 48°C free-floating inside the buffer.
Afterwards, the filters were air dried.
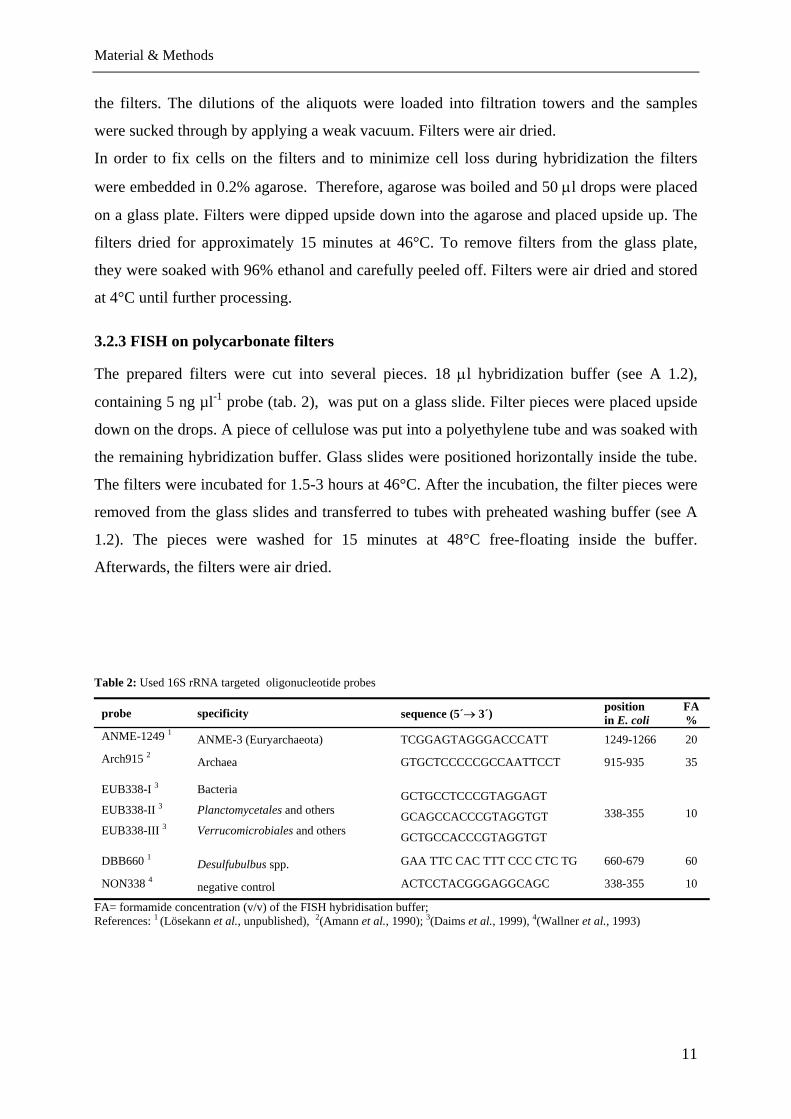
Table 2: Used 16S rRNA targeted oligonucleotide probes
probe specificity sequence (5´→ 3´) position in E. coli
FA %
ANME-1249 1 ANME-3 (Euryarchaeota) TCGGAGTAGGGACCCATT 1249-1266 20 Arch915 2
Archaea GTGCTCCCCCGCCAATTCCT 915-935 35
EUB338-I 3
EUB338-II 3
EUB338-III 3
Bacteria
Planctomycetales and others
Verrucomicrobiales and others
GCTGCCTCCCGTAGGAGT
GCAGCCACCCGTAGGTGT
GCTGCCACCCGTAGGTGT
338-355 10
DBB660 1 Desulfubulbus spp. GAA TTC CAC TTT CCC CTC TG 660-679 60
NON338 4 negative control ACTCCTACGGGAGGCAGC 338-355 10
FA= formamide concentration (v/v) of the FISH hybridisation buffer; References: 1 (Lösekann et al., unpublished), 2(Amann et al., 1990); 3(Daims et al., 1999), 4(Wallner et al., 1993)
Material & Methods
12
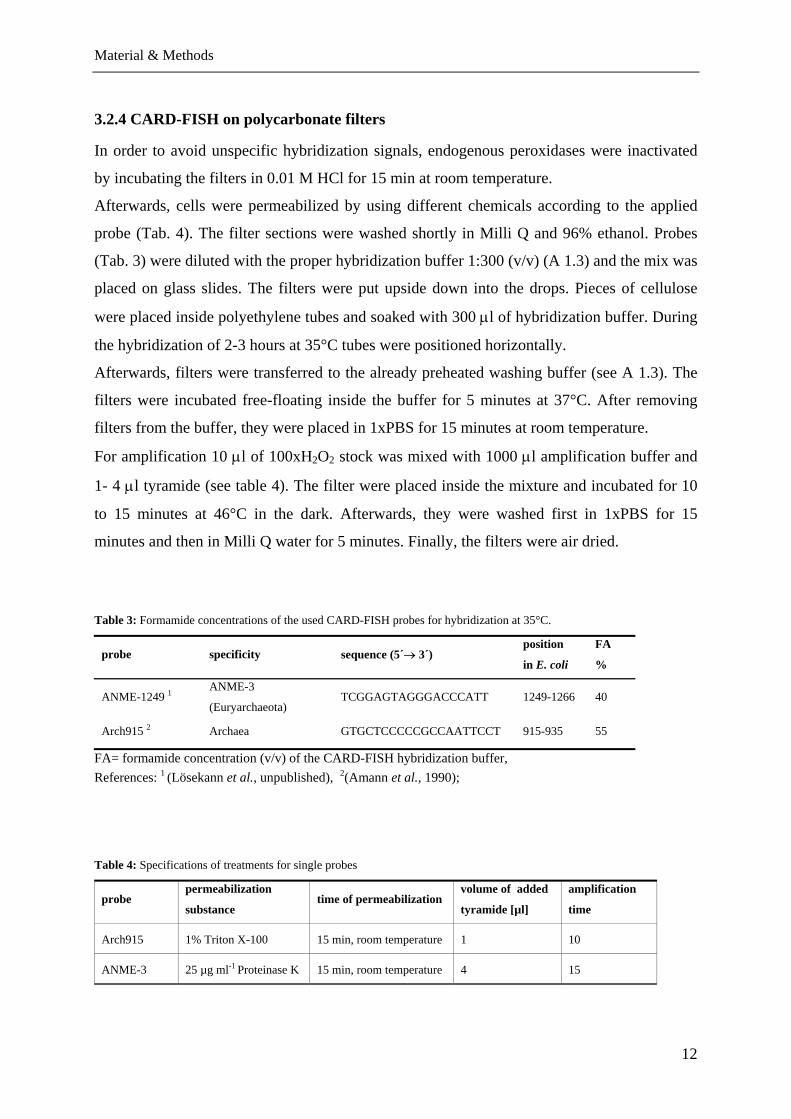
3.2.4 CARD-FISH on polycarbonate filters
In order to avoid unspecific hybridization signals, endogenous peroxidases were inactivated
by incubating the filters in 0.01 M HCl for 15 min at room temperature.
Afterwards, cells were permeabilized by using different chemicals according to the applied
probe (Tab. 4). The filter sections were washed shortly in Milli Q and 96% ethanol. Probes
(Tab. 3) were diluted with the proper hybridization buffer 1:300 (v/v) (A 1.3) and the mix was
placed on glass slides. The filters were put upside down into the drops. Pieces of cellulose
were placed inside polyethylene tubes and soaked with 300 µl of hybridization buffer. During
the hybridization of 2-3 hours at 35°C tubes were positioned horizontally.
Afterwards, filters were transferred to the already preheated washing buffer (see A 1.3). The
filters were incubated free-floating inside the buffer for 5 minutes at 37°C. After removing
filters from the buffer, they were placed in 1xPBS for 15 minutes at room temperature.
For amplification 10 µl of 100xH2O2 stock was mixed with 1000 µl amplification buffer and
1- 4 µl tyramide (see table 4). The filter were placed inside the mixture and incubated for 10
to 15 minutes at 46°C in the dark. Afterwards, they were washed first in 1xPBS for 15
minutes and then in Milli Q water for 5 minutes. Finally, the filters were air dried.
Table 3: Formamide concentrations of the used CARD-FISH probes for hybridization at 35°C.
probe specificity sequence (5´→ 3´) position
in E. coli
FA
%
ANME-1249 1ANME-3
(Euryarchaeota) TCGGAGTAGGGACCCATT 1249-1266 40
Arch915 2 Archaea GTGCTCCCCCGCCAATTCCT 915-935 55
FA= formamide concentration (v/v) of the CARD-FISH hybridization buffer, References: 1 (Lösekann et al., unpublished), 2(Amann et al., 1990);
Table 4: Specifications of treatments for single probes
probe permeabilization
substance time of permeabilization
volume of added
tyramide [µl]
amplification
time
Arch915 1% Triton X-100 15 min, room temperature 1 10
ANME-3 25 µg ml-1 Proteinase K 15 min, room temperature 4 15
Material & Methods
13
3.2.5 Counterstaining of hybridized cells with DAPI
In order to determine the relative abundance of hybridized cells, filters were stained with
DAPI (4´,6´-Diamino-2-phenylindol) after hybridization. DAPI can intercalate into DNA and
exhibits a blue fluorescence (λ=418 nm) after excitation with a certain wavelength
(λ=356nm). Unspecific binding of DAPI results in a yellow-brownish fluorescence.
Procedure:
The pieces of filters were put upside down into drops of 20 µl DAPI for 15 minutes at room
temperature. Afterwards, they were washed for 5 minutes in Milli Q water and shortly in
ethanol. After air drying, the FISH filters were embedded in Citifluor and the CARD-FISH
filters in the mounting medium. Until the prepared slides could be analyzed by
epifluorescence microscopy, they were stored at -20°C.
3.2.6 Determination of total cell numbers by acridine orange stain and DAPI
Acridine Orange Direct Counts are commonly used for determination of total cell numbers in
marine sediments due to the fact that it has normally a good signal to background ratio.
Similar to DAPI, acridine orange is a nucleic acid selective metachromatic stain. Due to high
background signals by applying the AODC method to these samples, the protocol was
adapted by using DAPI as a replacement for acridine orange.
Procedure:
The samples fixed for AODC were further diluted by using 2% PFA. The aliquots were
placed on ice and sonicated for 20s with one pulse per second and 20% intensity (Sonoplus
Homogenisator H1070, HD 200, Berlin). These samples were stored at 4°C until further
proceeding.
Acridine orange stain:
Appropriate volumes of the sonicated samples were dissolved in 5-10 ml citrate buffer.
Cellulose acetate filters were placed underneath black nucleopore filters to optimize the
distribution of cells. The filtration tower was loaded with the sample-buffer solution and a
weak vacuum was applied. Afterwards, 2 ml of 0.01% acridine orange solution was added
and incubated on the filtration tower for 5 minutes at room temperature. After removing the
acridine orange by filtration, filters were washed with citrate buffer and air dried. Finally,
filters were embedded in Cargille immersion oil.
Material & Methods
14
DAPI stain:
The same PFA diluted aliquots were used, but diluted with 1xPBS instead with citrate buffer.
The same filtration approach was used, but instead of black nucleopore, white polycarbonate
filters were used. After filtration of the sample 100 µl DAPI were put directly on the filter that
was still located on the filtration tower. After incubation (15 minutes, room temperature) the
DAPI was removed by using weak vacuum. Filters were washed by adding 1 ml of Milli-Q
water for 5 minutes. Afterwards, the filters were removed from the filtration tower and dipped
in 96% ethanol. After air drying the filters were embedded in Citifluor.
3.2.7 Detection and analyses of hybridizations
For the analyses of the slides a Zeiss Axioplan microscope was used (Carl Zeiss, Jena,
Germany). Pictures were taken by using AxioCam MRm (Carl Zeiss, Jena, Germany). The
calibration bar was added afterwards with AxioVs40 V4.3.0.101 program (Carl Zeiss, Jena,
Germany).
The filters were analyzed at 1000x magnification. A counting grid inside the field of view
enabled to count cells in a defined surface area of the filter. Probe signals were only counted,
if there was a corresponding DAPI signal. The relative abundance was determined by
calculating the ratio of hybridized cells and DAPI stained cells. At least 500 DAPI stained
cells or 40 grids were counted for each sample and probe.
The total numbers of aggregates per cm3 sediment were determined by using the specific
probe for ANME-3 archaea. For each filter at least 250 independent microscopic fields were
controlled. Due to the fact that it was not possible to count single cells associated with
aggregates quantitatively, a semi-quantitative method was used. The average size of the
aggregates was determined and by assuming that a single ANME-3 cell has a volume of 0.2
µm3, the average number of cells in aggregates was calculated. The SRB cell numbers were
neglected during the calculation due to the fact that only very few bacteria were associated
with the aggregates.
Material & Methods
15
3.3 Biomarker
In order to compare FISH and biomarker analyses, sediments of push cores 377-1, 377-3 and
377-17 were sub-sampled from the same horizons. Lipid compositions were analyzed
according to previously published methods (Elvert et al., 2003) (Niemann et al.,
unpublished). Briefly, total lipids were extracted from ca. 20 g of wet sediment by ultra-
sonication with organic solvents of decreasing polarity. The total lipid extract (TLE) was then
separated into a polar (containing fatty acids) and a neutral fraction (containing hydrocarbons,
ketons and alcohols) and subsequently derivaitised for analyses. The detailed procedure for
lipid extraction, separation and derivatisation is as follows.
3.3.1 Sampling
The upper 5cm of the sediment of the push cores were homogenized and transferred into pre-
cleaned glass vials. The samples were stored at -25°C until extraction.
3.3.2 Total Lipid Extract (TLE) from the Sediment
Details about the used laboratory equipment and solutions are listed in the appendix (A 1.4).
Ca. 20 g of wet sediment was transferred into Teflon centrifuge tubes. 100 µl of the internal
standard containing n-nonadecanoic acid, cholestane, hexatriacontane and nonadecanol (4 µg
each) as well as 25 ml of dichloromethane (DCM) / methanol (1:2, v/v) were added. Cell
membranes were disrupted by placing the Teflon tubes for 15 minutes in an ice-cooled ultra-
sonication bath. Afterwards, they were centrifuged for 5 minutes and supernatants were
transferred into separation funnels. Sediment pellets were then re-suspended in 25 ml
DCM/methanol (2:1, v/v), subjected to ultra-sonication (15 minutes), the solid phase was
separated from the liquid phase by centrifugation and the supernatant was added into the
separation funnel. This procedure was repeated twice with 25 ml DCM. After collection of the
supernatants, 25 ml KCl was added to each funnel. Subsequent to phase separation, the
solvent (lower) phase was poured into tip flasks and the aqueous (upper phase) was
discarded. The total lipid extract was concentrated with the rotating evaporator.
3.3.3 Saponification of fatty acids (FAs) & extraction neutral lipid fraction
Aliquots of TLE’s were transferred to cleaned reaction flasks and excess solvent was
evaporated under a stream of nitrogen. Subsequently, 2 ml KOH solution (6% in water, w/v)
was added and the saponification was carried out for 3 hours at 80°C. After cooling, 2 ml of
0.05 M KCl was added and the neutral fraction was extracted. For this procedure, n-hexane
Material & Methods
16
was added to the aqueous sample and the two phases were mixed by means of ultra-
sonication. The upper n-hexane phase was transferred to a tipped flask subsequent to phase
separation. This procedure was repeated 3 times. The separated neutral lipid fractions were
concentrated by evaporating excess solvent and stored at -20°C until further processing.
Free fatty acids (FA) were extracted with n-hexane as described above subsequent to
acidification (pH = 1) of the remaining solution with HCl. Excess solvent was evaporated and
1ml BF3 in methanol (14%) was added and methylation reaction were performed for 1 hour
at 60°C yielding fatty acid methyl esters (FAMES). Finally, FAMES were concentrated by
evaporating excess solvent and transferred into auto sampler vials for analyses.
3.3.4 Separation of Hydrocarbon-, Ketone- & Alcohol fraction
Neutral lipids were further separated into hydrocarbons, ketones and alcohols over a SPE
silica glass cartridge (0.5 g). Prior to separation, the column was cleaned three times with 5
ml n-hexane/dichloromethane (95:5, v/v). After the neutral fraction was applied to the
column, solvent mixtures of increasing polarity were subsequently added to elute particular
compound classes of increasing polarity: (I) hydrocarbons, (II) ketones and (III) alcohols
were eluted with (I) 5 ml n-hexane/dichloromethane (95:5, v/v), (II) 5 ml n-
hexane/dichloromethane (2:1, v/v) and (III) 5 ml dichloromethane/acetone (9:1, v/v),
respectively. Neutral lipid fractions were collected in tipped flasks and excess solvent was
evaporated down to 100 µl and stored at –20°C until further processing and analyses
{Niemann, unpublished #139.
Alcohols were analyzed as their trimethylsilyl (TMS) ethers. Shortly before analyses
(<1week), the alcohol fractions were dried and 100 µl pyridine as well as 50µl BSTFA were
added. The methylisation took place at 70°C for 1hour. Excess solvent was ablated and TMS
adducts were re-suspended in approximately 200 µl n-hexane and stored at -20°C until GC
and GC-MS analyses.
3.3.5 Gas Chromatography (GC), Gas Chromatography-Mass Spectrometry (GC-MS)
and Gas Chromatography-Isotope Ratio Mass Spectrometry (GC-IRMS)
GC, GC-MS and GC-IRMS analyses were used for determining the concentration, identity
and stable isotope ratio of individual lipid compounds. The setting of the instruments were
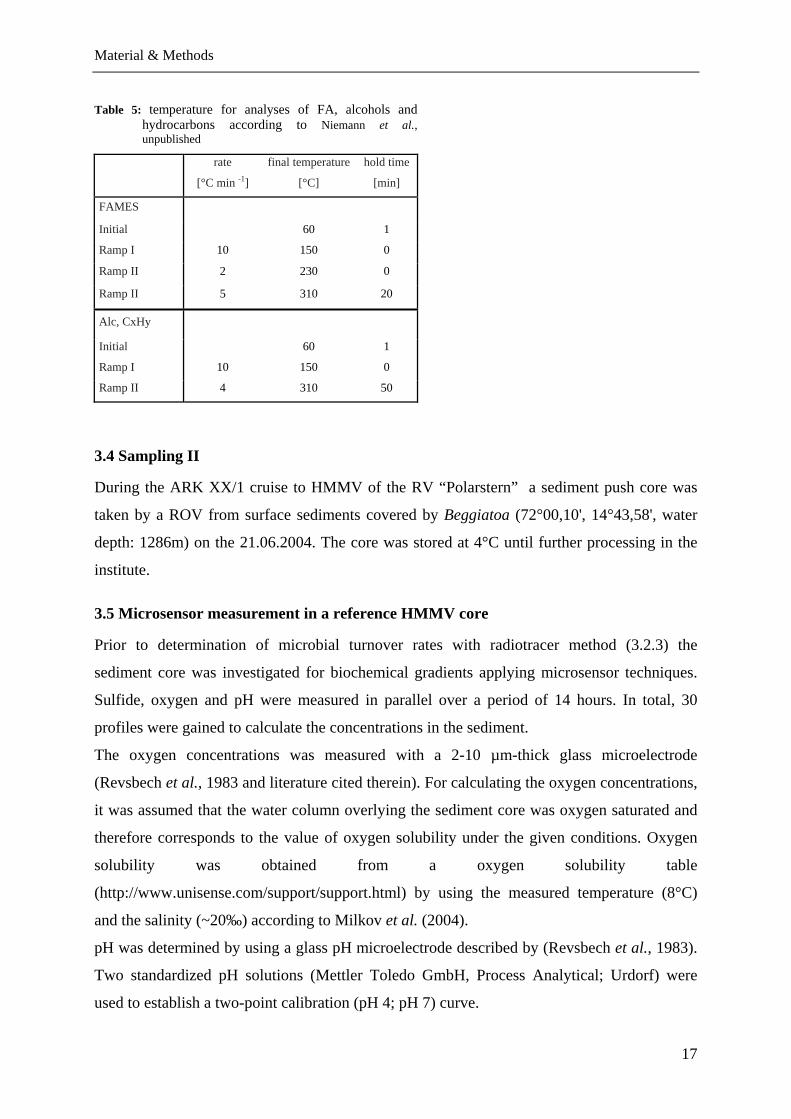
according to the specification made by (Elvert et al., 2003). Table 5 shows the temperature
program used for analyses of FA, alcohols and hydrocarbons, respectively. Concentrations
were calculated against the internal standards and identities of acquired mass spectra were
compared to known standards and published data.
Material & Methods
17
Table 5: temperature for analyses of FA, alcohols and hydrocarbons according to Niemann et al., unpublished
rate
[°C min -1]
final temperature
[°C]
hold time
[min]
FAMES
Initial 60 1
Ramp I 10 150 0
Ramp II 2 230 0
Ramp II 5 310 20
Alc, CxHy
Initial 60 1
Ramp I 10 150 0
Ramp II 4 310 50
3.4 Sampling II
During the ARK XX/1 cruise to HMMV of the RV “Polarstern” a sediment push core was
taken by a ROV from surface sediments covered by Beggiatoa (72°00,10', 14°43,58', water
depth: 1286m) on the 21.06.2004. The core was stored at 4°C until further processing in the
institute.
3.5 Microsensor measurement in a reference HMMV core
Prior to determination of microbial turnover rates with radiotracer method (3.2.3) the
sediment core was investigated for biochemical gradients applying microsensor techniques.
Sulfide, oxygen and pH were measured in parallel over a period of 14 hours. In total, 30
profiles were gained to calculate the concentrations in the sediment.
The oxygen concentrations was measured with a 2-10 µm-thick glass microelectrode
(Revsbech et al., 1983 and literature cited therein). For calculating the oxygen concentrations,
it was assumed that the water column overlying the sediment core was oxygen saturated and
therefore corresponds to the value of oxygen solubility under the given conditions. Oxygen
solubility was obtained from a oxygen solubility table
(http://www.unisense.com/support/support.html) by using the measured temperature (8°C)
and the salinity (~20‰) according to Milkov et al. (2004).
pH was determined by using a glass pH microelectrode described by (Revsbech et al., 1983).
Two standardized pH solutions (Mettler Toledo GmbH, Process Analytical; Urdorf) were
used to establish a two-point calibration (pH 4; pH 7) curve.
Material & Methods
The total sulfide concentration in aqueous solutions consists of the three species: (i) H2S
(dissolved hydrogen sulfide), (ii) HS- (hydrogen sulfide ion), (iii) S2- (sulfide ion). By
measuring one of this species and considering pH, ionic strength and temperature the total
sulfide concentration can be calculated (Kühl & Steuckart, 2000).
Therefore, H2S concentration in the sediment was determined with the sulfide microsensor
described by (Revsbech et al., 1983). Two solutions (100 µM; 0 µM) were used to calibrated
the sensor. Due to fast oxidation of the sulfide the real H2S concentration of the calibration
solutions were determined by applying the spectrophotometric method of Pachmayer (Trüper
& Schlegel, 1964). In order to determine the total sulfide concentration the pK1 was calculated
with the equation (Kühl & Steuckart, 2000):
pK1 = (-98.08 + T
4.57765 + 15.04555 x ln T ) - (0.157 x S ) + (0.0135 x S)
where T is the temperature (=281.15K) and S the salinity (=20‰).
The measured pH was below 9 and therefore pK2 could be neglected for the calculations.
Finally, the total sulfide (Stotal) was determined by considering the measured H2S
concentration and pH (Jeroschewski et al., 1996):
Stotal = [H2S] x pH
pK
10101 1
−
−+
3.6 Tracer Experiments with Sediments of HMMV
Radiotracers incubation was applied to determine rates of anaerobic oxidation of methane
(AOM) and sulfate reduction (SR) in sediment slurries. Subsequently, the communities of the
used slurries were characterized by using FISH. The solutions and material are listed again in
the appendix (A 1.5).
3.6.1 Preparation of the sediment slurries and re-activation of the sediment
Sediment of the 0-5 cm and 15-30 cm depth interval of the core was transferred into separate
glass bottles. The oxygenated gas phase was exchange by CO2/N2 gas mix. The following
steps were done by using the Hungate technique according to (Widdel & Bak, 1992) in order
to preserve the anoxic atmosphere of the approaches. Sediment slurries were produced by
mixing the sediments with SRB (see A 1.5) medium (1:3, v/v). A homogeneous sediment
slurry was achieved by intensively shaking the bottles. Afterwards, the 0-5 cm slurry was
diluted with the 15-30 cm slurry resulting in different ratios. In total, five different dilutions
18
Material & Methods
19
steps were produced: undiluted, 1:5, 1:10, 1:50 and 1:100. The dilution steps refer only to
slurry ratios and not to dilutions with SRB medium.
The sediment was collected and stored for 4 months. After this time, microorganism could be
inactive due to limited supply of methane and other nutrients. Hence, the slurries had to be
pre-incubated in order to re-activate the microorganisms under optimal conditions. Therefore,
the headspace of the dilutions was methane saturated. The bottles were stored at 4°C and
shaken twice per day in order to avoid diffusion limitations. The re-activation of the slurries
was monitored by measuring the increase of the sulfide concentration in the porewater. The
dissolved sulfide was determined applying the spectrophotometrically method described by
(Cord-Ruwisch, 1985).
3.6.2 Incubation of Radiotracers
In the anoxic glove box, 7ml of the re-activated slurries were transferred to 16ml Hungate
tubes. The tubes were closed with rubber stoppers and screwed inside the box. Afterwards,
headspaces of the tubes were exchanged with pure methane. In order to enrich methane in the
sediment, the tubes were shaken softy overnight. Subsequently, they were filled up
completely with methane saturated SRB medium. Incubation was conducted without any
gaseous headspace to avoid degassing of the dissolved 14C-methane tracer into the headspace.
The radiotracer tracers, i.e. 14C-methane and 35S-sulfate, were injected into separately
replicates using gas-tight syringes. In total, 4 replicates for each dilution and tracer were used.
Tubes were incubated at 4°C for ~65 hours. Microbial activity was stopped by transferring
AOM samples (14C-methane incubation) into 50 ml glass bottles filled with sodium
hydroxide. The bottles were closed quickly with rubber stoppers and shaken thoroughly. SR
samples (35S-sulfate incubation) were transferred into 50 ml Corning vials filled with zinc
acetate. 5 control samples for each tracer were treated like described but they were first fixed
before addition of tracer.
3.6.3 Sulfate Reduction Analyses
The sulfate reduction rate were determined by using the cold chromium distillation procedure
described in details by (Kallmeyer & Boetius, 2004). It combines the advantages of the hot
single-step chromium reduction method of (Fossing & Jorgensen, 1989) and the passive
distillation procedure by using N,N-dimethylformamide (DMF) according to (Hsieh & Yang,
1989).
Material & Methods
3.6.4 Determination of AOM rates
Methane concentration
The total methane concentration of the samples was determined by injecting 200 µl of the
headspace into the gas chromatograph. The specification were set according to (Treude et al.,
2003).
Measurement of 14CH4
The procedure for determining 14CH4 was described in detail by (Treude et al., 2003).
Briefly, the 14CH4 of the headspace was first combusted to 14CO2 at 850°C. CO2 was captured
in scintillation vials (20 ml) filled with a mixture of 1 ml phenylethylamine and 7 ml
ethylenglycolmonomethylether. The activity of the samples was determined by scintillation
counting.
Measurement of 14CO2
The amount of microbially produced 14CO2 was determined by using the modified acid
digestion method described by (Joye et al., 2004). The samples were transferred to
Erlenmeyer glass and the sampling glasses were rinsed 3 times with 5 ml 2.5% sodium
hydroxide to remove all sediment. Scintillation vials (6ml) filled with a mixture of 1ml
phenylethylamine and 1 ml 0.5 M sodium hydroxide were placed inside the Erlenmeyer glass
by using a special rubber-stopper construction. 6 ml 6 M hydrochloric acid was added by
placing the needle of the syringe between the rubber-stopper and the glass. The closed
Erlenmeyer glasses were shaken for 4 hours. Afterwards, 3 ml of scintillation cocktail were
added to the removed scintillation vials. The activity of the samples was determined by
scintillation counting.
Calculation of AOM
The calculation is based on the ratio of CH4 to 14CH4. It is assumed that any losses of CH4
during incubation of storage occur at the same ratio for CH4 as for 14CH4. The following
equation was used to calculate AOM rates:
tvCHCOCHAOM
414
214
4
×××
=
where CH4 is the total amount of methane, 14CO2 is the activity of the produced carbon
dioxide, 14CH4 is the activity of the radioactive methane, t is the incubation time and v is the
volume of the sample (Treude et al., 2003).
20
Material & Methods
21
3.6.6 Determination of sediment dry weight and porosity
2 ml from each slurry dilution was weighted, dried (80°C, 24 hours) and weight again. The
sediment dry mass and the porosity were calculated from the differences of these two weights.
Results
22
4. Results
4.1 Comparison of communities at neighboring sampling sites
4.1.1 Identification of methanotrophic communities
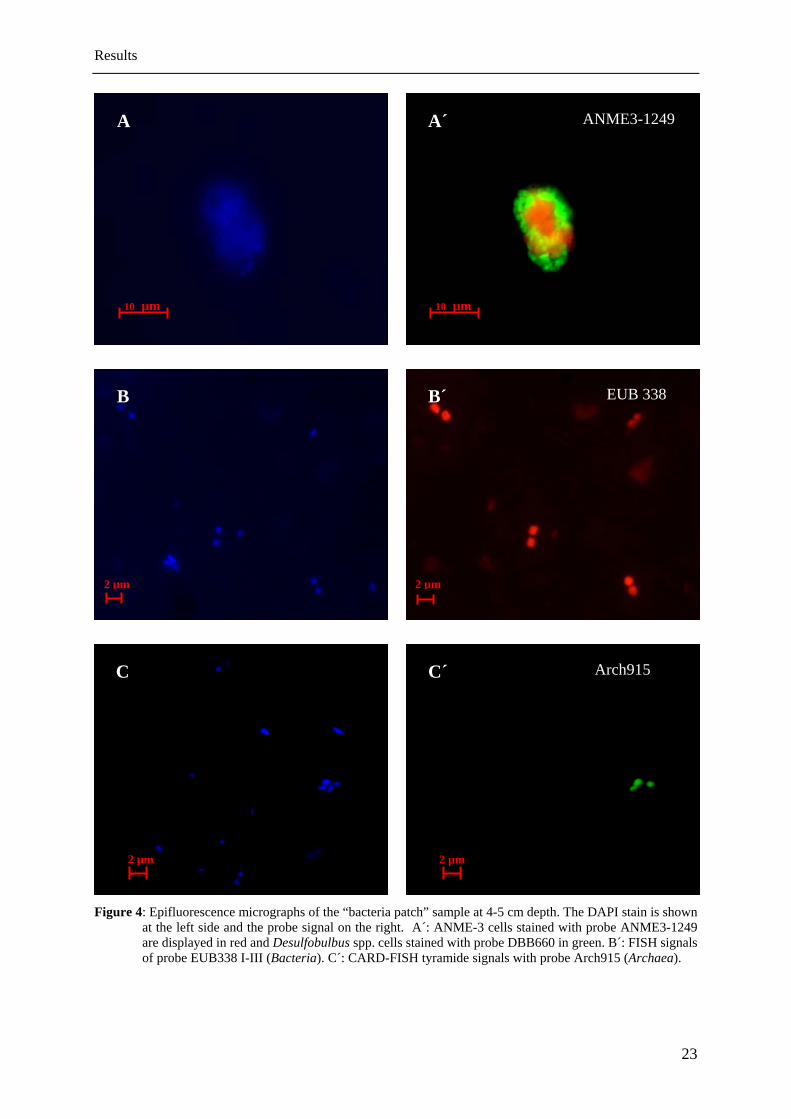
ANME-3 archaeal aggregates which have been previously shown to be highly abundant at
Håkon Mosby Mud Volcano were found in all samples, but their distribution and abundance
varied between the sites investigated (“center”, “between patches”, “bacteria patch”). The
detected aggregates consisted of densely packed ANME-3 cells, which were associated with
Desulfobulbus spp. cells (Fig. 4 A). Many aggregates were irregular formed, embedded in an
organic matrix and associated with only very few bacterial cells. Two forms of aggregates
could be distinguished: (i) spherical aggregates with diameters ranging from 3-13 µm and (ii)
cylindrical aggregates with length ranging from 3-20 µm and diameters of 1-10 µm.
For calculating the numbers of cells in aggregates, in total 44 aggregates were measured in the
sample with the highest abundance (bacteria patch at 2-3 cm depth). The spherical aggregates
(41%) had an average volume of 305 µm3 and the cylindrical aggregates (59%) of 188 µm3.
By assuming that a single ANME-3 cell has a volume of 0.2 µm3, the average spherical
aggregate consists approximately of 1,500 cells and a cylindrical of 940 cells. In order to
determine the average cell numbers for aggregates, the observed ratio of spheres:cylinders
(41:59) were taken into consideration and resulted in an average cell number of 1,200
ANME-3 cells per aggregate. The SRB cell numbers were neglected during the calculation
due to the fact that only very few bacteria were associated with the aggregates.
Results
ANME3-1249 A A´
10 µm 10 µm
EUB 338 B B´
2 µm 2 µm
Arch915 C C´
2 µm 2 µm
Figure 4: Epifluorescence micrographs of the “bacteria patch” sample at 4-5 cm depth. The DAPI stain is shown at the left side and the probe signal on the right. A´: ANME-3 cells stained with probe ANME3-1249 are displayed in red and Desulfobulbus spp. cells stained with probe DBB660 in green. B´: FISH signals of probe EUB338 I-III (Bacteria). C´: CARD-FISH tyramide signals with probe Arch915 (Archaea).
23
Results
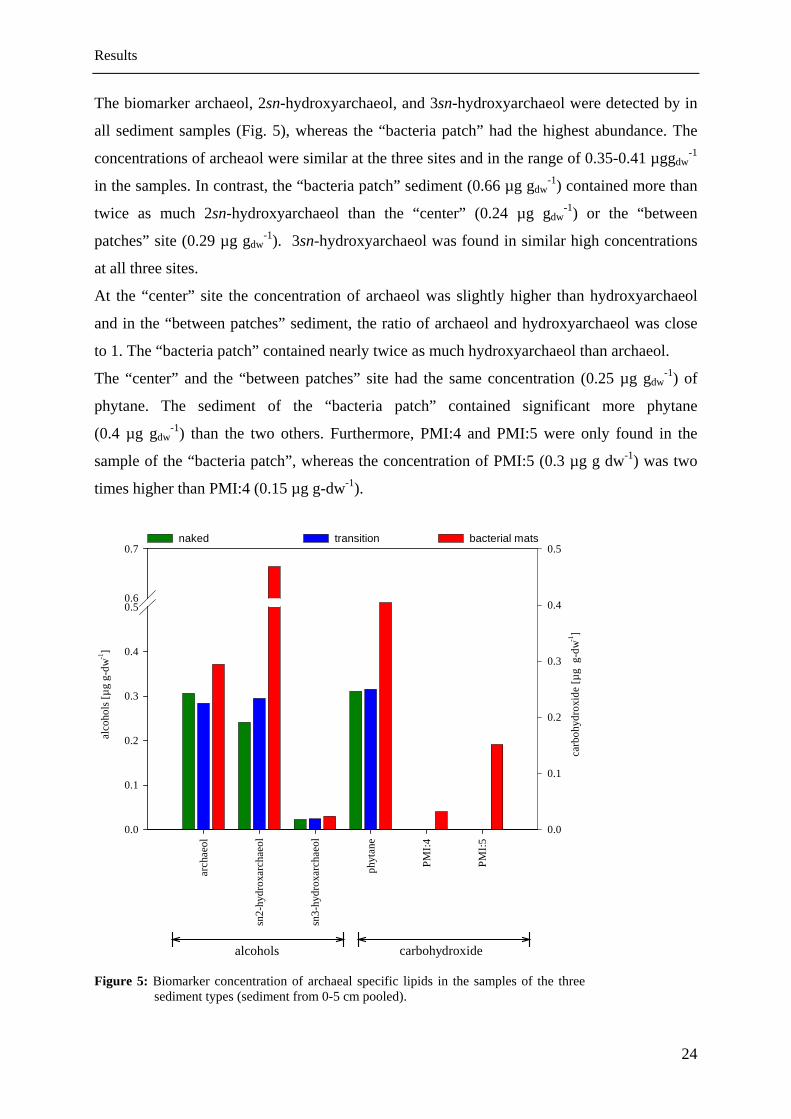
The biomarker archaeol, 2sn-hydroxyarchaeol, and 3sn-hydroxyarchaeol were detected by in
all sediment samples (Fig. 5), whereas the “bacteria patch” had the highest abundance. The
concentrations of archeaol were similar at the three sites and in the range of 0.35-0.41 µggdw-1
in the samples. In contrast, the “bacteria patch” sediment (0.66 µg gdw-1) contained more than
twice as much 2sn-hydroxyarchaeol than the “center” (0.24 µg gdw-1) or the “between
patches” site (0.29 µg gdw-1). 3sn-hydroxyarchaeol was found in similar high concentrations
at all three sites.
At the “center” site the concentration of archaeol was slightly higher than hydroxyarchaeol
and in the “between patches” sediment, the ratio of archaeol and hydroxyarchaeol was close
to 1. The “bacteria patch” contained nearly twice as much hydroxyarchaeol than archaeol.
The “center” and the “between patches” site had the same concentration (0.25 µg gdw-1) of
phytane. The sediment of the “bacteria patch” contained significant more phytane
(0.4 µg gdw-1) than the two others. Furthermore, PMI:4 and PMI:5 were only found in the
sample of the “bacteria patch”, whereas the concentration of PMI:5 (0.3 µg g dw-1) was two
times higher than PMI:4 (0.15 µg g-dw-1).
arch
aeol
sn2-
hydr
oxar
chae
ol
sn3-
hydr
oxar
chae
ol
phyt
ane
PMI:4
PMI:5
alco
hols
[µg
g-dw
-1]
0.0
0.1
0.2
0.3
0.4
0.50.6
0.7
carb
ohyd
roxi
de [µ
g g
-dw-1
]
0.0
0.1
0.2
0.3
0.4
0.5
carbohydroxidealcohols
naked transition bacterial mats
Figure 5: Biomarker concentration of archaeal specific lipids in the samples of the three sediment types (sediment from 0-5 cm pooled).
24
Results
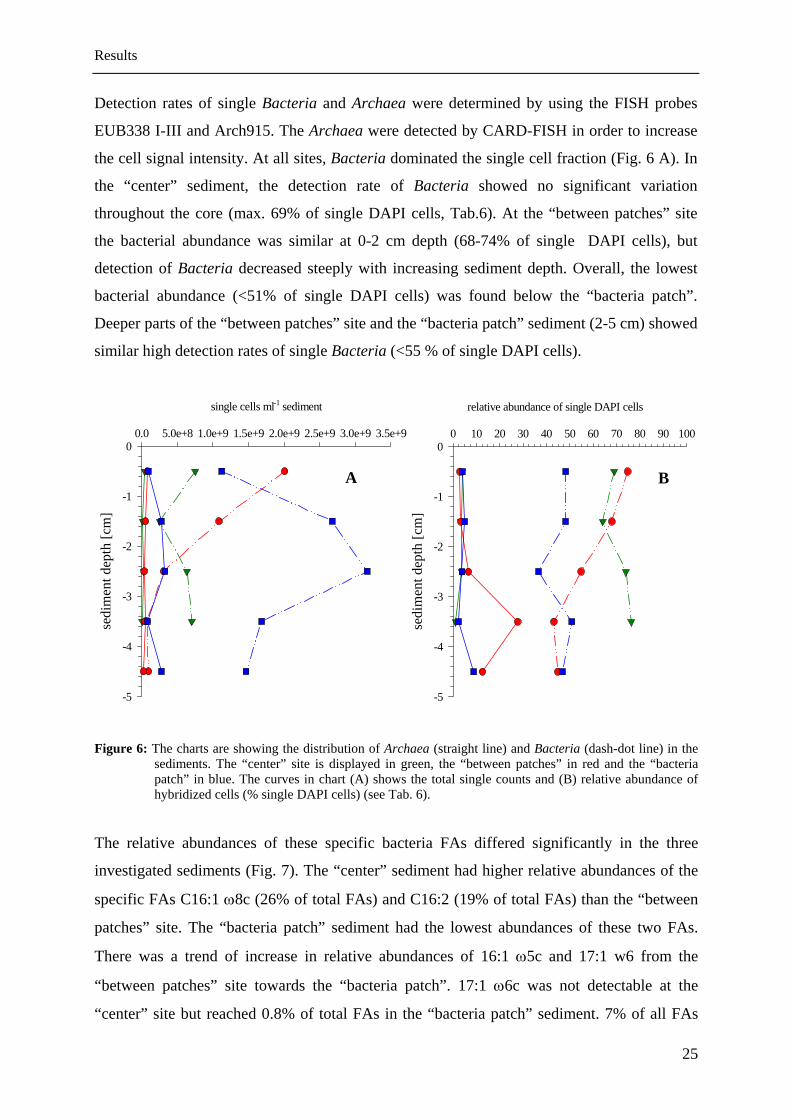
Detection rates of single Bacteria and Archaea were determined by using the FISH probes
EUB338 I-III and Arch915. The Archaea were detected by CARD-FISH in order to increase
the cell signal intensity. At all sites, Bacteria dominated the single cell fraction (Fig. 6 A). In
the “center” sediment, the detection rate of Bacteria showed no significant variation
throughout the core (max. 69% of single DAPI cells, Tab.6). At the “between patches” site
the bacterial abundance was similar at 0-2 cm depth (68-74% of single DAPI cells), but
detection of Bacteria decreased steeply with increasing sediment depth. Overall, the lowest
bacterial abundance (<51% of single DAPI cells) was found below the “bacteria patch”.
Deeper parts of the “between patches” site and the “bacteria patch” sediment (2-5 cm) showed
similar high detection rates of single Bacteria (<55 % of single DAPI cells).
relative abundance of single DAPI cells
0 10 20 30 40 50 60 70 80 90 100se
dim
ent d
epth
[cm
]
-5
-4
-3
-2
-1
0
B
single cells ml-1 sediment
0.0 5.0e+8 1.0e+9 1.5e+9 2.0e+9 2.5e+9 3.0e+9 3.5e+9
sedi
men
t dep
th [c
m]
-5
-4
-3
-2
-1
0
A
Figure 6: The charts are showing the distribution of Archaea (straight line) and Bacteria (dash-dot line) in the
sediments. The “center” site is displayed in green, the “between patches” in red and the “bacteria patch” in blue. The curves in chart (A) shows the total single counts and (B) relative abundance of hybridized cells (% single DAPI cells) (see Tab. 6).
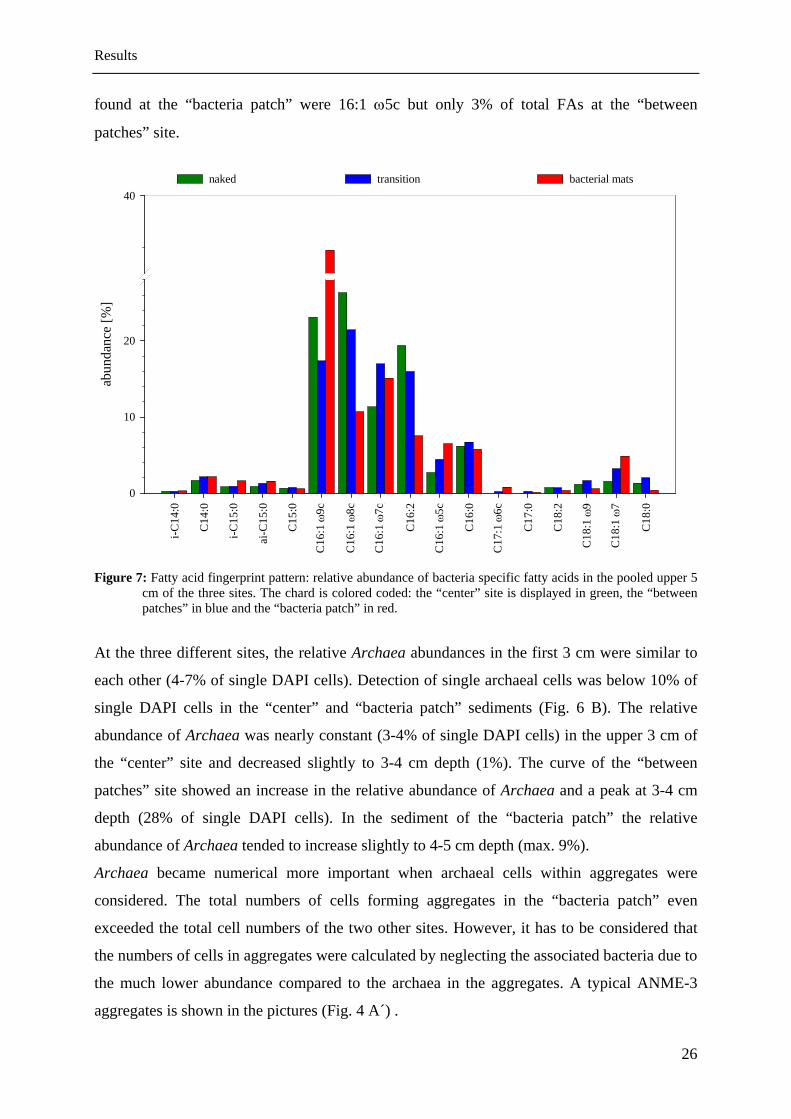
The relative abundances of these specific bacteria FAs differed significantly in the three
investigated sediments (Fig. 7). The “center” sediment had higher relative abundances of the
specific FAs C16:1 ω8c (26% of total FAs) and C16:2 (19% of total FAs) than the “between
patches” site. The “bacteria patch” sediment had the lowest abundances of these two FAs.
There was a trend of increase in relative abundances of 16:1 ω5c and 17:1 w6 from the
“between patches” site towards the “bacteria patch”. 17:1 ω6c was not detectable at the
“center” site but reached 0.8% of total FAs in the “bacteria patch” sediment. 7% of all FAs
25
Results
26
patches” site.
id fingerprint pattern: relative abundance of bacteria specific fatty acids in the pooled upper 5 colored coded: the “center” site is displayed in green, the “between
t the three different sites, the relative Archaea abundances in the first 3 cm were similar to
gregates were
aggregates is shown in the pictures (Fig. 4 A´) .
found at the “bacteria patch” were 16:1 ω5c but only 3% of total FAs at the “between
Figure 7: Fatty accm of the three sites. The chard is
i-C14
:0
C14
:0
i-C15
:0
ai-C
15:0
C15
:0
C16
:1 w
9c
C16
:1 w
8c
C16
:1 w
7c
C16
:2
C16
:1 w
5c
C16
:0
C17
:1w
6c
C17
:0
C18
:2
C18
:1 w
9
C18
:1 w
7
C18
:0
abun
danc
e [%
]
0
10
20
40naked bacterial matstransition
C16
:1 ω
9c
C16
:1 ω
8c
C16
:1 ω
7c
C16
:1 ω
5c
C17
:1 ω
6c
C18
:1 ω
9
C18
:1 ω
7patches” in blue and the “bacteria patch” in red.
A
each other (4-7% of single DAPI cells). Detection of single archaeal cells was below 10% of
single DAPI cells in the “center” and “bacteria patch” sediments (Fig. 6 B). The relative
abundance of Archaea was nearly constant (3-4% of single DAPI cells) in the upper 3 cm of
the “center” site and decreased slightly to 3-4 cm depth (1%). The curve of the “between
patches” site showed an increase in the relative abundance of Archaea and a peak at 3-4 cm
depth (28% of single DAPI cells). In the sediment of the “bacteria patch” the relative
abundance of Archaea tended to increase slightly to 4-5 cm depth (max. 9%).
Archaea became numerical more important when archaeal cells within ag
considered. The total numbers of cells forming aggregates in the “bacteria patch” even
exceeded the total cell numbers of the two other sites. However, it has to be considered that
the numbers of cells in aggregates were calculated by neglecting the associated bacteria due to
the much lower abundance compared to the archaea in the aggregates. A typical ANME-3
Results
27
below the detection limit in all sediment
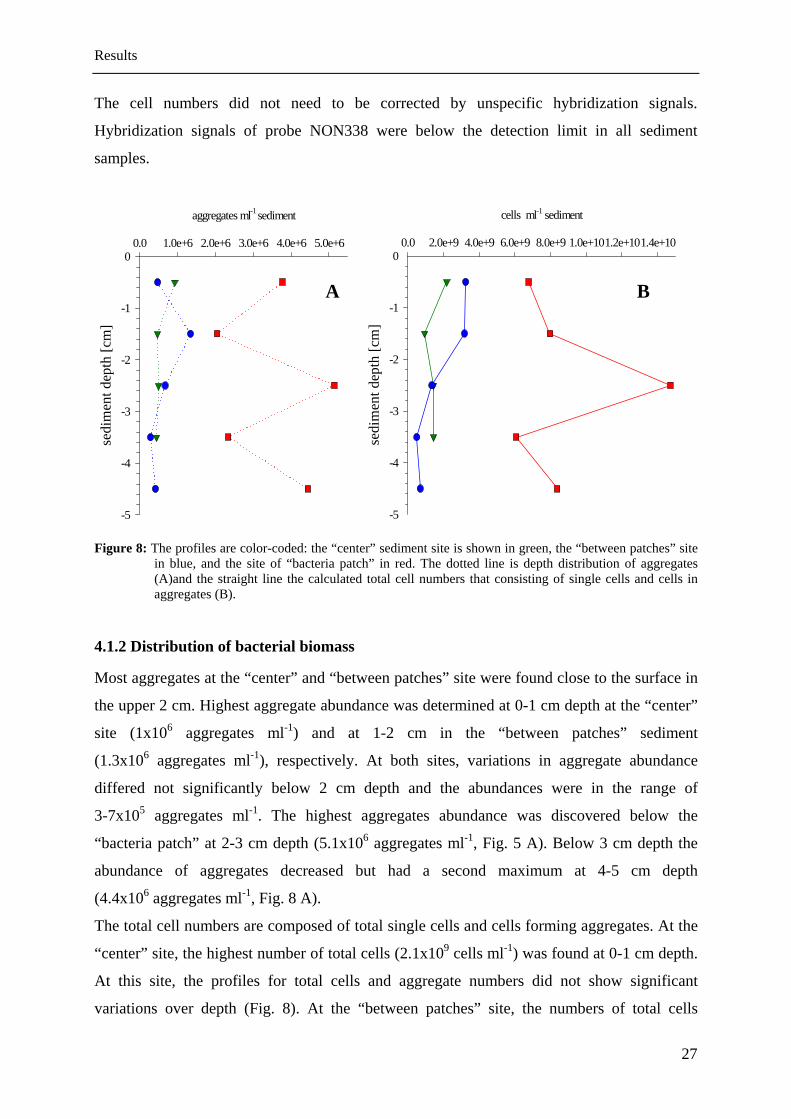
The cell numbers did not need to be corrected by unspecific hybridization signals.
Hybridization signals of probe NON338 were
samples.
aggregates ml-1 sediment
0.0 1.0e+6 2.0e+6 3.0e+6 4.0e+6 5.0e+6
sedi
men
t dep
th [c
m]
-5
-4
-3
-2
-1
0
A
cells ml-1 sediment
0.0 2.0e+9 4.0e+9 6.0e+9 8.0e+9 1.0e+101.2e+101.4e+10
sedi
men
t dep
th [c
m]
-5
-4
-3
-2
-1
0
B
Figure 8: The profiles are color-coded: the “center” sediment site is shown in green, the “between patches” site
in blue, and the site of “bacteria patch” in red. The dotted line is depth distribution of aggregates (A)and the straight line the calculated total cell numbers that consisting of single cells and cells in
4.1.2 Distribution of bacterial biomass
tches” site were found close to the surface in
nce was determined at 0-1 cm depth at the “center”
tal cells (2.1x10⁹ cells ml-1) was found at 0-1 cm depth.
aggregates (B).
Most aggregates at the “center” and “between pa
the upper 2 cm. Highest aggregate abunda
site (1x10⁶ aggregates ml-1) and at 1-2 cm in the “between patches” sediment
(1.3x10⁶ aggregates ml-1), respectively. At both sites, variations in aggregate abundance
differed not significantly below 2 cm depth and the abundances were in the range of
3-7x10⁵ aggregates ml-1. The highest aggregates abundance was discovered below the
“bacteria patch” at 2-3 cm depth (5.1x10⁶ aggregates ml-1, Fig. 5 A). Below 3 cm depth the
abundance of aggregates decreased but had a second maximum at 4-5 cm depth
(4.4x10⁶ aggregates ml-1, Fig. 8 A).
The total cell numbers are composed of total single cells and cells forming aggregates. At the
“center” site, the highest number of to
At this site, the profiles for total cells and aggregate numbers did not show significant
variations over depth (Fig. 8). At the “between patches” site, the numbers of total cells

Results
28
By integrating the abundance of single cells over the first 4 cm, the “center”
f cted by using monolabeled probes and CARD-FISH was applied for the determination the archaeal abundance. The confidence intervals of the single cells were calculated with a probability of 95%.
(max. 3.2 x 10⁹ cells ml-1) were nearly identical in the upper 2 cm and decreased slowly with
depth. The highest total cell numbers were found in the “bacteria patch” at 2-3 cm depth
(1.5x10¹⁰ cells ml-1). The vertical profile strongly correlates with the aggregate distribution
(Fig. 8).
In general, the cells of the aggregates made up more than 50% of the total cell numbers
(Tab. 6).
sediment had the lowest number of single cells (3.2x10⁹ cells ml-1) and aggregates
(2.3x10⁶ aggregates ml-1), whereas the “bacteria patch” had the highest of all three sites .
Table 6: Cell numbers at di ferent HMMV sites as detected by FISH and DAPI staining. Bacteria were dete
The aggregates were counted on only one filter and therefore no error calculations were done.
depth Total single cells (counted)
aggregates (counted)
Total cells (calculated) Bacteria * Archaea *
[cm] [cells x 109 x ml-1][aggregates x 105
x ml-1][cells x 109 x ml-1] (EUB338 I-III) (Arch915)
0-1 1.1 ± 0.2 9.3 2.2 69 41-2 0.4 ± 0.1 4.7 1.0 64 32-3 0.9 ± 0.1 5.0 1.5 74 43-4 0.9 ± 0.1 4.5 1.5 76 1
3.3 23.6 6.1
0-1 2.7 ± 0.8 4.8 3.3 75 31-2 1.6 ± 0.2 13.4 3.2 68 32-3 0.6 ± 0.1 6.8 1.4 55 73-4 0.2 ± 0.0 2.9 0.5 43 284-5 0.2 ± 0.0 4.2 0.7 45 13
5.0 27.9 8.3
0-1 2.3 ± 0.3 37.7 6.8 48 41-2 5.6 ± 0.7 20.4 8.0 48 52-3 8.7 ± 0.9 51.3 14.7 37 43-4 3.3 ± 0.7 23.4 6.1 51 24-5 3.1 ± 1.0 44.4 8.4 47 9
19.9 132.8 35.5
1 values integrated over the first 4 cm* relative abundance of free living cells [% DAPI stained cells]
sediment core
"center"
"between patches"
"bacteria patch"
integrated1
[cm-2]
integrated1
[cm-2]
integrated1
[cm-2]
Results
29
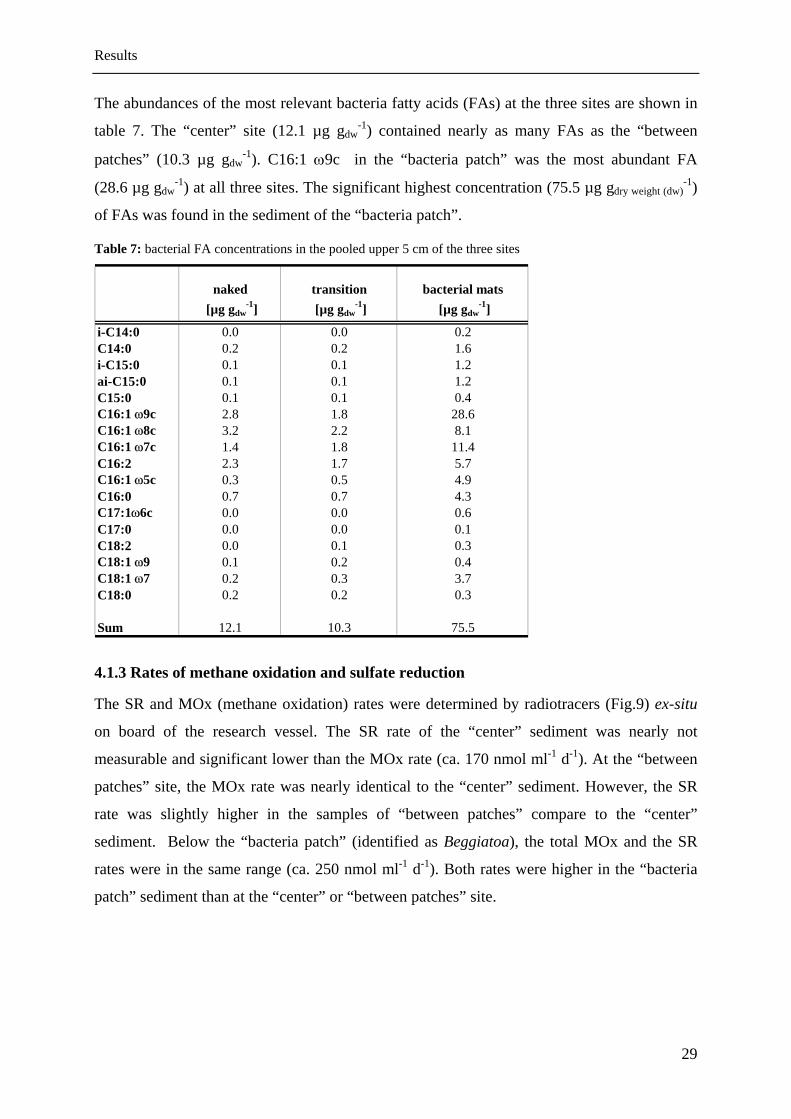
The abundances of the most relevant bacteria fatty acids (FAs) at the three sites are shown in
table 7. The “center” site (12.1 µg gdw-1) contained nearly as many FAs as the “between
patches” (10.3 µg gdw-1). C16:1 ω9c in the “bacteria patch” was the most abundant FA
(28.6 µg gdw-1) at all three sites. The significant highest concentration (75.5 µg gdry weight (dw)
-1)
of FAs was found in the sediment of the “bacteria patch”.
Table 7: bacterial FA concentrations in the pooled upper 5 cm of the three sites
naked transition bacterial mats [µg gdw
-1] [µg gdw-1] [µg gdw
-1]
i-C14:0 0.0 0.0 0.2C14:0 0.2 0.2 1.6i-C15:0 0.1 0.1 1.2ai-C15:0 0.1 0.1 1.2C15:0 0.1 0.1 0.4C16:1 ω9c 2.8 1.8 28.6C16:1 ω8c 3.2 2.2 8.1C16:1 ω7c 1.4 1.8 11.4C16:2 2.3 1.7 5.7C16:1 ω5c 0.3 0.5 4.9C16:0 0.7 0.7 4.3C17:1ω6c 0.0 0.0 0.6C17:0 0.0 0.0 0.1C18:2 0.0 0.1 0.3C18:1 ω9 0.1 0.2 0.4C18:1 ω7 0.2 0.3 3.7C18:0 0.2 0.2 0.3
Sum 12.1 10.3 75.5
4.1.3 Rates of methane oxidation and sulfate reduction
The SR and MOx (methane oxidation) rates were determined by radiotracers (Fig.9) ex-situ
on board of the research vessel. The SR rate of the “center” sediment was nearly not
measurable and significant lower than the MOx rate (ca. 170 nmol ml-1 d-1). At the “between
patches” site, the MOx rate was nearly identical to the “center” sediment. However, the SR
rate was slightly higher in the samples of “between patches” compare to the “center”
sediment. Below the “bacteria patch” (identified as Beggiatoa), the total MOx and the SR
rates were in the same range (ca. 250 nmol ml-1 d-1). Both rates were higher in the “bacteria
patch” sediment than at the “center” or “between patches” site.

Results
"center"
rate [nmol ml-1 d-1]
0 100 200 300 400 500 600 700
]
30
dept
mh
[c
-14
-12
-10
-8
-6
-4
-2
0
"between patches"
rate [nmol ml-1 d-1]
0 100 200 300 400 500 600 700
]
-14
-12
-10
-8
-4
-2
0
dept
m -6
h [c
Figure 9: Methane oxidation (MOx) and SR rate at the three sites (friendly provided by H. Niemann). The charts are color coded and MOx is displayed in red and SR in blue.
"bacteria patch"
rate [nmol ml-1 d-1]
0 100 200 300 400 500 600 700
dept
h [c
m]
-14
-12
-10
-8
-6
-4
-2
0
Results
31
4.2 Rates of sulfate reduction and anaerobic methane oxidation
4.2.1 Sulfide profiles in a bacterial mat core of HMMV
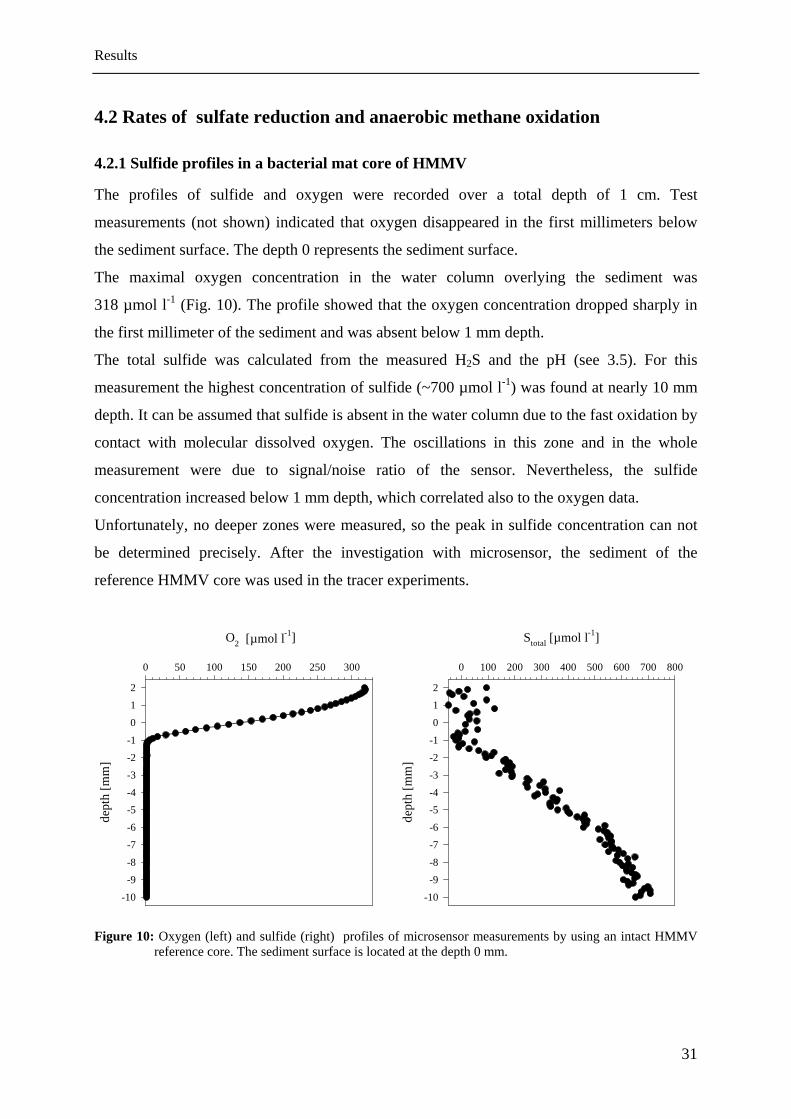
The profiles of sulfide and oxygen were recorded over a total depth of 1 cm. Test
measurements (not shown) indicated that oxygen disappeared in the first millimeters below
the sediment surface. The depth 0 represents the sediment surface.
The maximal oxygen concentration in the water column overlying the sediment was
318 µmol l-1 (Fig. 10). The profile showed that the oxygen concentration dropped sharply in
the first millimeter of the sediment and was absent below 1 mm depth.
The total sulfide was calculated from the measured H2S and the pH (see 3.5). For this
measurement the highest concentration of sulfide (~700 µmol l-1) was found at nearly 10 mm
depth. It can be assumed that sulfide is absent in the water column due to the fast oxidation by
contact with molecular dissolved oxygen. The ole
measurement were due to signal/noise ratio of the sensor. Nevertheless, the sulfide
concentration increased below 1 mm depth, which correlated also to the oxygen data.
Unfortunately, no deeper zones were measured, so the peak in sulfide concentration can not
be determined precisely. After the investigation with microsensor, the sediment of the
reference HMMV core was used in the tracer experiments.
oscillations in this zone and in the wh
Stotal [µmol l-1]
0 100 200 300 400 500 600 700 800
dept
h [m
m]
-10
-9-8
-7
-6
-5-4
-3
-2-1
0
12
O2 [µmol l-1]
0 50 100 150 200 250 300
dept
h [m
m]
-10
-9-8
-7
-6
-5-4
-3
-2-1
0
12
Figure 10: Oxygen (left) and sulfide (right) profiles of microsensor measurements by using an intact HMMV
reference core. The sediment surface is located at the depth 0 mm.

Results
4.2.2 Tracer Experiments with Sediments of HMMV
32
For this experiment “active” surface sediment (0-5 cm) with high AOM rates was diluted with
etermine the biomass depending
M rates of this undiluted
relatively high AOM
“less-active” deep sediment (15-30 cm) in order to d
anaerobic methane oxidation (AOM) and sulfate reduction (SR) rate.
The rates of AOM and SR are displayed the Fig. 11. The average SR rates of the replicates of
the surface slurry were 36.4 nmol gwet weight (ww)-1d-1. In general, AO
slurry was lower than SR rate, but still in the same range with the average of
21.9 nmol gww-1 d-1. The rates of the other approaches had the same overall ratio of AOM and
SR as the surface slurry. The sediment from the bottom of the core had
and SR rates (ca. 10 nmol gww-1d-1). Hence the effect of mixing the surface and bottom
sediments was only detectable down to a 1:10 mixture.
surface 1:5 1:10 1:50 sub-surface
rate
s [nm
o
0
10
20
l gslu
rry
wet
wei
ght-1
d-1]
30
40
50
SRR AOMSRR AOM
SRR AOMSRR AOMSRR AOM
Figure 11: Rates of the anaerobic methane oxidation (AOM) and sulfate reduction (SRR)
given in rates per wet weight slurry.
The rate measurements correlated to abundance of aggregates (Tab. 8). The numbers of
aggregates might be slightly underestimated due to the fact that only DAPI stained filters
without hybridization were used for counting. Therefore, identification of aggregates was
done by counting only clearly identifiable aggregate structures. Smaller and untypical
rchaea specific probe due to high sedim
have been embedded in agarose.
aggregates were maybe overseen. It was not possible to use the samples hybridized with the
ent loss during the FISH procedure, although filters A
Results
33
.1) were also found in the sediment
et al. (unpublished)
7 and 2.8, respectively.
Roughly calculated cell specific rates using total cell numbers of the slurry and the average
AOM as well SR rate, show that the sub-surface slurry had slightly higher cell specific rates
(2.9 x10⁻⁸ nmol cell-1 d-1) than surface slurry (cell specific rates of AOM
1.1 x10⁻⁸ nmol cell-1 d-1 and SR 1.8 x10⁻⁸ nmol cell-1 d-1, respectively). The cell specific rates
of the dilution steps (1.4- 2.2 x10⁻⁸ nmol cell-1 d-1) were lower than the rate of the sub-surface
slurry and in the range of the surface slurry. However, it has to be considered that the cell
specific rates are only rough estimations due to the fact that SR bacteria as well as ANME-3
archaea were not distinguished in the calculations.
The two described morphological aggregate forms (see 4
slurries. The diameters of the spherical aggregates ranged from 4-12 µm. The diameters of
surface slurry was also hybridized with the probe ANME3-1249 (data not shown) and all
visible aggregates had hybridization signals. Furthermore, Lösekann
detected also only ANME-3 cells below the white Beggiatoa mats of HMMV. Hence, the
observed aggregates most likely belonged to the ANME-3 group.
In the surface slurry, 8.9x10⁵ aggregates ml-1 were counted and the AOM as well as SR rates
were 21.9 nmol gww-1 d-1 and 36.4 nmol gww
-1 d-1, respectively. The sub-surface slurry
contained 1.6 x10⁵ aggregates ml-1 and had nearly identical AOM and SR rate of ca. 13 nmol
gww-1 d-1. Hence, the surface slurry contained five times more aggregates than the sub-surface,
but the AOM and SR rates differed only by a factor of 1.
Results
total cell numbers including aggregates
34
surface 1:5 1:10 1:50 sub-surface
cells
per
ml s
lurr
y
0.0
5.0e+8
1.0e+9
1.5e+9
2.0e+9
2.5e+9A
archaeal abundance
surface 1:5 1:10 1:50 sub-surface
cells
per
ml s
lurr
y
0.0
5.0e+8
1.0e+9
1.5e+9
2.0e+9
2.5e+9B
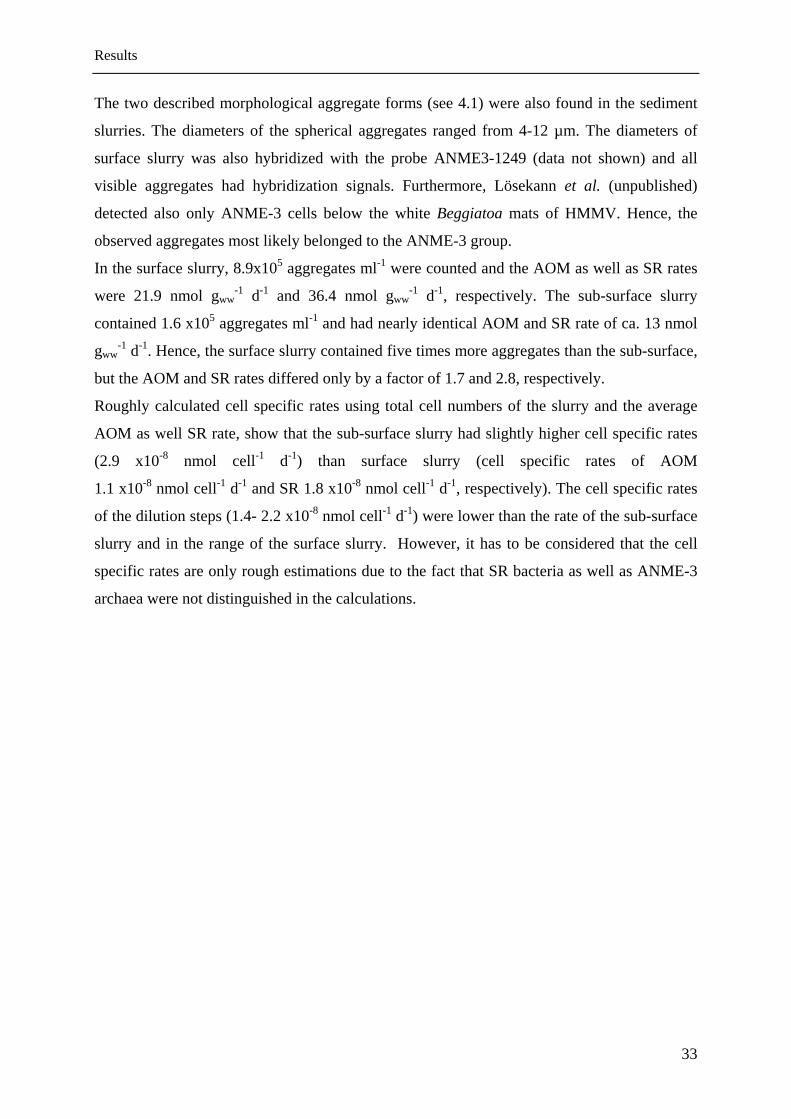
The relative archaeal abundance was lower than 8% of single DAPI cells in all dilutions and
therefore lower than in the slurries used for dilution (8% of single DAPI cells). Nevertheless,
the total archaeal abundance (Fig. 12) including aggregate associated cells represented the
main fraction of archaeal cells.
The bacterial single cells were determined by using probe EUB338 I-III. The relative
abundance of all bacterial cells ranged from 43-60% of single DAPI cells in all dilutions. The
total numbers of Bacteria were one order of magnitude lower than the Archaea or total cell
numbers. The cell numbers had not to be corrected due to the fact that hybridization signals of
probe NON338 were below detection limit.
Figure 12: The total numbers of cells in the sediments of the dilutions are shown in chart A. The abundances of archaeal cells (including the Archaea of aggregates) are displayed in (B) and chart C describes the bacterial abundances of the dilutions. Note: bacterial abundance is given in range of 108; archaeal abundance and total cell counts as 109.
bacterial abundance
surface 1:5 1:10 1:50 sub-surface 0.0
5.0e+7
1.0e+8
1.5e+8
2.0e+8
2.5e+8C
cells
per
ml s
lurr
y

Results
35
able 8: Results of flourescence-in situ-hybridizations and total cell counts. Bacteria were determined by using monolabeled EUB338 I-III probe and CARD-FISH was applied in order to identify archaeal cells. 1The values are also determined for the two depths used for dilution. The confidence intervals of the single cells were calculated with a probability of 95%. The aggregates were counted on only one filter and therefore no error calculations were done.
T
Total single cells (counted) aggregates (counted) Total cells
(calculated) Bacteria * Archaea *
[cells x 108 x ml-1] [aggregates x 105 x ml-1] [cells x 109 x ml-1] (EUB338 I-III) (Arch915)
undiluted 4.5 ± 0.7 8.9 2.0 43 71:5 2.3 ± 0.3 3.3 0.8 51 61:10 1.9 ± 0.2 2.4 0.6 48 31:50 1.9 ± 0.2 2.1 0.6 56 41:100 1.6 ± 0.2 1.6 0.4 60 2
0-5cm1 5.8 ± 1.3 12.0 2.6 50 815-30cm1 3.3 ± 0.2 1.4 0.6 51 8
* relative abundance of free living single cell (% of DAPI stained cells)
Discussion
36
5. Discussion
5.1 Comparison of communities at neighboring sampling sites
5.1.1 Composition of methanotrophic communities
The results of FISH were combined with the biomarker analysis in order to describe the
microbial communities of the three investigated sites (“center”, “bacteria patch”, and
“between patches”). For FISH, probes specific for different phylogenetic levels, e.g. Bacteria,
Archaea, were used to identify and quantify the microorganisms in situ. In the biomarker
approach, characteristic membrane compounds of Archaea and Bacteria are used to
investigate the community structure. The fatty acid composition (fingerprint pattern) analysis
is a common method for the identification of microorganisms and their chemotaxonomic
description (Niemann et al., unpublished-a and references therein). Furthermore, the
concentration of FAs in the sediment can be used for estimating relative biomass abundances.
The highest number of aggregates, identified as ANME-3 consortia, was found below the
“bacteria patch” (51.3 aggregates x 105 ml-1). This novel ANME-group was recently
described in more detail with molecular tools (Lösekann et al., unpublished) as well as
biomarkers (Niemann et al., unpublished-a). In this study, the composition of archaeal
specific isoprenoid hydrocarbons in the “bacteria patch” sediment was similar to the one
described by Niemann et al., (unpublished-a) for the ANME-3 consortia. The occurrence of
PMI 4 and 5 as well as the missing of other saturated and unsaturated PMI´s combined with
the absence of crocetane strongly suggest that the dominating fraction of Archaea below the
“bacteria patch” belong to the novel ANME-3 group. Furthermore, this conclusion is
supported by the fact that the sample contained nearly two times more sn2-hydroxyarchaeol
than archaeol. These characteristic features in combination were only found in the “bacteria
patch” sediment. PMI 4 and 5 were not detectable in the samples of the “between patches”
site and the “center” sediment. Additionally, the concentration of sn2-hydroxyarchaeol was
significant higher in the bacterial mat sediment compared to the other sites. Hence, the ratio
of sn2-hydroxyarchaeol and archaeol was also different and not longer specific for ANME-3.
The morphology of the ANME-3 aggregates were similar to the description of Lösekann et al.
(unpublished). Aggregates with cylindrical as well as spherical morphology were observed.
Furthermore, the bacteria that were directly associated with the aggregates formed only a
partial outer shell. These bacteria were identified with the FISH specific probe DBB660
(Lösekann et al., unpublished) as Desulfobulbus species (DBB).
Discussion
37
The highest relative abundance of the FA C17:1 ω6c was found in sample of the “bacteria
patch”. It was below the detection limited in the “center” site and only found in very low
abundances in the “between patches” site. The “bacteria patch” had also the highest relative
abundance of C16:1 ω5 and the lowest of this FA were measured in the sample of the
“center” site. Significant amounts of C17:1 ω6c as well as C16:1 ω5 were also found by
Niemann et al. (unpublished-a ) below Beggiatoa mats at HMMV. The authors concluded that
these FAs (FA C17:1 ω6c and C16:1 ω5) are specific for Desulfobulbus spp and the 13C
depletion C17:1 w6c indicates that these bacteria are participating in the process of AOM.
The reduced abundances of C17:1 ω6c and C16:1 ω5 in the “between patches” and “center”
site correlates to the already described reduced concentration of the specific ANME-3
isoprenoid hydrocarbons and alcohols. Therefore, the biomarker analyses showed that the
ANME-3/DBB consortia occur only below “bacteria patch”. The sensitivity of the FISH
method was higher than that of the biomarker approach and aggregates were detected in all
sites investigated. Due to the FAs fingerprint and FISH analysis, it can be concluded that
ANME-3 aggregates were associated with bacteria that belong to the genus Desulfobulbus,
which would be in agreement with previous works (Lösekann et al., unpublished; Niemann et
al., unpublished-a).
The FAs C16 ω8c and C 16:2 had their highest relative abundance in the “center” site. This
pattern is characteristic for type I methanotrophs and was described before to be found in the
center of HMMV (Niemann et al., unpublished-a). Additional analysis by the author showed
that the FAs C16 ω8c and C 16:2 were depleted in 13C. Hence, Niemann et al. (unpublished-
a) concluded that methane, exclusively used as carbon source, is oxidized aerobically in the
center of HMMV.
In this study the characteristic FAs of type I methanotrophs occurred also in the “between
patches” and “bacteria patch” sites. However, the relative abundance of these FAs was
reduced in the sample of the “between patches” site and in the “bacteria patch” sediment was
only half the concentration of the “center” site. Aerobic methanotrophs were found in situ
(probe Met I-444, data not shown) at all sites investigated, confirming the biomarker data.

Discussion
38
5.1.2 Distribution of AOM aggregates and aerobic methanotrophs
The relatively young and uncovered center sediments of HMMV harbor a community
dominated by aerobic methanotrophic bacteria, which use the upcoming methane and the
oxygen of the overlaying water column to gain energy. Aggregates of methanotrophic archaea
are absent at this site of HMMV (Lösekann et al., unpublished). At the center of HMMV, the
sediment is periodically mixed by the high fluid as well as mud flow. Therefore, the relief of
the center is rough and irregular. But it becomes more flat and smooth in the transition zone
of the center and outer Beggiatoa mats. The disturbance processes of the sediment are
reduced, which affects also the community in the transition zone. The first patch bacterial
mats are indications that AOM occurs in this sediment. The aim of this study was to
investigated if the appearance of aggregates influences the formation of Beggiatoa mats and
how disturbance events of the sediment affect the community structure.
The total cell numbers of the “center” site (max. 7.5x10⁸ cells ml-1) were significant lower
compared to total cell numbers of the HMMV center (max. 5.1x10⁹ cells ml-1) determined by
Lösekann et al. (unpublished). This could be an indication that the sediment of the “center”
site was involved in mixing processes that caused also a dilution of the microbial community.
The significant highest concentration of characteristic bacterial FAs was found in the
sediments of the “bacteria patch” (75.5 µg g-dw-1). Hence, the highest bacterial biomass is
located at this site. Total cells counts confirmed this result showing the highest abundance of
Bacteria also below the “bacteria patch” (max. 3.2x10⁹ cells ml-1). The sediment of the
“between patches” site (12.1 µg g-dw-1) contained nearly as much FAs as the “center”
(10.3 µg g-dw-1). However, the bacterial cell numbers in the “center” sediment
(max. 7.5x10⁸ cells ml-1) were lower than in the “between patches” site
(max. 2.0x10⁹ cells ml-1).
Biomarker approach indicated that ANME-3 aggregates are only located in the sediments of
the "bacterial patch". However, the FISH data showed that the ANME-3 aggregates were also
present in the “between patches” and “center” site. These aggregates were maybe not detected
by the biomarker approach due to the significant 5 fold lower abundance in the “center” and
“between patches” sediment compare to the “bacteria patch” (9.3 aggregates x 105 ml-1 and
13.5 aggregates x 105 ml-1 vs. 51.3 aggregates x 105 ml-1). Furthermore, the upper 5 cm of the
sediments were pooled for the biomarker analyses and therefore the concentration of
biomarkers probably decreased below the detection limit of the method.
The “center” sediment of this study was dominated by aerobic methanotrophic bacteria, but it
contained also ANME-3/DBB aggregates. The sample for the biomarker analysis was pooled
Discussion
39
and therefore the distribution of the methanotrophs in the sediment remains uncertain.
Nevertheless, the highest relative abundance of Bacteria (max. 76%) was found in the
“center” sediment and it could be assumed that methanotrophic bacteria formed a significant
fraction of the microbial community.
The ANME-3/DBB aggregates showed the maximum abundance in the top centimeter of the
“center” sediment, but the “center” sediment contained down to the depth of 5 cm aggregates.
This distribution and the fact that aggregates appeared together with the methanotrophs could
be an indication that the “center” sediment was mixed recently and not freshly expelled. More
likely, surface sediment containing aggregates was mixed with deep subsurface sediment and
therefore aggregates were diluted and distributed equally over depth. Whether the found
aggregates are active or maybe inactive at different depths is uncertain.
Nevertheless, the measured MOx and SR rate profile indicated that methane is mainly
oxidized aerobically due to the low SR rates at "center" site. Therefore, the activity of the
aggregates seems to be reduced to background values.
The analyses of the “between patches” samples showed that the results can be placed
between the “center” and the “bacteria patch”. Overall, the features of the “between patches”
sediment are more similar to the “center” than to the “bacteria patch” site.
In the sediment of the “between patches”, the abundance of aerobic methantrophic bacteria is
already reduced and the total number of aggregates is increased compared to the “center” site.
The abundance of ANME-3/DBB aggregates is significant higher in the “bacteria patch”
(max. 5.1x10⁶ aggregates ml-1) compared to the “between patches” site
(max. 1.3x10⁶ aggregates/ml). However, the ANME-3/DBB aggregates were detected at all
investigated depths at the "between patches" site. The highest concentration of aggregates was
found at 1-2 cm depth and therefore the peak is slightly deeper than the aggregate maxima of
the “center” site. The nearly equal distribution of aggregates over depth could be explained
again by mixing processes of sediments.
It could be suggested that the ANME-3 aggregates are not able to compete successfully with
the aerobic methanotrophs in the top layer of the sediment due to the fact that their maximal
abundance was found at 1-2 cm depth. The presence of oxygen in the surface sediment would
select for aerobic methanotrophs.
The increasing importance of AOM at in the “between patches” site is also observable in the
rate measurements. The MOx rates were in the same range like at the “center” site, but the SR
rates were higher in the “between patches” compare to the “center” sediment. The process of
Discussion
40
AOM is coupled to the SR and therefore an increase in the reduction of sulfate could be
caused by an increase of AOM activity.
In conclusion, methane oxidation is still probably mainly performed by aerobic type I
methanotrophic bacteria in surface of the “between patches” site sediment. However, due to
the increasing abundances of aggregates with depth and the rate measurements it can be
claimed that AOM becomes more important in the subsurface sediment.
Below the Beggiatoa mats at HMMV, the high abundance ANME-3 aggregates was limited to
a narrow zone at 1-2 cm depth (Lösekann et al., unpublished; Niemann et al., unpublished-a).
In this study, the highest abundances of ANME-3 aggregates were found below 3 cm depth in
the sediment of the “bacteria patch” (presumable Beggiatoa spp.). The maximal abundance
(5.1x10⁶ aggregates ml-1) is lower compared to 2x10⁷ aggregate ml-1 that were found in other
Beggiatoa mats at HMMV (Lösekann et al., unpublished). The available data of the “bacteria
patch” site (upper 5 cm) did not show a decrease of the aggregate abundance in depth. It can
suggested at the sample site very close to the center, the specific stratification described by
Lösekann et al., (unpublished) with the growth of aggregates into a high density has been not
reached, yet. Mixing processes could be the reason for the distribution of ANME-3 aggregates
over a wide depth.
However, the FAs analysis indicated also that aerobic type I methanotrophs are still present
below the “bacteria patch”. The distribution over depth remains uncertain due to the low
resolution of the chosen approach. However, by assuming that the aerobic methanotrophs
require oxygen, they might occur in the upper centimeters. Aerobic methanotrophs were also
detected in low abundances in the sediment of the HMMV Beggiatoa zone (Lösekann et al.,
unpublished).
In conclusion, AOM performed by ANME-3 aggregates seems to be the dominating process
in the sediment of the “bacteria patch”. This assumption is supported by the high abundance
of ANME-3/DBB aggregates and the rate measurements. The highest SR rates of all sites
were determined for the “bacteria patch” sediment and are in the same range as the measured
MOx rates.
The appearance of sulfide oxidizing bacteria, e.g. Beggiatoa, at the surface of the sediment is
an indication for high advective sulfide flow from the underlying sediment (Treude et al.,
2003). Therefore, the relatively thin coverage of the sediment and patch bacterial mats shows
that communities of anaerobic methane oxidizers and associated sulfate-reducing bacteria
were not fully developed yet in their newly stabilized sediment. Furthermore, Beggiatoa mats
and AOM aggregates influence positively each other.
Discussion
41
5.1.3 Ecology of the transition zone at HMMV
Sediments of or close to the center can be mixed with sub-surface sediments during events of
mud eruption (Lösekann et al., unpublished). The investigated area showed indications of
recent mud flow (“center” sediment) and a beginning stabilizing due to the appearance of the
patchy bacterial mats.
The recent mud flows are dominated by the process of aerobic methane oxidation, but
ANME-3 aggregates are also present at depth. Hence, sediment of this site seems to be mixed
(distribution of aggregates). Aerobic methane oxidation is more favorable due to the higher
energy gain of 126 kJ/mol methane and therefore microorganisms can have a higher growth
rate. The energy yield of AOM is much smaller (22 kJ/mol methane, Sorensen et al., 2001)
and results in a slower growth rate with doubling times of more than three months (Nauhaus
et al., 2004). Therefore, a population based on aerobic oxidation of methane can be described
as pioneer community after sediment disturbance. However, aggregates seem to be still active
and growing slowly until they reach certain abundance and produce higher amounts of
sulfide. The “between patches” sites of this study could be an intermediate state of
development with already measurable SR rates that are likely caused by increasing activity of
AOM.
As soon as the upward flux of sulfide is sufficient enough, mats of sulfide oxidizing bacteria
e.g. Beggiatoa can develop. In this study, the bacterial mats are still patchy and do not cover
the surface of the sediment completely, like it is described for other locations at HMMV
(Lösekann et al., unpublished). The sediments below the bacterial mats close to the center are
less stratified, concerning the distribution of microorganism, than the Beggiatoa outer
sediments (Lösekann et al., unpublished). The distribution, especially of aggregates, below
the bacteria patches can be explained by mixing with subsurface sediment and beginning
stabilization.
In an area of 20 m2 different stages of succession are found at HMMV. After disturbance of
the sediment a type I methanotrophic pioneer community settled and was subsequently
replaced by a community dominated by ANME-3/DBB aggregates.
Discussion
42
5.2 Sulfate & anaerobic oxidation of methane rates and their relation to
microbial biomass
5.2.1 Sulfide profiles in a bacterial mat core of HMMV
The investigation with the microsensors has shown that the oxygen diffusion was still limited
to the first millimeter and the sulfide concentration steeply increased below 1 mm depth.
Hence, it can be assumed that the original community in the sediments was still present, but
less active due to the reduced supply of methane. In situ profile measurements at the HMMV
Beggiatoa mats determined a sulfide peak of 12 mM at 2 cm depth (de Beer & Eickert, 2004).
The highest measured concentration in the core was only 0.7 mM and therefore more than10
fold lower than the maxima in situ concentration. However, the sulfide was only measured
down to 1 cm depth and therefore the maxima sulfide concentration in the core could be not
determined. Due to the in situ data, the sulfide peak was presumably below 1 cm and with a
higher concentration than 0.7 mM.
5.2.2 Tracer Experiments with Sediments of HMMV
The investigation of the microbial community in the slurry from a bacterial mat was rather
difficult by FISH. As mentioned before, significant amounts of sediment including cells were
lost during the FISH process. Furthermore, the CARD-FISH approach was chosen in order to
distinguish unspecific signals from the probe signal ARCH915. This method includes many
washing steps, during which sample material can be lost. Therefore, only reduced numbers of
cells (< 500 cells) could be investigated during the analyses of the filters compared to total
cell or Bacteria counts. Even agarose embedding of filters did not prevent the loss of
sediment.
AOM and SR rates, in the experiment with the slurries, were in the same range. Therefore, it
can be concluded that AOM and SR were coupled in this experiment with an average ratio of
1:1.3. Niemann et al., (unpublished-b) determined for sediment below HMMV Beggiatoa
mats AOM and SR rates that varied in two orders of magnitude between replicates and were
in the range from 0.015 to 0.703 and from 0.037 to 2.396 µmol cm-3day-1, respectively. The
measured average rates of the undiluted slurry were for AOM 0.02 µmol gww d-1and SR 0.036
µmol gww d-1. Hence, the measured rates are low but still in the same range compare to ex situ
measurements of Niemann et al., (unpublished-b). The rates have to be lower due the
application of different approaches, most likely explainable by lower methane concentrations.
Discussion
43
The rates could be also lower due to the short pre-incubation in order to activate the
microorganism. The slurries were incubated for 19 days and the tracer was added as soon as a
slight increase of the sulfide concentration was observed. This period of time was maybe to
short for the microorganism to reinstall their normal level of activity, after storage of four
months without continuously methane supply.
The measured AOM and SR rates between the single dilutions differed not always
significantly from each other. These observations were due to the fact that the “less-active”
(15-30 cm) sediment still contained aggregates and had high cell specific rates. Therefore, the
rates of the dilutions 1:10 and 1:50 seems to be the background rates of the sub-surface
sediment. Before the experiment was started, it was assumed that the abundance of
aggregates is limited to the surface and nearly absent deeper in the sediment of the HMMV
Beggiatoa mats (Lösekann et al., unpublished; Niemann et al., unpublished-a; Niemann et al.,
unpublished-b). Hence, sediment at 15-30 cm depth would be useable for diluting the
aggregate containing surface sediment without intensively changing of the physical
parameters.
In 5.1 of this study it was shown that aggregates were also found in the sub-surface after
sediment mixing events. The ANME-3 aggregates of sub-surface sediment were obviously
reactivated during the pre-incubation.
Small differences in cell specific rates of different dilution steps could also be a consequence
of the variability in the data (rates, cell numbers). Hence, by using total cell numbers as
indicator of total biomass, it can be assumed that AOM and SR rates are correlating with the
biomass in this study.
AOM is presumably mainly performed by the cells of ANME-3 consortia, which dominate
the total cell numbers. Therefore, the abundance of ANME-3 aggregates can be used as a
direct indicator for the AOM activity in sediments as long as other parameters, e.g. methane
or sulfate supply, are considered as well.
The tracer experiment demonstrated that the activity of AOM is mainly influenced by the
abundance of aggregates. After mixing of sediments with different contents with respect to
biotic and abiotic factors, the number of aggregates will be reduced. Therefore, AOM and SR
gross rate will decrease as long as sulfate and methane are still available for the process.
Discussion
44
5.3 Further Prospects
The samples of the ARK XIX 1b cruise could be further investigated in more details by using
FISH. The depth distribution analysis of methanotrophs at the three sites would make it
possible to state whether methanotrophs are also mixed within the sediment or settled later on
the top of the “center” site. Furthermore, methanotrophs occurred also at the “bacteria patch”
site but at which depth remains also uncertain.
Another aspect would be the distribution ANME-3 single cells that were also observed in the
samples but not counted. The analyses could maybe give information about the dispersal
process of ANME-3 cells and the potential influence of single ANME-3 cells on the total
AOM rate. The application of other probes of e.g. sulfate reducing bacteria could be also
helpful to understand the observation that ANME-3 aggregates seems to be only loosely
associated with Desulfobulbus spp.. (Lösekann et al., unpublished) proposed for example the
hypothesis that ANME-3 archaea maybe have the capability to perform AOM as well as SR
by them own.
It would be also interesting to take new samples in lower distances to each other and get a
transect. The investigation of these samples could show better the succession process and
would maybe also give more information about the spatial heterogenesis of the sediments.
The tracerexperiment could be further improved to see true relations between biomass and
rates. The used sediment should be longer pre-incubated in order to activate the aggregates
completely. It would be even better to used fresh sediment without a longer storage.
Furthermore, the sub-surface sediment used for dilution should come from below 30 cm and
should be pre-investigated by DAPI or AO stain in order to determine the abundance of
microorganism and aggregates.
This study has shown that microbial aggregates are able to survive for longer time at depths
that maybe not offer optimal living conditions. Hence, another interesting aspect would be to
investigate the ability of aggregates to recover after a period of starvation or even dormancy.
Furthermore, it would be also relevant to investigate the ability of aggregates to survive
unfavorable conditions. Unfortunately, pure or highly enriched cultures of ANME-3 would be
required to do the last named experiment. So far it was not possible to cultivate these
organisms in the laboratory.
References
45
6. References
Amann, R. I., Binder, B. J., Olson, R. J., Chisholm, S. W., Devereux, R. & Stahl, D. A. (1990). Combination of 16s Ribosomal-Rna-Targeted Oligonucleotide Probes with Flow-Cytometry for Analyzing Mixed Microbial-Populations. Appl Environ Microb 56, 1919-1925. Boetius, A., Ravenschlag, K., Schubert, C. J. & other authors (2000). A marine microbial consortium apparently mediating anaerobic oxidation of methane. Nature 407, 623-626. Cord-Ruwisch, R. (1985). A quick method for the determination of dissolved and precipitated sulfides in cultures of sulfate-reducing bacteria. J Microbiol Meth 4, 33-36. Daims, H., Bruhl, A., Amann, R., Schleifer, K. H. & Wagner, M. (1999). The domain-specific probe EUB338 is insufficient for the detection of all Bacteria: Development and evaluation of a more comprehensive probe set. Syst Appl Microbiol 22, 434-444. de Beer, D. & Eickert, G. (2004). Microscale analysis of the surface sediments. In The Expedition ARKTIS XIX/3 of the Research vessel POLARSTERN in 2003. Edited by M. Klages, J. Thiede & J. P. Foucher. Bremerhaven. Elvert, M., Boetius, A., Knittel, K. & Jorgensen, B. B. (2003). Characterization of specific membrane fatty acids as chemotaxonomic markers for sulfate-reducing bacteria involved in anaerobic oxidation of methane. Geomicrobiol J 20, 403-419. Fossing, H. & Jorgensen, B. B. (1989). Measurement of Bacterial Sulfate Reduction in Sediments - Evaluation of a Single-Step Chromium Reduction Method. Biogeochemistry 8, 205-222. Hallam, S. J., Girguis, P. R., Preston, C. M., Richardson, P. M. & DeLong, E. F. (2003). Identification of methyl coenzyme M reductase A (mcrA) genes associated with methane-oxidizing archaea. Appl Environ Microb 69, 5483-5491. Hinrichs, K. U., Hayes, J. M., Sylva, S. P., Brewer, P. G. & DeLong, E. F. (1999). Methane-consuming archaebacteria in marine sediments. Nature 398, 802-805. Hinrichs, K. U. & Boetius, A. (2002). The anaerobic oxidation of methane: New insights in microbial ecology and biogeochemistry. In Ocean margin systems, pp. 457-477. Edited by G. Wefer, D. Billet, D. Hebbeln, B. B. Jorgensen, M. Schlüter & T. van Weering. Berlin Heidelberg: Springer-Verlag. Hjelstuen, B. O., Eldholm, O., Faleide, J. I. & Vogt, P. R. (1999). Regional setting of Hakon Mosby Mud Volcano, SW Barents Sea margin. Geo-Mar Lett 19, 22-28. Hoehler, T. M., Alperin, M. J., Albert, D. B. & Martens, C. S. (1994). Field and Laboratory Studies of Methane Oxidation in an Anoxic Marine Sediment - Evidence for a Methanogen-Sulfate Reducer Consortium. Global Biogeochem Cy 8, 451-463. Hsieh, Y. P. & Yang, C. H. (1989). Diffusion Methods for the Determination of Reduced Inorganic Sulfur Species in Sediments. Limnol Oceanogr 34, 1126-1129.
References
46
Jeroschewski, P., Steuckart, C. & Kuhl, M. (1996). An amperometric microsensor for the determination of H2S in aquatic environments. Anal Chem 68, 4351-4357. Joye, S. B., Boetius, A., Orcutt, B. N., Montoya, J. P., Schulz, H. N., Erickson, M. J. & Lugo, S. K. (2004). The anaerobic oxidation of methane and sulfate reduction in sediments from Gulf of Mexico cold seeps. Chem Geol 205, 219-238. Kallmeyer, J. & Boetius, A. (2004). Effects of temperature and pressure on sulfate reduction and anaerobic oxidation of methane in hydrothermal sediments of Guaymas Basin. Appl Environ Microb 70, 1231-1233. Kruger, M., Meyerdierks, A., Glockner, F. O. & other authors (2003). A conspicuous nickel protein in microbial mats that oxidize methane anaerobically. Nature 426, 878-881. Kühl, M. & Steuckart, C. (2000). Sensors for In situ Analysis of Sulfide in Aquatic Systems. In In Situ Monitoring of Aquatic Systems: Chemical Analysis and Speciation, pp. 121-159. Edited by J. Buffle & G. Horvai. Chichester: John Wiley &Sons, LTD. Lösekann, T. (2002).Molekularbiologische Untersuchung der Diversität und Struktur mikrobieller Lebensgemeinschaften in methanreichen, Marinen Sedimenten (Håkon-Mosby-Schlammvulkan). In Fachbereich 2: Universität Bremen. Lösekann, T., Nadalig, T., Niemann, H., Knittel, K., Boetius, A. & Amann, R. (unpublished). Identification of a new cluster of anaerobic oxidizers at an Arctic mud volcano (Håkon Mosby Mud Volcano, Barents Sea). Michaelis, W., Seifert, R., Nauhaus, K. & other authors (2002). Microbial reefs in the Black Sea fueled by anaerobic oxidation of methane. Science 297, 1013-1015. Milkov, A., Vogt, P., Cherkashev, G., Ginsburg, G., Chernova, N. & Andriashev, A. (1999). Sea-floor terrains of Hakon Mosby Mud Volcano as surveyed by deep-tow video and still photography. Geo-Mar Lett 19, 38-47. Milkov, A. V., Vogt, P. R., Crane, K., Lein, A. Y., Sassen, R. & Cherkashev, G. A. (2004). Geological, geochemical, and microbial processes at the hydrate-bearing Hakon Mosby mud volcano: a review. Chem Geol 205, 347-366. Nauhaus, K., Boetius, A., Kruger, M. & Widdel, F. (2002). In vitro demonstration of anaerobic oxidation of methane coupled to sulphate reduction in sediment from a marine gas hydrate area. Environ Microbiol 4, 296-305. Nauhaus, K., Treude, T., Boetius, A. & Krüger, M. (2004). Environmental regulation of the anaerobic oxidation of methane: a comparison of ANME-I and ANME-II communities. Environ Microbiol 10.1111/. Niemann, H., Lösekann, T., Elvert, M., Jakob, J., Nadalig, T. & Boetius, A. (unpublished-a). Succession of novel methanotrophic guilds along mud flows at Håkon Mosby mud volcano, Barents Sea-evidence of biomarker and DNA analysis.
References
47
Niemann, H., Sauter, E. J., Krüger, M., Heinrich, F., Lösekann, T., Elvert, M. & Boetius, A. (unpublished-b). Various modes of methane oxidation in sediments of Håkon Mosby. Orphan, V. J., Hinrichs, K. U., Ussler, W., Paull, C. K., Taylor, L. T., Sylva, S. P., Hayes, J. M. & Delong, E. F. (2001). Comparative analysis of methane-oxidizing archaea and sulfate-reducing bacteria in anoxic marine sediments. Appl Environ Microb 67, 1922-1934. Orphan, V. J., House, C. H., Hinrichs, K. U., McKeegan, K. D. & DeLong, E. F. (2002). Multiple archaeal groups mediate methane oxidation in anoxic cold seep sediments. P Natl Acad Sci USA 99, 7663-7668. Pernthaler, A., Pernthaler, J. & Amann, R. (2002). Fluorescence in situ hybridization and catalyzed reporter deposition for the identification of marine bacteria. Appl Environ Microb 68, 3094-3101. Pimenov, N., Savvichev, A., Rusanov, I., Lein, A., Egorov, A., Gebruk, A., Moskalev, L. & Vogt, P. (1999). Microbial processes of carbon cycle as the base of food chain of Hakon Mosby Mud Volcano benthic community. Geo-Mar Lett 19, 89-96. Reeburgh, W. S. (1996). "Soft spots" in the global methane budget. In Microbial growth on C1 compounds, pp. 334-342. Edited by M. E. Lidstrom & F. R. Tabita. Dordrecht, The Netherlands: Kluwer Academic Publishers. Revsbech, N. P., Jorgensen, B. B., Blackburn, T. H. & Cohen, Y. (1983). Microelectrode Studies of the Photosynthesis and O-2, H2s, and Ph Profiles of a Microbial Mat. Limnol Oceanogr 28, 1062-1074. Smirnov, R. V. (2000). Two new species of Pogonophora from the arctic mud volcano off northwestern Norway. Sarsia 85, 141-150. Sorensen, K. B., Finster, K. & Ramsing, N. B. (2001). Thermodynamic and kinetic requirements in anaerobic methane oxidizing consortia exclude hydrogen, acetate, and methanol as possible electron shuttles. Microbial Ecol 42, 1-10. Treude, T., Boetius, A., Knittel, K. & other authors (2003a). Anaerobic oxidation of methane at Hydrate Ridge (OR). Geochim Cosmochim Ac 67, A491-A491. Treude, T., Boetius, A., Knittel, K., Wallmann, K. & Jorgensen, B. B. (2003b). Anaerobic oxidation of methane above gas hydrates at Hydrate Ridge, NE Pacific Ocean. Mar Ecol-Prog Ser 264, 1-14. Trüper, H. G. & Schlegel, H. G. (1964). Sulfur metabolism in Thiorhodaceae -Qualitative measurements in growing cultures of Chromatium okenii. Antonie Leeuwenhoek 30, 225-238. Valentine, D. L. (2002). Biogeochemistry and microbial ecology of methane oxidation in anoxic environments: a review. Anton Leeuw Int J G 81, 271-282.

References
48
Vogt, P., Cherkashev, G., Ginsburg, G. & other authors (1997). Haakon Mosby Mud volcano provides unusual example of venting. EOS Transactions of the Amercan Geophysical Union Supplement 78(48), 556-557. Wallner, G., Amann, R. & Beisker, W. (1993). Optimizing Fluorescent Insitu Hybridization with Ribosomal-Rna-Targeted Oligonucleotide Probes for Flow Cytometric Identification of Microorganisms. Cytometry 14, 136-143. Widdel, F. & Bak, F. (1992). Gram-Negative Sulfate Reducing Bacteria in:. In The Prokaryotes 2nd edition - A Handbook on the Biology of Bacteria:Ecophysiology, Isolation, Identification, Applications. Edited by A. Balows, G. H. Trüber, M. Dworkin, W. Harder & K. H. Schleifer. Berlin: Springer-Verlag.
Appendix
49
Appendix
A 1 Solutions & Materials
A 1.1 FISH:
• Acridine Orange (Fluka Chemie GmbH; Buchs, Germany), 0.01% (w/v) solution: sterile
filtrated
• agarose (Seakem® LE Agarose; Rockland, USA), 0.2% (w/v)
• 10xBlocking reagent (Roche Diagnostic GmbH; Mannheim, Germany)
• Cargille immersion oil (Cargille Laboratories Inc, USA)
• cellulose nitrate support filter (0.45 µm, Sartorius, Götting)
• Citifluor (Citifluor, London, UK)
• citrate buffer: 0.1 M Na-citrate (Merck KgaA; Darmstadt, Germany), pH 4, sterile filtrated
• cover slip
• DAPI solution (Sigma-Aldrich Chemie GmbH; Steinheim, Germany), 1 µg ml-1
• dextran sulphate (Sigma-Aldrich Chemie GmbH; Steinheim, Germany)
• EDTA (Fluka Chemie GmbH; Buchs, Germany): pH 8, autoclaved, sterile filtrated
• ethanol (Merck KgaA; Darmstadt, Germany), 96% (v/v)
• filter tower for 25 mm filter
• formaldehyde (Fluka Chemie GmbH; Buchs, Germany), 4% (v/v)
• formamide (Fluka Chemie GmbH; Buchs, Germany)
• glass slide
• HCl (Fluka Chemie GmbH; Buchs, Germany)
• H2O2 (Sigma-Aldrich Chemie GmbH; Steinheim, Germany), 30% (v/v)
• Milli Q water: autoclaved, sterile filtrated
• mounting medium: mix 0.5 parts 1xPBS with 5.5 parts Citifluor and 1 part Vectashield (Vector Labh., Burlingame, USA)
• NaCl (AppliChem GmbH; Darmstadt, Germany) solution: autoclaved, sterile filtrated
• Na-Phosphate buffer (pH 7.2-7.4), 1M: titration of Na2HPO4 (Fluka Chemie GmbH; Buchs, Germany) and
NaH2PO4 (Merck KgaA; Darmstadt, Germany)
• nucleopore filter Track-Etch membrane (0.2 µm, black, Whatman)
• 10x PBS (7.2-7.4): - 100 mM Na-Phosphate buffer
1.3 M NaCl
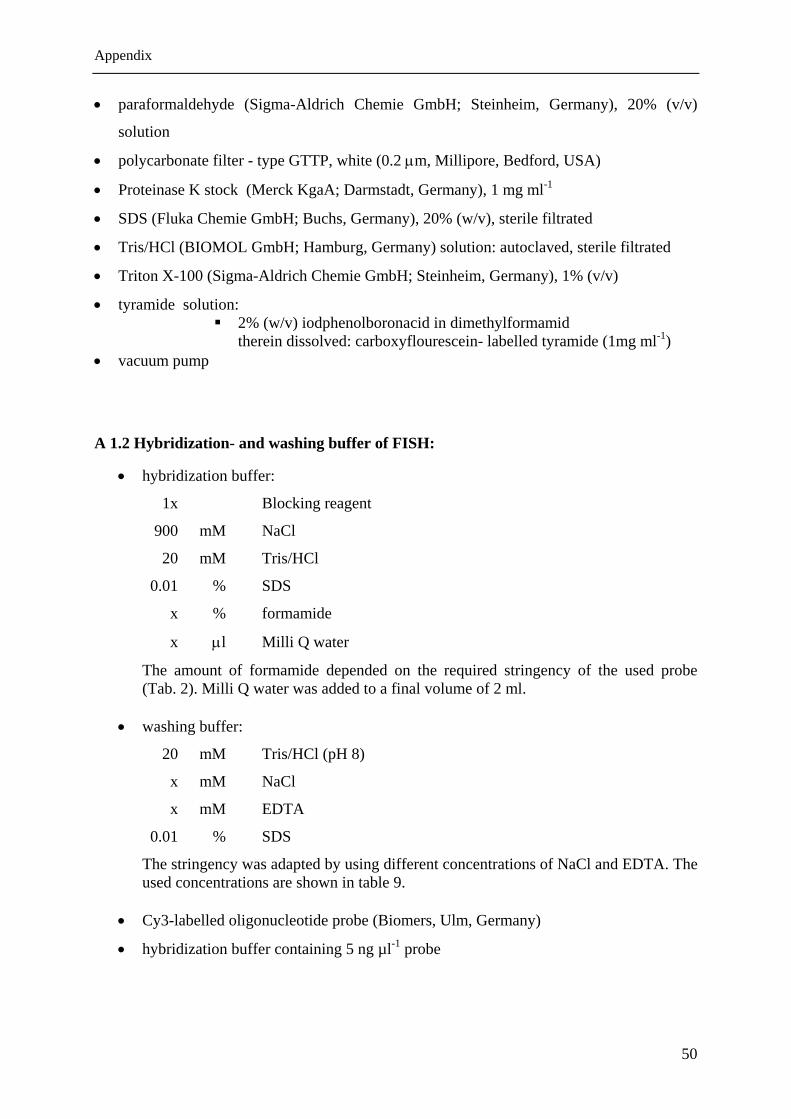
Appendix
50
• paraformaldehyde (Sigma-Aldrich Chemie GmbH; Steinheim, Germany), 20% (v/v)
solution
• polycarbonate filter - type GTTP, white (0.2 µm, Millipore, Bedford, USA)
• Proteinase K stock (Merck KgaA; Darmstadt, Germany), 1 mg ml-1
• SDS (Fluka Chemie GmbH; Buchs, Germany), 20% (w/v), sterile filtrated
• Tris/HCl (BIOMOL GmbH; Hamburg, Germany) solution: autoclaved, sterile filtrated
• Triton X-100 (Sigma-Aldrich Chemie GmbH; Steinheim, Germany), 1% (v/v)
• tyramide solution: 2% (w/v) iodphenolboronacid in dimethylformamid
therein dissolved: carboxyflourescein- labelled tyramide (1mg ml-1) • vacuum pump
A 1.2 Hybridization- and washing buffer of FISH:
• hybridization buffer:
1x Blocking reagent
900 mM NaCl
20 mM Tris/HCl
0.01 % SDS
x % formamide
x µl Milli Q water
The amount of formamide depended on the required stringency of the used probe (Tab. 2). Milli Q water was added to a final volume of 2 ml.
• washing buffer:
20 mM Tris/HCl (pH 8)
x mM NaCl
x mM EDTA
0.01 % SDS
The stringency was adapted by using different concentrations of NaCl and EDTA. The used concentrations are shown in table 9.
• Cy3-labelled oligonucleotide probe (Biomers, Ulm, Germany)
• hybridization buffer containing 5 ng µl-1 probe

Appendix
51
Table 9: Concentration in washing buffer
% formamide during hybridization [NaCl] M 5 M NaCl [µl] 0.5 M EDTA
10 0.450 4500 ---
20 0.225 2150 500
35 0.080 700 500
60 0.014 40 500
A 1.3 Hybridization- and washing buffer of CARD-FISH:
• hybridization buffer (for 20 ml):
3.6 ml 5 M NaCl
0.4 ml 1 M Tris/HCl
20 µl SDS
x ml formamide
x ml Milli Q water
2 ml blocking reagent
The amount of Milli Q depended from the formamide concentration (see Tab. 3). 2.0 g of dextran sulfate were added. The tube had to be heated (40 to 60°C) in order to dissolve it completely. Buffer was stored in the freezer at -20°C.
• washing buffer:
0.5 ml 0.5 M EDTA
1.0 ml 1 M Tris/HCl
x ml 5 M NaCl
add Milli Q water to final volume of 50 ml
25 µl SDS
The NaCl as well as the formamide concentration of the hybridization buffer determined the stringency. See Tab.10 for the used volumes of NaCl at different formamide concentration.
• amplification buffer:
2 ml 20xPBS
0.4 ml Blocking Reagent
added Milli Q water to final volume of 40 ml
4 g of dextran sulfate was added and in order to dissolve it the solution was heated up (40-60°C).The buffer was stored at 4°C for short time and long time at -20°C.
• 100xH2O2 stock (needed to prepare freshly):
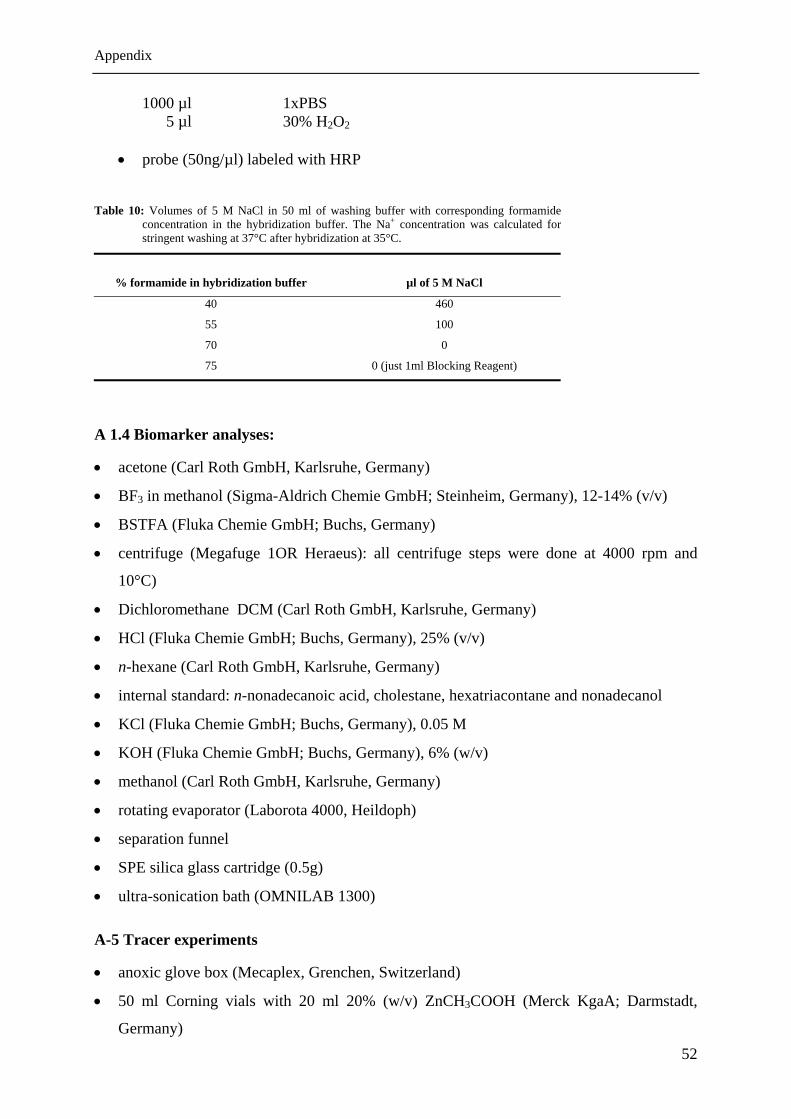
Appendix
52
1000 µl 1xPBS 5 µl 30% H2O2
• probe (50ng/µl) labeled with HRP
Table 10: Volumes of 5 M NaCl in 50 ml of washing buffer with corresponding formamide concentration in the hybridization buffer. The Na+ concentration was calculated for stringent washing at 37°C after hybridization at 35°C.
% formamide in hybridization buffer
µl of 5 M NaCl
40 460
55 100
70 0
75 0 (just 1ml Blocking Reagent)
A 1.4 Biomarker analyses:
• acetone (Carl Roth GmbH, Karlsruhe, Germany)
• BF3 in methanol (Sigma-Aldrich Chemie GmbH; Steinheim, Germany), 12-14% (v/v)
• BSTFA (Fluka Chemie GmbH; Buchs, Germany)
• centrifuge (Megafuge 1OR Heraeus): all centrifuge steps were done at 4000 rpm and
10°C)
• Dichloromethane DCM (Carl Roth GmbH, Karlsruhe, Germany)
• HCl (Fluka Chemie GmbH; Buchs, Germany), 25% (v/v)
• n-hexane (Carl Roth GmbH, Karlsruhe, Germany)
• internal standard: n-nonadecanoic acid, cholestane, hexatriacontane and nonadecanol
• KCl (Fluka Chemie GmbH; Buchs, Germany), 0.05 M
• KOH (Fluka Chemie GmbH; Buchs, Germany), 6% (w/v)
• methanol (Carl Roth GmbH, Karlsruhe, Germany)
• rotating evaporator (Laborota 4000, Heildoph)
• separation funnel
• SPE silica glass cartridge (0.5g)
• ultra-sonication bath (OMNILAB 1300)
A-5 Tracer experiments
• anoxic glove box (Mecaplex, Grenchen, Switzerland)
• 50 ml Corning vials with 20 ml 20% (w/v) ZnCH3COOH (Merck KgaA; Darmstadt,
Germany)

Appendix
53
• gas chromatograph (Hewlett Packard)
• ethylenglycolmonomethylether (Fluka Chemie GmbH; Buchs, Germany)
• 250 ml Erlenmeyer glasses
• 50 ml glass bottles filled with 25 ml 2.5% (w/v) NaOH
• HCl (Merck KgaA; Darmstadt, Germany), 6 M
• Hungate tubes 16 ml
• NaOH (Merck KgaA; Darmstadt, Germany), 2.5%
• NaOH (Merck KgaA; Darmstadt, Germany), 0.5 M
• phenylethylamine (Fluka Chemie GmbH; Buchs, Germany)
• radiotracer: 14C-methane (Amersham Bioscience, UK): dissolved in water, injection
volume 90µl, activity 1kBq
35S-sulfate (Amersham Bioscience, UK): dissolved in water, injection volume
6µl, activity 200kBq
• rubber stoppers (1.5cm thickness) for 50ml glass bottles
• scintillation cocktail (Ultima Gold XR, Perkin Elmer, Boston, USA)
• scintillation counter (2500TR LSC, Packard)
• 6 ml, 20 ml scintillation vials
• artificial seawater medium for sulfate-reducing bacteria (SRB) modified after Widdel &
Bak, 1992:
KBr* 0.756 mM
KCl* 8.05 mM
CaCl2 x 2 H2O* 10.00 mM
MgCl2 x 6 H2O* 27.89 mM
MgSO4 x 7 H2O* 27.60 mM
NaCl* 451.00 mM
addition after autoclavation:
NaHCO3* 30.00 mM
KH2PO4* 1.47 mM
trace elements, vitamins (*Fluka Chemie GmbH; Buchs, Germany)
Acknowledgment
Acknowledgment
Special thanks to Prof. Dr. Antje Boetius for supporting me the last years. She was the person
that first introduce me to field of marine microbiology. The experiences as Hiwi were so
impressive that I wanted to learn more about microbes in the habitat sea. I became the chance
to join the MarMic program, which was also suggested by her. Finally, she offered me the
possibility to work on the fascinating topic of anaerobic methane oxidation for my Masters
Thesis. Now, I am looking forward to work and discover new things during my PhD .
Many thanks to Dr. Katrin Knittel, who was supervising me during the last months and gave
me valuable advices for my work. I am also grateful that she will be the second reviewer of
my thesis.
I would like to express my special graduate to Tina Lösekann, who was excellent supervising
me in all molecular biological questions but also gave me other valuable advices. She was
always patient by explaining and coordinating my work. Furthermore, she became a friend
during the last months.
Thanks to all the people, who spent their limited time by introducing me into new techniques
and methods but also given me advices and new inputs for my work. Therefore, I want say
special thanks to Dr. Tina Treude, Helge Niemann, Amin Bachar and Thomas Höller but also
to the technician Imke Müller.
I want to say thanks to all members of the Biogeochemistry and the Molecular department. I
am grateful for the good atmosphere, friendship and laughs during the sometimes long days in
the MPI. I will also never forget the nine other “little” MarMics that were surviving with me
the last 1.5 years.
Above all I thank my family for their permanent support during my study and my Masters
Thesis. I am also grateful that you helped me to find my own way, although the distance
between us were sometimes longer than all of us wanted.

Erklärung
Statement
Hiermit versichere ich, dass ich diese Arbeit selbständig verfasst und keine anderen als die angegebenen Quellen und Hilfsmittel verwendet habe. I herewith confirm that I have written this thesis unaided and that I used no other resources than those mentioned. _________________________ _________________________________ (Ort und Datum / Place and Date) (Unterschrift / Signature )