Trabajo Práctico Nº 1 - ege.fcen.uba.ar · content, repeat density, local recombination rate, and...
56
EVOLUCIÓN DEPARTAMENTO DE ECOLOGÍA, GENÉTICA Y EVOLUCIÓN FACULTAD DE CIENCIAS EXACTAS Y NATURALES UNIVERSIDAD DE BUENOS AIRES 1° CUATRIMESTRE 2018 GUÍA DE TRABAJOS PRÁCTICOS Y SEMINARIOS MODULO 9 EVOLUCIÓN HUMANA
Transcript of Trabajo Práctico Nº 1 - ege.fcen.uba.ar · content, repeat density, local recombination rate, and...

EVOLUCIÓNDEPARTAMENTO DE ECOLOGÍA, GENÉTICA Y EVOLUCIÓN
FACULTAD DE CIENCIAS EXACTAS Y NATURALES
UNIVERSIDAD DE BUENOS AIRES
1° CUATRIMESTRE 2018
GUÍA DE TRABAJOS PRÁCTICOS YSEMINARIOS
MODULO 9
EVOLUCIÓN HUMANA

TRABAJOS PRÁCTICOS DE EVOLUCIÓN HUMANA
INTRODUCCIÓN GENERAL
El surgimiento de los homínidos puede ser analizado en el marco de los mecanismos evolutivos aprendidos y discutidos durante la materia. Muchos aspectos de la evolución del linaje humano pueden considerarse dentro del marco comprendido por la selección natural ya que todas las especies, (los homínidos no son excepción) son inherentemente variables y esa variabilidad afecta la capacidad de los individuos de sobrevivir y reproducirse. Por otro lado, los recursos son limitados y por lo tanto, existe una competencia entre los individuos por los mismos que resulta en la supervivencia y reproducción diferencial. Sin embargo, existen otros factores que pueden afectar la supervivencia y perpetuación de los seres vivos y además, existen otros niveles en los que puede ocurrir la evolución biológica. Algunos de estos factores constituyen el aspecto contingente de la evolución. Por ejemplo, cambios climáticos y geológicos a gran escala pueden llevar a la extinción de poblaciones o especies enteras o crear condiciones competitivas enteramente diferentes. Por otro lado, el carácter de los cambios evolutivos ocurridos previamente en la historia de un linaje puede influenciar o limitar el potencial de cambio de la especie. Este factor se conoce como la restricción filogenética del proceso evolutivo.
A la hora de analizar la evolución humana hay que considerar otro elemento: la potencialidad evolutiva adquirida con el desarrollo de un cerebro con capacidades no expresadas previamente por otro organismo en la historia del planeta. Este evento trajo aparejado el surgimiento de una evolución cultural sin antecedentes, un nuevo nivel evolutivo muy ligado al desarrollo del lenguaje articulado. Como los mecanismos darwinianos clásicos no son enteramente aplicables a éste nivel cultural, la cultura humana no puede ser analizada solamente desde la perspectiva biológica, por regirse por leyes propias, intrínsecamente distintas y cuya complejidad es irreducible a un plano biológico puro. Podemos pensar a la evolución cultural como un sistema de cambio más de tipo “lamarckiano” en donde todo lo aprendido en una generación puede ser transmitido directamente a la siguiente generación por medio de la enseñanza y de la escritura. Los caracteres adquiridos son transmitidos en la tecnología y la cultura. La evolución lamarckiana es rápida y acumulativa, es por eso que en tiempos tan pequeños – despreciables para los tiempos geológicos – nuestra tecnología nos permitió modificar nuestro entorno de manera drástica. La evolución biológica continúa en Homo sapiens pero lo hace a un ritmo nuevo, al compás de cambios impuestos (ahora además) por la cultura.
Muchas características que presenta Homo sapiens lo diferencian inclusive de las especies de primates más cercanas. La naturaleza de estos caracteres puede ser cuantitativa o cualitativa y abarcan varios niveles de complejidad: desde las diferencias genómicas, pasando por los patrones de desarrollo hasta llegar al comportamiento, las estrategias reproductivas, la estructura social, el manejo de la información y la relación de la especie con el resto de la biota. Entender como se produjeron esos cambios, como influyó el ambiente y cuales fueron las bases genéticas, de desarrollo o cognitivas que lo permitieron son preguntas fundamentales a responder por la ciencia. Disciplinas tan disímiles como la genómica comparada, la paleontología y la antropología social buscan responder partes de este dilema. El desafío último consiste en la conciliación de toda la información en una explicación completa de la evolución de nuestra especie.
A través de los trabajos prácticos del módulo de Evolución Humana se propone organizar la discusión alrededor de tres aspectos fundamentales de la evolución de nuestro linaje.
A- ¿Qué nos diferencia de otros primates? El orden Primate incluye una gran diversidad de familias y especies (Fig. 1). Durante el primer TP se abordará el estudio de ciertos aspectos característicos de otras especies de primates que constituyen el grupo al cual pertenecemos: los monos antropoideos. Asimismo, se estudiará la base biológica de nuestro parentesco con
2

los chimpancés, especie viviente más cercanamente emparentada con Homo sapiens. Este Se propone reflexionar sobre las características que han surgido en ambos linajes luego de la divergencia.
B- Registro fósil de los homínidos. Recientemente denominados homíninos, este grupo de primates fósiles bípedos que constituyen nuestro linaje se conoce a través de un nutrido registro fósil. En el segundo TP de este bloque se propone analizar el patrón que presenta dicho registro y discutir diferentes interpretaciones posibles. Se hará hincapié en el estudio de aquellos caracteres que evolucionaron a lo largo del linaje y las particularidades de los distintos grupos de homíninos, con el objetivo de inferir los procesos evolutivos subyacentes a dicho patrón.
C- Evolución de Homo sapiens modernos. En el último TP del bloque, se propone estudiar las evidencias disponibles en la actualidad sobre cuándo y cómo surgen los humanos anatómicamente modernos, las características anatómicas que permiten reconocerlos, y los procesos evolutivos que habrían operado modelando dichos rasgos. Se estudiarán en particular los modelos que existen para explicar el surgimiento del género Homo y de nuestra especie, analizando las evidencias en las que se basan, las predicciones que elaboran y, su nivel de correlato con la evidencia de distribución geográfica y temporal.
Figura 1: Árbol filogenético que muestra relaciones de parentesco probables entre distintos grupos de primates, entre ellos, nuestra especie.
3

SEMINARIO I
ORDEN PRIMATES:
NUESTROS PARIENTES CERCANOS
Durante este TP se propone reflexionar sobre la base biológica de nuestro parentesco con el resto de las especies del Orden Primate. Se abordará el estudio de ciertos aspectos característicos del grupo de especies de primates más cercanamente emparentadas con el humano y que constituyen el grupo al cual pertenecemos: los monos antropoideos.
Se analizarán luego las características que han surgido en los linajes de chimpancés y humanos actuales luego de la divergencia desde su ancestro común. Este estudio se abordará a distintos niveles. En primer lugar, a nivel morfológico a través de los extractos de Fleagle (1999); en segundo lugar y a nivel molecular, se estudiará la expresión proteica diferencial utilizando parte del trabajo pionero de King y Wilson (1975); en tercer lugar, la expresión diferencial será estudiada a partir de los patrones de mRNA evidenciados en el trabajo de Enard et al. (2002). Por último, las diferencias a nivel de la secuencia misma de ADN serán abordadas con el paper de Clark (2003).
Lea atentamente los siguientes artículos y responda las preguntas que se detallan a continuación:
1. Fleagle, J.G. 1999. Extractos del capítulo 7: “Apes and Humans” en Primate Adaptation andEvolution. 2da. Ed. Elsevier.
1.1. ¿Cuántas especies de simios africanos viven en la actualidad? Explique el modelo evolutivo propuesto para este grupo a partir de la figura 7.13.
1.2. ¿Cuáles son las principales similitudes y diferencias entre las especies de hominoideos?
1.3. ¿Por qué considera que resulta dificultoso recuperar una filogenia robusta del grupo de los monos antropoideos? ¿Qué significa “evolución en mosaico”?
2. King & Wilson. 1975. Evolution at two levels in humans and chimpanzees. Science 188:107-116.
Responda las siguientes preguntas según el contenido de la primera página del artículo (pág. 107):
2.1. En su artículo, King y Wilson mencionan que entre humanos y chimpancés hay diferencias anatómicas, fisiológicas y comportamentales. ¿Podría especificar algunas diferencias entre humanos y chimpancés que caen dentro de las categorías de King y Wilson? ¿Estas diferencias corresponden a cambios ocurridos en el linaje de los humanos o de los chimpancés?
2.2. ¿Cuál es la conclusión general de este fragmento? Preste atención al título del trabajo: ¿Cuáles son los dos niveles de los que se habla?
4

3. Enard, W. et al. 2002. Intra- and interspecific variation in primate gene expression patterns.Science 296: 340-343.
Para una mejor comprensión del artículo de Enard, W. et al. se incluye una breve descripción sobre la construcción y uso de los microarreglos. Esta herramienta es adecuada para encarar estudios a nivel sistémico y es utilizada actualmente para estudiar interrogantes evolutivos.
Los microarreglos
En los últimos años se han secuenciado numerosos genomas completos y se han generado grandes bases de datos de secuencias transcriptas (cDNAs). Esta valiosa información ha permitido desarrollar la tecnología de microarray chips.
El microarray de DNA es un vidrio con secuencias de DNA ordenadas en muy poco espacio físico. Está divido en miles de cuadrados que albergan fragmentos de DNA de secuencia conocida. Los microarrays de cDNA se fabrican amplificando por PCR fragmentos de 600 a 2400 pares de bases a partir de clones de libraries de cDNA1. Luego, estos fragmentos doble cadena son inmovilizados en el vidrio. Los microarrays de oligonucleótidos se fabrican sintetizando in situ oligonucleótidos de DNA simple cadena de 25 bases o inmovilizando oligonucleótidos de ~70 bases que fueron sintetizados previamente. A diferencia de los microarrays de cDNA, no es necesario contar con clones de cDNA a partir de los cuales se hace la PCR, simplemente se necesita tener datos de la secuencia de los genes que se quiere ubicar en el microarray. A partir de esta secuencia se diseñan los oligonucleótidos a ubicar en el vidrio.
Uno de los usos de los microarrays es el análisis de expresión de genes. La gran cantidad de genes representados en el arreglo, nos permite hacer estudios a gran escala. La metodología consiste en extraer RNA en dos condiciones determinadas (o de dos especies distintas) y transformarlo a cDNA. Al transformar el RNA en cDNA, a este último se le acopla un fluoróforo2 diferente para cada una de las dos condiciones. Luego, se juntan en el mismo tubo los cDNAs de las dos condiciones y se hibridan en el mismo microarray (ver Figura 1) También está la posibilidad de hibridar los mRNAs de cada condición en un microarray distinto. Luego de lavar el microarray con alta rigurosidad (para asegurar un pegado específico del cDNA marcado al DNA inmovilizado en el chip), con un láser se cuantifican las intensidades de los dos fluoróforos para cada gen. Esto nos indicará cuantitativamente las diferencias en los niveles de expresión de un gen en dos condiciones o especies distintas.
Los chips son fabricados por empresas (http://www.affymetrix.com; http://www.appliedbiosystems.com; http://www.agilent.com) o son desarrollados por laboratorios en universidades o institutos (http://www.microarray.org http://bti.cornell.edu/CGEP/CGEP.html).
1 Una library de cDNA es una colección de secuencias clonadas en plásmido u otro tipo de vector. El cDNA clonado en el vector se obtuvo a partir de la retrotranscripción del mRNA de un tejido determinado. 2 Un fluoróforo es una molécula que emite fluorescencia en una determinada longitud de onda al ser excitada por luz.
5

Figura 1. Esquema de producción y uso de un microarray de cDNA.
Links de interés:
• http://www.ncbi.nlm.nih.gov/About/primer/microarrays.htmlRecuerda las bases moleculares sobre las que se construyeron y pensaron los microarrays.
• http://www.bio.davidson.edu/courses/genomics/chip/chip.htmlUna animación que permite ver claramente cómo se hace un experimento con microarrays.
3.1. ¿Por qué cree que se tomaron tres humanos y tres chimpancés para hacer este trabajo? ¿Cuáles son los riesgos de tomar sólo un individuo de orangután?
3.2. a) Los autores no mencionan en ninguna parte del artículo la edad exacta de los primates de los cuales se obtienen las muestras. Comente los problemas de comparar la expresión de genes en dos especies con distinta ontogenia y largo de vida.
b) En el trabajo de Enard et al. (2002) se usan muestras de cerebro provenientes únicamentede primates machos. En un trabajo posterior que tiene similares objetivos al de Enard et al. (Cáceres et al., 2003) se usan muestras de cerebro de humano y chimpancé de ambos sexos. ¿Cuál de las dos posibilidades le parece la más adecuada?
3.3. Figuras 1 y 2: ¿Qué indican los números sobre las ramas de los árboles? ¿Por qué comparan los autores la expresión en distintos tejidos? ¿Qué conclusión sacan los autores de los árboles?
3.4. ¿Para qué cree que se utiliza un grupo externo (orangután o macaco) para analizar diferencias de expresión entre humano y chimpancé?
3.5. Con un microarray o cualquier otra técnica que mida expresión se pueden detectar diferencias en los niveles de mRNA entre dos especies. Si el gen X muestra niveles de mRNA distintos comparando cerebro de chimpancé y humano ¿En qué parte(s) del gen X es factible que se encuentren diferencias entre las dos especies? ¿Se le ocurre otra hipótesis para explicar las diferencias en los niveles de mRNA?
Fluorophore quantification
sample 1 sample 2
6

3.6. Analice la tabla 1 ¿Qué puede concluir de estos datos?
3.7. En el ya mencionado trabajo de Cáceres et al. (ver pregunta 2), se concluye que de los genes que muestran distintos niveles de expresión en cerebro entre chimpancé y humano, el 80% presenta niveles más altos en humanos. Si se hace el mismo análisis para corazón e hígado, se ve que de los genes que muestran distintos niveles de expresión, hay aproximadamente un 50% que tiene mayor expresión en chimpancé y lógicamente el otro 50 % se encuentra “sobreexpresado” en humano. Entre los genes que se encuentran “sobreexpresados” en cerebro humano comparado con chimpancé hay muchos que se agrupan en las siguientes categorías funcionales: 1) mantenimiento y crecimiento celular, 2) metabolismo de RNA y lípidos y 3) chaperonas.
¿Puede generar alguna hipótesis evolutiva con estos datos?
Bibliografía complementaria de microarrays:
• Duggan, DJ, Bittner, M, Chen, Y, Meltzer, P, Trent, JM. Expression profiling using cDNAmicroarrays. Nat Genet. 1999 Jan;21(1 Suppl):10-4.
• Gibson, G and Muse, S. A primer of Genome Science. Pags.195-230. Sinauer Associates,Inc. 2004.
• Lipshutz RJ, Fodor SP, Gingeras TR, Lockhart DJ. High density synthetic oligonucleotide arrays.Nat Genet. 1999 Jan;21(1 Suppl):20-4.
4. Clark, A.G. 2003. Inferring Nonneutral Evolution from Human-Chimp-Mouse Orthologous GeneTrios. Science 302:1960-1963.
4.1. Para una investigación completa sobre la evolución humana a nivel genético no alcanza con conocer y mapear las diferencias genómicas entre nuestra especie y el resto de las especies de primates. ¿Qué otra información se necesita?
4.2. ¿Por qué los autores incluyen secuencias de ratón en el análisis? ¿Por qué se trabaja con genes ortólogos? ¿Cómo se comprueba la relación de ortología entre genes?
4.3. Comente los análisis realizados para poner a prueba la existencia de selección sobre los genes.
4.4. Comente los resultados en relación con las funciones de los genes analizados y los caracteres involucrados.
4.5. ¿Qué otros análisis completarían los resultados presentados en este trabajo?
4.6. En base a todo lo comentado en el TP, discuta si se puede considerar a los chimpancés como una especie con caracteres plesiomórficos con respecto a Homo sapiens.
7

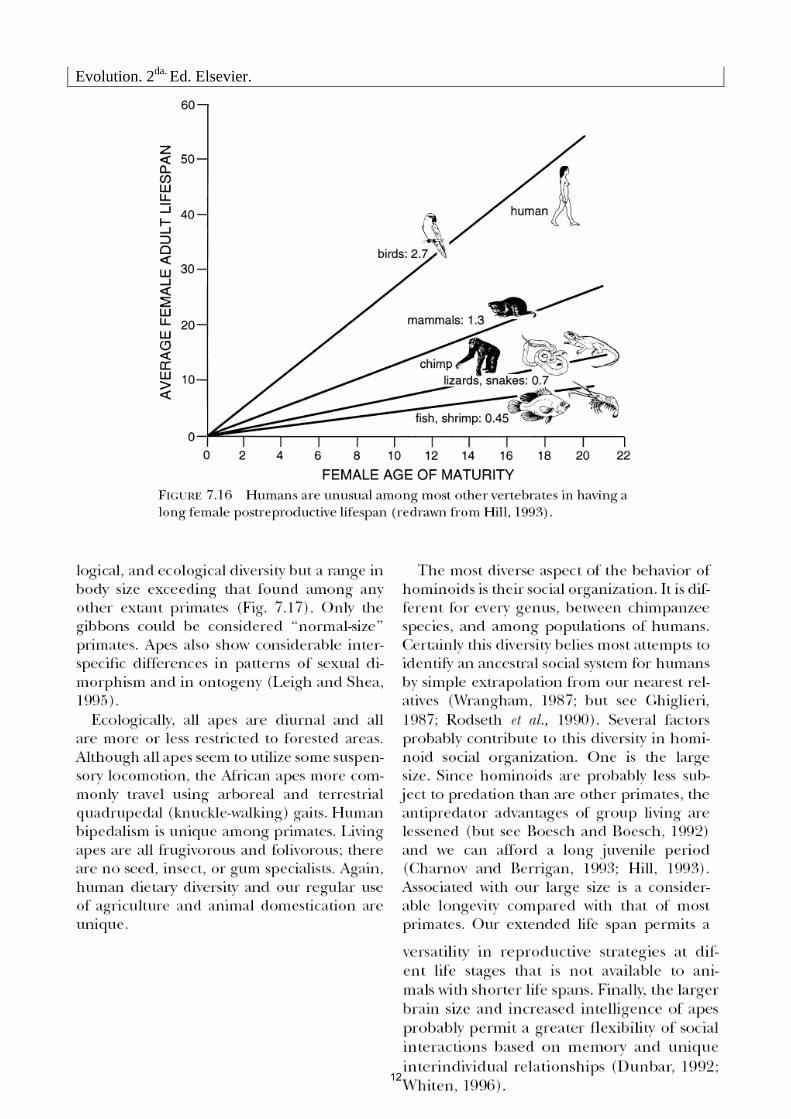
Evolution. 2da. Ed. Elsevier.
8

Evolution. 2da. Ed. Elsevier.
9

Evolution. 2da. Ed. Elsevier.
10

Evolution. 2da. Ed. Elsevier.
11
Evolution. 2da. Ed. Elsevier.
12

Fleagle, J.G. 1999. Extractos del capítulo 7: “Apes and Humans” en Primate Adaptation and Evolution. 2da. Ed. Elsevier.
13

11 April 1975, Volume 188, Number 4184
Evolution at Two LevelsHumans and Chimpanze
Their macromolecules are so alike that regulat4
evidence concerning the molecular basisof evolution at the organismal level.We suggest that evolutionary changesin anatomy and way of life are more
in often based on changes in the mecha-nisms controlling the expression ofgenes than on sequence changes in pro-
es teins. We therefore propose that regula-tory mutations account for the majorbiological differences between humans
ory and chimpanzees.
mutations may account for their biological differences.
Mary-Claire King and A. C. Wilson
Soon after the expansion of molecularbiology in the 1950's, it became evidentthat by comparing the proteins andnucleic acids of one species with thoseof another, one could hope to obtaina quantitative and objective estimateof the "genetic distance" between spe-cies. Until then, there was no commonyardstick for measuring the degree ofgenetic difference among species. Thecharacters used to distinguish amongbacterial species, for example, were en-tirely different from those used fordistinguishing among mammals. Thehope was to use molecular biology tomeasure the differences in the DNAbase sequences of various species. Thiswould be the common yardstick forstudies of organismal diversity.
During the past decade, many work-ers have participated in the develop-ment and application of biochemicalmethods for estimating genetic distance.These methods include the comparisonof proteins by electrophoretic, immuno-logical, and sequencing techniques, aswell as the comparison of nucleic acidsby annealing techniques. The only twospecies which have been compared byall of these methods are chimpanzees
Dr. King, formerly a graduate student in theDepartments of Genetics and Biochemistry,University of California, Berkeley, is now aresearch geneticist at the Hooper Foundation andDepartment of International Health, Universityof Califomnia, San Francisco 94143. Dr. Wilson isa professor of biochemistry at the University ofCalifornia, Berkeley 94720.
11 APRIL 1975
(Pan troglodytes) and humans (Homosapiens). This pair of species is alsounique because of the thoroughnesswith which they have been comparedat the organismal level-that is, at thelevel of anatomy, physiology, behavior,and ecology. A good opportunity istherefore presented for finding outwhether the molecular and organismalestimates of distance agree.The intriguing result, documented in
this article, is that all the biochemicalmethods agree in showing that the ge-netic distance between humans and thechimpanzee is probably too small toaccount for their substantial organismaldifferences.
Indications of such a paradox alreadyexisted long ago. By 1963, it appearedthat some of the blood proteins ofhumans were virtually identical inamino acid sequence with those ofapes such as the chimpanzee or gorilla(1). In the intervening years, com-parisons between humans and chimpan-zees were made with many additionalproteins and with DNA. These results,reported herein, are consistent withthe early results. Moreover, they tell usthat the genes of the human and thechimpanzee are as similar as those ofsibling species of other organisms (2).So, the paradox remains. In order toexplain how species which have suchsimilar genes can differ so substantiallyin anatomy and way of life, we review
Similarity of Human and
Chimpanzee Genes
To compare human and chimpanzeegenes, one compares either homologousproteins or nucleic acids. At the proteinlevel, one way of measuring the degreeof genetic similarity of two taxa is todetermine the average number of aminoacid differences between homologouspolypeptides from each population. Themost direct method for determining thisdifference is to compare the amino acidsequences of the homologous proteins.A second method is microcomplementfixation, which provides immunologicaldistances linearly correlated with aminoacid sequence difference. A third meth-od is electrophoresis, which is usefulin analyzing taxa sufficiently closely re-lated that they share many alleles. Forthe human-chimpanzee comparison allthree methods are appropriate, and thusmany human and chimpanzee proteinshave now been compared by eachmethod. We can therefore estimate thedegree of genetic similarity betweenhumans and chimpanzees by each ofthese techniques.
Sequence and immunological com-parisons of proteins. During the lastdecade, amino acid sequence studieshave been published on several humanand chimpanzee proteins. As Table 1indicates, the two species seem to haveidentical fibrinopeptides (3), cyto-chromes c (4), and hemoglobin chains[alpha (4), beta (4), and gamma (5,6)]. The structural genes for these pro-teins may therefore be identical in hu-mans and chimpanzees. In other cases,for example, myoglobin (7) and the
107
on
Oct
ober
13,
200
9 w
ww
.sci
ence
mag
.org
Dow
nloa
ded
from
14

Intra- and InterspecificVariation in Primate Gene
Expression PatternsWolfgang Enard,1* Philipp Khaitovich,1* Joachim Klose,2
Sebastian Zollner,1 Florian Heissig,1 Patrick Giavalisco,3
Kay Nieselt-Struwe,4 Elaine Muchmore,5,6 Ajit Varki,5
Rivka Ravid,7 Gaby M. Doxiadis,8 Ronald E. Bontrop,8
Svante Paabo1†
Although humans and their closest evolutionary relatives, the chimpanzees, are98.7% identical in their genomic DNA sequences, they differ in many mor-phological, behavioral, and cognitive aspects. The underlying genetic basis ofmany of these differences may be altered gene expression. We have comparedthe transcriptome in blood leukocytes, liver, and brain of humans, chimpanzees,orangutans, and macaques using microarrays, as well as protein expressionpatterns of humans and chimpanzees using two-dimensional gel electrophore-sis. We also studied three mouse species that are approximately as related toeach other as are humans, chimpanzees, and orangutans. We identified species-specific gene expression patterns indicating that changes in protein and geneexpression have been particularly pronounced in the human brain.
Striking differences in morphology and cog-nitive abilities exist between humans andtheir closest evolutionary relatives, the chim-panzees. At least some of these differencescan be assumed to form the basis for thecomplex and rapid cultural evolution and de-mographic explosions that have characterizedrecent human evolution (1). In addition, hu-mans and chimpanzees differ in several othertraits that are of medical interest, such assusceptibility to AIDS, epithelial neoplasms,malaria, and Alzheimer’s disease (2, 3). Al-though it was pointed out 25 years ago (4 )that many of these differences may be due toquantitative differences in gene expressionrather than structural changes in gene prod-ucts, nothing is known about how gene ex-pression profiles differ between humans andchimpanzees. In order to take a first steptoward understanding the evolution of themammalian transcriptome and proteome, westudied mRNA expression levels, as well asprotein expression patterns, in different tis-sues of humans, chimpanzees (Pan troglo-dytes), orangutans (Pongo pygmaeus), and
rhesus macaques (Macaca mulatta). Forcomparative purposes, we performed similarstudies in rodent species that have divergedfrom each other approximately as much ashumans and the great apes.
First, we compared mRNA levels in brainand liver of humans, chimpanzees, and aorangutan using Affymetrix U95A arrays (5),which contain oligonucleotides that examineapproximately 12,000 human genes. Fromthe brain, gray matter from the left prefrontallobe (Brodmann area 9) was removed at au-topsies from three adult male humans, threeadult male chimpanzees, and one adult maleorangutan. For brain and liver, two indepen-dent isolations of RNA from adjacent tissuesamples were performed for each individualand analyzed independently (5).
All possible pairwise comparisons amongthe six human, six chimpanzee, and two or-angutan samples were made for each tissue,and the differences in apparent expressionlevels were used to calculate an overall dis-tance summarized over all genes (6). For thebrain samples, the distances measured among
the duplicates from the same individual con-stituted less than 14% of the distances be-tween individuals. For the liver samples, thecorresponding value was less than 12%. Be-cause experimental variation between the tis-sue samples from the same individual wassmall, the averages of the pairwise distancesmeasured between the duplicates for eachtissue sample were used to estimate a treedepicting the overall differences in gene ex-pression measured between individuals. Theresults (Fig. 1A) show that the variation ingene expression between individuals withinthe species is substantial, relative to the dif-ferences between humans and chimpanzee.For example, one human brain sample differsmore from the other human samples than thelatter differ from the chimpanzee samples.However, for both the brain and liver sam-ples, the humans, as well as the chimpanzees,fall into two mutually exclusive groups whentheir gene expression patterns are related tothat seen in the orangutan, which is evolu-tionarily further removed from humans andchimpanzees than these are from each other.When statistically tested by a bootstrap ap-proach, this observation is supported in bothliver and brain (7 ). Thus, a number of geneexpression differences between humans andchimpanzees are shared among all individu-als analyzed from each species. The amountof gene expression differences shared amongall humans is larger than those shared amongall chimpanzees. One likely factor contribut-ing to this is that oligonucleotides comple-mentary to human cDNAs are used to assayRNA levels not only in humans but also inchimpanzees and orangutans. Thus, nucleo-tide sequence differences between the last-named species and humans can be expectedto reduce the apparent expression levels mea-sured in the apes. Such differences will beassigned to the human lineage. However, theapparent acceleration on the human lineage islarger in the brain (3.8-fold) than in the liver(1.7-fold), raising the possibility that geneexpression patterns may have changed morein the brain than in the liver during recenthuman evolution.
To investigate the latter possibility, weperformed a second set of experiments usingmembrane-based cDNA arrays carrying
1Max-Planck-Institute for Evolutionary Anthropology,Inselstrasse 22, D-04103 Leipzig, Germany. 2Institutfuer Humangenetik Charite, D-13353 Berlin, Germa-ny. 3Max-Planck-Institute for Molecular Genetics,D-14195 Berlin, Germany. 4Max-Planck-Institute ofBiophysical Chemistry, D-37077 Gottingen, Germany.5University of California San Diego, La Jolla, CA92093, USA. 6VA Medical Center, San Diego, La Jolla,CA 92093, USA. 7The Netherlands Brain Bank, Am-sterdam, the Netherlands. 8Biomedical Primate Re-search Centre, Rijswijk, the Netherlands.
*These authors contributed equally to this work.†To whom correspondence should be addressed. E-mail: [email protected]
Table 1. Brain protein pattern differences between humans and chimpanzees as analyzed by 2D gelelectrophoresis (16). Differences between humans and chimpanzees were scored if confirmed in threeindividual human-chimpanzee pairs and were analyzed in the same way as in a larger mouse studycomparing M. musculus and M. spretus (23). Qualitative differences represent changes in electrophoreticmobility of spots, which likely result from amino acid substitutions, whereas quantitative differencesreflect changes in the amount of protein.
Comparison Analyzed spotsDifferences
Qualitative Quantitative
Human–chimpanzee 538 41 (7.6%) 169 (31.4%)M. musculus–M. spretus 8767 668 (7.6%) 656 (7.5%)
R E P O R T S
12 APRIL 2002 VOL 296 SCIENCE www.sciencemag.org34015

21,504 DNA sequences of an average lengthof ;1,000 bp, amplified from 17,997 humangenes of the Unigene set (8). When such longtarget sequences are used, the average nucle-otide sequence difference of around 0.8%between human and chimpanzee cDNAs (9)is not expected to influence the results signif-icantly. For these experiments, brain neocor-tex samples from the autopsies of seven hu-mans, four chimpanzees and two macaqueswere used, as well as liver samples from sixhumans, five chimpanzees, and four ma-caques. In addition, blood samples were col-lected from 10 humans, 10 chimpanzees, and10 rhesus macaques. To allow the same filterarrays to be used throughout the experiments,equal amounts of RNA from a given speciesand tissue were pooled, labeled, and hybrid-ized to the cDNA arrays (10).
The relative rates of evolutionary changein the transcriptomes of the three tissues wereestimated (11), using the macaque as an out-group (Fig. 2). For both blood leukocytes andliver, the human expression patterns are moresimilar to those of the chimpanzees than tothose of the macaques, reflecting the evolu-tionary relationships of the species. Further-more, the extent of change on the lineagesleading to the chimpanzees and the humansare equal in leukocytes and 1.3-fold differentin liver. In stark contrast, the expression pat-tern in the chimpanzee brain cortex is moresimilar to that of the macaques than to that of
humans. This is due to a 5.5-fold accelerationof the rate of change in gene expressionlevels on the lineage leading to humans.Thus, the results show that the rate of evolu-tionary change of gene expression levels inthe brain is accelerated in the human evolu-tionary lineage relative to the chimpanzee,whereas no such acceleration is evident inliver or blood. It should be noted, however,that the extent of the acceleration is highlydependent on the metric used.
To gauge whether the observations madeamong the primate species are typical ofmammals, we investigated the three mousespecies, Mus spretus, M. caroli, and M. mus-culus, among which the former two speciesdiffer from M. musculus at silent sites, i.e., atsites that do not change the encoded aminoacids, by approximately 2.5% and 4.5%, re-spectively (12). Thus, their extent of diver-gence from M. musculus is in the same orderof magnitude as that of chimpanzees (1.08%)and orangutans (2.98%), respectively, fromhumans (13, 14 ). Affymetrix arrays carryingoligonucleotides specific for 12,000 M. mus-culus genes (5) were used to analyze samplesfrom the frontal part of the brains and liversfrom three individuals of M. musculus, threeindividuals of M. spretus, and one individualof M. caroli. To make the experiments ascomparable as possible to the analysis of thehumans and apes, outbred mice were used,and only gray matter was sampled from the
frontal cortex. As in the primates, the geneexpression patterns within species show greatvariation (Fig. 1B), as recently reported evenfor inbred mice (15). However, when themore distantly related M. caroli is taken intoaccount, it is clear that all M. musculus andM. spretus individuals share gene expressionpatterns that separate them from the otherspecies, as is the case for humans and chim-panzees. When these species-specific differ-ences are compared, it is found that thechange on the line to M. musculus is 2.1-foldand 2.3-fold that in brain and liver, respec-tively. Thus, as in the case of the primateanalyses, the species for which the oligonu-cleotide array was designed shows an appar-ent acceleration, which is likely to be due tonucleotide sequence differences between thespecies analyzed. However, in the rodents,this acceleration is of similar magnitude inbrain and liver, and as expected from theslightly higher genomic divergence, it isslightly higher than that seen in primate liver.Thus, these results show that gene expressiondifferences are substantial between closelyrelated mammalian species and supports thenotion that changes in gene expression levelsin the brain may have been especially pro-
Fig. 1. Distance trees representing the relative extent of expression changes in brain and liveramong (A) three primate and (B) three mouse species: MUS., M. musculus; SPR., M. spretus; andCAR, M. caroli (6). Numbers refer to the ratio between the changes common to humans andchimpanzees, and M. musculus and M. spretus, respectively.
Fig. 2. Distance trees representing the relativeextent of expression changes among three pri-mate species and three tissues as assayed bythe cDNA arrays (11). Numbers refer to theratio between the changes common to humansand chimpanzees.
R E P O R T S
www.sciencemag.org SCIENCE VOL 296 12 APRIL 2002 34116

nounced during recent human evolution.Differences in mRNA levels do not nec-
essarily translate into differences in proteinlevels. Therefore, we investigated whetherquantitative changes not only in RNA lev-els but also in protein levels are especiallypronounced in the brain during recent hu-man evolution. We studied protein patternsin the brains of humans and chimpanzees,as well as in M. musculus and M. spretus toput the primate differences into perspective(16 ). In each case, the tissue samples wereremoved from sites adjacent to the onesused in the first set of mRNA analyses fromthe same individuals. Soluble proteins wereisolated by differential centrifugation, sep-arated on two-dimensional (2D) polyacryl-amide gels, and visualized by silver stain-ing (Fig. 3). Two types of differences werescored: (i) shifts in the migration positionsof proteins, which represent a shift in sizeor charge of the protein, i.e., covalent dif-ference that in most cases are changes inamino acid sequence; (ii) differences inquantity of proteins without a shift in mi-gration position which represent differenc-es in amounts of protein expressed in thetissue. The relative amounts of qualitativeprotein differences observed between hu-mans and chimpanzees and between M.musculus and M. spretus, respectively, aresimilar (Table 1), as expected from thesimilar extent of genomic DNA sequencedifferences between the two species pairs.
For the two rodents, the relative amounts ofquantitative protein differences are similarto the qualitative differences. In contrast,quantitative differences are approximately6 times as common as qualitative differenc-es when chimpanzee and human brains arecompared. Thus, the human brain has prob-ably experienced more evolutionary chang-es in gene expression both at the mRNAand protein levels than the two mouse spe-cies. In this regard, a recent comparison ofhuman and great ape blood plasma proteins(17 ) found only one human-specific differ-ence. This is in contrast to the many differ-ences found here for soluble brain proteinsand supports a more rapid rate of evolutionof protein expression levels in the brain.
Our results show that that large numbersof quantitative changes in gene expressioncan be detected between closely related mam-mals. They furthermore suggest that suchchanges have been particularly pronouncedduring recent evolution of the human brain.The underlying reasons for such expressiondifferences are likely to be manifold, for ex-ample, duplications and deletions of genes,promotor changes, changes in levels of tran-scription factors, and changes in cellularcomposition of tissues. A challenge for thefuture is to investigate the relative contribu-tions of these factors to the expression differ-ences observed. A further challenge is toclarify how many of the differences havefunctional consequences.
References and Notes1. G. Klein, The Human Career: Human Biological and
Cultural Origins ( The Univ. of Chicago Press, Chicago,1989).
2. P. Gagneux, A. Varki, Mol. Phylogenet. Evol. 18, 2(2001).
3. A. Varki, Genome Res. 10, 1065 (2000).4. M. C. King, A. C. Wilson, Science 188, 107 (1975).5. All apes used in this study died of natural causes. In
all cases, postmortem times were shorter than 6hours, and only minimal RNA degradation was seenby agarose electrophoresis. Preparation of the sam-ples for the Affymetrix arrays, hybridization, andscanning were performed as described (18). Nine of10 genes that differed at least twofold betweenhuman and chimpanzee brains could be verified by aNorthern analysis. Details of experimental proce-dures are available on Science Online at www.sciencemag.org/cgi/content/full/296/5566/340/DC1and on http://email.eva.mpg.de/;khaitovi/supplement1.html.
6. Affymetrix array results were carried out with Mi-croarray Suite, version 4.0 (Affymetrix) by using de-fault settings. All arrays were normalized to the sametarget intensity using all probe sets. The difference inscaling factor was less than threefold among allarrays. In order to build distance trees, pairwise dis-tances between samples were calculated as the sumof the base-two logarithms of the absolute values ofthe “fold change” for all 12,000 genes represented ona chip. When “absent calls” were assigned to bothsamples in a comparison, and when the differencecall for the gene was “no change,” the fold changevalue was set to zero. The resulting distance matrixwas used to build neighbor joining trees (19) asimplemented in the PHYLIP package (20). The fulldata set is available at http://email.eva.mpg.de/;khaitovi/supplement1.html
7. The reliability of the distance trees branching patternwas estimated by 1000 bootstrap samples of the12,000 genes. The bootstrap values for the specieswere .99.9% in all cases except for the chimpanzeebrain branch, where in the remaining 16% of cases,the orangutan fell among the chimpanzees. There
Fig. 3. Two-dimensional gel electrophoresis of proteins from the cyto-solic fraction of human (A) and chimpanzee (B) cortex frontalis. From thetotal pattern, comprising about 8500 protein spots, a representativesection consisting of about 200 spots is shown. Protein patterns fromhuman and chimpanzee were compared, and changes between homolo-gous spots found in all three human-chimpanzee pairs were scored. Threedifferent types of variations were registered: (i) variations in electro-phoretic mobility of spots (7), most likely due to mutations affectingthe structure of proteins (e.g., amino acid substitutions); (ii) variations inspot intensity (1 or2) reflecting alterations in protein amount, possiblydue to mutations in regulatory genes; and (iii) presence or absencevariations (1 or 2), which may also result from quantitative
changes. For each type of variation, a few examples are indicated. Fromidentification by mass spectrometry in both humans and chimpanzees,these proteins spots are 1, aldose reductase (gi576365); 4, carbonicdehydratase (gi4502517); 5, electron transfer flavoprotein(gi2781202); 6, hypothetical protein DKFZp564D1378 (gi14149777);10, d-aminolevulinate dehydratase (gi2118316); 11, CGI-105 protein(gi11431155); 13, hypothetical protein XP_047816 (gi14743583); 14,malate dehydrogenase 2 (gi5174541); 15, MAWD-binding protein(gi16307296); 16, uncharacterized hypothalamus protein HCDASE(gi8923864); 30, purine nucleoside phosphorylase (gi4557801); 31,purine nucleoside phosphorylase (gi4557801); and 35, aldehyde reduc-tase (gi1633300).
R E P O R T S
12 APRIL 2002 VOL 296 SCIENCE www.sciencemag.org34217

was 100% bootstrap support for the separation ofthe mouse species in both tissues.
8. M. S. Boguski, G. D. Schuler, Nature Genet. 10, 369(1995).
9. I. Hellmann, unpublished data.10. All RNA pools were hybridized 4 to 6 times to the
same set of filters in order to estimate interexperi-mental errors and to minimize their effectsthrough the combined analysis of several experi-ments. Signals that were at least 5 times abovebackground and not influenced to more than 25%by neighboring spots were further analyzed. A genewas regarded as differently expressed if it fulfilledtwo criteria: (i) The difference in signal betweentwo species was at least two-fold; and (ii) thesignal between the two species was significantlydifferent as determined by a paired t test. Sixteendifferently expressed genes were analyzed byNorthern blots, and 1 out of 12 that were detectedby the Northern analyses yielded results contra-dictory to the arrays, whereas the remaining 11showed expression patterns that were both quali-tatively and quantitatively similar in all three spe-cies to that detected by the arrays. Details ofexperimental procedures are available on ScienceOnline at www.sciencemag.org/cgi/content/full/296/5566/340/DC1and on http://email.eva.mpg.de/;khaitovi/supplement1.html.
11. The distance between two expression profiles of twospecies in a given tissue was determined by summingup the absolute ratios of the included genes given by
the formula: Oi 5 1
n
log2 O x ij
xik, where n is the number
of included genes, and is the normalized intensity ofgene i as measured in species j. In order to avoid thecontribution of genomic differences, only those differ-ently expressed genes were considered that did notshow the same expression difference in two or moretissues. The resulting distance matrix was used to buildneighbor joining trees (19) as implemented in thePHYLIP package (20). The data are available at http://email.eva.mpg.de/;khaitovi/supplement1.html
12. We retrieved nonmitochondrial nucleotide sequencesfrom M. spretus (10 sequences) and M. caroli (11sequences) from GenBank and compared them withthe corresponding M. musculus sequence. The aver-age number of substitutions at silent sites was esti-mated to be 0.025 (6 0.006) for M. spretus and0.045 (6 0.008) for M. caroli.
13. F. C. Chen, W. H. Li, Am. J. Hum. Genet. 68, 444 (2001).14. A. Fujiyama et al., Science 295, 131 (2002).15. C. C. Pritchard, L. Hsu, J. Delrow, P. S. Nelson, Proc.
Natl. Acad. Sci. U.S.A. 98, 13266 (2001).16. Fractionation, 2D gel electrophoresis, and matrix-
assisted laser desorption time-of-flight (MALDI-TOF) mass spectrometry were done as described in(21–23).
17. P. Gagneux et al., Am. J. Phys. Anthropol. 115, 99(2001).
18. L. Wodicka, H. Dong, M. Mittmann, M. H. Ho, D. J.Lockhart, Nature Biotechnol. 15, 1359 (1997).
19. N. Saitou, M. Nei, Mol. Biol. Evol. 4, 406 (1987).20. J. Felsenstein, PHYLIP (Phylogeny Inference Package,
version 3.5c; Department of Genetics, Univ. of Wash-ington, Seattle (1993).
21. J. Klose, Methods Mol. Biol. 112, 67 (1999).22. iiii , Methods Mol. Biol. 112, 147 (1999).23. iiii et al., Nature Genet. 30, 385 (2002); pub-
lished online 25 March 2000 (10.1038/ng 861).24. We thank C. Allen and T. Insel of the Yerkes Primate
Center, Atlanta, for chimpanzee tissues; T. Arendt and U.Uberham of the Paul Flechsig Institute, Leipzig, for hu-man and mouse tissue dissections; E. Kuhn at the Bio-medical Primate Research Centre, Rijswijk, for autopsies;H. Zischler and K. Matz-Rensing from the German Pri-mate Center, Gottingen, for macaque samples; C. Wit-tekind and U. Gutz from the University of Leipzig for liverresections; E. Edel from the University of Leipzig forhuman blood samples; F. Bonhomme and A. Orth of theUniversite Montpellier II for the mouse tissues; J. Retiefat Affymetrix for help and support; K. Chowdhury fromthe Max-Planck-Institute of Biophysical Chemistry, Got-
tingen, and K. Krohn and Petra Suptitz from the Inter-disziplinares Zentrum fur Klinische Forschung (IZKF),Leipzig, for the help with microarray experiments; T.Kitano for analyzing the mouse divergence; D. Kuhl forinitial advice in the project; and many people at MaxPlanck Institute for Evolutionary Anthropology for stim-
ulating discussions. We also thank the Bundesministe-rium fur Bildung und Forschung, the Saxonium Ministryfor Science, and the Max Planck Gesellschaft for financialsupport.
14 December 2001; accepted 27 February 2002
A MADS-Box Gene Necessaryfor Fruit Ripening at the
Tomato Ripening-Inhibitor (Rin)Locus
Julia Vrebalov,1,2 Diane Ruezinsky,2
Veeraragavan Padmanabhan,2 Ruth White,1,2 Diana Medrano,1,2
Rachel Drake,3 Wolfgang Schuch,3 Jim Giovannoni1*
Tomato plants harboring the ripening-inhibitor (rin) mutation yield fruits that failto ripen. Additionally, rin plants display enlarged sepals and loss of inflorescencedeterminacy. Positional cloning of the rin locus revealed two tandem MADS-boxgenes (LeMADS-RIN and LeMADS-MC), whose expression patterns suggested rolesin fruit ripening and sepal development, respectively. The rin mutation altersexpression of both genes. Gene repression and mutant complementation demon-strate that LeMADS-RIN regulates ripening, whereas LeMADS-MC affects sepaldevelopment and inflorescence determinacy. LeMADS-RIN demonstrates anagriculturally important function of plant MADS-box genes and provides mo-lecular insight into nonhormonal (developmental) regulation of ripening.
The maturation and ripening of fleshy fruitsis a developmental process unique to plantsand affects the quality and nutritional contentof a significant portion of the human diet.Although specific fruit-ripening characteris-tics vary among species, ripening can be gen-erally described as the coordinated manifes-tation of changes in color, texture, flavor,aroma, and nutritional characteristics thatrender fruit attractive to organisms receivingsustenance in exchange for assisting in seeddispersal (1, 2).
Fruit species are classically defined as oneof two ripening types, climacteric and non-climacteric, where the former display a burstin respiration at the onset of ripening, incontrast to the latter. Climacteric fruit typi-cally increase biosynthesis of the gaseoushormone ethylene, which is required for theripening of fruit such as tomatos, bananas,apples, pears, and most stone fruit. Noncli-macteric fruit, including strawberries, grapes,and citrus fruits, do not require climacteric
respiration or increased ethylene for matura-tion. Molecular ripening research has focusedprimarily on ethylene, but little is known ofcontrol before ethylene induction, nor ofcommon regulatory mechanisms shared byclimacteric and nonclimacteric species (3).
The tomato is a model for analysis ofripening due originally to its significance asa food source and diverse germplasm, andmore recently, the availability of moleculartools (4 ) and efficient transformation (5). Anumber of tomato-ripening mutants havebeen useful for research and breeding (3).Especially interesting is the recessive rip-ening-inhibitor (rin) mutation that inhibitsall measured ripening phenomena, includ-ing the respiratory climacteric and associ-ated ethylene evolution, pro-vitamin Acarotenoid accumulation, softening, andproduction of flavor compounds (6 ). Therin mutant exhibits ethylene sensitivity, in-cluding the seedling triple response (7 ),floral abscission, and petal and leaf senes-cence. Nevertheless, rin fruit do not ripenin response to exogenous ethylene, yet theydisplay induction of at least some ethylene-responsive genes, indicating retention offruit ethylene sensitivity (8). We interpretthese results to mean that the RIN gene en-codes a genetic regulatory component neces-sary to trigger climacteric respiration and rip-ening-related ethylene biosynthesis in addi-tion to requisite factors whose regulation is
1U.S. Department of Agriculture–Agricultural Re-search Service (USDA-ARS) Plant, Soil and NutritionLab and Boyce Thompson Institute for Plant Research,Cornell University, Ithaca, NY 14853, USA. 2TexasA&M University, Department of Horticultural Scienc-es, College Station, TX 77843, USA. 3Zeneca PlantSciences (Syngenta), Jeallots Hill Research Station,Bracknell, Berkshire RG12 6EY, UK.
*To whom correspondence should be addressed. E-mail: [email protected]
R E P O R T S
www.sciencemag.org SCIENCE VOL 296 12 APRIL 2002 34318
and LED 8 (541 observed, 456 expected, P �0.0006)—providing evidence in plants for a linkbetween genome organization and gene regulation.
Together these data provide an organ ex-pression map, revealing putative localized hor-mone-response domains and a complex patternof regulatory genes that could mediate primarydevelopmental cues. These data should helpidentify candidate genes involved in patternformation and cell specificity in the root, whichis a model for organogenesis. The expressionmap will also facilitate both computational andexperimental methods aimed at decoding regu-latory mechanisms in the root. Thus, these re-sults can now be used to explore how thehundreds of different expression patterns theyreveal are established and interpreted at thecellular level to generate a complex organ.
References and Notes1. N. M. Kerk, T. Ceserani, S. L. Tausta, I. M. Sussex, T. M.Nelson, Plant Physiol. 132, 27 (2003).
2. T. Asano et al., Plant J. 32, 401 (2002).
3. D. Milioni, P. E. Sado, N. J. Stacey, K. Roberts, M. C.McCann, Plant Cell 14, 2813 (2002).
4. P. J. Roy, J. M. Stuart, J. Lund, S. K. Kim, Nature 418, 975(2002).
5. H. Jasper et al., Dev. Cell 3, 511 (2002).6. P. N. Benfey, J. W. Schiefelbein, Trends Genet. 10, 84(1994).
7. Materials and methods are available as supportingmaterial on Science Online.
8. J. Sheen, Plant Physiol. 127, 1466 (2001).9. J. Quackenbush, Nature Rev. Genet. 2, 418 (2001).10. The program Cluster was used in the analysis and down-
loaded from http://rana.lbl.gov/EisenSoftware.htm.11. M. B. Eisen, P. T. Spellman, P. O. Brown, D. Botstein,
Proc. Natl. Acad. Sci. U.S.A. 95, 14863 (1998).12. K. Birnbaum et al., unpublished data.13. T. Berleth, J.Mattsson,Curr. Opin. Plant Biol.3, 406 (2000).14. U. Wittstock, B. A. Halkier, Trends Plant Sci. 7, 263 (2002).15. L. L. Murdock, R. E. Shade, J. Agric. Food Chem. 50,
6605 (2002).16. B. A. Cohen, R. D. Mitra, J. D. Hughes, G. M. Church,
Nature Genet. 26, 183 (2000).17. H. Caron et al., Science 291, 1289 (2001).18. A. P. Mahonen et al., Genes Dev. 14, 2938 (2000).19. M. Bonke, S. Thitamadee, A. P. Mahonen, M. T.
Hauser, Y. Helariutta, Nature, in press.20. J. W. Wysocka-Diller, Y. Helariutta, H. Fukaki, J. E.
Malamy, P. N. Benfey, Development 127, 595 (2000).21. The plant line was generated by the Haseloff labora-
tory (www.plantsci.cam.ac.uk/Haseloff/Home.html).The lines were obtained through the Arabidopsis In-formation Resource (www.arabidopsis.org/).
22. Y. Lin, J. Schiefelbein, Development 128, 3697 (2001).23. M. M. Lee, J. Schiefelbein, Cell 99, 473 (1999).24. E. Truernit, N. Sauer, Planta 196, 564 (1995).25. We thank J. Malamy for valuable ideas on the proto-
plasting technique; H. Petri, K. Gordon, and J. Hirst forassistance in cell sorting; H. Dressman and the DukeMicroarray Core Facility for assistance with microar-rays; A. Pekka Mahonen and Y. Helariutta for use ofthe pWOL::GFP line and M. Cilia and D. Jackson forthe pSUC2::GFP line, both before publication; M.Levesque for valuable discussions; and G. Sena and T.Nawy for photos. This work was supported by NSFgrants MCB-020975 (P.N.B. and D.E.S.), DBI-9813360(D.W.G.), DBI-0211857 (D.W.G.), and a Small Grantfor Exploratory Research (P.N.B. and D.E.S.). The NIHsupported K.B. with a postdoctoral fellowship grant(5 F32 GM20716-03).
Supporting Online Materialwww.sciencemag.org/cgi/content/full/302/5652/1956/DC1Materials and MethodsFigs. S1 to S3Tables S1 to S4
4 August 2003; accepted 15 October 2003
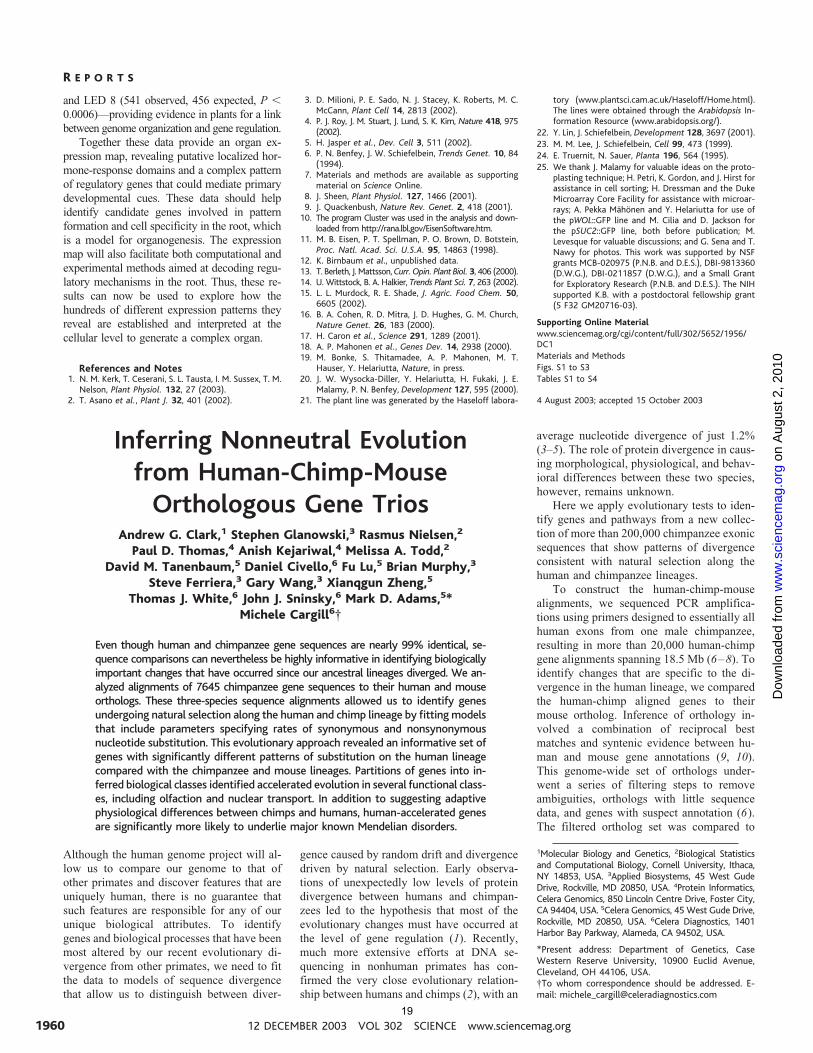
Inferring Nonneutral Evolutionfrom Human-Chimp-MouseOrthologous Gene Trios
Andrew G. Clark,1 Stephen Glanowski,3 Rasmus Nielsen,2
Paul D. Thomas,4 Anish Kejariwal,4 Melissa A. Todd,2
David M. Tanenbaum,5 Daniel Civello,6 Fu Lu,5 Brian Murphy,3
Steve Ferriera,3 Gary Wang,3 Xianqgun Zheng,5
Thomas J. White,6 John J. Sninsky,6 Mark D. Adams,5*Michele Cargill6†
Even though human and chimpanzee gene sequences are nearly 99% identical, se-quence comparisons can nevertheless be highly informative in identifying biologicallyimportant changes that have occurred since our ancestral lineages diverged. We an-alyzed alignments of 7645 chimpanzee gene sequences to their human and mouseorthologs. These three-species sequence alignments allowed us to identify genesundergoing natural selection along the human and chimp lineage by fittingmodelsthat include parameters specifying rates of synonymous and nonsynonymousnucleotide substitution. This evolutionary approach revealed an informative set ofgenes with significantly different patterns of substitution on the human lineagecompared with the chimpanzee and mouse lineages. Partitions of genes into in-ferred biological classes identified accelerated evolution in several functional class-es, including olfaction and nuclear transport. In addition to suggesting adaptivephysiological differences between chimps and humans, human-accelerated genesare significantly more likely to underlie major known Mendelian disorders.
Although the human genome project will al-low us to compare our genome to that ofother primates and discover features that areuniquely human, there is no guarantee thatsuch features are responsible for any of ourunique biological attributes. To identifygenes and biological processes that have beenmost altered by our recent evolutionary di-vergence from other primates, we need to fitthe data to models of sequence divergencethat allow us to distinguish between diver-
gence caused by random drift and divergencedriven by natural selection. Early observa-tions of unexpectedly low levels of proteindivergence between humans and chimpan-zees led to the hypothesis that most of theevolutionary changes must have occurred atthe level of gene regulation (1). Recently,much more extensive efforts at DNA se-quencing in nonhuman primates has con-firmed the very close evolutionary relation-ship between humans and chimps (2), with an
average nucleotide divergence of just 1.2%(3–5). The role of protein divergence in caus-ing morphological, physiological, and behav-ioral differences between these two species,however, remains unknown.
Here we apply evolutionary tests to iden-tify genes and pathways from a new collec-tion of more than 200,000 chimpanzee exonicsequences that show patterns of divergenceconsistent with natural selection along thehuman and chimpanzee lineages.
To construct the human-chimp-mousealignments, we sequenced PCR amplifica-tions using primers designed to essentially allhuman exons from one male chimpanzee,resulting in more than 20,000 human-chimpgene alignments spanning 18.5 Mb (6–8). Toidentify changes that are specific to the di-vergence in the human lineage, we comparedthe human-chimp aligned genes to theirmouse ortholog. Inference of orthology in-volved a combination of reciprocal bestmatches and syntenic evidence between hu-man and mouse gene annotations (9, 10).This genome-wide set of orthologs under-went a series of filtering steps to removeambiguities, orthologs with little sequencedata, and genes with suspect annotation (6).The filtered ortholog set was compared to
1Molecular Biology and Genetics, 2Biological Statisticsand Computational Biology, Cornell University, Ithaca,NY 14853, USA. 3Applied Biosystems, 45 West GudeDrive, Rockville, MD 20850, USA. 4Protein Informatics,Celera Genomics, 850 Lincoln Centre Drive, Foster City,CA 94404, USA. 5Celera Genomics, 45West Gude Drive,Rockville, MD 20850, USA. 6Celera Diagnostics, 1401Harbor Bay Parkway, Alameda, CA 94502, USA.
*Present address: Department of Genetics, CaseWestern Reserve University, 10900 Euclid Avenue,Cleveland, OH 44106, USA.†To whom correspondence should be addressed. E-mail: [email protected]
R E P O R T S
12 DECEMBER 2003 VOL 302 SCIENCE www.sciencemag.org1960
on
Aug
ust 2
, 201
0 w
ww
.sci
ence
mag
.org
Dow
nloa
ded
from
19

other public sets and found to be highlyconsistent (11) (table S1). We used the mostconservative set of 7645 genes for which wehad the highest confidence in orthology andsequence annotation (12) (Database S1).
To identify genes that have undergoneadaptive protein evolution, we applied twoformal statistical tests that fit models of mo-lecular evolution at the codon level. Bothtests fit models of the nucleotide-substitutionprocess by maximum likelihood (ML) (13),and both include parameters specifying ratesof synonymous and nonsynonymous substi-tution (14– 16). In the first (Model 1), weperformed a classic test of the null hypothesisof dN/dS � 1 in the human lineage (17, 18).The second model is a modification of themethod described by Yang and Nielsen (16),which allows variation in the dN/dS ratioamong lineages and among sites at the sametime. In this method (Model 2), a likelihoodratio test of the hypothesis of no positiveselection is performed by comparing the like-lihood values for two hypotheses. Under thenull hypothesis, it is assumed that all sites areeither neutral (dN/dS �1) or evolve undernegative selection (dN/dS � 1). Under thealternative hypothesis, some of the sites areallowed to evolve with dN � dS in the humanlineage only (Fig. 1). We refer to this asModel 2, and to the P-value of neutrality asP2 (6). The test based on Model 2 is not asconservative as the test based on Model 1 andmay tend to detect genes with acceleratedamino acid substitution rates in humans evenif the average dN/dS rate is not larger than 1.
There were 1547 human genes and 1534chimp genes, which met the criteria for positiveselection (with dN/dS �1). The neutral null hy-pothesis of Model 1 was rejected for 72 genes(0.94% of the tests) at P � 0.001, 414 genes(5.4%) at P � 0.01, and 1216 genes (15.9%) atP � 0.05 (12). There were six human genes forwhich the neutral null hypothesis of Model 1was rejected at P � 0.05 and dN/dS was greaterthan 1 (12). The neutral null hypothesis of Model2 was rejected for 28 genes (0.38%) at P2 �0.001, 178 genes (2.3%) at P2 � 0.01, and 667genes (8.7%) at P2 � 0.05. The relatively lowoverlap of these sets reflects the different natureof the tests. Of the 1547 human genes that ex-hibited dN/dS � 1, only 125 also fell into theclass of 178 human genes with a P2 � 0.01.Similarly, Model 2 can detect cases where aprotein has a domain undergoing positive selec-tion, but the overall dN/dS may not be elevated,and thus would be missed by Model 1. For thisreason, the remainder of the analysis considersonly the Model 2 test results.
Before attempting any biological inferencefrom the results of the statistical tests, it is im-portant to consider whether attributes like GCcontent, repeat density, local recombination rate,and segmental duplications might affect the ratesand patterns of substitution (19, 20). In principle,
the ML estimation procedure corrects for varia-tion in base composition; however, if the truesubstitution rate differs across the genome in amanner that is correlated with GC content, thenwe should be able to detect this by simple cor-relation (6, 12) (Database S2). The synonymoussubstitution rate was significantly correlatedwith the following attributes: GC content (0.164,P � 0.0001), local recombination rate in cM/Mb(21) (0.100, P � 0.001), and LINE (long inter-spersed nuclear element) density (�0.091, P �0.0001). None of these factors was significantlycorrelated with either nonsynonymous substitu-tion rate or P2-value; however, genes associatedwith some biological processes, such as olfac-tion, do show nonrandom associations withgenomic location [P � 10�4, Kolmogorov-Smirnov (K-S) test] and GC content (P � 10�9,K-S test). We also verified that segmental dupli-cations were not responsible for distortions in thepatterns of substitution seen in our tests, mostlybecause genes with close duplicates were under-represented in our set because of the requirementfor strict human-mouse orthology. Interestingly,the genes with P2-values �0.05 are overrepre-sented in the Online Mendelian Inheritance inMan (OMIM) catalog of genes associated withgenetic disease (P � 0.009), demonstrating therelevance of interspecific comparisons (ftp.ncbi.nih.gov/repository/OMIM/morbidmap).
Many of the 7645 genes have been classifiedinto inferred functional categories based on the
Panther classification system (6, 22). We asked,for the subset of genes in each functional cate-gory, whether the distribution of P2 values forthose genes differed significantly from the P2
distribution for the full set of 7645 genes (6)(tables S2 and S3). In this way, we can gaininsight into higher-order biological processesand molecular functions that may be under se-lective pressure in a given lineage (Tables 1 and2). The statistical tests of significance are validas formal inferences, and these lead immediatelyto tentative biological hypotheses, only some ofwhich we describe here.
In the human lineage, genes involved inolfaction show a significant tendency to beunder positive selection (PMW � 0.005) (Ta-ble 1 and Fig. 2). Nearly all the genes clas-sified to olfaction are olfactory receptors(ORs). It seems likely that the different life-styles of chimps and humans might have ledto divergent selection pressure on these re-ceptors. There has been a rapid accelerationof pseudogene formation in human ORs (23),and the acceleration of apparent amino acidsubstitution in pseudogenes could potentiallylead to a spurious inference of selection.However, we verified that most of the ORgenes in our set are bona fide genes (http://bioinformatics.weizmann.ac.il/HORDE/), in-dicating that these genes are either undergo-ing positive selection or are in the process ofpseudogenization (24).
Fig. 1. Graphical rep-resentation of the testof positive selection(Model 2). The null hy-pothesis (H0) assumesall three brancheshave two classes ofamino acid residues:those that are neutrally evolving (p1: dN � dS) and those that are under constraint (p0: dN/dS�1). The alternative hypothesis (Ha) allows the human lineage to have a subset of sites (ps)with accelerated amino acid substitution (dN � dS).
Fig. 2. P2-value distributionsof selected groups of genes.The plot shows the cumula-tive fraction of selected bio-logical processes showingthe excess of cases of signif-icant positive selection ingenes for olfaction, aminoacid catabolism, andMende-lian disease genes (OMIM)relative to the overall distri-bution of genes. The distri-bution of developmentalgenes that do not show asignificant excess is shownfor comparison.
R E P O R T S
www.sciencemag.org SCIENCE VOL 302 12 DECEMBER 2003 1961
on
Aug
ust 2
, 201
0 w
ww
.sci
ence
mag
.org
Dow
nloa
ded
from
20

Several other classes of genes (amino acidcatabolism, developmental processes, reproduc-tion, neurogenesis, and hearing) show manygenes with low P2 values, although these classesdo not show significant PMW values or containfewer than 20 genes (table S1 and Fig. 2). It ispossible that individual genes within these cate-gories account disproportionately for specific
phenotypic effects. For example, 7 (GSTZ1,HGD, PAH, ALDH6A1, BCKDHA, PCCB, andHAL) of the 16 genes in the amino acid catab-olism category have P2 values less than 0.05. Aspeculative suggestion is that this signal of pos-itive selection may arise from different dietaryhabits or pressures in the two lineages. For ex-ample, branched-chain amino acid catabolism,
which involves the ALDH6A1, BCKDHA, andPCCB genes, is the primary pathway for energyproduction from muscle protein under starvationconditions (25). For all seven genes, mutationshave been found that result in human metabolicdisorders, consistent with the idea that naturalselection shifted these genes in a manner that isrelevant to reproductive fitness.
Most of the human developmental geneswith low P2 values fall into two main cate-gories: skeletal development (TLL2, ALPL,BMP4, SDC2, MMP20, and MGP) and neu-rogenesis (NLGN3, SEMA3B, PLXNC1,NTF3, WNT2, WIF1, EPHB6, NEUROG1,and SIM2). In addition, several of the geneswith low P2 values are homeotic transcriptionfactor genes (CDX4, HOXA5, HOXD4,MEOX2, POU2F3, MIXL1, and PHTF),which play key roles in early development.Several genes associated with pregnancy,such as the progesterone receptor (PGR),GNRHR, MTNR1A, and PAPPA, appear toexhibit nonneutral divergence between hu-mans and chimps. PGR is involved not onlyin maintenance of the uterus, but is alsoexpressed on the cell membrane of sperm,where it may play a role in the acrosomereaction (26), so the physiological basis forthe adaptive evolution remains unclear.
Speech is considered to be a defining char-acteristic of humans. The forkhead-box P2 tran-scription factor (P2 � 0.0027) has been impli-cated in speech development, and has previouslybeen identified as undergoing an unusual hu-man-specific pattern of substitution (27). Severalgenes involved in the development of hearingalso appear to have undergone adaptive evolu-tion in the human lineage, and we speculate thatunderstanding spoken language may have re-quired tuning of hearing acuity. The gene withthe most significant pattern of human-specificpositive selection is alpha tectorin, whose proteinproduct plays a vital role in the tectorial mem-brane of the inner ear. Single–amino acid poly-morphisms are associated with familial high-frequency hearing loss (28), and knockout miceare deaf. These results strongly motivate a de-tailed assessment of the nature of hearing differ-ences between humans and chimpanzees. Othergenes involved in hearing that appear to be underhuman-specific selection include DIAPH1,FOXI1, EYA4, EYA1, and OTOR.
The inference of lineage-specific evolution-ary acceleration requires a phylogenetic tree. Bysimply adding mouse to our alignments, we wentfrom a directionless pairwise comparison of hu-man and chimp to having reasonable ability toinfer common ancestral state, and lineage-specif-ic changes. These approaches will gain in bothstatistical and biological power as additional pri-mate or other mammalian genomes are se-quenced, enabling identification of genes thatexhibited accelerated amino acid substitutionsince our most recent common ancestor. Al-though it is tempting to conclude that this will
Table 1. Biological processes showing the strongest evidence for positive selection. The top panel includesthe categories showing the greatest acceleration in human lineage, and the bottom panel includescategories with the greatest acceleration in the chimp lineage.
Biological processNumber ofgenes*
PMW (human/Model 2)*
PMW (chimp/Model 2)*
Categories showing the greatest acceleration in human lineageOlfaction 48 0 0.9184Sensory perception 146 (98) 0 (0.026) 0.9691 (0.9079)Cell surface receptor–mediated signal transduction 505 (464) 0 (0.0386) 0.199 (0.0864)Chemosensory perception 54 (6) 0 (0.1157) 0.9365 (0.7289)Nuclear transport 26 0.0003 0.2001G-protein–mediated signaling 252 (211) 0.0003 (0.1205) 0.2526 (0.0773)Signal transduction 1030 (989) 0.0004 (0.0255) 0.0276 (0.0092)Cell adhesion 132 0.0136 0.3718Ion transport 237 0.0247 0.8025Intracellular protein traffic 278 0.0257 0.8099Transport 391 0.0326 0.7199Metabolism of cyclic nucleotides 20 0.0408 0.1324Amino acid metabolism 78 0.0454 0.0075Cation transport 179 0.0458 0.8486Developmental processes 542 0.0493 0.2322Hearing 21 0.0494 0.9634
Categories with the greatest acceleration in the chimp lineage
Signal transduction 1030 (989) 0.0004 (0.0255) 0.0276 (0.0092)Amino acid metabolism 78 0.0454 0.0075Amino acid transport 23 0.1015 0.0102Cell proliferation and differentiation 82 0.3116 0.0182Cell structure 174 0.2633 0.0233Oncogenesis 201 0.3132 0.0267Cell structure and motility 239 0.2208 0.0299Purine metabolism 35 0.9127 0.0423Skeletal development 44 0.2876 0.0438Mesoderm development 168 0.5813 0.0439Other oncogenesis 39 0.2777 0.0469DNA repair 49 0.9363 0.0477
*The number of genes and the PMW values excluding olfactory receptor genes are shown in parentheses.
Table 2. Molecular functions showing the strongest evidence for positive selection. The table includesonly human-accelerated categories, because the only categories accelerated in the chimp lineage arechaperones (P � 0.0124), cell adhesion molecules (P � 0.0220), and extracellular matrix (P � 0.0333).
Molecular functionNumber ofgenes*
PMW (human/Model 2)*
PMW (chimp/Model 2)*
G protein coupled receptor 199 (153) 0 (0.2533) 0.8689 (0.6776)G protein modulator 62 0.0008 0.3776Receptor 448 0.0030 0.9798Ion channel 134 0.0043 0.8993Extracellular matrix 97 (95) 0.0120 (0.0178) 0.1482 (0.1593)Other G protein modulator 32 0.0149 0.4441Extracellular matrix glycoprotein 44 (42) 0.0178 (0.0269) 0.1579 (0.1765)Voltage-gated ion channel 62 0.0219 0.6692Other hydrolase 95 0.0260 0.4823Oxygenase 46 0.0303 0.4792Protein kinase receptor 37 0.0314 0.6911Transporter 214 0.0338 0.1836Ligand-gated ion channel 45 0.0405 0.9503Microtubule binding motor protein 22 0.0421 0.6385Microtubule family cytoskeletal protein 54 0.0467 0.2815
*The number of genes and the PMW values excluding olfactory receptor genes are shown in parentheses.
R E P O R T S
12 DECEMBER 2003 VOL 302 SCIENCE www.sciencemag.org1962
on
Aug
ust 2
, 201
0 w
ww
.sci
ence
mag
.org
Dow
nloa
ded
from
21

constitute a list of genes that “make us human,”one has to take a step back to see the gulf thatexists between understanding at this narrowlyfocused molecular level and at the organismallevel. A large number of human genes, whentransformed into mutant yeast or Drosophila,can rescue the mutant phenotype, but this doesnot make these genetically modified organismsany more human. This study has focused only onprotein-coding genes, and it will require exami-nation of regulatory sequences to determine thecontribution of regulation of gene expression tothe evolutionary divergence between humansand chimps.
Perhaps the best way to understand the rela-tion between DNA sequence divergence and thedifferences between human and chimpanzeephysiology and morphology is to compare thesedifferences to the variability among humans.Human-chimp DNA sequence divergence isroughly 10 times the divergence between ran-dom pairs of humans. Contrasts that are underway to place human polymorphism in the con-text of human-specific divergence further em-power these models to identify molecular targetsof natural selection. Evolutionary analysis willbe extended to include comparison of the Xchromosome and autosomes, the impact of localrecombination rates and GC content, codon-us-age patterns, and divergence in regulatory se-quences. Additional insight will be gained byexamining sequence divergence in the context ofgene-expression differences. The informative-ness of all these approaches will increase byinclusion of additional mammalian genome se-quences, and realization of the goal to ascribefunctional significance to the complex landscapeof our own genome will most effectively bemade in the context of our close relatives.
References and Notes1. M. C. King, A. C. Wilson, Science 188, 107 (1975).2. Y. Satta, J. Klein, B. Takahata, Mol. Phylogenet. Evol.
14, 259 (2000).3. F. C. Chen, W.-H. Li, Am. J. Hum. Genet. 68, 444(2001).
4. I. Ebersberger, D. Metzler, C. Schwarz, S. Paabo, Am. J.Hum. Genet. 70, 1490 (2002).
5. R. Sakate et al., Genome Res. 13, 1022 (2003).6. Detailed materials and methods are available as sup-porting material on Science Online.
7. A total of 201,805 primer pairs were successfully designedto 23,363 human coding sequences (27.6 Mb).
8. Primer pairs were amplified in 39 female humanindividuals (19 African-Americans, 20 Caucasians)and 1 male chimpanzee (4X0033, Southwest Nation-al Primate Research Center) by a standard PCR andsequencing protocols. Trimmed chimp sequenceswere BLASTed against human exon sequence (9) tocreate virtual transcripts.
9. J. C. Venter et al., Science 291, 1304 (2001).10. R. J. Mural et al., Science 296, 1661 (2002).11. Mouse-human orthologs were downloaded from Na-
tional Center for Biotechnology Information (NCBI)HomoloGene; NCBI Homol_seq_pairs; NCBI Homol-ogy Map; and Mouse Genome Database, Mouse Ge-nome Informatics Web Site, The Jackson Laboratory(Bar Harbor, ME).
12. All 7645 alignments in Phylip format (13) and aflatfile of genes and their associated statistics areavailable at http://panther.celera.com/appleraHCM_alignments/index.jsp. Sequences have been deposited
in GenBank under accession codes AY398769-AY421703.
13. J. Felsenstein, J. Mol. Evol. 17, 368 (1981).14. N. Goldman, Z. Yang, Mol. Biol. Evol. 11, 725
(1994).15. S. V. Muse, B. S. Gaut, Mol. Biol. Evol. 11, 715 (1994).16. Z. Yang, R. Nielsen, Mol. Biol. Evol. 19, 908 (2002).17. Z. Yang, R. Nielsen, J. Mol. Evol. 46, 409 (1998).18. Z. Yang, R. Nielsen, Mol. Biol. Evol. 17, 32 (2000).19. I. Hellmann et al., Genome Res. 13, 831 (2003).20. J. A. Bailey et al., Science 297, 1003 (2002).21. A. Kong et al., Nature Genet. 31, 241 (2003).22. P. D. Thomas et al., Nucleic Acids Res. 31, 334 (2003).23. Y. Gilad, O. Man, S. Paabo, D. Lancet, Proc. Natl.
Acad. Sci. U.S.A. 100, 3324 (2003).24. Y. Gilad, C. D. Bustamante, D. Lancet, S. Paabo, Am. J.
Hum. Genet. 73, 489 (2003).25. H. R. Freund, M. Hanani, Nutrition 18, 287 (2002).26. S. Gadkar et al., Biol. Reprod. 67, 1327 (2003).27. W. Enard et al., Nature 418, 869 (2002).
28. S. Naz et al., J. Med. Genet. 40, 360 (2003).29. The data in this paper were obtained from more
than 18 million sequencing reads obtained fromthe Celera Genomics sequencing center in Rock-ville, MD. We thank J. Duff, C. Gire, M. A. Rydland,C. Forbes, and B. Small for development and main-tenance of software systems, laboratory informa-tion management systems, and analysis programs.S. Hannenhalli and S. Levy provided particularlyhelpful discussions. C. Aquadro, B. Lazzaro, K. Mon-tooth, T. Schlenke, and P. Wittkopp provided help-ful comments on the manuscript.
Supporting Online Materialwww.sciencemag.org/cgi/content/full/302/5652/1960/DC1Materials and MethodsTables S1 to S3Databases S1 and S2
7 July 2003; accepted 24 October 2003
The Proteasome of Mycobacteriumtuberculosis Is Required forResistance to Nitric Oxide
K. Heran Darwin,1 Sabine Ehrt,1 Jose-Carlos Gutierrez-Ramos,2
Nadine Weich,2 Carl F. Nathan1,3*
The production of nitric oxide and other reactive nitrogen intermediates(RNI) by macrophages helps to control infection by Mycobacterium tuber-culosis (Mtb). However, the protection is imperfect and infection persists.To identify genes that Mtb requires to resist RNI, we screened 10,100 Mtbtransposon mutants for hypersusceptibility to acidified nitrite. We found 12mutants with insertions in seven genes representing six pathways, includingthe repair of DNA (uvrB) and the synthesis of a flavin cofactor ( fbiC). Fivemutants had insertions in proteasome-associated genes. An Mtb mutantdeficient in a presumptive proteasomal adenosine triphosphatase was at-tenuated in mice, and exposure to proteasomal protease inhibitors markedlysensitized wild-typeMtb to RNI. Thus, the mycobacterial proteasome servesas a defense against oxidative or nitrosative stress.
Mtb persistently infects about two billionpeople. The identification of pathways usedby the microbe to resist elimination by thehost immune response may suggest newtargets for prevention or treatment of tuber-culosis. During latent infection, the primaryresidence of Mtb is the macrophage. Theantimicrobial arsenal of the activated mac-rophage includes inducible nitric oxidesynthase (iNOS or NOS2) (1). At the acidicpH (�5.5) prevalent in the phagosome ofactivated macrophages (2), nitrite, a majoroxidation product of NO, is partially pro-tonated to nitrous acid, which dismutates toform NO and another radical, �NO2 (3).
Thus, mildly acidified nitrite is a physio-logic antimicrobial system. RNI may inflictnot only nitrosative but also oxidative in-jury, such as when NO combines with su-peroxide from bacterial metabolism to gen-erate peroxynitrite (4 ). Reagent NO killsMtb with a molar potency exceeding that ofmost antituberculosis drugs (5, 6 ). In hu-mans and mice with tuberculosis, macro-phages in infected tissues and airways ex-press enzymatically active iNOS (7–9), andmice lacking iNOS cannot control Mtb in-fection (10). Despite the protective effects ofRNI, a small number of viable mycobacteriausually persist for the lifetime of the infectedhost (11) and sometimes resume growth.
To identify Mtb genes required for re-sistance against RNI, we screened 10,100transposon mutants individually for in-creased sensitivity to nitrite at pH 5.5 [sup-porting online material (SOM text)].Twelve mutants were hypersensitive. Toquantify their phenotype, bacteria were ex-posed to pH 5.5 with or without 3 mM
1Department of Microbiology and Immunology, WeillMedical College of Cornell University, New York, NY10021, USA. 2Millennium Pharmaceuticals, 75 SidneyStreet, Cambridge, MA 02139, USA. 3Programs inImmunology and Molecular Biology, Weill GraduateSchool of Medical Sciences of Cornell University, NewYork, NY 10021, USA.
*To whom correspondence should be addressed. E-mail: [email protected]
R E P O R T S
www.sciencemag.org SCIENCE VOL 302 12 DECEMBER 2003 1963
on
Aug
ust 2
, 201
0 w
ww
.sci
ence
mag
.org
Dow
nloa
ded
from
22

SEMINARIO II
PATRONES EVOLUTIVOS: INTERPRETACIONES DEL
REGISTRO FÓSIL
INTRODUCCIÓN GENERAL
Los orígenes de la humanidad es uno de los temas de la investigación científica que despierta más pasiones y debates. Muchas hipótesis e ideas que eran aceptadas con entusiasmo en el pasado han pasado al olvido y otras han surgido a medida que la evidencia se acumula y las técnicas paleoantropológicas se refinan. Pero las interpretaciones de los fósiles distan mucho de ser absolutamente objetivas. Las teorías sobre la evolución humana no sólo intentan enmarcar la evidencia en un contexto lógico basado en las evidencias disponibles, sino que también nos brindan información valiosa sobre el pensamiento de la época en que fueron formuladas.
Temas- El registro fósil de los homínidos. Patrones y criterios de interpretación.- Herramientas para un análisis comparado: elementos de morfología cráneo-facial- Historia de las teorías y miradas sobre la evolución humana.- Las evidencias de evolución humana como patrón macroevolutivo.- Lenguaje y pensamiento simbólico en relación a la evidencia paleontológica.
Tradicionalmente, las inferencias sobre el grado de parentesco existente entre el hombre moderno y sus parientes cercanos (monos y simios) y fósiles (homíninos) se han basado en el análisis morfológico a nivel osteológico. Los huesos, en particular los huesos del cráneo, poseen asociado un alto potencial de fosilización por lo que constituyen la mayoría de los restos del registro fósil conocido sobre nuestro linaje.
Observe con detenimiento el siguiente esquema sintético de morfología cráneo-facial comparativo e intente reconocer las estructuras óseas en los ejemplares que se hallarán a su disposición en el TP.
23

Por otra parte, los restos líticos confeccionados y utilizados por los homininos también poseen un alto potencial de conservación asociado. El patrón de distribución geográfico, su tipología y su variabilidad son rasgos característicos de este registro arqueológico, los cuales se analizan en conjunto con los rasgos morfológicas presentes en los restos óseos. De manera muy general, se reconocen en el linaje homínido una serie de “industrias” líticas o “complejos tecno-culturales” diferentes asociadas a distintas especies. Si bien cada uno de estos complejos es identificado a través de ciertos componentes diagnósticos, los mismos incluyen una serie variable de utensilios en cuanto a la forma, el tamaño y la materia prima utilizada. En la figura a continuación se esquematiza la secuencia de pasos generales que implica el proceso de tallado en roca para la obtención de utensilios:
24

Los utensilios más antiguos conocidos datan de aproximadamente 2,6 millones de años (MA) y se hallaron asociados a los primeros restos óseos asignados al género Homo, en África. Se trata de cantos rodados tallados en uno o dos planos de manera tal que se genera un filo y se los denomina choppers o chopping tools. En general, estas primeras herramientas de roca se agrupan dentro de una “industria” llamada olduvaiense:
Recién hacia los 1,7 MA aparece en África una innovación a nivel de la talla de las materias primas seleccionadas por los homininos. Se trata de los bifaces, pieza diagnóstica que llevó a la delimitación de una nueva “industria” lítica, la “industria” acheulense. Estas piezas poseen un tamaño variable y se caracterizan porque el canto rodado se halla tallado en ambas caras:
Los bifaces se encuentran en el registro arqueológico durante un periodo muy extendido al igual que en una vasta extensión geográfica (hasta en Europa y Asia), por lo tanto se las asocia a distintas especies de homininos.
A medida que nos acercamos al millón de años de antigüedad, el nutrido registro arqueológico permitió la definición de secuencias temporales de muchas industrias, muy diversas, por lo general con especificidad regional.
Desde comienzos del Paleolítico Superior, hacia los 40.000 años AP, se observa una aceleración de la evolución de las técnicas de subsistencia conjuntamente con la emergencia del pensamiento simbólico (evidenciado por las múltiples expresiones de arte). Una innovación característica a nivel de la talla de las rocas es la talla de tipo microlaminar que permite obtener un gran rendimiento de utensilios a partir de una cantidad reducida de materia prima. Por otra parte, se registra el uso intensivo del hueso como materia prima para la talla. Todas estas “industrias” se asocian a la especie Homo sapiens. Se ejemplifican a continuación algunas de esas piezas:
25

ACTIVIDADES A REALIZAR:
Su grupo dispondrá de información sobre distintos fósiles de homínidos y patrones paleoambientales y temporales de distribución. A partir de dicha información y de los elementos descritos anteriormente:
1. Desarrolle una hipótesis evolutiva y confeccione un esquema de relaciones entre losespecímenes y el hombre.
2. Especifique el número de especies que quedan conformadas y las características elegidascomo claves evolutivas y criterios de agrupamiento.
3. Actividad Complementaria: lectura y discusión de las siguientes preguntas:
- Tattersall, I. 2005. Once we were not alone. Scientific American 25-32.
3.1. ¿Cuál es la edad de los fósiles más antiguos pertenecientes al género Australopithecus? ¿Y del género Homo?
3.2. ¿Qué planteaba la hipótesis de especie única? ¿Qué factores contribuían al mantenimiento de esta línea de pensamiento?
3.3. ¿Cómo afectaron los descubrimientos efectuados a partir de 1970 a la concepción que se tenía del modo de evolución del linaje humano? ¿Cómo es ahora el panorama atribuible a la diversidad de homínidos hace 1.8 millones de años?
3.4. ¿Qué rol se le atribuye a Neandertal (y a las poblaciones asiáticas de H. erectus) en una visión lineal de la evolución? ¿Qué propone la teoría arbustiva?
3.5. ¿Qué propone Tattersall acerca de los neandertales? ¿Qué diferencias se observan en la coexistencia ocurrida entre H. sapiens y H. neanderthalensis entre Medio Oriente y Europa? ¿Qué propone el autor acerca del resultado de esas interacciones?
3.6. En octubre de 2004 se describió a una nueva especie de homínido: Homo floresiensis. Esta especie existió hasta hace 13.000 años en una isla del sudeste asiático. ¿Cómo repercute este descubrimiento en el modelo sostenido por Tattersal?
3.7. ¿Cuál habría sido según Tattersall la característica clave del éxito de H. sapiens y cómo se habría establecido? ¿Cómo se aplican en este caso los conceptos de exaptación y de emergencia?
3.8. ¿Cómo interpreta Tattersall el hecho que los patrones de comportamiento moderno de los humanos, que denotan la existencia de pensamiento simbólico, se establecieron mucho tiempo después que las características anatómicas típicas de H. sapiens?
26

BIBLIOGRAFÍA COMPLEMENTARIA
• Domínguez-Rodrigo, M. 2002. Hunting and scavenging by early humans: The state of debate. Journal ofWorld Prehistory 16:1-54.
• Foley, R. 1993. Causes and Consequences in Human Evolution. J. Roy. Anthrop. Inst. 1:67-86.
• Stiner, M. C. 2002. Carnivory, coevolution and the geographic spread of the genus Homo. Journal ofArchaeological Research 10: 31-68.
• Klein, R.G. 2003. Whither the Neanderthals? Science 229:1525-1527.
• McBrearty, S.; Brooks, A.S. 2000. The revolution that wasn’t: a new interpretation of the origin of modernhuman behavior. J Hum Evol 39:453-563.
• d'Errico, F. 2003. The invisible frontier. A multiple species model for the origin of behavioral modernity.Evolutionary Anthropology 12 (4):188-202.
27

25 S C I E N T I F I C A M E R I C A N E X C L U S I V E O N L I N E I S S U E A U G U S T 2 0 0 5
ONCE we
SHARING A SINGLE LANDSCAPE, four kinds of hominids lived about 1.8 million years ago in what is now part of northern Kenya.Although paleoanthropologists have no idea how—or if—these different species interacted, they do know that Paranthropus boisei, Homo rudolfensis, H. habilis and H. ergaster foraged in the same area around Lake Turkana.
TODAY WE TAKE FOR GRANTED THAT HOMO SAPIENS
FOUR MILLION YEARS MANY HOMINID SPECIES
EMERGENCEoriginally published in 2003
COPYRIGHT 2005 SCIENTIFIC AMERICAN, INC.
28

were not alone
IS THE ONLY HOMINID ON EARTH. YET FOR AT LEAST
SHARED THE PLANET. WHAT MAKES US DIFFERENT?
By Ian Tattersall • Paintings by Jay H. Matternes
26 S C I E N T I F I C A M E R I C A N E X C L U S I V E O N L I N E I S S U E A U G U S T 2 0 0 5COPYRIGHT 2005 SCIENTIFIC AMERICAN, INC.
29

for the past 25,000 years or so, free andclear of competition from other mem-bers of the hominid family. This periodhas evidently been long enough for us tohave developed a profound feeling thatbeing alone in the world is an entirelynatural and appropriate state of affairs.
So natural and appropriate, indeed,that during the 1950s and 1960s aschool of thought emerged that claimed,in essence, that only one species of hom-inid could have existed at a time becausethere was simply no ecological space onthe planet for more than one culture-bearing species. The “single-species hy-pothesis” was never very convincing—
even in terms of the rather sparse homi-nid fossil record of 40 years ago. But theimplicit scenario of the slow, single-minded transformation of the bent andbenighted ancestral hominid into thegraceful and gifted modern H. sapiensproved powerfully seductive—as fablesof frogs becoming princes always are.
So seductive that it was only in thelate 1970s, following the discovery of in-controvertible fossil evidence that hom-inid species coexisted some 1.8 million
years ago in what is now northern Kenya,that the single-species hypothesis wasabandoned. Yet even then, paleoanthro-pologists continued to cleave to a ratherminimalist interpretation of the fossilrecord. Their tendency was to downplaythe number of species and to group to-gether distinctively different fossils un-der single, uninformative epithets suchas “archaic Homo sapiens.” As a result,they tended to lose sight of the fact thatmany kinds of hominids had regularlycontrived to coexist.
Although the minimalist tendencypersists, recent discoveries and fossilreappraisals make clear that the biolog-ical history of hominids resembles thatof most other successful animal families.It is marked by diversity rather than bylinear progression. Despite this rich his-tory—during which hominid species de-veloped and lived together and compet-ed and rose and fell—H. sapiens ulti-mately emerged as the sole hominid. Thereasons for this are generally unknow-able, but different interactions betweenthe last coexisting hominids—H. sapiensand H. neanderthalensis—in two dis-
tinct geographical regions offer some in-triguing insights.
A Suite of Species FROM THE BEGINNING, almost fromthe very moment the earliest hominidbiped—the first “australopith”—madeits initial hesitant steps away from theforest depths, we have evidence for hom-inid diversity. The oldest-known poten-tial hominid is Sahelanthropus tchaden-sis, represented by a cranium from thecentral-western country of Chad [see il-lustration on page 26]. Better known isAustralopithecus anamensis, from sitesin northern Kenya that are about 4.2million years old.
A. anamensis looks reassuringly simi-lar to the 3.8- to 3.0-million-year-oldAustralopithecus afarensis, a small-brained, big-faced bipedal species towhich the famous “Lucy” belonged.Many remnants of A. afarensis havebeen found in various eastern Africansites, but some researchers have suggest-ed that the mass of fossils described as A.afarensis may contain more than onespecies, and it is only a matter of time
Homo sapiens has had the earth to itself
HOMO RUDOLFENSISwas a relativelylarge-brainedhominid, typified bythe famous KNM-ER1470 cranium. Itsskull was distinctfrom the apparentlysmaller-brained H.habilis, but its bodyproportions areeffectively unknown.
PARANTHROPUS BOISEIhad massive jaws,equipped with hugegrinding teeth for apresumed vegetariandiet. Its skull isaccordingly stronglybuilt, but it is notknown if in body size itwas significantly largerthan the “gracile”australopiths.
27 S C I E N T I F I C A M E R I C A N E X C L U S I V E O N L I N E I S S U E A U G U S T 2 0 0 5COPYRIGHT 2005 SCIENTIFIC AMERICAN, INC.
30

until the subject is raised again. In anyevent, A. afarensis was not alone inAfrica. A distinctive jaw, from an aus-tralopith named A. bahrelghazali, wasfound in 1995 in Chad. It is probablybetween 3.5 and 3.0 million years oldand is thus roughly coeval with Lucy, asis the recently named new form Kenyan-thropus platyops.
In southern Africa, scientists reportedevidence in 1999 of another primitivebipedal hominid species. As yet un-named and undescribed, this distinctiveform is 3.3 million years old. At aboutthree million years ago, the same regionbegins to yield fossils of A. africanus, thefirst australopith to be discovered (in1924). This species may have persisteduntil not much more than two millionyears ago. A 2.5-million-year-old speciesfrom Ethiopia, named Australopithecusgarhi in 1999, is claimed to fall in an in-termediate position between A. afaren-sis, on the one hand, and a larger groupthat includes more recent australopithsand Homo, on the other. Almost exact-ly the same age is the first representativeof the “robust” group of australopiths,Paranthropus aethiopicus. This earlyform is best known from the 2.5-mil-lion-year-old “Black Skull” of northernKenya, and in the period between about2 and 1.4 million years ago the robustswere represented all over eastern Africaby the familiar P. boisei. In South Africa,during the period around 1.6 millionyears ago, the robusts included the dis-
tinctive P. robustus and possibly a close-ly related second species, P. crassidens.
I apologize for inflicting this long listof names on readers, but in fact it actu-ally underestimates the number of aus-tralopith species that existed. What ismore, scientists don’t know how longeach of these creatures lasted. Neverthe-less, even if average species longevitywas only a few hundred thousand years,it is clear that from the very beginningthe continent of Africa was at least pe-riodically—and most likely continual-ly—host to multiple kinds of hominids.
The appearance of the genus Homodid nothing to perturb this pattern. The2.5- to 1.8-million-year-old fossils fromeastern and southern Africa that an-nounce the earliest appearance of Homoare an oddly assorted lot and probably alot more diverse than their conventionalassignment to the two species H. habilisand H. rudolfensis indicates. Still, atKenya’s East Turkana, in the period be-tween 1.9 and 1.8 million years ago,these two species were joined not onlyby the ubiquitous P. boisei but by H. er-gaster, the first hominid of essentiallymodern body form. Here, then, is evi-dence for four hominid species sharingnot just the same continent but the samelandscape [see illustration on previouspage and below].
The first exodus of hominids fromAfrica, presumably in the form of H. er-gaster or a close relative, opened a vastprospect for further diversification. One
could wish for a better record of thismovement, and particularly of its dat-ing, but there are indications that hom-inids of some kind had reached Chinaand Java by about 1.8 million years ago.A lower jaw that may be about the sameage from Dmanisi in ex-Soviet Georgiais different from anything else yet found[see “Out of Africa Again ... and Again?”by Ian Tattersall; SCIENTIFIC AMERICAN,April 1997]. By the million-year markH. erectus was established in both Javaand China, and it is possible that a morerobust hominid species was present inJava as well. At the other end of theEurasian continent, the oldest-knownEuropean hominid fragments—fromabout 800,000 years ago—are highlydistinctive and have been dubbed H. an-tecessor by their Spanish discoverers.
About 600,000 years ago, in Africa,we begin to pick up evidence for H. hei-delbergensis, a species also seen at sitesin Europe—and possibly China—be-tween 500,000 to 200,000 years ago. Aswe learn more about H. heidelbergensis,we are likely to find that more than onespecies is actually represented in thisgroup of fossils. In Europe, H. heidel-bergensis or a relative gave rise to an en-demic group of hominids whose best-known representative was H. nean-derthalensis, a European and westernAsian species that flourished betweenabout 200,000 and 30,000 years ago.The sparse record from Africa suggeststhat at this time independent develop-
HOMO HABILIS(“handy man”) wasso named because itwas thought to be themaker of the 1.8-million-year-oldstone toolsdiscovered at OlduvaiGorge in Tanzania.This hominidfashioned sharpflakes by banging one rock cobbleagainst another.
HOMO ERGASTER,sometimes called “AfricanH. erectus,” had a high,rounded cranium and askeleton broadly similarto that of modernhumans. Although H.ergaster clearly ate meat,its chewing teeth arerelatively small. The bestspecimen of this hominidis that of an adolescentfrom about 1.6 millionyears ago known asTurkana boy.
28 S C I E N T I F I C A M E R I C A N E X C L U S I V E O N L I N E I S S U E A U G U S T 2 0 0 5COPYRIGHT 2005 SCIENTIFIC AMERICAN, INC.
31

ments were taking place there, too—in-cluding the emergence of H. sapiens.And in Java, possible H. erectus fossilsfrom Ngandong were dated to around40,000 years ago, implying that this areahad its own indigenous hominid evolu-tionary history for perhaps millions ofyears as well.
The picture of hominid evolution justsketched is a far cry from the “Australo-pithecus africanus begat Homo erectusbegat Homo sapiens” scenario that pre-vailed 40 years ago—and it is, of course,based to a great extent on fossils thathave been discovered since that time.Yet the dead hand of linear thinking stilllies heavily on paleoanthropology, andeven today quite a few of my colleagueswould argue that this scenario overesti-mates diversity. There are various waysof simplifying the picture, most of them
involving the cop-out of stuffing all vari-ants of Homo of the past half a millionor even two million years into the speciesH. sapiens.
My own view, in contrast, is that the20 or so hominid species invoked (if notnamed) above represent a minimum es-timate. Not only is the human fossilrecord as we know it full of largely un-acknowledged morphological indica-tions of diversity, but it would be rash toclaim that every hominid species thatever existed is represented in one fossilcollection or another. And even if onlythe latter is true, it is still clear that thestory of human evolution has not beenone of a lone hero’s linear struggle.
Instead it has been the story of na-ture’s tinkering: of repeated evolution-ary experiments. Our biological historyhas been one of sporadic events rather
than gradual accretions. Over the pastfive million years, new hominid specieshave regularly emerged, competed, co-existed, colonized new environmentsand succeeded—or failed. We have onlythe dimmest of perceptions of how thisdramatic history of innovation and in-teraction unfolded, but it is already evi-dent that our species, far from being thepinnacle of the hominid evolutionarytree, is simply one more of its many ter-minal twigs.
The Roots of Our Solitude ALTHOUGH THIS is all true, H. sapi-ens embodies something that is undeni-ably unusual and is neatly captured bythe fact that we are alone in the worldtoday. Whatever that something is, it isrelated to how we interact with the ex-ternal world: it is behavioral, which
29 S C I E N T I F I C A M E R I C A N E X C L U S I V E O N L I N E I S S U E A U G U S T 2 0 0 5
TUC D’AUDOUBERT CAVE in France was entered sometime between perhaps11,000 and 13,000 years ago by H. sapiens, also called Cro Magnons, whosculpted small clay bison in a recess almost a mile underground.
COPYRIGHT 2005 SCIENTIFIC AMERICAN, INC.
32

means that we have to look to our ar-chaeological record to find evidence ofit. This record begins some 2.5 millionyears ago with the production of the firstrecognizable stone tools: simple sharpflakes chipped from parent “cores.” Wedon’t know exactly who the inventorwas, but chances are that he or she wassomething we might call an australopith.
This landmark innovation represent-ed a major cognitive leap and had pro-found long-term consequences for hom-inids. It also inaugurated a pattern ofhighly intermittent technological change.It was a full million years before the nextsignificant technological innovationcame along: the creation about 1.5 mil-lion years ago, probably by H. ergaster,of the hand ax. These symmetrical im-plements, shaped from large stone cores,were the first tools to conform to a “men-tal template” that existed in the tool-maker’s mind. This template remainedessentially unchanged for another mil-lion years or more, until the invention of“prepared-core” tools by H. heidelber-gensis or a relative. Here a stone core waselaborately shaped in such a way that asingle blow would detach what was aneffectively finished implement.
Among the most accomplished practi-tioners of prepared-core technologywere the large-brained, big-faced andlow-skulled Neandertals, who occupiedEurope and western Asia until about30,000 years ago. Because they left anexcellent record of themselves and wereabruptly replaced by modern humans
who did the same, the Neandertals fur-nish us with a particularly instructiveyardstick by which to judge our ownuniqueness. The stoneworking skills ofthe Neandertals were impressive, ifsomewhat stereotyped, but they rarely ifever made tools from other preservablematerials. And many archaeologistsquestion the sophistication of their hunt-ing skills.
Further, despite misleading early ac-counts of bizarre Neandertal “bearcults” and other rituals, no substantialevidence has been found for symbolicbehaviors among these hominids or forthe production of symbolic objects—cer-tainly not before contact had been madewith modern humans. Even the occa-sional Neandertal practice of buryingthe dead may have been simply a way ofdiscouraging hyenas from making in-cursions into their living spaces or havea similar mundane explanation. Thisview arises because Neandertal burials
lack the “grave goods” that would attestto ritual and belief in an afterlife. TheNeandertals, in other words, though ad-mirable in many ways and for a longtime successful in the difficult circum-stances of the late ice ages, lacked thespark of creativity that, in the end, dis-tinguished H. sapiens.
Although the source of H. sapiens asa physical entity is obscure, most evi-dence points to an African origin perhapsbetween 150,000 and 200,000 yearsago. Modern behavior patterns did notemerge until much later. The best evi-dence comes from Israel and its sur-rounding environs, where Neandertalslived about 200,000 years ago or per-haps even earlier. By about 100,000years ago, they had been joined byanatomically modern H. sapiens, andthe remarkable thing is that the toolsand sites the two hominid species left be-hind are essentially identical. As far ascan be told, these two hominids behaved
30 S C I E N T I F I C A M E R I C A N E X C L U S I V E O N L I N E I S S U E A U G U S T 2 0 0 5
IAN TATTERSALL and JAY H. MATTERNES have worked together since the early 1990s, no-tably on the Hall of Human Biology and Evolution at the American Museum of Natural His-tory in New York City and at the Gunma Museum of Natural History in Tomioka, Japan (wherethe Tuc d’Audoubert mural on the opposite page is installed). Tattersall was born in Englandand raised in East Africa. He is a curator in the department of anthropology at the Ameri-can Museum of Natural History. His books include Becoming Human: Evolution and HumanUniqueness (Harvest Books, 1999) and The Last Neanderthal: The Rise, Success, and Mys-terious Extinction of Our Closest Human Relatives (Westview Press, 1999, revised).
Matternes is an artist and sculptor who has for more than 40 years specialized in fos-sil primates and hominids. In addition to his museum murals, he is well known for his illus-trations for books, periodicals and television, including Time/Life Books and National Geo-graphic. The research for his depictions has taken him to many parts of the U.S., Canada,Mexico, France, Colombia and Africa.
THE
AU
THO
R A
ND
TH
E A
RTI
ST
HOMINIDS of modern body form mostlikely emerged in Africa around 150,000years ago and coexisted with otherhominids for a time before emerging asthe only species of our family. Until about 30,000 years ago, they overlappedwith H. neanderthalensis (left) in Europeand in the Levant, and they may havebeen contemporaneous with theH. erectus (right) then living in Java.
COPYRIGHT 2005 SCIENTIFIC AMERICAN, INC.
33

31 S C I E N T I F I C A M E R I C A N E X C L U S I V E O N L I N E I S S U E A U G U S T 2 0 0 5
PAT
RIC
IA J
. W
YNN
E (
dra
win
gs)
in similar ways despite their anatomicaldifferences. And as long as they did so,they somehow contrived to share theLevantine environment.
The situation in Europe could hardlybe more different. The earliest H. sapi-ens sites there date from only about40,000 years ago, and just 10,000 or soyears later the formerly ubiquitous Ne-andertals were gone. Significantly, theH. sapiens who invaded Europe broughtwith them abundant evidence of a fullyformed and unprecedented modern sen-sibility. Not only did they possess a new“Upper Paleolithic” stoneworking tech-nology based on the production of mul-tiple long, thin blades from cylindricalcores, but they made tools from boneand antler, with an exquisite sensitivityto the properties of these materials.
Even more significant, they broughtwith them art, in the form of carvings,engravings and spectacular cave paint-ings; they kept records on bone andstone plaques; they made music on windinstruments; they crafted intricate per-sonal adornments; they afforded someof their dead elaborate burials withgrave goods (hinting at social stratifica-tion in addition to belief in an afterlife,for not all burials were equally fancy);and their living sites were highly orga-nized, with evidence of sophisticatedhunting and fishing. The pattern of in-termittent technological innovation wasgone, replaced by constant refinement.Clearly, these people were us.
Competing ScenariosIN ALL THESE WAYS, early Upper Pa-leolithic people contrasted dramaticallywith the Neandertals. Some Neandertalsin Europe seem to have picked up newways of doing things from the arrivingH. sapiens, but we have no direct cluesas to the nature of the interaction be-tween the two species. In light of the Ne-andertals’ rapid disappearance and ofthe appalling subsequent record of H.sapiens, though, we can reasonably sur-mise that such interactions were rarelyhappy for the former. Certainly the re-peated pattern found at archaeologicalsites is one of short-term replacement,and there is no convincing biological ev-
SPECULATIVE FAMILY TREE shows the variety of hominidspecies that have populated the planet—some identified byonly a fragment, others known to exist for a specific timeperiod (solid lines). The emergence of H. sapiens has notbeen a single, linear transformation of one species intoanother but rather a meandering, multifaceted evolution.
H. sapiens (Worldwide)
H. heidelbergensis (throughout Old World)
H. neanderthalensis (Europe and Western Asia)
H. antecessor(Spain)
0
1
2
3
4
5
6
Au. africanus(South Africa)
Orrorin tugenensis(Kenya)
Ardipithecus ramidus(Ethiopia)
Sahelanthropus tchadensis
(Chad)
Australopithecusanamensis(Kenya)
Au. afarensis (Ethiopia and
Tanzania)
Au. garhi(Ethiopia)
Paranthropusaethiopicus
(Eastern Africa)
Mill
ions
ofY
ears
Ago
Homo ergaster(Eastern Africa)
P. robustus(South Africa)
P. boisei(Eastern Africa)
H. erectus (Eastern Asia)
H. habilis(Sub-Saharan Africa)
Au. bahrelghazali(Chad)
Kenyanthropusplatyops(Kenya)
K. rudolfensis(Eastern Africa)
COPYRIGHT 2005 SCIENTIFIC AMERICAN, INC.
34

idence of any intermixing of peoples inEurope.
In the Levant, the coexistence ceased—
after about 60,000 years or so—at rightabout the time that Upper Paleolithic–like tools began to appear. About 40,000years ago the Neandertals of the Levantyielded to a presumably culturally richH. sapiens, just as their European coun-terparts had.
The key to the difference between theEuropean and the Levantine scenarioslies, most probably, in the emergence ofmodern cognition—which, it is reason-able to assume, is equivalent to the ad-vent of symbolic thought. Business hadcontinued more or less as usual rightthrough the appearance of modern bonestructure, and only later, with the ac-quisition of fully modern behavior pat-terns, did H. sapiens become complete-ly intolerant of competition from itsnearest—and, evidently, not its dearest—co-inhabitors.
To understand how this change in sen-sibility occurred, we have to recall cer-tain things about the evolutionary pro-cess. First, as in this case, all innovationsmust necessarily arise within preexistingspecies—for where else can they do so?Second, many novelties arise as “exap-tations,” features acquired in one con-text before (often long before) being co-opted in a different one. For example,hominids possessed essentially modernvocal tracts for hundreds of thousandsof years before the behavioral recordgives us any reason to believe that theyemployed the articulate speech that thepeculiar form of this tract permits.
And finally, it is important to bear inmind the phenomenon of emergence—
the notion that a chance coincidencegives rise to something totally unexpect-ed. The classic scientific example in thisregard is water, whose properties arewholly unpredicted by those of hydro-gen and oxygen atoms alone. If we com-bine these various observations, we can
see that, profound as the consequencesof achieving symbolic thought may havebeen, the process whereby it came aboutwas unexceptional.
We have no idea at present how themodern human brain converts a mass ofelectrical and chemical discharges intowhat we experience as consciousness.We do know, however, that somehowour lineage passed to symbolic thoughtfrom some nonsymbolic precursor state.The only plausible possibility is thatwith the arrival of anatomically modernH. sapiens, existing exaptations werefortuitously linked by a relatively minorgenetic innovation to create an unprece-dented potential.
Yet even in principle this deduced sce-nario cannot be the full story, becauseanatomically modern humans behavedarchaically for a long time before adopt-ing modern behaviors. That discrepan-cy may be the result of the late appear-ance of some key hardwired innovationnot reflected in the skeleton, which is allthat fossilizes. But this seems unlikely,because it would have necessitated awholesale Old World–wide replacementof hominid populations in a very shorttime, something for which there is no evidence.
It is much more likely that the modernhuman capacity was born at—or closeto—the origin of H. sapiens, as an abili-ty that lay fallow until it was activatedby a cultural stimulus of some kind. If
sufficiently advantageous, this behav-ioral novelty could then have spreadrapidly by cultural contact among pop-ulations that already had the potential toacquire it. No population replacementwould have been necessary to spread thecapability worldwide.
It is impossible to be sure what this in-novation might have been, but the bestcurrent bet is that it was the invention oflanguage. For language is not simply themedium by which we express our ideasand experiences to one another. Ratherit is fundamental to the thought processitself. It involves categorizing and nam-ing objects and sensations in the outerand inner worlds and making associa-tions between resulting mental symbols.It is, in effect, impossible for us to con-ceive of thought (as we are familiar withit) in the absence of language, and it isthe ability to form mental symbols thatis the fount of our creativity. Only whenwe are able to create such symbols canwe recombine them and ask such ques-tions as “What if...?”
We do not know exactly how lan-guage might have emerged in one localpopulation of H. sapiens, although lin-guists have speculated widely. But we doknow that a creature armed with sym-bolic skills is a formidable competitor—
and not necessarily an entirely rationalone, as the rest of the living world, in-cluding H. neanderthalensis, has discov-ered to its cost.
32 S C I E N T I F I C A M E R I C A N E X C L U S I V E O N L I N E I S S U E A U G U S T 2 0 0 5
Dark Caves, Bright Visions: Life in Ice Age Europe. Randall White. W. W. Norton/American Museumof Natural History, 1986. Language and Species. Reprint edition. Derek Bickerton. University of Chicago Press, 1992.The Fossil Trail: How We Know What We Think We Know about Human Evolution. Ian Tattersall.Oxford University Press, 1995.Getting Here: The Story of Human Evolution. Updated edition. William Howells. Compass Press,1997.African Exodus: The Origins of Modern Humanity. Reprint edition. Christopher Stringer and Robin McKie. Henry Holt, 1998.The Origin and Diversification of Language. Edited by Nina G. Jablonski and Leslie C. Aiello.University of California Press, 1998.The Last Neanderthal: The Rise, Success and Mysterious Extinction of Our Closest HumanRelatives. Revised edition. Ian Tattersall. Westview Press, 1999.
M O R E T O E X P L O R E
The pattern of intermittent technological innovation was gone, replaced by constant refinement.
Clearly, these people were us.
COPYRIGHT 2005 SCIENTIFIC AMERICAN, INC.
35

36

SEMINARIO III
SURGIMIENTO DEL HOMBRE MODERNO, OLEADAS MIGRATORIAS Y
EVOLUCIÓN DE Homo sapiens
INTRODUCCIÓN GENERAL
Homo sapiens es, actualmente, una especie cosmopolita. La distribución actual responde a un fenómeno que empezó hace millones de años con la/s población/es de homínidos que abandonaron por primera vez África, el continente origen de nuestro linaje. El proceso de poblamiento de nuestro planeta interesa tanto por sus causas como por sus consecuencias y es uno de los aspectos en donde la adaptabilidad de nuestra especie queda más evidenciada. Sin embargo, la reconstrucción del patrón de migraciones no se comprende plenamente y actualmente es objeto de intenso debate.
TEMAS:
- Surgimiento del Hombre Moderno (género Homo).- Modelos teóricos de surgimiento: “modelo Multirregional” y “modelo Fuera de África”. Evidencias que sustentan cada modelo. Controversias asociadas.- Poblamiento del Viejo Mundo. Oleadas migratorias durante el Pleistoceno Medio y Superior.- La evolución operando en la actualidad sobre Homo sapiens.
ACTIVIDADES A REALIZAR:
A partir de la bibliografía de lectura obligatoria se responderán y discutirán las siguientes preguntas:
1.1. ¿Qué ventajas tendría según los autores, la utilización de datos moleculares respecto de los datos paleontológicos tradicionales para la reconstrucción de historias de parentesco? ¿En qué medida el ejemplo presentado de Ramaphitecus ilustra esta controversia?
1.2. ¿Por qué se utiliza ADN mitocondrial para el estudio de la evolución reciente de los humanos? ¿Cuáles son sus ventajas respecto del ADN nuclear? ¿A qué se refiere la metáfora “Eva mitocondrial”? ¿Con qué criterios Kocher (1988) seleccionó un árbol de ADNmt entre los múltiples posibles? ¿Qué nueva información proporcionó el estudio comparado de ADNmt de chimpancés y humanos?
1.3. ¿Qué se observó cuando los autores utilizaron una muestra que incluía 182 tipos diferentes de ADNmt? ¿Qué información aporta este tipo de estudios respecto de la colonización de distintas regiones por Homo sapiens? ¿Qué sugieren acerca del concepto clásico de raza? ¿Y acerca del escenario geográfico donde ocurrió el origen de Homo sapiens?
Wilson, A. C.; Cann, R. L.; Origen africano reciente de los humanos; Investigación y Ciencia; Junio de 1992.
37

1.4. ¿Con qué criterios se estableció la datación del origen de nuestra especie? ¿Podrían relacionar este aspecto del estudio con la discusión planteada en la introducción de trabajo acerco de la objetividad de los datos moleculares? ¿Qué relación existe entre la hipótesis de Eva mitocondrial y las evidencias fósiles disponibles actualmente?
1.5. ¿Qué críticas hacen los autores al modelo multirregional? ¿Qué explicaciones proponen para el desplazamiento sin hibridación de las antiguas poblaciones de homínidos por Homo sapiens? ¿Qué nuevas perspectivas podrán ampliar la comprensión de este problema?
2.1. ¿Cómo presentan los autores su hipótesis sobre el origen del hombre moderno? ¿Cuál es la analogía que proponen para comparar los dos modelos en disputa? ¿Cuál es la opinión de los autores sobre los distintos tipos de datos que se utilizan para interpretar el problema?
2.2. ¿Cuáles son las premisas que según los autores deberían cumplirse en el modelo Eva mitocondrial? ¿Por qué se afirma que el registro arqueológico estaría contradiciendo las predicciones del modelo de Eva?
2.3. ¿Qué se propone acerca del camino anatómico a nivel regional que supone el modelo de Eva mitocondrial? ¿Por qué se propone que si el modelo de Eva fuera correcto, la continuidad de las formas a nivel regional debería ser “superficial”?
2.4. ¿Cómo interpretan los autores las relaciones filogenéticas existentes entre neandertales y Homo sapiens?
2.5. Según los autores: ¿qué se espera encontrar en África si la hipótesis de Eva fuera correcta? ¿Cómo interpretan las evidencias existentes en este continente? ¿Cuál es la interpretación alternativa a los datos de ADN mitocondrial, en el caso de afirmar que hubo hibridación entre poblaciones locales y migrantes?
2.6. ¿Cómo afectaría a la datación del origen de Homo sapiens la pérdida azrosa de linajes de ADNmt? ¿Por qué se propone que debe considerarse la historia demográfica de las poblaciones? ¿Qué otras objeciones se plantean al reloj molecular mitocondrial? ¿Cómo reinterpretan e incorporan estos autores las evidencias moleculares en relación con su hipótesis?
3.1. ¿Cuál sería la relación entre el preconcepto de que la evolución se ha detenido en nuestra especie y la Escala del Ser?
3.2. ¿Seguimos evolucionando los humanos? ¿Por procesos selectivos o por deriva? Comente ejemplos de ambos procesos.
3.3. ¿Cuáles son las funciones o efectos de los genes con señales de selección reciente comentados en el trabajo?
Thorne, A. G.; Wolpoff, M. H.; Evolución Multirregional de los humanos; Investigación y Ciencia; Junio 1992.
Balter, M. 2005. Are Humans Still Evolving? Science 309:234-237.
38

3.4. ¿Cuáles son las consecuencias evolutivas del desarrollo cultural y tecnológico de los humanos?
3.5. Discuta el futuro de la evolución humana, la predicción de los fenotipos por parte de la Biología, y los posibles patrones macroevolutivos en nuestro linaje.
SÍNTESIS
Es preciso comprender que ambos modelos son, actualmente, los extremos de una gama muy diversa de modelos que intentan explicar el "cómo" del surgimiento del hombre moderno y su distribución posterior, revelada a través del registro fósil.
A partir de la discusión de estos trabajos fundacionales, y a modo de síntesis, los alumnos deberían llegar a comparar ambos modelos según los siguientes criterios: (1) lugar geográfico originario de Homo sapiens; (2) población ancestral; (3) edad de la especie humana; (4) tipos de evidencias utilizadas; (5) posición filogenética de neandertales; (6) dinámica de poblamiento a nivel del viejo mundo; (7) mirada macroevolutiva subyacente.
BIBLIOGRAFÍA COMPLEMENTARIA
• Tattersall, I. 2003. Out of Africa again…and again? Scientific American.
• Stringer, C. B. 1991. ¿Está en África nuestro Origen? Investigación y Ciencia.
• Stringer, C. B. 2001. Modern Human Origins – Distinguishing the Models. African Archaeological Review
18 (2).
• Templeton, A. 2007. Genetics and recent human evolution. Evolution 61-7: 1507–1519.
39

40

41

42

43

44

45

46

47

48

49

50

51

52

The news made headlines around the world:Blonds were going extinct. According toCNN and other media, a World HealthOrganization (WHO) study concluded thatthe gene for blond hair, which wasdescribed as recessive to dominant genesfor dark hair, would disappear in200 years. The BBC announcedthat the last natural blond wouldbe born in Finland and suggestedthat those who dyed their hairmight be to blame, because “bot-tle blonds” were apparentlymore attractive to the oppositesex than natural blonds were andthus had more children.
Fortunately for blonds, thewhole story turned out to be ahoax—“a pigment of the imag-ination,” as the Times of Indialater put it. WHO announcedthat i t had never conductedsuch a study, and hair color isprobably determined by severalgenes that do not act in a sim-ple dominant-recessive rela-tionship. The story, which may have orig-inally sprung from a German women’smagazine, apparently simply leaped fromone media outlet to another.
Although the story was untrue, the easewith which it spread reflects popular fascina-tion with the evolutionary future of ourspecies, as well as the media’s appetite forevolutionary pop science. Today, Oxford Uni-versity geneticist Bryan Sykes is receivingvoluminous coverage for his book, Adam’sCurse, which predicts that continuing degen-eration of genes on the Y chromosome willleave men sterile or even extinct in 125,000years. Many biologists say that the questionthey most often receive from students and thepublic is “Are humans still evolving?”
To many researchers, the answer is obvi-ous: Human biology, like that of all other liv-ing organisms on Earth, is the result of natu-
ral selection and other evolutionary mecha-nisms. Some say the question itself betrays amisunderstanding of how evolution works.“The very notion that … we might not beevolving derives from a belief that all otherlife forms were merely stages on the way to
the appearance of humans as the intendedend point,” says primatologist Mary Pavelkaof the University of Calgary in Canada.
But other scientists point out that indeveloped countries, culture, technology,and especially medical advances havechanged the evolutionary rules, from sur-vival of the fittest to the survival of nearlyeveryone. The result, they say, is a “relax-ation” of the selective pressures that mighthave operated 50 or 100 years ago. “Biolog-ically, human beings are going nowhere,”says anthropologist Ian Tattersall of theAmerican Museum of Natural History inNew York City. University College Londongeneticist Steven Jones agrees. “The centralissue is what one means by ‘evolving,’ ”Jones says. “Most people when they thinkof evolution mean natural selection, achange to a different or better adapted state.
In that sense, in the developed world, humanevolution has stopped.”
Yet millions of people in developingcountries continue to live under the com-bined stresses of poverty and disease. Underthese conditions, even skeptics of ongoinghuman evolution agree that natural selec-tion may be favoring genes that conferresistance to disease or enhance repro-ductive f itness in other ways. Indeed,researchers are now tracking how deadlymaladies such as AIDS and malaria exertselective pressure on people today. “As longas some people die before reproducing orreaching reproductive age, selection islikely to be acting,” says geneticist ChrisTyler-Smith of the Sanger Institute nearCambridge, United Kingdom.
Even in developed countries, where sur-vival tends to be prolonged for almost all,recent studies suggest that there are stillgenetic differences among people in fertil-ity and reproductive fitness, an indicationthat natural selection is operating. “Thequestion ‘Are humans still evolving?’should be rephrased as ‘Do all people havethe same number of children?’ ” saysPavelka. “The answer is that we do not makeequal contributions to the next generation,and thus we are still evolving.”
Over the past few years, a wealth of newdata has begun to illuminate how naturalselection has shaped—and may still beshaping—humanity. The human genomeproject and genetic data from people aroundthe world have powered an explosion ofresearch seeking signs of natural selectionin human DNA. “A lot of the tools we arenow using to search for selection weredeveloped by people working on flies andother organisms,” says evolutionary geneti-cist Bruce Lahn of the University ofChicago. “But once researchers began todiscover examples of ongoing selection inhumans, it opened the door and gave themconfidence that they could find even more.” C
RED
ITS
(TO
P TO
BO
TTO
M):
GET
TY IM
AG
ES;M
.MÖ
LLEN
BER
G/Z
EFA
/CO
RB
IS
8 JULY 2005 VOL 309 SCIENCE www.sciencemag.org234
The goal of much of modern medicine and culture is effectively to stop evolution. Is that happening?
Are Humans Still Evolving?
News Focus
Modern mismatch. Overbite is widespread among modernhumans, but evolution may not be to blame.
The goal of much of modern medicine and culture is effectively to stop evolution. Is that happening?
Are Humans Still Evolving?
Published by AAAS
53

So far, the number of confirmed cases ofgenes under recent selective pressure is only“a handful,” says Tyler-Smith. But that islikely to change once the results of the Inter-national HapMap Project, a multinationeffort to determine worldwide variation inthe human genome, are released later thisyear. Because genetic variation is the rawmaterial on which natural selection works,favoring certain alleles over others, Tyler-Smith says the HapMap should “give us anoverall view of the regions of the genomethat have been under selection.”
Drifting toward modernity?
To science-fiction fans, the future of humanevolution conjures up visions of dramaticchanges in our bodies, such as huge brainsand skulls. “Many people see us continuingon the righteous path of increasing intelli-gence,” says Pavelka. “But we will not headin the direction of larger brains and crania aslong as infants are required to pass througha woman’s pelvis to get into the world.”
Whatever lies in our evolutionary future,scientists agree that the modern humanbody form is largely the result of evolution-ary changes that can be traced back millionsof years. The uniquely human lineage datesfrom about 6 million years ago, and manystudies have demonstrated that our diver-gence from chimpanzees was accompaniedby strong selective pressure, for example onthe human brain. Yet researchers cautionthat not all morphological changes—theones we can see in body shape and size—are the result of natural selection; somemay not be due to genetic evolution at all.For example, the increase in average heightseen in many developed nations over the past 150 years or so is probably duemostly to better diets rather thannatural selection.
Even very early evolutionarychanges in the hominid line werenot necessarily due to naturalselection. Take the hominid face,which has changed dramaticallyin the past 3 million years fromthe heavy-jawed mugs of the aus-tralopithecines to the relativelysmall and gracile skulls of mod-ern humans. AnthropologistRebecca Ackermann of the Uni-versity of Cape Town in SouthAfrica and anatomist JamesCheverud of the WashingtonUniversity School of Medicine inSt. Louis, Missouri, analyzedhominid faces over time, usingformulas that model naturalselection as well as randomgenetic drift, in which some traitsor alleles become more commonsimply through chance. They
concluded last December in the Proceed-ings of the National Academy of Sciences(PNAS) that natural selection probablydrove the evolution of facial form up to thebirth of early Homo. But they also foundthat genetic drift could explain most of thechanges in the human face after the birth ofHomo about 2.5 million years ago. “Selec-tive pressures on the face may have beenreleased” when humans began using toolsand so did less biting and chewing, saysAckermann.
The take-home lesson, she says, is that“genetic drift has played an important rolein shaping human diversity. This is evolu-tion, too.” Drift has continued to shapemodern human faces and skulls in the morerecent past, according to other studies. Forexample, researchers have examined
regional differences in head shape—param-eters such as width of the skull, height of thenose, and length of the jaw—to see whethercertain traits were favored by natural selec-tion in response to differences in climate orenvironment. In most cases, the differencesamong populations turned out to be no morethan expected due to random drift. But thereare a few exceptions: AnthropologistCharles Roseman of Stanford University inCalifornia last year reported in PNAS thatthe skulls of the Buriat people of Siberia arebroader than predicted by random drift.Broad skulls have smaller surface areas andso may be an adaptation to cold climates.That fits with previous work by anthropolo-gist John Relethford of the State Universityof New York College at Oneonta. Releth-ford concludes that random drift and migra-tion can explain cranial differences in “mostcases,” with the exception of people like theBuriat and Greenland Eskimos, who live invery cold environments.
Although the evolution of measurabletraits such as modern human skull shape maybe due to random drift, some changes inhuman body form may have more to do withcultural and environmental factors such asdiet. “Over the past 10,000 years, there hasbeen a signif icant trend toward rounderskulls and smaller, more gracile faces andjaws,” notes anthropologist Clark Larsen ofOhio State University in Columbus. Most ofthe change, says Larsen, is probably due tohow we use our jaws rather than genetic evo-lution. With the rise of farming, humansbegan to eat much softer food that was easierto chew. The resulting relaxation of stress onthe face and jaw triggered changes in skullshape, Larsen says. He adds that the dramaticand worldwide increase in tooth maloc-
clusion, tooth crowding, andimpacted molars are also signs ofthese changes: Our teeth are toobig for our smaller jaws. Numer-ous studies show that non-West-ern people who eat harder tex-
tured foods have very lowrates of malocclusion, henotes. Similar changes arefound in monkeys fed hardand soft diets. “With thereduction in masticatory
stress, the chewing musclesgrow smaller, and thus the bonegrows smaller,” Larsen says. “It isnot genetic but rather reflects thegreat plasticity of bone. It is a bio-logical change but heavily influ-enced by culture.”
Signs of selection
Even if random drift and othernongenetic forces have helpedshape modern humans, there is
www.sciencemag.org SCIENCE VOL 309 8 JULY 2005 235
CR
EDIT
S (T
OP
TO B
OT
TOM
):G
ETT
Y IM
AG
ES/A
FP;I
MA
GE:
CD
C
Cold adapted. Natural selection may havefavored the Buriats’ broad skulls.
N E W S F O C U S
Lactase
G6PD
Duffly blood group
Hemoglobin C
TNFSF5
CCR5
H2 haplotype
DRD4
MAOA
AGT
CYP3A
TAS2R38
Improved nutrition from milk
Protection against malaria
Protection against malaria
Protection against malaria
Protection against malaria
Protection against smallpox and AIDS
Unknown but only in Europe
Cognition and behavior
Cognition and behavior
Protection against hypertension
Protection against hypertension
Bitter taste perception
Candidates for Recent Selection in Humans
GENE OR GENETIC LOCUS HYPOTHESIZED SELECTIVE PRESSURE
Published by AAAS
54

growing evidence that natural selection hasalso played an important role, even if itseffects have been more subtle. Human evolution researchers are now mining theriches of genomic data to spot genes subjectto recent selective pressures (Science, 15 November 2002, p. 1324). Geneticistshave a large arsenal of “tests of selection” attheir disposal, all of which exploit thegenetic diversity of human populations todetermine whether individual alleles orlarger blocks of the genome—called haplo-types—are behaving as would be expectedif they were only subject to random drift andwere not under selection.
Some tests look for evidence that muta-tions in an allele that alter the protein itcodes for have been favored over those thatcause no change; others examine whethercertain alleles are more common thanexpected. A fairly new and powerfulapproach compares the frequency of anallele in a population with the genetic diver-sity within a haplotype to which it belongs.If the allele is common due to random driftover a long time, the adjacent region of thegenome should show considerable variationdue to genetic recombination, the exchangeof DNA between chromosomes during mei-otic cell divisions. But if the variation is lessthan expected, the allele may have risen tohigh frequency in a much shorter period oftime—a telltale sign of selection. “Thesetools are powerful,” says Lahn. “Where weare lagging behind is in good data.”
By deploying such methods, geneticistshave identified more than two dozen genesthat appear to have come under selectivepressures since the rise of Homo, and severalof them may still be subject to such pressures
today. Some of these favored alleles appar-ently arose at highly critical periods in humanevolution. Such is the case of FOXP2, the so-called speech gene, which is implicated in theability to talk, shows signs of strong selec-tion, and arose no more than 200,000 yearsago, coinciding closely with the first appear-ance of Homo sapiens (Science, 16 August2002, p. 1105). Other genes under selectionare linked to cognition and behavior, and stillothers are involved in defense against dis-eases such as hypertension, malaria, andAIDS (see table, p. 235).
In some cases, the new tests for selectionhave helped nail down long-suspected casesof evolutionary adaptation. One classicexample is lactase persistence, the inversecondition of so-called lactose intolerance.Most adults cannot drink milk because theyproduce little lactase, the enzyme thatbreaks down lactose, which is the majorsugar in milk. But a sizable number of peo-ple can, and their geographical distributioncorrelates closely with the spread of domes-ticated cattle out of the Near East. Thus,more than 70% of Europeans, who have a longhistory of drinking milk, have lactase persist-ence, as do some African pastoralists. In con-trast, the percentage is very low in most ofsub-Saharan Africa and Southeast Asia.
Last year, researchers clinched the casefor selection at the lactase gene. A team ledby genome researcher Joel Hirschhorn ofHarvard Medical School in Boston identi-f ied a haplotype more than 1 millionnucleotide base pairs long that includes thelactase gene and confers lactase persistenceon people who carry it. This form of thehaplotype is found in nearly 80% of Euro-peans and Americans of European ancestry
but is absent in the Bantu of South Africaand most Chinese populations. Hirschhornand colleagues concluded from the unusuallength of the DNA block that it is young,because it has not yet been broken up bygenetic recombination. They calculate inthe June 2004 issue of the American Jour-nal of Human Genetics that this haplotypecame under very strong selective pressurebeginning between 5000 and 10,000 yearsago, corresponding to the rise of dairyfarming. Thus a cultural and technologicalchange apparently fostered a genetic one.“This is one of the best examples of recentselection in humans,” says Tyler-Smith.
Although being able to drink milk as anadult has its pleasant side, as any chocolate-shake lover can testify, most people in theworld get along fine without the beverage. Yetin some cases, having a certain allele can be amatter of life or death. Thus, the genes mostlikely to be under strong selective pressuretoday are probably those involved in provid-ing resistance to infectious disease, saysSarah Tishkoff, a geneticist at the Universityof Maryland, College Park. “In Africa, peopleare dying daily [of infectious disease], andthose who have genotypes that confer someresistance are going to have more offspring.That is natural selection in action.”
AIDS and malaria are arguably the worstscourges of humankind today, and they mayboth be exerting selective pressure onAfrican genomes. Several genes have alle-les that provide resistance to malaria,including those that code for hemoglobin Cand an allele of the so-called Duffy bloodgroup found only in sub-Saharan Africa;accumulating evidence suggests that theyhave both been under recent selective pressure. Four years ago, Tishkoff and colleagues showed that two different allelesof a gene called glucose-6-phosphate dehydrogenase (G6PD) have also beenfavored by strong selective pressure. Themutant alleles, A– and Med, are found onlywhere malaria is or recently was a problemand offer resistance against malaria,although they can cause blood diseases.
Tishkoff and her co-workers used theknown geographical variations in the G6PDgene to estimate that the A– allele probablyarose in Africa about 6300 years ago and thenspread rapidly across the continent; the Medallele, found in southern Europe, the MiddleEast, and India, is estimated to be only about3300 years old (Science, 20 July 2001, pp. 442 and 455). These estimates are consis-tent with archaeological evidence thatmalaria only became a major health problemafter the invention of farming, when the clear-ing of forests left standing pools of water inwhich the vector for the disease, the Anophe-les mosquito, could breed. Thus a culturalchange again led to a genetic one.
8 JULY 2005 VOL 309 SCIENCE www.sciencemag.org236
Battle for survival. AIDS and other deadly diseases may spur a rise in resistant gene alleles.
CR
EDIT
:ASSO
CIA
TED
PR
ESS
N E W S F O C U S
Published by AAAS
55

The case of AIDS, and the virus thatcauses it, HIV, suggests that the selectiveadvantage of a gene can shift over time. AsHIV infects T cells in the blood, it docksonto a cell surface receptor called CCR5. Inthe mid-1990s researchers discovered that amutation in the CCR5 gene provides strongprotection against AIDS in homozygotes,people who have two copies of the protec-tive allele. The mutation, called delta 32, isfound in up to 13% of European popula-tions but is extremely rare in other groups,including Africans. Researchers dated theorigins of the delta 32 mutationin humans to about 700 yearsago and concluded that a strongselective event resulted in itsspread; this f inding was con-firmed in 2001 using sophisti-cated selection tests.
Yet because the AIDS epi-demic dates only from the late1970s at the earliest, researchersbelieve that the selective pressureon the delta 32 mutation musthave been from some other factor. Researchers have debatedwhether the plague or smallpox,both of which ravaged Europeanpopulations in the past, is morelikely, although some recent stud-ies have leaned toward smallpox.
Icelanders evolving?
Although researchers scouringthe human genome for signs ofnatural selection have uncovereda few examples, direct evidencethat a particular allele actually boosts repro-duction—the sine qua non of natural selec-tion—is hard to come by in humans. Butthat’s just what researchers were able to do inone dramatic study in Iceland. For the pastseveral years, scientists at deCODE Genet-ics, a biotechnology company based inReykjavik, Iceland, have been gatheringgenetic information on the nation’s 270,000citizens, in a government-approved effort toisolate disease genes (Science, 24 October1997, p. 566). In the course of this research,deCODE researchers discovered a variant ofhuman chromosome 17 in which a 900,000 -nucleotide-base-pair stretch of DNA wasinverted; this inversion was associated witha previously identified haplotype called H2,which they estimate arose 3 million yearsago. H2 carriers make up about 17.5% ofIcelanders and 21% of Europeans, but onlyabout 6% of Africans and 1% of Asians.
To see whether the relatively high fre-quencies in Europeans represented naturalselection, the team genotyped 29,137 Ice-landers born between 1925 and 1965. Whenthese data were correlated with the island’sextensive genealogical database, the evi-
dence for positive selection was stunning:As the team reported in the February 2005issue of Nature Genetics, female H2 carriershad about 3.5% more children than H1 car-riers. “This study has large implications,”says anthropologist Osbjorn Pearson of theUniversity of New Mexico, Albuquerque.“The European version of the H2 haplotypecould sweep the entire human population ifit conveyed the same reproductive advan-tage in other people and environments.” ButdeCODE CEO and research team co-leaderKári Stefánsson says the low frequencies of
H2 outside Europe suggest that for somereason, its advantages are limited to thatcontinent. “Why, I can’t tell you,” he says.
There are several genes in the H2 region,but it is not at all clear which ones cause H2carriers to have more children; one nearbygene is implicated in pregnancy complica-tions. The deCODE team is looking at thegenes to see whether differences in expres-sion might create the selective advantage.One lead, Stefánsson says, is that H2 carri-ers also show a higher rate of recombinationduring meiosis. In an earlier study, his teamfound that mothers with high oocyte recom-bination rates also tend to have more chil-dren, possibly because this genetic shuf-fling helps protect against errors in meiosis,which are a major cause of miscarriage inolder mothers. H2 carriers also appear tolive longer on average. “It is fascinating tothink that there might be an advantage asso-ciated with a DNA variant at both ends oflife,” Stefánsson says.
Our evolutionary future
To many researchers, the limited but grow-ing evidence that natural selection is cur-
rently acting on the human genome meansthat humans are still evolving, even if insubtle ways. But can we actually predict thecourse of future evolution, à la Sykes’s dis-appearing males or the vanishing blonds?Most researchers’ predictions are consider-ably more narrow and cautious and are tiedto known selective pressures.
For example, researchers predict thatdelta 32 and other protective CCR5 muta-tions may become more common in popula-tions widely infected with HIV, especiallyin Africa. “If there are no more advances in
the treatment of AIDS and peo-ple continue to die, we wouldexpect selection pressure toincrease [the mutations’] fre-quency over time,” says Tyler-Smith, who adds that he sees “noreason why they should not go tof ixation”—that is, replace allother alleles of the gene.
Whether or not these patternswill make a signif icant differ-ence in the way humans look orlive is another question. “Therewill be minor fluctuations overtime and space in the makeup oflocal human gene pools ashumans respond to local condi-tions,” predicts Tattersall, “butthey won’t be directional. I findit hard to foresee that under cur-rent conditions a qualitativelynew kind of human is ever likelyto emerge. But if conditionschange, all bets are off.”
Evolutionary predictions aretied to speculation about just what kind of environment we may face. Someresearchers suggest that changing climateconditions may diminish the benefits of cul-ture and medicine, creating a new era of nat-ural selection. “There has been a relaxationin selective pressures in industrialized soci-eties,” says evolutionary geneticist PeterKeightley of the University of Edinburgh,U.K. “But our ability to sustain that relax-ation is probably temporary. We are usingup our energy resources, our population isgrowing, and the climate is changing. Allthis is bound to lead to greater difficultiesand renewed selective pressures.”
Despite such concerns, however, mostscientists remain leery of long-term fore-casts, in part because of the way evolutionworks. “Evolution is not directed towards agoal,” says Tyler-Smith. “It always takes theshort-term view, operating just on whatallows us to survive and reproduce better inthis generation.” For now, predictinghumanity’s evolutionary future may be littlemore than crystal ball gazing—better suitedto science fiction than scientific research.
–MICHAEL BALTER
N E W S F O C U S
www.sciencemag.org SCIENCE VOL 309 8 JULY 2005 237
CR
EDIT
:NA
TU
RE
GE
NE
TIC
S3
7,1
29
-13
7 (
20
05
)
Baby boost. Women with an inversion in this region of chromosome 17have more children.
Published by AAAS
56