TÉR – GAZDASÁG – EMBER - Széchenyi István...
132
TÉR – GAZDASÁG – EMBER
Transcript of TÉR – GAZDASÁG – EMBER - Széchenyi István...

TÉR – GAZDASÁG – EMBER


TÉR – GAZDASÁG – EMBER
Győr, 2016

The Academic Journal ofSzéchenyi István UniversityKautz Gyula Faculty of Economics
Published every March, June, September and December (the final edition in English)
December 2016. Vol. IV. No. 4.
The journal was supported by the Pallas Athéné Domus Animae Foundation.
Editorial room9026 Győr, Egyetem tér 1.Administration Building, VI. floor, room 603/aPhone number | 00 36 96/503483 E-mail | [email protected]
Publisher | Manager of Universitas-Győr Non-profit Kft.Distributor | Universitas-Győr Non-profit Kft.Address | 9026 Győr, Egyetem tér 1.Print works | Palatia Nyomda

Editorial committee
President MIHÁLY SIMAI | Academic
Editor in chief FERENC SOMOGYI | Széchenyi István University, Associate ProfessorDeputy editor in chief TAMÁS DUSEK | Széchenyi István University, Professor
MembersLÍVIA ABLONCZYNÉ Dr. MIHÁLYKA | Széchenyi István University, ProfessorTAMÁS BÁNFI | Corvinus University of Budapest, ProfessorGYÖRGYI BARTA | Széchenyi István University, Professor ANDREA BENCSIK | Széchenyi István University, Professor ÁGNES BORGULYA | University of Pécs, Academic private tutor, Professor LÁSZLÓ JÓZSA | Széchenyi István University, Professor ETELKA KATITS | Széchenyi István University, Associate Professor GYÖRGY KOCZISZKY | University of Miskolc, Professor IMRE LENGYEL | University of Szeged, Professor JÓZSEF LEHOTA | Szent István University, Professor ERZSÉBET NOSZKAY | BKF University of Applied Sciences, Professor ILONA PAPP | Széchenyi István University Associate Professor ISTVÁN PISKÓTI | University of Miskolc, Associate Professor JÁNOS RECHNITZER | Széchenyi István University, Professor GÁBOR REKETTYE | University of Pécs, Professor emeritus PÉTER RÓBERT | Széchenyi István University, Professor ÉVA SZALKA | Széchenyi István University, Associate Professor IRÉN SZÖRÉNYINÉ KUKORELLI | Széchenyi István University, Professor GYÖRGY SZRETYKÓ | University of West Hungary, Associate Professor ZOLTÁN VERES | Budapest Business School, Professor LÁSZLÓ ZSOLNAI | Corvinus University of Budapest, Professor
Proof editor | NATASHA BAILEY

CONTENTS
SPACE
ZOLTÁN EPERJESI | Relationship of competitiveness and social cohesion in the European Union
KRISZTINA TÓTHNÉ KARDOS – JÁNOS RECHNITZER | City branding in Győr, from the change of regime to the current day
KRISZTIÁN KOPPÁNY | Macroeconomic Impacts of the University and Industry Cooperation Centre of Győr
ECONOMY
GYÖRGY SZRETYKÓ – ATTILA MÉSZÁROS | The measurement of the GDP and the well-being of the people
PETRA PLATZ | Reflections on the role of internal environment in the preference system construction
VERONIKA POREISZ | Theoretical review of the companies’ performance in spatial approach
ATTILA ALBERT TÓTH | Tourism destination development by hotel industry investment
ATTILA KURUCZ | The SMEs surf in change flow
MARKÉTA SANALLA - VERA PLHOŇOVÁ | New Challenges of E-government: the Use of New Media in Public Administration
9
28
41
64
73
84
93
109
122

SPACE

9
ZOLTÁN EPERJESI[1]
Relationship of competitiveness and social cohesion in the European Union
INTRODUCTION
In my current study I try to prove that due to the economic and financial crises, and the fierce global competition, the European Union does not have any other choice but to strengthen its competitiveness on contrary of cohesion. The signals of a paradigm shift can be detected in the development policy of the EU. The development policy, based on market mechanism, will be determined by competi-tiveness factors. The movement from the bureaucratic co-ordination to the market co-ordination is inevitable in the allocation of the EU funds. The change of para-digm can be established studying the structure of the current financial perspec-tive. The shift toward competitiveness is beneficial for the core regions of the EU, projecting the vision of the two-speed Europe. Tensions are to be awaited because the newly accessed member-states are first of all interested in cohesion and social-economic close up.
I use the available secondary sources and statistics in order to underpin my hypothesis. It states that the future economic policy of the European Union will be determined by the intensification of competitiveness.
The economic, social and territorial cohesion is based on three strategic directives in the period of 2007–2013:
• Enhancing the attractiveness of the member-states, regions and cities by ameliorating their access, securing the appropriate quality of services and maintaining the environment.
• Fostering innovations, the entrepreneurial spirit, the knowledge based economy and the new information communication technologies.
• Establishment of more and better jobs, increasing employment, developing the absorption abilities of employees and enterprises, investments in human resources.
[1] Senior manager, KPMG Tanácsadó Kft., Energy and Utilities Advisory Services ([email protected]).

10
ZOLTÁ N EPERJESI
The following principles are to be taken into consideration so that the renewed Lisbon strategy can be accomplished. The cohesion policy within the renewed Lisbon strategy strongly concentrates on the creation of a knowledge-based economy, research and development, as well as innovation. The sustainable development is further maintained by harmonising the coincidence between the economic, social and environmental protection dimensions. The national devel-opment policies regard the environmental protection as a vehicle generating growth that strengthens the competitiveness and increases the employment. The environmental aspect has already been considered in the preparation phase of the programmes. Furthermore, the equality between genders and anti-discrimination is emphasized.
In the framework of the Cohesion Fund and with the aim of convergence, the member states and regions, entitled to maintenance, have to prefer those Euro-pean integration projects that refer to their territory. Special attention has to be paid to the cross-border connections within the Trans-European networks trans-portation projects. In order to improve regional development and the effective-ness of the transportation projects, the geographically isolated regions have to be involved in the TEN transportation projects.
The renewed Lisbon strategy contains considerable changes in comparison to the original concept. As the original Lisbon strategy concentrated on cohesion, the renewed version prefers competitiveness to cohesion.
Member states, entitled to subsidies from the Cohesion and Structural Funds, use the funds of the Cohesion Fund to the financing of their TEN projects, while they withdraw funds from the Structural Funds to finance economic fostering projects.[2]
The growth of the EU and the creation of new jobs require the shift of the economy into the direction of knowledge based activities. The EU has a big gap on the field of research and development compared to the USA and Japan. The private sector needs to struggle with an even bigger lack. The Lisbon strategy established that the member states should spend 3% of their GDP on R&D but this ratio is not fulfilled within the EU. The innovation gap of the EU, compared to other global economic players, is getting deeper and deeper. Unfortunately, the commercialisation of the technological developments does not occur in the appropriate measure. The broadening of the national and regional capacities has to be fostered so that technology and knowledge are really used in the econ-omy. The integration of the small and medium sized companies into research and development activities is of utmost importance as these companies employ two-third of the workforce. It is rather important to co-ordinate the R&D activi-ties of the state and the private sector so that duplicities can be avoided and
[2] Resolution of the European Council for strategic guidelines concerning cohesion (2006/702/EK), Official Journal of the European Union, L291/11.

11
R EL ATIONSHIP OF COMPETITIVENESS A ND SOCIAL . . .
synergy effects can be used. The cohesion policy aids the regions to establish their research and innovation capacities. The regions may take part in the Euro-pean Research Space in that way.
The strategy of the integration referring to cohesion formulates the following directives:
• Strengthening of the co-operation among companies, research institutions and universities. The maintenance of the regional and trans-regional clusters.
• Maintenance of the R&D activities and technology transfers within the SME sector. The aim is to get the SME sector access to R&D services rendered by state owned research institutions.
• Maintenance of the trans-regional and trans-national initiatives. The aim is to foster the research co-operation and the efficiency on research fields prioritised by the EU.
• The research infrastructure and the human resources have to be developed on the fields disposing of considerable growth potential.[3]
STUCTURAL EFFECTS OF THE FINANCIAL FUNDS OF THE EUROPEAN INVESTMENT BANK
The European Investment Bank integrates the common development strategy of the European Union when formulating its strategic directives and business policy. The actual financial policy of the EIB is based on the Europe 2020 strat-egy accepted in 2010. The maintenance of an intelligent, sustainable and inclu-sive growth, formulated in the Europe 2020 strategy, was taken over by the EIB. The bank has evoked a separate working group so that the banking products and services suit the best way transportation, research and development, innova-tion and environmental protection investments. The intelligent growth means a knowledge-based, innovated economic growth. Sustainable growth is understood as the establishment of a competitive economy using the resources in a more effi-cient way. The aim of the inclusive, endogenous growth is to achieve high employ-ment and economic, social and territorial cohesion. The development strategy of the EU contains 5 outstanding areas: employment, research and innovation, climate protection and energy, education and the fight against poverty. The aims are strongly interconnected with each other. The broadening of the research, development and innovation capacities and the rational resource management contributes to the fostering of competitiveness and employment. The biggest challenge is to increase employment and productivity in the framework of the “knowledge triangle” that comprises of the maintenance of education (increasing
[3] Op. cit.

12
ZOLTÁ N EPERJESI
the number of people possessing a diploma), fostering research activities and intensified innovation activities (using the research results in the economy).
The EIB approved more than EUR 4 billion for different educational invest-ments and EUR 7 billion for research, development and innovation projects.
The first sheet presents the financing spent on a knowledge-based economy:
Table 1: EIB fund allocation
2010 2000 - 2010
Infrastructure 4761 25
Education 0,31 0,59
R&D 0,69 0,41
Others 0,36 0,20
Total 0,21 0,07
Source: EIB annual report 2010. 19.
The EIB strives to foster the financing of the knowledge triangle because these investments serve not only the increasing competitiveness but they also contrib-ute to fight poverty and social exclusion.
The EIB elaborated the Risk Sharing Finance Facility (RSFF) with the Euro-pean Commission so that the research and development projects, the innovations with high risk and profit factors can be financed. The fund was financed by the EIB and the European Commission. EUR 10 billion were disbursed for R&D and innovation investments in the budget period (2007–2013). The total amount of these investments makes up at least the double of this.
The structural credit line facilities of EIB also have to be mentioned. In 2010, the bank financed the convergence regions, hit by the financial crises, with 25,9 billion EUR. This amount of money makes up 41% of the total loan sum of EUR 63 billion granted in the EU. The member states may use these loans for financing projects accepted by the structural funds.
The bank of the union also provides technical assistance to the newly-joined 12 member countries regarding the preparations for the most important invest-ments approved by the structural and cohesion funds.
The following common European programs are distinguished:• JASPERS - common program maintaining the investments of the European
regions (EIB, European Commission, EBRD, Kreditanstalt für Wiederaufbau),• JESSICA – common European initiative maintaining sustainable city
development investments (EIB, European Commission, • JEREMIE – common European funds maintaining micro-, small and medium
sized enterprises (EIB, European Commission),• JASMINE – common program promoting European micro-financing
institutions (EIB, European Commission).
EUR Mill.

13
R EL ATIONSHIP OF COMPETITIVENESS A ND SOCIAL . . .
The European Investment Bank elaborates an operational plan for 3 years that is monitored biannually and evaluated annually. The operational plan of 2012–2014 contains all targets and sums up the crucial priorities and activities. Special emphasis is laid on it so that the strategy of the bank is harmonised with the budget of the EU beginning 2014.
Several strategic parameters were developed to reform the operational plan. They are as follows:
• Sustaining the core business model in order to grant the outstanding creditworthiness of the bank
• Maintaining the long term transparent investment projects• short- and middle term measurements are needed to be taken for the financial
stability of the bank and amelioration of the quality of the portfolio.
In order to overcome the economic and financial crises, the bank reorganised its internal procedures and modified its financial services. Due to the changes, the EIB managed to remain the leading financial institution of the EU. 90% of the total credit volume concentrates on the financing of the member states. According to the Europe 2020 strategy, the EIB finances projects representing high value added regarding economic growth, employment, cohesion, and environmental protec-tion. The EIB provides preference to projects to be accomplished in regions lack-ing the necessary capital. The bank puts special emphasis on the climate protec-tion commitments of the European Commission and the member states.
The bank prioritises the single investment projects in order to reach maximal effi-ciency and to be in line with the common goals set by the EC. The common goals are as follows:
• to increase the growth and employment potential of the EU• economic and social cohesion• projects contributing to the climate actions-program[4]
The co-operation of the EIB with the European Commission and other financial institutions specialised in long term project financing unambiguously showed the synergy effects. The development of the common actions greatly contributes to the common risk-division mechanism. The EIB furthermore provides financial and technical advisory activities in order to strengthen the political goals of the union. The EIB needs to elaborate financial solutions tailored to infrastructural projects covering the whole Europe. These projects necessitate long preparation periods because of the joint financing of the state and the private investors and due to the fact that several states are involved. Considerable economic disparities between member-states cause further delays concerning the investments to be financed by
[4] The EIB Group Operational Plan 2012–2014.

14
ZOLTÁ N EPERJESI
the EIB. 50% of the bank financing concentrates on the infrastructural and energy efficiency projects. The European small and medium-sized enterprises sector is a crucial pillar of the European economy. The SME sector faces serious financing problems hindering economic growth and innovations. The bank needs to fulfil different criteria at the same time: ranking of fund resources, pricing of financial intermediaries, use of the funds in the utmost efficient way in the interest of the final beneficiaries. The European Investment Fund is charged with securing risk capital for the SME sector. The European Micro-Financing Fund financed by the EIB and the European Commission is trusted by the European Investment Fund.
In the framework of the climate action program, the EIB faces severe difficul-ties due to the low risk-taking willingness of the commercial banks, the economic recession and the uncertainties experienced in the regulation of the renewable energy sector. In order to reach tangible results on the European level, the EIB will reduce the average project size compared to the past periods. The projects are to be classified according to a transparent enlisting order so that the value added of the bank can be maximised. The second chart demonstrates the outstanding financing position of the knowledge economy and the environmental protection very well.
Table 2: Credit targets
Category Unit 2011. 2012. plan
Convergence bln EUR 21 18
Knowledge economy bln EUR 9,8 8,4
EIB loans bln EUR 9,8 8,4
European Investment Fund bln EUR 1,2 1,3
Trans-European networks bln EUR 9,5 6,3
Environmental protection bln EUR 15,9 11,3
SME sector bln EUR 10,4 11
EIB loans bln EUR 10,4 11
European Investment Fund bln EUR 1,3 1,3
Energy projects bln EUR 12 9,5
Source: EIB Group, operational plan 2012—2014. EIB 16th February 2012. 15.

15
R EL ATIONSHIP OF COMPETITIVENESS A ND SOCIAL . . .
Figure 3: Political goals
Goals Unit 2011 2012 2013 2014 2012-14 average
Credits contributing to growth and employment targets
bill. EUR 39,5 32,7 31,8 30,8 31,8
Knowledge economy, EIB loans bill EUR 9,8 8,4 8,1 7,8 8,1
Knowledge economy, European Investment Fund bill EUR 1,2 1,3 1,3 1,3 1,3
Trans-European networks - transport bill EUR 8 6 5,8 5,6 5,8
competitive and safe energy supply bill EUR 7,5 4,5 4,5 4,4 4,5
SME sector EIB loans bill EUR 10,4 11 11 10,7 10,9
SME sector EIF guarantees bill EUR 3,8 2,8 2,4 2,3 2,5
urban rehabilitation bill EUR 3,8 2,8 2,4 2,3 2,5
Source: EIB Group, operational plan 2012-2014. EIB 16th February 2012. 15.
The third chart shows exactly that the EIB financing reflects the priorities of the Europe 2020 strategy.
Half of the total credit volume of the bank is made of infrastructural and energy projects. All of these projects play an important role in increasing the economic growth and employment. This fact underpins the emphasis the EIB lays on trans-portation and energy projects. The urban infrastructure developments proceed in the framework of the JESSICS program.
The following additional regional development targets have to be considered in the convergence regions:
1. the geographical location of the disparity level2. the special parts of the operation plan of the European Commission3. the abolishment of the lacks experienced in the implementation of the
acquis communautaire (environmental standards). 4. the increase of the productivity and interconnection of the regions.
In the future, the EIB will pay an intensified attention to the climate action programs, the infrastructure and energy projects, bearing considerable economic multiplication effect. Such sectors belong to the preferred financing priorities of the EIB, in which the European enterprises dispose of comparative advantages. Such sectors are, for example, biotechnology, environmental protection vehicles. The support of the “greener growth” does not only refer to the renewable energy sources but to the industrial infrastructure and the energy efficient development of transportation and shipping, too.

16
ZOLTÁ N EPERJESI
The bank develops new financial products by combining the structural funds of the EU and its own sources so that it may serve even more efficiently the goals laid down in the Europe 2020 strategy. The new banking products provide an alternative solution to extend funds of the EU and EIB by sharing the risks.
The role of the SME sector cannot be questioned regarding growth and innova-tions so it remains central element of the EIB’s financing policy. The EIB elaborates business development plans in co-operation with decisive commercial banks, specialised in the SME sector, so that loans can really foster the competitiveness. The European Investment Fund greatly contributes to the economic growth of the EU by its micro-financing, mezzanine loans and risk capital. The European Invest-ment Fund and the EIB play a major role in strengthening the innovations and developing the entrepreneurial spirit by linking the competitiveness and innova-tion programs of the EU and the JEREMIE financing tools.
DIVISION OF THE FUNDS OF THE STRUCTURAL FUNDS AND THE COHESION FUND
The main goal of the European cohesion policy is to assure the institutionalized financial framework for different projects, which contribute to the economic growth of the member states. The cohesion policy revises all 7 years. The expenditures of the regional and cohesion policies are managed by three structural funds, the European Regional Development Fund, the European Social Fund, and the European Cohe-sion Fund. The European cohesion policy is based on three pillars: convergence, regional competitiveness and employment, European territorial co-operation.
Article 25. of the regulation 1083/2006/EK provides economic, social and terri-torial instructions for interventions concerning the aforementioned structural funds. The harmonious, balanced and sustainable development of the EU is always considered. [5]
The accession of the new candidate countries deepened the inequalities among the regions. The opportunity, that the poorest regions with great growth potential are to be located in the new member states, has to be considered. The new element of the cohesion policy, the territorial cohesion has a central role. The 13th point of the resolution met by the European Council concerning the cohesion policy contains as follows: “territorial dimension of the cohesion policy is of crucial importance and all territories of the EU should have access to the development sources for growth and employment purposes. Strategic guidelines have to consider investment needs of towns and rural territories in the interest of harmonious development, sustain-able communities and social integration.”[6]
[5] Resolution of the European Council (06.10.2006.) concerning the common strategic directives for cohesion (2006/702/EK), Official paper of the EU, 21.10.2006.[6] Resolution of the European Council (06.10.2006) concerning strategic guidelines of the EU (2006/702/EK), official paper of the EU, 21.10.2006.

17
R EL ATIONSHIP OF COMPETITIVENESS A ND SOCIAL . . .
The overwhelming part of the budget of the cohesion policy refers to conver-gence issues. The cohesion funds are used in the poorest regions, where the GDP does not reach 75% of the European average. The developmental funds are, first of all, spent on infrastructure and transport projects. 100 European regions belong to this target with 170 million inhabitants, one third of the total European population. The convergence regions are located in the Middle-Eastern European countries and in the Mediterranean countries. 170 regions belong to the regional competitiveness and employment target. In this case, the developmental funds are used for co-financed investments contributing to the strengthening of compet-itiveness and innovation capacities, the development of the human resources and absorption capabilities of the workforce.
The European territorial co-operation target supports the joint actions between the different regions and the change of experience. A decisive proportion of the funds is spent on the development of the cross-border co-operations. 81,5% of the funds at disposal are spent on convergence issues, as 16% are spent on competi-tiveness and employment issues, while 2,5% of the funds are used for European territorial co-operation purposes.[7]
The financial perspective for the period of 2007–2013 stipulated EUR 347 billion for the development funds of the EU. The European Regional Development Fund receives EUR 201 billion, the European Social Funds receives EUR 76 billion, while the European Cohesion Fund receives EUR 70 billion from the total amount. The cohesion policy needs to reach considerable results on the field of economic and social cohesion, and reduction of the developmental disparities between the regions. The concept is based on the establishment of the modern regions that function as the engine of economic growth and competitiveness in the unified European economic space. The EU lays big emphasis on the exchange of experi-ence and the well-functioning procedures and processes. It is exceptional in the history of the European Union that EUR 350 billion are spent on regional develop-ments in a period of financial perspective.
In March, 2000, the leaders of the EU approved a new strategy for economic growth and employment on the Lisbon summit. It was aimed that the EU’s econ-omy would become the most competitive economy. As there are considerable disparities among the old and new member states considering the allocation of the funds. In Spanish and Portugal convergence regions, 80% of the total investment volume is spent on convergence targets, as in Danish competitiveness regions, 92% of the total investment volume serves competitiveness objectives.
Although, Bulgaria, Romania, and Poland should execute serious national, regional and local infrastructure projects, they decided to spend the funds on targets stipulated in the Lisbon strategy.
[7] Cohesion Policy 2007–2013, National Strategic Reference Frameworks, January 2008. Luxem-bourg: Office for Official Publications of the European Communities 2007.

18
ZOLTÁ N EPERJESI
The European Council set four priorities in the renewed Lisbon strategy: more knowledge-based innovation investments, fostering of business opportunities in the SME sector, increasing employment and more efficient use of the energy sources. The new cohesion programs prefer these priorities. More than EUR 85 billion are allocated to the knowledge-based economy in the current financial perspective. The new programs provide a further fund of EUR 13 billion to human resources development of enterprises and innovative procedures contributing to more efficient work organisation. The funds also help to abate the difficulties caused by restructuring. It is also aimed that the entering of the labour market is eased for young employees and the institutions responsible for employment issues are modernised. The decision makers recognised the outstanding role of the public education and professional trainings.
Table 3: The division of the subsidies granted by the ERDF and ESF during the financial perspective 2007–2013 in the 27 EU member states
development fields %
culture 2,2
energy 4
environmental protection, prevention 18,7
increase of durable employment 0,4
human resources 0,4
combat against social exclusion 0,1
development of the absorption capabilities of employees and enterprises 0,3
information society 5,6
investment into the social infrastructure 6,2
mobilisation on the field of employment 0,1
cost reduction hindering regional development 0,2
R&D, innovations 23,8
development of institutional capacities at local, regional and national level 0,6
technical aid 3
tourism 2,3
transportation 28,3
urban and rural regeneration 3,8
Total: 100
Source: Cohesion Policy 2007–13, National Strategic Reference Frameworks, January 2008. Luxembourg: Office for Official Publications of the European Communities 2007. 7.

19
R EL ATIONSHIP OF COMPETITIVENESS A ND SOCIAL . . .
The European Union allocates five times more funds for the common energy policy, the efficient use of energy sources and renewable energy sources during the current financial perspective than during 2000–2006 in the convergence target. This tendency is even more decisive in the regional competitiveness objec-tive. The fourth chart demonstrates that the R&D, the innovations, the transpor-tation and the environmental protection play the most important role within the cohesion targets.
The new cohesion programs strive to use the synergies in the most complete way. The Trans-European transportation networks have a privileged position among the convergence targets.
Efficient state administration is inevitable to accomplish the Lisbon strategy. For this purpose, EUR 3-6 billion were allocated for the modernisation of the local, regional and national administration.
Table 4: The division of the subsidies granted by the European Social Fund during the financial perspective 2007–2013 in the 27 EU member states
development fields %
increase of durable employment 28,4
human resources 32,9
combat against social exclusion 13,1
development of the absorption capabilities of employees and enterprises 17,8
information society 0,2
investment into the social infrastructure 0,2
mobilisation on the field of employment 1,2
R&D, innovations 0,1
development of institutional capacities at local, regional and national level 2,8
technical aid 3,3
Total: 100
Source: Cohesion Policy 2007–13, National Strategic Reference Frameworks, January 2008. Luxembourg: Office for Official Publications of the European Communities 2007. 7.
The fifth chart shows that the decisive share of the ESF funds are spent on the estab-lishment of the enduring employment and the development of human resources. The annual budget of the European Union totals approximately EUR 120 billion. This amount of money makes up 1% of the GDP of the member states. The struc-tural and cohesion funds have a proportion of 33% within the total EU budget. The European Social Fund disposes of 8% within the total EU budget. The European Social Fund spends EUR 75 billion on the establishment of qualitative jobs. The structural funds have a proportion of 35% within the entire EU budget totalling 42

20
ZOLTÁ N EPERJESI
billion EUR annually. The GDP per capita ratio defines whether a region belongs to the convergence or regional competitiveness target. In case of the convergence regions, the co-financing of the ESF can make up even 80% of the total costs.
In the framework of the convergence target such employment projects are financed that shift the economic growth and employment rate to the average of the EU. In the framework of the regional competitiveness target, the European Social Fund supports the labour market of such countries and regions that become more competitive following these financings. In all member states the conver-gence regions receive more funds. The new member states receive proportionally more funds than the older ones. This measurement is in line with the expectation that the new member states need to close up their economies and accommodate their labour market to the global expectations. This reflects the cohesion serving function of the ESF unambiguously. The regions in need are supported so that the European Union becomes more and more unified.
FINANCIAL PERSPECTIVE OF THE EUROPEAN UNION BETWEEN 2017–2013
Table 5: Financial perspective 2007–2013 (mill EUR at prices 2004)
description 2007 2008 2009 2010 2011 2012 2013 2007–2013
1. Sustainable growth 51 267 52 415 53 616 54 294 55 368 56 876 58 303 382 139
1.a. Competitiveness for growth and employment
8404 9097 9754 10 434 11 295 12 153 12 961 74 098
1.b. Cohesion for growth and employment
42 863 43 318 43 862 43 860 44 073 44 723 45 342 308 041
2. Preserving and maintenance of natural resources
54 985 54 322 53 666 53 035 52 400 51 775 51 161 371 344
from which: Costs and direct payments relating to the market
43 120 42 697 42 279 41 864 41 453 41 047 40 645 293 105
3. Citizenship, liberty, safety, justice
1199 1258 1380 1503 1645 1797 1988 10 770
4. EU as global partner 6199 6469 6739 7009 7339 7679 8029 49 463
5. Administration 6633 6818 6973 7111 7255 7400 7610 49 800
6. Compensations 419 191 190 – – – – 800
Total commitments directives 120 702 121 473 122 564 122 952 124 007 125 527 127 091 864 316
in % GNI 1,100% 1,080% 1,070% 1,040% 1,030% 1,020% 1,010% 1,048%
Source: European Commission: ICEG Working paper 20., 30.06.2007. 6.
21
R EL ATIONSHIP OF COMPETITIVENESS A ND SOCIAL . . .
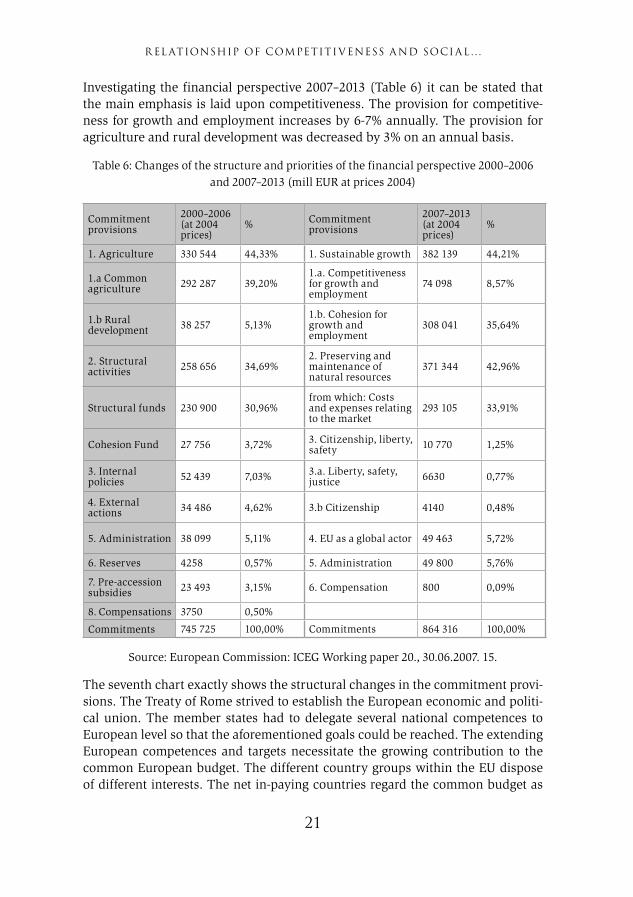
Investigating the financial perspective 2007–2013 (Table 6) it can be stated that the main emphasis is laid upon competitiveness. The provision for competitive-ness for growth and employment increases by 6-7% annually. The provision for agriculture and rural development was decreased by 3% on an annual basis.
Table 6: Changes of the structure and priorities of the financial perspective 2000–2006 and 2007–2013 (mill EUR at prices 2004)
Commitment provisions
2000–2006 (at 2004 prices)
% Commitment provisions
2007–2013 (at 2004 prices)
%
1. Agriculture 330 544 44,33% 1. Sustainable growth 382 139 44,21%
1.a Common agriculture 292 287 39,20%
1.a. Competitiveness for growth and employment
74 098 8,57%
1.b Rural development 38 257 5,13%
1.b. Cohesion for growth and employment
308 041 35,64%
2. Structural activities 258 656 34,69%
2. Preserving and maintenance of natural resources
371 344 42,96%
Structural funds 230 900 30,96%from which: Costs and expenses relating to the market
293 105 33,91%
Cohesion Fund 27 756 3,72% 3. Citizenship, liberty, safety 10 770 1,25%
3. Internal policies 52 439 7,03% 3.a. Liberty, safety,
justice 6630 0,77%
4. External actions 34 486 4,62% 3.b Citizenship 4140 0,48%
5. Administration 38 099 5,11% 4. EU as a global actor 49 463 5,72%
6. Reserves 4258 0,57% 5. Administration 49 800 5,76%
7. Pre-accession subsidies 23 493 3,15% 6. Compensation 800 0,09%
8. Compensations 3750 0,50%
Commitments 745 725 100,00% Commitments 864 316 100,00%
Source: European Commission: ICEG Working paper 20., 30.06.2007. 15.
The seventh chart exactly shows the structural changes in the commitment provi-sions. The Treaty of Rome strived to establish the European economic and politi-cal union. The member states had to delegate several national competences to European level so that the aforementioned goals could be reached. The extending European competences and targets necessitate the growing contribution to the common European budget. The different country groups within the EU dispose of different interests. The net in-paying countries regard the common budget as

22
ZOLTÁ N EPERJESI
a basis and not the common policies and targets. The net in-paying countries require the proportional division of the funds and the stronger representation of the national interests. The beneficiaries of the common budget support solidarity, the strengthening of convergence and the redistribution of the common budget. The character of the common budget has considerably changed due to the acces-sion of the Mediterranean countries. The underdeveloped peripheries needed the redistribution of the common funds.
The cohesion needs and demands of the newly joined Middle-Eastern-Euro-pean countries make the situation even more difficult because the funds to be distributed decreased and the new financing needs turn up in the middle of the economic recession. The new member states are, first of all, interested in the close-up and the deepening of the cohesion. Severe disputes are to be reck-oned with between the core regions and the peripheries. The interest clash is also to be treated between the former beneficiaries and the new Middle-Eastern European newcomers. Above that, there are theoretical disputes as well. One standpoint supports the market protection while the other one struggles for the competitiveness. The decision makers of the EU face a serious dilemma. Either they strengthen the competitiveness of the core regions or they struggle for the close up of the underdeveloped regions. The EU needs to make the decision whether it supports quicker economic growth with considerable developmental differences or slower economic growth with decreasing developmental differ-ences. Studying the Europe 2020 strategy. it is unambiguous that the EU prefers the competitiveness in the circumstances of the current recession that projects the two-speed Europe.
The size of the European budget underwent serious changes in the last decades. The common budget made up 0,4% of the GDP of the EU during 1965 to1970. An overwhelming part of the budget was spent on agriculture. The common budget was increased up to 0,85% of the GDP of the EU by 1985, so it doubled.[8]
Agriculture further played a decisive role in the budget. Structural policies became more and more important due to the accession of the Mediterranean countries. 1,24% of the GDP of the EU was assessed as the size of the European budget.
[8] ICEG Working paper 20., 30.06.2007. 9.

23
R EL ATIONSHIP OF COMPETITIVENESS A ND SOCIAL . . .
Table 7: Division of funds for convergence and regional competitiveness in the 27 member states between 2007–2013.
Description
Convergence Regional competitiveness and employment
European territorial co-operation
Total
Cohesion Conver- gence
Ceasing subsidies
New subsidies
Regional competitiveness and employment
Belgium 638 1425 194 2257
Bulgaria 2283 4391 179 6853
Czech Rep. 8819 17 064 419 389 26 691
Denmark 510 103 613
Germany 11 864 4215 9409 851 26 339
Eastland 1152 2252 52 3456
Ireland 458 293 151 902
Greece 3697 9420 6458 635 210 20 420
Spain 3543 21 054 1583 4955 3522 559 35 216
France 3191 10 257 872 14 320
Italy 21 211 430 972 5353 846 28 812
Cyprus 213 399 28 640
Latvia 1540 2991 90 4621
Lithuania 2305 4470 109 6884
Luxemburg 50 15 65
Hungary 8642 14 248 2031 389 25 310
Malta 284 556 15 855
Netherlands 1660 247 1907
Austria 177 1027 257 1461
Poland 22 176 44 377 731 67 284
Portugal 3060 17 133 280 448 490 99 21 510
Romania 6552 12 661 455 19 668
Slovenia 1412 2689 104 4205
Slovakia 3899 7013 449 227 11 588
Finland 545 1051 120 1716
Sweden 1626 265 1891
United Kingdom 2738 174 965 6014 722 10 613
Interregional co-operation 445 445
Technical aid 868
Total: 69 577 199 323 13 955 11 408 43 555 8 724 347 410
Source: Cohesion Policy 2007–13, National Strategic Reference Frameworks, January 2008. Luxembourg: Office for Official Publications of the European Communities 2007. 8.
24
ZOLTÁ N EPERJESI
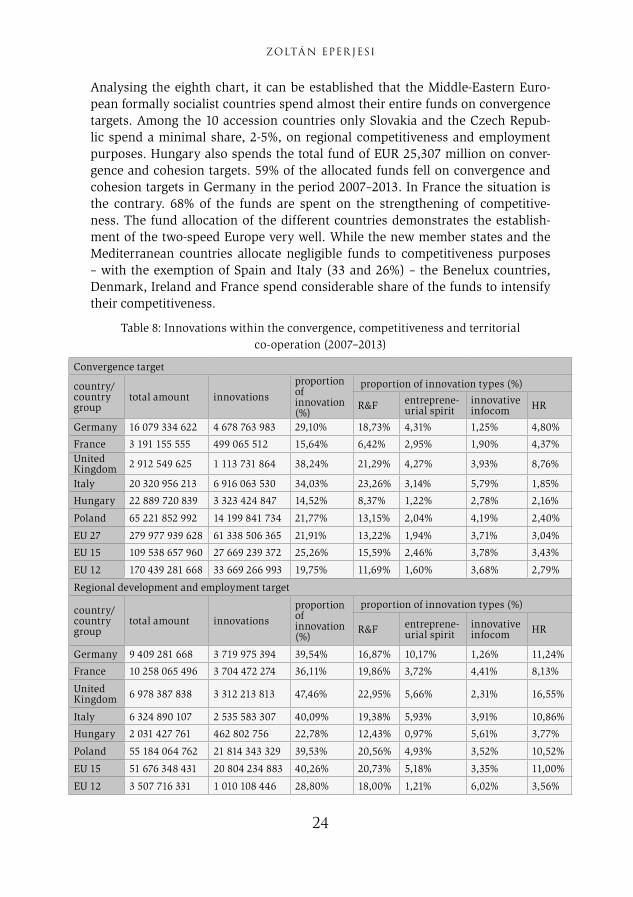
Analysing the eighth chart, it can be established that the Middle-Eastern Euro-pean formally socialist countries spend almost their entire funds on convergence targets. Among the 10 accession countries only Slovakia and the Czech Repub-lic spend a minimal share, 2-5%, on regional competitiveness and employment purposes. Hungary also spends the total fund of EUR 25,307 million on conver-gence and cohesion targets. 59% of the allocated funds fell on convergence and cohesion targets in Germany in the period 2007–2013. In France the situation is the contrary. 68% of the funds are spent on the strengthening of competitive-ness. The fund allocation of the different countries demonstrates the establish-ment of the two-speed Europe very well. While the new member states and the Mediterranean countries allocate negligible funds to competitiveness purposes – with the exemption of Spain and Italy (33 and 26%) – the Benelux countries, Denmark, Ireland and France spend considerable share of the funds to intensify their competitiveness.
Table 8: Innovations within the convergence, competitiveness and territorial co-operation (2007–2013)
Convergence target
country/country group
total amount innovations
proportion of innovation (%)
proportion of innovation types (%)
R&F entreprene-urial spirit
innovative infocom HR
Germany 16 079 334 622 4 678 763 983 29,10% 18,73% 4,31% 1,25% 4,80%
France 3 191 155 555 499 065 512 15,64% 6,42% 2,95% 1,90% 4,37%United Kingdom 2 912 549 625 1 113 731 864 38,24% 21,29% 4,27% 3,93% 8,76%
Italy 20 320 956 213 6 916 063 530 34,03% 23,26% 3,14% 5,79% 1,85%
Hungary 22 889 720 839 3 323 424 847 14,52% 8,37% 1,22% 2,78% 2,16%
Poland 65 221 852 992 14 199 841 734 21,77% 13,15% 2,04% 4,19% 2,40%
EU 27 279 977 939 628 61 338 506 365 21,91% 13,22% 1,94% 3,71% 3,04%
EU 15 109 538 657 960 27 669 239 372 25,26% 15,59% 2,46% 3,78% 3,43%
EU 12 170 439 281 668 33 669 266 993 19,75% 11,69% 1,60% 3,68% 2,79%
Regional development and employment target
country/country group
total amount innovations
proportion of innovation (%)
proportion of innovation types (%)
R&F entreprene-urial spirit
innovative infocom HR
Germany 9 409 281 668 3 719 975 394 39,54% 16,87% 10,17% 1,26% 11,24%
France 10 258 065 496 3 704 472 274 36,11% 19,86% 3,72% 4,41% 8,13%
United Kingdom 6 978 387 838 3 312 213 813 47,46% 22,95% 5,66% 2,31% 16,55%
Italy 6 324 890 107 2 535 583 307 40,09% 19,38% 5,93% 3,91% 10,86%
Hungary 2 031 427 761 462 802 756 22,78% 12,43% 0,97% 5,61% 3,77%
Poland 55 184 064 762 21 814 343 329 39,53% 20,56% 4,93% 3,52% 10,52%
EU 15 51 676 348 431 20 804 234 883 40,26% 20,73% 5,18% 3,35% 11,00%
EU 12 3 507 716 331 1 010 108 446 28,80% 18,00% 1,21% 6,02% 3,56%

25
R EL ATIONSHIP OF COMPETITIVENESS A ND SOCIAL . . .
European territorial co-operation
country/country group
total amount innovations
proportion of innovation (%)
proportion of innovation types (%)
R&F entreprenu- rial spirit
innovative infocom HR
European territorial co-opera- tion
7 428 375 549 1 994 705 122 26,85% 15,99% 2,37% 6,69% 1,80%
all targets
country/country group
total amount innovations
proportion of innovation (%)
proportion of innovation types (%)
R&F entreprenu- rial spirit
innovative infocom HR
Germany 25 488 616 290 8 398 739 376 32,95% 18,05% 6,47% 1,26% 7,18%
France 13 449 221 051 4 203 537 786 31,25% 16,67% 3,54% 3,81% 7,24%United Kingdom 9 890 937 463 4 425 945 677 44,75% 22,46% 5,25% 2,79% 14,25%
Italy 26 645 846 320 9 451 646 837 35,47% 22,34% 3,81% 5,34% 3,99%
Hungary 24 921 148 600 3 786 227 603 15,19% 8,70% 1,20% 3,01% 2,29%
Poland 342 759 567 465 85 197 888 856 24,86% 14,46% 2,43% 3,75% 4,22%
EU 15 161 215 006 391 48 473 474 255 30,07% 17,24% 3,33% 3,64% 5,86%
EU 12 173 946 997 999 34 679 375 439 19,94% 11,82% 1,59% 3,72% 2,80%
Source: self-made chart.
The European Union spends a total of EUR 342 757 567 465 on convergence, regional competitiveness and employment targets, from which innovations disposes of 25% (EUR 85,198 million). The old member countries may use EUR 48 billion; the new member countries may use EUR 35 billion from this amount of money. Comparing the actual data to the data in the financial period (2000–2006) it turns out that the funds spent on innovations have doubled.
Analysing the sheet above, it can be assessed that 60% of the funds within the convergence were spent in the new member counties, and the remaining 40% were allocated among the old member countries. The proportion is just the contrary in case of regional competitiveness and employment objectives. 94% of the funds fell on the old member states and only 6% of the funds are used in the new member states. The cohesion policy for the period 2007–2013 requires such a strategic approach that integrates the growth strategies at European, regional and local level. The new concept strives to assure that the different sectors are not developed separately and that the economic and social circumstances of the given member state or region are investigated in every case.
In the last financial period, innovations got into the centre of the vision of the cohesion policy. The regions are also spurred due to the changed circumstances to elaborate their own innovation strategy.
The renewed Lisbon strategy and the cohesion strategy decisively emphasize the importance of the innovations that are regarded as key elements in the fight with the European economic problems.

26
ZOLTÁ N EPERJESI
CONSEQUENCES
In the fourth chapter, I present the decisive differences undertaken in the fund allocation during the financial perspective 2007–2013, compared to the former financial period. The changes can be seen in the comparing sheet. The emphasis was shifted towards competitiveness in the financial perspective 2007–2013. The provisions for competitiveness issues grow by 6-7% at an annual basis. At the same time, the provisions for agriculture decrease by 3%. 85,5% of the funds of EUR 347,410 million at disposal are spent on convergence issues, 16% are spent on regional competitiveness issues, while 2,5% of the funds are used for European territorial co-operation.
Analysing the 9th spread sheet concerning innovations, convergence and competitiveness, in the fourth chapter I present that 60% of the funds are used in the new member states and the remaining funds are allocated in the old member states. The proportion is just the contrary in case of regional competitiveness and employment objectives. 94% of the funds fell on the old member states and only 6% of the funds were used in the new member states.
The development of competitiveness will cause tensions in the EU, because the programs of the new member states are not so sophisticated and their institu-tional underdevelopment greatly shrinks their absorption abilities.
The proportion of innovations is crucial within the regional competitiveness target at EU level, it makes up 39,53%. The fund allocation for innovations is, first of all, crucial in the old member states. The old member states allocate 40,26% of the funds to innovations in the framework of the competitiveness target. The same proportion makes up only 28,8% in case of the newcomers. The difference of the funds of human resource development within innovations is even more astonishing in the old- and new member countries. The EU15 spends 11% of the innovation funds on HR development while the spending of the EU12 makes up only 3,56%.
With the turning up of the competitiveness factor, the two-speed Europe is to be projected.
It can be stated that the effectiveness of the market co-ordination may result in a better quality of bureaucratic regulation. This mutual strengthening process can be regarded as success countries disposing of a developed and innovative economy. In spite of that, bureaucratic co-ordination and administration captured by social relationships and interest group networks means the main burden for redistribution based on real performance.
According to me, it was a good decision to make competitiveness the core element of the Europe 2020 strategy, even though social cohesion is negatively hit at the beginning because the establishment of the knowledge economy assures the future of Europe for the long term. When executing the strategy, utmost atten-tion has to be paid to the amelioration of the absorption abilities for innovation of the Middle-Eastern European countries. The new member states must take

27
R EL ATIONSHIP OF COMPETITIVENESS A ND SOCIAL . . .
further steps so that their universities and other professional education institutes suit the requirements set by the market.
REFERENCES
• Resolution of the European Council for strategic guidelines concerning cohesion (2006/702/EK), Official Journal of the European Union, L291/11. • Cohesion Policy 2007–13, National Strategic Reference Frameworks. January 2008. Luxembourg: Office for Official Publications of the European Communities 2007. • EIB annual report 2010.• ICEG Working Paper 20., 30th June 2007. • The EIB Group Operational Plan 2012–2014.
HUNGARIAN SUMMARY
Jelen tanulmányomban az Európai Unió gazdaságpolitikájában bekövetkezett nagyon jelentős változásokat mutatom be, amelyeket a pénzügyi és világgaz-dasági válság, valamint az ezzel párhuzamosan egyre erőteljesebben jelentkező világgazdasági verseny váltott ki. A gazdaságpolitika fő hangsúlya egyre inkább a versenyképesség erősítése, mintsem a közép-kelet-európai tagállamok gazdasági és szociális felzárkóztatása irányába tolódott el. A versenyképesség növekedé-sét szolgáló pénzügyi források mértékét éves szinten 6-7%-kal növelték, míg az agrártámogatások mértéke 3%-kal csökkent a 2007–2013 közti költségvetési időszakban. A nagyon jelentős paradigmaváltás következtében egyre inkább elővillannak a kétsebességű Európa körvonalai. Egyre érzékelhetőbbé válnak az unió mag és periféria országai közti feszültségek, mivel a nyugat-európai tagál-lamok legfőképp versenyképességük erősítésében, míg a közép-kelet-, valamint dél-európai tagországok gazdaságaik mielőbbi felzárkóztatásában érdekeltek.
28
KRISZTINA TÓTHNÉ KARDOS[1] – JÁNOS RECHNITZER[2]
City branding in Győr, from the change of regime to the current days
INTRUDUCTION
Nowadays town marketing activity pervades the entirety of a settlement; a town has an identity just like a human being, a business association or a corporation. Town branding does not have long traditions; the concept was first used by Kotler at the beginning of 1990s.[3] This was the first time when professionals experi-enced that a branding system contributes to the development of the settlement, which must be shaped and formed more and more intensely. Branding of individ-ual settlements is the duty to be carried out by city management in the first place, since the primary aim of city politics is to make the city successful[4] and certainly involving local key participants increases the brand image of cities further on. In the 21st century making cities attractive and marketable as well as creating a posi-tive city brand is already a high priority.
Rich historical past, solid industrial traditions, attractions, a favourable geographical location and numerous other advantages of Győr are well-known among investors, those wishing to settle down and tourists visiting the city alike. The goal of Győr city brand is to bring a rising number of visitors, investors, future residents to Győr, in other words to make more and more people decide to purchase the city as a „product”. In our study the change of elements of Győr city brand (identity, slogan and image) starting from the change of regime to our current days will be analysed.[5]
[1] PhD candidate, Széchenyi István University, Doctoral School of Regional and Economic sciences ([email protected]).[2] University Professor, Széchenyi István University ([email protected]).[3] Kotler, P. – Haider, D. – Rein, I. J. (1993): Marketing places: attracting investment, industry, and tourism to cities, states and nations. Free Press, New York.[4] Enyedi Gy. (1995): Városverseny, várospolitika, városmarketing. Tér és Társadalom, 9(1-2). 1–3.[5] Hereby we would like to say thank you to Tóth Nándorné, former head of Cultural Department at Municipality of Győr Town with a County Rank for her professional assistance provided in writing this article.

29
CIT Y BR A NDING IN GYŐR , FROM THE CHA NGE OF R EGIME. . .
LITERATURE REVIEW
Depending on their size and economic development, cities offer subsistence, entertainment and accommodation for the various generations living there. A city has become a product of our time. The conscious, successive and thoughtful sell-ing of the city product is a decisive part of city development, whose significant element is city branding. Both international and national entities have to be made aware of the city brand, so that the city in question becomes renowned and repu-table on a larger scale, urging investors, tourists, and settlers to view the settle-ment in a rather favourable and positive way.
City branding is a long-term process with elements building on each other in a complex manner. Its main aim is to enhance the recognition of the subject city, highlight its unique nature and distinguish it from other cities. A good city brand strengthens the economy of the city, but it is also true the other way round, a town with a solid economy owns a well-thought- over and applied brand equity. It has been proved that emphasizing the economic output, assets and attractions of cities has an impact on the success of towns.[6] As for Papp-Váry if a city is well-branded:
• the inhabitants’ satisfaction grows, their identity is strengthened as well as their pride, the city becomes more and more attractive and simultaneously with increasing local patriotism, brand loyalty rises too;
• the settlement becomes more and more attractive, the number of tourists increases and investment mood also improves;
• the reputation of the city improves, prices of real estates increase along with the intention to settle there;
• furthermore the work performed by the city management is accepted and appreciated more.[7]
When creating a city brand a particular city image is established. It is quite fortunate if the city has a „local value” characteristic of the settlement (economy, industry, nature, monuments, historical past, thermal water, tradition, gastron-omy etc.), which defines the brand of the settlement. According to Ashwort the name of a city having historical, cultural, and industrial or any other outstanding attractions develops into a brand itself.[8] In many cases the industrial production, products of the city specify the brand or the symbol of the city (for instance: Audi, Vagongyár, Győri Keksz, Győri Balett, etc.). With regard to local products manu-factured or special local services rendered at the settlements, the aim of branding is to be distinguished from others, to acquire a competitive edge or publicity of various factors. Each city is delighted to hear that their name is intertwined with a
[6] http://www.macrame.tv/storage/Saff_CityBrandBarom.pdf, downloaded: 17.01.2015.[7] Papp-Váry Á. (2011): Hogyan lesz a településből márka? A városmárkázás alapjai. In: Beszédek könyve polgármestereknek. Raabe Tanácsadó és Kiadó Kft., Budapest. 1–24. [8] Ashwort, G. J, (1992): Is there an urban tourism? Tourism Recreation Research, 2. 2–8.

30
K R ISZTINA TÓTHNÉ K AR DOS – JÁ NOS R ECHNITZER
unique attraction or a product that cannot be found elsewhere; however it is only a mere attempt for towns trying to display themselves via symbols in order to posi-tion the town at the globalised competitive space.[9]
The essence of building a city brand is differentiation, to show in what way the town is different from other towns with similar endowments, what other opportunities can it offer, namely, why is it worth choosing that certain town to investors, tourists and those wishing to settle down. A town is an immobile „product”,[10] therefore the unified identity of these media (for instance: colourful publications, advertisements, different organisations, websites, Facebook, Insta-gram etc.) as well as the city image (external and internal judgment of the city) plays an outstanding role. It is advisable to harmonise the establishment of the (external, internal) image and the identity and provide enough time for those showing interest to get to know and accept it. In the following chapters the city brand, identity and image of Győr will be analysed starting from the change of regime to the present.
THE CHANGE OF GYŐR CITY BRAND
Throughout history various and ever-changing adjectives have been attached to Győr. In the Turkish times Győr was referred to as the largest and most modern border castle, the saviour of Europe, in the 17th century it was called the city of guilds, later it was named a baroque or commercial town, in the 19th century it was defined as the centre of trading crops and animals, in the 20th century it was labelled as an industrial city, and nowadays it is frequently mentioned as the centre of the national automotive industry and vehicle production. The trends of town development are well described by these concise and concen-trated explanations which also signal function changes and the transformation of major roles to be attributed to the city. While earlier these adjectives and characteristics used to serve only as the means of separation and expressing uniqueness,[11] nowadays – particularly due to the town turning into a product – they are interpreted as a brand.
In Győr conscious city branding started after the change of regime with the co-ordination of the Municipality from the middle of the 1990’s. Nowadays it is the Town Marketing and Event Organisation Department of the Municipality[12]
[9] Zukin, S. (1991): Landscapes of Power: From Detroit to Disney World. University of California Press.[10] Probáld K. (1994): Kommunikáció a településfejlesztés szolgálatában (városmarketing). Szak-dolgozat. BKE, Külgazdasági Tanszék, Budapest.[11] The city of rivers, The city of three rivers, Labourer’s city, Baroque city, The city of meetings, etc. [12] The change and transformation of urban organisations demonstrate that this issue is more and more appreciated. In 1993 a public benefit company was founded to organise actions of the planned World Exhibition, then it turned into Győr 2000 Touristic Public Benefit Company to promote developments in tourism. In 1996 Tourinform Győr Office was opened in the main street.

31
CIT Y BR A NDING IN GYŐR , FROM THE CHA NGE OF R EGIME. . .
which implements and guides continuous building of the city brand. The main goal is to make every person interested in Győr and be familiar with characteristic values, attractions, opportunities for investment available in the city.
Slogans, logos and symbols are fundamental means of city branding which facilitate communication and make the public aware of current values, possibili-ties and novelties. Győr is a complex system, a destination of investments, a scene of quality life, and a centre offering job opportunities, a scene of consumption, or a concentrated supplier of institutions of training, education and culture. All these versatile roles convert Győr into a marketable or even a consumable prod-uct. Consequently, Győr needs concrete marking which separates it from other locations, expresses its features so that it is distinguished from its competitors by drawing attention to its originalities, uniqueness and specialties.
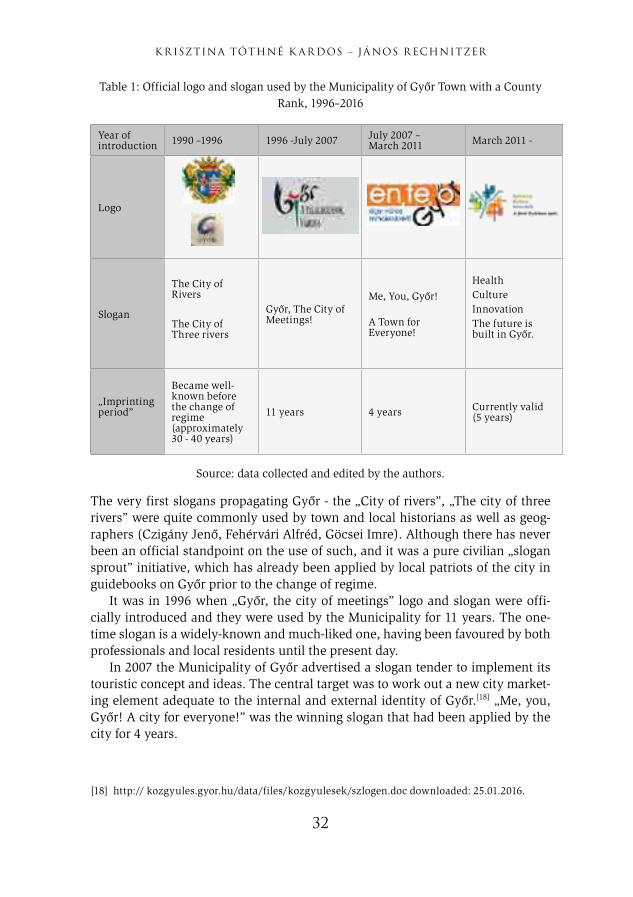
Our study starts with the introduction of changes in the external image of Győr. External image is based on the perception of participants far away from everyday duties of local life, thus it can be modified more easily with means of communication related to city marketing activity than internal image.[13] Books and publications popularising a town are sort of „tourist gazes”,[14] where the visitor associates the image, slogan, logo seen or heard with the reality.[15] It is quite favourable if the slogan embodies and expresses the character, atmosphere, perhaps vision of the town.[16] Table 1 demonstrates the changes in official logos and slogans of Győr.[17]
Meanwhile a touristic referent worked at the Town Hall whose job was supported by the Touristic Committee. In 2006 Communication and Town Marketing Team was established to manage town identity and image which transformed into Town Marketing and Event Organisation Department (2014) after several restructuring. In 2012 the Municipality of Győr handed over a cutting-edge Visitor’s Centre in Baross street which serves tourism in a complex manner. [13] Kavaratzis, M. – Ashworth, G. J, (2005): City branding: an effective assertion of identity or a transitory marketing trick? Tijdschrift voor Economische en Sociale Geografie, 96(5). 506–514. [14] Urry, J. (1990): The Tourist Gaze. Leisure and Travel in Contemporary Societies, London.[15] Szijártó Zs. (2010): Városlakók, turistatekintetek: Az én kulturális fővárosom. Magyar Lettre Internationale, 76. 11–14.[16] Papp-Váry Á. (2014): Hogyan válasszunk szlogent és logót? A verbális és vizuális arculat sze-repe a városmárkázásban. In: Beszédek könyve polgármestereknek. Raabe Tanácsadó és Kiadó Kft., Budapest. 1–28.[17] Tóthné Kardos K. (2016): Győr turizmusának szinergiákon keresztül történő vizsgálata. Doktori értekezés, Győr.
32
K R ISZTINA TÓTHNÉ K AR DOS – JÁ NOS R ECHNITZER
Table 1: Official logo and slogan used by the Municipality of Győr Town with a County Rank, 1996–2016
Year of introduction 1990 –1996 1996 -July 2007 July 2007 –
March 2011 March 2011 -
Logo
Slogan
The City of Rivers
The City of Three rivers
Győr, The City of Meetings!
Me, You, Győr!
A Town for Everyone!
HealthCultureInnovationThe future is built in Győr.
„Imprinting period”
Became well-known before the change of regime(approximately 30 - 40 years)
11 years 4 years Currently valid(5 years)
Source: data collected and edited by the authors.
The very first slogans propagating Győr - the „City of rivers”, „The city of three rivers” were quite commonly used by town and local historians as well as geog-raphers (Czigány Jenő, Fehérvári Alfréd, Göcsei Imre). Although there has never been an official standpoint on the use of such, and it was a pure civilian „slogan sprout” initiative, which has already been applied by local patriots of the city in guidebooks on Győr prior to the change of regime.
It was in 1996 when „Győr, the city of meetings” logo and slogan were offi-cially introduced and they were used by the Municipality for 11 years. The one-time slogan is a widely-known and much-liked one, having been favoured by both professionals and local residents until the present day.
In 2007 the Municipality of Győr advertised a slogan tender to implement its touristic concept and ideas. The central target was to work out a new city market-ing element adequate to the internal and external identity of Győr.[18] „Me, you, Győr! A city for everyone!” was the winning slogan that had been applied by the city for 4 years.
[18] http:// kozgyules.gyor.hu/data/files/kozgyulesek/szlogen.doc downloaded: 25.01.2016.

33
CIT Y BR A NDING IN GYŐR , FROM THE CHA NGE OF R EGIME. . .
The currently valid, official slogan and logo „Health. Culture. Innovation. The future is being built in Győr” were introduced in 2011. The slogan and logo consol-idating the city image is not only used by the Municipality but also by Audi Motor Hungaria Ltd. playing a determining role in the economic, cultural and sport life of the city jointly with Széchenyi István University and mutually strengthening the position of the city, automotive industry and the university at the same time. The colourful logo attached to the current slogan is basically a miniaturised city „map” in which blue „ lines” mark rivers and colours equivalent with words mar different parts of the city:
Figure 1: Logo of Győr Town with a county rank
Source: City Marketing Department of Győr Town with a County Rank.
• Health: Újváros – Sziget (currently: Rába Quelle Thermal Bath and Spa, in the future – location for sport infrastructure developments related to EYOF in 2017),
• Culture: Belváros-City centre (buildings, museums, exhibition centres, information centre, etc.),
• Innovation: Révfalu (Széchenyi István University, Mobilis Interactive Exhibition Centre, Audi Hungária Motor Ltd.).
The role of a logo or a slogan is a kind of positioning, which is why it is highly important that its message is unambiguous and easily associated with the city. Based on the data of the above chart it can be stated that the name of Győr has been part of all the three official slogans since 1996, therefore it can be linked to the town unmistakeably when first heard and it is easy to remember and imprint it. (Figure 1)
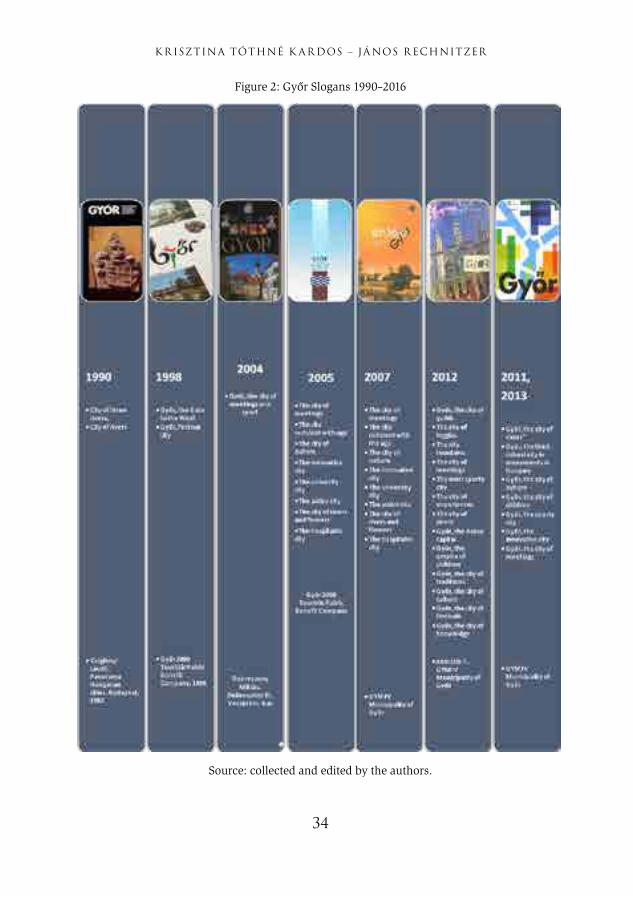
From the aspect of the previously mentioned „Tourist-gaze” the authors asso-ciate Győr with several items (a product, a building, a famous person, attraction, festival etc.). Chart 2 was devised using slogans included in Győr guidebooks and tourist image publications published by the Municipality of Győr.[19]
[19] Tóthné Kardos (2016): op. cit.
34
K R ISZTINA TÓTHNÉ K AR DOS – JÁ NOS R ECHNITZER
Figure 2: Győr Slogans 1990–2016
Source: collected and edited by the authors.

35
CIT Y BR A NDING IN GYŐR , FROM THE CHA NGE OF R EGIME. . .
The slogans appearing in the printed documents are mirrors of sorts for the face of Győr. They convey concrete messages, information easing decision-making in order to establish a unified, positive city image. The above chart shows how vari-able and vibrant collection is made of slogans in publications. It can be detected that professionals in charge of city marketing in Győr are really fond of attaching adjectives (rivers, culture, innovative, sporty, meetings) to the name of the city. Consistent use of well-known buzz sentences having been used for many years increase the value of Győr city brand (e.g. Győr, the city of meetings, Győr, the city of rivers); nevertheless too many valid slogans may be confusing, linked to another city or a less concrete buzz word.
Between 2013–2014 in the course of the residents’ survey carried out within the framework of Vehicle Industrial Research the publicity of slogans and mottos related to the city were examined. Chart 2 describes the chronological changes in city branding elements. Whereas in the past the City of rivers slogan emphasizing the natural endowments as well as the strongly system-specific “Labourers’ city was rather dominant, nowadays the respondents have a mixed attitude. The good old slogan: The city of rivers that had been imprinted has remained, “The city of meetings applied in the 90’s is still liked albeit on a smaller scale, but the most spectacular outbreak was presented by the slogan “City of vehicle production indus-try – Autopolis” Although one may not encounter this slogan in an official form it seemed to appeal to the public. Future-related definitions appear and the new identity “Health, Culture, Innovation. The future is being built in Győr”, although „The city of automotive industry – Autopolis” has remained. In this sample the new slogan appears to be known, however the old ones cannot be erased from people’s memory. All these demonstrate that the formation and transformation of city brand-ing elements must be thoroughly prepared through wide acceptance of the urban society and adequate time must be left to approve and accept them.
Table 2: Publicity of slogans related to Győr and chronological changes(References %-)
Name Past Present Future
City of Rivers 47,4 33,2 12,2
City of Meeting 9,5 19,2 9,4
Automotive city – Autopolis 1,6 25,3 25,6
Labourers’ city 24,4 1,9 1,7
Civic city 8,1 1,9 0,8
Baroque city 8,2 6,7 2,8
Me, You, Győr 0,6 6,3 7,8
The future is being built in Győr 0,2 5,5 39,8
Source: FAQ research, residents survey, processed by Páthy Ádám.

36
K R ISZTINA TÓTHNÉ K AR DOS – JÁ NOS R ECHNITZER
The figures of the above chart reveal and it is also confirmed by the findings of another survey in 2014,[20] that the new slogan having been introduced in 2011 did not have time to be imprinted in the common knowledge in three-years time. The slogan “Health, Culture, Innovation. The future is being built in Győr” is mentioned by 5,5% at present, while when it refers to future it is mentioned by 39,8%.
An important tool to create and imprint the external image of Győr to the common knowledge is advertising on citylights and billboards. Since 2013 we have been able to meet this form of promoting the city on numerous surfaces like that all over the country, mostly beside busy motorways. Between 2013–2015 a conscious city branding activity based on a creative concept and affecting emotions could be detected which drew the attention to Győr with different mottos: „I went to Győr; please leave a message”, „To Győr? You lucky thing…”, „We were born in the right place.”, „I love Győr”,[21] „One city, thousands of experiences.” We can agree with Kozma saying that city branding activity is a rather complex task, during which the city, as a physical space is sold to various “consumers” with different needs at the same time”.[22] When city branding, unified slogans, mottos and experience pictures are to be applied in the long run a unified city brand feature of Győr can be formed over the years in the layer of the society (resident, tourist, settler, economic-, institutional participants)wished to be targeted. Ever-changing use of mottos does not do any good for the city since it may confuse those concerned.[23]
City branding is not only interesting from economic and touristic aspects, it also aims to enhance internal image. It is highly important that local residents are proud of their city and their bonds for the city as well as their identity are strengthened. To research internal image of cities qualitative methods are the most wide-spread, since there is an opportunity to reveal deep causes and individual associations regarding the subject city.[24] The findings of the questionnaire survey made among the social and professional elite of Győr in 2008 display that the system of symbols attributed to the city are fairly homogenous and stabile. It can be seen that the system of symbols most frequently involve certain elements of the built environ-ment. As for the local residents, the image of Győr is mainly determined by the Town hall, the Bishop’s Castle and the entire city centre. Approximately half of the
[20] Dombi D. – Gabora B. – Kovács A. – Potháczki Á. – Vecsey V. – Zágonyi Sz. (2013): Arculat. Élhe-tőség Győrben. Városmarketing kutatás Győrben. Kézirat. Széchenyi István Egyetem. Kautz Gyula Emlék konferencia 2013. június 11. Győr. [21] „I love Győr” is present at the largest social networking site too. Those giving likes to the site may acquire information on programmes, media performances, camps, old urban videos etc. In January 2016 the site has 3698 followers, and the operator of the site is working on a website under the same name to be launched very soon. [22] Kozma G. (1995): Városmarketing, mint a helyi gazdaságfejlesztés egyik lehetséges eszköze. Tér és Társadalom, 9(1-2). 37–54.[23] Papp-Váry Á. (2014): op. cit.[24] Zenker, S. – Petersen, S. – Aholt, A. (2013): The citizen satisfaction index (CSI): Evidence for a four basic factor model in a German Sample. Cities, 30. 156–164.

37
CIT Y BR A NDING IN GYŐR , FROM THE CHA NGE OF R EGIME. . .
respondents mentioned these elements when a question of free choice was put to them. In second place one can find the elements of natural environment, whereas objects and concepts related to the industrial nature of the city were designated to third place – representing a higher proportion than those in the survey of 2004 (however Audi was only mentioned by 14% of the respondents back then).[25]
In 2014 Széchenyi István University did some research on various judgements in terms of the city among prominent residents of the city. One of the questions concentrated on the system of symbols finding out how those are infiltrated in the thinking and city formula of the elite.[26] The world of city symbols is rather simplified since 75% of the questioned people designated three characteristic features, namely the Town hall (32%), rivers (25%) and Audi (13%). The research-ers were trying to find out during the survey what symbols are the most suitable to express the future status of the city. Similarly to the above the answers focused on buildings (Town hall, Széchenyi square), rivers, automotive industry in third place and finally tourism followed by culture.
In our own survey carried out on the Internet in 2014 we were curious how the system of symbols of the city changes. In Chart 4 frequency of references are demonstrated in a word cloud.
Figure 3: Factors mainly determining the image of Győr according to local residents
Source: own edit, based on the replies given to the open question of the questionnaire, 2014.
[25] Csizmadia Z. – Páthy Á. (2010): Győri elit és a városfejlődés – a gazdasági és társadalmi folya-matok megítélése. Tér és Társadalom, 24(2). 63–91.[26] Czakó K. – Poreisz V. (2014): 2014-es győri elitkutatás – összegezve a lakossági-vállalati kutatás eredményeivel és a 2008-as elitkutatás eredményeivel. (előadás) GYIK szakmai projektzáró. 2014. szeptember 25. Széchenyi István Egyetem, Győr.
38
K R ISZTINA TÓTHNÉ K AR DOS – JÁ NOS R ECHNITZER
It is clearly visible that the highest number of references were given to the Town hall (29%), the rivers (20%), the Iron Rooster (19%) and Audi (11%). The author’s mutual view is that identity buildings of the past 20-25 years are reflected in the replies, furthermore some new factors motivating economic growth too (e.g. vehi-cle production- Audi), as well as elements of social capital, such as knowledge production (e.g. university) and innovation (e.g. Siphon Fountain).
Other research also done in 2014 explicitly focused on the judgment of city image of Győr (700 inquiries and 50 in-depth interviews) and made an attempt to examine how much urban citizens identified themselves with the current city image.[27] The analysis revealed that the Town hall also excels in the reputation of objects among all the other mentioned facilities or sights.
We totally agree with the statement of the authors that city development – we would add, that each factor shaping the city – must pay a great attention to the consistent, unified and coherent use of the city brand introduced and accepted by Győr in urban, national and international communication scales, thus the social capital of the city can be increased. The European Youth Olympic Festival to be held in 2017 offers new and great opportunity for branding the city on an international scale.
CONCLUSION
To sum up, it can be stated that Győr has been performing conscious and intense city branding since the middle of 1990s, some years after the change of regime. In the ever-increasing competition of cities a well-known, reputable Győr brand facilitates the imprinting the advantages of the city into common knowledge. Elements of current city branding in Győr are innovative, vibrant and youthful. There are common image elements (based on subjective views and simultane-ously on the objective reality) which are able to address wide range of the society (residents, investors, settlers, tourists, young people) and also offer a vision. The slogan explicitly denotes that the city is open to innovation, concurrently present-ing the development directions the city follows. Győr may become distinctive among domestic urban destinations with similar attributes, monuments and tour-ist attractions by conscious marketing communication. Besides, an active market-ing activity with an economic and touristic approach covering all target groups may enable Győr to alter the picture of an “industrial city” still embedded in the common knowledge.
From this colourful cavalcade the place of Győr is unfolding in the city brand competition and we can declare that Győr had found its route with own identity which coincides with the mission and vision of Győr. Research findings prove that residents of Győr, tourists and investors recognise and have interiorised the slogan
[27] Dombi – Gabora – Kovács – Potháczki – Vecsey – Zágonyi (2013): op. cit.

39
CIT Y BR A NDING IN GYŐR , FROM THE CHA NGE OF R EGIME. . .
„Health. Culture. Innovation. The future is being built in Győr.” even more. Never-theless in 2015 the majority of people are not yet aware of – a unique, unmistak-able city brand. Results of surveys unambiguously support that great effort must be made to apply a slogan or motto in a consistent, external and internal way, and sufficient time is to be provided for making it part of common knowledge so Győr can improve its reputation in the long run.
BIBLIOGRAPHY
• Ashwort, G. J. (1992): Is there an urban tourism? Tourism Recreation Research, 2. 2–8.• Csizmadia Z. – Páthy Á. (2010): Győri elit és a városfejlődés – a gazdasági és társadalmi folyamatok megítélése. Tér és Társadalom, 24(2). 63–91.• Czakó K. – Poreisz V. (2014): 2014-es győri elitkutatás- összegezve a lakossági-vállalati kutatás eredményeivel és a 2008-as elitkutatás eredményeivel. (előadás) GYIK szakmai projektzáró. 2014. szeptember 25. Széchenyi István Egyetem, Győr.• Dombi D. – Gabora B. – Kovács A. – Potháczki Á. – Vecsey V. – Zágonyi Sz.(2013): Arculat. Élhetőség Győrben. Városmarketing kutatás Győrben. Kézirat. Széchenyi István Egyetem. Kautz Gyula Emlék konferencia 2013. június 11. Győr. • Enyedi Gy. (1995): Városverseny, várospolitika, városmarketing. Tér és Társadalom, 9(1-2). 1–3.• Kavaratzis, M. – Ashworth, G. J, (2005): City branding: an effective assertion of identity or a transitory marketing trick? Tijdschrift voor Economische en Sociale Geografie, 96(5). 506–514. • Kozma G (1995): Városmarketing, mint a helyi gazdaságfejlesztés egyik lehetséges eszköze, Tér és Társadalom, 9(1-2). 37–54.• Kotler, P. – Haider, D. Rein, I. J. (1993): Marketing places: attracting investment, industry, and tourism to cities, states and nations. Free Press, New York.• Papp-Váry Á. (2011): Hogyan lesz a településből márka? A városmárkázás alapjai. In: Beszédek könyve polgármestereknek. Raabe Tanácsadó és Kiadó Kft., Budapest. 1–24.• Papp-Váry Á. (2014): Hogyan válasszunk szlogent és logót? A verbális és vizuális arcu-lat szerepe a városmárkázásban. In: Beszédek könyve polgármestereknek. Raabe Tanács-adó és Kiadó Kft., Budapest. 1–28.• Probáld K. (1994): Kommunikáció a településfejlesztés szolgálatában (liárosmarketing). Szakdolgozat. BKE, Külgazdasági Tanszék, Budapest.• Szijártó Zs. (2010): Városlakók, turistatekintetek: Az én kulturális fővárosom. Magyar Lettre Internationale, 76. 11–14.• Tóthné Kardos K. (2016): Győr turizmusának szinergiákon keresztül történő vizsgá-lata. Doktori értekezés. Győr.• Urry, J. (1990): The Tourist Gaze. Leisure and Travel in Contemporary Societies, London.• Zenker, S. – Petersen, S. – Aholt, A. (2013): The citizen satisfaction index (CSI): Evidence for a four basic factor model in a German Sample. Cities, 30. 156–164. • Zukin, S. (1991): Landscapes of Power: From Detroit to Disney World. University of California Press.• http:// kozgyules.gyor.hu/data/files/kozgyulesek/szlogen.doc downloaded: 25.01.2016• http://www.macrame.tv/storage/Saff_CityBrandBarom.pdf,downloaded: 17.01.2015.

40
K R ISZTINA TÓTHNÉ K AR DOS – JÁ NOS R ECHNITZER
HUNGARIAN SUMMARY
A győri városmárka célja, hogy évről évre minél több látogatót, befektetőt, leendő lakost vonzzon, vagyis minél többen döntsenek úgy, hogy a várost mint „termé-ket megvásárolják”. A városok egyre kiélezettebb versenyében egy ismert Győr márka hozzásegíti a város előnyeinek a köztudatba való mélyebb „beégetését”. Tanulmányunkban elemezzük a győri városmárka elemeinek (arculat, szlogen és imázs) változását a rendszerváltozástól napjainkig.

41
KRISZTIÁN KOPPÁNY[1]
Macroeconomic Impacts of the University and Industry Cooperation Centre of Győr
Some Methods of Aalysis with Input-Output Tables and the SZEconomy-GyőRIO Model[2]
Győr is one of the locations of the Hungarian higher education system where a University and an Industry Cooperation Centre (UICC) are to be established. UICC enables Széchenyi István University to operate as a regional hub and economic catalyst beyond, but in close relation with its basic educational and research mission. Supporting suppliers and buyers to intensify their cooperation means catalysing input-output relations along the value chains. Methods, based on input-output tables, provide an effective toolkit in practice in order to analyse poten-tial macroeconomic impacts. This study presents some examples of augmenting cross-industry data with individual company information to obtain more precise results. These hybrid techniques are going to be utilized in the SZEconomy portal, which is an important part of the proposed development programme. SZEcon-omy is a bunch of interconnected economic models that can help UICC to fulfil its mission offering a forecasting, planning and monitoring system for regional improvements. In order to o investigate national level effects, the updated versions of the input-output table of the official Central Statistical Office can be used. To quantify local impacts, we have developed the regional input-output model of the Győr Industrial Area, called GyőRIO. For GyőRIO, the UICC impact analysis is the first and probably also the primary application in the future.
The paper unravels as follows: after a short introduction the first and second sections discuss the aims and relating features of UICC and SZEconomy in more detail; the third section justifies why the input-output model is a feasible frame-work for analysing UICC impacts; from the fourth to seventh sections it demon-strates the use of the input-output tables for this specific purpose through simpli-fied examples; the eighth section concludes and flashes the detailed database and tools for real analyses and the methods for future researches and applications.
[1] Associate professor, Széchenyi István University, Faculty of Economics, Department of Interna-tional and Theoretical Economics, ([email protected]).[2] This research was supported by the Bolyai János Research Scholarship of Hungarian Academy of Sciences and the Pallas Athéné Domus Scientiae Foundation.

42
K R ISZTIÁ N KOPPÁ NY
INTRODUCTION
The topic of this study can be circumscribed as an economic impact analysis: not in general and theory, but rather in practice. The paper overviews some opportu-nities of the application for a particular case, which is one of the recently proposed and hopefully upcoming new development projects our university. Maybe, the most important one of them is the University and Industry Cooperation Centre (UICC). With this project we would like to expand, enhance, deepen and institu-tionalize our function of organizing, affecting and catalysing local economic and social networks and processes.
WHAT’S THIS COMPLEX PROJECT ABOUT? WHAT IS UICC?
Universities have two major traditional interrelated tasks: research and higher education. Beyond. but in close relation with them, a university must be an inte-grated agent of the regional and national economy and society as well, serving their needs, not in a passive, but a proactive way, giving them a leverage by the knowledge disseminated.
This task conventionally is performed by the primary output of the university, i.e. the graduates, who have the skills and competencies that fit the needs and provide for the progress of the region. In the 21th century, it has to be augmented with direct services, consultancy, company trainings, development activities and research capacities to the local agents, such as the Management Campus, the Supplier Qualification Centre, the Incubation Programme, the Open Labs, etc., in the UICC project, that can help them to intensify their cooperation and also boost the local and national economy.
The economy of the Győr region is very concentrated. Firstly, it is due to the biggest motor manufacturer of the world and other highly-developed, world-standard, large international companies located in the city and its hinterland. They give more than 60% of the total output of the agglomeration.[3]
The local economy is not only concentrated but very bipartite, too. There’s a significant gap between these big firms and the small- and medium-sized entre-preneurships. Differences can be found in the fields of hard and soft factors as well, such as the financial background, technology, efficiency, as hard factors, and soft skills and competencies, like communication, corporate culture, market-ing, management, and ownership.
These gaps impede an effective cooperation between the local SMEs and large companies. That’s why the latter operate with very high import rates and pretty low GDP multipliers. The manufacturing of motor vehicles, which is a key-growth industry in both the Hungarian and Győr region economy, has the 3rd
[3] Dusek T. – Koppány K. – Kovács N. – Szabó D. R. (2015): A győri járműipari körzet hozzáadott értékének becslése. Területi Statisztika, 1. 76–87.

43
M ACROECONOMIC IMPACTS OF THE UNIVER SIT Y. . .
and 4th lowest value added multipliers out of the 64 industries of the national input-output table.[4] One can easily realize and say that great further-unexploited opportunities are hidden even in the growth industries.
SMEs, of course, would like to reach international standards and want to be the suppliers of the local, large international companies, and penetrate the new export, domestic, and the local intermediate and final user markets. For this, they may need to detect their customers’ needs more precisely, redefine or improve their products, services, technology, management, marketing, public relations, communication and so on.
Large companies would like to purchase guaranteed quality materials and components from guaranteed quality and flexible local suppliers in large quanti-ties and at competitive prices. They also want to deepen their R&D cooperation with the university and increase the local value-added ratio of their operations.
The University and Industry Cooperation Centre can help these ambitions on the basis of our research, the educational core competencies and capacities, and the opportunities carried by a multi-way knowledge transfer between regional agents, which, in return, can give precious inspirations and contributions for the research and education. This process works as cross-fertilization.
UICC enables Széchenyi István University to operate as a regional hub that can support the connections between the incoming cables. With its assistance, UICC can catalyse both the regional and national economies. That is what the national and local governments and chambers are also interested in, so they are all partners in this development endeavour. Figure 1 shows the relations discussed above.
Figure 1: Széchenyi István University as a regional hub and an economic catalyst
[4] Koppány K. (2016): Magyarország feldolgozóipari exportteljesítményéből és ágazati szerkezetéből fakadó növekedési lehetőségei és kockázatai 2010–2014. Közgazdasági Szemle, forthcoming.
Source: own figure.

44
K R ISZTIÁ N KOPPÁ NY
WHAT IS SZECONOMY?
The tasks of the UICC bear a great amount of responsibilities. We need to meas-ure and plan the potential effects of our efforts in case of every single company and on the whole, too. This assignment is not only a duty but also a challenging economic project, which is an important part of the proposed wide and complex UICC programme. This subprogram was labelled SZEconomy, coining from the acronym “SZE”, the Hungarian name of our university, and the term “economy”.
SZEconomy is going to operate as a portal with user friendly graphical inter-faces, clear-cut reports, tables and diagrams, and a bunch of interconnected economic models, a regional and national economic database behind them.
SZEconomy will not be an exclusive toy for the developers, modellers and university analysts. It will be an open toolkit for all invited and registered local data suppliers with which they will be able to detect the macroeconomic effects of the expected variations or planned steps of their own company businesses. Terms and policies of use are under development.
The concept of SZEconomy stems from a preceding research project, called Győr Industrial Area, in which the foundations of the GyőRIO regional input-output model of the city and its agglomeration was laid down.[5]
In SZEconomy the impact analyses are going to be accomplished at three terri-torial levels (Figure 2). In the SZEconomy model Győr Industrial Area will be level 1. Level 2 for Middle and West Danubia Region is a subject of future research and it needs an expansion of the GyőRIO. Level 3 is the whole country. GyőRIO and the updated national input-output tables will be the main data background and macroeconomic impact models for the SZEconomy portal.
[5] Koppány K. – Kovács N. – Szabó D. R. (2014): Város és vonzáskörzete: gazdasági kapcsolatrend-szer és növekedés. Vázlat a győri járműipari körzet regionális makromodelljének kidolgozásához. Tér és Társadalom, 2. 128–158., Koppány K. (2015a): First Calibrations of the Multiregional Input-Output Table of Győr and its agglomeration. In: Radek Kratochvíl – Jiří Vopava – Vladimír Douda (ed.): Proceedings of The 4th MAC 2015, Prague, 2015.02.20-2015.02.21.; Koppány K. (2015b): First Drafts for the Regional Macroeconomic Model of Győr and its Agglomeration. In: Karlovitz János Tibor (ed.): Some Current Issues in Economics, 2015. International Research Institute, Komárno. 319–334.

45
M ACROECONOMIC IMPACTS OF THE UNIVER SIT Y. . .
Figure 2: UICC economic impacts at different regional levels
Source: own figure.
WHY INPUT-OUTPUT ANALYSIS?
Because what UICC aims is exactly the catalysing of the input-output relations through the company value chains. Backward cumulative effects can originate from the endpoints; in this case they run through the whole value chain probably with greater effect, or somewhere from the middle.
Consider Figure 3 and a local original equipment manufacturer (OEM) company! This OEM produces final products for households, other companies, the government, or export markets. The question is what will happen if it can increase its sales regarding these final users. The overall macroeconomic effect, of course, depends on whether it crowds a local competitor out or not and whether domestic or foreign suppliers are involved or not. However, in any case, the chain-reaction goes through the whole supply chain.
Or, some steps back can be taken, assuming no final demand changes but structural variations. In both cases, we should analyse the input side of the company businesses, which is, in turn, the output side for some other agents.
What resources does a company need as inputs? First of all, labour force and human capital for which one of the regional suppliers is SZE itself. That’s why SZEmployment is defined as a module for the SZEconomy system. SZEmploy-ment is going to analyse the labour demand and the supply of the region, includ-ing SZE’s own course and graduate structure, thus it helps to harmonise the labour-force output of the university with its demand.
A company needs financial capital, as well. Micro models, that can help to assess the market and industry position, financial conditions, risks and creditwor-thiness of a firm, are also beyond the topic now.

46
K R ISZTIÁ N KOPPÁ NY
The financial capital turns into fixed real capital goods and these investments mean final demand changes for the project suppliers. Big investment projects are usually carried out with intercurrence, not in every single year. Now we focus on changes in the value chains that endure for several years, for example, a technol-ogy, and thus an intermediate input structure-change that an overall investment project can bring. Of course, modifications of materials and components, i.e. the intermediate goods, and their suppliers, can be made with other considerations in the background, for example, turning to a more competitive price, better quality, more flexible alternatives, and/or shifting from import to local suppliers.
Figure 3: Catalysing Input-Output Relations along Value Chains
Source: own figure.
Initial changes can occur in any suppliers’ tier. We are focusing on the multiplica-tion processes that can be made by them. The data for these analyses, albeit a bit obsolete but updatable, as we will see soon, is available in national aggregates, at a sector, industry and inter-industry level. We can simply assign the micro cate-gories to macroeconomic counterparts, as gross output, intermediate consump-tion, value-added, household consumption, investment, government spending, exports, and imports.
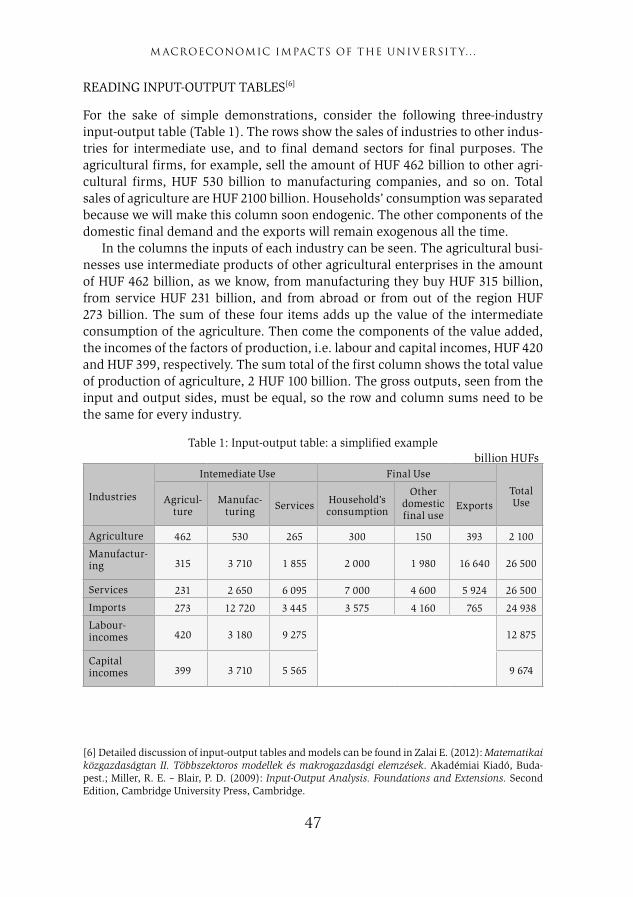
47
M ACROECONOMIC IMPACTS OF THE UNIVER SIT Y. . .
READING INPUT-OUTPUT TABLES[6]
For the sake of simple demonstrations, consider the following three-industry input-output table (Table 1). The rows show the sales of industries to other indus-tries for intermediate use, and to final demand sectors for final purposes. The agricultural firms, for example, sell the amount of HUF 462 billion to other agri-cultural firms, HUF 530 billion to manufacturing companies, and so on. Total sales of agriculture are HUF 2100 billion. Households’ consumption was separated because we will make this column soon endogenic. The other components of the domestic final demand and the exports will remain exogenous all the time.
In the columns the inputs of each industry can be seen. The agricultural busi-nesses use intermediate products of other agricultural enterprises in the amount of HUF 462 billion, as we know, from manufacturing they buy HUF 315 billion, from service HUF 231 billion, and from abroad or from out of the region HUF 273 billion. The sum of these four items adds up the value of the intermediate consumption of the agriculture. Then come the components of the value added, the incomes of the factors of production, i.e. labour and capital incomes, HUF 420 and HUF 399, respectively. The sum total of the first column shows the total value of production of agriculture, 2 HUF 100 billion. The gross outputs, seen from the input and output sides, must be equal, so the row and column sums need to be the same for every industry.
Table 1: Input-output table: a simplified example
Industries
Intemediate Use Final Use
Total UseAgricul-
tureManufac-
turing Services Household’s consumption
Other domestic final use
Exports
Agriculture 462 530 265 300 150 393 2 100
Manufactur-ing 315 3 710 1 855 2 000 1 980 16 640 26 500
Services 231 2 650 6 095 7 000 4 600 5 924 26 500
Imports 273 12 720 3 445 3 575 4 160 765 24 938
Labour-incomes 420 3 180 9 275 12 875
Capital incomes 399 3 710 5 565 9 674
[6] Detailed discussion of input-output tables and models can be found in Zalai E. (2012): Matematikai közgazdaságtan II. Többszektoros modellek és makrogazdasági elemzések. Akadémiai Kiadó, Buda-pest.; Miller, R. E. – Blair, P. D. (2009): Input-Output Analysis. Foundations and Extensions. Second Edition, Cambridge University Press, Cambridge.
billion HUFs
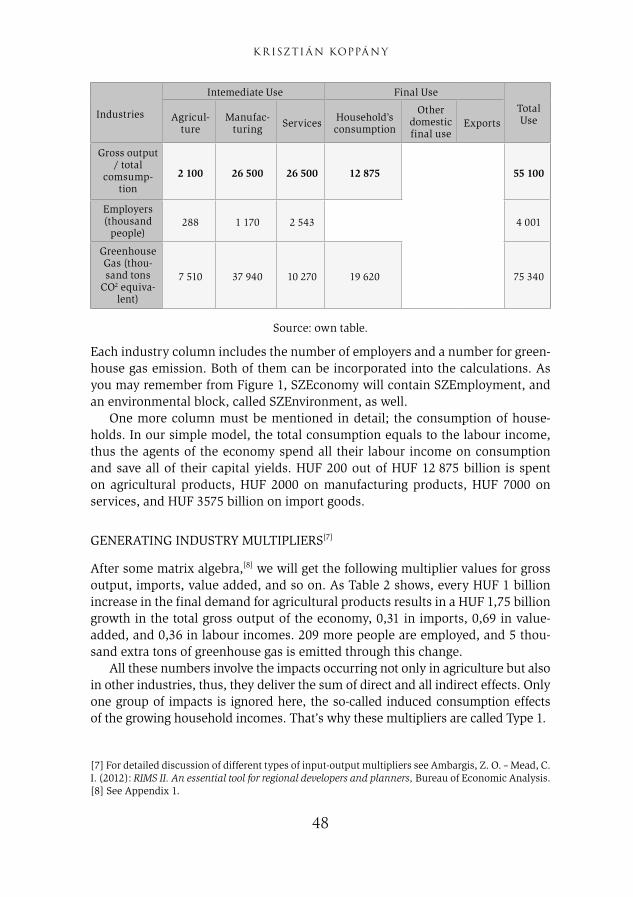
48
K R ISZTIÁ N KOPPÁ NY
Industries
Intemediate Use Final Use
Total UseAgricul-
tureManufac-
turing Services Household’s consumption
Other domestic final use
Exports
Gross output / total
comsump-tion
2 100 26 500 26 500 12 875 55 100
Employers (thousand
people)288 1 170 2 543 4 001
Greenhouse Gas (thou-sand tons
CO2 equiva-lent)
7 510 37 940 10 270 19 620 75 340
Source: own table.
Each industry column includes the number of employers and a number for green-house gas emission. Both of them can be incorporated into the calculations. As you may remember from Figure 1, SZEconomy will contain SZEmployment, and an environmental block, called SZEnvironment, as well.
One more column must be mentioned in detail; the consumption of house-holds. In our simple model, the total consumption equals to the labour income, thus the agents of the economy spend all their labour income on consumption and save all of their capital yields. HUF 200 out of HUF 12 875 billion is spent on agricultural products, HUF 2000 on manufacturing products, HUF 7000 on services, and HUF 3575 billion on import goods.
GENERATING INDUSTRY MULTIPLIERS[7]
After some matrix algebra,[8] we will get the following multiplier values for gross output, imports, value added, and so on. As Table 2 shows, every HUF 1 billion increase in the final demand for agricultural products results in a HUF 1,75 billion growth in the total gross output of the economy, 0,31 in imports, 0,69 in value-added, and 0,36 in labour incomes. 209 more people are employed, and 5 thou-sand extra tons of greenhouse gas is emitted through this change.
All these numbers involve the impacts occurring not only in agriculture but also in other industries, thus, they deliver the sum of direct and all indirect effects. Only one group of impacts is ignored here, the so-called induced consumption effects of the growing household incomes. That’s why these multipliers are called Type 1.
[7] For detailed discussion of different types of input-output multipliers see Ambargis, Z. O. – Mead, C. I. (2012): RIMS II. An essential tool for regional developers and planners, Bureau of Economic Analysis.[8] See Appendix 1.

49
M ACROECONOMIC IMPACTS OF THE UNIVER SIT Y. . .
Table 2: Type 1 final demand multipliers
Agriculture Manufacturing Services
Gross Output 1,75 1,37 1,45
Imports 0,31 0,59 0,23
Value Added 0,69 0,41 0,77
Household (Labour) Incomes 0,36 0,20 0,48
Employment (thousand people per billion HUF’s) 0,21 0,07 0,13
Greenhouse Gas (thousand tons per billion HUF’s) 5,05 1,87 0,74
Source: own calculations.
Table 3: Type 2 final demand and direct multipliers
Agriculture Manufacturing Services
Fin
al D
eman
d M
ult
ipli
ers
Gross Output 2,29 1,67 2,16
Industrial Imports 0,43 0,66 0,38
Value Added 0,95 0,55 1,11
Household (Labour) Incomes 0,52 0,29 0,68
Employment (thousand people per billion HUF’s) 0,57 0,74 0,57
Industrial Greenhouse Gas (thousand tons per billion HUF’s) 0,25 0,10 0,19
Total Greenhouse Gas (thousand tons per billion HUF’s) 6,26 2,55 2,33
Dir
ect M
ult
ipli
ers Household (Labour) Incomes
total (direct, indirect and induced) house-hold incomes impact of 1 HUF increase in labour incomes in the final demand industry
2,59 2,42 1,95
Employment the total change local jobs perchange in jobs in the final demand industry
1,86 2,21 2,03
Source: own calculations.

50
K R ISZTIÁ N KOPPÁ NY
Type 2 multipliers involve induced consumption of households as well. In Table 3, Type 2 values are somewhat higher than Type 1 counterparts for this reason.[9] One can find also four more rows in the Type 2 multiplier table. Two of them are for comprising not just industry but also household impacts of induced consump-tion on imports and carbon-dioxide emission. The others are direct multipliers of household incomes and employment.
How can these numbers be used to show the effects of the final demand change of a specific individual company on the whole national or regional economy? If we can say that the company that is under investigation is an average of its indus-try, we can use the numbers of Table 3 to multiply the final demand changes. If not, because of the fact that the average company in reality usually doesn’t exist, we can try to express individual company multipliers using financial report and survey data.
GENERATING AND USING COMPANY MULTIPLIERS FOR QUANTIFING FINAL DEMAND IMPACTS[10]
Now consider a very large manufacturing company with a HUF 1,800 billion total and HUF 1,500 billion export sales. These numbers can be picked out from the financial reports of the firm, however, the composition of the remaining, the mix of the domestic sales for the intermediate and final uses, as usual, is not available from these public sources. We can make a shift with the average industry shares, so as holds in the manufacturing industry, we assume that in the case of our company in the example, 3,2%, 37,6%, 18,8%, 20,3%, and 20,1% of its domestic output is for the intermediate use of the agriculture, manufacturing and services, for final household consumption, and for other final demand users, i.e., 10, 113, 56, 61 and HUF 60 billion, respectively (Table 4).
[9] For calculating Type 2 multipliers see Appendix 2.[10] For enterprise input-output models and multipliers see for example Tiebout, C.M. (1967): In-put-output and the firm: a technique for using national and regional tables. Review of Economics and Statistics, 49. 260–262.; Billings, R. B. – Katz, J. L. (1982): A technique to obtain accurate impact multipliers for individual firms by means of existing input-output models. Environment and Planning A, 14. 739–744. and Polenske, K.R. (1997): Linked system of enterprise, regional and national input-output accounts for policy analysis. In: M. Chatterji (ed.): Regional Science: Perspectives for the Future. Macmillan Press Ltd., Houndmills, Basingstoke. 26–42.

51
M ACROECONOMIC IMPACTS OF THE UNIVER SIT Y. . .
Table 4: Final demand impacts of a company with public company information: company sales and expenditures
Outputs Total Output
Sales for intermediate use to… Sales and output for final use to…
Agricul-ture
Manufac-turing Services Household’s
consumption
Other domestic final use
Exports
Company 1 800 10 113 56 61 60 1 500
Manufacturing 26 500 315 3 710 1 855 2 000 1 980 16 640
3,2% 37,6% 18,8% 20,3% 20,1%
Inputs Company Manufacturing
Agriculture 26 1,5% 530 2,7% 2,0%
Manufacturing 185 10,3% 3 710 18,9% 14,0%
Services 132 7,4% 2 650 13,5% 10,0%
Imports 636 35,3% 12 720 64,9% 48,0%
Total intermediate consumsption 980 54,4% 19 610 100,0% 74,0%
Labour incomes 340 18,9% 3 180 12,0%
Capital incomes 480 26,7% 3 710 14,0%
Gross output 1 800 100,0% 26 500 100,0%
Employers (thousand people) 10 1 170
Greenhouse Gas (thousand tons CO2 equivalent)
1 000 37 940
Source: own calculations.
We can replace the missing information in the same way on the input side as well, supposing that the purchase of our company from the agriculture, manufacturing, service, and import industries is, as in the whole manufacturing industry, 2,7%, 18,9%, 13,5%, and 64,9% of its total material cost, HUF 980 billion, i.e., 26, 185, 132, and 636 billion, respectively. The incomes, the gross output, the number of employers and greenhouse gas emission can be known from public reports.
In view of the individual data above, we can now separate our company from its industry, give it its own row and column in the input-output table (Table 5), and calculate its own multipliers (Table 6).
To demonstrate the use of multipliers for final demand change impact analyses, assume a 10% export growth rate for the company for next year. This growth is equal to HUF 150 billion final change of demand. Multiplying it by 0,74 gives a HUF 111 billion value added impact, which is a 0,49% growth of GDP in the whole economy.
billion HUFs

52
K R ISZTIÁ N KOPPÁ NY
Table 5: Final demand impacts of a company with public company information: separating company in the IO table
Inputs Intermediate Use Final Use Total Use
Company Company Agricul-ture
Manufac-turing Services
House-holds'
consump-tion
Other domestic final use
Exports
Agriculture 0 10 113 56 61 60 1 500 1 800
Manufacturing 26 462 504 265 300 150 393 2 100
Services 185 305 3 412 1 799 1 939 1 920 15 140 24 700
Imports 132 231 2 518 6 095 7 000 4 600 5 924 26 500
Total intermedi-ate consumsp-tion
636 273 12 084 3 445 3 575 4 160 765 24 938
Labour incomes 340 420 2 840 9 275 12 875
Capital incomes 480 399 3 230 5 565 9 674
Gross output 1 800 2 100 24 700 26 500 12 875 55 100
Employers (thousand people)
10 288 1 160 2 543 4 001
Greenhouse Gas (thousand tons CO2 equivalent)
1 000 7 510 36 940 10 270 19 620 75 340
Source: own calculations.
Table 6: Company final demand multipliers and impact analysis with public company information
Company Agriculture Manufacturing Services
Fin
al D
eman
d M
ult
ipli
ers
Gross Output 1,65 2,29 1,68 2,16
Industrial Imports 0,52 0,43 0,67 0,38
Value Added 0,74 0,94 0,54 1,11
Household (Labour) Incomes 0,36 0,52 0,29 0,68
Total Imports 0,62 0,57 0,75 0,57
Employment (thousand people per billion HUF's) 0,06 0,26 0,10 0,19
Industrial Greenhouse Gas (thousand tons per billion HUF's) 1,18 5,48 2,18 1,30
Total Greenhouse Gas (thousand tons per billion HUF's) 1,72 6,27 2,62 2,34
billion HUFs

53
M ACROECONOMIC IMPACTS OF THE UNIVER SIT Y. . .
Export growth rate 10%
Export (final demand) growth (billion HUFs) 150
Value added impact (billion HUFs) 111
Value added impact/growth rate 0,49%
Source: own calculations.
Having the option to get detailed and superior information through a survey, more precise distinctions can be made from the industry average output and input shares, and of course, more precise multiplier values and analytical results can be gained. The steps of the operations are the same as shown above.
ANALYSING STRUCTURAL CHANGES
Consider now the following two-company example to show the method of analys-ing a structural change in the upstream value chain of the former large company. Let it be company#1, which makes a HUF 200 billion shift from a foreign to a domestic supplier, company#2. They have had no purchaser-supplier relation before. Tables 7-8 show the changes from the aspect of the two companies. To produce more output, Company#2 needs more purchases from domestic and foreign companies, and more employers, as well. The post-change numbers are based on the operational and financial plans.
Table 7: Analysing structural changes with survey: a two-company example, company#1 sales and expenditures
Outputs Company#1 total output
Sales for intermediate use to… Sales and output for final use to…
Company#2 Agri-culture
Manu-factur-
ingServices
House-holds'
consump-tion
Other domes-tic final
use
Exports
Before 1 800 0 0 100 50 50 100 1 500
After 1 800 0 0 100 50 50 100 1 500
billion HUFs

54
K R ISZTIÁ N KOPPÁ NY
Inputs Before After
Company#2 0 200
Agriculture 80 80
Manufacturing 200 200
Services 100 100
Imports 600 400
Labour incomes 340 340
Capital incomes 480 480
Gross output 1 800 1 800
Employers (thousand people) 10 10
Greenhouse gas (thousand tons CO2 equivalent) 1000 1000
Source: own calculations.
Table 8: Analysing structural changes with survey: a two-company example, company#2 sales and expenditures
Outputs Company#2 total output
Sales for intermediate use to… Sales and output for final use to…
Company#1 Agri-culture
Manu-factur-
ingServices
House-holds'
consump-tion
Other domes-tic final
use
Exports
Before 270 0 50 150 10 10 20 30
After 470 200 50 150 10 10 20 30
Inputs Before After
Company#1 0 0
Agriculture 25 44
Manufacturing 70 125
Services 50 85
Imports 70 120
Labour incomes 45 77
Capital incomes 10 19
Gross output 270 470
Employers (thousand people) 1,4 2,05
Greenhouse gas (thousand tons CO2 equivalent) 110 167,15
Source: own calculations.
Table 9 represents the initial economy status before the structural changes with the two separated and highlighted firms and the input-output tables after the shift.
billion HUFs

55
M ACROECONOMIC IMPACTS OF THE UNIVER SIT Y. . .
Table 9: Analysing structural changes with survey: a two-company example, IO tables
Before Structural Changes
Industries
Intermediate Use Final Use
Total UseCompany
#1Company
#2Agricul-
ture
Manu-factur-
ingServices
House-holds'
consump-tion
Other domes-tic final
use
Exports
Company#1 0 0 0 100 50 50 100 1 500 1 800
Company#2 0 0 50 150 10 10 20 30 270
Agriculture 80 25 462 425 265 300 150 393 2 100
Manufacturing 200 70 265 3 190 1 795 1 940 1 860 15 110 24 430
Services 100 50 231 2 500 6 095 7 000 4 600 5 924 26 500
Imports 600 70 273 12 050 3 445 3 575 4 160 765 24 938
Labour incomes 340 45 420 2 795 9 275 12 875
Capital incomes 480 10 399 3 220 5 565 9 674
Gross output / total consump-tion
1 800 270 2 100 24 430 26 500 12 875 55 100
Employers (thousand people)
10,0 1,4 288,0 1 158,6 2 543,0 4 001,0
Greenhouse gas (thousand tons CO2 equivalent)
1 000 110 7 510 36 830 10 270 19 620 75 340
billion HUFs

56
K R ISZTIÁ N KOPPÁ NY
After Structural Changes, Default Position
Industries
Intermediate Use Final Use
Total UseCompany
#1Company
#2Agricul-
ture
Manu-factur-
ingServices
House-holds'
consump-tion
Other domes-tic final
use
Exports
Company#1 0 0 0 100 50 50 100 1 500 1 800
Company#2 200 0 50 150 10 10 20 30 470
Agriculture 80 44 462 425 265 300 150 393 2 119
Manufacturing 200 125 265 3 190 1 795 1 940 1 860 15 110 24 485
Services 100 85 231 2 500 6 095 7 000 4 600 5 924 26 535
Imports 400 120 273 12 050 3 445 3 575 4 160 765 24 788
Labour incomes 340 77 420 2 795 9 275 12 907
Capital incomes 480 19 399 3 220 5 565 9 683
Gross output / total consump-tion
1 800 470 2 100 24 430 26 500 12 875 55 300
Employers (thousand people)
10,0 2,1 288,0 1 158,6 2 543,0 4 001,7
Greenhouse gas (thousand tons CO2 equivalent)
1 000,0 167,2 7 510,0 36 830,0 10 270,0 19 620,0 75 397,2
billion HUFs

57
M ACROECONOMIC IMPACTS OF THE UNIVER SIT Y. . .
Final Table
Industries
Intermediate Use Final Use
Total UseCompany
#1Company
#2Agricul-
ture
Manu-factur-
ingServices
House-holds'
consump-tion
Other domes-tic final
use
Exports
Company#1 0 0 0 100 50 50 100 1 500 1 801
Company#2 200 0 51 151 10 10 20 30 472
Agriculture 80 44 469 427 266 302 150 393 2 131
Manufacturing 200 125 269 3 202 1 804 1 954 1 860 15 110 24 525
Services 100 85 234 2 510 6 125 7 052 4 600 5 924 26 630
Imports 400 120 277 12 097 3 462 3 601 4 160 765 24 883
Labour incomes 340 77 426 2 806 9 321 12 970
Capital incomes 480 19 405 3 233 5 592 9 729
Gross output / total consump-tion
1 801 472 2 131 24 525 26 630 12 970 55 559
Employers (thousand people)
10,0 2,1 292,3 1 163,1 2 555,5 4 022,9
Greenhouse gas (thousand tons CO2 equivalent)
1 000,5 167,7 7 621,6 36 973,2 10 320,4 19 764,6 75 848,0
Source: own calculations.
After accounting the modified sales and purchase values for our two directly concerned agents, first we suppose no changes implicated in the remaining parts of the economy. This assumption, of course, must be resolved. Since our compa-nies have relations to other firms and industries, too, the changes between them must have an effect on third parties. This is also reflected by the inequalities of the row and column sums for the three industries. Further alignments must occur to equilibrate the economy, which have repercussions to Company#1 and #2. After several iterations, the final equilibrium table, which can be generated by the standard input-output methods,[11] shows a slight increase in the production of Company#1’s and Company#2, too.
[11] See Appendix 3.

58
K R ISZTIÁ N KOPPÁ NY
As a result of the above changes, the value added of the whole economy rises from HUF 22,549 to 22,699 billion, thus by 0,67%. If we would like to get to the bottom of the causes, by performing a variance analysis and drawing a waterfall chart (Figure 5) we could realize that
• replacing Company#1’s imports with Company#2’s product increases value added by 200 billion HUFs;
• expanding Company#2’s production needs HUF 50 billion more imports, which is a negative factor to GDP growth;
• increasing imports of all upstream links to Company#2’s value chains deliver also a negative partial effect of 65 billion;
• endogenous household incomes and consumption give a HUF 95 billion rise; and finally
• import content of increased consumption decreases value added by HUF 26 billion.
Figure 4: Components of change in value added (billion HUFs)
Source: own calculations.
BEYOND THE EXAMPLES
The examples presented here describe the main points of a macro or a regional economic impact analysis. For real cases, of course, an actual and more detailed database is needed. In the SZEconomy model, at national level, updated versions of official input-output tables of Hungarian Statistical Office will be used.[12] At the regional level, GyőRIO[13] will provide the basis for the calculation.
[12] Koppány (2016): op. cit.[13] Koppány (2015a): op. cit., Koppány (2015b): op. cit.

59
M ACROECONOMIC IMPACTS OF THE UNIVER SIT Y. . .
GyőRIO now is a full non-survey regional input-output table of Győr and its agglomeration, assembled for the year 2010, detailed in 20 industries. In the SZEconomy both national and regional tables will be constantly updated and balanced by company survey data.[14] This way we can get a good hybrid database and model depicting a more realistic current state of the regional economy and impacts that can evolve in it.
The applications can cover not only the assessing impacts of the final demand and the structural changes of industries and individual companies, but also select-ing key industries for UICC, continuous monitoring of regional industry portfolio by assessing its expected growth, risks, shock resistance, and so on.
REFERENCES
• Ambargis, Z. O. – Mead, C. I. (2012): RIMS II. An essential tool for regional developers and planners, Bureau of Economic Analysis.• Billings, R. B. –Katz, J. L. (1982): A technique to obtain accurate impact multipliers for individual firms by means of existing input-output models. Environment and Planning A, 14. 739–744.• Dusek T. – Koppány K. – Kovács N. – Szabó D. R. (2015): A győri járműipari körzet hozzáadott értékének becslése. Területi Statisztika, 1. 76–87.• Koppány K. – Hajba T. (2015): Hibrid regionális input-output modellek kiegyensúlyo-zási problémái: Lehetséges megoldások a GyőRIO modellben. XXXI. Magyar Operációku-tatási Konferencia, Cegléd, Magyarország, 2015.06.10-2015.06.12., 51.• Koppány K. – Kovács N. – Szabó D. R. (2014): Város és vonzáskörzete: gazdasági kapcso-latrendszer és növekedés. Vázlat a győri járműipari körzet regionális makromodelljének kidolgozásához. Tér és Társadalom, 2. 128–158.• Koppány K. (2015a): First Calibrations of the Multiregional Input-Output Table of Győr and its agglomeration. In: Radek Kratochvíl – Jiří Vopava – Vladimír Douda (ed.): Proceedings of The 4th MAC 2015, Prague, 2015.02.20-2015.02.21.• Koppány K. (2015b): First Drafts for the Regional Macroeconomic Model of Győr and its Agglomeration. In: Karlovitz János Tibor (ed.): Some Current Issues in Economics, 2015. International Research Institute, Komárno. 319–334.• Koppány K. (2016): Magyarország feldolgozóipari exportteljesítményéből és ágazati szerkezetéből fakadó növekedési lehetőségei és kockázatai 2010–2014. Közgazdasági Szemle, forthcoming.• Miller, R. E. – Blair, P. D. (2009): Input-Output Analysis. Foundations and Extensions. Second Edition, Cambridge University Press, Cambridge.• Polenske, K.R. (1997): Linked system of enterprise, regional and national input-output accounts for policy analysis. In: M. Chatterji (ed.): Regional Science: Perspectives for the Future. Macmillan Press Ltd., Houndmills, Basingstoke. 26–42.• Tiebout, C.M. (1967): Input-output and the firm: a technique for using national and regional tables. Review of Economics and Statistics, 49. 260–262.
[14] Koppány K. – Hajba T. (2015): Hibrid regionális input-output modellek kiegyensúlyozási problé-mái: Lehetséges megoldások a GyőRIO modellben. XXXI. Magyar Operációkutatási Konferencia, Cegléd, Magyarország, 2015.06.10-2015.06.12., 51.

60
K R ISZTIÁ N KOPPÁ NY
• Zalai E. (2012): Matematikai közgazdaságtan II. Többszektoros modellek és makrogaz-dasági elemzések. Akadémiai Kiadó, Budapest.
HUNGARIAN SUMMARY
Győr egyike azoknak az egyetemi városainknak, ahol a következő években Felsőoktatási és Ipari Együttműködési Központot (FIEK) hozhatnak létre. A FIEK lehetővé teszi, hogy a Széchenyi István Egyetem kiteljesítse térségi hub és gazdasági katalizátor szerepét. A helyi szereplők támogatása vevő-beszál-lító kapcsolataik kialakításában, értékláncaik összefűzésében és együttműkö-désük elmélyítésében az input-output relációk katalizálását jelenti. Az input-output táblákon alapuló elemzési módszerek hatékony eszközöket biztosítanak a potenciális hatások elemzéséhez. Ez a tanulmány néhány példát mutat arra, hogy miként juthatunk az ágazati aggregátumok egyedi vállalati adatokkal való kiegészítésével még pontosabb eredményekhez. A FIEK program szerves részét képező SZEconomy portál kidolgozásakor ilyen hibrid technikák alkal-mazását tervezzük. A SZEconomy nem egyetlen modell, hanem egymással összehangolt és összekapcsolt makro- és mikro-modellek komplex együttese, a Széchenyi István Egyetem és a FIEK gazdaságelemző, előrejelző, tervező és monitoring rendszere. A tervezett kutatási-szolgáltatási infrastruktúra fejlesz-tés lehetséges országos szintű gazdasági hatásait a Központi Statisztikai Hiva-tal aktualizált input-output tábláival, a térségieket pedig a győri ipari körzetre kidolgozott GyőRIO regionális modellel igyekszünk számszerűsíteni, amelynek a FIEK hatáselemzés jelenti az első és várhatóan a jövőben is elsődleges gyakor-lati alkalmazását.

61
M ACROECONOMIC IMPACTS OF THE UNIVER SIT Y. . .

62
K R ISZTIÁ N KOPPÁ NY

ECONOMY

64
GYÖRGY SZRETYKÓ[1] – ATTILA MÉSZÁROS[2]
The measurement of the GDP and the well-being of the people
’The air pollution activity, cigarette advertisements, deforestation and the sacrificing of natural wonders for
growth is included in the GDP as a value. While our children’s health, the quality of our education or the joy that is caused
by playing with their parents is not. Moreover, GDP is not increased by the beauty of our poetry and the power of
marriages. To cut the whole thing short, GDP considers everything but the important things in life.’
Robert Kennedy, 1968.
The subjects of this essay are definition, limits and critique of GDP. At the same time it presents the reasons and goals of creating of Stiglitz Committee, sketches 12 suggestions developed by the Committee. Among the alternative indexes elaborated for measurement of GDP, this essay gives detailed analyses of Better Life Index (BLI) and Human Development Index (HDI). Regarding welfare and sustainable development realised at the same time, the essay analyses the practice of Bhutan Kingdom and initiative of Germany. It concludes that the suggestions of the Stiglitz Committee are very correct and well-established, but every document is worth as much as it realised in practice.
HYPOTHESIS
In the Transatlantic/Western world and the countries influenced by it a usury civilization[3] and a phantom economy[4] has come into existence that lacks an economic and financial basis. The international financial world and its controling
[1] Széchenyi István University, habil. Associate Professor, Head of Department ([email protected]).[2] Széchenyi István University, Associate Professor, ([email protected]).[3] Drábik János (2002): Uzsoracivilizáció. A kamatkapitalizmus új világrendje. Gold Book Kft., Debrecen. [4] Korten C. D. (2009): Gyilkos vagy humánus gazdaság? Kairosz Kiadó, Budapest.

65
THE MEASUR EMENT OF THE GDP . . .
elite, the international financial oligarchy has tried to overcome all the barriers to make the resource pump work at the highest level possible. Thus it has made effort to make the states, the national cultures, religions and the different civil organizations and communities weaker. Basically, it needs two types of people: the executives, and on the other hand, the cheap workforce, the consumers or the so-called helots (outlawed slaves). So Western civilization has been based on individualism in the last 30 years which is expressed by the satisfaction of the instincts, the personal level consumption and the omnipotence of the individual advocacy.
This model of capitalism was based on the market fundamentalism which – without control – is known to be very harmful to the economy of the natural and human resources. Nowadays this neoliberal world system is about to be broken up.
As a result of the present activity of the global money-imperium social inequal-ity has come into existence and it is reproduced, on the one hand among the differently developed countries, on the other hand, inside the countries. One of the consequences of this money-oriented system is that ’20% of the people living in the developed industrial countries consume 86% of the world’s resources, while the other inhabitants can only consume the remaining 14%’.[5] Moreover, the number of people living in poverty and social exclusion is on the rise which generates the intensification of economic, ethnic and social conflicts. In connec-tion with these things we should highlight the speech of Pope Francis delivered on 9 July 2015 in Santa Cruz at the World Meeting of Folk Movements where he presented his thoughts on the critical position of our Earth, its basic causes and the things to be done urgently. During his speech the Head of the Catholic Church emphasized that a basic systematic change is needed in the whole world. ’A posi-tive change that focuses on the life and the service of human communities as opposed to the profit-oriented processes’.[6]
Pope Francis stated that there are three main tasks to ease and solve global problems:• We have to put economy at the disposal of people. To achieve this, he
suggests that workers and farmers should set up cooperations and economic associations.
• We need to unify people on the way to peace and justice.• The protection of our Mother Earth.[7]
I consider these thoughts to be essential to be able to interpret the discussions in connection with GDP and social development and put them in wider economic correlations.
[5] Drábik (2002): op. cit. 18.[6] Ferenc pápa teljes bolíviai beszéde most először magyarul. http://greenpeace.blog.hu/2015/07/28/.[7] Op. cit.

66
GYÖRGY SZR ET YKÓ – ATTIL A MÉSZ ÁROS
THE DEFINTION, LIMITS AND CRITICISM OF THE GDP
The notion of gross domestic product (GDP-Gross Domestic Product) as an indi-cator came into existence during the global economic crisis in 1930. In economics GDP is the value of products and services produced in a certain area (a country) during a certain period which can be used in the economy.
We can conclude that GDP=the consumption of households + investment + the consumption of the public sector + (export-import).
This indicator, in spite of the fact that this is one of the the key notions of main-stream economics, is not perfect. It is suitable for the measurement of economic production, but it does not pay attention to several important factors.
In the domestic and international specialized literature the following statements are identified the as regards the limits and criticism of the GDP:
• The increase of the GDP is not equal with the increase of the well-being as to achieve it we need a suitable economic and social policy.
• It does not measure sustainability.• The income generated by black economy is left out from the official accounts.
The value of the GDP is then identified by estimations.• It does not pay attention to household activities such as child-rearing or care
of the elderly which are important from the economic point view as well.• The evaluation of non-market activities and their inclusion in the GDP is
complicated. (for example: police or home defense activities). It is not suitable to measure the inequality of people.
• It does not take notice of the negative effects of natural harm (environment pollution, the destruction of people’s health).
• It does not take several factors into account that influence the well-being of the society (health, economic safety, the quality of social relationships).
THE AIM AND RECOMMENDATIONS OF THE STIGLITZ – COMMITTEE
In February 2008 the President of the Republic in France, Nicholas Sárközy asked 3 Nobel prize winning economists (Joseph Stiglitz, Amartya Sen and Jean-Paul Fitoussi) to form a committee that was later called ’The Economic Production and Social Development Measurement Comittee’. The Stiglitz-Committee not only included the above mentioned economists but sociologists as well, whose expertise went together very well. The committee set up three work teams which researched the following topics: classical questions in connection with the GDP, the quality of life and sustainability. The aim of the Committee is to measure the limits of the GDP and analyse the alternative measurement methods.

67
THE MEASUR EMENT OF THE GDP . . .
The key message of the Stiglitz report is the following: the time has come to put the emphasis from the measurement of the economic productivity on the measurement of people’s well-being. The measurement of well-being needs to be examined in correlation with sustainability.[8]
The committee has made up the following 12 suggestions:[9]
• During the evaluation of financial well-being the income and consumption should be in the focal point instead of production.
• Emphasizing the point of view of the households.• Income and consumption should be examined together with the assets. • Greater emphasis should be placed on the division of income, consumption
and the assets.• The measurement of income should cover the non-market activities.• People’s quality of living depend on their objective circumstances and abilities.
Steps should be taken to make the measurements of their health, personal activities and environmental circumstances better. We need to make effort to develop and carry out reliable measurement methods which aim at social relationships, political representation and insecurity as they are proved to influence the satisfaction with life. The indicators describing the quality of living need to evaluate inequality at all fields.
• The measurements need to be planned to be able to recognize the relationships between the life quality fields of all the people and this information needs to be used to plan the different strategies related to the different life fields.
• The statistical offices should provide the information which is needed to be able to connect each dimension of life quality, so they can create different indexes.
• The objective and subjective measurement of well-being provides key information of people’s quality of life. The statistical offices need to include questions in their polls which help define people’s life evaluation, experiences in connection with happiness and their priorities as well.
• We need a well-defined indicator system to evaluate sustainability. The items of the system need a characteristic so that we can interpret them as the variables of the described ’principal’. The financial index of sustainability has its own place in the system, but according to the latest approaches it should basically concentrate on the economic viewpoints of sustainability.
• The environmental viewpoints of sustainability should be followed separately, therefore well-selected physical indicators are necessary. We especially need a clear indicator which refers to the proximity of the dangerous level of environmental pollution. (eg. it is related to climate change or the decrease of fish stock).
[8] Stiglitz, E. J. – Sen, A. – Fitoussi, J. (2010): A bizottság jelentése a gazdasági teljesítmény és a tár-sadalmi fejlődés méréséről. Statisztikai Szemle, 3.[9] Stiglitz – Sen – Fitoussi (2010): op. cit. 312–320.

68
GYÖRGY SZR ET YKÓ – ATTIL A MÉSZ ÁROS
The document emphasizes that we would need data collection which helps deci-sion makers and politicians to find the right way forward. So after the workout of the recommendations of the Stiglitz Committee the European Community Committee published the statement entitled ’Hence and forth the GDP. The meas-urement of progress in our changing world’ on 20 August 2009 for the Council and the European Parliament. In this document the Committee of the European Communitites has defined the realisation of the following five arrangements:[10]
• The completion of the GDP with environmental and social indicators.• Real time information for decision making.• More precise report on the social division of possessions and inequalities. • The workout of the European sustainable developmental scoreboard.• The expansion of national bills to environmental and social questions.
ALTERNATIVE INDICATORS TO MEASURE THE GDP
In international and domestic specialized literature according to the authors there are seven alternative indicators to measure well-being and sustainability. These are the following: the Human Development Index (HDI), the Gender Inequality Index (GII), the Multiple Poverty Index (MPI), the Environmental Performance Index (EPI), the Climate Change Protection Index (CCPI), the Ecological Foot-print (EFP), and the Happy Planet Index (HPI).[11] Researchers apply other indexes apart from the above mentioned ones. As GDP cannot be the one and only index of social well-being, I am going to introduce two alternative indexes which can be used to supplement the GDP.
Better Life Index
The BLI index shows the quality of life and well-being in a way that it considers several dimensions. This index could be one of the supplementary indexes of the GDP, although it was thought to be one of the alternatives of the GDP. It correlates with the extent of the GDP, but it is bigger, and it measures the most important things in life. It is not easy to interpret, but it summarises 26 indexes from 11 dimensions. These dimensions are the following:
• flat or house• income • job• community• education• health
[10] A GDP-n innen és túl. A haladás mérése változó világunkban (2010). Statisztikai Szemle, 3. 4–11.[11] Szigeti Cecília (2012): Alternatív mutatók, jólét és fenntarthatóság Magyarországon. Polgári Szemle, 3-6.

69
THE MEASUR EMENT OF THE GDP . . .
• safety• satisfaction• environment• social participation (the participation in elections, the extent of social
consultation built in legislation and the transparency of processes) • work-life balance (it is measured by the method of timescale, where the
number of people doing overtime and having freetime is measured)
Apart from the above mentioned things there is the employment rate, the extent of salaries, the level of education, the results of the PISA test measuring different skills, the number of suicides, the air pollution, and the water quality. The OECD considers all the dimensions equally important in its research.[12]
Human Development Index
This index was worked out by Mahbub ul Haq a Pakistani economist in 1990 and the UN has been using it for two decades to compare the countries of the world. The advantage of the HDI is that it can separate the differently developed coun-tries. On the other hand, it can measure the effect of the economic policy on the quality of life.
There are three important parts of the HDI index:
• It approaches the long healthy life with the use of the average life expectancy.• The next component is the knowledge acquired in the education which is
measured by the use of two variables. The first variable is the writing-reading skill of people above 15 which makes up two-thirds of the whole sum, the second one is the combined educational rate, the total index of the primary-secondary and tertiary education which makes up one-third of the whole.
• The third component is the standard of living which is counted by the GDP based on purchasing power parity, expressed in per capita terms.[13]
In addition, we can use the data provided by the Eurostat and the KSH, the indica-tors of sustainable development, the results of the empiric research done by the method of timescale, and the publications dealing with income inequality and the demographic situation. We can state that the initiatives made to introduce alterna-tive indexes are most useful because of the change of their viewpoint. Of course, we cannot neglect the GDP, but we have to use it together with other indexes.
[12] Mérjük a jobb életet! Elérhető: lelkesen.wordpress.com 2012.[13] Wikipedia.org. 2015.

70
GYÖRGY SZR ET YKÓ – ATTIL A MÉSZ ÁROS
POSITIVE PRACTICES AND INITIATIVES
Several countries have made an effort to realize well-being and sustainable devel-opment at the same time, but with more or less success. From these countries, I am going to present the practices used by the Bhutan Kingdom and the initiatives of Germany.
Bhutan Kingdom
Bhutan is a distant country situated between the ranges of the Himalayas with a poulation of about 1,5 million. Looking at the average of the world the inhabit-ants of this country are one of the poorest. In spite of this fact,they are not aware of starvation, there is no unemployment, no beggars and no crime at all. 95% of the Bhutanese are farmers and live by agriculture. Bhutanese people try to keep away from wealth as they know that money could destroy their cultural tradi-tions. Money is used in this country as well, but most of the business is done by exchange and barter.[14]
While in the Western part of the world economic growth, the GDP and profit is considered to be essential, King Dzsigme Keszar Namgjel Vangcsuk made his country accept in the constitution that 60% of the country must be covered by forests and it is forbidden to hunt for animals. Being the first in the world, the Bhutan Kingdom introduced the Gross National Happiness Index in 1972. The Buddhist spirited GNH means the real welfare if the material and spiritual devel-opment go together or complete each other. Starting from all these things we can state that GNH is based on four facts: sustainable development, preserving cultural values and natural resources and the appropriate governance. It means that it does not want to measure human welfare directly, but it wants to grab the factors leading to it with quantitative instruments.[15]
Germany
According to a study published in 2013 a new method will be introduced in Germany, too, which can examine the welfare conditions of the population more thoroughly than the GDP. The method was elaborated in two years by a parlia-mentary committee containing politicians and expert measuring the well-being of the German population based on three dimensions and ten indicators. Accord-ing to the opinion of this committee the GDP does not provide us with a detailed picture of the situation of the inhabitants, thus we need to include financial, social and ecological viewpoints in the examination.
[14] Palmer, J. (1998): Világjárók lexikona. Reader’s Digest Kiadó Kft., Budapest. 93.[15] GDP kontra Bruttó Nemzeti Boldogság http://index.hu/gazdaság/vilag/2009/10/29/gdp-fixacis helyett boldog bolygó.
71
THE MEASUR EMENT OF THE GDP . . .
The first dimension is called financial welfare where we need to examine not only the GDP but the national debt as well as it shows the clearing of the state. Furthermore, the distribution of the income is analysed. As a result, the changes of the social stratification based on financial situation become obvious.
Four indicators belong to the category called ’society and participation’. The first one is the employment rate which gives us the opportunity to compare coun-tries at an international level with its single calculations. The second one is the average life expectancy which shows the health situation. The third one is the rate of people with higher education qualifications representing the educational level of the society. The fourth one is the so-called ’freedom of speech’ and account-ability indicator that examines the situation of the state based on the tranparency level of the state operation and political freedom. In the third, so-called ecological dimension the welfare of the population is characterised by three indicators. One of the indicators is the number of useful bird species living in the country, the second one being the carbon-dioxide and the third one the nitrogen-emission. The indicator shows the condition of the natural environment based on the above mentioned things.[16]
They expected the procedure to represent the changing situation of the popula-tion and starting from 2014 have carried out the research annually. To sum up, we can state that the recommendations of the Stiglitz-Committee are professionally correct and valid and they can intend positive changes for the future. At the same time, based on historical experience, we are aware of the fact that every document is worthwhile in practice. However, it seems to be unsure that the international money imperium will make it possible to realise these helpful recommendations in practice. Thus the words of Pope Francis about the protection of our Mother Earth, the fight against social exclusion and poverty and the cooperation from down under are most relevant nowadays.
REFERENCES
• A GDP helyett új mérőszámot találtak ki Németországban. http://hvg.hu/gazda-ság/2013 0128 Downloaded: 19.06.2013.• A GDP-n innen és túl. A haladás mérése változó világunkban (2010): Statisztikai Szemle, 3.• Bhután. Világjárók lexikon. (ed.: Kulcsár Zsuzsanna) (2003): Reader’s Diges Kiadó Kft., Budapest.• Csath Magdolna (2010): A társadalmi fejlődést is mérni kell. Magyar Nemzet, szept-ember 6.• Drábik János (2002): Uzsoracivilizáció. A kamatkapitalizmus új világrendje. Gold Book Kft., Debrecen• Emberi fejlettségi index http://hu.wikipedia.org./viki/ Downloaded: 23.08.2015.
[16] A GDP helyett új mérőszámot találtak ki Németországban. http://hvg.hu/gazdaság/2013 0128.

72
GYÖRGY SZR ET YKÓ – ATTIL A MÉSZ ÁROS
• Ferenc pápa teljes bolíviai beszéde most először magyarul. http://greenpeace.blog.hu/2015/07/28/ Downloaded: 05.08.2015.• GDP kontra Bruttó Nemzeti Boldogság http://index.hu/gazdaság/vilag/2009/10/29/gdp-fixacis helyett boldog bolygó index. Downloaded: 19.06.2013.• Gore, A. (1993): Mérlegen a Föld. Ökológia és az emberi lélek. Föld Napja Alapítvány, Budapest.• Korten, C. D. (1996): Tőkés társaságok világuralma. Kapu Kiadó, Budapest.• Korten, C. D. (2009): Gyilkos vagy humánus gazdaság? Kairosz Kiadó, Budapest.• Merjünk jobb életet! Better Life Index és a GDP. http://lelkesen.word press.com /2012/12/09/ Downloaded: 19.06.2013.• Perkins J. (2006): Egy gazdasági bérgyilkos vallomásai. Ráció Kiadó, Budapest.• Stiglitz, E. J. – Sen, A. – Fitoussi, J. (2010): A bizottság jelentése a gazdasági teljesítmény és a társadalmi fejlődés méréséről. Statisztikai Szemle, 3.• Szigeti Cecília (2012): Alternatív mutatók, jólét és fenntarthatóság Magyarországon. Polgári Szemle, 3-6.
HUNGARIAN SUMMARY
A nemzetközi és a magyar szakirodalomban vita folyik arról, hogy mit mér, illetve mit nem mér a GDP. Több kutató arra a következtetésre jutott, hogy a GDP mindent figyelembe vesz, csak azt nem, ami az emberek számára fontos. Mind-ezekből kiindulva a tanulmány vizsgálja a GDP fogalmát, korlátait és kritikáit, egyúttal bemutatja a Stiglitz-bizottság létrehozásának okait, céljait és a bizottság által kidolgozott tizenkét ajánlást. A GDP mérésére kidolgozott alternatív mutatók közül részletesen elemzi a Better Life Indexet (BLI) és a Humán Development Indexet (HDI). A jóllét és a fenntartható fejlődés egy időben történő megvaló-sításával kapcsolatban vizsgálja a Bhutáni Királyság gyakorlatát és Németország kezdeményezését. A tanulmány konklúzuiója az, hogy a Stiglitz-bizottság aján-lásai szakmailag nagyon korrektek és megalapozottak, de minden dokumentum annyit ér, amennyit abból a gyakorlatban megvalósítanak.

73
PETRA PLATZ[1]
Reflections on the role of internal environment in the preference system construction
The issues of the preference system stability appear in various fields of science: microeconomics places it under the utility theories, behaviourism discusses it as part of the irrational human behaviour, while psychology considers the consumer preferences as our projection. As all the aspects focus on a common topic, on the consumer preference system, there should be an overall concept of the preference system itself, which defines its structure, elements and the interrelations between its parts. Based on numerous scientific approaches – psychological, social, and economic, as it was mentioned before – the preference system is internal, and it is revealed in the choices. The latest trend made those findings popular, which put an emphasize on the determining role of the current external circumstances. In order to gain real insight, researchers shall balance the weights between the inter-nal and external environment, because normally the preference system is built as a result of an interaction between the internal and the external environment. The question is: which elements of these environments are involved?
PREVIOUS FINDINGS IN CONSUMER PREFERENCE CONSTRUCION
The issues of consumer preferences appear in various fields of science: microeco-nomics places them under the utility theories, behaviourism discusses it as part of the irrational human behaviour, and psychology considers the consumer prefer-ences as our projection. All the theories about the preference systems are reason-able, meaning that they all focus on its special feature. However, the discrepan-cies of the consumer preference systems appear in the methodological relations first: in the questions of their measurement. Nowadays, the common scientific view regarding the preference system is that humans in decision situations cannot always, or cannot fully reveal their real internal preferences. According to Amar-tya Sen (1973)[2] the result of the purchase decision, the choice itself is a hard piece of information, which is suitable for observation, but it is weak as an
[1] Széchenyi István University, assistant professor ([email protected]).
[2] Sen, A. (1973): Behaviour and the concept of preference. Economica, New Series, 40(159). 241–259.

74
PETR A PL ATZ
explanatory variable. He suggests that in order to gain real insight researchers shall put emphasis on the process prior to the choice made: how exactly the pref-erence system will be built. Sen criticized the economic approach saying that it lacks the consideration of the circumstances. I agree with this statement; however, I interpret it as if the formation of the preference system was influenced by inter-nal and external factors. This complexity determines the preference system and the choice itself as well.
In my concept, the choice is an extrapolation based on the current optimum of the internal and external factors. These internal and external factors can be classified as constant and inconstant, important and unimportant factors in each group. The interrelation between those factors defines the choice pattern. The analysis and the classification of these factors are problematic. Till now, the action was the only empirically testable variable. Unfortunately, in an economic sense, when a consumer defines that he prefers x to y, it often happens that he does choose y to x. This confrontation refers to the dominance of an internal preference system, which was not revealed or could not be revealed in this current shopping situation. (This pattern often leads to post-purchase disappointment.) The next challenge of science is to go deeper in order to understand the logic and later to estimate the expected behaviour in a certain purchase situation.
There were already theoretical experiments to explain this hidden mechanism. Samuelson (1938)[3] suggests keeping the basis of the economic modelling on the revealed preference. He and his followers believe that rationality is a subjective, but consistent system: it can be reasonable for others if the observers are emphatic enough. When fitting the prior description to Samuelson’s statement, we can see that the prior description details a part of Samuelson’s logic: as he concedes that the consumers are rational and different at the same time, the description refers to the different patterns, according to the interrelations of the internal and external, constant and inconstant, important and unimportant factors. This variance hides behind the different optimums, if we accept the optimum as one consumer’s optimum, instead of an economic optimum. This requires suitable measurement, evaluation and forecast techniques instead of the pure economic – statistical models. If we still experience discrepancies between the internal and the revealed preference systems, we need to go back to Sen’s theory, which says humans cannot always optimize, neither in an individual nor in an economic way. Maybe the reason for that can be found with the help of this new model: the detailed analysis would show the weak links between those internal and external factors, which cannot be reconciled with one another. However, Sen and Samuel-son emphasize different parts of the same process (formation or preparation and output) they both talk about the same issue: the unexpected consumer behaviour.
[3] Samuelson, P. A. (1938): ‘A Note on the Pure Theory of Consumer’s Behaviour’. Economica, 5. 61–71.

75
R EFLECTIONS ON THE ROLE OF INTER NAL ENVIRONMENT. . .
My individual conjecture is that in some cases the decision cannot be articu-lated at once. I believe that if we want to take an action (choose, answer, etc.) first we need to formulate the action for ourselves. That is why I would divide the purchase decisions into two styles, according to the literature: core cogni-tive processes and regulatory decision processes.[4] The core cognitive processes are activated in making decisions while the regulatory decision processes are concerned with choice regulation. As regulatory decision processes are habitual, they might be suitable for the analysis, from the behaviourists’ aspect, where the main question is to identify the right ratio of the influence of the external environ-ment on the behaviour.
THE KINKY PERSONALITY OF CONSUMER PREFERENCES
Our versatile personalities can also give answers to our apparently inconsistent choices. In different situations (and environments!) different identities and goals dominate. Our decision styles should be fitted to our changing identities. Some principles remain the same under every other circumstance. Of course, it depends on the individual which are those environment resistant principles. Goldstein (1990)[5] supposed that humans are not conscious about their internal preference systems, at least if it is a regulatory decision situation, they are only conscious about their output: the holistic choice, but not about the details. Furthermore, he supposes that the elements of the preference system have systematic importance weights, which is consistent with their will. He called the environment resistant preferences global preferences. Global preferences keep their importance weights under any circumstances. The other type of preferences – according to Goldstein (1990) is called local preferences: their importance weight is not constant; it always depends on the current situation. I suppose, that this phenomenon reflects the personality through the internal preference system.
Another typology from Pellerone (2015) follows the logic of humanistic psychol-ogy. The mentally healthy individuals apply different decision styles. Those, who are able to rationalize their decisions in consort with their self-interest, are also conscious about their goals, visions, and themselves. Pellerone (2015) also notes that the decisions (meaning: clear intention) and the choices (meaning: action, in which the decision reveals) reflect to the personality, so as to the personality-driven internal preference system. This is a very interesting note if we consider our research question from a progressive aspect: which preference importance weights remain the same throughout the situation in case of a mentally healthy human?
[4] Dewberry, C. – Juanchich, M. – Narendran, S. (2013): The latent structure of decision styles. Personality and Individual Differences, 53. 566–571.[5] Goldstein, W. M. (1990): Judgements of Relative Importance in Decision Making: Global vs Lo-cal Interpretations of Subjective Weight. Organizational Behavior and Human Decision Processes, 47. 313–336.

76
PETR A PL ATZ
Based on former results (see: Slavic – Lichtenstein, 1971;[6] Nisbett & Wilson, 1977[7]), it can be considered that the preference importance weights are calculated in an intuitive way. The author supposes that these fuzzy weights do have compo-nents dependent on, in the one hand, the personality, like the level of conscious-ness, the level of concentration, former experiences, consumer memories; on the other hand, from the relation between the consumer and the subject (motivation, willingness to have, attitude, and involvement). This complex internal environ-ment contacts the current external environment (with alive and physical elements) during the decision situation. The changing external environment can be an expla-nation for different repeated choices, even if the internal environment is all stable. In this sense, the settled internal environment reacts to the different purchase situa-tions (online or in-store, sales person involvement or self-service etc.) in a different way. I consider that in case of a stable internal preference system this system is the driving force in the if-then mechanism. Vice versa: when the internal preference system is not constant, the external environment will dominate, and the behaviour pattern can be influenced from outside. This is what behaviourism says. However, some behaviourists go further and suppose that the internal environment is always dependent on the external one, no matter how stable it is – the external environ-ment will always enjoy a greater influence. If we examine this question in a broader context and involve macro-level variables, like social conformity, we can believe in this phenomenon. Király (2014)[8] emphasizes that in some cases the individual decides as others expect him to decide. This, however, violates the individual’s util-ity maximization. Because the choice orientation came from a reference group – and their preferences were so-called ‘half-internal’ for the individual, as a wannabe group member. Other classic theories echo this view: Veblen (1975)[9] and the conspicuous consumption, or more specific: the visibility of the products (Bourne, 1957)[10] or the exclusiveness of the products (Tárkányi, 2008).[11] The common core of these theories is that the possession of certain goods offers utility for the consum-er’s image, but not for the consumer itself. They suppose, during the purchase and the consumption of some sort of goods, an external environmental factor: the opin-ion of others prevails and provides feedback to the internal preference system.
[6] Slavic, P. – Lichtenstein, S. (1971): Comparison of Bayesian and regression approaches to the study of information processing in judgement. Organizational Behavior and Human Performance, 6. 649–744.[7] Nisbett, R. E. – Wilson, T. D. (1977): Telling more than we know: Verbal reports on mental processes.Psychological Review, 84. 231–259.[8] Király, Gábor (2014): A közgazdaságtan és a szociológia határán – az identitás-gazdaságtan által felvetett elméleti kérdések (On the borders of economics and sociology. Theoretical questions raised by identity economics). Közgazdasági Szemle, 51(1). 92–107.[9] Veblen, T. (1975): A dologtalan osztály elmélete. KJK Kiadó, Budapest. (First edition: 1899).[10] Bourne, F. F. (1957): Group Influence in Marketing. In: R. Likert – S. Hayes (eds.): Some Applications of Behavioral Research. UNESCO, Paris. 208–224.[11] Tárkányi, E. (2008): A referenciacsoportok szerepe a fogyasztói magatartásban. Doctoral dissertation. SZE RGDI Győr

77
R EFLECTIONS ON THE ROLE OF INTER NAL ENVIRONMENT. . .
MORE WORDS ON THE INTERNAL ENVIRONMENT
Scientists say that experience cannot change cognition. At the same time, it is still an unanswered question whether it unequivocally drives to one behaviour pattern. Some attempts were made to clarify the influential internal human factors. Warren, McGraw and Van Boven (2010)[12] worked with goals, experiences and cognitive boundaries; Hlédik (2012)[13] classified decision related (nearness, importance), product related (perfect information, involvement, experience, loyalty), personal-ity related (risk avoidance, willingness to pay) and task related (simple or compli-cated) factors. Koltay – Vincze (2009)[14] considered self-interest, insatiability and analytic-mathematic competences as determining internal factors. The list of internal factors has never been fully comprehensive in the researches until now. I focused on the role of consumer memories in my dissertation (Platz, 2016).[15] The memory works independent of demographic variables, in case of mentally healthy grown-ups (the memory of ill or elderly people and children works in a different way – these groups are not suitable for analysing individual decisions from other aspects either). Despite the former praxis, my research focused only on the influence of one internal factor on the output. The main empirical findings are that the consumer memories’ role dropped in the purchase situation compared to the non-purchase situation. The consequence is that if it is about a regulatory purchase decision, the consumer rather focuses on the present circumstances and does not invest energy to consider. This supports the system 1 – system 2 theory: humans try to get a good and, first of all, fast decision. The yearning for easy solu-tions stands close to Johnson’s (1984)[16] idea, who supposed that the preference system is not constructed on detailed internal and external environmental factor analysis, but on an abstract impression. The production of this abstract impres-sion requires less cognitive energy than an analytic approach. In some cases, it can be a truly good way. Dijksterhuis and his research group (2004)[17] conducted a conjoint analysis-like experiment. Car profiles were shown to the participants. The car profiles listed four attributes, and there was an optimal car hidden in the car profiles. The participants were in a group of two: the first group had time to consider which model they would like to have, while the second group had to make a random decision. Under these circumstances, the first group performed better:
[12] Warren, C. – McGraw, A. P. – Van Boven, L. (2011): Values and preferences: Defining preference construction. Interdisciplinary Reviews: Cognitive Science, 2(2). 193–205.[13] Hlédik E. (2012): Termékjellemzők és preferenciák. Doctoral dissertation. Szegedi Tudományegye-tem Gazdaságtudományi Kar Közgazdaságtani Doktori Iskola.[14] Koltay Gábor – Vincze János (2009): Fogyasztói döntések a viselkedési közgazdaságtan szemszö-géből. Közgazdasági Szemle, 56. 495–525.[15] Platz P. (2016): Elements of the essence. Doctoral dissertation. SZE RGDI Győr.[16] Johnson, M. D. (1984): Consumer Choice Strategies for Comparing Noncomparable Alternatives. Journal of Consumer Research, 11. 741–753.[17] Dijksterhuis, A (2004): Think Different: The Merits of Unconscious Thought in Preference Development and Decision Making. Journal of Personality and Social Psychology. 86(5). 586 – 598.

78
PETR A PL ATZ
there were a relatively low number of bits of information, so they could optimize them. Then, the experiment was repeated. The car profiles now contained sixteen attributes! The first group, which had enough time to decide, mostly failed. The second group found the optimal car in a higher ratio with the random decision strategy. Though these valuable researches lack the influence of internal environ-ment: they are focused on the various elements of the external environment and linked it to one part of the internal environment: to the information processing or to the decision style without counting in other internal factors. The result is that we see an output, where almost every corner of the external environment and only one element of the internal environment are involved – but not the whole! The big picture is still missing.
There were other early attempts to look for stable internal preferences, which make the person resistant to the environmental factors, or which simply domi-nate over the external environment. Lawless (1985)[18] found that the preference for sweet taste is biologically determined on a sensory basis in every one of us, or the avoidance of bitter tastes, because it might refer to toxicity. Simonson (2008a, 2008b)[19] has a more specific idea about the existence of complex stable internal preferences. He supposes that we bear underlying inherent preferences, which can operate as a preference index for an external environmental factor. Their greatest advantage is that they are constructed in a context-independent way. Their operation is simple: they orientate if a certain element of the environ-ment is ‘yes’ or ‘no’. Simonson (2008a) reckons that this tiny ‘yes, I like it’ or ‘no, I don’t like it’ orientation about a detail is extended to the whole product, so, finally, this is what determines the result of the evaluation and is revealed in a biotic choice – even in the real purchase situation: ‘yes, I take this’ or ‘no, I do not take this’. He does not explain if that choice is not about one individual product, but between two or more alternatives. This concept is not an easy one to test, first of all, because its subject is underlying. However, the underlying inherent preferences should be global preferences with a stable preference value. Simon-son (2008b) believes that the preliminary information or the desire for the prod-uct can create a skin-deep preference system or opinion, but when it comes to the decision, the underlying inherent preferences show themselves and decide. In my interpretation, the researcher thinks that the preference system, which is revealed in the choice, is the real, original preference system, and at the same time, the preference system, which was created in the non-decision situation, is not real. To formulate in another way: the moderation of the preference system from the non-decision situation is necessary. This manifestation of arbitrari-
[18] Lawless, H. (1985): Sensory development in children: research in taste and olfaction. Journal of the American Dietary Association, 85(5). 577–582.[19] Simonson, I. (2008a): Will I like a „medium” pillow? Another look at constructed preferences. Journal of Consumer Psychology, 18. 155–169; Simonson, I. (2008b): Regarding inherent preferences. Journal of Consumer Psychology, 18. 191–196.
79
R EFLECTIONS ON THE ROLE OF INTER NAL ENVIRONMENT. . .
ness or free will, does it completely replace the passive Pavlovian conditioning or even complete it? In order to answer this question, we need to know whether an underlying inherent preference can be modified on the long run with the help of learning or gaining experiences. Maybe the right choice is based on the Pavlovian reflex on a higher level: the various experiences offer a wider range of alternatives, which can contain the optimal one with a higher probability. Because Schank and Ram (1988)[20] found that humans do not classify the memories during the storage process according to stimuli (for example visual or audible). They say the memo-ries are stored in schemes, in their complexity. They call it the script theory. As we do our daily routines we lean on such schematic scripts, which are basically examples for the resolution of the same previous situations. The difference is that however the optimum is found, it does not happen via the analysis of the current situation, but on the recall of a previous good example.
EVEN MORE WORDS ON THE MEMORY
It is very remarkable that the three memory researchers, Eysenck, Anderson and Baddeley[21] (2010) call the perception the entrance hall of the memory. They introduced it as the sensory memory in literature. The sensory memory basically means the ability that the mind can hold the external environmental information after the stimulus ends; it is enough to transfer the information into the short-term memory. The key is that from the cardinality of external factors only those serve as perception, which mean stimulus for the person. So the whole process, from the very beginning, is induced from inside. It can depend on the current focus of attention or on the personality. A premise of perception is the experience. If we observe the phenomenon as a process, which consists of the same repeated action, there should be a kind of saturation point, from which there is a qual-ity change. Right at the beginning, without any former experiences, it would be crucial to know how the first stimuli were taken: driven by some internal aptitude, by chance, or by the external environment. If we accept that the first stimuli had nothing to do with any internal aptitude, then the behaviourist patterns should prevail. If there was an influence from inside from the beginning, the behaviourist theory should be reconsidered. In case we fit in Eysenck and his research group’s view into the process, we should admit that the internal environment dominates the external environment, so the internal environment is the independent varia-ble, while the external environment is the dependent variable. Nowadays, science is able to describe that the stimuli is only activated, if its strength is above a certain threshold for the sensory organs. This biological mechanism is not clearly linked to the conscious level: to the context of consumer choices and purchase decisions.
[20] Schank, R. C. – Ram, A. (1988): Dynamic memory: a response to reader. New Idea sin Psychology, 6(1). 153–157.[21] Eysenck, M. W. – Anderson, M. C. – Baddeley, A. (2010): Emlékezet. Akadémiai Kiadó. Budapest.

80
PETR A PL ATZ
If we pay attention to a previous key word, ‘strength’, it should ring a bell that the stimuli cannot have a discrete (yes or no) value, either. I suppose that the stimu-lus is an interval variable, which makes the understanding more complicated, as there are no clear limits between the values. Regarding the further steps, on the methodological level researchers should find a suitable measurement scale and statistical tests as well, in order to get a proper analysis. If the marketers’ goal is to get reliable information about the product attribute preferences, which serve as items in the preference system, they need a clear access to the consumer memories, where those product related experiences are stored. It is particularly interesting in case of services or products with low physical content: as there is a lack of physical existence, the consumer is not able to recreate the attribute evalu-ation prior to the purchase on an empirical basis. The consequence is that in such cases the consumer need to lean on her memories about a previous consumption (as there is a lack of observable attribute prior to the purchase). If the consumer needs to make a buying decision under such circumstances, she has two options: first, she pays attention to the available attributes, which might not be in direct contact with the service. So she forms her internal preference system according to service-related attributes, but not service attributes – and this makes a difference. In this case, the consumer can only deduce. The consumer’s second option would be to recall her memories about a script or a certain previous consumption. Due to the discrepancies of the human memory system, this way does not offer a perfect evaluation either. Because both alternatives have encoded mistakes, none of them can guarantee a reliable forecast on the right choice.
To have a more analytic look at the second option (consumer memory recall), a bunch of failure points can be easily listed according to Tulving’s summary (2007): [22]
• The memory recall is based on conceptual representation, which is complex. The consequence is that it does not give a detailed impression on the attributes, rather a holistic one.
• This cognitive structure operates the same way, no matter the origin of ‘consumer memories’: the memory information could be heard from somebody else, or could be experienced by the consumer herself, or it can represent only a similar situation.
• Humans tend to remember in accordance with the present expectations and desires. The recalled memories are usually context conformed.
• The quality of the memory depends on the type of storage: short or long term. The memories from the short-term storage usually show a weighted behaviour: a couple of sharper details besides the mostly fuzzy rags.
[22] Tulving, E. (2007): ‘Are There 256 Different Kinds of Memory?’. In: Nairne, J. S. (ed.): The Foundations of Remembering: Essays in Honor of Henry L. Roediger. Psychology Press, New York III. 39–52.

81
R EFLECTIONS ON THE ROLE OF INTER NAL ENVIRONMENT. . .
• The reliability of the memory is also bounded by its availability and the amount of ancillary information (as the memory is always stored with some additional information, like time) and on the cardinality of the recalled memories also.
THE ROLE OF MEMORY IN THE CONSTRUCION OF THE PREFERENCE SYSTEM
The psychologists’ preferred research topic is the change of the memory system with the age. Brand managers deal with the outputs of the memory: the success of the recall in a certain situation, where the brand enjoys the lime-light. Practitioners use the memory functions. Marketing academics focus on the memory in connection with the learning process, experiences, information processing, and past evaluations. Reminiscences appear in qualitative researches as methodological techniques. There are no widely-accepted general findings on the role of consumer memories in the construction of the attribute preference system prior to, in, or after the purchase situation. There are some studies which focus on the effect of consumer memories on the consumer behaviour, but not on the purchase decision: Ratnayake, et al, (2010),[23] Teichert & Schöntag; (2010),[24] Herz és Riefler (2013).[25] Their results in common are that the brand-related expe-riences influence the brand recognition and the brand loyalty. All three research teams admit that they faced difficulties by reaching and also by following up the memories.
This insufficient knowledge basis does not give answer to the following questions:• How do the consumer memories appear in the revealed preference system?• Is there a difference in memory influence between consumers with various
profiles, like demographic variables, personality or lifestyle? • Is the intensity of the consumer memories in the preference system dependent
on their emotional context: whether the memories are linked to basic emotions (joy, surprise, sorrow, fear, disgust, rage)?
• Is the type of the memory (for example semantic or episodic) more vivid?• Are there more or less memorable goods?• Is there a purchase situation or are there any external factors which would be
beneficial for the consumer memories?
[23] Ratnayake, N. – Broderick, A. J. – Mitchell, R. L. C. (2010): A neurocognitive approach to brand memory. Journal of Marketing Management, 26(13-14). 1295–1318.[24] Teichert, T. A. – Schöntag, K. (2010): Exploring Consumer Knowledge Structures Using Associative Network Analysis. Psychology & Marketing, 27(4). 369–398.[25] Herz, M. – Riefler, P. (2013): „Making Memories Manageable”, presented at the presented at the 4th EMAC Regional Conference (Sept 26-27, 2013, St.Petersburg, Russia).

82
PETR A PL ATZ
As the above mentioned questions have remained unanswered until now, complete marketing management (product development, branding, communica-tion etc.) guidelines and techniques are absent both on the strategic and on the operative level. The insight into the role of consumer memories in the construc-tion of the attribute preference system would have a fruitful effect on the effi-ciency of the participants in the whole process in each relation: producers, suppli-ers, merchants and consumers.
REFERENCES
• Bourne, F. F. (1957): Group Influence in Marketing. In: R. Likert – S. Hayes (eds.): Some Applications of Behavioral Research. UNESCO, Paris. 208–224.• Dewberry, C. – Juanchich, M. – Narendran, S. (2013): The latent structure of decision styles. Personality and Individual Differences, 53. 566–571.• Dijksterhuis, A. (2004): Think Different: The Merits of Unconscious Thought in Preference Development and Decision Making. Journal of Personality and Social Psychology, 87(5). 586–598.• Eysenck, M. W. –Anderson, M. C. – Baddeley, A. (2010): Emlékezet. Akadémiai Kiadó, Budapest.• Goldstein, W. M. (1990): Judgements of Relative Importance in Decision Making: Global vs Local Interpretations of Subjective Weight. Organizational Behavior and Human Decision Processes, 47. 313–336.• Herz, M. – Riefler, P. (2013): “Making Memories Manageable”, presented at the presented at the 4th EMAC Regional Conference (Sept 26-27, 2013, St.Petersburg, Russia).• Hlédik E. (2012): Termékjellemzők és preferenciák. Doctoral dissertation. Szegedi Tudományegyetem Gazdaságtudományi Kar Közgazdaságtani Doktori Iskola.• Király Gábor (2014) A közgazdaságtan és a szociológia határán – az identitás-gazda-ságtan által felvetett elméleti kérdések (On the borders of economics and sociology. Theoretical questions raised by identity economics). Közgazdasági Szemle, 51(1). 92–107.• Johnson, M. D. (1984): Consumer Choice Strategies for Comparing Noncomparable Alternatives. Journal of Consumer Research, 11. 741–753.• Koltay Gábor – Vincze János (2009): Fogyasztói döntések a viselkedési közgazdaságtan szemszögéből. Közgazdasági Szemle, 56. 495–525.• Lawless, H. (1985). Sensory development in children: research in taste and olfaction. Journal of the American Dietary Association, 85(5). 577–582.• Nisbett, R. E. – Wilson, T. D. (1977): Telling more than we know: Verbal reports on mental processes. Psychological Review, 84. 231–259.• Platz P. (2016): Elements of the essence. Doctoral dissertation. SZE RGDI Győr.• Ratnayake, N. – Broderick, A. J. – Mitchell, R. L. C. (2010): A neurocognitive approach to brand memory. Journal of Marketing Management, 26(13-14). 1295–1318.• Samuelson, P. A. (1938): ‘A Note on the Pure Theory of Consumer’s Behaviour’. Economica, 5. 61–71.• Schank, R. C. – Ram, A. (1988): Dynamic memory: a response to reader. New Ideas in Psychology, 6(1). 153–157.• Sen, Amartya (1973): Behaviour and the concept of preference. Economica, New Series, 40(159). 241–259.

83
R EFLECTIONS ON THE ROLE OF INTER NAL ENVIRONMENT. . .
• Simonson, I. (2008a): Will I like a „medium” pillow? Another look at constructed preferences. Journal of Consumer Psychology, 18. 155–169.• Simonson, I. (2008b): Regarding inherent preferences. Journal of Consumer Psychology, 18. 191–196.• Slavic, P. – Licthenstein, S. (1971): Comparison of Bayesian and regression approaches to the study of information processing in judgement. Organizational Behavior and Human Performance, 6. 649–744.• Tárkányi E. (2008): A referenciacsoportok szerepe a fogyasztói magatartásban. Doctoral dissertation. SZE RGDI, Győr.• Teichert, T. A. – Schöntag, K. (2010): Exploring Consumer Knowledge Structures Using Associative Network Analysis. Psychology & Marketing, 27(4). 369–398.• Tulving, E. (2007): ‘Are There 256 Different Kinds of Memory?’. In: Nairne, J. S. (ed.): The Foundations of Remembering: Essays in Honor of Henry L. Roediger. Psychology Press, New York. III. 39–52.• Veblen, T. (1975): A dologtalan osztály elmélete. KJK Kiadó, Budapest.• Warren, C. – McGraw, A. P. – Van Boven, L. (2011). Values and preferences: Defining preference construction. Interdisciplinary Reviews: Cognitive Science, 2(2). 193–205.
HUNGARIAN SUMMARY
A preferenciarendszer stabilitására vonatkozó kérdéskör a tudomány különböző területein megjelent: a mikroökonómiában a hasznosság elméletek részeként, a behavioristák az irracionális viselkedést magyarázzák vele, a pszichológia pedig úgy tartja, hogy a preferenciarendszer a szelf kinyilvánítása. Mindegyik megköze-lítésben közös pont a preferenciarendszer, a preferenciarendszer elemi és a köztük lévő kapcsolat tranzitív definiálása. Több tudományos megközelítésre – társa-dalomtudományi, pszichológiai, gazdaságtani – alapozva elfogadhatjuk, hogy a preferenciarendszer elsősorban a belső tényezőrendszer viszonyai alapján konst-ruálódik és választásainkban megjelenik. A legutóbbi trend ezzel szemben azt erősíti, hogy a döntési szituációban jelen lévő külső tényezők módosító hatással lehetnek a preferenciarendszerre. A kutatónak a két nagy tényezőcsoport (belső és külső) egyrészt egymással, másrész számos elemével szintézisbe hozása nagy kihívás, hiszen a döntési szituációban a két körülményrendszer interakcióinak nyomán történik meg a választás. Ezért a fő kérdés a továbbiakban inkább az, hogy a két nagy tényezőcsoport, mely elemei dominálnak a preferenciarendszer kinyilvánításának alakulásában.
84
VERONIKA POREISZ[1]
Theoretical review of the performance of companies in spatial approach
This paper reviews the theory of urban competitiveness from the view point of companies. The competitiveness of cities fits into a complex system, which determines the competitiveness of nations and regions, furthermore the indus-trial concentration. The main goal of this paper is to describe the most important dimension of the economic competitiveness regarding management and perfor-mance. In addition, the study focuses on the spatial aspects of the performance of some companies. We review the most important models, definitions and previous studies on this subject.
INTRODUCTION
The first part of this study focuses on competitiveness in general, the second part is about company performance and the third part reviews some previous researches that are investigating company competitiveness and performance from spatial approach, too.
The definition of competitiveness can be distinguished by spatial units and companies. The enhancing competition between the spatial units (nations, regi-ons, sub-regions, or cities) has drawn the rising attention of investigation on regional competitiveness.[2] According to Lengyel – Rechnitzer, the competition of cities has been highlighted due to globalization. The cities are essential parts of the spatial competition between investments, populations and resources. For instance; they want to increase their positions (explicit or implicit) through local stakeholders and policies. The permanent growth of incomes is a key element in competitiveness, which can be measured by the amount of GDP or employment rates.[3]
[1] Széchenyi István University, assistant professor ([email protected]).[2] Lukovics Miklós (2008): Térségek versenyképességének mérése. JatePress, Szeged.[3] Lengyel Imre – Rechnitzer János (2000): A városok versenyképességéről. In: Horváth Gy. – Rechnitzer J. (eds.): Magyarország területi szerkezete és folyamatai az ezredfordulón. MTA RKK, Pécs. 130–153.

85
THEOR ETICAL R EVIEW OF THE. . .
According to Porter, localisation, as a key factor in competitiveness, is divided into three dimensions (ecological, human, and economic) which are resources for spatial units in order to enhance their position.[4]
Horváth’s study[5] describes the competition of the regions and cities from two different point of views. On the one hand, regions (or cities) are investigated through their performance. The basis of the research are the output data, so this approach is similar to the national competition. On the other hand, regions are investigated through the competitiveness of the companies. In spite of the other approach, the basis of this research are the input data. In addition, the two differ-ent approaches have lots in common. For example, the goals of the competition that can be the followings: attracting investments, employment, creating work-places, and the increasing of the incomes or the population.
COMPETITIVENESS OF THE COMPANIES
„The companies’ competitiveness is a skill they use in order to constantly offer a product or service, which are more attractive for customers on competitive prices instead of competitor’s products yet the company is still profitable, and in addi-tion, they have to keep the social responsibility norms.”[6] Researchers highlight the need for adaptation to the changes, as a requirement of competitiveness.
According to Varga,[7] the economic actors’ (companies’) competitiveness is a capability applied in order to create value, which capabilities determine the competitive advantages and the higher level of meeting the needs. He agreed with Chikán – Czakó’s[8] point of view, according to which adaptation is the key factor of better competitiveness and returns. Chickán developed the index of corporate competitiveness; he described competitiveness as operability on adaptability admitted by the market:[9]
C = (M + V) T, whereC – competitiveness; M – operability; V – adaptability; T – performance.
While he was primarily investigating the competitiveness of large-sized compa-nies, Szerb et. al.[10] created the competitiveness index of SMEs from the data-
[4] Porter, M. E. (1990): The Competitive Advantage of Nations. Free Press, New York.[5] Horváth György (2001): A magyar régiók és települések versenyképessége az európai gazdasági térben. Tér és Társadalom, 15(2). 203–231.[6] Chikán Attila (2006): A vállalati versenyképesség mérése. Pénzügyi Szemle, 51(1). 42–56.,43.[7] Varga János (2014): A versenyképesség többszintű értelmezése és az innovációval való összefüggé-sei. Doctoral Thesis, Szent István Univerity, Gödöllő.[8] Chikán Attila – Czakó Erzsébet (2005): A versenyképesség szintjei: fogalmak és értelmezések. Ver-senyképességi Kutatások műhelytanulmány-sorozat, Competitiveness Research Centre, Budapest.[9] Chikán Attila (2006): op. cit. 44.[10] Szerb László et.al (2014): Mennyire versenyképesek a magyar kisvállalatok? Marketing & Me-nedzsment, 48. / Special Issue. 3–21.

86
VERONIK A POR EISZ
base of almost 800 small-sized companies. The base of the index were variables assigned to the ten pillars of competitiveness. The first group of variables refers to the level of entrepreneurship skills: the value, the cost of substitution, and the corporate features. The second group of indicators was innovation, built in only the relevant pillars. The third group of variables consists of financial indexes; it was not built in all of them, too. The last group of variables individually created extraordinary variables.
Table 1: Competitiveness index of SME’s
Pillars
Variables
Level of entre-preneurship Innovation Financial
indexes
Extraordi-nary
variables
Human capital
value
cost of substitution
corporate features
qualification bargaining power of suppli-ers and customers
growth diversifica-
tion
forecast of insolvency
variables of online pres-
ence
Finances stock management
Cooperation leverage
Product product innovation investments
Administration operational management
Technology technology innovation
innovation, level of techni-cal development
Marketing marketing innovation
Internationali-zation debts ratio
Online presence and tools
Performance indexes
Return Increase of revenues Insolvency index
Source: Own construction, based on Szerb et. al. (2014): op. cit. 11–14.
The determining factor of competitiveness of nations or other spatial units is the performance of the companies operating in a given geographical area. There-fore, that region (or another spatial unit) is competitive, in which companies can contribute to enhancing economic performance and increasing employment. The competitiveness of the companies has a strong correlation with the competitive-ness of the region they are located at. Table 2 shows the selected competitive-ness factors of SME’s from Németné Gál’s research, where only the statistical or corporate financial data are highlighted. She concluded that the medium-sized companies are the most competitive ones in the SME sector. The larger the size of the company is, as improved is the level of externally financed resources, the rate of suppliers, the rate of export activity and the complacency with the equity

87
THEOR ETICAL R EVIEW OF THE. . .
rate becomes. The rate of the long-term loans is more likely to be higher regarding small-sized companies. Controlling for export companies, the export rate corre-lates positively with company size.[11]
Table 2: The competitiveness factors of SMEs
Competitiveness factors Indicators
FinancesRate of equity
Rate of loans received (long and short term)
ExportRate of export activity
Rate of export revenues
Productivity Gross added value on employment
Innovation and R&DAmount of innovative companies
Rate of companies doing R&D
Employment Rate of employment
Source: Own construction, based on Némethné Gál’s data (2009): op. cit. 178–208.
SPATIAL ASPECTS OF THE PERFORMANCE OF COMPANIES
There are a lot of approaches to investigating the spatial aspects of the perfor-mance of the companies. The first possible criterion of classification is the subject of the investigation (subject orientation). This type of research is based on compa-nies (company data) or on given spatial units. The first group of subject oriented researches investigates the spatial location of companies. Their main goal is to measure the spatial patterns of the given companies (for example TOP 100 or multinational) in order to deduce the characteristics of the given spatial units. We can distinguish between researches made on multinational, large sized or small and medium-sized companies. In addition, the economic sectors and the spatial dispersion of the multinational headquarters are often investigated. The studies usually cover a nation or a larger spatial unit, for example, the EU, and by the loca-tions take the regions or city-regions into consideration.
The second group of the subject oriented researches is based on a given spatial unit, investigates the companies located in them, distinguished by sector or size. Studies can compare spatial units at varied levels, at international, national, regional or city levels, too. Instead of companies, there is a given spatial unit in this case and researchers try to describe the characteristics of a given region by company performance or sectorial specifics. This assignment includes studies among characteristics of a given nation or region using aggregated data.
The other classification of investigating spatial aspects of the performance of
[11] Némethné Gál Andrea (2009): A kis és középvállalatok versenyképessége. Doctoral Thesis. Szé-chenyi István University, Győr.

88
VERONIK A POR EISZ
companies distinguishes the company size or economic sector. The sector specific studies investigate the concentration of a given sector. They refer to economic clusters and clusterization.
INVESTIGATION OF COMPANIES
According to Tonts and Taylor, the global and national (or regional) levels are the two main approaches to the location of companies. They investigated the TOP 300 companies in Australia and ascertained that their location concentrated on capitals of six counties with over-representation of Sydney and Melbourne (206 companies from 300) while the cities in the countryside are in the background. There is a level of industrial specialization in every city and the concentration is traceable mostly in a given city, proved in the research.[12]
Rozenblat and Pumain investigated the location of the multinational headquar-ters in the European city network. They compared the spatial and sectoral disper-sion of the TOP 300 European companies with the investigated 94 companies. The location of half of the companies concentrated into the cities of London or Paris, furthermore into the North-Western regions of Europe in both groups.[13] Bosnan and Smidt’s study researched the location of international management headquar-ters in the European city regions.[14] Csete and Szabó examined the dispersion of the Hungarian TOP 500 companies at the NUTS2 level with an approach to their effect on regional development. The study revealed that the TOP 500 companies are export-oriented and concentrated in the more developed regions.[15]
Fothergrill et al. investigated the profitability of the English companies from the urban-rural viewpoint. The study referred to the relationship between loca-tion and profitability of the manufacturing companies in the U.K. with employ-ment data at a city level. The manufacturing companies calculate with higher costs due to the higher prices of employment, rental, and properties. This fact has an impact on the location choices of the new investments The rural areas are more likely to be chosen.[16]
[12] Tonts, M. – Taylor, M. (2010): Corporate Location, Concentration and Performance: Large Company Headquarters in the Australian Urban System. Urban Studies, 47(12). 2641–2664[13] Rozenblat, C. – Pumain, D. (1993): The location of multinational firms in the European urban system. Urban Studies, 30(10). 1691–1709[14] Bosman, J. – Smidt, M. (1993): The Geographical Formation of International Management Centres in Europe. Urban Studies, 30(6). 967–980.[15] Csete M. – Szabó M. (2014): How to spatial distribution of the Hungarian top 500 companies affects. Regional Statistics, 4(1). 40–60.[16] Fothergrill, S. – Gudgin, G. – Kitson, M. – Monk, S. (1984): Differences in the profitability of the U.K. manufacturing sector between conurbations and other areas. Scottish Journal of Political Economy, 31(1). 72–91.

89
THEOR ETICAL R EVIEW OF THE. . .
INVESTIGATION OF REGIONS
So-me researches proceed from the agglomeration economies based on the theory of Marshallian industrial districts, advantages of concentration, and localisation. The location of one large or a lot of small companies in a given region results in a higher level of employment, which causes economic growth. The concentra-tion of industry vitalizes the economy by attracting suppliers. The advantages of agglomeration do not affect the development of the region directly, but indirectly, through the performance of the companies. Regional studies typically investigate the performance of the companies with aggregated data and measure the effect of the companies on the economic growth by the given indicators or indexes.
According to Van Oort et al., the investigation of the relationship between the agglomeration economies and the performance of the companies is a missing key factor. In addition, there is a compelling question to ascertain: are the regional differ-ences based on local specializations or industrial divergence. Using aggregated data, the particular performance of a company is lost, so they applied a multidimensional approach in order to investigate the spatial concentration and financial performance of a Dutch economy not only at a macro, but also at a micro level.[17]
Holl investigated the relationship between the location, accessibility and performance (at the company level) in Spain. He submitted that the urban concentration and the good transport accessibility allow companies to increase their market positions and enhance their productivity. The study distinguishes between the indicators of local characteristics: population, population density, market accessibility, and transport infrastructure. Operation and financial infor-mation, data from the balance sheet, profit or loss account, spatial location and employment statistics of Spanish production companies were used in the study. The results show that there is a significant correlation between the productivity and the local characteristics of the companies. The market performance correlates more strongly with the efficiency of the company than the population or popula-tion density variables.[18]
Ketelhönh and Quintanilla investigated the effect of the country on the performance of the company by Central-American countries. The basis of their research was the resource-based theory, that the performance of a company is defined by the variety of resources. The aim of the study was to describe the regional differences by the similar Central-American countries, where 7 neigh-bouring countries (Costa Rica, El Salvador, Guatemala, Honduras, Nicaragua, Panama and the Republic of Dominica) were involved. They investigated the data of 263 companies in 33 industrial sectors between 1999 and 2003 by using
[17] Van Oort, F. G. – Burger, M. J. – Knoben J. – Raspe. O. (2012): Multilevel approaches and the firm-agglomeration ambiguity in economic growth studies. Journal of Economic Surveys, 26(3). 468–491.[18] Holl, A. (2014): Location, accessibility and firm-level productivity. In: Condeco-Melhorado, A. – Guriérrez, J. – Reggiani, A. (eds.): Accessibility and Spatial Interaction. Edward Elgar Nectar Series.

90
VERONIK A POR EISZ
the ROA (Return on Assets) index. The results show that the country-effect explains the variance of performance between 5.1% and 8.4% and they found significant differences between the profitability within countries. The explained variance by industrial sector is between 10,2% and 17,5%, so the sector is more effective on performance.[19]
According to Verhetsel et. al., who did some researches on the small and medium-sized companies on the Antwerp-Brussels axis; the profitability is more likely to be higher in the rural areas. The wages in larger cities and in their agglom-eration are higher, however, in the rural areas the liquidity, solvency, and finances are better. We can summarize the spatial dispersion of added value. Larger cities show a higher level of labour-intensity and a lower level of assets-intensity, while rural areas are the opposite. Companies have to face higher operational costs (wages, rental costs, property prices, and transfer costs) in the cities.[20]
Stavropoulos and Skuras investigated 410 companies in 15 EU countries at NUTS2 level in order to describe the effect of the location and the region on the performance of the company. The data were based on the profitability indexes and the employment data of 2005. The profitability was measured by indexes of ROA, profit, EBIT (earnings before interest and taxes), liquidity and solvency indexes, total assets, current assets, and the age and size of the company. The study ascertained that regional differences do not explain significantly the perfor-mance of the companies. Furthermore, the spatial concentration indicators, for instance, the city-size, population density, employment density, industry specific factors (supplier and customer companies) do not contribute significantly to the profitability of the companies. They concluded that the regional characteristics do not or only partly explain the performance of the companies, furthermore, the regional industrial specialization was found as a low impact determinant. The advantages of agglomeration are more perceivable in case of such company characteristics like knowledge-transfer, R&D investments, innovation collabora-tions, and human capital. In order to investigate the impact of the advantages of agglomeration on the companies, we have to take other socio-economic factors into consideration, too.[21]
[19] Ketelhöhn, N. W. – Quintanilla, C. (2012): Courntry effects on profitability: A multielvel approach using a sample of Central American firms. Journal of Business Research, 65. 1767–1772[20] Verhetsel, A. – Jorissen, A. – Vandamme, S. (1995): Small and medium-sized enterprises in the Antwerp-Brussels axis. Tijdschrift voor Economische en Sociale Geografie, 86(5). 467–476.[21] Stavropoulos, S. – Skuras, D. (2015): Firm profitability and agglomeration economies: an elusive relationship. Tijschrift voor Economische en Sociale Geografie, 96. 1–15.

91
THEOR ETICAL R EVIEW OF THE. . .
CONCLUSION
The reviewed studies proved that the regional characteristics and the location of the company only partly explain productivity. It is necessary to take the character-istics, systems, operations, processes and individual performance of the company into consideration. It is recognized, that there are differences between the profit-ability of companies at regional and urban level. Cities, as spatial density points, provide advantages by concentrating labour, capital, services, and information, but property prices, rental costs and wages can be higher in larger cities than in rural areas. It can occur; rural companies seem to be more competitive or profit-able due to lower costs.
The research in the field of regional (urban) characteristics and the profitabil-ity of companies measured by financial indexes is less investigated, proved the theoretical overview. Furthermore, there is a lack of financial or profitability indi-cators in the complex competitiveness indexes. Despite this fact, it is necessary to measure the performance of the companies in the competitiveness investigations in a given geographical area, because companies are the main economic drivers of the region. It is a compelling question to ascertain, how to affect the performance of the companies regarding regional (urban) competitiveness and which cities are more competitive when compared to each other.
REFERENCES
• Bosman, J. – Smidt, M. (1993): The Geographical Formation of International Manage-ment Centres in Europe. Urban Studies, 30(6). 967–980.• Csete M. – Szabó M. (2014): How to spatial distribution of the Hungarian top 500 companies affects. Regional Statistics, 4(1). 40–60.• Chikán Attila (2006): A vállalati versenyképesség mérése. Pénzügyi Szemle, 51(1), 42–56.• Chikán Attila – Czakó Erzsébet (2005): A versenyképesség szintjei: fogalmak és értel-mezések. Versenyképességi Kutatások műhelytanulmány-sorozat, Competitiveness Research Centre, Budapest. • Evans, A. W. (1973): The Location of the Headquarters of Industrial Companies. Urban Studies, 10. 387–395.• Fothergrill, S. – Gudgin, G. – Kitson, M. – Monk, S. (1984): Differences in the profitability of the U.K. manufacturing sector between conurbations and other areas. Scottish Journal of Political Economy. 31(1). 72–91.• Holl, A. (2014): Location, accessibility and firm-level productivity. In: Condeco-Melhorado A. – Guriérrez, J. – Reggiani, A. (eds.): Accessibility and Spatial Interaction. Edward Elgar Nectar Series.• Horváth György (2001): A magyar régiók és települések versenyképessége az európai gazdasági térben. Tér és Társadalom, 15(2). 203–231. • Ketelhöhn, N. W. – Quintanilla, C. (2012): Country effects on profitability: A multilevel approach using a sample of Central American firms. Journal of Business Research, 65. 1767–1772.

92
VERONIK A POR EISZ
• Klier, T. (2006): Where the headquarters are: location patterns of large public companies, 1990–2000. Economic Development Quarterly, 20. 117–128.• Lengyel Imre – Rechnitzer János (2000): A városok versenyképességéről. In: Horváth György – Rechnitzer János (eds.): Magyarország területi szerkezete és folyamatai az ezred-fordulón. MTA RKK, Pécs. 130–153.• Lukovics Miklós (2008): Térségek versenyképességének mérése. JatePress, Szeged.• Némethné Gál Andrea (2009): A kis és középvállalatok versenyképessége. Doctoral Thesis. Széchenyi István University, Győr.• Porter, M. E. (1990): The Competitive Advantage of Nations. Free Press, New York.• Rozenblat, C. – Pumain, D. (1993): The location of multinational firms in the Europan urban system. Urban Studies, 30(10). 1691–1709.• Semple, K. R. (1973): Recent trends in the spatial concentration of corporate headquarters. Economic Geography, 49. 309–318. • Stavropoulos, S. – Skuras, D. (2015): Firm profitability and agglomeration economies: an elusive relationship. Tijschrift voor Economische en Sociale Geografie, 96. 1–15.• Szerb László et. al. (2014): Mennyire versenyképesek a magyar kisvállalatok? Marke-ting & Menedzsment, 48. / Special Issue. 3–21.• Tonts, M. – Taylor, M. (2010): Corporate Location, Concentration and Performance: Large Company Headquarters in the Australian Urban System. Urban Studies, 47(12). 2641–2664. • Van Oort, F. G. – Burger, M. J. – Knoben J. – Raspe. O. (2012): Multilevel approaches and the firm-agglomeration ambiguity in economic growth studies. Journal of Economic Surveys, 26(3). 468–491. • Varga János (2014): A versenyképesség többszintű értelmezése és az innovációval való összefüggései. Doctoral Thesis. Szent István Univerity, Gödöllő.• Verhetsel, A. – Jorissen, A. – Vandamme, S. (1995): Small and medium-sized enterprises in the Antwerp-Brussels axis. Tijdschrift voor Economische en Sociale Geografie, 86(5). 467–476.
HUNGARIAN ABSTRACT
Jelen tanulmány a városi versenyképesség vállalati szemszögből történő megkö-zelítésével foglalkozik elméleti szinten. A városok versenyképessége egy komplex rendszerbe illeszkedik, amely az ország, a régió versenyképességét, az ott jelen lévő iparágak koncentrációját jelenti. A tanulmány fő célja, hogy bemutassa a gazdasági versenyképesség egy dimenziójának legfontosabb tényezőit – menedzs-ment, illetve pénzügyi-számviteli megközelítésből is – és hogy kitérjen a vállala-tok teljesítményének területi aspektusaira.

93
ATTILA ALBERT TÓTH[1]
Tourism destination development by hotel industry investment
Developments are needed in each phase of the life cycle of the areas of tourism. Without them it would not be possible for any areas, even with tourist attractions, to become a really successful tourism destination. The development of basic infrastructure and tourism superstructure, including hotel investments, is of high importance, because the increase of the number of tourists, overnight stays and income can only be ensured by them. Even in the phase of stagnation, invest-ment in hotels is essential in order to maintain and possibly improve the quality of services, rather than increasing capacity. Therefore, the main objective is to avoid decline. This paper introduces different features of investments in the hotel industry through the analysis of the life cycle model of tourism reception areas and hotel real estate development, using international and national examples.
INTRODUCTION
There have been overlapping views in the specialist literature about the topics of tourism development, the management and development of tourism destinations, tourism planning, sustainable tourism, and real estate development in tourism. Irrespective of the way of the approach, the main target is that a tourism destina-tion develops in a sustainable way and provides for the population of the territory through the possibilities provided by tourism.
The onset of the related specialist literature dates back very far, to the time when the spatiality of tourism and its economic geographical concerns were analysed with PRIA geographical approach. Bowman had already analysed the demand and supply of tourism in 1909. In one of his essays, Meinecke (1929) dealt with the environmental effects of intensive tourism, while McMurry (1930) and Joerg (1935) wrote an essay on the effects of the area use of tourism and their consequences.[2]
[1] Széchenyi István University, Kautz Gyula Faculty of Economics, Tourism Department ([email protected]).[2] Ref.: Schuckert, R. M. – Boksberger, E. P. (2008): Development of destinations and real estate in a tourism region – An application of life cycle theory. In: Keller, P. – Bieger, T. (eds.): Real Estate and Destination Development in Tourism. Erich Schmidt Verlag GmbH, Berlin. 232–247.

94
ATTIL A ALBERT TÓTH
Miege (1933) and Poser (1939) wrote about the development of the reception areas of tourism. Gilbert (1939) was examining the development opportunities of seaside areas, baths and spa resorts in England. Gilbert described the discovery of the tourism areas, the stages of their growth, the change of the population and temporary residents, the size and form of the built-up areas.[3]
Krippendorf et al. (1982) analysed the relation between tourism of the modern times and regional development. The 28 authors analysed the tourism of the Swiss highland and borderland in a volume of essays and studies containing 20 stud-ies and they explored the range of subjects of economic and social development realised by the tourism developments. Swiss tourism, the Swiss hotel industry and the international hotel schools have always been considered as an etalon in Europe, but they became well-known all over the world, as well as the Swiss tour-ism experts, who have greatly contributed to the continuously growing specialist literature.[4]
According to Gunn (1994), the common existence of 12 main elements is needed for the successful regional tourism development, which does not even provide any assurance on the successful development.[5] However, the lack of any of the elements reduces the possibility of success. The elements are as follows: natural resources, cultural circumstances, the local acceptance of tour-ism, accessibility, existence of services, suitable market, favourable improvement possibilities, business-friendly self-government environment, available areas of developments, existence of enterprises and experts, suitable labour force, and the possibility of financial funding. Mundruczó and Stone (1996) mentioned the economic restructuring and the regional development among the most important economic effects of tourism. They emphasize that the development of the infra-structure and the foundation of new enterprises are expected on a given tour-ism reception area, which can favourably influence employment, revenues and tax incomes. With regards to the hotels, they emphasize that they can signify an attractive investment possibility for foreign investors.[6]
TOURISM AREA LIFE CYCLE ANALYSIS
One of the most important and most frequently cited models is the Tourism Area Life Cycle model which is linked with the name of Butler (1980).[7] He has adapted
[3] Ref.: Ma, M. – Hassink, R. (2012): An Evolutionary Perspective on Tourism Area Development. Annals of Tourism Research, 41. 89–109.[4] Krippendorf, J. – Messerli P. – Hanni H. (1982): Tourismus und regionale Entwicklung. Verlag Rüegger, Diessenhofen.[5] Gunn, A. Clare (1994): Tourism Planning: Basics, Concepts, Cases. Taylor & Francis, London.[6] Mundruczó Gy. – Stone, G. (1996): Turizmus. Elmélet és gyakorlat. (Tourism. Theory and practice) Közgazdasági és Jogi Könyvkiadó, Budapest.[7] Butler, R. W. (1980): The concept of a tourist area cycle of evolution: implications for management of resources. Canadian Geographer, 14. 5–12.

95
TOUR ISM DESTINATION DEVELOPMENT . . .
the concept of the product life cycle curve to the life cycle model of tourism desti-nations which is well known as the TALC model. The TALC model can be used as an applied development model in the preparation of the marketing strategy and the development plans of any destinations as well as a means of forecasting.
However, according to Cooper (1994), the usefulness of the model depends on the features of the destination to a great extent. The form of the curve and the length of the cycles can show a significant difference between the areas because its general application in planning is less successful than presumed previously. Cooper’s findings are supported if we make a comparison between the forms of the life cycle curve of a holiday resort and a city as tourism destinations.[8]
Zhang and Xiao’s analysis (2014) on a Chinese non-seaside territory shows that the development was the biggest and the curve was the steepest when the developments of the hotels (new hotels and renovation of the old ones) took place simultaneously with other real estate developments.[9] Romao – Guerreiro – Rodrigues (2013) analysed the development of the tourism of South-Western Europe in a six-year period between 2003 and 2008, also with the TALC model through assessing 67 NUTS-2 regions. The research reveals that numerous seaside regions in Spain, France and Italy, too, where the “3 S” „Sun, Sand, See” still means the main attraction for the tourists, are in stagnant phase, while numerous areas far away from the seaside are in the phase of development and exploration. This research is also built on the accommodation capacities and first of all on the turnover data, with assessing area-proportional and population-proportional index-numbers.[10]
The use of the TALC model and the Real Estate Market Value Cycle Model can be combined and they are used by the developers for risk analysis primarily. However the models are also used by companies dealing with real estate rent-ing, value assessment as well as service providing.[11] We can define the life cycle curve of a tourism destination on the basis of the number of visitors and the over-night stays in hotels and other accommodations. This raises the role of the accom-modations because of the relatively exact and reliable statistics that can be used as a zero point originate from here. However, it is more difficult to measure the other economic and social effects, and it is more complicated to detect how much the tourists spend as well as the local tax incomes, the rate of employment, the value of the real estates, the size of the local crime generated by tourism, and the common denominator of other numerous effects in a life cycle curve.
[8] Cooper, C. (1994): The destination life cycle: an update. In: Seaton, A. V. (ed.): Tourism. The State of the Art John Wiley & Sons, Chicester. 340–346.[9] Zhang, C. – Xiao, H. (2014): Destination development in China: towards an effective model of explanation. Journal of Sustainable Tourism, 22(2). 214–233. [10] Romao, J. – Guerreiroa, J. – Rodrigues, P. (2013): Regional tourism development: culture, nature, life cycle and attractiveness. Current Issues in Tourism, 16(6). 517–534.[11] PWC (1999): Real Estate Cycle Methodology. The Global Strategic Real Estate Group of PricewaterhouseCoopers.
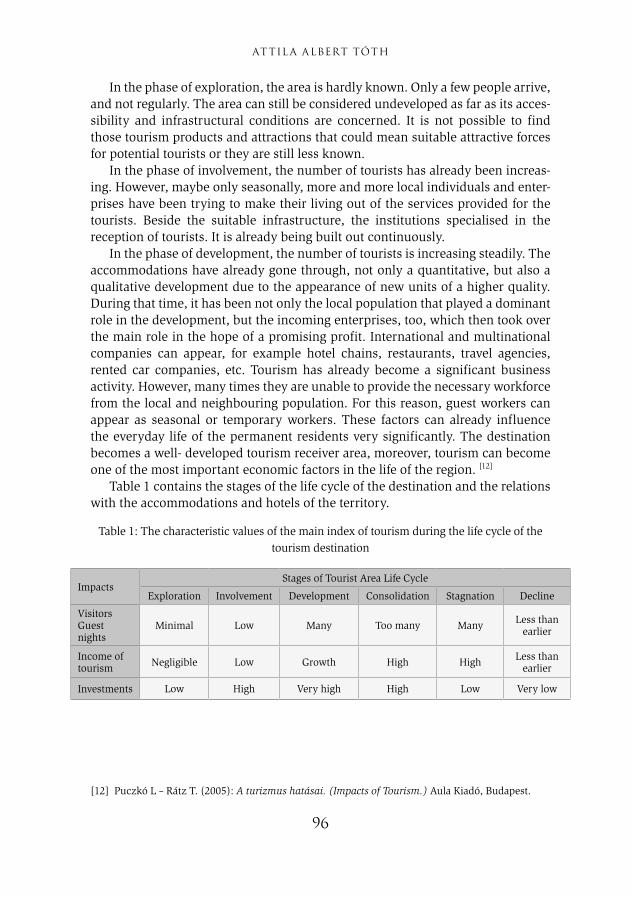
96
ATTIL A ALBERT TÓTH
In the phase of exploration, the area is hardly known. Only a few people arrive, and not regularly. The area can still be considered undeveloped as far as its acces-sibility and infrastructural conditions are concerned. It is not possible to find those tourism products and attractions that could mean suitable attractive forces for potential tourists or they are still less known.
In the phase of involvement, the number of tourists has already been increas-ing. However, maybe only seasonally, more and more local individuals and enter-prises have been trying to make their living out of the services provided for the tourists. Beside the suitable infrastructure, the institutions specialised in the reception of tourists. It is already being built out continuously.
In the phase of development, the number of tourists is increasing steadily. The accommodations have already gone through, not only a quantitative, but also a qualitative development due to the appearance of new units of a higher quality. During that time, it has been not only the local population that played a dominant role in the development, but the incoming enterprises, too, which then took over the main role in the hope of a promising profit. International and multinational companies can appear, for example hotel chains, restaurants, travel agencies, rented car companies, etc. Tourism has already become a significant business activity. However, many times they are unable to provide the necessary workforce from the local and neighbouring population. For this reason, guest workers can appear as seasonal or temporary workers. These factors can already influence the everyday life of the permanent residents very significantly. The destination becomes a well- developed tourism receiver area, moreover, tourism can become one of the most important economic factors in the life of the region. [12]
Table 1 contains the stages of the life cycle of the destination and the relations with the accommodations and hotels of the territory.
Table 1: The characteristic values of the main index of tourism during the life cycle of the tourism destination
ImpactsStages of Tourist Area Life Cycle
Exploration Involvement Development Consolidation Stagnation Decline
VisitorsGuest nights
Minimal Low Many Too many Many Less than earlier
Income of tourism Negligible Low Growth High High Less than
earlier
Investments Low High Very high High Low Very low
[12] Puczkó L – Rátz T. (2005): A turizmus hatásai. (Impacts of Tourism.) Aula Kiadó, Budapest.

97
TOUR ISM DESTINATION DEVELOPMENT . . .
ImpactsStages of Tourist Area Life Cycle
Exploration Involvement Development Consolidation Stagnation Decline
Relations with Hotels and other kind of Accommodations
Capacity Minimal Very low Low High Very high Very high
Occupancy level Low Low High Very high High Less than
earlier
Hotels category Low Low
Middle MiddleHigh
Middle High
Middle High
MiddleHigh
Average room rate Low Slow growth High Very high High Less than
earlier
Source: self-constructed, on the basis of Butler (1980), Getz (1992), Buhalis (2000), Jancsik (2011), modified by Albert T. A. (2015).
In the phase of consolidation, the growth of the number of tourists and the new enterprises declines, but the development is still unbroken, just in a slower pace.
In the phase of stagnation, the destination has already reached the peak of its development possibility and loading capacity, one cannot calculate with further significant growth any more. If everything turns out well, this phase can last for a very long time, too, and if it becomes stable on a high level, tourism can be domi-nant concerning the destination in the long run as well.
The decline stage is the last phase of the life cycle curve. In this case, the number of tourists decreases, and the enterprises can achieve less and less suita-ble economic results. The competitor destinations win over the guests; the service providers are forced to reduce their prices adjusting them to the new situation. As a result, after a while, the activity becomes so unprofitable that it does not attract new investors any more. After the decline stage, if it occurs, there are two possible cases. The worse version is that the destination declines step by step and after such a period it will not be a particularly popular destination for the tourists any more. The luckier version is when it can renew itself and a phase of rejuvenation starts after a temporary decline. The rejuvenation can usually be supported artifi-cially, with the production of new attractions.
It is necessary to apply all the exact and available statistical data in the analysis of the life cycle curve of the tourism destinations, of which one basic pillar is the development of the accommodation statistics, first of all the number of guests and overnight stays.
With the capacity data, the number of guests and overnight stays, and then with the longitudinal analysis of the turnover data based on these, one can sketch the life cycle curve of the destination.
Out of the capacity increase (the number of the hotels and lettable rooms), the investors’ willingness can also be seen, if the international investors have already emerged beside the domestic small and medium enterprises. The foreign investors

98
ATTIL A ALBERT TÓTH
entering into the market means a significant improvement in the life cycle of the destination, too, because the chains of hotels are only interested in the develop-ments through the establishment of high quality hotels of medium or large size, if they can plan in the long run and they assess the destination as a promising area.
PROPERTY DEVELOPMENT IN THE HOTEL INDUSTRY
A hotel is essentially a property investment which differs from other property investments due to its commercial use. Leonard says that three important differ-ences can be detected.[13] The hotels need a very high level of labour force as compared to other properties with other types of commercial use. The hotels have to sell their lettable rooms every day, which means a large part of the territory of the property, while the letting out is not an everyday job for other commercial units. The hotels provide 24-hour services for the guests, while the offices and the shopping centres are available for the customers only for a shorter time, i.e. for a day and their services cannot be used every day.
From the property investments, Rushmore draws attention to the special features of the hotels, which all investors have to pay attention to if they initiate a hotel investment.[14]
In case of a hotel, the equipment and the gear total up about a quarter of the value of the property investment, whilst in a luxury hotel this ratio can also be much higher.[15]
Hotels need well-trained managers, personnel and sales entities with special knowledge. Hotels have huge capacity of rooms, restaurants and other services which have to be continuously sold.[16]
Investment in the hotel properties was more and more popular by the fact that in the 90s the utilisation indicators also increased, which forecasted even the growth of the values of the properties beside the growing stock market prices and the regular disbursement for the shareholders.[17] The investment strategy in the hotel industry is basically determined by the „buy, hold or sell” type of decisions.[18]
[13] Leonard, S. (1992): A Hotel is More than a Real Estate. Hotels, 26(7). 35. [14] Rushmore, S. (1992): Hotels and Motels. A Guide to a Market Analysis. Investment Analysis and Valuation. Appraisal Institute, Chicago.[15] Rushmore, S. – O’Neill, W. J. – Rushmore, S. (Jr.) (2012): Hotel Market Analysis and Valuation. Appraisal Institute, Chicago.[16] Fattorini, E. J. (1999): Accommodation strategy and accommodation stock in the hotel industry. In: Verginis, S. C. – Wood, C. R. (eds.) (1999): Accommodation Management. Perspectives for the Inter-national Hotel Industry. International Thomson Business Press. 63–72.[17] Gu, Z. – Kim, H. (2003): An Examination of the determinants of Hotel REIT’s unsystematic risk. Journal of Hospitality & Tourism Research, 27(2). 166–184. [18] Roginsky, R. J. (2012): Investment strategies: Buy, Hold, or Sell. In: Raleigh, L.E. – Roginsky R. J. (eds.): Hotel Investments. Issues & Perspectives. 55–65.

99
TOUR ISM DESTINATION DEVELOPMENT . . .
Certainly, it is not all the same which side of the Porter model the investor is standing, whether he wants to enter the market by building a new hotel, purchas-ing an already operating one or he wants to leave the market with selling the hotel and prefers getting the profit from it. The decision of keeping a hotel can have different reasons in the short, medium and long run, too. It is worth keep-ing a well and successfully managed hotel in the long run but it may be that an undervalued unit in poor working order has to be temporarily kept in a miserable property market in order to reduce the losses and one has to wait for the revival of the property market so that one can reach an advantageous selling price.
An eclectic theory, which was used by Dunning and his partners, analysed the strategy of entering the international market, the business activity of hotel chain s crossing the borders, and their expansion.[19]
The theory is built on several theories that has been worked out previously and their combination provides the basis of the eclectic theory of Dunning. One theory is assessing the advantages that originate from the proprietary relation, the other one the advantages of the features of the location, while the third one the advantages of remaining on the national market and internationalisation, too. The eclectic theory, based on the O.L.I. theory (Ownership, Location and Inter-nalization), considers all three main components as a process and, on the basis of these factors, it decides on whether entering the international market or not, as well as the hotel property investments abroad. The eclectic theory of Dunning can be used best regarding the chains of hotels when they make their decisions on private property investments.[20]
The first component of the O.L.I. theory is assessing the size of the enter-prise, the international experiences of the company, the extent of the technical-technological development, and the strategy of branding in connection with the proprietary relation.
The second main component is the location, the selection of which is a multi-ple-stage decision process. In case of a location which is abroad, the first step is the selection of the country, in which the economic situation of the country, the regulations for the investment, the political, legal and tax conditions, the stabil-ity, the business environment, the market competition and the local characters, taking the payback time also into consideration, are assessed.
The third component cannot be a question for the big chains of hotels anymore, because of the international character of tourism; even numerous smaller and
[19] Dunning, J. H. – McQueen, M. (1982): Multinational corporations in the international ho-tel industry. Annals of Tourism Research, 9. 69–90.; Dunning J. H. – Kundu, S. (1995): The Internationalization of the Hotel Industry: some new findings from a field study. Management Interna-tional Review, 35(2). 101–133.[20] Ref.: Weiermair, K. – Frehse, J. (2008): Real estate private equity investment and its impacts on the business development strategy of international hotel companies in European tourism destinations. In: Keller, P. – Bieger, T. (2008): Real Estate and Destination Development in Tourism. Successful Strategies and Instruments. Erich Schmidt Verlag, Berlin. 217–231.

100
ATTIL A ALBERT TÓTH
medium-size companies choose to become international on the regional level.[21] Even two chains of hotels with national centre can provide an example for
this: Danubius and Hunguest also own and run hotels abroad. First of all, in the surrounding countries and in some countries neighbouring those.
Lee – Koh – Xiao’s (2014) essay analysed and compared the American hotels and the hotel chains also operating on the international market with the hotels operat-ing only on the American (domestic) market, during the period between 1990 and 2010.[22] According to the assessment, the hotels of the international chains have reached much better financial and operational results than the hotels operating only on the domestic markets. In these hotels, the advantages of belonging to an international chain, the professional knowledge that was collected during the decades and the high level of corporate culture have not only meant advantages in the operation but it could also play a dominant role in the profit maximisation.
HOTEL DEVELOPMENTS IN HUNGARY IN THE TOURISM REGIONS, DATA COLLECTION AND METHODOLOGY
According to my research, over the last few years, the Hungarian hotel industry was facing a significant development before the outbreak of the economic crisis, which was slowed down by the crisis to a certain extent, but the majority of the development ideas were, even with some delays, realised.
The period of the assessment started in 2008, when one could not know yet whether the economic crisis would influence the prevised hotel investments in the future.
I collected and grouped in the breaking down after the tourism regions the planned and prevised investments in the hotel industry in Hungary on the basis of the then available resources (data of Hotel and Restaurant Association of Hungary). The first target of the research was to explore the territorial dispropor-tions of the planned hotel investments across the different regions.
Later, in the years to follow, the assessment of the final capacity data also took place in two steps with the implementation of the investments, the growth of the capacities and the elimination of the distorting effects (alteration of the legal regulations, and of the categories). At first, up until 2012, this took place by extending the period with the necessary investment and construction time until the opening of the hotels, because the implementation of the prevised develop-ments was considered as realistic until this time. In case of the period between 2012 and 2015, I did not analyse the proportion of the implementation of the prevised investments any more. The main reason for this was the postponement
[21] Johnson, C. – Vanetti, M. (2005): Locational strategies of International Hotel chains. Annals of Tourism Research, 32(4). 1077–1099. [22] Lee, S. – Koh, Y. – Xiao, Q. (2014): Internationalization and financial health in the US hotel industry. Tourism Economics, 20(1). 87–105.

101
TOUR ISM DESTINATION DEVELOPMENT . . .
of the investments that could be noticed during the years of the economic crisis, the shifting in time and the abdication of the investments. The other reason is that later, maybe by way of a precaution originating from the experience of the economic crisis, the number of the published, prevised hotel investments were relatively low. At the end of the period surveyed, I assessed the most important tourism, hotel industry index numbers and their effects on the life cycle of the tourism regions on the basis of the realized developments between 2008 and 2015.
ANNOUNCED AND REALISED HOTEL DEVELOPMENTS IN HUNGARY
Examining t-he effect of the hotel developments on the capacity increase, one can state that from the year of 2008 until 2015, the number of lettable rooms in the Hungarian hotel industry increased by 19 per cent, which is, overall, less than the quantity of the developments that were in progress at the end of 2008 and announced for the period of 2008-2012. Because of the economic crisis, many hotel investments were postponed in time and there were some which were not implemented at all. However, the territorial distribution of the developments had changed significantly as compared to the prevised plans. The regions of the Southern Great Plain and Northern Hungary were the definite winners of the hotel industry investments of the given period, the capacity of hotel rooms increased by 40 per cent, in the latter by 39 per cent during the seven-year period. In the Northern Great Plain region, the extent of the development was spectacular after the year of 2012, and due to this, the capacity of the hotel rooms increased by 30 per cent in the region. Unfortunately, the hotel capacity hardly increased by Lake Balaton, which meant an increase of 2 per cent in total, with less than three hundred new hotel rooms. The number of lettable hotel rooms stagnated by Lake Tisza, moreover, it even decreased a little bit.
From Table 2, one can see that a significant part of the hotel developments, about 44 per cent, were planned into Budapest and the Central Danube tourism region in 2008, from which more than 60 per cent into the capital. The increase of the hotel capacity would have been altogether 47 per cent in the four Trans-danubian regions, while in the Budapest and the Central Danube region it would have already reached the proportion of 92 per cent and the increase of the hotel capacity of the four tourism regions in the Eastern part of the country would have been just 8 per cent.
In Table 2, one can see in the column of the fair share and the new develop-ments, too, that the proportion of the planned investments in the Eastern regions was much less than the proportion of the already existing capacity. The territo-rial distribution of the planned developments shows the preferences of the inves-tors at the time, that the buildings of the new hotels were planned first of all in the capital and its surroundings, and in the Transdanubian region, and less were planned in the Eastern part of the country.

102
ATTIL A ALBERT TÓTH
Table 2: Announced Hotel developments in the tourism regions 2008–2012.
Tourism regions in Hungary
Room capacity31st of July,
2008
Fair share %
Projected new develop-
ments between 2008-2012
(+ new rooms)
Fair share of announced new developments
%
Budapest and the Central Danube region
17 936 35,4 + 4926 44,4
Northern Hungary 3263 6,4 + 543 4,9
Northern Great Plain 4105 8,1 + 150 1,4
Lake Tisza 452 0,9 0 0
Southern Great Plain 2741 5,4 + 236 2,1
Central Transdanubia 1956 3,8 + 1030 9,3
Lake Balaton 12 550 24,8 + 1445 13,0
Southern Trans-danubia 2363 4,7 + 1212 10,9
Western Trans-danubia 5303 10,5 + 1552 14,0
Summary 50 669 100,0 + 11 094 100,0
Source: Own calculations, on the basis of the issue of the MSZÉSZ and the HCSO statistics.
In case of the realisation of all development ideas and plans, the hotel capacity of the country would have increased by 22 per cent, but in the meantime, as a result of the effects of the economic crisis, a lot of investments were postponed or suspended owing to financial difficulties. Many investors simply gave up the planned investments, foreign developer companies even left Hungary. The inves-tors judged the situation more realistically by the end of 2011, because a signifi-cant part of the investments, in the above table, had been realised. Nevertheless, it was welcomed that significant part of the investments had not been planned to Budapest and only to the Transdanubia either, but thanks to the effect of the new Mercedes factory, to Kecskemét and other locations as well. Even at that time, the special big proportion of a planned development, the Euro Vegas hotel with 632 rooms in Bezenye, had already distorted the proportion of the developments, which would have meant more than 5 per cent of the new investments in total. The hotel investment, that has already been uncertain for many years, would have been built in the County Győr-Moson-Sopron, next to the Austrian and Slovakian border, and this would have been the biggest hotel of Hungary. Between 2008 and 2012 the Hungarian hotel room capacity increased by 8019 rooms, to 58214 lettable rooms, which during the period of four years meant an increase in capac-ity by 22 per cent instead of the 16 per cent on a nationwide level, but in different

103
TOUR ISM DESTINATION DEVELOPMENT . . .
proportions per tourism regions, so the market distribution of the capacities also changed to some extent.
Unfortunately, the data of the capacity increase was distorted by the fact that in the meantime, as a result of the change of the legal regulations in 2009, many of the large pensions carried on with the operation as a hotel after the reclassifica-tion. The increase of the capacity owing to the reclassification was considerable, because in the meantime the capacity of the pensions decreased by 3108 rooms by the year of 2013 as compared to the year of 2008 and the “units with hotel type” (the hotels and the pensions together) had increased by 4437 rooms.
In the meantime, some hotels with credit problems were closed temporarily or permanently, though the majority were operating continuously, and, however, their owners and operators changed, at best the guests were not affected by it in any way, part of the hotel personnel changed in the hotels concerned.
Having eliminated the distorting effects, the real new hotel developments meant an increase of capacity of about 9 per cent during the four years as compared to the announced development intentions of 22 per cent. Location No. 1 of the real-ised development was Budapest and the Central Danube region, just half of the increase was realised in the capital and its surroundings.
After the year of 2012, the territorial distribution of the developments changed significantly as compared to the announced plans. (Table 3)
Table 3: Assessment of the realisation of the Hotel development until 31st of July, 2015
Tourism regions in Hungary
Room capacity31st of July, 2015
Fair share %
Changes between 2008-2015
(+ new rooms)
Fair share of changes
%
Budapest and the Central Danube region 21706 36,0 + 3770 39,1
Northern Hungary 4505 7,5 + 1242 12,9
Northern Great Plain 5337 8,9 + 1232 12,8
Lake Tisza 440 0,7 - 12 -0,1
Southern Great Plain 3829 6,3 + 1088 11,3
Central Transdanubia 2544 4,2 + 588 6,1
Lake Balaton 12 827 21,3 + 277 2,9
Southern Transdanubia 2874 4,8 + 511 5,3
Western Transdanubia 6235 10,3 + 932 9,7Summary 60 297 100 + 9628 100
Source: own calculations, based on HCSO statistics.
Examining the effects of the hotel developments on the increase of capacity, one can state that the number of lettable rooms in the Hungarian hotel indus-try increased by 19 per cent between 2008 and 2015, which is less in total than the number of the developments being in progress at the end of 2008 and were announced for the period of 2008–2012.

104
ATTIL A ALBERT TÓTH
The hotel developments and the already larger capacity benefited the devel-opment of the tourism destinations, too. The tourism regions had undergone a significant development as far as the overnight stays, the room prices, the incomes and as far as one of the most important hotel index numbers, the RevPar index was concerned, too.
Table 4: The extent (proportions) of the changes in the hotel industry after the tourism regions, between 2008 and 2015 (2008=100 %; 2015= %, results in the table)
Tourism regions in Hungary
Hotel room Capacity Guest nights Room
revenue RevPar* Life cycle stage
Budapest and the Central Danube
region121 143 151 127 Development
Northern Hungary 138 204 227 153 Development
Northern Great Plain 130 112 138 119 Development
Lake Tisza 97 119 162 162 Development-Consolidation
Southern Great Plain 140 165 205 158 Development
Central Trans-danubia 130 169 194 145 Development
Lake Balaton 102 111 143 137 Development-Consolidation
Southern Trans-danubia 121 144 151 119 Development
Western Trans-danubia 117 134 154 128 Development
Summary (average) 119 137 156 129 Development
Source: own calculations, based on HCSO statistics. (*RevPar: Revenue per Available Room)
Analysing the performances of the tourism regions (Table 4) one can state that without taking into account three regions, the other regions were undergoing a significant development during the assessed seven years. As a matter of fact, each region is in the phase of development, but there are big differences between the extents of the developments. From the regions Lake Balaton and Lake Tisza can be considered as an independent tourism destination and, however, each devel-oped in respect of the incomes, the change of the number of the overnight stays and the capacities have changed only slightly. These rather refer to a consolida-tion, in spite of the fact that there is huge development potential in the two tour-ism destinations, but more developments would be needed for them. Not only the

105
TOUR ISM DESTINATION DEVELOPMENT . . .
increase of the hotel capacity, but the development of the attractions and tourism products, the improvement of the quality of the already existing hotels, better marketing, and the branding of the destinations, too. Lake Balaton and Lake Tisza are the locations of the native tourism primarily, the turnover of which is signifi-cantly determined by the tourism stimulating effect of the Széchenyi Recreation Card. The completeness also includes that the proportion of the accommodations of other types is much higher in these regions than in other regions, but the analy-sis primarily focused on the concerns of the hotel industry. The seasonality and the dependence on the weather also influence the tourism performance of the two regions and even the willingness of the investors in the hotels too. From this point of view, there was a modest change during the assessed years.
Two regions, Northern Hungary and the Southern Great Plains developed to the greatest extent, which at first did not seem to be realistic on the basis of the plans of 2008, but luckily the trends changed after the crisis and the investor senti-ment, too.
CONCLUSION
The development of the hotel industry and the accommodations are in direct connection with the general development and popularity of the tourism areas. The quantity and the quality of the capacity supply influence the reservation indexes, the potential of the hotels to generate profit and their profitability. The capacity and the number of the overnight stays influence the personnel manage-ment of the hotels, which influences the rate of employment, first of all the labour force market position of the surrounding areas. If there is an oversupply from the accommodations, it will affect the operational results unfavourably and it could force the lower-selling hotels and other accommodations to reduce their prices. The negative price spiral could generate an uncertainty on the market and finally it could stop the development because further investments may be postponed or withdrawn.
It is important that each expert who deals with tourism development pays attention to the life cycle curve of the destinations and it is important to recognize in which stage the tourism destination is right now. The developments have to be planned accordingly. For example, in the declining stage it is already risky to execute big investments. However, this is not set in stone and it is not impossible that this results in the fact that the destination enters a new stage of development or reborns.
The regional analysis of Hungary has also brought very interesting results. On the basis of the first summaries, the majority of the developments were planned to Budapest and its surroundings, but luckily, it changed in the course of time and the trends changed in the second part of the examined seven years. Northern Hungary, the Southern Great Plains and the Northern Great Plains developed well in spite of the earlier development forecasts. It is advantageous that the extent of

106
ATTIL A ALBERT TÓTH
the hotel investments was even better in the Eastern part of the country as well and the results of the tourism worked well, too.
Nowadays, a hotel investment is more and more considered as a special prop-erty investment, therefore the property market greatly influences the strategies of the investors, especially on the international markets, by the chains of hotels. Several developers have left Hungary because of the economic crisis, however, there were not many investments in the chains of hotels in Hungary earlier either, with the exception of the capital. These investors usually analyse the market in a professional way. The life cycle, the competitive position of a given tourism destination, the competitors and the expectable results on the market. The market entrance strategy they follow is usually well-prepared, it is the consequence of a deliberate decision and the appearance of an international hotel chain in a desti-nation that can also forecast the success of a given area, too.
REFERENCES
• Buhalis, D. (2000): Marketing the competitive destination of the future. Tourism Mana-gement 21. 97–116. http://dx.doi.org/10.1016/S0261-5177(99)00095-3• Butler, R. W. (1980): The concept of a tourist area cycle of evolution: implications for management of resources. Canadian Geographer, 14. 5–12. DOI ttp://onlinelibrary.wiley.com/doi/10.1111/j.1541-0064.1980.tb00970.x • Cooper, C. (1994): The destination life cycle: an update In: Seaton, A. V. (ed.): Tourism, The State of the Art. John Wiley & Sons, Chicester. 340–346.• Dunning J. H. – Kundu, S.(1995): The Internationalization of the Hotel Industry: some new findings from a field study. Management International Review, 35(2). 101–133. • Dunning, J. H. – McQueen, M. (1982): Multinational corporations in the international hotel industry. Annals of Tourism Research, 9. 69–90. • Fattorini, E. J. (1999): Accommodation strategy and accommodation stock in the hotel industry. In: Verginis, S. C. – Wood, C. R. (eds.): Accommodation Management. Perspectives for the International Hotel Industry. International Thomson Business Press. 63–72. • Getz, D. (1992): Tourism Planning and Destinations Life Cycle. Annals of Tourism Research, 19(4). 752–770. • Gunn, A. Clare (1994): Tourism Planning: Basics, Concepts, Cases. Taylor & Francis, London.• Gu, Z. – Kim, H. (2003): An Examination of the determinants of Hotel REIT’s unsystematic risk. Journal of Hospitality & Tourism Research, 27(2). 166–184. • HCSO (Hungarian Central Statistical Office) (KSH) Tourism statistics, 2008–2015 own data collection. www.ksh.hu• Jancsik A. (2011): A turisztikai terek életciklusát mérő indikátorok. (Indicators of Tourism Area Life Cycle) Turisztikai kutatások módszertana. 6. fejezet. Digitális tananyag. Pécsi Tudományegyetem (www.eturizmus.pte.hu)• Johnson, C. – Vanetti, M. (2005): Locational strategies of International Hotel chains. Annals of Tourism Research, 32(4). 1077–1099.

107
TOUR ISM DESTINATION DEVELOPMENT . . .
• Krippendorf, J. – Messerli P. – Hanni H. (1982): Tourismus und regionale Entwicklung. Verlag Rüegger, Diessenhofen.• Lee, S. – Koh, Y. – Xiao Q. (2014): Internationalization and financial health in the US hotel industry. Tourism Economics, 20 (1). 87–105. DOI: http://dx.doi.org/10.5367/te.2013.0261.• Leonard, S. (1992): A Hotel is More than a Real Estate. Hotels, 26(7). 35. • Ma, M. – Hassink, R. (2012): An Evolutionary Perspective on Tourism Area Development. Annals of Tourism Research, 41. 2013. 89–109. http://dx.doi.org/10.1016/j.annals.2012.12.004• Mundruczó Gy. – Stone, G. (1996): Turizmus. Elmélet és gyakorlat. (Tourism. Theory and Practice) Közgazdasági és Jogi Könyvkiadó, Budapest.• MSZÉSZ (Hotel and Restaurant Association of Hungary (Announced Hotel developments, 2008–2012, own data collection) www.hah.hu• Puczkó, L – Rátz, T. (2005): A turizmus hatásai. (Impacts of tourism) Aula Kiadó, Budapest.• PWC (1999): Real Estate Cycle Methodology. The Global Strategic Real Estate Group of PricewaterhouseCoopers. • Raleigh, L. E.– Roginsky R. J. (eds.) (2012): Hotel Investments. Issues & Perspectives. American Hotel & Lodging Educational Institute, Lansing, Michigan.• Romao, J. – Guerreiroa, J. – Rodrigues, P. (2013): Regional tourism development: culture, nature, life cycle and attractiveness. Current Issues in Tourism, 16(6). 517–534. http://dx.doi.org/10.1080/13683500.2012.699950.• Rushmore, S. (1992): Hotels and Motels. A Guide to a Market Analysis. Investment Analysis and Valuation. Appraisal Institute, Chicago.• Rushmore, S. – O’Neill, W. J. – Rushmore, S. (Jr.) (2012): Hotel Market Analysis and Valuation. Appraisal Institute, Chicago. • Schuckert, R. M. – Boksberger, E. P. (2008): Development of destinations and real estate in a tourism region – An application of life cycle theory. In: Keller, Peter – Bieger, Thomas (ed.) (2008): Real Estate and Destination Development in Tourism. Successful Strategies and Instruments. Erich Schmidt Verlag GmbH, Berlin. 232–247. • Weiermair, K. – Frehse, J. (2008): Real estate private equity investment and its impacts on the business development strategy of international hotel companies in Euro-pean tourism destinations. In: Keller, P. – Bieger, T. (2008): Real Estate and Destination Development in Tourism. Successful Strategies and Instruments. Erich Schmidt Verlag, Berlin 217–231. • Zhang, C. – Xiao, H. (2014): Destination development in China: towards an effective model of explanation. Journal of Sustainable Tourism, 22(2). 214–233. http://dx.doi.org/10.1080/09669582.2013.839692.
HUNGARIAN SUMMARY
A turisztikai fogadóterületek életciklusának minden fázisában szükségesek a fejlesztések, ezek nélkül nem válhatna egyetlen, még arra alkalmas, turisztikai vonzerőkkel rendelkező terület sem igazán sikeres turisztikai desztinációvá. Az alapinfrastrukúra és a turisztikai szuperstruktúra (superstructure) fejlesz-tése, beleértve a szállodai beruházásokat, kiemelt jelentőségűek, mert csak ezek

108
ATTIL A ALBERT TÓTH
által biztosítható az adott területen a turisták, a vendégéjszakák számának és a bevételeknek a növekedése. Még a stagnálás fázisában is szükségesek a szállodai fejlesztések, ilyen időszakban nem a kapacitásbővítés, hanem a szolgáltatásfej-lesztés, a színvonal megőrzése, és a hanyatlás elkerülése a cél. A tanulmány a szállodaipari befektetések sajátosságait mutatja be, a turisztikai fogadóterületek életciklus modelljének, a szállodai ingatlanfejlesztés jellegzetességeinek elemzé-sével, nemzetközi és hazai példák által.
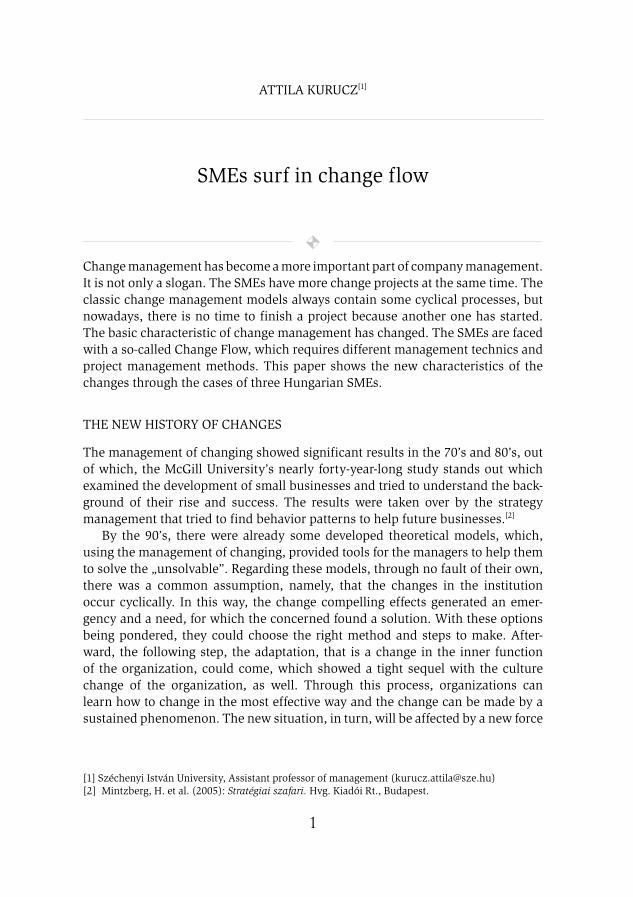
1
ATTILA KURUCZ[1]
SMEs surf in change flow
Change management has become a more important part of company management. It is not only a slogan. The SMEs have more change projects at the same time. The classic change management models always contain some cyclical processes, but nowadays, there is no time to finish a project because another one has started. The basic characteristic of change management has changed. The SMEs are faced with a so-called Change Flow, which requires different management technics and project management methods. This paper shows the new characteristics of the changes through the cases of three Hungarian SMEs.
THE NEW HISTORY OF CHANGES
The management of changing showed significant results in the 70’s and 80’s, out of which, the McGill University’s nearly forty-year-long study stands out which examined the development of small businesses and tried to understand the back-ground of their rise and success. The results were taken over by the strategy management that tried to find behavior patterns to help future businesses.[2]
By the 90’s, there were already some developed theoretical models, which, using the management of changing, provided tools for the managers to help them to solve the „unsolvable”. Regarding these models, through no fault of their own, there was a common assumption, namely, that the changes in the institution occur cyclically. In this way, the change compelling effects generated an emer-gency and a need, for which the concerned found a solution. With these options being pondered, they could choose the right method and steps to make. After-ward, the following step, the adaptation, that is a change in the inner function of the organization, could come, which showed a tight sequel with the culture change of the organization, as well. Through this process, organizations can learn how to change in the most effective way and the change can be made by a sustained phenomenon. The new situation, in turn, will be affected by a new force
[1] Széchenyi István University, Assistant professor of management ([email protected])[2] Mintzberg, H. et al. (2005): Stratégiai szafari. Hvg. Kiadói Rt., Budapest.

tan
ulm
án
yok
2
ATTIL A KURUCZ
that leads to a new turn, and then the new situation will wait for its new change. However, we can easily find change management projects that were unsuccessful, which, after presenting a superficial activity, are aligned back and remain in the previous behavior pattern.
The change demanding „voices” do not vanish in this case either and new projects follow each other without major changes in the point.
On the other hand, not long, only 1-2 months, after the more or less successful changing management projects, the companies do not feel comfortable with the worked-up situation and start making new changes, then wait for its long-term results, but it does not happen because by the time it has revealed itself, they have to face another challenge.
These situations point out that we have to reassess the current standardization of the change (so-called typologies) and the presence of the changes in the organi-zations. Of course, there is a need for further changes, but we cannot „conserve” their results in the organizations for long. There are more obstacles to face when trying to maintain the new achievements in the organization, but two of them definitely have to be highlighted:
• The changes, even in some part-sectors, can take apart a complicated configuration, which will affect the whole organization immediately, via modern IT.
• On the other hand, changes follow each other so fast that they actually correlate in time and we have to deal with several changes at the same time. We cannot split them up and handle them separately.
The methodology of change management has to adapt to the today ever-changing hyper reality. Maybe it is even more important to open our minds to new dimen-sions. A new way of thinking can help us to handle the changes appropriately. Sometimes, we may feel that only the planning phase can have some flaws, but in my consulting practice, I have seen many cases at small and medium-sized companies, in which I could see on the CEO’s face that there are situations that could not be planned ahead. How should we prepare for such changing times? Is consciousness an opportunity, or a bad thing that has to be handled?
In this study, this question still remains open. However, in fact, it points out that the turbulence of the changes is increasing has a faster effect, and new changes are constantly being caused. In these situations, we cannot talk about open innovative elements, however, we can realize, that a contiguous conflict generates starts, where power, structural, and self-interested fights rearrange the structure. Putting it another way, changes start in more fronts and we cannot tell their roots, namely, their effect is a combined result, because by the time we see the result, another effect will have evaded it.
We can tell that when we are talking about changes, it gets less and less mean-ingful to talk about revolutionary, non–revolutionary, radical, or incremental

3
SMES SUR F IN CHA NGE FLOW
changes. It does not make any sense to separate the smaller changes from the major ones, which affect the organization, especially if we are talking about small and medium-sized enterprises. SMEs have lots of idiosyncrasies that provide forever changing signs in themselves. The changes affect the whole company very fast, the business administration (leadership, strategic parts) process and the operative function as well. In the next part, some peculiarities of the SME sector will be looked over in order to describe the new dimensions of changes.
THE PARTICULARITIES OF SMES FROM THE VIEWPOINT OF CHANGE MANAGEMENT
SMEs react differently to the changes of the market according to their size, culture, and organization model. That’s why, we need to describe competitiveness in a different way, from their point of view.
The SMEs motivation for a change does not differ necessarily from the motiva-tion of bigger companies, so we can accept the results of a German study carried out in 2000.[3]
According to the study, 98% of the interviewed CEOs made minor changes in their company.
• These can lead back to four root causes:• The development of technology • The changing of markets • The globalization of market competition • The demographic changes on the labor market
Small companies also have to face these factors and try to use the most up-to-date technology, find their own market (under global conditions as well), just as well as find skilled labor speaking foreign languages and locally available.
Nevertheless, in the competition, one of the most important factors of the SMEs is their enlargement; only a few companies can survive without growing - these are some localized SMEs that produce for the local market.
In case of small and medium-sized companies, we do not literally mean enlarge-ment by the size of their fortune. We have to add, that the entrepreneur, who does not wish to adapt to the changing environment, does not take the permanent renewal criteria into consideration, and does not recycle some of the gained profit devitalizes the company after a while. This reveals that for further subsistence some business growth has to be reached through investments.
Small and medium-sized corporations start in minimal sizes because of equity risk, thus they can estimate their opportunities and capabilities or rather prevent a bigger loss due to a failure. In the life of a small company a certain level of growth
[3] Farkas Ferenc (2013): A változásmenedzsment elmélete és gyakorlata. Akadémia Kiadó, Budapest.

tan
ulm
án
yok
4
ATTIL A KURUCZ
can be reached anyhow, however the determination of the ideal size is the CEO’s responsibility, who allows the company to grow until he or she can still handle it. Then he will be the obstacle of the further growing. Chikán, Attila’s opinion about small business strategies: One of the main characteristics of the compet-ing companies is that they do not have those competitiveness ensuring strate-gies which can facilitate their survival in a strong price competition.: Neither by reaching thrift with the increase of the production, nor by settling down on cheap material resources. Neither of these is a real option for them.[4]
According to J. Wright, there are two routes left for them to follow in order to gain advantage in the competition: specialization and special treatment. The author says: „Companies can focus on a specific group of consumers, provide the right products for special needs, build their own relationships network, or they can compensate the high level of price with extra good quality.”[5] Furthermore, the author considers the personal attention paid to the customers important, together with the long-term loyalty to the activity. Moreover, this is to be mani-fested through the everyday operational functions.
The most successful small businesses can identify with the strategy as a vision, just like entrepreneurs can. However, if these entities grow too fast, piling their success, they can easily get off the marked route.
„Competitiveness is an often used economic concept but it does not have a conventional definition. Its variousness should definitely be found in the wide range of factors of competitiveness, from which different analysts consider differ-ent ones important and outstanding. In fact, there is a wide palette to the mean-ing of the definition, because competitiveness can be interpreted in many levels of the business environment. We can talk about the competitiveness of different groups of countries, for example the European Union, countries, regions, smaller geographical areas, sectors, business groups, and a company.
We can distinguish between macro and micro level competitiveness.”[6]
When looking for some help in working out a magnificent strategy and look-ing around in the literature studies, the leader may face a huge abundance in the topic. For companies, it is an exciting challenge to draw up answers, increase their outcomes, keep the success, or renew initially. They can get similarly much support from the change management writings where specific models can help them out.
The previous studies on the SMEs’ strategy described that they cannot provide appropriate grouping of strategic tools according to the different schools and various directions. However, they pointed out that beside the
[4] Chikán A. (2010): Vállalatgazdaságtan. Akadémia Kiadó, Budapest.[5] Chikán A. et al. (2002): Az értékteremtő folyamatok menedzsmentje. Aula Kiadó Kft. Budapest.[6] Némethné G. A.(2007): Statisztikai módszerek alkalmazásának lehetőségei a kis- és középvállalko-zások versenyképességének elemzésében. 4. p. downloaded from: http://www.sze.hu/etk/_konferen-cia/publikacio/Net/eloadas_nemethne_gal_andrea.doc;[03.06.2008.]

5
SMES SUR F IN CHA NGE FLOW
‘concentrated leadership’ and the ‘manual control’ the more intuitive methods are more popular.[7]
As a support of the growth strategy, a new goal has showed up: the develop-ment of a cost-effective organization. One way for this is outplacement, when some property is sold to a legally independent company. Further solution can be the application of a decentralized leading mechanism, that will allow the company to receive some foreign capital and knowledge; moreover, the owner’s and the entrepreneur’s interests are not harmed.
The extreme and dynamic growth can cause further problems, which can cramp the advancement of the small and medium enterprises’.
They are listed below:[8]
• Overgrow their current markets; • Overgrow their present product structure; • Their knowledge is not enough for the daily business administration; • Lack of management abilities; • The middle-sized company lost its strategic direction; • The profit decreases; • The need of external capital injection appears; • A decision is necessary to be made whether to continue to grow or not;• Focusing on the mergers and acquisitions of the company; • Overgrowing the small size; • Out-of-date functioning system; • Losing the personal contact with the employees; • The inner communication of the organization is formalized; • The conversion of the tacit knowledge to explicit knowledge.
The main reason for the previous factors is the degradation of the business perfor-mance of smaller companies (e.g. reducing profit, or even losses are made, or having operational deficiencies) and the consequence of this is the cracking of capital strength or market position. Furthermore, it can cause an economic disad-vantage for the business or even worse, bankruptcy.
The right solution cannot be clearly seen; the possible alternatives are not trivial, if we think about a small organization with a maximum of two-level hier-archy and only a few people working in different positions and roles. In this situa-tion, there is no administration capacity available and these people want to be the change manager with a massive operational approach.
[7] Papp, I. (2006): Tanulás és stratégiaalkotás a kis- és középvállalatoknál. PhD dissertation, SZE, Győr.[8] Snaith, B. – Walker, J. (2002): The Definition of a Medium Enterprise. A Management Account-ing and Control Systems Approach. International Conference on Medium Enterprise Development. Collingwood College, University of Durham. 14–16 July.

tan
ulm
án
yok
6
ATTIL A KURUCZ
The SMEs, due to their behavior and organizational system, react differently to the changes of the market and their environment. In essence, they have to resolve difficult changes in the short term.
The current study wants to focus on the new characteristics of the change management through the following 3 cases of Hungarian SMEs.
THREE HUNGARIAN CASES – CHANGE OF SMALL BUSINESSES
In the study, there will be enterprises I personally worked with as a management or process consultant in the past three years. That is the reason why, according to the privacy statement, I cannot mention their specific names and cannot disclose actual inner information either.
This fact does not distort the conclusion of this paper, and does not obstacles its understanding either.
COMPANY “A”
This SME works in the electronics industry with a HUF 700 million (approx. € 2,26 M) annual turnover and with 100-110 employees. The enterprise is owned by a German parent company with an expatriate Hungarian owner. The owner of the company is the CEO of the German parent company itself, and regularly takes part in the management of the Hungarian company, too. The company has an exces-sively human resource demanding business profile.
In the end of 2012, the enterprise started to work out a new strategy, which required a new top management decision-making mechanism to be introduced. Besides, the company started a reorganization project, and also created four new manager positions (supply chain, quality control, production, and controlling) as well as functional fields. The company accomplished a half-year-long lean project in order to improve the efficiency in the production.
The efficiency change was forced by the Western-European customers’ quality requirements and the low-priced Chinese import substitutes.
There were one to three key customers who always came up with newer demands to keep on the strategical partnership. For example: packaging, labeling, and delivery time shortening.
These internal projects always demanded the mutation or the regulation of some processes.
All of the projects affected the following departments: management, supply chain management (SCM), R+D, production, quality management, and the finan-cial management.

7
SMES SUR F IN CHA NGE FLOW
COMPANY “B”
This is a Hungarian-owned machinery company.It makes a nearly HUF 1 billion (approx. € 3,3 M turnover a year with only
50 employees. The majority owner of the company is the CEO itself. The activity of the company is planning and assembling special machines, therefore, it has a huge competence and capacity in engineering. As the consequence of this tech-nological intensive profile, technology development plays an important role in the life of the company.
In 2010, the enterprise implemented an integrated enterprise resources plan-ning (ERP) software which was created to help the actual 25 employees in the business data processing with a strong emphasis on project management. The substantive changes even affected the order management processing and the invoicing as well. The implementation of the new ERP system entailed the over-thought and audit of the ISO system of the company. After that the company started to grow intensively because this way it was able to win some significant customers and within one and a half years they managed to double the number of workers.
Bigger measures require more serious coordination in the sales activity and in the engineering works, too. Thus, they builed up a new marketing and project department; even a new marketing manager got hired by the company. The next step of the technology development was to establish a new plant where precon-ditioning, preparation and blasting operations could be done. The most impor-tant new technology was the pneumatic paint spray technology, which definitely required new engineer capabilities, skills and worker competences to use the new machines.
Finally, as a result of the sudden growth, the company was able to win larger projects and accumulated inventories. However, the manufacturing of special custom machines typically requires less inventory and suppliance, because many of the parts are used only once. But the management realized that the actual level of stock had become higher. Thus, the bookkeeping department suggested a more serious stock management system to be implemented. According to this, we could handle the problem as a matter of financing.
The changing projects affected the following functional departments of the company: the project management, production, financial management, sales, administration management, stock management and bookkeeping.
COMPANY “C”
The third presented enterprise is a traditional Hungarian family business under the management of the father and his son. It generates a revenue of 200-300 million a year in the footwear industry.

tan
ulm
án
yok
8
ATTIL A KURUCZ
The major part of the activity is wage work in a 60-people plant. The manpower of the whole company means around 70 people. The production process of the company is strongly human resource demanding. Although, it is partly automa-tized, due to the development of the company, custom products showed up which are to be hand-made and of excellent quality. In the life of Company „C” the change is not caused by the growth, but the economic crisis of 2008. The volume of the production had shrunk and the number of employees had decreased by approximately 30% which got stabilized by the year of 2013. During this period, divisions of labours were developed and workplaces were formed. Meanwhile, the two leaders of the company were looking for other possible ways of development.
One of the pillars of the change was to remove the weight from the leaders’ shoulders because in the ongoing „slim” structure they exhausted themselves. They needed an organization to support the new product development along with the more efficient usage of the current production capacity We have to underline that the structural forming of the organization was due to the founder’s retirement and to the fact that he handed over the steering wheel to his son.
Such a succession process can make an important change by itself. The action plan of this change has to be worked out when the organization is born.
Otherwise, the company starts a process optimizing project as well from which we can highlight the logistical process optimizations and the improvement of productivity as important projects. In the life of the company, beside the optimiza-tion of the processes, the question of responsibility and authority was very mark-able, had to be synchronized with the structure of the organization, of course.
The enterprise invested into a new technology in order to produce special tailor-made goods in to which it successfully involved tender resources. This tech-nology is based on IT tools: a scanner can take a picture of one’s feet somewhere abroad, and send the data to the Hungarian local host set up at the headquarters’. According to the drafts, the chief engineer plans the shoes and prepares the docu-ments for the production. The R+D processes and the unique engineering process also have to be modified and reorganized. This progression still continues.
CHANGING PROJECTS AND THEIR INFLUENCE THROUGH THE ORGANIZA-TIONS
According to the cases we can sum up some interesting findings:• Each project was optimally designed for a 2-8 months’ time horizon.• The realization of the joint projects took about 1,5 years, i.e., it was completed
in 18 to 20 months • The projects were running simultaneously: there were 2-3 projects at the
same time at the companies. • One project manager was responsible for more projects and the changes as
well.• The CEO was responsible for 80% of the cases.

9
SMES SUR F IN CHA NGE FLOW
The temporal congestion of change management generates very difficult deci-sion-making situations; they had to make decisions regarding the rules and the efficiency of the processes, either way, which we thought had already been final-ized.
Table 1: The changing project at each company within a 1,5-years-long period
Companies A (Electric Industry)
B (Machinery Industry)
C (Shoe manufacturing)
Cha
nge
man
agem
ent p
roje
cts New strategy creation ERP Implementation Reorganization
Reorganization Capacity expansion (number of employees)
Succession of the founder-CEO
Implementation of Lean production system
Reorganization of project and sales management
Optimization of the purchas-ing process
Process optimization (standardization)
New plant (paint technology) R+D (new scan technology)
Reengineering the field of business administration
and finance
Source: own research.
In many cases, the business leaders remain in these decision-making situations. And it is not necessarily got into the trouble because of the not so clear and confused vision; the modification of their previous conceptions is much more difficult. You may ask why. The reason is quite simple: once a decision is made to fit they have to question themselves.
In case of such decisions the managerial intervention process may occur in several different aspects, and they do not have enough skills, knowledge or expe-rience to evaluate the possible outcomes, that means uncertainty and frustration.
This very fast dynamics of these changes questions the theoretical separation of the radical or incremental changes as the former change management books contains.
The changes definitely influence a large part of the organization; such a project affects at least two to three functions and departments. In the case of SMEs, where we cannot find any top management, the CEO himself has to create and recreate his/her visions, and in this way she/he will act differently in all areas.
tan
ulm
án
yok
10
ATTIL A KURUCZ
Table 2: The extent of organizational change projects
A (Electric Industry) B (Machinery Industry) C (Shoes manufacturing)
Change project Impacted functions Change project Impacted
functions Change project Impacted functions
New strategy creation
ManagementERP Implemen-
tation
Project manage-ment
Reorganization
Management
SCM Production Production
R+D Finance Purchasing
Reorganization
Production
Capacity expansion (number of employees)
Production
Succession of the founder-
CEO
Production
SCM Project manage-ment Management
Quality manage-ment Sales & Marketing R+D, planning
Finance Management Sales & Marketing
Implementation of Lean produc-
tion system
ProductionReorganization of project and sales manage-
ment
Sales & MarketingOptimization of the purchasing
process
PurchasingQuality manage-mentSCM Project manage-
ment ProductionR+D
Process optimi-zation (stand-
ardization)
SCM
New plant (paint technol-
ogy)
Production
R+D (new scan technology)
Production
R+D Sales & Marketing R+D, Planning
Production Project manage-ment
Production plan-ning
Reengineer-ing the field of business
administration and finance
Inventory
ERP
Purchasing
Source: own research.
Thus, changes in the functional areas of the company are interwoven and affect the same process, and so they do it to each other.
11
SMES SUR F IN CHA NGE FLOW
CHANGE FLOW, NEW CHANGE APPROACH
In the study, the presented companies and their change management projects towards us the thought that small businesses and the managers of SMEs should consider the occurrence of changes, and the related new projects in their companies. We have to take note of the fact that the changes are always present in the organizations and thus the change management becomes a daily work leader activity.
This has two consequences: a) the leaders must endeavor to become change managers, who know the relevant methodology as well as b) in their attitudes; they are to accept the changes and are not to believe strongly in the status quo and not to support it. The changes “run at each other” and will cause more and more serious situations requiring decisions. In this case, they have to leave their previ-ous decisions they trust behind, because it should not have an inhibitory effect on the current new decisions they have to make. Although, there is no chance to plan the effectiveness of the changes, in this way it is also practically impossible because of the absence of the needed information and data. On the other hand, it shows that changes will have a major impact on the organization. The leaders in their efforts have to keep in mind a specific configuration and to define its elements.
As the manager implements a decision, it is important that the created process is planned to be a „self-propelled” process. These processes should be worked out without further managerial intervention and they should produce the expected results, in which the tasks and activities of the participants are well-known and they are able to do their job in a continuous manner.
From this point, the process does not need any manual control from the lead-ers, only if some new aspects come into the picture, and the existing mechanisms do not satisfy that. In this case the management makes a new decision in order to adjust them.
Nowadays, the SMEs (but we can say that the larger entities as well) are facing continuous changes, the so-called “change flow”. The changes do not occur at a steady pace, but are constantly present in the life of the company, which ties up resources and has a significant impact on the profitability, and the achievement of the strategic goals.
The change flow is neither cyclic nor incremental. So we cannot find well-defined resting points that can be seen explicitly or may show persistent behav-ioral pattern. Rather, it provides an implicit experimental knowledge gathered through the change for the participants of the change management. This project experience is permanently changing their behavior in ways that they do not return to their previous behavior patterns, but the new ways of behavior are constantly revised and adjusted.
The main principle in the changing process is the “always could be better” principle, but as it has become implemented we have to confront the changes with it and asks again: Is it the best option, or could it be much better? This ques-

tan
ulm
án
yok
12
ATTIL A KURUCZ
tion should be asked regarding the whole project we have made, or about a new process we have calibrated as the outcome of the change project.
CONSCLUSION
After the previous change management typology criticism, we can formulate some proposals for the SMEs in relation to change management, which could be a starting point for future researches.
We deliberately did not put down in writing that it can be refuted, since the new trends of management concept are already on a world-conquering way, but rather we would like to draw attention to the managers and employees of the Hungarian SMEs that they need to be open-minded to accept the postmodern ideas of information economy.
Company managers are responsible for nurturing the successors who are „socialized in change flow”. In this way, these new leaders become trained and experienced enough to become good change managers. For the fast and success-ful change project it is necessary for the managers to detect and evaluate the actual configuration of the organization as soon as possible (internal and external business processes and their integration). It is indispensable to take the next steps in redesigning the company.
The design thinking as a management tool can ensure the inclusion and accept-ance of successful behavior pattern changes for the organizations. The design approach includes the decryption techniques to decrypt the aforementioned design patterns, helping the new, people-oriented solutions (or their prototype) design and construct.
Finally, we emphasize how important it is for today’s SME to live their post-modernity.
On the one hand, in the market, as a seller, the company has to be cool, on the other hand, as an outstanding enterprise between the competitors has to be the „best choice for its employees”.
What does it mean to be cool? As the President of the Hungarian Design Asso-ciation describes it: „The knowledge and information existing as the substance (as an essential aspect) of the goods and services affecting our five senses (sight, touch, hearing, smell, and taste) is cold and often secret, in other words: cool. This is not only true for goods and services, but also true concerning the attractive person of the Information Age. Behind their behavior we suspect a plan built on valuable knowledge, a secret knowledge which makes the owner attractive, excit-ing, erotic, such a person whom, in a given case, we would be happy to touch, employ, or work with”.[9]
[9] Kollár József (2014): A cselekvésre irányuló coaching végterméke: a cool. http://www.iloveschool.] hu/component/content/article/38-dr-kollar-blogja/938-a-cselekvesre-iranyulo-coaching-vegtermeke-a-cool.html [21.04.2014].

13
SMES SUR F IN CHA NGE FLOW
The coolness is not only the appearance of the existing knowledge and infor-mation, the game itself is based on such „hidden” information. The competing company communicating the product, the service this way, will make the image of the company appear as a presentation of a secret plan. The cool person and the cool product express their coolness in a cool way.
Strategic student books have already tried to point out, that we can take advan-tage of the fact that we do not do everything transparently for the market and for other external stakeholders.
This is true in this aspect, too, that changes, such as the secret recipe for a unique and valuable knowledge cannot be made clear, but is also restraint, and this mastery can possibly leak out. And who is a master in this, will be cool.
REFERENCES
• Chikán Attila (2010): Vállalatgazdaságtan. Akadémia Kiadó, Budapest.• Chikán Attila et al. (2002): Az értékteremtő folyamatok menedzsmentje. Aula Kiadó Kft., Budapest.• Farkas Ferenc (2013): A változásmenedzsment elmélete és gyakorlata. Akadémia Kiadó, Budapest. • Kollár József (2014): A cselekvésre irányuló coaching végterméke: a cool. 2014, http://www.iloveschool.hu/component/content/article/38-dr-kollar-blogja/938-a-cselekvesre-iranyulo-coaching-vegtermeke-a-cool.html [21.04.2014.]• Mintzberg, H. et al. (2005): Stratégiai szafari. Hvg. Kiadói Rt., Budapest.• Némethné G. A.: Statisztikai módszerek alkalmazásának lehetőségei a kis- és közép-vállalkozások versenyképességének elemzésében. downloaded from: http://www.sze.hu/etk/_konferencia/publikacio/Net/eloadas_nemethne_gal_andrea.doc;[2008.06.03.] • Papp Ilona (2006): Tanulás és stratégiaalkotás a kis- és középvállalatoknál. PhD dissertation, SZE, Győr. • Snaith, B. – Walker, J. (2002): The Definition of a Medium Enterprise: A Manage-ment Accounting and Control Systems Approach. International Conference on Medium Enterprise Development. Collingwood College, University of Durham. 14–16 July. 2002.
HUNGARIAN SUMMARY
A változásmenedzsment egyre lényegesebb része lett a menedzserek hétköznap-jainak, és ez nem csak aféle szlogen. Egy kis- és középvállalkozás (KKV) több változásprojektet menedzsel egyidőben, a változások egymásra csúsznak. A klasz-szikus változásmendezsment modellekben mindig egyféle ciklikusságról beszé-lünk, de erre már nincs idő, azaz a ciklusok néhány eleme nem valósul meg. Ez azt jelenti, hogy a változásmenedzsment karakterisztikája megváltozott. A KKV-k egy változásfolyamban találják magukat, amely új menedzsment-eszközöket és projektmendzsment módszereket kíván. Írásunkban ezt az új jelentséget írjuk le három magyar KKV esetét bemutatva.

122
MARKÉTA SANALLA[1] – VĚRA PLHOŇOVÁ[2]
New Challenges of E-government: The Use of New Media in Public Administration
INTRODUCTION
It has become a cliché to say that today’s managers, wherever they work, must focus on their customers. They must understand their needs. But how can they find out what a customer wants? They need information.
Communication is one of the principal means of information exchange. However, this exchange occurs not only in our personal and professional lives, but communication also accompanies us when managing our assets and operations, namely in our civil lives. Therefore, it is essential during a negotiation process with the government. In the last twenty-five years, many indicators have changed in this area. A new phenomenon, the Internet, has appeared. This situation joints our lives more and more frequently. During the day, every day, routinely, even such age groups as seniors.
From this point of view, state administration is changing its approaches itself. The state administration tries to ease the citizens’ interaction in the official acts in this area. Kovaříková says (2016), that in an organized institution, the communi-cation is partly formal and partly informal. The second is based in the company independently and often spontaneously, and it should be taken into account, when an information exchange is taking place and creates a platform for the correct process of service providing, especially in public administration.
The new trends of modernization and a so called e-Government have been breaking through administration in the local public sector since the early 1990s. The phenomenon can be called the modernization of public administration and it, together with others, represents part of the reform in the Czech Republic. Some phases of the reforms have been completed more or less successfully. Now, the most important priority of the current reform is to improve the services of the government, which can improve the citizens’ communication with the authorities.
[1] Markéta Sanalla, assistant professor, Private College of Economic Studies Znojmo ([email protected]).[2] Věra Plhoňová, assisetant professor, Private College of Economic Studies Znojmo ([email protected]).

123
NEW CHALLENGES OF E-GOVER NMENT. . .
In line with the global trends in public administration, there are new integrated tools. In this article, among the major challenges, mainly the area of the New Media or the so-called New Media is included. Nowadays, the classic definition, used for the specification of the new media e.g. in. the Oxford Dictionary, is the following: “Means of mass communication using digital technologies such as the Internet: the new media has become central to the political arena” (http://www.oxforddictionaries.com/definition/english/new-media). This new and emerging field of the media is not only a tool for building the information society, but it also arranges communication with the public and the administrative management in an electronic format. The modernization of the public administration, together with its essential terms of computerization, is still in progress and other service tasks are appearing together with new challenges and problems.
In the research, it is supported by facts, that the technologies of public admin-istration are becoming more and more accessible and are spreading much more quickly than before and that the new media is a useful tool of communication. This mean of communication is, however, used mainly by the younger citizens of the municipalities so the public administration must also bear in mind the elderly age group which prefers mainly the classical means of communication, such as local newspapers. Therefore, the task of the municipality is to choose a combina-tion of means of communication through which the information can reach all the citizens.
THEORETICAL BASIS
CONTEMPORARY CHALLENGES OF PUBLIC ADMINISTRATION
The paper analyses the current challenges in the sphere of public administration with an emphasis on the new media issues. The basic issue is communication. Communication is the act of transferring information from one person to another. This is the main tool to be used to exchange information between the residents and the authorities. The means of transfer can be very different.
Public service organizations are often characterized as being slow-moving bureaucracies, bound by red tape, dominated by rules and slow innovation.[3]
This is the reason why it is necessary to clarify the terminology in the beginning of the text. There are many definitions of public administration. The same feature of all the definitions postulates that, in essence, it is an activity that provides the management of public affairs. Petr Prucha and Karel Schelle define public admin-istration in their book, the Foundations of Local Government. Therefore, public administration is supplemented by a definition that “public administration in a society, organized in the state, means governance, implemented in its role as a
[3] Lawton, A. – Rayner, J. – Lasthuizen, K. (2013): Ethics and management in the public sector. Routledge masters in public management. Routledge, London.

124
M AR K ÉTA SA NALL A – VĚR A PLHOŇOVÁ
manifestation of executive power in the state. For this executive power, it is char-acteristic to be a predominantly public authority.”[4] Pavel Káňa adds that admin-istration has its roots in the Roman law. “Public administration is the management of human society organized by the state in the state system.”[5]
Nowadays, the reforms and all the complex changes in public administration are so extensive that the public administration system brings a whole new set of challenges. The leading experts on this topic are Richard Pomahač and Olga Vidláková who talk about a social problem. “Public administration is a social problem. People have long believed that this is a problem that requires a solution, and therefore, it is not strange that there are widely developed theories about it, in many forms, that created other problems. For example, not everything written and taught about public administration corresponds to reality, or that the public administration theory is virtually unknown to all those who act as experts in the matters of public administration.”[6]
Responding to the public administration reform and the constant new-coming innovations that address municipalities and regions, the newly emerging tools of modern management are used in public administration. Thus, these tools of modern times contribute to a public administration of a higher quality and effi-ciency and support the democratic principles of governmental and citizen satis-faction.[7]
The new dimensions of public administration introduced the possibility of electronic communication, which is “the transmission of data messages between public authorities and between these authorities and other third parties” (Macek – Štědroň). Legislation carries a general provision. The general provision is carried by Law no. 40/1964 S., the Civil Code, in section 40 Article 3 provides that if a legal act is done by electronic means, it can be signed electronically in accord-ance with the special regulations. Moreover, certain legislations can regulate the possibility of electronic communication precisely, but only in specific cases and agendas. As an example, the Act no. 500/2004 Coll., The Administrative Code, which in Section 37, Paragraph 2, provides that filing. An act directed against the administrative authority can also be made in an electronic form signed by an electronic signature.
There are a lot of ways to understand the social media. This research works with the most commonly used definition, which describes social media as part of New Media connected to internet-based technologies (Jirák – Köpplová). Social media means applications that carry consumer-generated content and network-ing. We could also use a common definition worded by Pete Blackshaw, who says that “media impressions are created by consumers, typically informed by relevant
[4] Průcha, P. – Schelle, K. (1995): Základy místní správy. 1st ed. Iuridica Brunensia, Brno.[5] Káňa, P. (2004): Základy veřejné správy. 1st ed. Montanex, Ostrava.[6] Pohamač, R. Vidláková, O. (2002): Veřejná správa. Praha: C. H. Beck. p. 3.[7] Http://www.grapes.cz/nove-metody-rizeni-ve-verejne-sprave/, [online]. [Cit. 14/11/2013].

125
NEW CHALLENGES OF E-GOVER NMENT. . .
experience, and archived or shared online for easy access by other impressionable consumers”.[8]
The fact that the social media offers a unique opportunity to form a relation-ship between government and citizens, from a mono- or bidirectional informa-tion exchange into a many-to-many communication process, is very important for public administration.[9] Social media means very powerful tools to improve communication in public administration that can develop the quality of services.
Finally, it should be noted that effective communication is only one side of the coin. It must be simple and enjoyable for all involved, and this can be achieved only under the condition that all the ethical assumptions of negotiations are retained, such as the sources of information process and actual recipients of information.
OBJECTIVES AND METHODOLOGY
As mentioned above, the research works with a unique link between public administration and social media. The aim of this paper is to define options for the public administration concerning the use new media in the networks of modern municipalities. New media is managed by smaller municipalities, and limited by the abilities of their users, namely the citizens of these communities, but also by the elected and non-elected officials.
This present research was conducted in the academic years 2014 and 2015 in the Znojmo region. A research area was defined, the former district municipal-ity of Znojmo, in the questionnaire survey. The questionnaires were distributed online and in paper form, too. Another part of the research was directed to the residents of the village Znojmo, administration type number III. In this section of the survey, 150 papers of the relevant questionnaires were returned. The second component of the respondents were the municipalities, administration type number II, in the region of Znojmo.
The total number of municipality respondents, asked electronically, was 78. The filling benefited 38 municipalities to complete the questionnaire in a text document took advantage of.
Seven municipalities, using paper forms, did not respond to any communities. The total number of the returned questionnaires was 45. This number is adequate in relation to the number of municipalities regarding this public administration type in the Znojmo district. The information, obtained by data collection, was evaluated and analysed statistically. The results are shown in the graphs.
[8] Blackshow, P. (2006): The consumer-generated surveillance culture. http://www.clickz.com/showPage.html?page=3576076 [accessed 28.06.2014].[9] Agostino, D. (2013): Using social media to engage citizens: A study of Italian municipalities. Public Relations Review, 39. 232–234.

126
M AR K ÉTA SA NALL A – VĚR A PLHOŇOVÁ
RESEARCH RESULTS
Znojmo’s municipality communicates with its employees by using many ways of the media. One of the possible communication forms, through which the employ-ees can communicate, is the internal network. The department of the municipality utilizes the classical forms of communication, such as phone and e-mail. Some also prefer personal contact. New media, such as Skype and Facebook, which improve the efficiency of the work in public administration, are also very important.
Efficiency is one of the most important parts and the primary goal of the reforming of public administration. The reform widely affected the operation of the domestic institutions, particularly in the early 1990s. However, in the last decade, a wide range of new possibilities based on New Media, was typical. This fact gave scope for conducting researches in the Private College of Economic Studies in Znojmo, too. This paper presents partial results of the research. The answers are illustrating and summarizing the current knowledge that focuses on the public administration, specifically in the region of Znojmo.
One of the possible forms of communication is internal network. In this network, important pieces of information are recorded, e.g. meetings that can be shared with the employees. Facebook is also a very popular method of communication.
This means of communication was initiated by the employees. Facebook is primarily used by the press department, but other people, who are engaged in various town projects, such as “Znojmo – town of green vegetation”, or “The healthy town of Znojmo”, also use it.
Just these employees have an internal work group in the social net of Facebook. They use it for communication very effectively, particularly because they get an insight into which staff member is online and who are those who have already read their messages. This kind of communication is also very useful because in the beginning of the information process, it is necessary to convey the informa-tion to only one person, but sometimes it is essential to pass on the information to more people. In fact, it is also advantageous to use it because we can disclose the information only to the head of department first, and then, in case more people are needed to be involved in the conversation, it is possible to share the informa-tion with them, too, without any problems.
The city police and the fire fighters communicate with the town via SMS. Regarding the communication between the security forces and the municipal-ity of Znojmo, there had not been any problems recorded, until a recent tragedy that happened in Uherský Brod, when the mayor complained about the lack of information originated from the police. There was a police raid in a restaurant where a man with mental problems shot nine people including himself at lunch-time. It was a public threat, but police failed to give sufficient information to the government of the town about the affected organization. In case the police or the fire fighters are managing a problem in Znojmo, they send information through

127
NEW CHALLENGES OF E-GOVER NMENT. . .
text messages to the municipality management, with information reports. The communication between these organs is very well organised.
The communication of the management with the employees of the municipal-ity can be set in different ways. The results of the research, which asked about the employees’ preferences in this process, are shown in Figure 1.
Figure 1: The means of communication preferred by the employees when communicating with the municipalities
Source: own research.
According to the results of the survey, based on the answers of the 38% of the respondents, the majority of the employees consider the telephone as the main form of communication, when communicating with the municipality. According to the 34% of the respondents, the second most preferred way of communication is sending e-mails. It is the cheapest and fastest way to exchange information. 31% of the respondents prefer personal contact, 3% Internet calls (Skype) and 1% the internal network.

128
M AR K ÉTA SA NALL A – VĚR A PLHOŇOVÁ
Figure 2: Valuation of the quality of communication with other employee of the munici-pality of Znojmo
Source: own research.
The other task was to find out how officers assess the quality of communication with other employees or the management of the Municipality of Znojmo. Officials had to grade the quality of the communication by marks, e.g. from excellent to insufficient. Exactly half of the respondents rated the quality of communication very good. 32% of the officials valued the quality of communication as excellent. The communication was assessed as good by 18% of the officials. None of them gave insufficient or sufficient rates.
The research also focused on the citizens. The following figure summarizes the willingness of the citizens to use the social media to communicate with other citizens in the region. The willingness to communicate through new media is clearly visible in all age segments of the respondents.

129
NEW CHALLENGES OF E-GOVER NMENT. . .
Figure 3: The reference of electronic communication to personal conduct in office
Source: own research.
DISCUSSION
The communication within the municipality is more formalized than the commu-nication in the private sector or in other state organizations. It is caused by the fact that public servants may do only what is allowed by the law. Inside the organiza-tion, during communication a linear communication model is applied. This model is typical for both the public administration and most of the private organizations. The linear model of communication means that the superiors communicate with inferiors by orders.[10]
Communication within the bureaucratic organization depends on the politi-cal governance and the legal environment. Decision-making must be performed in accordance with the international standards, laws, and codes, but also by the internal regulations of the authority and the instructions of the superiors. Pomahač writes in his book that the officer can make decisions in two ways, on his own, because he thinks it is the correct one, or because it is told him by his colleagues or superiors to do. Pomahač calls the decision situation the customary law (Pomahač).
Novotná presents in her book that within an office there is the principle of precaution. On the basis of the social contact, the principle suits both the office management and the ordinary employees. When dealing with each task,
[10] Heger, V. (2012): Komunikace ve veřejné správě. 1st ed. Grada, Praha. 96.

130
M AR K ÉTA SA NALL A – VĚR A PLHOŇOVÁ
a rigorously formal procedure is to be followed. In case of any uncertainty, the numbers of critical steps are increased and a lot of consultation control mecha-nisms are used. Not only the application of this principle can last for long, but it can also lead to the indecision of an official. For example, in a situation where the problem is caused by lack of regulation, which one should be followed by the officer (Novotná). According to Novotná, in the organization a so-called vicious circle of bureaucracy takes place. This can be seen as a preference of the organization struggling to fulfil the goals of the organization. The form is preferred to the content, which takes away the organization from reality, and it can also bring misunderstanding to the public (Novotná).
As mentioned earlier in this chapter, the communication inside an office is hierarchical. So, it depends on the powers, the authorities, the competence of the elected representatives and the office staff. Therefore, it is logical that different positions have different information availability. Nowadays, electronic communi-cation prevails in official relations.
CONCLUSION
E-government represents a significant shift forward in the organization, which allows a high level of comfort for a wide range of clients, i.e. those citizens who use the services provided by the government or municipality. In addition to the basic technological security, both the hardware and software have to be able to secure the usage of the service as the most qualified employee - office worker. Data protection is also connected to these two factors. It is closely related not only to the provider of the electronic services but also to the user, who is informed and equipped with the necessary knowledge to be able to avoid the opening of an imaginary gate by his actions for an attack coming from outside or let an unau-thorized access get the data used.
As the main task of the state, or by extension, public administration appears next to data protection and security and creates the appropriate conditions of comfortable services that are provided for clients, i.e. citizens. Comfort is easily available both in time and space. The accessibility of the services via Web portal can make even the officials’ work easier. They do not have to be overwhelmed by their clients’ demands, only in office hours, but they can spread processing in the slots that fit them best, so they are able to satisfy the residents’ needs and use the time given or best suits the law, but always in favour of the clients. As for innova-tion in general and for communication, it must be simple.[11]
Only the new media with its client accessibility can break through the biggest problem of today’s society, and by the extension of public administration, which
[11] Drucker, Peter F. (2008): Classic drucker: essential wisdom of Peter Drucker from the pages of Harvard business review. 1st ed. Harvard Business Press, Boston.

131
NEW CHALLENGES OF E-GOVER NMENT. . .
is the reluctance of the citizens in participating in public life. We can also discuss another step in the public administration reform: the extension of public adminis-tration in the form of user-friendly applications, e.g. a smart phone. Public admin-istration should not merely be a means to handle the necessary administration, but it should be a mediator between the political and civil sphere. It could offer a wide range of possibilities for the civil society in participating in the public affairs. What is, by the way, one of the fundamental principles of democracy? Modern-ized public administration must stand on the strong pillars of a conscious civil society.
REFERENCES
• Agostino, D. (2013): Using social media to engage citizens: A study of Italian municipalities. Public Relations Review, 39. 232–234.• Balík, S. (2006): Komunální politika: Obce, aktéři a cíle místní politiky. 1st ed. Grada, Praha.• Blackshow, P. (2006): The consumer-generated surveillance culture. http://www.clickz.com/showPage.html?page=3576076 [accessed 28.06.2014].• Čmejrek, J. – Bubeníček, V.– Čopík, J. (2010): Demokracie v lokálním politickém prostoru: specifika politického života v obcích ČR (1st ed, p.223). Grada, Praha.• Doseděl, T. (2005): 21 základních pravidel počítačové bezpečnosti. 1st ed. CP Books, Brno.• Drucker, Peter F. (2008): Classic drucker: essential wisdom of Peter Drucker from the pages of Harvard business review. 1st ed. Harvard Business Press, Boston.• Heger, V. (2012): Komunikace ve veřejné správě. 1st ed. Grada, Praha. • Horzinková, E. – Novotný, V. (2008): Základy organizace veřejné správy v ČR. 1st ed. Aleš Čeněk, Plzeň.• Jirovský, V. (2007): Kybernetická kriminalita: nejen o hackingu, crackingu, virech a trojských koních bez tajemství. 1st ed. Grada, Praha.• Káňa, P. (2004): Základy veřejné správy. 1st ed. Montanex, Ostrava.• Kovaříková, J. (2016): Interní komunikace je nutnost! 1st ed. Siria, Praha.• Lane, Henry W et al. (2012): International Management Behaviour: Leading with a Global Mindset. 6th ed. CPI Group, Croydon. • Lawton, A. – Rayner, J. – Lasthuizen, K. (2013): Ethics and management in the public sector. Routledge masters in public management. Routledge, London. • Mates, P. (2007) Reforma veřejné správy: sborník příspěvků. 1st ed. ASPI, Praha.• Mates, P. – Smejkal, V. (2012): E-government v České republice: právní a technologické aspekty. 2nd ed. Leges, Praha.• Matějka, M. (2002): Počítačová kriminalita 1st ed. Computer Press, Praha.• Pomahač, R. – Vidláková, O. (2002): Veřejná správa. 1st ed. C. H. Beck, Praha.• Průcha, P. – Schelle, K. (1995): Základy místní správy. 1st ed. Iuridica Brunensia, Brno.

132
M AR K ÉTA SA NALL A – VĚR A PLHOŇOVÁ
HUNGARIAN SUMMARY
Korunkat olyan túlzsúfolt információs források jellemzik, amelyek gyakran nem relevánsak. A nyilvános adminisztrációnak és a szerkezetének kellene felelni azért, hogy az adminisztrációs folyamatokkal és azok felépítésével foglalkozó polgárok dolga könnyebb, az információáramlás egyszerűbb, gazdaságosabb és hatékonyabb legyen. Ezen célok elérésére jelenleg lehetetlen kellően fejlett tech-nológiai és technikai platformot (felületet) használni. A polgárokkal való kommu-nikációban az E-government (internetes kormányzat) ezen a területen egy lehet-séges eszköz. A többoldalú kommunikáció egy lehetőség a reform során, mert kiemeli a polgár státuszát mint klienst a nyilvános adminisztrációban.


![Worth its salt - Analytik NEWSAgricultural Chemistry and Environment website. Reference literature [1] Sajó, I. (1969) Magyar Kemiai Folyoirat 75, 1–3 Source: Smith, T. and C. Haider](https://static.fdocuments.in/doc/165x107/5ec28d8a862cfe5cb419d0f2/worth-its-salt-analytik-news-agricultural-chemistry-and-environment-website-reference.jpg)