TPL Properties Quarterly Report 2017tplproperty.com/wp-content/uploads/2017/02/TPL-Properties... ·...
16
CORPORATE OFFICE 12th Floor, Centrepoint, Off Shaheed-e-Millat Expressway, Adjacent KPT Interchange, Karachi - 74900 Phone: (+92)-21-35316009, UAN: (+92)-21-111-000-300 Fax: (+92)-21-35316032 Email: [email protected], Website: www.tpl-property.com INFINITE INNOVATION 2017 REPORT MARCH QUARTERLY
Transcript of TPL Properties Quarterly Report 2017tplproperty.com/wp-content/uploads/2017/02/TPL-Properties... ·...

CORPORATE OFFICE12th Floor, Centrepoint, O� Shaheed-e-Millat Expressway,
Adjacent KPT Interchange, Karachi - 74900Phone: (+92)-21-35316009, UAN: (+92)-21-111-000-300
Fax: (+92)-21-35316032Email: [email protected], Website: www.tpl-property.com
INFINITE INNOVATION
2017REPORTMARCH
QUARTERLY
Contents
COMPANY PROFILEVision and MissionCompany Information
DIRECTORS’ REPORTEconomic ReviewUpdate on the Real Estate SectorStandalone PerformanceConsolidated PerformanceCompany OutlookAcknowledgement
FINANCIAL STATEMENTSBalance SheetProfit and Loss AccountCash Flow StatementStatement of Changes in EquityNotes to the Financial Statements
CONSOLIDATED FINANCIAL STATEMENTSConsolidated Balance SheetConsolidated Profit and Loss AccountConsolidated Cash Flow StatementConsolidated Statement of Changes in EquityNotes to the Consolidated Financial Statements
0405
060606070707
10111213
14-19
20212223
24-29

VisionTo be region’s premier property developer providing world-class
infrastructure and quality to investors, supported by the country’s leading team of professionals.
MissionTo set the benchmark for other developers to follow.

06
DIRECTORS’ REPORT
The Directors are pleased to present the unaudited condensed interim �nancial information for nine months ended March 31, 2017 and a brief review of the Company’s operations:
ECONOMIC REVIEW
The Pakistan economy is on a sustainable growth path with most of the indicators, like in�ation and interest rate, the lowest since the last �ve years. Our Country’s GDP is expected to grow at the rate of 5.2% for the �scal year 2016-2017 as compared to 4.7% of last year. This improved outlook is derived from the cumulative impact of government’s economic and structural reform program including gradually improving law and order situation. Further investment in CPEC increased from USD 46 billion jumping more than 30% from its initial commitment which will be used in power generation projects to further strengthen the economy. All these factors have enabled Pakistan to become one of the attractive investment destination for foreign investors.
UPDATE ON THE REAL ESTATE SECTOR
A survey conducted by Zameen.com, an online real estate portal, suggested that Pakistan’s real estate sector managed to post an overall growth of 118% over the last �ve years. All three major cities of Pakistan Karachi, Lahore and Islamabad have posted phenomenal growth over the same period.
According to analysts, Non-resident Pakistanis do not just buy properties for the purpose of living, but also buy these as an investment asset to increase wealth. Population growth has a shortage of housing units and rising disposable income along with falling interest rates have been the key triggers for interest and demand in the real estate sector.
STANDALONE PERFORMANCE
Comparisons of the results of the Company with the corresponding period are given below: brokers to enter the market.
The Company performance has been improved signi�cantly as compared to the last period which is primarily due to reduction in �nance cost including exchange loss. This exchange loss was incurred in the last period due to a foreign currency loan which was repaid by the company while other factors in decreased �nance cost is reduction in associated company loans and their related interest rates as compared to the prior period.
There are no material changes in the commitments or the fair value of investment property as disclosed in respective notes to the condensed interim �nancial statements.
05
BOARD OF DIRECTORS LEGAL ADVISOR
Jameel Yusuf (S.St) Chairman Mohsin Tayebaly & Co. Ali Jameel DirectorBilal Alibhai Director Ziad Bashir Director BANKERSMaj. Gen (R) Zafar-ul-Hasan Naqvi Director Vice Admiral (R) Muhammad Sha� HI (M) Director Habib Metropolitan Bank LimitedYousuf Zohaib Ali Director United Bank limitedAli Asgher Director Habib Bank Limited JS Bank LimitedCHIEF EXECUTIVE OFFICER Al Baraka Bank (Pakistan) Limited Summit Bank LimitedAli Jameel CHIEF FINANCIAL OFFICER SHARE REGISTRAR
Ali Abbas THK Associates 1st Floor, 40-C, Block-6, PECHS,
Karachi-75530, Pakistan. Tel: (021) 34168270
UAN: 111-000-322 Fax: (021) 34168271
AUDIT COMMITTEE REGISTERED OFFICE
Ziad Bashir Chairman TPL Properties LimitedYousuf Zohaib Ali Member 12th Floor, Centrepoint, Vice Admiral (R) Muhammad Sha� HI (M) Member O�-Shaheed-e- Millat Expressway, Naseer Khan Secretary Adjacent KPT Interchange, Karachi, Postal Code: 74900
HUMAN RESOURCE & REMUNERATION COMMITTEE WEB PRESENCE Maj. Gen (R) Zafar-ul-Hasan Naqvi Chairman www.tpl-property.comZiad Bashir Member Muhammad Ali Jameel MemberNader Nawaz Secretary
AUDITORS
Ernst & Young Ford Rhodes & Co.Chartered Accountants
COMPANY INFORMATION CONSOLIDATED PERFORMANCE
Comparisons of the results of the Company with the corresponding period are given below:
Pro�t after tax increased by Rs. 112.092 million mainly due to the increase in revenue by Rs. 49.01 million and decrease in �nance costs, revenue increased mainly due to increase in maintenance income. The Company incurred cost of Rs. 3.37 million in direct cost to achieve this increase in revenue. Further reduction in �nance cost is achieved by replacing high cost debts with low-priced loans in its subsidiary.
In the light of these �nancial results we are satis�ed that the company is on the progressive path. The new projects when materialized (as discussed in detail below), will add signi�cant value not only to our shareholders but also to our stakeholder and the environment.
There are no material changes in the commitments or the fair value of investment property as disclosed in respective notes to the consolidated condensed interim �nancial statements.
COMPANY OUTLOOK
The Company has entered into a Joint Venture agreement with the sponsors / shareholders of HKC Limited. The Company will acquire 90% shares in HKC by issuing its shares at agreed swap ratio. The Company’s interest in acquiring a controlling stake in HKC is due to the fact that HKC owns a property measuring 2539.32 Square Yards, located at Homie Katarak Chambers, CL 9-227, Civil Lines Quarters, Hoshang Road, Karachi, which the Company is keen on developing into a high-end mixed-use development including residential units and showrooms. The above will be subject to obtaining the necessary corporate and regulatory approvals
For the development of the above project the Company intends to engage foreign design and consultancy �rms to bring the international expertise with quality in Pakistan. This will surely take the construction and development into the next level in the Country which will ultimately fetch best in class living standards for residents.
Further in continuation, of the Company’s developer services segment, few locations have been identi�ed for corporates and the design phase on these will commence shortly.
Acknowledgement
We would like to thank the shareholders of the Company for the con�dence they have reposed in us. We also appreciate the valued support and guidance provided by the Securities Exchange and Commission of Pakistan, Federal Board of Revenue and the Pakistan Stock Exchange. We would also express our sincere thanks to the employees, strategic partners, vendors, suppliers and customers for their support in pursuit of our corporate objectives.
Rental Income 275,765,649 272,134,720Gross Pro�t 267,709,788 264,599,986Pro�t /(loss)before tax 76,539,293 3,238,354Pro�t /(loss) after tax 59,430,138 (3,300,712) Number of outstanding shares 208,000,000 133,912,727Earnings/(loss) per share - pre tax 0.37 0.02Earnings/(loss) per share - post tax 0.29 (0.02)
ParticularsNine months ended
March 31, 2017Nine months ended
March 31, 2016
Quarterly Report Mar 2017 Quarterly Report Mar 2017

DIRECTORS’ REPORT
The Directors are pleased to present the unaudited condensed interim �nancial information for nine months ended March 31, 2017 and a brief review of the Company’s operations:
ECONOMIC REVIEW
The Pakistan economy is on a sustainable growth path with most of the indicators, like in�ation and interest rate, the lowest since the last �ve years. Our Country’s GDP is expected to grow at the rate of 5.2% for the �scal year 2016-2017 as compared to 4.7% of last year. This improved outlook is derived from the cumulative impact of government’s economic and structural reform program including gradually improving law and order situation. Further investment in CPEC increased from USD 46 billion jumping more than 30% from its initial commitment which will be used in power generation projects to further strengthen the economy. All these factors have enabled Pakistan to become one of the attractive investment destination for foreign investors.
UPDATE ON THE REAL ESTATE SECTOR
A survey conducted by Zameen.com, an online real estate portal, suggested that Pakistan’s real estate sector managed to post an overall growth of 118% over the last �ve years. All three major cities of Pakistan Karachi, Lahore and Islamabad have posted phenomenal growth over the same period.
According to analysts, Non-resident Pakistanis do not just buy properties for the purpose of living, but also buy these as an investment asset to increase wealth. Population growth has a shortage of housing units and rising disposable income along with falling interest rates have been the key triggers for interest and demand in the real estate sector.
STANDALONE PERFORMANCE
Comparisons of the results of the Company with the corresponding period are given below: brokers to enter the market.
The Company performance has been improved signi�cantly as compared to the last period which is primarily due to reduction in �nance cost including exchange loss. This exchange loss was incurred in the last period due to a foreign currency loan which was repaid by the company while other factors in decreased �nance cost is reduction in associated company loans and their related interest rates as compared to the prior period.
There are no material changes in the commitments or the fair value of investment property as disclosed in respective notes to the condensed interim �nancial statements.
07
CONSOLIDATED PERFORMANCE
Comparisons of the results of the Company with the corresponding period are given below:
Pro�t after tax increased by Rs. 112.092 million mainly due to the increase in revenue by Rs. 49.01 million and decrease in �nance costs, revenue increased mainly due to increase in maintenance income. The Company incurred cost of Rs. 3.37 million in direct cost to achieve this increase in revenue. Further reduction in �nance cost is achieved by replacing high cost debts with low-priced loans in its subsidiary.
In the light of these �nancial results we are satis�ed that the company is on the progressive path. The new projects when materialized (as discussed in detail below), will add signi�cant value not only to our shareholders but also to our stakeholder and the environment.
There are no material changes in the commitments or the fair value of investment property as disclosed in respective notes to the consolidated condensed interim �nancial statements.
COMPANY OUTLOOK
The Company has entered into a Joint Venture agreement with the sponsors / shareholders of HKC Limited. The Company will acquire 90% shares in HKC by issuing its shares at agreed swap ratio. The Company’s interest in acquiring a controlling stake in HKC is due to the fact that HKC owns a property measuring 2539.32 Square Yards, located at Homie Katarak Chambers, CL 9-227, Civil Lines Quarters, Hoshang Road, Karachi, which the Company is keen on developing into a high-end mixed-use development including residential units and showrooms. The above will be subject to obtaining the necessary corporate and regulatory approvals
For the development of the above project the Company intends to engage foreign design and consultancy �rms to bring the international expertise with quality in Pakistan. This will surely take the construction and development into the next level in the Country which will ultimately fetch best in class living standards for residents.
Further in continuation, of the Company’s developer services segment, few locations have been identi�ed for corporates and the design phase on these will commence shortly.
Acknowledgement
We would like to thank the shareholders of the Company for the con�dence they have reposed in us. We also appreciate the valued support and guidance provided by the Securities Exchange and Commission of Pakistan, Federal Board of Revenue and the Pakistan Stock Exchange. We would also express our sincere thanks to the employees, strategic partners, vendors, suppliers and customers for their support in pursuit of our corporate objectives.
08Jameel Yusuf (S.St.)
Chairman
ParticularsNine months ended
March 31, 2017Nine months ended
March 31, 2016
Revenue 421,568,597 372,558,149Gross Pro�t 308,266,022 262,625,596Pro�t/(loss) before tax 71,726,290 (88,490,199)Pro�t/(loss) after tax 38,334,977 (73,757,478)Number of outstanding shares 208,000,000 133,912,727Earnings/(loss) per share - pre tax 0.34 (0.66)Earnings/(loss) per share-post tax 0.18 (0.55)
Quarterly Report Mar 2017 Quarterly Report Mar 2017
2016
272,134,720
264,599,986
3,238,354
(3,300,712)
133,912,727
0.02
(0.02)
275,765,649
267,709,788
76,539,293
59,430,138
208,000,000
0.37
0.29

09
Quarterly Report Mar 2017
10
Quarterly Report Mar 2017
UNCONSOLIDATED CONDENSED INTERIM BALANCE SHEET
March 31,2017
June 30,2016
Note Rupees(Unaudited)
Rupees(Audited)
AS AT MARCH 31, 2017 - (Unaudited)
Chief Executive O�cer Director
ASSETS
NON-CURRENT ASSETS Property, plant and equipment 6 6,809,468 5,581,476 Investment Property 7 4,655,575,207 4,632,000,000 Long-term investment 352,999,990 352,999,990 Long-term subordinated loan 4,123,440 10,770,709 Long-term deposits 186,919 186,919 Interest accrued 50,650,079 78,038,053 5,070,345,103 5,079,577,147 CURRENT ASSETS Receivables against rent from tenants 8 13,114,403 20,966,759 Advances and prepayments 14,971,558 19,621,854 Taxation - net 96,901,650 97,864,137 Cash and bank balance 270,371,555 850,576,013 395,359,166 989,028,763 TOTAL ASSETS 5,465,704,269 6,068,605,910
EQUITY & LIABILITIES SHARE CAPITAL Authorised capital 220,000,000 (June 30, 2016: 220,000,000) ordinary shares of Rs. 10/- each 2,200,000,000 2,200,000,000 Issued, subscribed and paid-up capital 2,080,000,000 2,080,000,000 Share premium account 140,497,151 140,497,151 Accumulated pro�ts 1,034,963,991 975,533,853 3,255,461,142 3,196,031,004
NON-CURRENT LIABILITIES Long-term �nancing 9 1,659,587,157 1,948,861,362 Due to related parties - unsecured 10 135,674,322 275,645,979 Accrued mark-up 897,620 19,095,500 Deferred tax liability 11 43,076,916 39,005,393 1,839,236,015 2,282,608,234
CURRENT LIABILITIES Trade and other payables 12 77,202,701 163,832,637 short-term borrowings - 200,000,000 Current portion of non-current liabilities 211,252,129 181,351,134 Advances against rent from tenants 13 82,552,281 44,782,901 371,007,111 589,966,672
CONTINGENCIES & COMMITMENTS 14 TOTAL EQUITY & LIABILITIES 5,465,704,269 6,068,605,910
The annexed notes from 1 to 22 form an integral part of these condensed interim �nancial statements.
2016
421,568,597
308,266,022
71,726,290
38,334,977
208,000,000
0.34
0.18
372,558,149
262,625,596
(88,490,199)
(73,757,478)
133,912,727
(0.66)
(0.55)

11 12
Quarterly Report Mar 2017 Quarterly Report Mar 2017
UNCONSOLIDATED CONDENSED INTERIM PROFIT & LOSS ACCOUNT
FOR THE NINE MONTHS ENDED MARCH 31, 2017 - (Unaudited)
Chief Executive O�cer Director
March 31,2017
March 31,2016
Note
Nine months ended Quarter ended
Rupees(Unaudited)
Rupees(Unaudited)
March 31,2017
March 31,2016
Rupees(Unaudited)
Rupees(Unaudited)
Rental income 15 275,765,649 272,134,720 91,921,884 91,921,960 Direct operating costs 16 (8,055,861) (7,534,734) (2,328,671) (2,106,168) Gross pro�t 267,709,788 264,599,986 89,593,213 89,815,792 Administrative & general expenses (68,875,445) (63,736,563) (22,656,481) (19,574,519) Exchange loss - net - (57,400,000) - - Other operating expenses - (382,663) - - Finance cost 17 (135,878,433) (171,828,941) (41,365,356) (59,809,765) Other Income 18 13,583,382 31,986,536 3,061,909 11,625,572 Pro�t before taxation 76,539,293 3,238,354 28,633,286 22,057,079 Taxation 19 (17,109,154) (6,539,065) (6,854,275) - Pro�t / (loss) for the period 59,430,138 (3,300,712) 21,779,009 22,057,079 Other comprehensive income for the period, net of tax - - - -
Total comprehensive income / (loss) for the period 59,430,138 (3,300,712) 21,779,009 22,057,079 Earnings / (loss) per share - Basic and diluted 0.29 (0.02) 0.10 0.15
The annexed notes from 1 to 22 form an integral part of these condensed interim �nancial statements.
DirectorChief Executive O�cer
UNCONSOLIDATED CONDENSED INTERIM CASH FLOW STATEMENT
FOR THE NINE MONTHS ENDED MARCH 31, 2017 - (Unaudited)
March 31,2017
March 31,2016
Rupees(Unaudited)
Rupees(Unaudited)
CASH FLOWS FROM OPERATING ACTIVITIES Pro�t / (Loss) before taxation 76,539,293 3,238,354 Adjustments for Non-Cash Items Depreciation 6.1 1,954,557 1,719,599 Finance Costs 17 135,878,433 171,828,941 Pro�t on savings account 18 (7,044,479) - Markup on long-term subordinated loan 18 27,387,974 - Exchange loss - net - 57,400,000 158,176,483 230,948,540 Working capital Changes Decrease / (increase) in current assets Receivables against rent from tenants 7,852,356 (40,537,821) Advances and prepayments 4,650,296 (7,192,536) 12,502,653 (47,730,357) (Decrease) / increase in current liabilities Trade and other payables (86,629,937) (39,602,664) Advances against rent from tenants 37,769,380 (42,687,037) (48,860,556) (82,289,700) Cash �ows used in operations 198,357,872 104,166,837 Finance costs paid - (249,764,693) Markup on savings account received 7,044,479 - Income taxes paid (12,075,144) (30,441,575) Net cash �ows from / (used in) operating activities 193,327,207 (176,039,430) CASH FLOWS FROM INVESTING ACTIVITIES Additions to operating �xed assets 6.1.1 (3,182,549) (6,216,875) Expenditure incurred on investment property 7.1 (15,817,113) (52,916,536) Additions to cpital work in progress 7.2 (7,758,094) - Long term subordinated loan - net 6,647,269 (105,549,100) Long-term deposits - (100,000) Net cash �ows used in investing activities (20,110,487) (164,782,511) CASH FLOWS FROM FINANCING ACTIVITIES
Proceeds from issuance of share capital - 342,500,000 Share issue cost - 57,806,000 Long-term �nancing - net (413,449,522) (100,768,288) Short-term borrowings - net (200,000,000) 200,000,000 Due to related parties (139,971,657) (321,065,898)
Net cash �ows (used in) / from �nancing activities (753,421,179) 178,471,813 Net decrease in cash and cash equivalents (580,204,458) (162,350,128) Cash and cash equivalents at the beginning of the year 850,576,013 178,262,172 Cash and cash equivalents at the end of the year 270,371,555 15,912,044
The annexed notes from 1 to 22 form an integral part of these condensed interim �nancial statements.

UNCONSOLIDATED CONDENSED INTERIM STATEMENT OF CHANGES IN EQUITYFOR THE NINE MONTHS ENDED MARCH 31, 2017 - (Unaudited)
Chief Executive O�cer Director
13 14
Quarterly Report Mar 2017 Quarterly Report Mar 2017
Share Share Accumulated Total capital premium Pro�t/Loss ---------------------------- (Rupees) ---------------------------- Balance at June 30, 2015 (Audited) 1,100,000,000 - 684,863,802 1,784,863,802 Issue of ordinary shares for cash consideration 342,500,000 57,806,000 - 400,306,000 Loss for the year - - (3,300,711) (3,300,711)
Other comprehensive income for the period, net of tax - - - - Total comprehensive loss for the period - - (3,300,711) (3,300,711) Balance at March 31, 2016 (Unaudited) 1,442,500,000 57,806,000 681,563,091 2,181,869,091 Balance at June 30, 2016 (Audited) 2,080,000,000 140,497,151 975,533,853 3,196,031,004 Pro�t for the period - - 59,430,138 59,430,138
Other comprehensive income for the period, net of tax - - - - Total comprehensive income for the period Balance at March 31, 2017 (Un-audited) 2,080,000,000 140,497,151 1,034,963,991 3,255,461,142
The annexed notes from 1 to 22 form an integral part of these condensed interim �nancial statements.
NOTES TO THE UNCONSOLIDATED CONDENSED INTERIMFINANCIAL STATEMENTSFOR THE NINE MONTHS ENDED MARCH 31, 2017 - (Unaudited)
1. LEGAL STATUS AND OPERATIONS 1.1. TPL Properties (Private) Limited was incorporated in Pakistan as a private limited company on February 14, 2007 under
the Companies Ordinance, 1984. In September 2015, the Company changed its status from private limited company to public company. Accordingly, the Company name was changed to TPL Properties Limited. The principal activity of the Company is to invest, purchase, develop and build real estate and to sell, rent out or otherwise dispose o� in any manner the real estate including commercial and residential buildings, houses, shops, plots or other premises. The registered o�ce of the Company is situated at Centrepoint Building, O� Shaheed-e-Millat Expressway, Near KPT Interchange Flyover, Karachi. TPL Trakker Limited and TPL Holdings (Private) Limited are the parent and ultimate parent company respectively, as of balance sheet date.
1.2. These �nancial statements are the separate �nancial statements of the Company, in which investment in the subsidiary company namely Centrepoint Management Services (Private) Limited (the Subsidiary Company) has been accounted for at cost less accumulated impairment losses, if any."
2. STATEMENT OF COMPLIANCE These condensed interim �nancial statements of the Company for the nine months ended March 31, 2017 have been
prepared in accordance with the requirements of the International Accounting Standard 34 - Interim Financial Reporting and provisions of and directives issued under the Companies Ordinance, 1984. In case where requirements di�er, the provisions of or directives issued under the Companies Ordinance, 1984 have been followed.
3. BASIS OF PREPARATION These condensed interim �nancial statements are un-audited and are preapred in accordance with approved
accounting standards as applicable in Pakistan. These condensed interim �nancial statements do not include all the information and disclosures required in the annual �nancial statements, and should be read in conjunction with the �nancial statements (unconsolidated) of the Company for the year ended June 30, 2016.
4. SUMMARY OF SIGNIFICANT ACCOUNTING POLICIES The accounting policies adopted in the preparation of these condensed interim �nancial statements are consistent
with those followed in the preparation of the Company’s annual �nancial statements (unconsolidated) for the year ended June 30, 2016 except for the adoption of new and amended standards and interpretations as stated below:
4.1. New amended and revised standards and interpretations of IFRSs
The Company has adopted the following amendment to IFRSs which became e�ective for the current period: IFRS 10 - Consolidated Financial Statements, IFRS 12 Disclosure of Interests in Other Entities and IAS 27 Separate
Financial Statements: Investment Entities: Applying the Consolidation Exception (Amendment)
IFRS 11 - Joint Arrangements: Accounting for Acquisition of Interest in Joint Operation (Amendment)
IAS 1 - Presentation of Financial Statements: Disclosure Initiative (Amendment)
IAS 16 - Property, Plant and Equipment and IAS 38 Intangible Assets: Clari�cation of Acceptable Method of
Depreciation and Amortization (Amendment)
IAS 16 - Property, Plant and Equipment and IAS 41 Agriculture: Agriculture - Bearer Plants (Amendment)
IAS 27 - Separate Financial Statements: Equity Method in Separate 'Financial Statements (Amendment)
The adoption of the above amendment to accounting standards did not have any e�ect on the condensed interim �nancial statements.
In addition to the above standards and amendments, improvements to various accounting standards have also been issued by the IASB in September 2014. Such improvements are generally e�ective for accounting periods beginning on or after January 01, 2016. The Company expects that such improvements to the standards will not have any material impact on the Company's �nancial statements in the period of initial application.

5. ACCOUNTING ESTIMATES AND FINANCIAL RISK MANAGEMENT The preparation of these condensed interim �nancial statements require management to make judgements,
estimates and assumptions that a�ect the application of accounting policies and the reported amounts of assets and liabilities, income and expense. Actual results may di�er from these estimates.
In preparing these condensed interim �nancial statements, the signi�cant judgements made by the management in applying the Company’s accounting policies and areas where assumptions and estimates are signi�cant are same as those applied to the �nancial statements as at and for the year ended June 30, 2016. The company’s �nancial risk management objectives and policies are consistent with those disclosed in the �nancial statements (unconsolidated) as at and for the year ended June 30, 2016.
15 16
Quarterly Report Mar 2017 Quarterly Report Mar 2017
NOTES TO THE UNCONSOLIDATED CONDENSED INTERIMFINANCIAL STATEMENTSFOR THE NINE MONTHS ENDED MARCH 31, 2017 - (Unaudited)
Note
March 31,2017
June, 302016
Rupees(Unaudited)
Rupees(Audited)
March 31,2017
June, 302016
Rupees(Unaudited)
Rupees(Audited)
6. PROPERTY, PLANT AND EQUIPMENT The movement in operating �xed assets during the period / year are as follows: Opening balance (WDV) 5,581,476 1,584,109 Add: Additions during the period / year 6.1 3,182,549 6,322,378 8,764,025 7,906,487 Depreciation Charge for the period / year (1,954,557) (2,325,011) 6,809,468 5,581,476 6.1 Additions including transfers during the period / year
Computer and accessories 459,900 340,778 Furniture - 5,801,600 Vehicles 2,628,649 - Mobile phones 94,000 180,000 3,182,549 6,322,378 7. INVESTMENT PROPERTY Investment property 7.1 4,647,817,113 4,632,000,000 Capital work in process 7.2 7,758,094 -
4,655,575,207 4,632,000,000 7.1 The movement in investment property during the period / year is as follows: Opening balance 4,632,000,000 4,319,000,000 Add: Additions during the period / year 15,817,113 38,782,113 4,647,817,113 4,357,782,113 Remeasurement adjustment - 274,217,887 Closing balance 7.1.1 4,647,817,113 4,632,000,000
7.1.1 An independent valuation of Centrepoint Project was carried out by an independent professional valuer on June 30,
2016. As of balance sheet date, the management expects no material change in the aforementioned fair value of investment property.
7.2 Capital work in process Represents expenses incurred and advances made by the Company in respect of development of investment properties.
8. RECEIVABLES AGAINST RENT FROM TENANTS – unsecured, considered good TPL Trakker Limited – the parent company - 16,150,330 Others 13,114,403 4,816,429 13,114,403 20,966,759

17 18
Quarterly Report Mar 2017 Quarterly Report Mar 2017
Note
Note
March 31,2017
June, 302016
Rupees(Unaudited)
Rupees(Audited)
March 31,2017
June, 302016
Rupees(Unaudited)
Rupees(Audited)
Note
March 31,2017
June, 302016
Rupees(Unaudited)
Rupees(Audited)
9. LONG-TERM FINANCING Musharika Finance 1,864,337,157 2,074,861,362 Current Portion shown under current liabilities 204,750,000 126,000,000 9.1 1,659,587,157 1,948,861,362 9.1 There is no material changes in the terms and conditions as disclosed in the annual �nancial statements (Unconsolidated) of the Company for the year ended June 30, 2016.
10. DUE TO RELATED PARTIES - unsecured TPL Holdings (Private) Limited - an ultimate parent Company 82,872,176 32,338,178 TPL Trakker Limited - the parent Company 52,802,146 243,307,801 10.1 135,674,322 275,645,979 10.1 There is no material change in the terms and conditions as disclosed in the annual �nancial statements (unconsolidated) of the Company for the year ended June 30, 2016
11. DEFERRED TAX LIABILITY Deferred tax liability on taxable temporary di�erences: Advance against rent from tenants (net of receivables) 43,076,918 39,005,393
12. TRADE & OTHER PAYABLES
Creditors 24,669,156 67,179,093 Accrued expenses 24,315,676 56,291,707 Retention Money 18,446,352 30,360,795 Payable to employees 480,571 710,096 Workers' Welfare Fund 9,290,946 9,290,946 77,202,701 163,832,637
13. ADVANCE AGAINST RENT FROM TENANTS Related parties: TPL Trakker Limited - the parent company 4,376,867 - TPL Direct Insurance Limited - an associated company 30,057,635 19,110,536 Others 48,117,779 25,672,365 82,552,281 44,782,901 14. CONTINGENCIES AND COMMITMENTS As of balance sheet date, there is no signi�cant change in the status of contingencies and commitments as reported in annual �nancial statements for the year ended 30 June 2016.
March 31,2017
March 31,2016
Note
Nine months ended Quarter ended
Rupees(Unaudited)
Rupees(Unaudited)
March 31,2017
March 31,2016
Rupees(Unaudited)
Rupees(Unaudited)
15. RENTAL INCOME Related parties: TPL Trakker Limited - the parent company 31,443,170 31,443,170 10,481,056 10,481,056 TPL Direct Insurance Limited - an associated company 34,067,403 34,067,403 11,355,802 11,355,878
65,510,573 65,510,573 21,836,858 21,836,934 Others 210,255,076 206,624,146 70,085,026 70,085,025
275,765,649 272,134,720 91,921,884 91,921,960 16. DIRECT OPERATING COSTS Repairs and maintenance 1,182,606 1,177,748 86,969 78,950 Insurance 6,086,451 6,081,302 2,192,762 1,996,554 Advertisement and promotional 786,804 275,684 48,940 30,664
8,055,861 7,534,734 2,328,671 2,106,168 17. FINANCE COST Markup on: Long term �nancing 120,896,944 118,322,425 39,272,761 43,246,192 Short-term borrowing - 8,823,123 - 7,736,000 Due to related parties 14,114,533 44,325,946 2,077,674 8,822,545
135,011,477 171,471,494 41,350,435 59,804,737 Bank Charges 866,956 357,447 14,921 5,028
135,878,433 171,828,941 41,365,356 59,809,765
18. OTHER INCOME Pro�t on saving account 7,044,479 3,048,540 3,011,264 527,259 Markup on long-term subordinated loan 6,025,487 27,266,021 37,229 10,298,438 Others 513,416 1,671,974 13,416 799,874
13,583,382 31,986,536 3,061,909 11,625,572 19. TAXATION Current 13,037,630 6,122,609 4,809,616 - Deferred 4,071,525 416,456 2,044,660 -
17,109,154 6,539,065 6,854,275 -
19.1. The Company has �led income tax return for the tax year 2016, which is deemed to be assessed under Section 120 of Income Tax Ordinance, 2001 unless selected for audit. Current tax charge is based on minimum tax under Section 113C of the Income Tax Ordinance, 2001.

20. TRANSACTIONS WITH RELATED PARTIES The related parties comprise of the ultimate parent company, parent company and group company, associated companies, subsidiary company, directors of the Company, companies where directors also hold directorship, key employees and sta� retirement funds. Details of transactions with related parties, other than those which have been speci�cally disclosed elsewhere in these unconsolidated �nancial statements are as follows:
March 31, March 31, 2017 2016 (Unaudited) (Unaudited) -------------- (Rupees) -------------- Relationship with the company Nature of Transaction The Ultimate Parent Company TPL Holdings (Private) Amount received from THL by the Limited [THL] Company 192,000,000 111,050,000 Mark-up on current account 3,747,878 24,887,760 Payment made to THL on account of current account 141,466,002 580,300,000 Payment made to THL on account of accrued mark-up 8,682,902 146,193,368 The Parent Company TPL Trakker Limited [TTL] Amount received from TTL 119,245,997 - Payment made to TTL on account of accrued mark-up 23,629,500 - Payment made by the Company 320,370,500 20,000,000 Mark-up on current account 10,366,656 19,428,793 Expenses incurred / paid by TTL on behalf of the Company 16,911,437 16,138,238 Expenses incurred / paid by the Company on behalf of TTL 810,000 -
Adjustments of advance receivable for rent from TTL by the Company: - due to related parties balance of TTL 5,482,590 16,921,139 - accrued markup payable balance of TTL - 14,147,504 Amount received from TTL on account of rent 51,970,368 - Services acquired by the Company 31,443,170 31,443,170 Subsidiary Company Centrepoint Management Services Long-term sub-ordinated loan: (Private) Limited [CMS] - received during the period 242,401,560 22,441,000 - repaid during the period 235,754,291 100,728,029 - Mark-up for the period 6,025,487 27,266,021 - Payment received from CMS on account of accrued mark-up 33,413,461 - Common Directorship TPL Direct Insurance Limited [TDI] Amount received from TDI on accoun of rent 45,014,501 34,289,331 Services acquired by the Company 34,067,403 34,067,403
21. DATE OF AUTHORIZATION These condensed interim �nancial statements were authorised for issue on April 25, 2017 by the Board of Directors of
the Company.
22. GENERAL 22.1 Corresponding �gures have been reclassi�ed for the purpose of better presentation and comparison, wherever
necessary. However, there are no material reclassi�cations to report. 22.2 All �gures have been rounded o� to the nearest rupee, unless otherwise stated.
Chief Executive O�cer Director19 20
CONSOLIDATED CONDENSED INTERIM BALANCE SHEET
ASSETS
NON-CURRENT ASSETS Property, plant and equipment 4. 362,311,053 375,806,971 Investment property 5. 4,655,575,207 4,632,000,000 Long-term deposits 186,919 5,727,863 Deferred tax asset 6. 43,593,092 54,968,187 5,061,666,271 5,068,503,021 CURRENT ASSETS Tools - 286,473 Receivable against rent, maintenance and other services 7. 45,269,365 51,477,998 Advances and prepayments 42,553,894 30,318,768 Taxation – net 106,177,254 107,307,694 Cash and bank balances 276,221,599 852,543,314
470,222,112 1,041,934,247 TOTAL ASSETS 5,531,888,383 6,110,437,268 EQUITY AND LIABILITIES SHARE CAPITAL Authorised capital 220,000,000 (June 30, 2016: 220,000,000) ordinary shares of Rs. 10/each 2,200,000,000 2,200,000,000 Issued, subscribed and paid-up capital 2,080,000,000 2,080,000,000 Share Premium account 140,497,151 140,497,151 Accumulated Pro�t 760,471,989 722,137,012 2,980,969,140 2,942,634,163 NON-CURRENT LIABILITY Long-term �nancing 8. 1,899,279,402 2,022,611,362 Liabilities against assets subject to �nance lease - 9,500,045 Due to related parties 9. 135,674,322 275,645,979 Accrued mark-up 11,235,668 19,095,500 2,046,189,392 2,326,852,886 CURRENT LIABILITIES Trade and other payables 10. 135,862,381 228,074,341 Short term borrowings - 200,000,000 Current portion of non-current liabilities 238,752,129 342,383,916 Advance against rent, maintenance and other services 11. 130,115,340 70,491,962 504,729,851 840,950,219 CONTINGENCIES AND COMMITMENTS 12. TOTAL EQUITY AND LIABILITIES 5,531,888,383 6,110,437,268 The annexed notes from 01 to 15 form an integral part of these consolidated condensed interim �nancial statements.
Chief Executive O�cer Director
AS AT MARCH 31, 2017 - (Unaudited) March 31,2017
June 30,2016
Note Rupees(Unaudited)
Rupees(Audited)
Quarterly Report Mar 2017 Quarterly Report Mar 2017

CASH FLOW FROM OPERATING ACTIVITIES Pro�t / (loss) before taxation for the period 71,726,290 (88,490,199)Adjustment for non cash charges and other items Depreciation 27,665,768 26,387,210 Finance Costs 153,795,042 171,828,941 Markup on savings acccount (7,044,479) - Exchange loss - net - 57,400,000 174,416,330 255,616,152 Changes in working capital (Increase) / decrease in current assets Tools 286,473 (11,000)Advances, prepayments and other receivables (12,235,125) (7,404,636)Receivable against rent, maintenace and other services 6,208,632 (45,848,839) (5,740,021) (53,264,475) Increase / (decrease) in current liabilities Current portion of Lease Finance - (8,176,670)Current portion of Demand Finance - (31,875,000)Due to related parties (23,294,409) 50,500,000 Advance against rent, maintenance and other services 59,623,378 (53,565,326)Trade and other payables (84,663,814) (25,105,741) (48,334,845) (68,222,738)Cash used in operations 192,067,755 45,638,740 Finance cost paid (27,056,539) (249,764,693)Markup on savings acccount received 7,044,479 - Income tax - net (20,885,782) (35,808,359)Net cash used in operating activities 151,169,913 (239,934,312) CASH FLOW FROM INVESTING ACTIVITIES Purchase of property, plant and equipment (14,169,850) (7,332,865)Expenditure incurred on Investment Property (31,123,342) (52,916,536)Long term loan - (27,266,021)Long term deposits 5,540,944 (100,000)Net cash used in investing activities (39,752,248) (87,615,422) CASH FLOW FROM FINANCING ACTIVITIES Long term �nancing (413,449,522) (100,768,288)Due to related parties (139,971,657) (321,065,898)Short term borrowings repaid (200,000,000) 200,000,000 Proceeds from Issue of shares - 342,500,000 Share issue cost - 57,806,000 Accrued markup - 29,679,703 Lease Liability paid (100,260,448) (12,963,722)Demand Finance-repaid 165,942,247 (31,874,998)Net cash �ow from �nancing activities (687,739,380) 163,312,796 Net decrease in cash and cash equivalents (576,321,715) (164,236,937)Cash and cash equivalents at the beginning of the period 852,543,314 180,697,046 Cash and cash equivalents at the end of the period 276,221,599 16,460,109 The annexed notes from 01 to 15 form an integral part of these consolidated condensed interim �nancial statements.
CONSOLIDATED CONDENSED INTERIM CASH FLOW STATEMENT
FOR THE NINE MONTHS ENDED MARCH 31, 2017 - (Unaudited)
Chief Executive O�cer Director
March 31,2017
March 31,2016
Rupees(Unaudited)
Rupees(Unaudited)
2221
Quarterly Report Mar 2017 Quarterly Report Mar 2017
CONSOLIDATED CONDENSED INTERIM PROFIT & LOSS ACCOUNT
FOR THE NINE MONTHS ENDED MARCH 31, 2017 - (Unaudited)
DirectorChief Executive O�cer
March 31,2017
March 31,2016
Nine Months ended Quarter ended
Rupees(Unaudited)
Rupees(Unaudited)
March 31,2017
March 31,2016
Rupees(Unaudited)
Rupees(Unaudited)
Revenue 421,568,597 372,558,149 135,711,889 129,499,075
Direct operating costs (113,302,575) (109,932,553) (36,099,752) (50,010,897) Gross Pro�t 308,266,022 262,625,596 99,612,137 79,488,178
Administrative and general expenses (97,002,911) (93,890,155) (33,917,706) (16,219,585)
Exchange loss - net - (57,400,000) - -
Other operating epenses - (382,663) - -
Finance costs (147,806,784) (204,590,420) (46,937,270) (69,287,186)
Other Income 8,269,963 5,147,444 2,801,972 1,339,671
Pro�t / (loss) before tax 71,726,290 (88,490,199) 21,559,133 (4,678,923) Taxation (33,391,313) 14,732,721 (12,591,695) -
Pro�t / (loss) for the period 38,334,977 (73,757,478) 8,967,438 (4,678,923)
Other comprehensive income for the period, net of tax - - - -
Total comprehensive income for the period 38,334,977 (73,757,478) 8,967,438 (4,678,923) EPS 0.18 (0.55) 0.04 (0.03)
The annexed notes from 01 to 15 form an integral part of these consolidated condensed interim �nancial statements.
23
NOTES TO THE CONSOLIDATED CONDENSED INTERIM FINANCIAL STATEMENTSFOR THE NINE MONTHS ENDED MARCH 31, 2017 - (Unaudited)
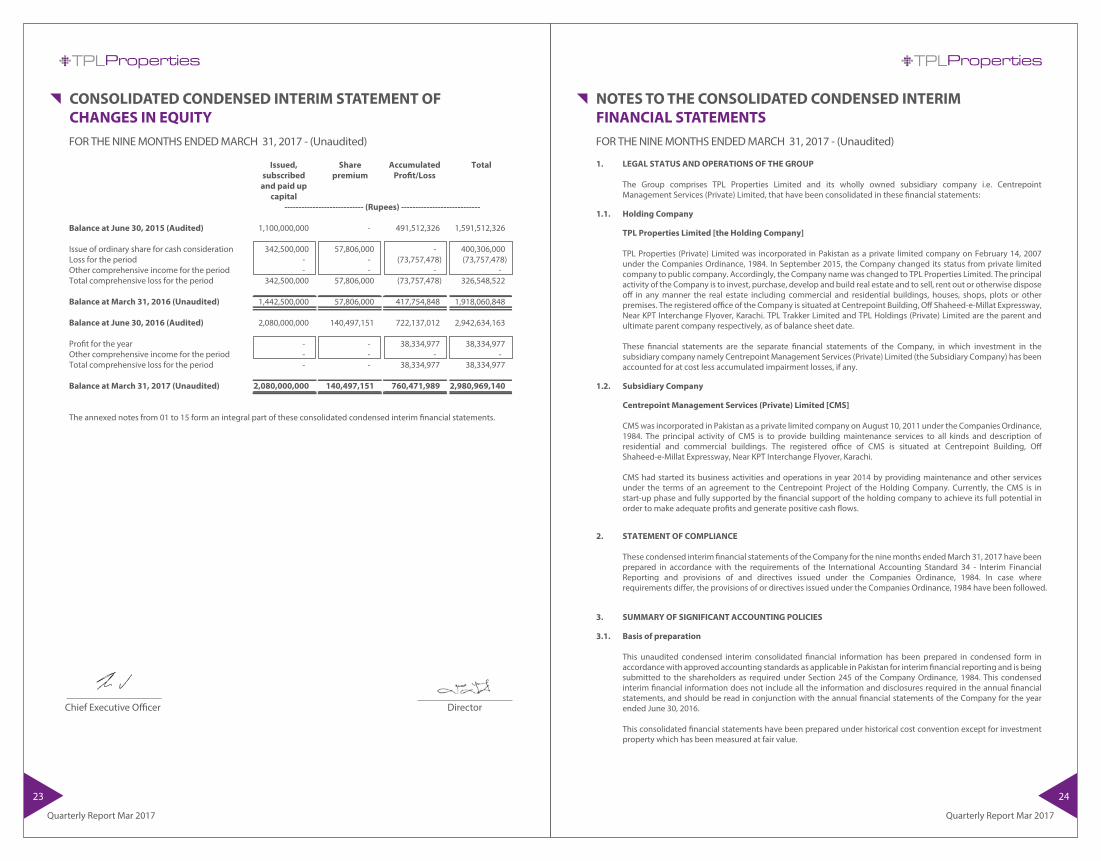
1. LEGAL STATUS AND OPERATIONS OF THE GROUP The Group comprises TPL Properties Limited and its wholly owned subsidiary company i.e. Centrepoint
Management Services (Private) Limited, that have been consolidated in these �nancial statements: 1.1. Holding Company TPL Properties Limited [the Holding Company] TPL Properties (Private) Limited was incorporated in Pakistan as a private limited company on February 14, 2007
under the Companies Ordinance, 1984. In September 2015, the Company changed its status from private limited company to public company. Accordingly, the Company name was changed to TPL Properties Limited. The principal activity of the Company is to invest, purchase, develop and build real estate and to sell, rent out or otherwise dispose o� in any manner the real estate including commercial and residential buildings, houses, shops, plots or other premises. The registered o�ce of the Company is situated at Centrepoint Building, O� Shaheed-e-Millat Expressway, Near KPT Interchange Flyover, Karachi. TPL Trakker Limited and TPL Holdings (Private) Limited are the parent and ultimate parent company respectively, as of balance sheet date.
These �nancial statements are the separate �nancial statements of the Company, in which investment in the subsidiary company namely Centrepoint Management Services (Private) Limited (the Subsidiary Company) has been accounted for at cost less accumulated impairment losses, if any.
1.2. Subsidiary Company Centrepoint Management Services (Private) Limited [CMS] CMS was incorporated in Pakistan as a private limited company on August 10, 2011 under the Companies Ordinance,
1984. The principal activity of CMS is to provide building maintenance services to all kinds and description of residential and commercial buildings. The registered o�ce of CMS is situated at Centrepoint Building, O� Shaheed-e-Millat Expressway, Near KPT Interchange Flyover, Karachi.
CMS had started its business activities and operations in year 2014 by providing maintenance and other services
under the terms of an agreement to the Centrepoint Project of the Holding Company. Currently, the CMS is in start-up phase and fully supported by the �nancial support of the holding company to achieve its full potential in order to make adequate pro�ts and generate positive cash �ows.
2. STATEMENT OF COMPLIANCE These condensed interim �nancial statements of the Company for the nine months ended March 31, 2017 have been
prepared in accordance with the requirements of the International Accounting Standard 34 - Interim Financial Reporting and provisions of and directives issued under the Companies Ordinance, 1984. In case where requirements di�er, the provisions of or directives issued under the Companies Ordinance, 1984 have been followed.
3. SUMMARY OF SIGNIFICANT ACCOUNTING POLICIES 3.1. Basis of preparation This unaudited condensed interim consolidated �nancial information has been prepared in condensed form in
accordance with approved accounting standards as applicable in Pakistan for interim �nancial reporting and is being submitted to the shareholders as required under Section 245 of the Company Ordinance, 1984. This condensed interim �nancial information does not include all the information and disclosures required in the annual �nancial statements, and should be read in conjunction with the annual �nancial statements of the Company for the year ended June 30, 2016.
This consolidated �nancial statements have been prepared under historical cost convention except for investment
property which has been measured at fair value.
24
Quarterly Report Mar 2017 Quarterly Report Mar 2017
CONSOLIDATED CONDENSED INTERIM STATEMENT OF CHANGES IN EQUITYFOR THE NINE MONTHS ENDED MARCH 31, 2017 - (Unaudited)
DirectorChief Executive O�cer
Issued, Share Accumulated Total subscribed premium Pro�t/Loss and paid up capital ---------------------------- (Rupees) ---------------------------- Balance at June 30, 2015 (Audited) 1,100,000,000 - 491,512,326 1,591,512,326 Issue of ordinary share for cash consideration 342,500,000 57,806,000 - 400,306,000 Loss for the period - - (73,757,478) (73,757,478)Other comprehensive income for the period - - - - Total comprehensive loss for the period 342,500,000 57,806,000 (73,757,478) 326,548,522 Balance at March 31, 2016 (Unaudited) 1,442,500,000 57,806,000 417,754,848 1,918,060,848 Balance at June 30, 2016 (Audited) 2,080,000,000 140,497,151 722,137,012 2,942,634,163 Pro�t for the year - - 38,334,977 38,334,977 Other comprehensive income for the period - - - - Total comprehensive loss for the period - - 38,334,977 38,334,977 Balance at March 31, 2017 (Unaudited) 2,080,000,000 140,497,151 760,471,989 2,980,969,140
The annexed notes from 01 to 15 form an integral part of these consolidated condensed interim �nancial statements.

25
3.2. Basis of consolidation These consolidated �nancial statements comprise of the �nancial statements of the Holding Company and its
subsidiary company, CMS as at March 31, 2017, here-in-after referred to as ‘the Group’. 3.3 SUMMARY OF SIGNIFICANT ACCOUNTING POLICIES
The accounting policies adopted in the preparation of these consolidated condensed interim �nancial statements are consistent with those followed in the preparation of the Company’s annual �nancial statements (consolidated) for the year ended June 30, 2016 except for the adoption of new and amended standards and interpretations as stated below:
New amended and revised standards and interpretations of IFRSs
The Company has adopted the following amendment to IFRSs which became e�ective for the current period:
IFRS 10 - Consolidated Financial Statements, IFRS 12 Disclosure of Interests in Other Entities and IAS 27 Separate Financial Statements: Investment Entities: Applying the Consolidation Exception (Amendment)
IFRS 11 - Joint Arrangements: Accounting for Acquisition of Interest in Joint Operation (Amendment)
IAS 1 - Presentation of Financial Statements: Disclosure Initiative (Amendment)
IAS 16 - Property, Plant and Equipment and IAS 38 Intangible Assets: Clari�cation of Acceptable Method of Depreciation and Amortization (Amendment)
IAS 16 - Property, Plant and Equipment and IAS 41 Agriculture: Agriculture - Bearer Plants (Amendment)
IAS 27 - Separate Financial Statements: Equity Method in Separate 'Financial Statements (Amendment)
The adoption of the above amendment to accounting standards did not have any e�ect on the condensed interim
�nancial statements. In addition to the above standards and amendments, improvements to various accounting standards have also been
issued by the IASB in September 2014. Such improvements are generally e�ective for accounting periods beginning on or after January 01, 2016. The Company expects that such improvements to the standards will not have any material impact on the Company's �nancial statements in the period of initial application.
3.4 ACCOUNTING ESTIMATES AND FINANCIAL RISK MANAGEMENT The preparation of these consolidated condensed interim �nancial statements require management to make
judgments, estimates and assumptions that a�ect the application of accounting policies and the reported amounts of assets and liabilities, income and expense. Actual results may di�er from these estimates.
In preparing these consolidated condensed interim �nancial statements, the signi�cant judgments made by the management in applying the Company’s accounting policies and areas where assumptions and estimates are signi�cant are same as those applied to the consolidated �nancial statements as at and for the year ended June 30, 2016. The company’s �nancial risk management objectives and policies are consistent with those disclosed in the consolidated �nancial statements as at and for the year ended June 30, 2016.
26
Quarterly Report Mar 2017 Quarterly Report Mar 2017
Note
March 31,2017
June, 302016
Rupees(Unaudited)
Rupees(Audited)
March 31,2017
June, 302016
Rupees(Unaudited)
Rupees(Audited)
4. PROPERTY, PLANT AND EQUIPMENT The movement in operating �xed assets during the period / year are as follows: Opening balance (WDV) 375,806,971 401,955,345 Additions during the period / year 4.1 14,169,850 9,111,969 389,976,821 411,067,314 Depreciation charge for the period / year (27,665,768) (35,260,343) Operating �xed assets (WDV) 362,311,053 375,806,971 4.1 Additions including transfers during the period / year Computer & Accessories 4,240,211 340,778 Motor Vehicle 2,628,649 - Mobile Phones 134,000 543,140 Furniture & �xtures - 6,463,439 Electrical Equipments 1,451,342 1,764,602 Power Generation Unit 5,715,648 - 14,169,850 9,111,959
5. INVESTMENT PROPERTY Investment Property 5.1 4,647,817,113 4,632,000,000 Capital work in-progress 5.2 7,758,094 - 4,655,575,207 4,632,000,000 5.1 Opening balance 4,632,000,000 4,319,000,000 Add: Additions during the period / year 15,817,113 38,782,113 4,647,817,113 4,357,782,113 Remeasurement adjustment - 274,217,887 Closing balance 5.1.1 4,647,817,113 4,632,000,000 5.1.1 An independent valuation of Centrepoint Project was carried out by an independent professional valuer on June 30,
2016. As of balance sheet date, the management expects no material change in the aforementioned fair value of investment property.
5.2 Represents expenses incurred and advances made by the Company in respect of development of investment
properties.
6. DEFERRED TAX ASSET Deferred tax assets on deductible temporary di�erences: Unused tax loss 157,974,545 158,002,592 Liabilities against assets subject to �nance leases - 11,124,489 157,974,545 169,127,081 Deferred tax liability on taxable temporary di�erences: Property, plant and equipment - owned (71,304,537) (75,153,501) Advance against rent from tenants (43,076,916) (39,005,393) (114,381,453) (114,158,894) 43,593,092 54,968,187

27
Note
March 31,2017
June, 302016
Rupees(Unaudited)
Rupees(Audited)
9. DUE TO RELATED PARTIES TPL Trakker Limited 9.1 52,802,146 243,307,801 TPL Holdings (Pvt) Ltd 9.1 82,872,176 32,651,583 Loan from Director 9.2 - 22,981,004 135,674,322 298,940,388 Less: Current portion - (23,294,409) 135,674,322 275,645,979 9.1 There is no material change in the terms and conditions as disclosed in the annual �nancial statements (consolidated)
of the company for the year ended June 30, 2016. 9.2 During the year CMS repaid the loan from Director which was repayable on demand. It carried mark up ranging from
6.35 percent to 18 percent per annum.
10. TRADE & OTHER PAYABLES
Trade Creditors 32,217,291 67,179,093 Payable to contractors 24,208,733 44,962,971 Accrued expenses 47,514,113 71,866,065 Retention Money 22,150,727 34,065,170 Workers' welfare fund 9,290,946 9,290,946 Payable to employees 480,571 710,096
135,862,381 228,074,341 Included herein payable to TPL Security Services (Pvt.) Limited, a related party amounting to Rs 2.438mn (June 30,
2016: Rs 22.88mn) on account of security services proivded.
11. ADVANCE AGAINST RENT AND MAINTENANCE SERVICES
Advance Against: - rent from tenants 82,552,281 44,782,901 - maintenance services 47,563,058 25,709,061
130,115,340 70,491,962
12. CONTINGENCIES AND COMMITMENTS
As of balance sheet date, there is no signi�cant change in the status of contingencies and commitments as reported in annual �nancial statements for the year ended 30 June 2016.
13. TRANSACTIONS WITH RELATED PARTIES The related parties comprise of the ultimate company, parent company and group company, associated companies,
subsidiary company, directors of the Company, companies where directors also hold directorship, key employees and sta� retirement funds. Details of transactions with related parties, other than those which have been speci�cally disclosed elsewhere in these consolidated condensed interim �nancial statements are as follows:
Note
March 31,2017
June, 302016
Rupees(Unaudited)
Rupees(Audited)
March 31,2017
June, 302016
Rupees(Unaudited)
Rupees(Audited)
Quarterly Report Mar 2017 Quarterly Report Mar 2017
28
7. Receivable against rent, maintenance and other services Receivable against rent 13,114,403 20,966,759 Receivable against maintenance services 5,468,098 - Receivable against electricity and air conditioning services 24,111,322 12,614,131 Receivable against water supply services 2,575,543 16,066,952 Receivable against IT Services - 1,830,156 45,269,365 51,477,998
8. LONG TERM FINANCING Musharika Finance (Islamic) 8.1 2,131,529,402 2,074,861,362 Demand �nance facility (conventional) 8.2 - 109,375,000 Diminishing musharika - I (Islamic) 8.3 - 18,750,000 Diminishing musharika - II (Islamic) 8.4 - 37,500,000 2,131,529,402 2,240,486,362 Less: Current portion shown under current liabilities (232,250,000) (217,875,000) 1,899,279,402 2,022,611,362 8.1 The Holding Company had entered into the Musharaka facility agreement of Rs.2,400 million with a commercial bank
through an agreement dated May 26, 2015. Out of which, the Holding Company has utilized facility upto Rs.2,100 million as at balance sheet date. It carries mark-up at the rate of 6 months KIBOR plus 1.75 percent per annum, and is repayable semi-annually in arrears over a period of seven years including 1 year grace period i.e. the �rst installment will become due after 12 months from the date of disbursement dated September 16, 2015. The facility is secured against hypothecation charge over hypothecated �xed and current assets of Rs.2,800 million and by way of personal and corporate guarantee of Chief Executive and a related party.
During the period CMS has entered into Musharika facility of Rs. 275 million with a commercial bank through an
supplemental Masaryk agreement dated December 6, 2016. It carries mark up at the rate of 6 months KIBOR plus 2 percent per annum (with �oor 5% and cap 25%), and is repayable semi-annually in arrears over a period of 6.3 years. First installment will become due after on Oct 16, 2017. The facility is secured against hypothecation charge over present and future current and �xed assets of the Company of Rs. 367 million and by was of personal and corporate guarantee of Chief executive and related party.
8.2 During the period, the CMS has repaid the entire �nancing facility of Rs. 175 million obtained from a conventional
commercial bank. The company availed the facility for a period of 5 years. The loan carried mark up at the rate of six months KIBOR plus 3 percent per annum payable semi annually percent per annum payable semi-annually in arrears and is repayable in 8 equal semi-annual installments of Rs.21.875 million each latest by April 19, 2018. The �rst installment became due after 18 months i.e. on September 19, 2014, from the date of �rst disbursement date i.e. April 19, 2013. This facility was secured against exclusive charge on machinery and equipment of Rs.251.497 million, personal guarantees of directors and ordinary shares investment of TPL Holdings (Private) Limited (an ultimate parent company) in TPL Trakker Limited.
8.3 During the period CMS has repaid the entire Diminishing Musharika �nancing Facility of Rs. 30 million from a
commercial bank for a period of �ve years for re�nancing of of CAPEX incurred by CMS for Chillers. This was paid from the Musharika Financing facility of Rs. 275 million as mentioned in the respective note. The facility carried mark up at the rate of 6 months KIBOR plus 3 percent per annum and was subject to revision on semi annual basis. The musharika units were to be purchased in 8 equal semi-annual installments starting from the 18th month of disbursement date i.e. April 08, 2015 during the period of 4 years latest by October 08, 2018. The facility was secured against �rst exclusive charge over the asset (Chillers) with 10% risk margin over market value, ranking hypothecation charge over �xed assets of Rs.40 million and personal guarantees of the directors of the subsidiary company.
8.4 During the period CMS has repaid the entire Diminishing Musharika �nancing Facility of Rs. 50 million from a
commercial bank for a period of �ve years for re�nancing of of CAPEX incurred by CMS for its assets. This was paid from the Musharika Financing facility of Rs. 275 million as mentioned in the respective note. The facility carried mark up at the rate of 6 months KIBOR plus 3 percent per annum and was subject to revision on semi annual basis. The musharika units were to be purchased in 8 equal semi-annual installments starting from the 18th month of disbursement date i.e. June 26, 2015 during the period of 4 years latest by December 26, 2018. The facility was secured against pledge over shares of TPL Trakker Limited held by TPL Holdings (Private) Limited (an ultimate parent company) with 40% risk margin, ranking hypothecation charge over �xed assets with 10% risk margin and personal guarantees of the directors of the subsidiary company.
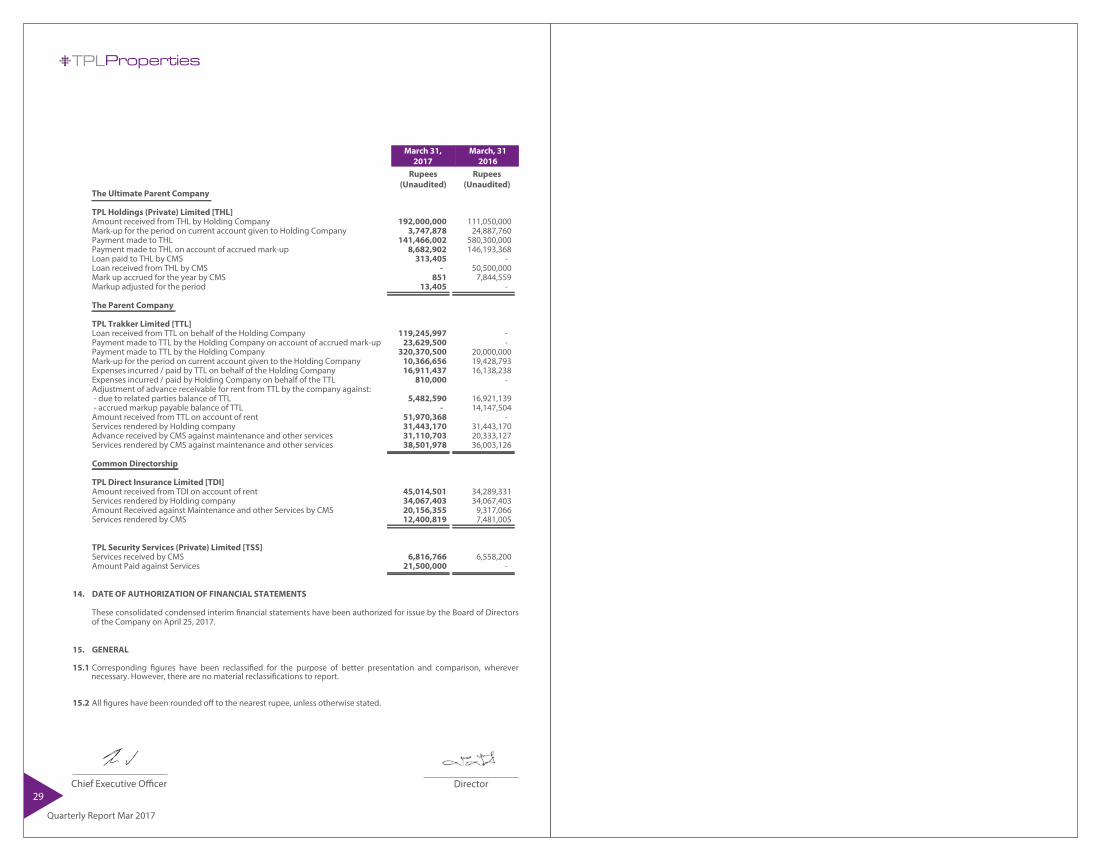
The Ultimate Parent Company TPL Holdings (Private) Limited [THL] Amount received from THL by Holding Company 192,000,000 111,050,000 Mark-up for the period on current account given to Holding Company 3,747,878 24,887,760 Payment made to THL 141,466,002 580,300,000 Payment made to THL on account of accrued mark-up 8,682,902 146,193,368 Loan paid to THL by CMS 313,405 - Loan received from THL by CMS - 50,500,000 Mark up accrued for the year by CMS 851 7,844,559 Markup adjusted for the period 13,405 - The Parent Company TPL Trakker Limited [TTL] Loan received from TTL on behalf of the Holding Company 119,245,997 - Payment made to TTL by the Holding Company on account of accrued mark-up 23,629,500 - Payment made to TTL by the Holding Company 320,370,500 20,000,000 Mark-up for the period on current account given to the Holding Company 10,366,656 19,428,793 Expenses incurred / paid by TTL on behalf of the Holding Company 16,911,437 16,138,238 Expenses incurred / paid by Holding Company on behalf of the TTL 810,000 - Adjustment of advance receivable for rent from TTL by the company against: - due to related parties balance of TTL 5,482,590 16,921,139 - accrued markup payable balance of TTL - 14,147,504 Amount received from TTL on account of rent 51,970,368 - Services rendered by Holding company 31,443,170 31,443,170 Advance received by CMS against maintenance and other services 31,110,703 20,333,127 Services rendered by CMS against maintenance and other services 38,501,978 36,003,126 Common Directorship
TPL Direct Insurance Limited [TDI] Amount received from TDI on account of rent 45,014,501 34,289,331 Services rendered by Holding company 34,067,403 34,067,403 Amount Received against Maintenance and other Services by CMS 20,156,355 9,317,066 Services rendered by CMS 12,400,819 7,481,005 TPL Security Services (Private) Limited [TSS] Services received by CMS 6,816,766 6,558,200 Amount Paid against Services 21,500,000 -
14. DATE OF AUTHORIZATION OF FINANCIAL STATEMENTS
These consolidated condensed interim �nancial statements have been authorized for issue by the Board of Directors of the Company on April 25, 2017.
15. GENERAL
15.1 Corresponding �gures have been reclassi�ed for the purpose of better presentation and comparison, wherever necessary. However, there are no material reclassi�cations to report.
15.2 All �gures have been rounded o� to the nearest rupee, unless otherwise stated.
DirectorChief Executive O�cer
March 31,2017
March, 312016
Rupees(Unaudited)
Rupees(Unaudited)
29
Quarterly Report Mar 2017