
TPC COMPONENTS AB INCREASING EFFICIENCY BY USING …zoomin.idt.mdh.se/course/kpp319/HT2012/Report...
19
TPC COMPONENTS AB INCREASING EFFICIENCY BY USING SIMULATION KPP319 INDUSTRIAL EXCELLENCE 2011-12-05 Authors Sandra Anderstig Karin Gunnarsson Zahra Mohammadi School of Innovation, Design and Engineering – IDT Mälardalen University, Eskilstuna, Sweden
Transcript of TPC COMPONENTS AB INCREASING EFFICIENCY BY USING …zoomin.idt.mdh.se/course/kpp319/HT2012/Report...

TPC COMPONENTS AB
INCREASING EFFICIENCY BY USING SIMULATION
KPP319 INDUSTRIAL EXCELLENCE
2011-12-05
Authors
Sandra Anderstig Karin Gunnarsson
Zahra Mohammadi
School of Innovation, Design and Engineering – IDT
Mälardalen University, Eskilstuna, Sweden

KPP319 Industrial Excellence
2
Abstract This paper guides the reader through the subject of simulation. Simulation models are useful to
visualize a wanted or future state of a process and they can also visualize what would happen if
you changed some parameters in a current process. This is an effective way to see what would
be beneficial for the company to implement or not. In this paper; a cutting department at TPC
Components AB is simulated and the simulations are evaluated.
KPP319 Industrial Excellence
3
CONTENTS
INTRODUCTION ...................................................................................................................................................................V
BACKGROUND AND DESCRIPTION OF SIMULATION CASE ................................................................................................................. V
OBJECTIVES AND GOALS ......................................................................................................................................................................... V
PROJECT PLAN ......................................................................................................................................................................................... V
EXPECTED RESULTS ............................................................................................................................................................................... VI
THEORETICAL BACKGROUND .................................................................................................................................... VII
SIMULATION AS A TOOL WITHIN PRODUCTION AND LOGISTICS MANAGEMENT ....................................................................... VII
DISCRETE EVENT SIMULATION .......................................................................................................................................................... VII
3D MODELING ...................................................................................................................................................................................... VII
PROCESS DESCRIPTION ................................................................................................................................................ VII
PROBLEM AND REASON FOR SIMULATION ...................................................................................................................................... VIII
DATA COLLECTION ........................................................................................................................................................ VIII
INPUTS, OUTPUTS AND DELIMITATIONS OF THE MODEL ............................................................................................................. VIII
SIMULATION MODEL.......................................................................................................................................................... X
SIMULATION MODEL CONSTRUCTION...................................................................................................................................................X
LOGICAL MODEL DESCRIPTION ............................................................................................................................................................ XI
3D MODEL DESCRIPTION .................................................................................................................................................................. XIII
Current State ......................................................................................................................................................... XIII
Future State ........................................................................................................................................................... XIV
VALIDITY AND RELEVANCE OF THE MODEL ...................................................................................................................................... XV
SIMULATION .................................................................................................................................................................... XVI
3D MODEL DESCRIPTION .................................................................................................................................................................. XVI
Robot .......................................................................................................................................................................XVII
Operators ...............................................................................................................................................................XVII
Conveyors ..............................................................................................................................................................XVII
Pallets ......................................................................................................................................................................XVII
Machines ................................................................................................................................................................XVII
Boxes........................................................................................................................................................................XVII

KPP319 Industrial Excellence
4
Feeders ...................................................................................................................................................................XVII
RESULTS AND CONCLUSIONS .................................................................................................................................. XVIII
RESULTS FROM SIMULATION .......................................................................................................................................................... XVIII
THE USE OF SIMULATION TOOLS ................................................................................................................................................... XVIII
REFERENCES .................................................................................................................................................................... XIX
KPP319 Industrial Excellence
5
INTRODUCTION
In the course Industrial Excellence, a cutting process at the company TPC Components AB is
simulated. It is done on collaboration between Mälardalen University and Robotdalen.
BACKGROUND AND DESCRIPTION OF SIMULATION CASE
As a foundation for this project a pre-study from a previous course was used. The pre-study was
performed at TPC Components, which is a medium size company that produces steel
components in the energy, automotive and process field. TPC Components is a leading company
within casting foundry in Europe. They offer installation-ready components globally to many
attractive sectors which are based on the components they make and their applications
[Anderstig et. al., 2010].
In this project we will use simulation modelling to manipulate the interaction of the cutting
process. Since TPC Components produce many different products and many of them are
processed in the cutting department, a generalization had to be made. By choosing only one
product it was possible to make dependable measurements for the time study. The current
process and the future/desired process will both be simulated in this course. ExtendSim is used
to simulate the current state and 3D Create is used to simulate both the current and the future
state. The results are compared to evaluate how the suggestions can improve the productivity
and the simulation models are analysed to investigate the reliability and to determine possible
improvements of the models.
OBJECTIVES AND GOALS
Simulation results can provide a decision support for choosing the best alternative of
improvement, in this project ExtendSim and 3D Create is used for modelling the cutting process.
Our goal is to automate the cutting department at TPC Components. Today the cutting area has
two cutting machines that are run by manual workforce. Benefits gained by automate the
department are shorter cycle times and decreased manual labour. It would also increase safety
and improve the working conditions for the employees.
The goal for the students in this project group is to gain more knowledge in both simulation
programmes; ExtendSim and 3D Create.
PROJECT PLAN
In project planning, according to the course plan, the standard steps in simulating a model with
the goal of solving the problem are following the standard. These steps contain [Dahlquist,
2006]:
KPP319 Industrial Excellence
6
1. Identify the problem
2. Interaction with outside world
3. Physical or statistical, data driven model
4. Continuous, discrete or combined
5. Simulation environment selection
6. Verification of models
7. Initialization
8. Use of the simulator
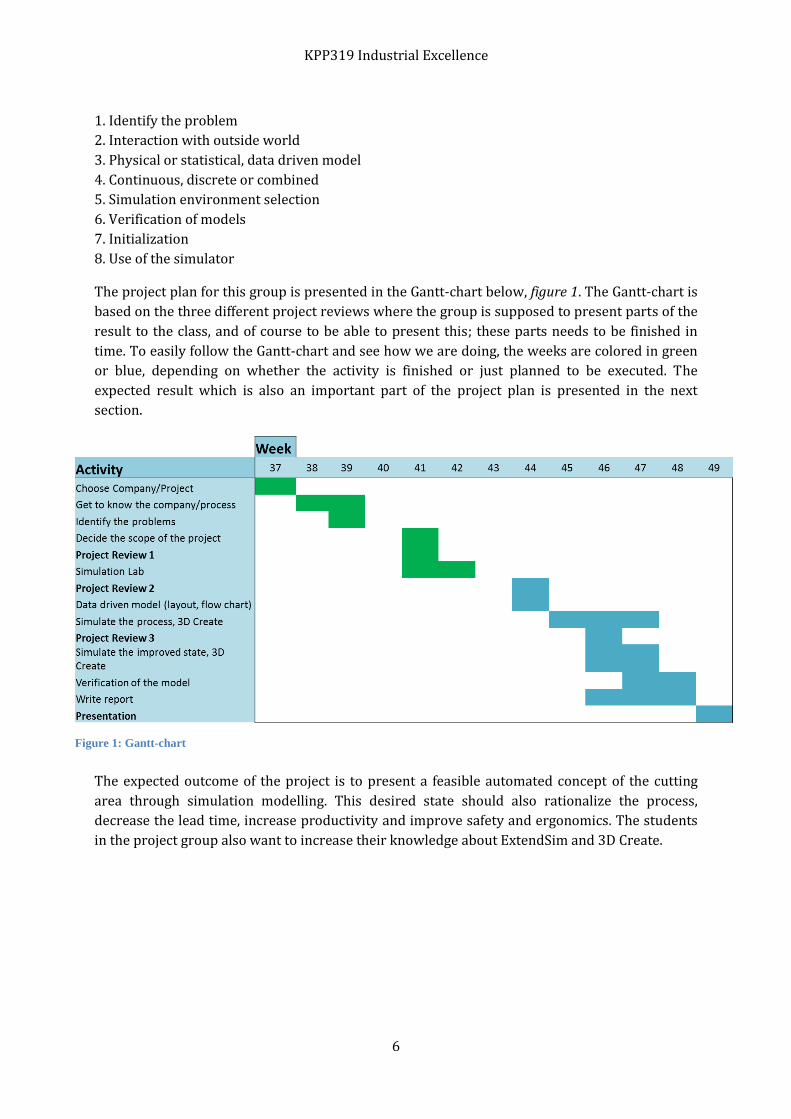
The project plan for this group is presented in the Gantt-chart below, figure 1. The Gantt-chart is
based on the three different project reviews where the group is supposed to present parts of the
result to the class, and of course to be able to present this; these parts needs to be finished in
time. To easily follow the Gantt-chart and see how we are doing, the weeks are colored in green
or blue, depending on whether the activity is finished or just planned to be executed. The
expected result which is also an important part of the project plan is presented in the next
section.
EXPECTED RESULTS
The expected outcome of the project is to present a feasible automated concept of the cutting
area through simulation modelling. This desired state should also rationalize the process,
decrease the lead time, increase productivity and improve safety and ergonomics. The students
in the project group also want to increase their knowledge about ExtendSim and 3D Create.
Figure 1: Gantt-chart
KPP319 Industrial Excellence
7
THEORETICAL BACKGROUND
SIMULATION AS A TOOL WITHIN PRODUCTION AND LOGISTICS MANAGEMENT
Simulation is used to test or experiment with a developed model based on features from reality
or estimations made based on the reality. The main objective of simulation is manipulating the
interaction of product and production flow and acquiring the ability of choosing correctly.
DISCRETE EVENT SIMULATION
In modeling a dynamic manufacturing process, discrete event simulation is used based on
operational or strategic applications. In discrete event simulation, the operation of the system is
illustrated as the sequence of events in countable number of points in specific duration of time.
The major purpose of discrete modeling is detailed analysis of linear processes. In discrete
modeling, the focus is on detailed features related to discrete event dynamic.
3D MODELING
3D Modeling is simulating a defined object on mathematical logic, in a three dimensional world.
In 3D modeling; objects in a 3D world are used by connecting triangles, curves, etc. to visualize
the model. The 3D models are categorized in solid models and shell-boundary. Solid models
defined the volume of the object and shell-boundary models defined the structure of a model.
PROCESS DESCRIPTION
Cutting operations are done by two machines; Grenkap and Stamkap. One is used to remove the
big semi-conical part from the casting; the other is used to cut the useful component down.
Operators are managing the cutting machines and the input and
output of the material.
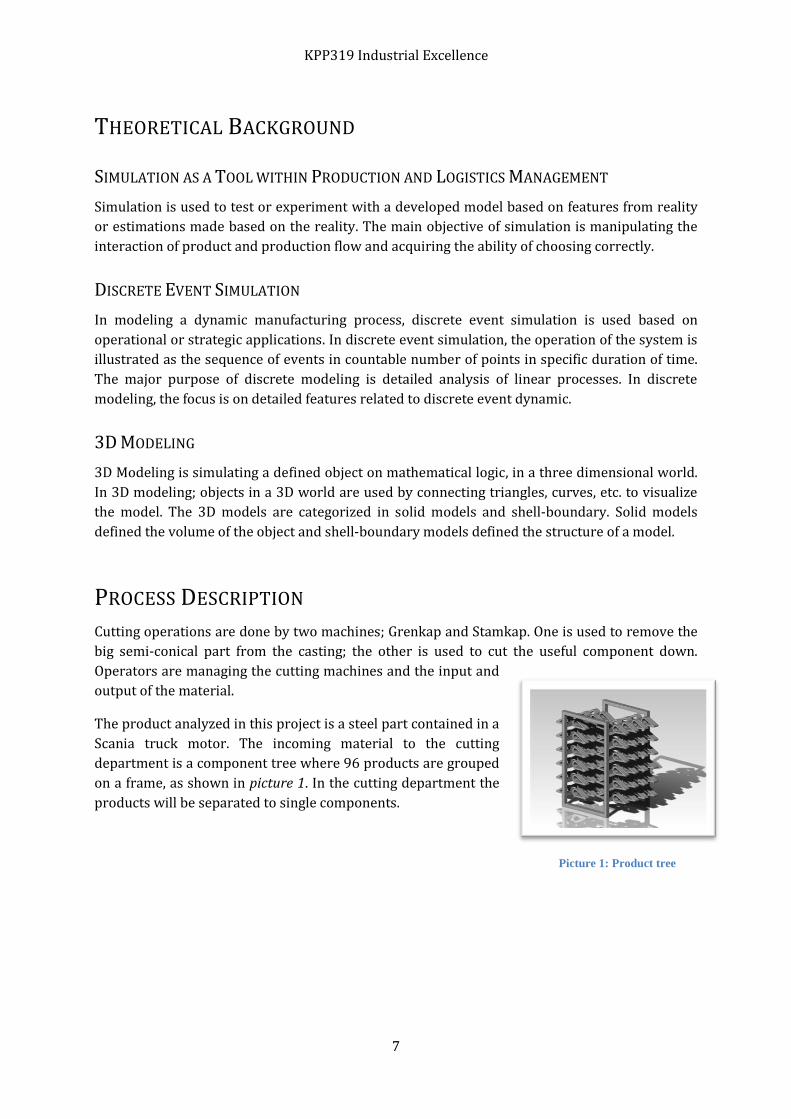
The product analyzed in this project is a steel part contained in a
Scania truck motor. The incoming material to the cutting
department is a component tree where 96 products are grouped
on a frame, as shown in picture 1. In the cutting department the
products will be separated to single components.
Picture 1: Product tree
KPP319 Industrial Excellence
8
Wax manufacturing of
details
Wax manufacturing of
runner system
Wax assembly
Shell manufacturing
Dewaxing
Casting
Cutting
Blasting Grinding
Heat treatment
Blasting
Packaging
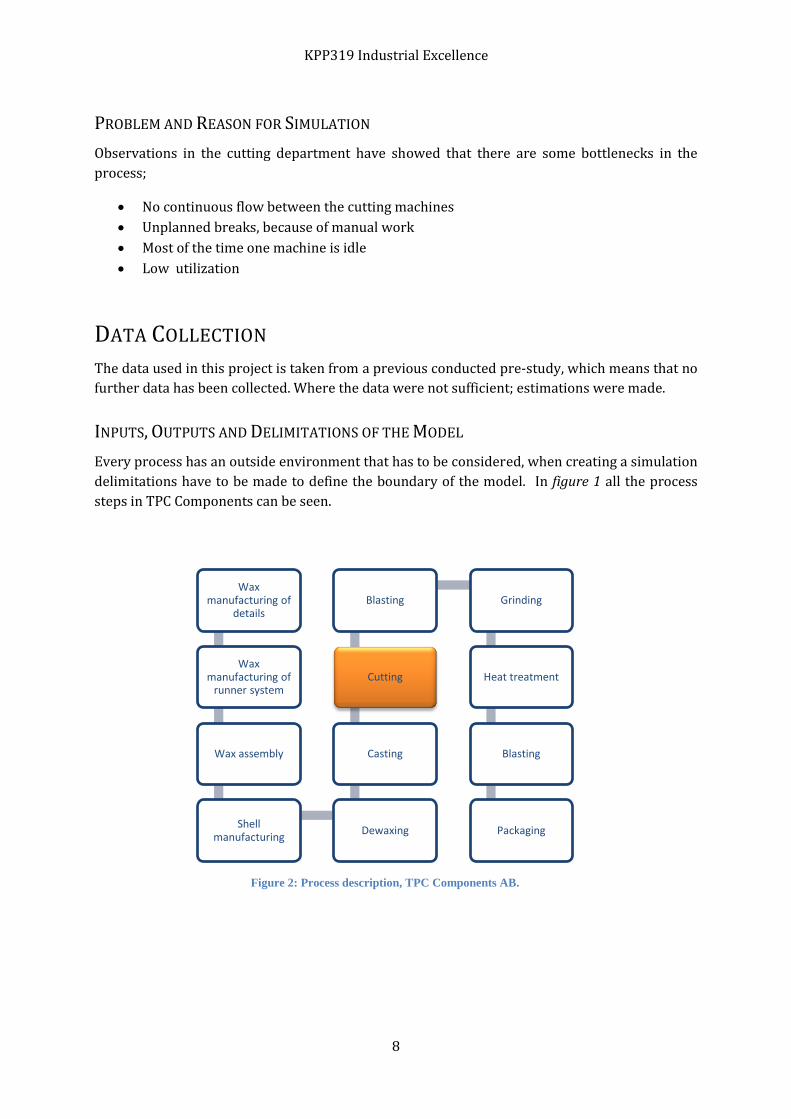
PROBLEM AND REASON FOR SIMULATION
Observations in the cutting department have showed that there are some bottlenecks in the
process;
No continuous flow between the cutting machines
Unplanned breaks, because of manual work
Most of the time one machine is idle
Low utilization
DATA COLLECTION
The data used in this project is taken from a previous conducted pre-study, which means that no
further data has been collected. Where the data were not sufficient; estimations were made.
INPUTS, OUTPUTS AND DELIMITATIONS OF THE MODEL
Every process has an outside environment that has to be considered, when creating a simulation
delimitations have to be made to define the boundary of the model. In figure 1 all the process
steps in TPC Components can be seen.
Figure 2: Process description, TPC Components AB.
KPP319 Industrial Excellence
9
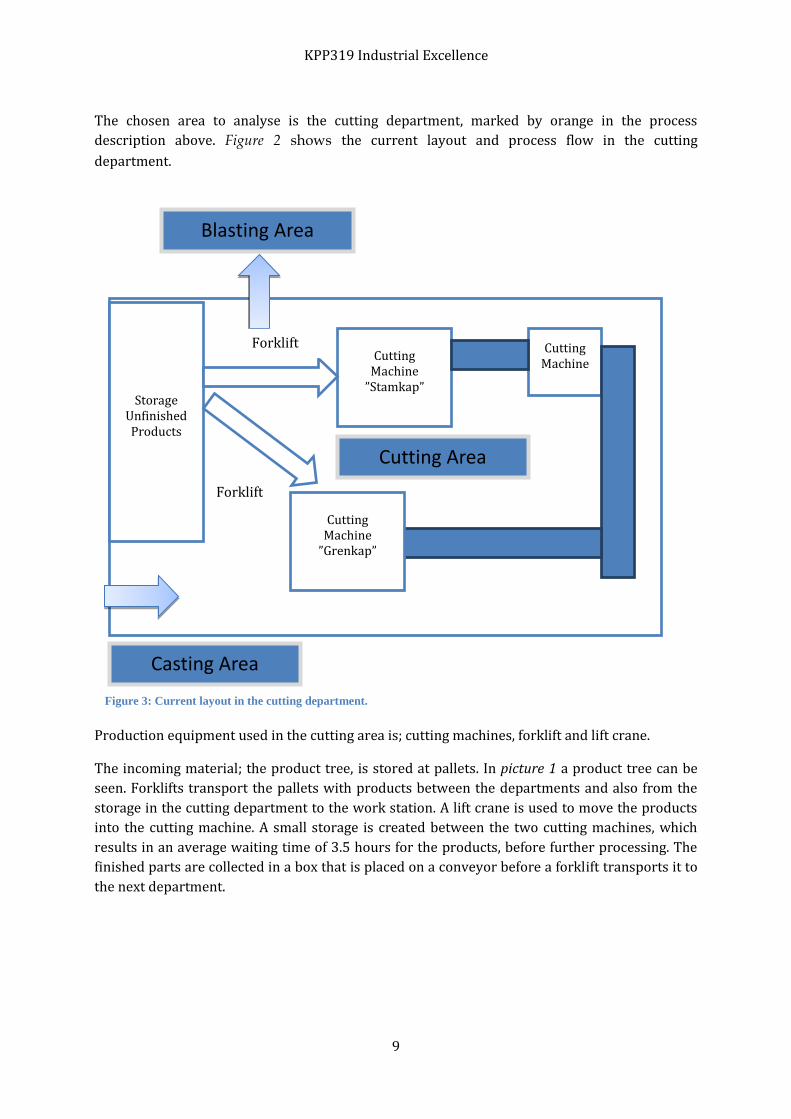
The chosen area to analyse is the cutting department, marked by orange in the process
description above. Figure 2 shows the current layout and process flow in the cutting
department.
Production equipment used in the cutting area is; cutting machines, forklift and lift crane.
The incoming material; the product tree, is stored at pallets. In picture 1 a product tree can be
seen. Forklifts transport the pallets with products between the departments and also from the
storage in the cutting department to the work station. A lift crane is used to move the products
into the cutting machine. A small storage is created between the two cutting machines, which
results in an average waiting time of 3.5 hours for the products, before further processing. The
finished parts are collected in a box that is placed on a conveyor before a forklift transports it to
the next department.
CuttingMachine
Cutting Machine
”Stamkap” Storage
Unfinished Products
Casting Area
Blasting Area
Forklift
Forklift
Cutting Machine
”Grenkap”
Cutting Area
Figure 3: Current layout in the cutting department.

KPP319 Industrial Excellence
10
Production information:
There is a centrally connected computer in the middle of the station where the workers can
check the demand and the schedule of their respective work. According to the demand, they
come to know the relevant information about the number and type of products to be cut in the
cutting machine. Operators use visual control on the products before they go into the cutting
process, to know in which machine they should be entered.
Production volume:
TPC Components has a wide variation of the batch sizes for different products. Some customers
order only a low volume of a component per year, while others are high volume customers that
order continuously. In average 400 trees per week, of the specific product observed, are being
processed in the cutting department.
Cycle Time:
Process Name
Set up time (min)
Pieces/Hour (Actual average)
Capacity Pieces/Hour (Theoretical)
Utilization Cycle times/Tree (min)
Cutting, Stamkap
5 1019 1277 79.8 % 2,02
Conveyor - - - - 210,00
Cutting, Grenkap
10 1059 1545 68.5 % 1,67
Total cycle time
213,69
The parts that have been cut in the first machine, waiting to be cut in the second one, are
placed on a conveyer between the machines. The average waiting time is 3.5 h.
SIMULATION MODEL
To clarify the process and the problem statement a couple of simulations in ExtendSim and 3D
Create will be presented. These models will helps to argument for or against an implementation
of an automation system.
SIMULATION MODEL CONSTRUCTION
The pre-study presented two improved suggestions for the cutting department layout. For this
simulation the layout most likely to be implemented was chosen. After choosing the layout the
data required to simulate this process was extracted from the pre-study and anything that could
not be found in the pre-study has been estimated. This way a simulation has been produced.
KPP319 Industrial Excellence
11
LOGICAL MODEL DESCRIPTION
The initial problems observed were the long waiting time between the two cutting machines and
that the machines are operated manually and that the work plan is not efficient enough to get a
high utilization. Therefore the current state of cutting area was simulated in ExtendSim with
focus on the problem, in order to find the best solution to improve the cutting area.
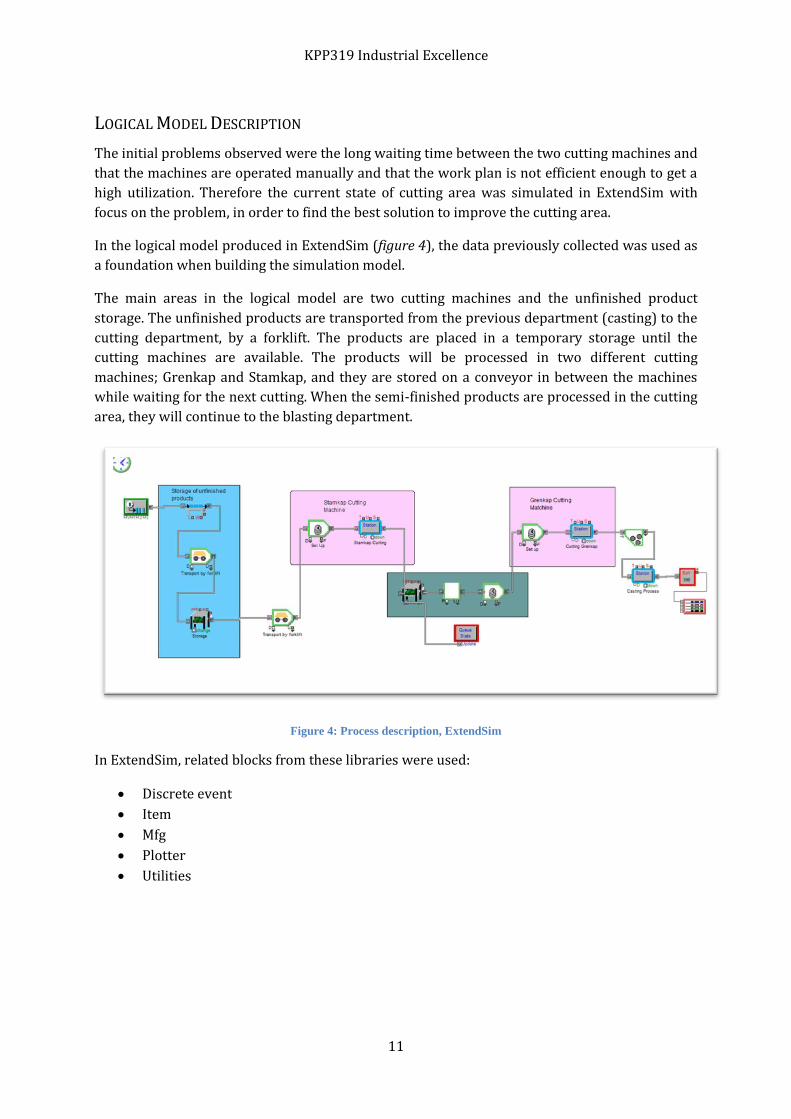
In the logical model produced in ExtendSim (figure 4), the data previously collected was used as
a foundation when building the simulation model.
The main areas in the logical model are two cutting machines and the unfinished product
storage. The unfinished products are transported from the previous department (casting) to the
cutting department, by a forklift. The products are placed in a temporary storage until the
cutting machines are available. The products will be processed in two different cutting
machines; Grenkap and Stamkap, and they are stored on a conveyor in between the machines
while waiting for the next cutting. When the semi-finished products are processed in the cutting
area, they will continue to the blasting department.
Figure 4: Process description, ExtendSim
In ExtendSim, related blocks from these libraries were used:
Discrete event
Item
Mfg
Plotter
Utilities

KPP319 Industrial Excellence
12
At first, with considering the process description, the discrete event model was created using
related blocks:
Buffer Block from Mfg Library: Simulates a first-in-first-out (FIFO) queue for buffering products
needed by machines, conveyors, or batching operations. The maximum length, which
determines how many products the buffer can hold, can be set in the dialog.
Transport Block from Item Library: Moves the product from one block to another.
Stock Block from Mfg Library: Provides and stores items such as raw materials, work in process,
and so on. This block may be used in an open system such as when items are shipped, or in a
closed system such as when exchanging parts in spares inventory.
Activity Block from Item Library: Defines process activities.
Queue Block from Item Library: Queues products and releases them based on a user selected
queuing algorithm.
Plotter Block from Plotter Library: Defines the results on plot.
Unbatch from Item Library: Produces multiple products from a single input product,
“unbatching” them. The number of products produced at each output is specified in the dialog.
This block holds its inputs until its outputs are used.
Queue Stats from Discrete Event Library: Place this block anywhere in the model and it will
report the following statistics for all queue-type blocks in the model:
Block number (or block label, if a label is entered in the block)
Block Name
Average Queue Length
Maximum Queue Length
Average Wait Time
Maximum Wait Time
Time of Observation
When modeling the cutting department in ExtendSim the times and logic behind it was
considered.
In the cutting department the machines actual operation time is 35 hours per week (126 000
sec) for each machine. In average 400 trees per week are being processed in the cutting
department. The parts that have been cut in the first machine, waiting to be cut in the second
one, are placed on a conveyor between the machines. The average waiting time is 3.5 h. This
information along with other data from the table of cycle times and set times are entered in the
model and the verification of the model is made.

KPP319 Industrial Excellence
13
As the model is run for 35 hours, the result is:
3D MODEL DESCRIPTION
CURRENT STATE A simulation model for the current state was created. The way it works on TPC Components
today is that there are two cutting machines managed by manual work. To get a finished product
the product trees must go through both cutting machines. In between the machines there is a
conveyor that works as storage more than a transport tool. The product trees are heavy and the
ergonomic situation in the current state could be improved.
Figure 5: Plot for the ExtendSim results
Picture 2: Current Layout, 3D Create
KPP319 Industrial Excellence
14
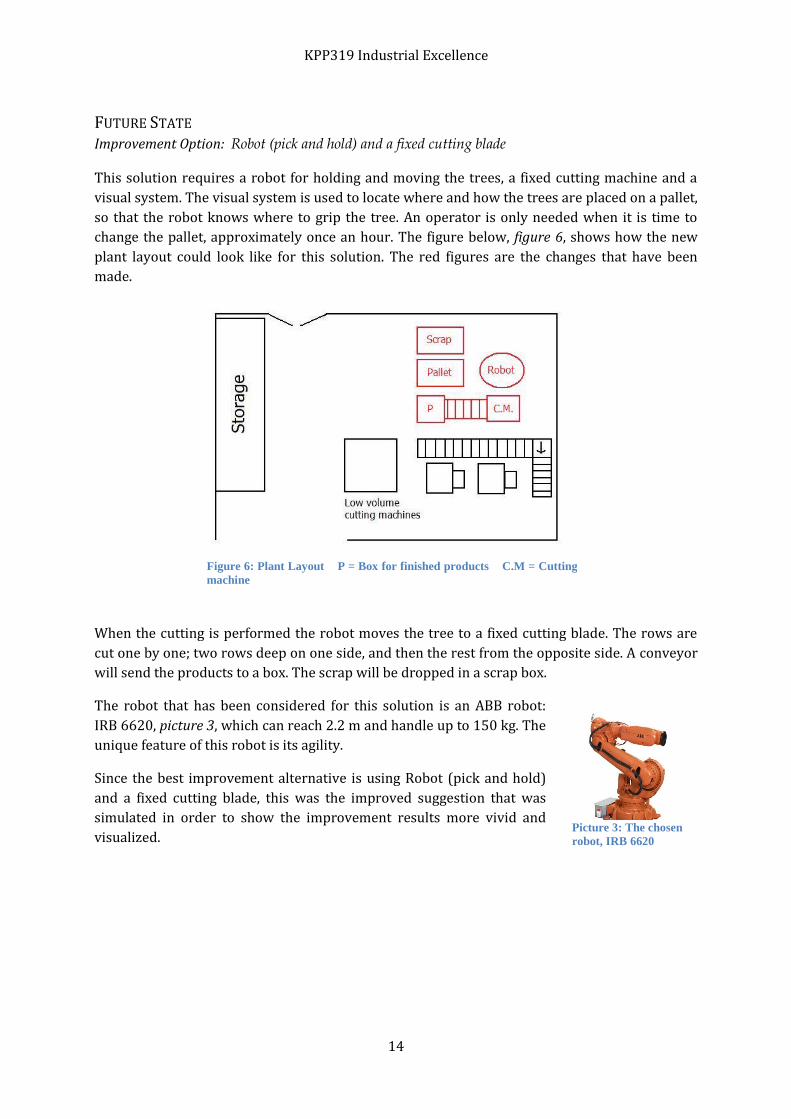
FUTURE STATE Improvement Option: Robot (pick and hold) and a fixed cutting blade
This solution requires a robot for holding and moving the trees, a fixed cutting machine and a
visual system. The visual system is used to locate where and how the trees are placed on a pallet,
so that the robot knows where to grip the tree. An operator is only needed when it is time to
change the pallet, approximately once an hour. The figure below, figure 6, shows how the new
plant layout could look like for this solution. The red figures are the changes that have been
made.
When the cutting is performed the robot moves the tree to a fixed cutting blade. The rows are
cut one by one; two rows deep on one side, and then the rest from the opposite side. A conveyor
will send the products to a box. The scrap will be dropped in a scrap box.
The robot that has been considered for this solution is an ABB robot:
IRB 6620, picture 3, which can reach 2.2 m and handle up to 150 kg. The
unique feature of this robot is its agility.
Since the best improvement alternative is using Robot (pick and hold)
and a fixed cutting blade, this was the improved suggestion that was
simulated in order to show the improvement results more vivid and
visualized.
Figure 6: Plant Layout P = Box for finished products C.M = Cutting
machine
Picture 3: The chosen
robot, IRB 6620

KPP319 Industrial Excellence
15
The simulation is focused around the robot and the robot’s working area. The input is a pallet
filled with the product trees; the unfinished products. The robot is moving the product tree to
the cutting machine and releases the scrap in a scrap box. Conveyors are transporting the
finished products to a buffer. Picture 4 shows the future state layout.
VALIDITY AND RELEVANCE OF THE MODEL
The current simulation model is based on input and output data that are valid today. That makes
it easy to compare the simulation with the reality, that way it is possible to confirm whether the
model is valid.
The simulation results in ExtendSim were compared with the data in the pre-study, and it
proved valid.
The future state model is loosely based on the input and output of today, which makes it hard to
estimate exactly if the model is valid since there are so many changes from the current state.
Picture 4: Future state, 3D Create
KPP319 Industrial Excellence
16
SIMULATION
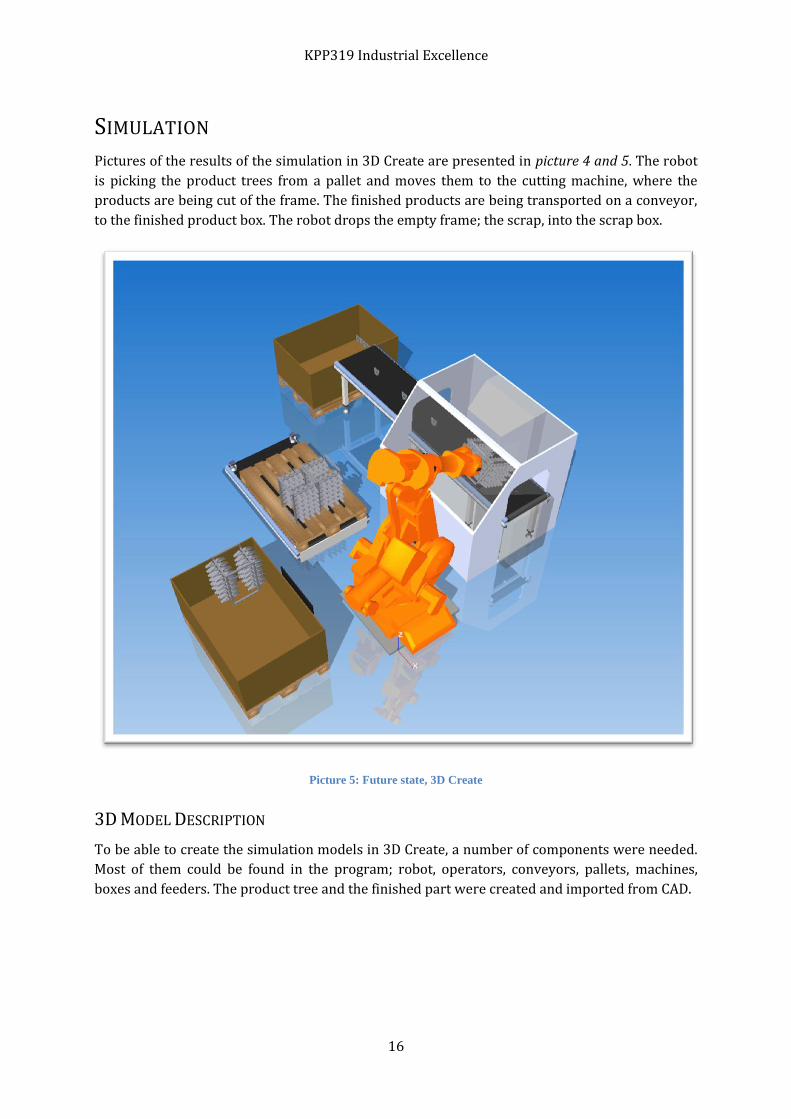
Pictures of the results of the simulation in 3D Create are presented in picture 4 and 5. The robot
is picking the product trees from a pallet and moves them to the cutting machine, where the
products are being cut of the frame. The finished products are being transported on a conveyor,
to the finished product box. The robot drops the empty frame; the scrap, into the scrap box.
Picture 5: Future state, 3D Create
3D MODEL DESCRIPTION
To be able to create the simulation models in 3D Create, a number of components were needed.
Most of them could be found in the program; robot, operators, conveyors, pallets, machines,
boxes and feeders. The product tree and the finished part were created and imported from CAD.
KPP319 Industrial Excellence
17
ROBOT The robot suggested in the pre-study was imported from ABB’s folder in 3D Creates library. The
robot was placed on a machine tending robot manager, which simulates the computer program
telling the robot what to do.
OPERATORS Two operators were added into the current state simulation. To be able to communicate with
the operators, machine tending managers were needed. Through the machine tending managers
it is possible to communicate how the operators work; which machines to attend, pathways etc.
CONVEYORS The conveyors used in both simulations are basic belt conveyors. Some of them are equipped
with sensors to let the machine tending robot manager and the machine tending manager know
when there are products to pick up.
PALLETS The pallets used in these simulations are standard Euro-pallets. These can be imported from the
component library in 3D Create.
MACHINES Process machine work tables were imported in the current state simulation. The process point
conveyors were used in both the current and future state simulations, but it is not an actual
machine that can be manipulated. It
represents the cutting machines.
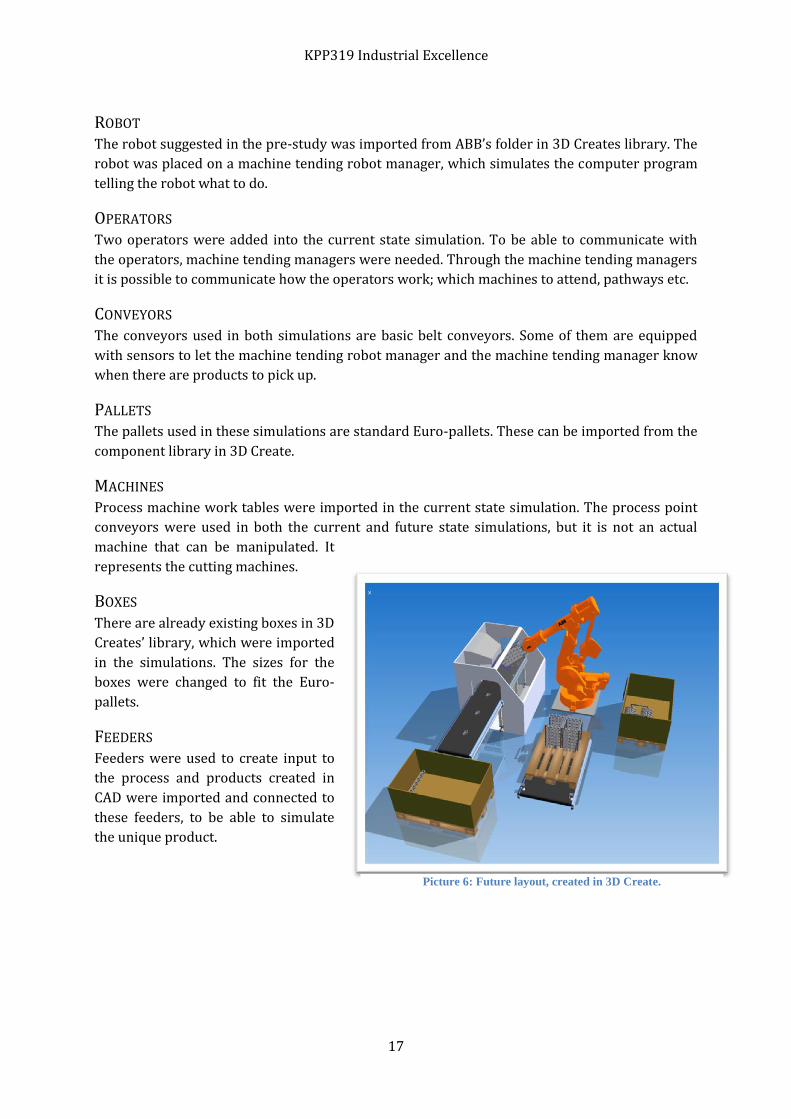
BOXES There are already existing boxes in 3D
Creates’ library, which were imported
in the simulations. The sizes for the
boxes were changed to fit the Euro-
pallets.
FEEDERS Feeders were used to create input to
the process and products created in
CAD were imported and connected to
these feeders, to be able to simulate
the unique product.
Picture 6: Future layout, created in 3D Create.
KPP319 Industrial Excellence
18
RESULTS AND CONCLUSIONS
RESULTS FROM SIMULATION
The current situation simulation of the cutting department in Extendsim and 3D Create has
proved the bottlenecks in the process;
No continuous flow between the cutting machines
Unplanned breaks, because of manual work
Most of the time one machine is idle
Low utilization
The simulation of the current state confirms that there is a lot of idle time for the cutting
machines in the cutting department. The simulation of the future state proves that the suggested
improvement would create a continuous flow. One reason for the continuous flow is that the
time for mounting the product tree will be reduced. Another reason is that the product trees
only need to be processed in one cutting machine, this way the product only has the be mounted
one time and the storage that used to be between the machines will be removed completely.
Continuous flow also provides a higher capacity. The ergonomic situation would be improved
because the operators would not have to lift the product trees.
If TPC Components AB would chose to implement the suggested future solution, there would be
a high cost to implement the solution, but in the long run it would be profitable. Further
calculations can be found in the pre-study, which this project is based upon [Anderstig et. al.,
2010].
THE USE OF SIMULATION TOOLS
Simulation in this project has helped us clarify the problem within the cutting department. The
lack of continuous flow, storage between the two cutting machines and the idle time of the
machines is obvious in the simulation.
Also, using simulation tools have helped us to increase our knowledge about simulation and the
specific programs we have used; ExtendSim and 3D Create. Our understanding of the
importance for simulation as a tool for improving the efficiency in production systems has
increased. We find simulation useful when it comes to evaluation and visualization of production
systems.

KPP319 Industrial Excellence
19
REFERENCES Dahlquist, E. (2006). Process Technology and Process Simulation. Mälardalen University, Sweden
http://en.wikipedia.org/wiki/3D_modeling, accessed 2011-11-30, time 11:00.