Toyota Motor Sales, U.S.A., Inc. Corppgorate … 03192009 _Sm.pdf · Association of Energy...
49
Toyota Motor Sales, U.S.A., Inc. Corporate Energy Management Program
-
Upload
vuongkhanh -
Category
Documents
-
view
215 -
download
0
Transcript of Toyota Motor Sales, U.S.A., Inc. Corppgorate … 03192009 _Sm.pdf · Association of Energy...
Toyota Motor Sales, U.S.A., Inc. Corporate Energy Management Programp gy g g
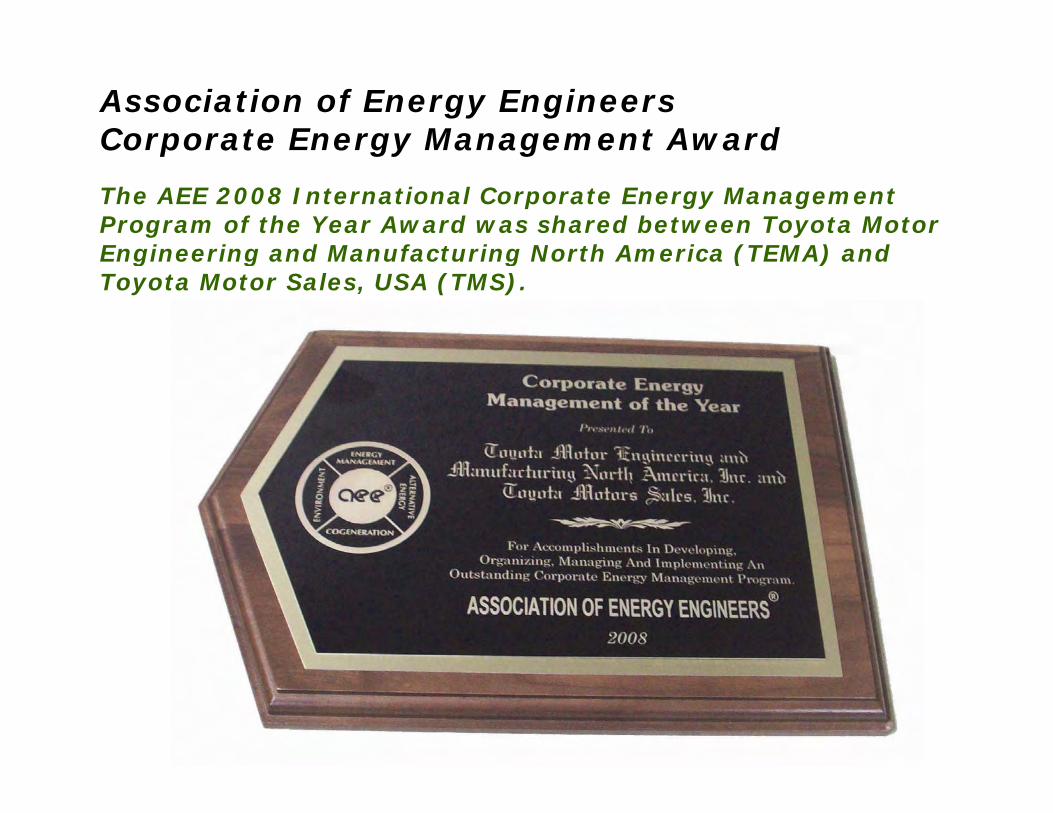
Association of Energy Engineers Corporate Energy Management Award
The AEE 2008 International Corporate Energy Management Program of the Year Award was shared between Toyota Motor Engineering and Manufacturing North America (TEMA) and
Co po ate e gy a age e t a d
Engineering and Manufacturing North America (TEMA) and Toyota Motor Sales, USA (TMS).
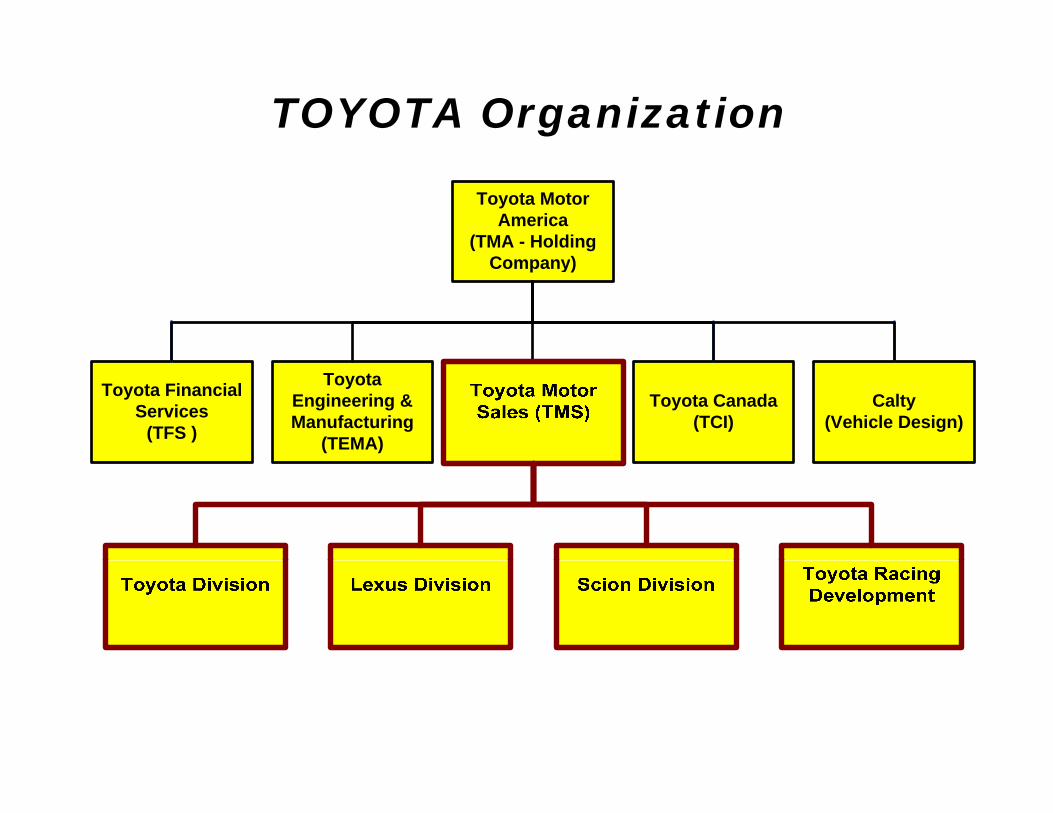
TOYOTA Organization
Toyota Motor America
(TMA - Holding Company)
Toyota Financial Services
(TFS )
Toyota Engineering & Manufacturing
(TEMA)
Toyota Motor Sales (TMS) Toyota Canada
(TCI)Calty
(Vehicle Design)
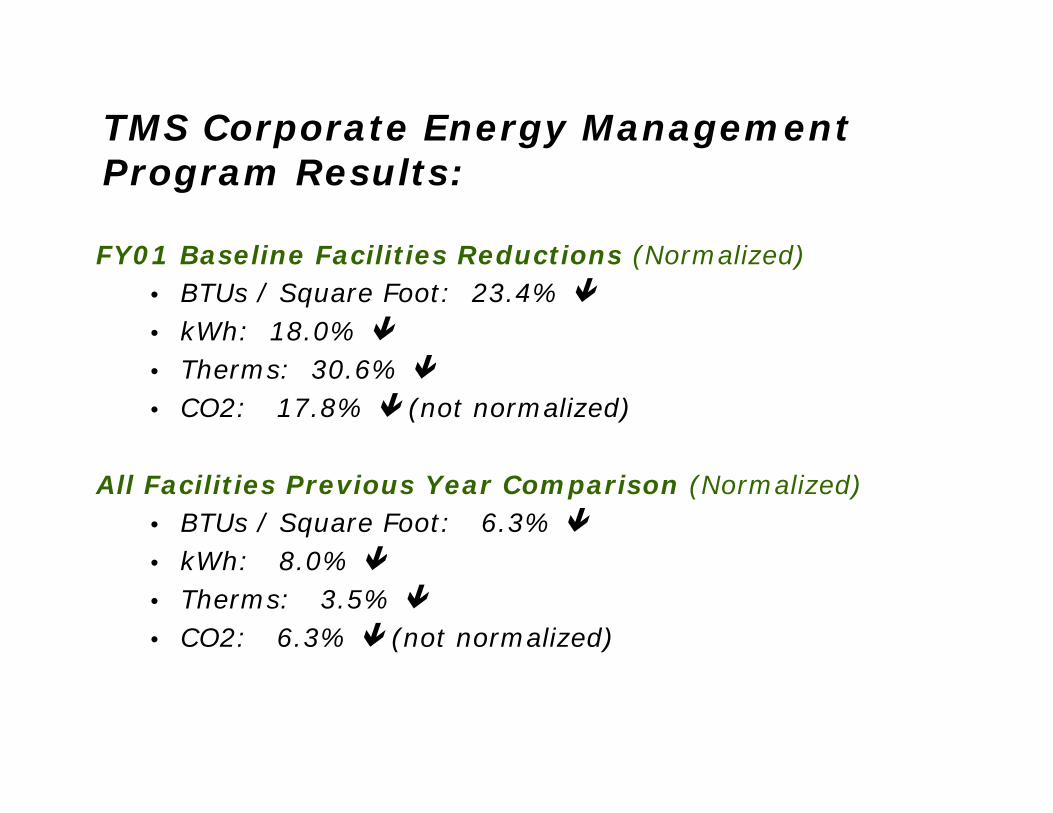
TMS Corporate Energy Management
FY01 Baseline Facilities Reductions (Normalized)
Program Results:
FY01 Baseline Facilities Reductions (Normalized)• BTUs / Square Foot: 23.4% • kWh: 18.0% • Therms: 30.6% • CO2: 17.8% (not normalized)
All Facilities Previous Year Comparison (Normalized)• BTUs / Square Foot: 6.3% • kWh: 8 0% • kWh: 8.0% • Therms: 3.5% • CO2: 6.3% (not normalized)
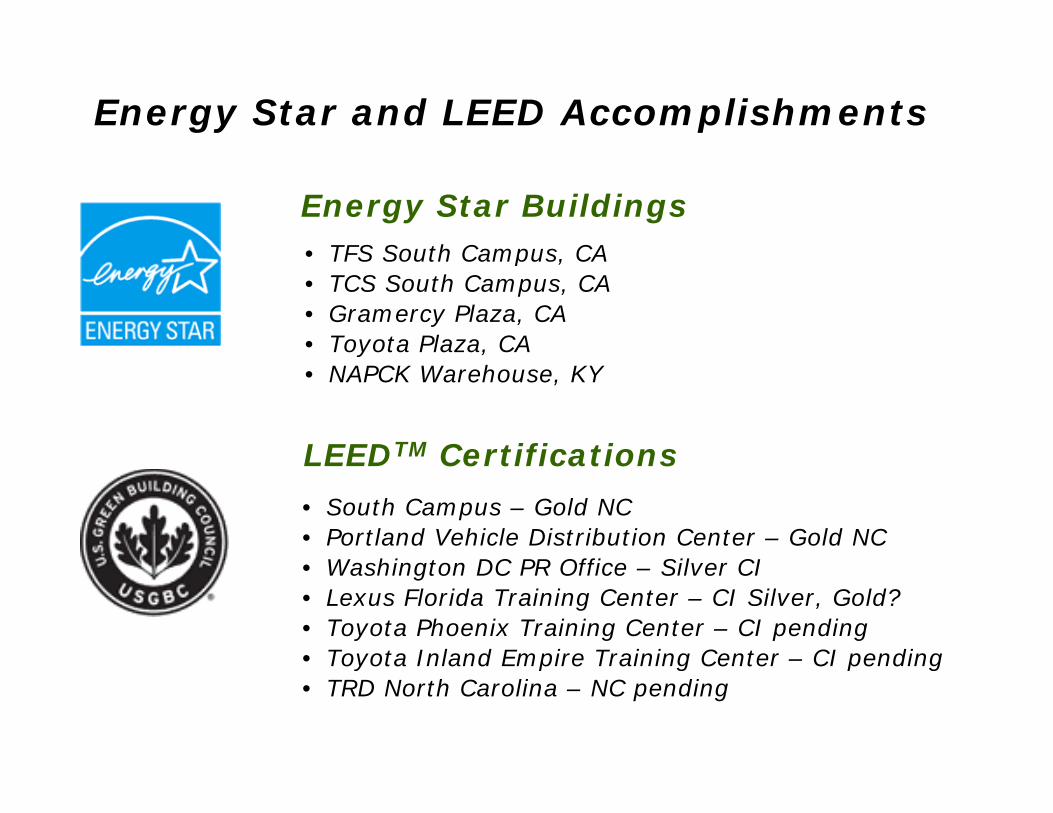
Energy Star and LEED Accomplishments
Energy Star Buildings • TFS South Campus CA• TFS South Campus, CA• TCS South Campus, CA• Gramercy Plaza, CA• Toyota Plaza, CAy ,• NAPCK Warehouse, KY
LEEDTM Certifications
• South Campus – Gold NC• Portland Vehicle Distribution Center – Gold NC
W hi t DC PR Offi Sil CI
LEED Certifications
• Washington DC PR Office – Silver CI• Lexus Florida Training Center – CI Silver, Gold?• Toyota Phoenix Training Center – CI pending• Toyota Inland Empire Training Center – CI pendingToyota Inland Empire Training Center CI pending• TRD North Carolina – NC pending
Toyota’s Environmental Commitment Drives its Sustainability and Energy Management
Toyota Motor Corporation Earth Charter (1992)
its Sustainability and Energy Management Programs.
Toyota Motor Corporation Earth Charter (1992)• Contribute towards a prosperous 21st century society• Pursue environmental technologies• Take action voluntarily• Take action voluntarily• Work in cooperation with society
"It is more than just good business for Toyota; it is the key to the future of our industry and a necessity for a healthy future industry and a necessity for a healthy future for people everywhere.”
Fujio Cho, President of Toyota Motor Corporationj , y p
Toyota Motor Sales Facility Types
•Office Buildings
oyota oto Sa es ac ty ypes
HQ Campus in California (2,000,000 Sq. Ft.)
14 Toyota & Lexus Regional Offices (550,000 Sq. Ft.)
•Warehouse Facilities
2 Parts Centers (1,875,000 Sq. Ft.)( , , q )
9 Parts Distribution Centers (2,400,000 Sq. Ft.)
•Logistics Operations•Logistics Operations
Post Production Operations (675,000 Sq. Ft.)
Site Lighting (800 acres)Site Lighting (800 acres)
Corporate Energy Program OverviewComprehensive Program Developed With TMS Business Partner:
• Utility Invoice Tracking
Business Partner:
• Utility Invoice Tracking • Real Time Energy Monitoring• Treasure HuntsTreasure Hunts• Building Automation Systems• Energy Projects
Corporate Energy Program Overview
• Utility Invoice Tracking• Utility Invoice Tracking• Real Time Energy Monitoring• Treasure Hunts• Building Automation Systems• Energy Projects

Utility Invoice TrackingCollecting Datasitename NAPCK Kentucky SC EUI Baseline EUI BasllinesiteType (All) 32 904 61 49 091 02siteType (All) 32,904.61 49,091.02 sitestate (All)mtrtype (All)
monthyrpivotsite Data Jan-00 Feb-00 Aug-08 Sep-08 Oct-08 Nov-08 Dec-08NAPCK Kentucky Sum of kwhU 920,400 945,000 463,522 460,756 437,017 440,412 454,886
Sum of kwhR 0 0 0 0 0 0 0Sum of kwhN 0 0 0 0 0 0 0Sum of kwhN 0 0 0 0 0 0 0Sum of BldgLoad 920,400 945,000 463,522 460,756 437,017 440,412 454,886Sum of therms 27,340 22,800 70 160 700 10,520 19,580Sum of wtrP 0 0 138,600 599,626 173,274 97,700 114,700Sum of wtrISum of wtrRSum of galswater 0 0 138,600 599,626 173,274 97,700 114,700Sum of sqft 1,071,984 1,071,984 1,071,984 1,071,984 1,071,984 1,071,984 1,071,984Sum of other sqft 0 0 0 0 0 0 0Sum of totalsqft 1,071,984 1,071,984 1,071,984 1,071,984 1,071,984 1,071,984 1,071,984Sum of lacres 0.0 0.0 0.0 0.0 0.0 0.0 0.0Sum of eucost $49,400 $51,100 $40,840 $38,411 $39,843 $43,334 $41,850Sum of ercostSum of encostSum of gcost $29,700 $24,800 $144 $251 $899 $12,528 $20,113Sum of watercost $0 $0 $564 $2,401 $702 $410 $468Sum of vehiclesS fSum of partsSum of mmbtuElect 3,141 3,224 1,582 1,572 1,491 1,503 1,552Sum of mmbtuGas 2,733 2,279 7 16 70 1,052 1,958
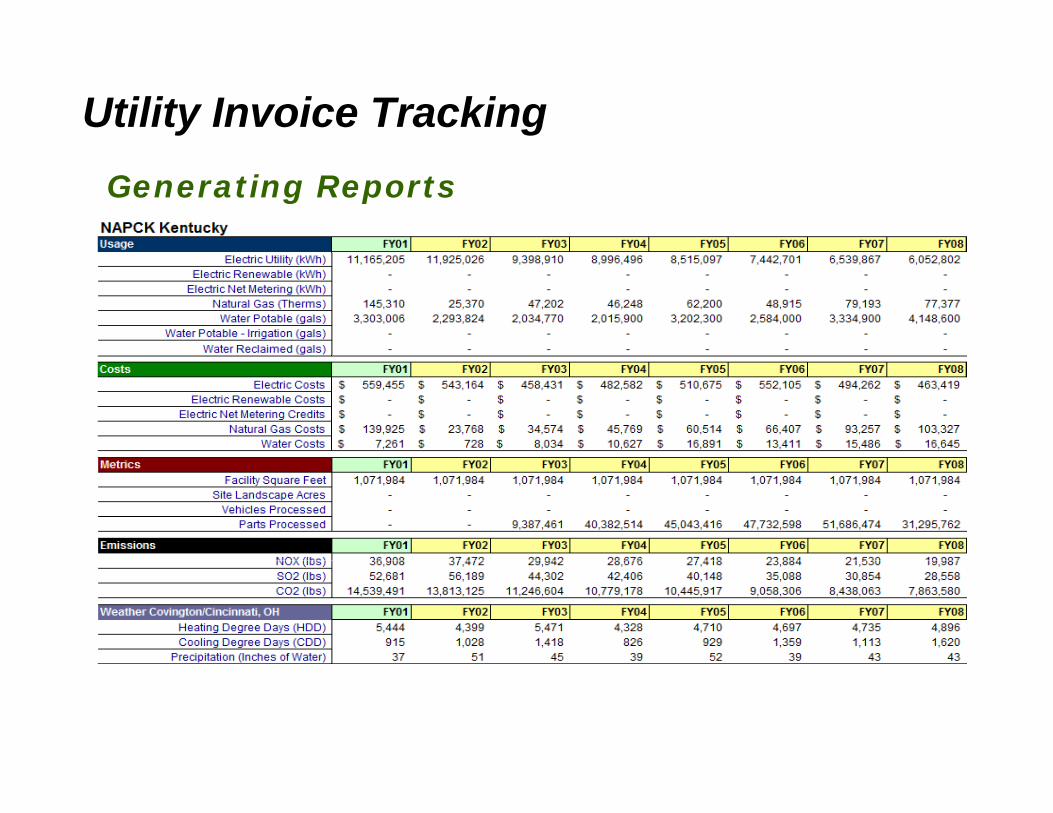
Utility Invoice TrackingGenerating Reports
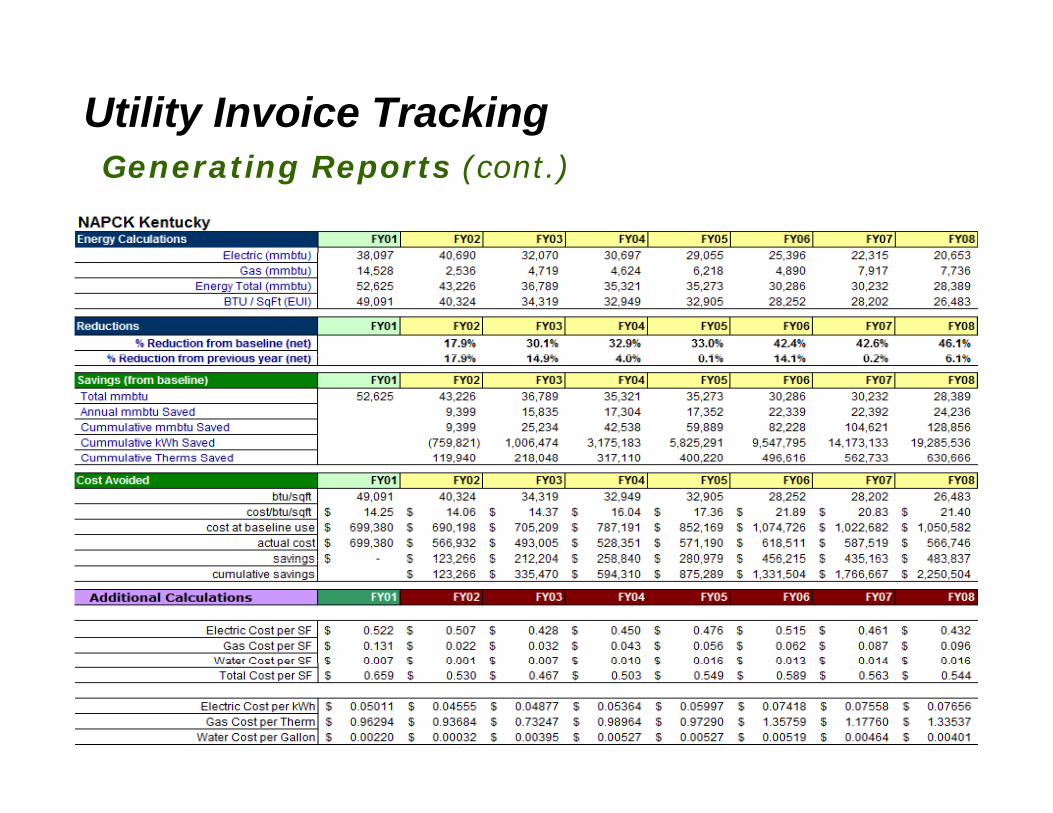
Utility Invoice TrackingGenerating Reports (cont.)
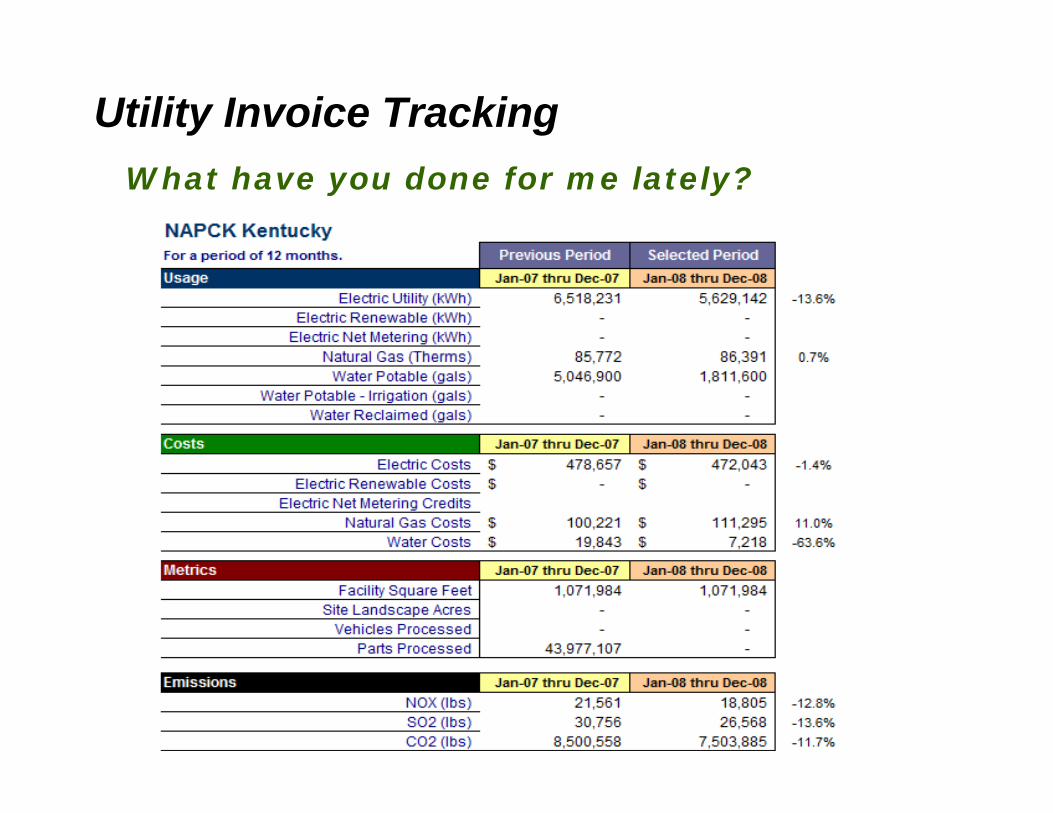
Utility Invoice TrackingWhat have you done for me lately?
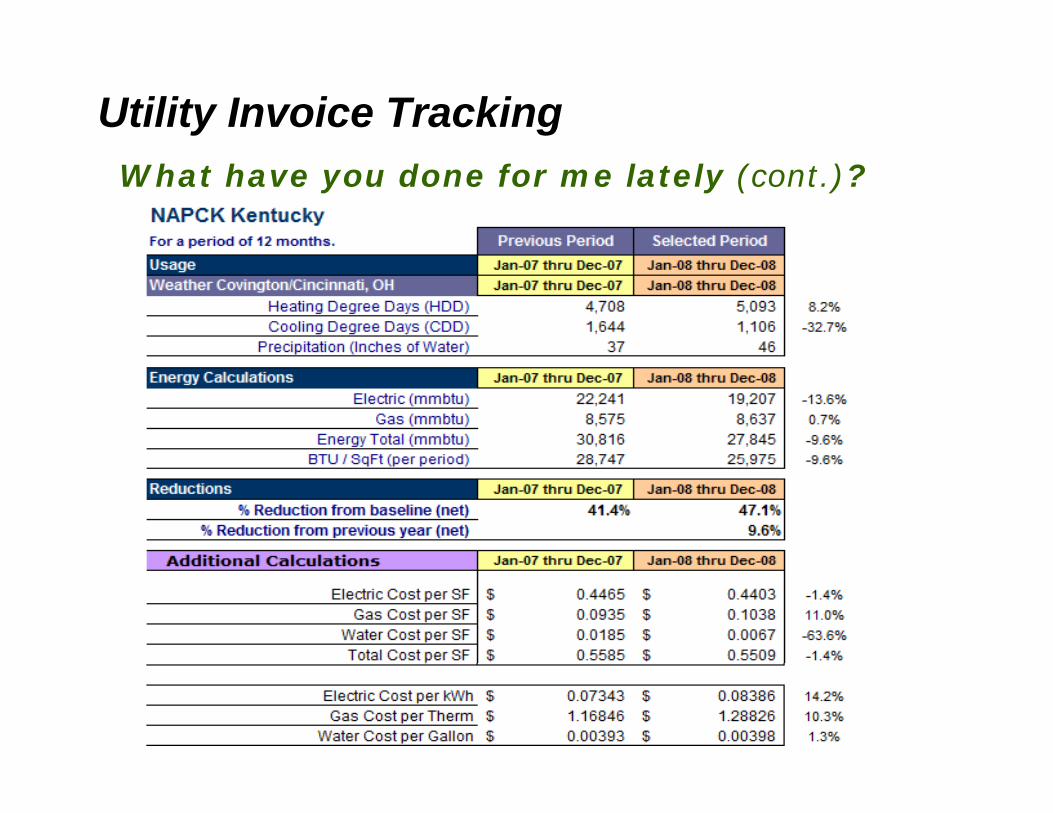
Utility Invoice TrackingWhat have you done for me lately (cont.)?
Utility Invoice Tracking
L k f li
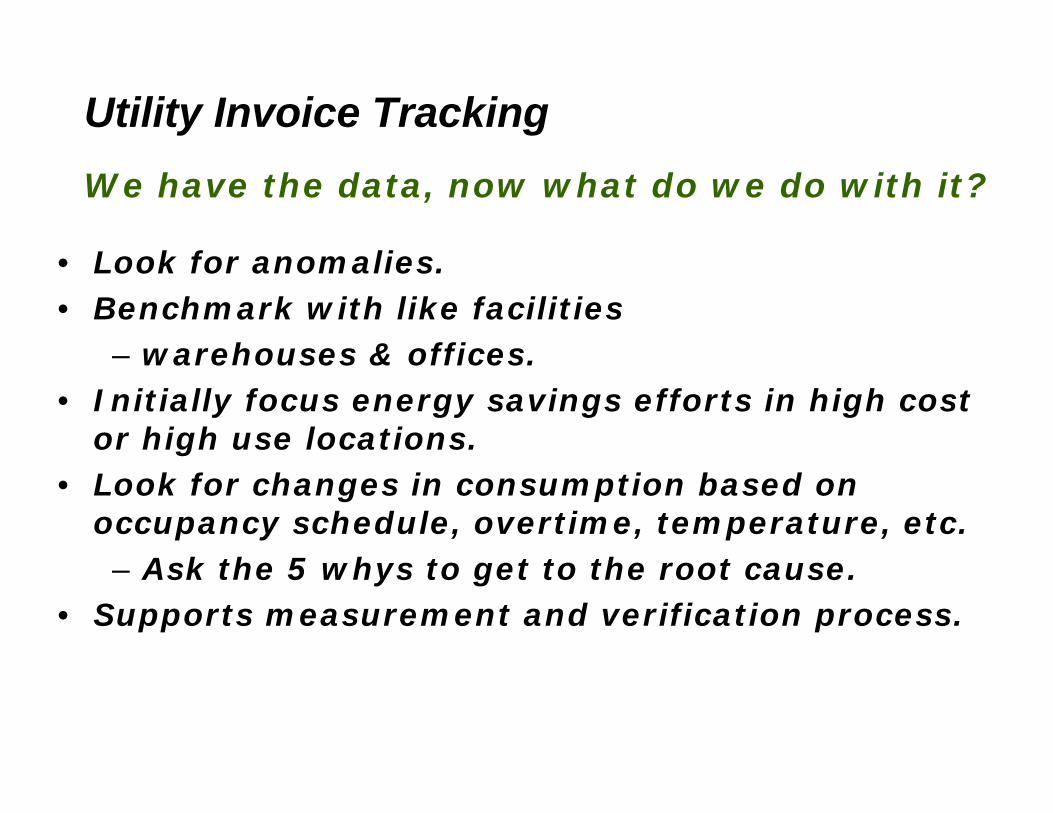
We have the data, now what do we do with it?
• Look for anomalies.• Benchmark with like facilities
warehouses & offices– warehouses & offices.• Initially focus energy savings efforts in high cost
or high use locations.• Look for changes in consumption based on
occupancy schedule, overtime, temperature, etc. A k th 5 h t t t th t – Ask the 5 whys to get to the root cause.
• Supports measurement and verification process.
Corporate Energy Program Overview
• Utility Invoice Tracking• Utility Invoice Tracking• Real Time Energy Monitoring• Treasure Hunts• Building Automation Systems• Energy Projects
Real Time Energy Monitoring
kWh
kWh gas RegionCT kWh gas gas kWhRegion
CTWhse
CT
Sub CkWh
Sub AkWh
AdminSub DkWh
Sub BkWh
gas bat chgCT kWh
Boston Region & PDCGID 603
New York Region &PDC
GID 506
CATGID 608
Cincinatti Region &PDC
GID 625
kWh gas kWh gas gas kWh kWh Web Based System
kWh gas kWh kWh
kWh kWh gas kWh kWhGS
kWhSH kWh gas
kWhkWh CTkWhkWhTLS Princeton
off site RailGID 601
kWh RegionCT B
RegionCT A gas
TLS FremontPPO Shop
GID 607
TLS Fremont Rail
GID 604
Long BeachBldg B.GID 465
LongBeachPASHAGID 627
gas chillergas
AdminCT kWh
NAPCCGID 642
San Ramon Region & PDCGID 479
Lexus EasternGID 726
ChicagoRegionGID 586
WhsekWh
RegionkWh
TrngkWh gas
Kansas City Region & PDCGID 623
Sub ACT
Sub BCT
TTC AdminGID 619
H2CT kWh
MDCGID 616
gas kWh
AirFliteMain Hanger
GID 621
kWh
AirFliteOfficesGID 622
kWh gas
Portland PDCGID 746
kWh
Denver RegionGID 637
gas
Chicago PDCGID 599
g g
TLS GeorgetownMegaplexGID 592
TLS GeorgetownPPO Shop
GID 529
gas kWh
TLS PrincetonPPO Shop
GID 639
kWh
TLS PrincetonBody Shop
GID 638
kWh
LexusSouthernGID 602
kWh
TTC EvalGID 617
NAPCKGID 600
LA RegionGID 633
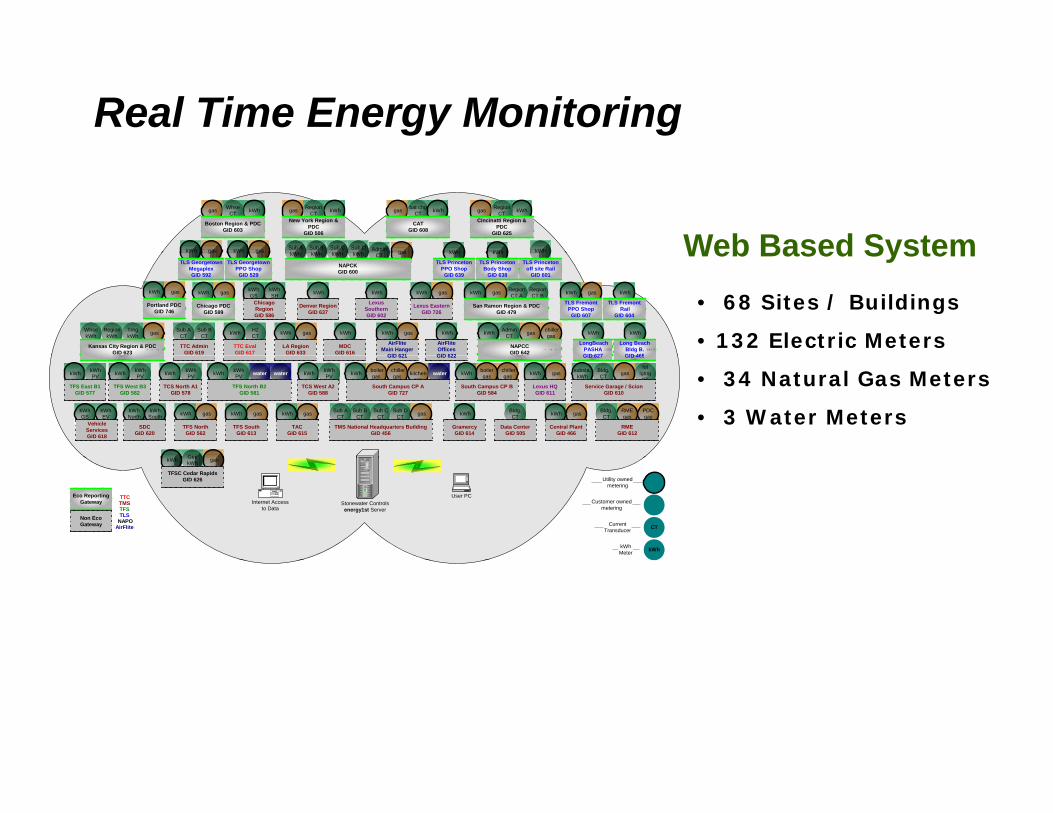
• 68 Sites / Buildings
• 132 Electric Meters
Web Based System
Cloud
Bldg.CT
PDCgas
RMEgas
Bldg.CT
GID 465GID 627
Bldg.CT
lotlgtngCT
kWh boilergas
chillergas kWh gas
kWh
substa.kWh
gas
gas
Data CenterGID 505
Central PlantGID 466
RMEGID 612
Service Garage / ScionGID 610
Lexus HQGID 611
South Campus CP BGID 584
kWhGS
kWhEV
VehicleServicesGID 618
kWhSouth
kWhNorth
SDCGID 620
gas kWh
TFS NorthGID 562
gas kWh
TFS SouthGID 613
kWh Gen
gas kWh
TACGID 615
Sub CCT
Sub BCT
Sub DCT
Sub ACT gas
TMS National Headquarters BuildingGID 456
kWh
GramercyGID 614
kWh kWhPV
TFS East B1GID 577
kWh kWhPV
TFS West B3GID 582
kWh kWhPV
TCS North A1GID 578
water water kWh kWhPV
TFS North B2GID 581
kWh kWhPV
TCS West A2GID 588
boilergas
chillergas kitchen
gas water kWh
South Campus CP AGID 727
GID 621 GID 622
• 34 Natural Gas Meters
• 3 Water Meters
Internet Accessto Data
User PCTTCTMSTFSTLS
NAPOAirFlite
Eco ReportingGateway
Non EcoGateway
Utility ownedmetering
Customer ownedmetering
CT
kWh
CurrentTransducer
kWhMeter
kWh gasGenkWh
TFSC Cedar RapidsGID 626
Stonewater Controlsenergy1st Server
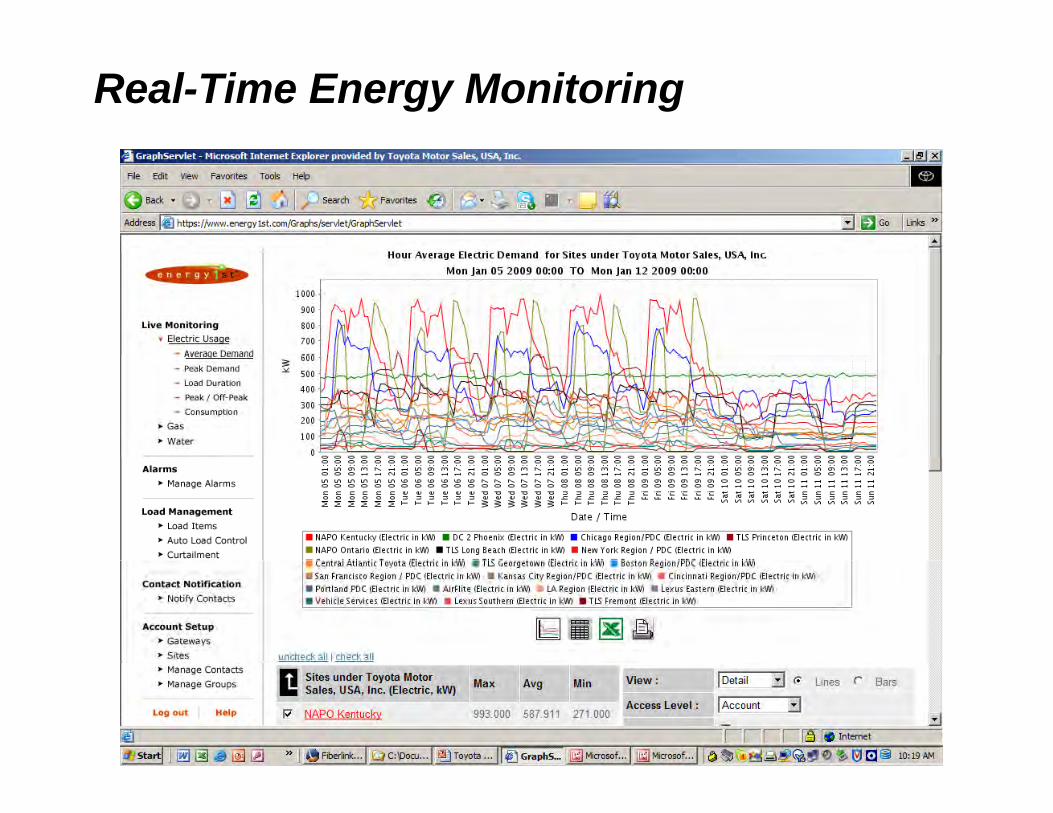
Real-Time Energy Monitoring
Wh t d l k f ?
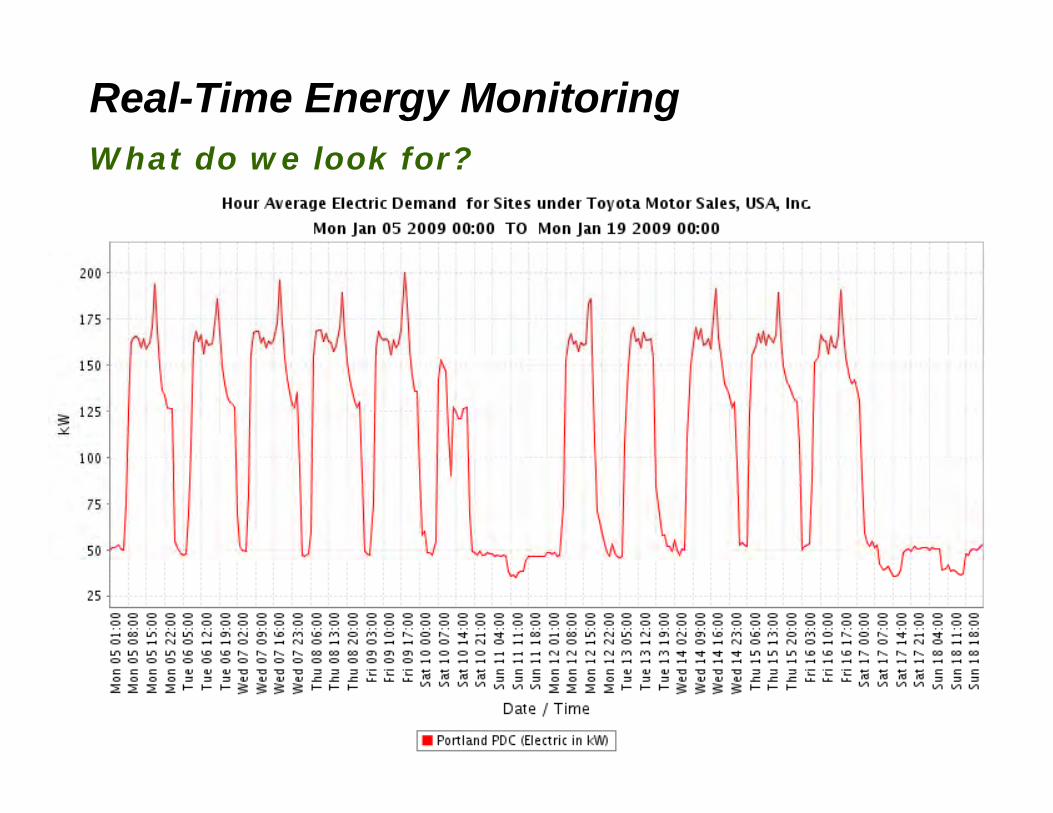
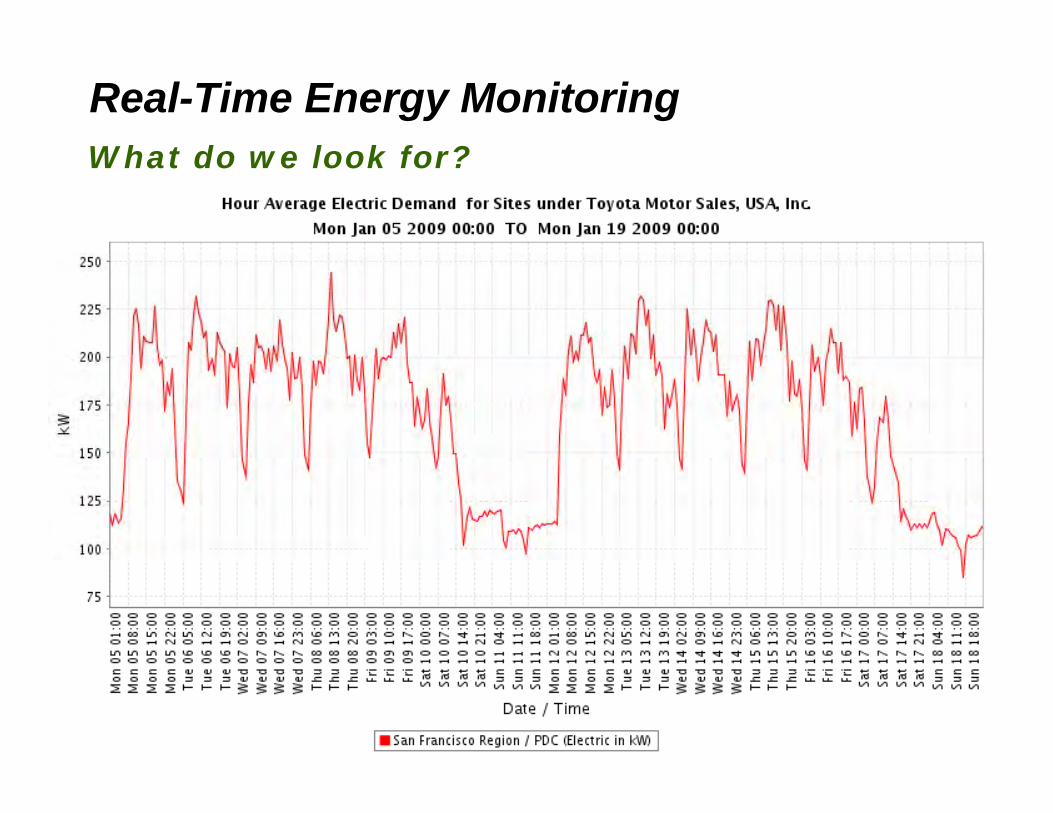
Real-Time Energy MonitoringWhat do we look for?
T ki l l k
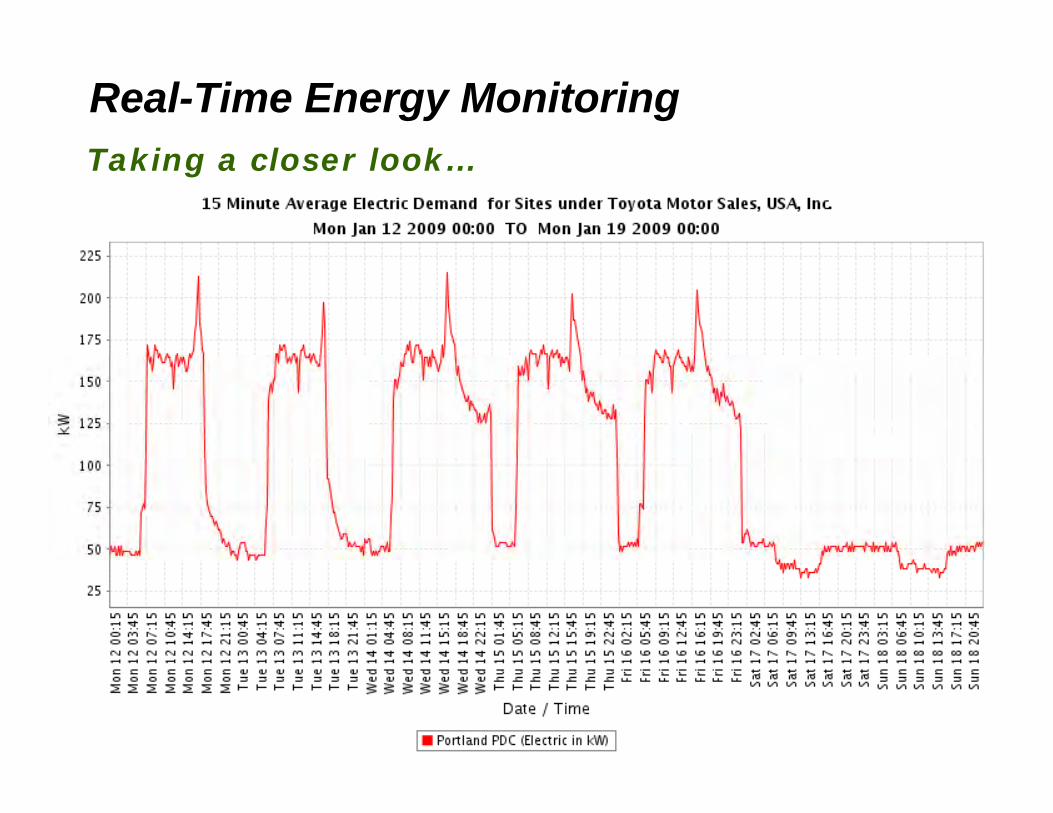
Real-Time Energy MonitoringTaking a closer look…
What do e look fo ?
Real-Time Energy MonitoringWhat do we look for?
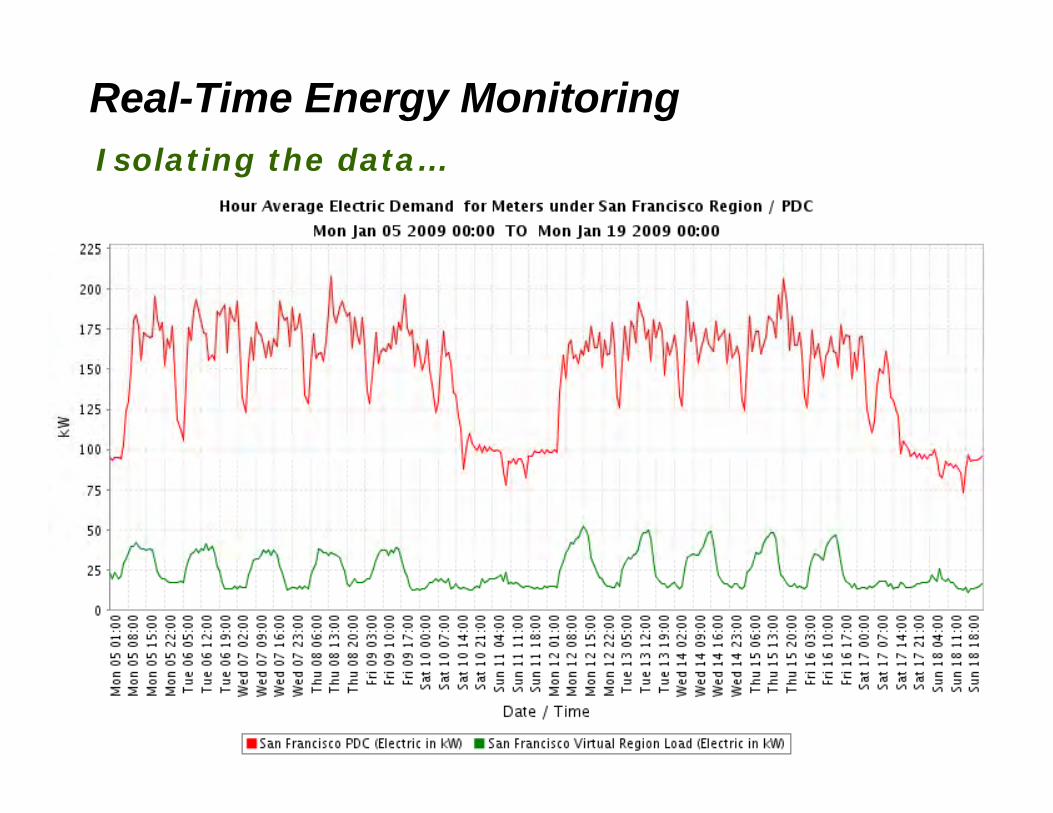
I l ti th d t
Real-Time Energy MonitoringIsolating the data…
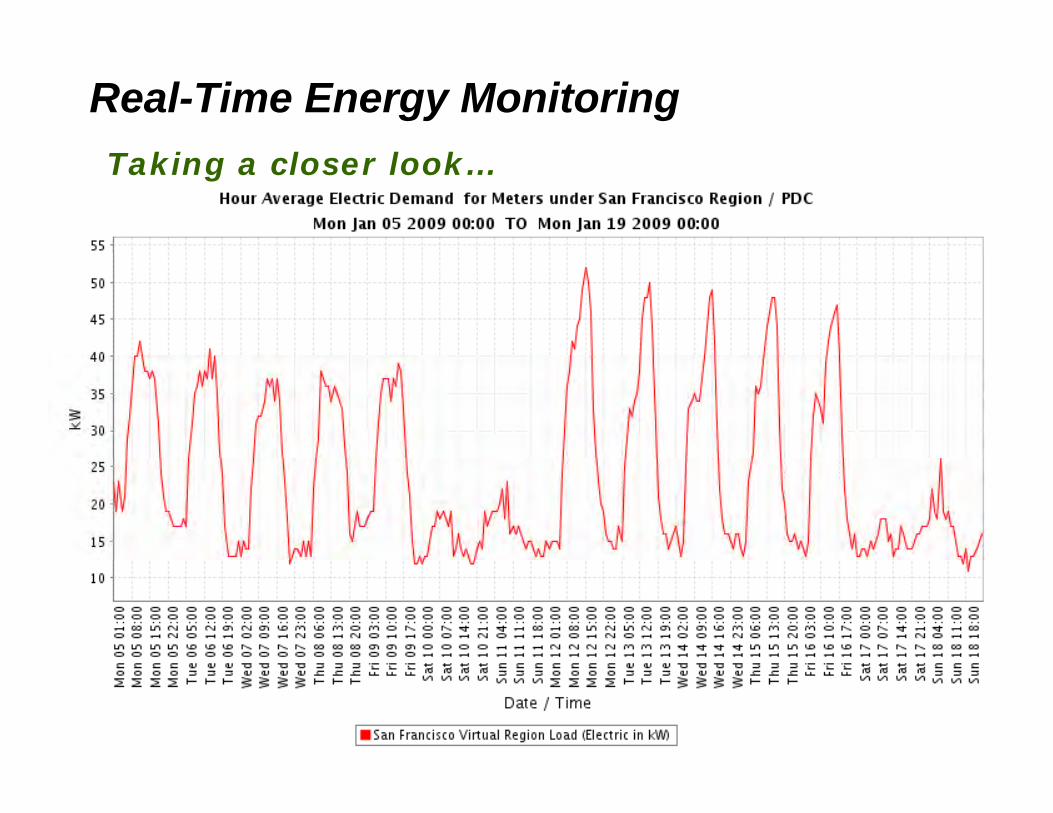
Real-Time Energy MonitoringTaking a closer look…
I t f th
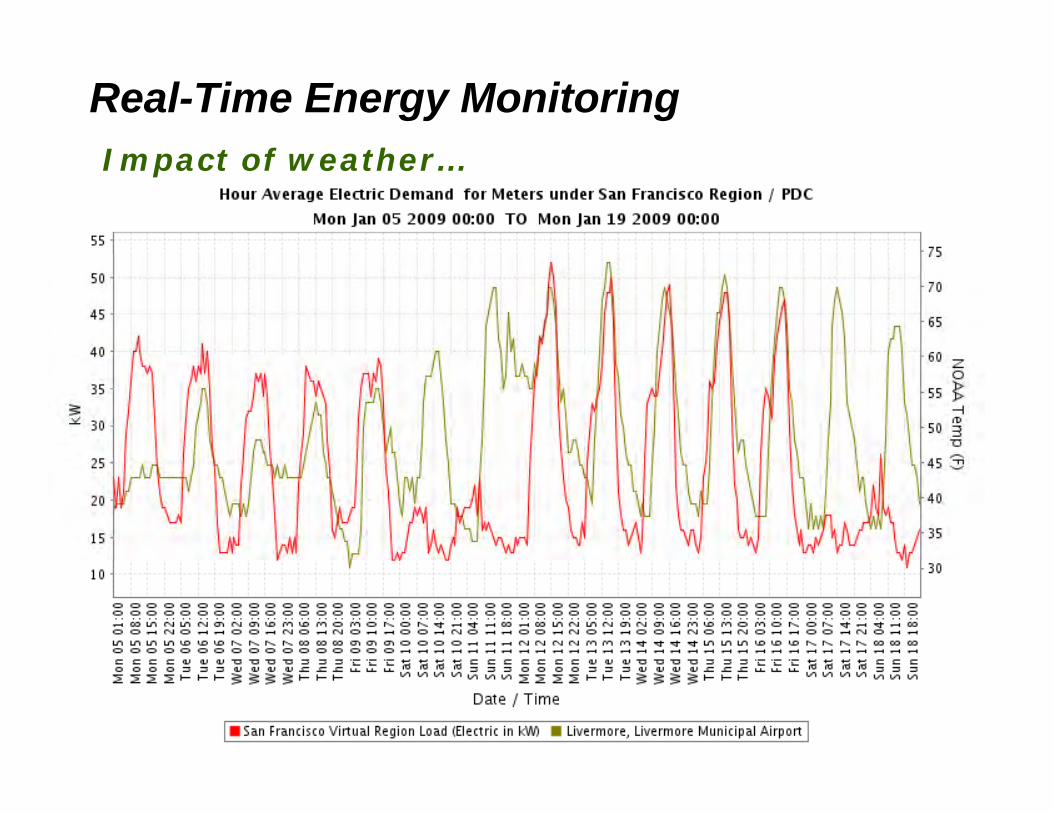
Real-Time Energy MonitoringImpact of weather…
Real-Time Energy Monitoring
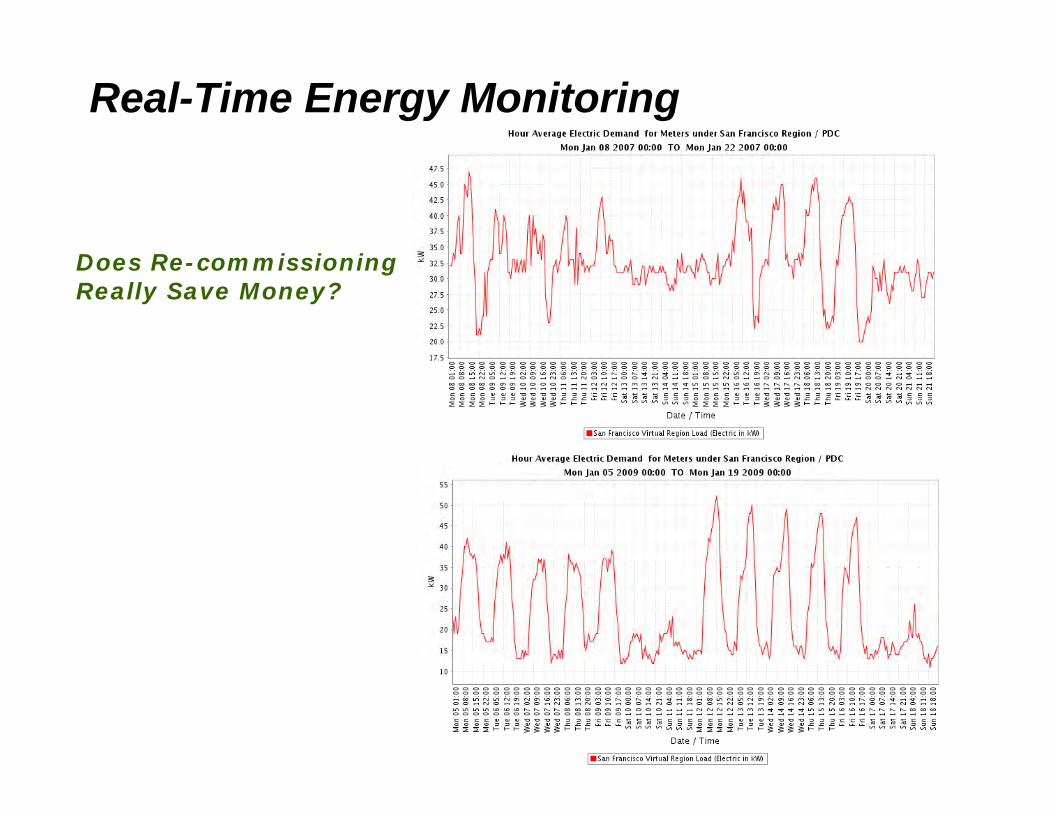
i i iDoes Re-commissioning Really Save Money?
Real-Time Energy Monitoring
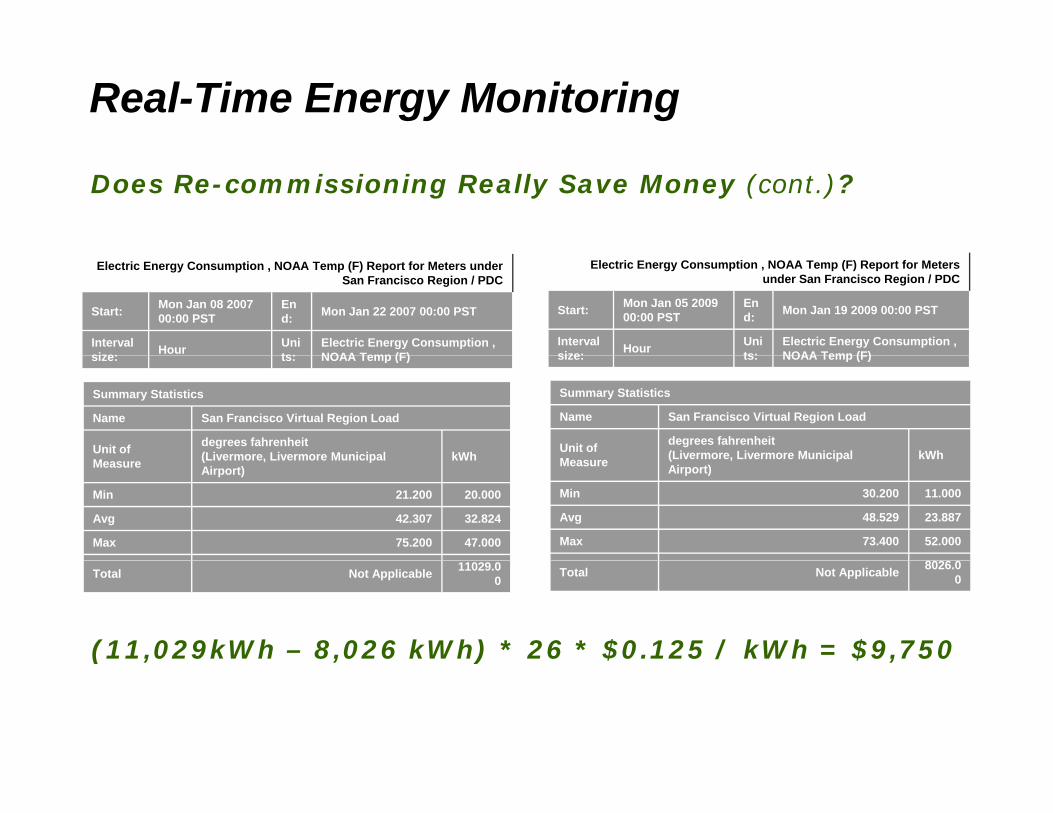
Does Re-commissioning Really Save Money (cont.)?
Electric Energy Consumption , NOAA Temp (F) Report for Meters under San Francisco Region / PDC
Start: Mon Jan 05 2009 00:00 PST
End: Mon Jan 19 2009 00:00 PST
Interval size: Hour Uni
ts:Electric Energy Consumption , NOAA Temp (F)
Electric Energy Consumption , NOAA Temp (F) Report for Meters under San Francisco Region / PDC
Start: Mon Jan 08 2007 00:00 PST
End: Mon Jan 22 2007 00:00 PST
Interval size: Hour Uni
ts:Electric Energy Consumption , NOAA Temp (F) size: ts: NOAA Temp (F)
Summary Statistics
Name San Francisco Virtual Region Load
Unit of M
degrees fahrenheit(Livermore, Livermore Municipal kWh
size: ts: NOAA Temp (F)
Summary Statistics
Name San Francisco Virtual Region Load
Unit of degrees fahrenheit(Livermore Livermore Municipal kWh Measure (Livermore, Livermore Municipal
Airport)kWh
Min 30.200 11.000
Avg 48.529 23.887
Max 73.400 52.000
Measure (Livermore, Livermore Municipal Airport)
kWh
Min 21.200 20.000
Avg 42.307 32.824
Max 75.200 47.000
Total Not Applicable 8026.00Total Not Applicable 11029.0
0
(11,029kWh – 8,026 kWh) * 26 * $0.125 / kWh = $9,750( , , ) $ $ ,
Corporate Energy Program Overview
• Utility Invoice Tracking• Utility Invoice Tracking• Real Time Energy Monitoring• Treasure Hunts• Building Automation Systems• Energy Projects
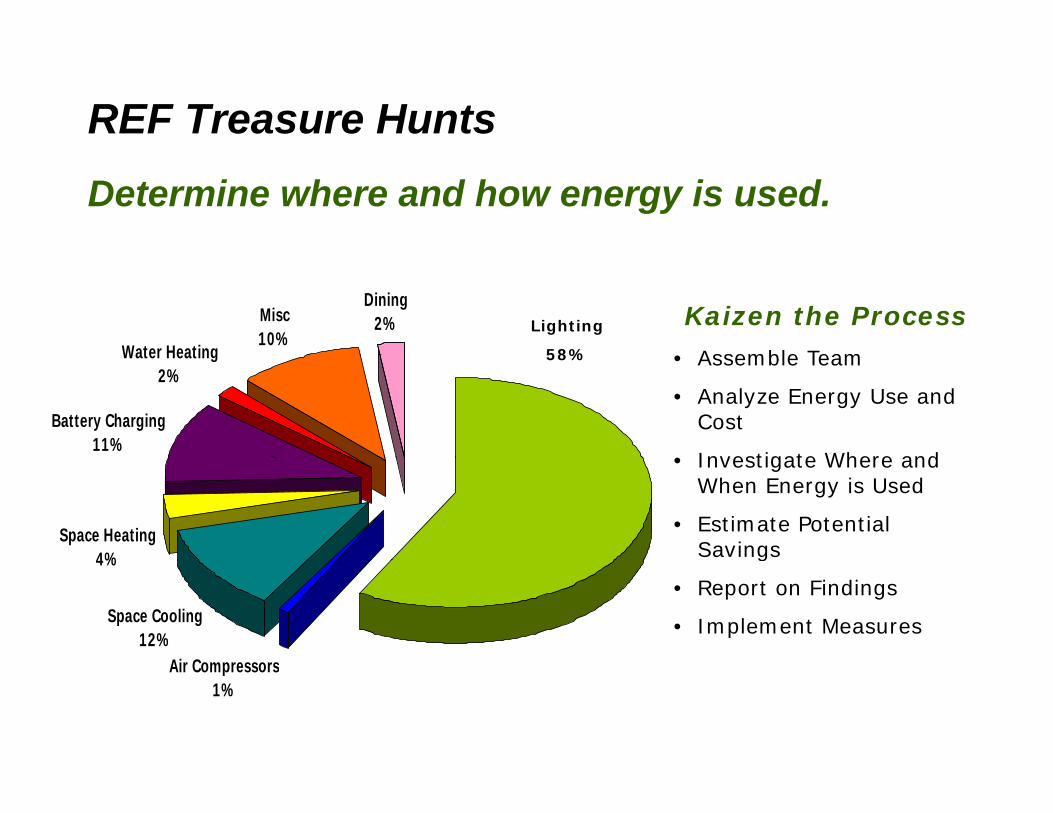
REF Treasure HuntsDetermine where and how energy is used.
Water Heating
Misc10%
Dining2%
• Assemble Team
Kaizen the ProcessLighting
58%
Battery Charging11%
Water Heating2%
• Assemble Team
• Analyze Energy Use and Cost
• Investigate Where and
58%
Space Heating4%
• Investigate Where and When Energy is Used
• Estimate Potential Savings
Air Compressors
Space Cooling12%
4% g
• Report on Findings
• Implement Measures
Air Compressors1%
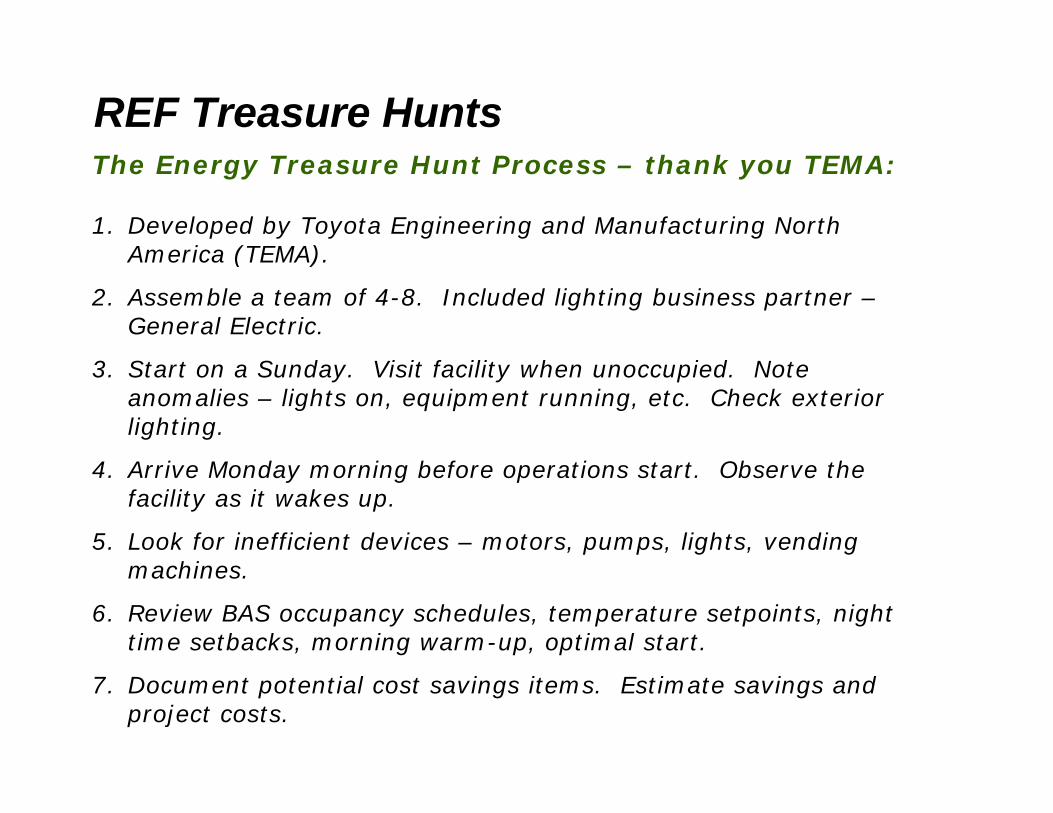
REF Treasure HuntsThe Energy Treasure Hunt Process – thank you TEMA:
1. Developed by Toyota Engineering and Manufacturing North America (TEMA)America (TEMA).
2. Assemble a team of 4-8. Included lighting business partner –General Electric.
3. Start on a Sunday. Visit facility when unoccupied. Note anomalies – lights on, equipment running, etc. Check exterior lighting.
4. Arrive Monday morning before operations start. Observe the facility as it wakes up.
5. Look for inefficient devices – motors, pumps, lights, vending hmachines.
6. Review BAS occupancy schedules, temperature setpoints, night time setbacks, morning warm-up, optimal start.
7. Document potential cost savings items. Estimate savings and project costs.
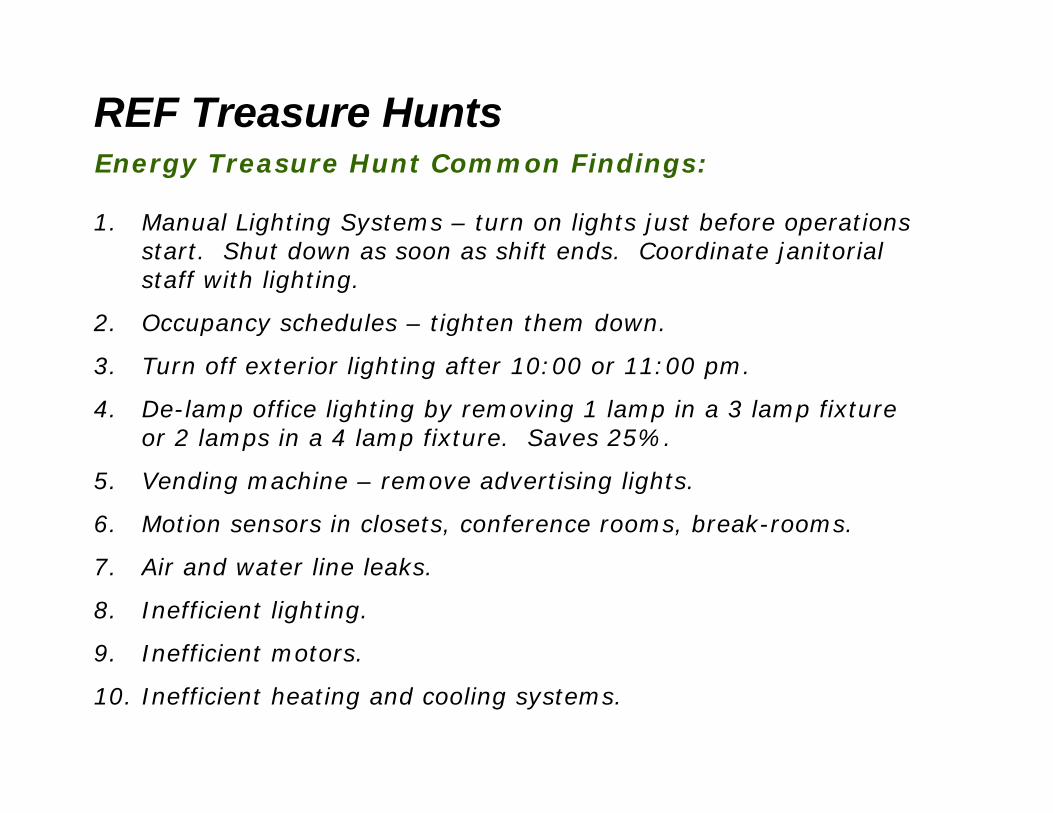
REF Treasure HuntsEnergy Treasure Hunt Common Findings:
1. Manual Lighting Systems – turn on lights just before operations start Shut down as soon as shift ends Coordinate janitorial start. Shut down as soon as shift ends. Coordinate janitorial staff with lighting.
2. Occupancy schedules – tighten them down.
3. Turn off exterior lighting after 10:00 or 11:00 pm.
4. De-lamp office lighting by removing 1 lamp in a 3 lamp fixture or 2 lamps in a 4 lamp fixture. Saves 25%.
5. Vending machine – remove advertising lights.
6. Motion sensors in closets, conference rooms, break-rooms.
7 Ai d t li l k7. Air and water line leaks.
8. Inefficient lighting.
9. Inefficient motors.
10. Inefficient heating and cooling systems.
Corporate Energy Program Overview
• Utility Invoice Tracking• Utility Invoice Tracking• Real Time Energy Monitoring• Treasure Hunts• Building Automation Systems• Energy Projects
Building Automation Systems
TMS utilizes Building Automation Systems (BAS) to implement energy savings initiatives.
• If you don’t have BAS or Lighting Control Systems you are limited on opportunities to Systems, you are limited on opportunities to reduce energy consumption.
• If you have facilities that are located in several geographical areas and you have minimal expertise available: standardize standardize expertise available: standardize, standardize, standardize.
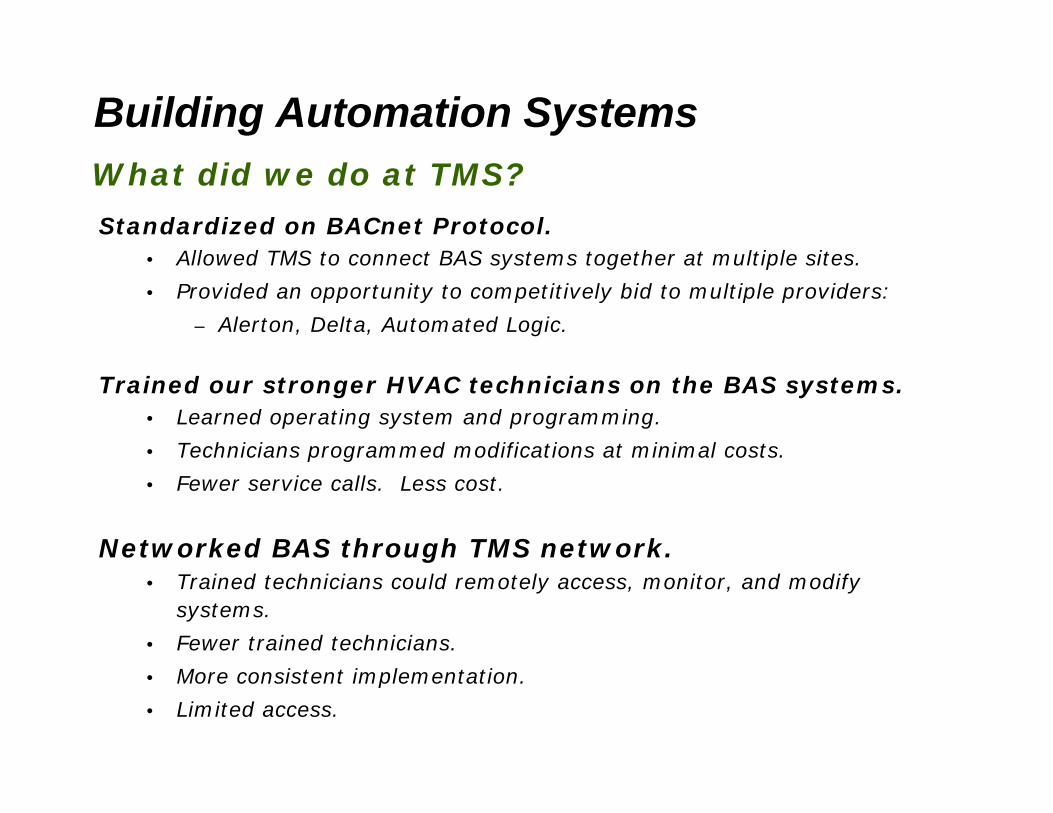
Building Automation Systems
Standardized on BACnet Protocol.All d TMS t t BAS t t th t lti l it
What did we do at TMS?
• Allowed TMS to connect BAS systems together at multiple sites.
• Provided an opportunity to competitively bid to multiple providers:
– Alerton, Delta, Automated Logic.
Trained our stronger HVAC technicians on the BAS systems.• Learned operating system and programming.
• Technicians programmed modifications at minimal costs.p g
• Fewer service calls. Less cost.
Networked BAS through TMS network.g• Trained technicians could remotely access, monitor, and modify
systems.
• Fewer trained technicians.
• More consistent implementation.
• Limited access.
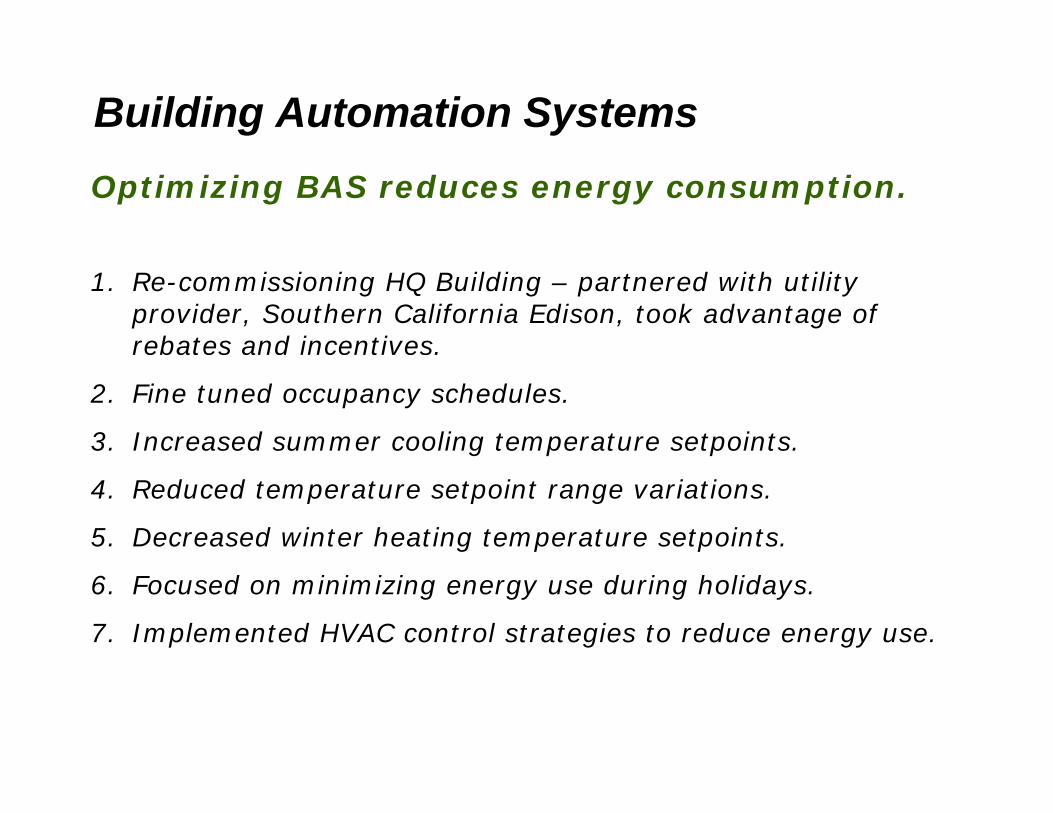
Building Automation SystemsOptimizing BAS reduces energy consumption.
1. Re-commissioning HQ Building – partnered with utility provider, Southern California Edison, took advantage of rebates and incentives.
2. Fine tuned occupancy schedules.
3. Increased summer cooling temperature setpoints.
4. Reduced temperature setpoint range variations.
5. Decreased winter heating temperature setpoints.
6. Focused on minimizing energy use during holidays.
7. Implemented HVAC control strategies to reduce energy use.
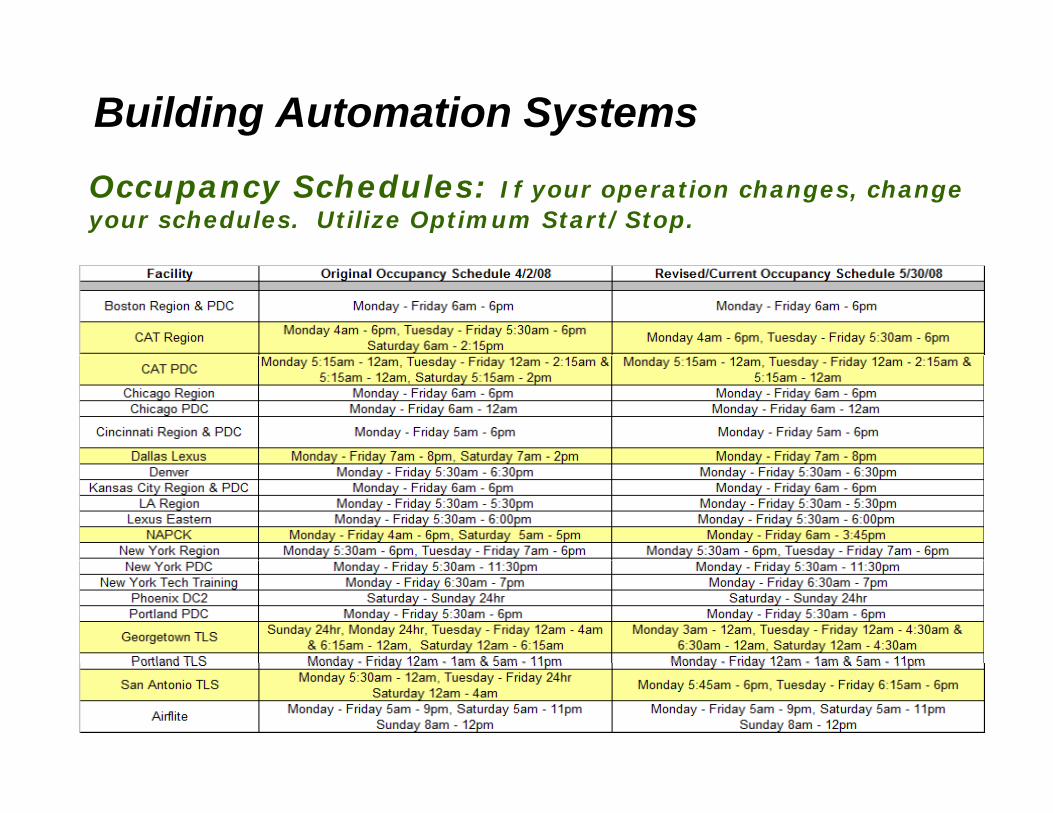
Building Automation SystemsOccupancy Schedules: If your operation changes, change your schedules. Utilize Optimum Start/Stop.
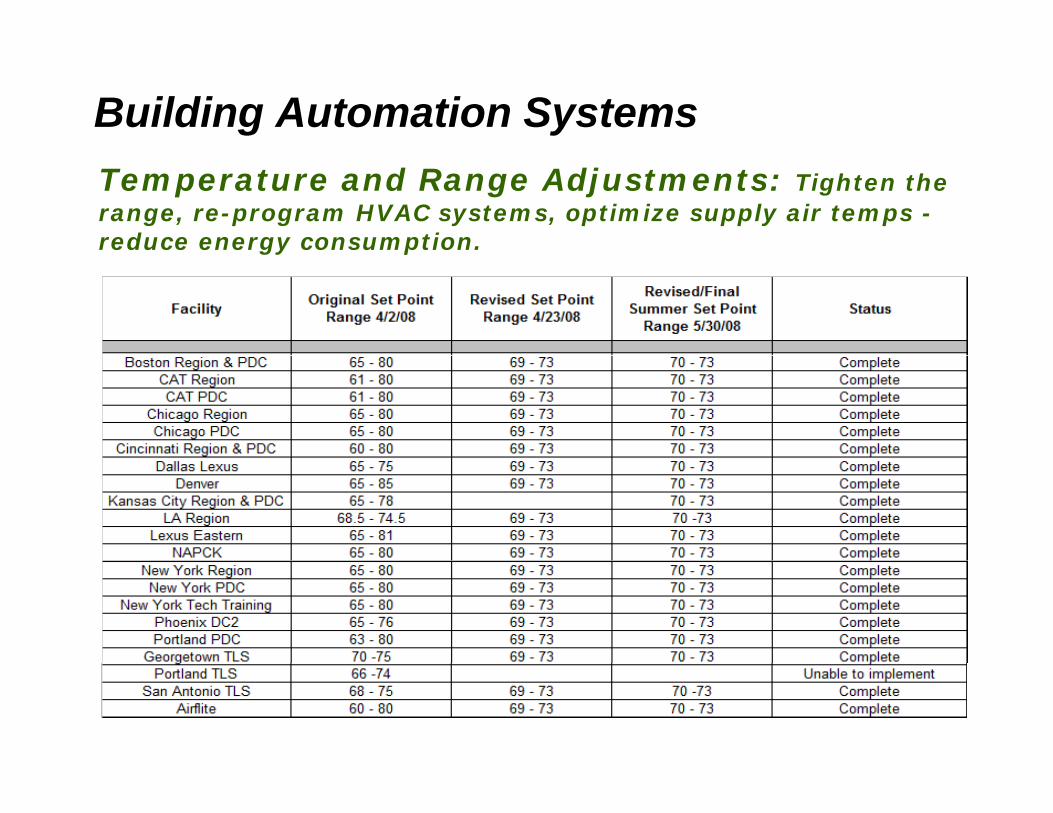
Building Automation SystemsTemperature and Range Adjustments: Tighten the range, re-program HVAC systems, optimize supply air temps -reduce energy consumption.gy p
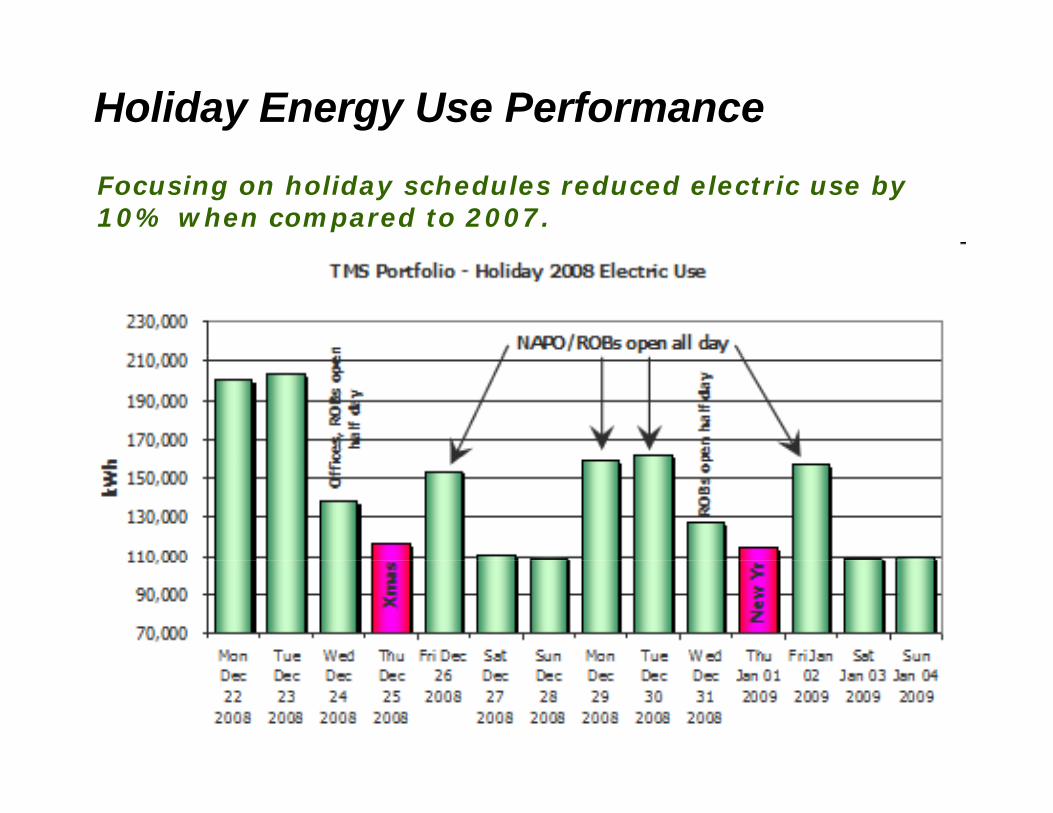
Holiday Energy Use PerformanceFocusing on holiday schedules reduced electric use by 10% when compared to 2007.
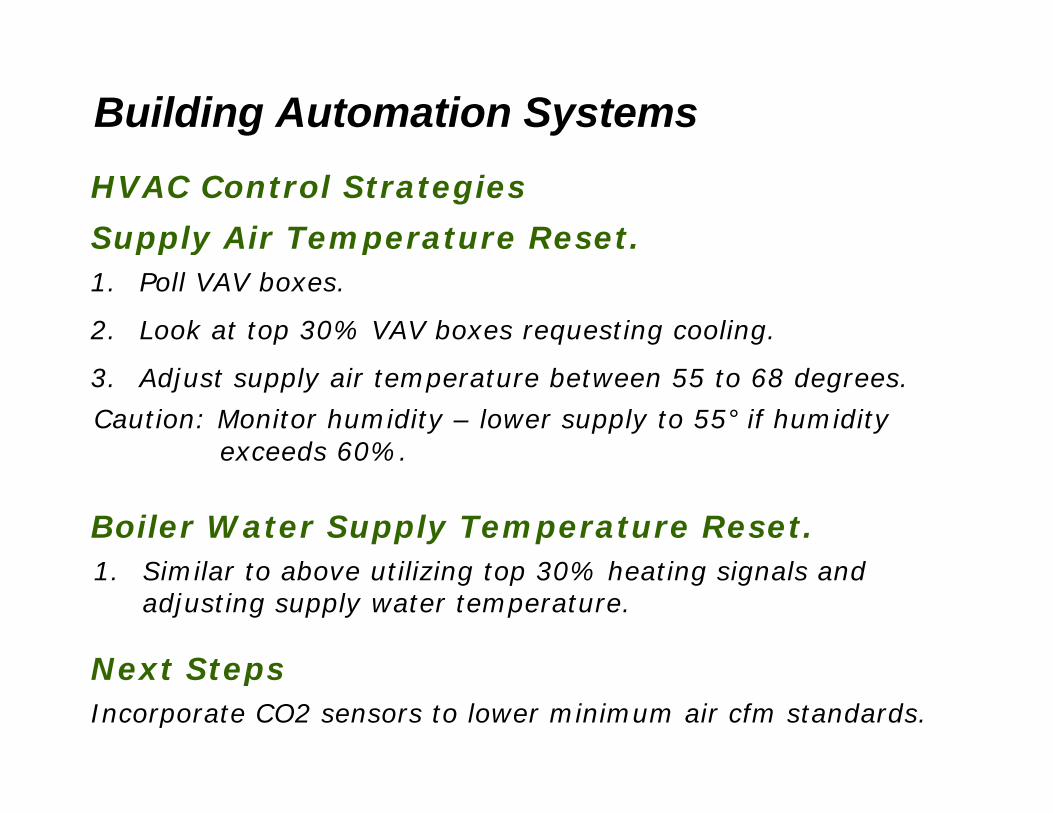
Building Automation SystemsHVAC Control Strategies
Supply Air Temperature Reset.1. Poll VAV boxes.
2. Look at top 30% VAV boxes requesting cooling.
pp y p
3. Adjust supply air temperature between 55 to 68 degrees.
Caution: Monitor humidity – lower supply to 55° if humidity exceeds 60%.exceeds 60%.
Boiler Water Supply Temperature Reset.l b l 3 h l d
Next Steps
1. Similar to above utilizing top 30% heating signals and adjusting supply water temperature.
Next StepsIncorporate CO2 sensors to lower minimum air cfm standards.
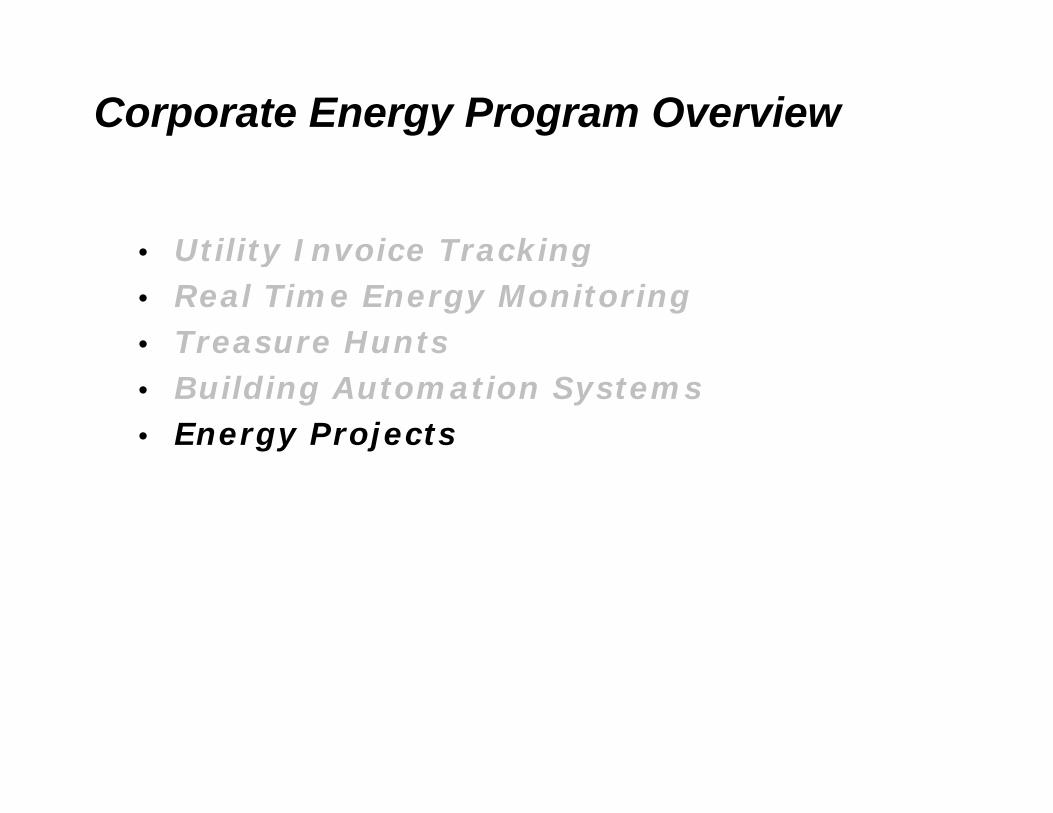
Corporate Energy Program Overview
• Utility Invoice Tracking• Utility Invoice Tracking• Real Time Energy Monitoring• Treasure Hunts• Building Automation Systems• Energy Projects
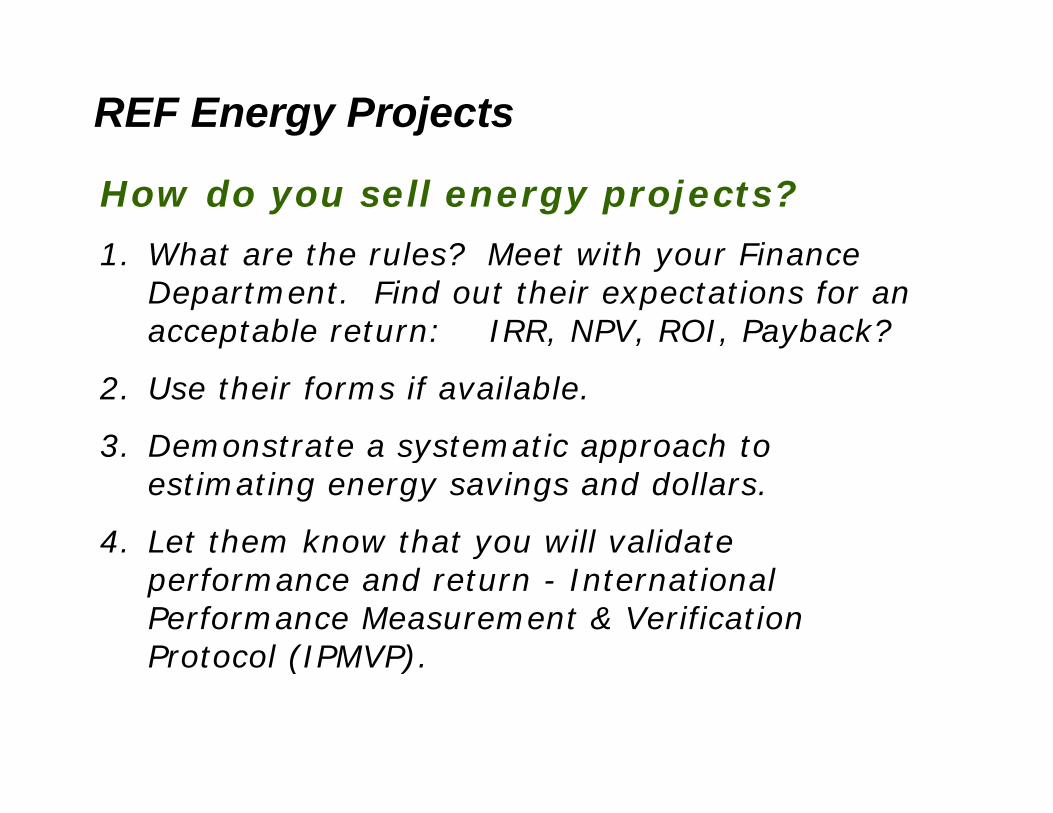
REF Energy Projects
How do you sell energy projects?
1 What are the rules? Meet with your Finance 1. What are the rules? Meet with your Finance Department. Find out their expectations for an acceptable return: IRR, NPV, ROI, Payback?
2. Use their forms if available.
3. Demonstrate a systematic approach to y ppestimating energy savings and dollars.
4. Let them know that you will validate performance and return - International Performance Measurement & Verification Protocol (IPMVP).Protocol (IPMVP).
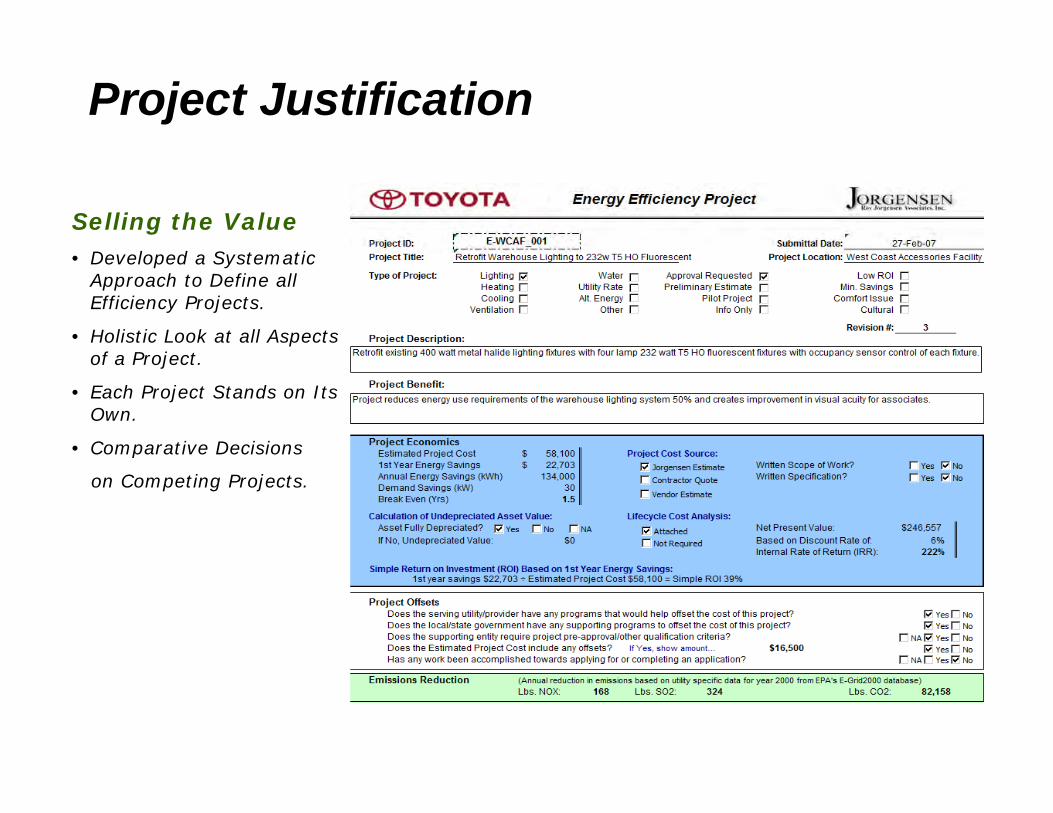
Project Justification
Selling the ValueD l d S t ti • Developed a Systematic Approach to Define all Efficiency Projects.
• Holistic Look at all Aspects of a Projectof a Project.
• Each Project Stands on Its Own.
• Comparative Decisions
on Competing Projects.
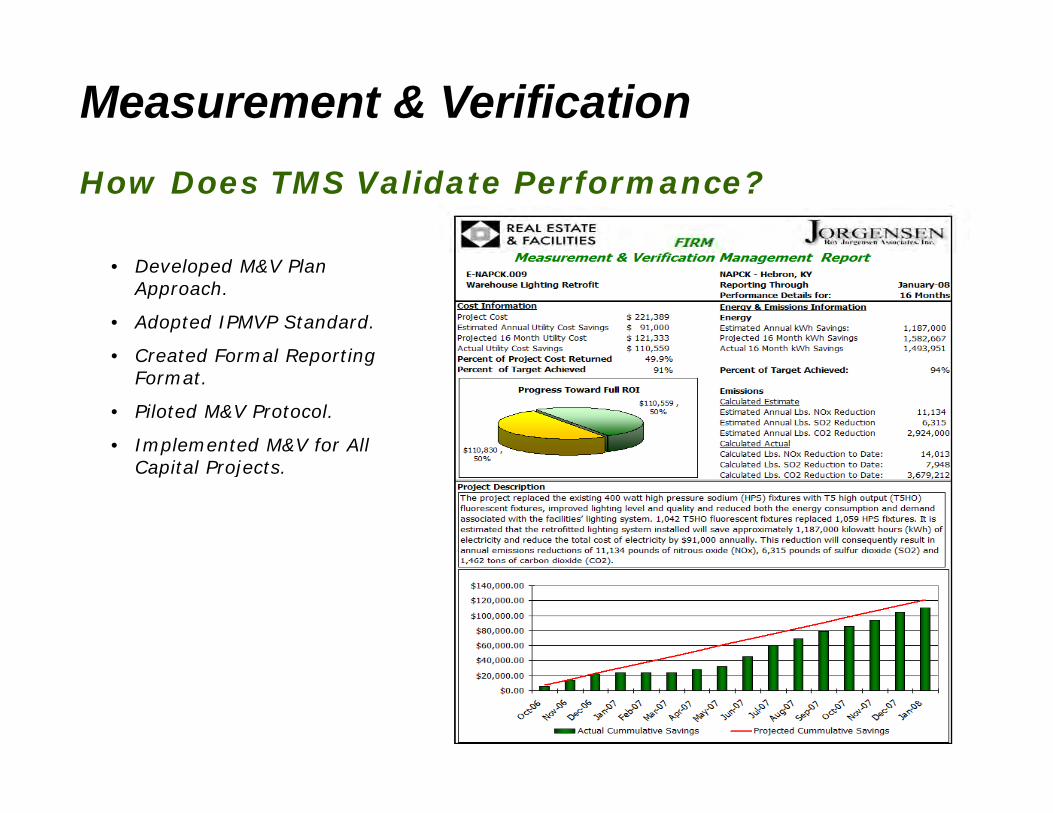
Measurement & VerificationHow Does TMS Validate Performance?
• Developed M&V Plan Approach.
• Adopted IPMVP Standard.
• Created Formal Reporting • Created Formal Reporting Format.
• Piloted M&V Protocol.
• Implemented M&V for All Capital Projects.
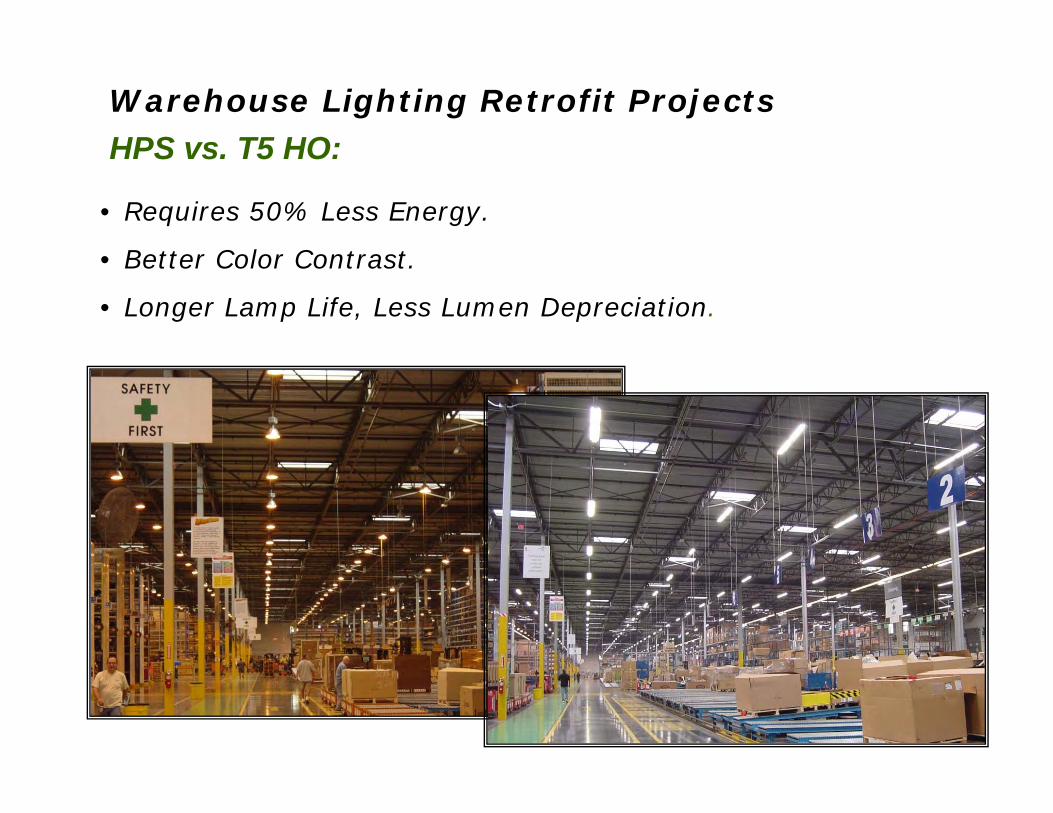
Warehouse Lighting Retrofit ProjectsHPS vs T5 HO:
• Requires 50% Less Energy.
B tt C l C t t
HPS vs. T5 HO:
• Better Color Contrast.
• Longer Lamp Life, Less Lumen Depreciation.
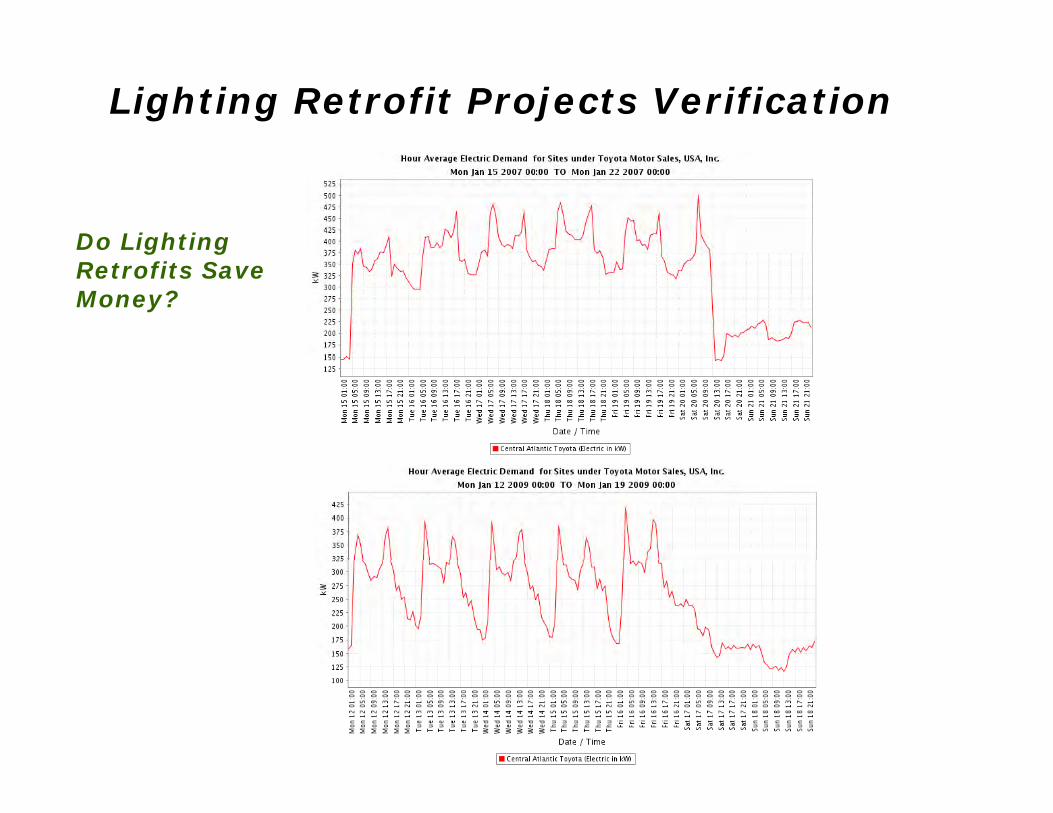
Lighting Retrofit Projects Verification
Do Lighting g gRetrofits Save Money?

Lighting Retrofit Projects Verification
Do Lighting Retrofits Save Money (cont.) ?
Electric Energy Consumption , NOAA Temp (F) Report for Sites under Toyota Motor Sales, USA, Inc.
Start: Mon Jan 12 2009 00:00 EST
End: Mon Jan 19 2009 00:00 EST
Interval size: Hour Uni
ts:Electric Energy Consumption , NOAA Temp (F)
Electric Energy Consumption , NOAA Temp (F) Report for Sites under Toyota Motor Sales, USA, Inc.
Start: Mon Jan 15 2007 00:00 EST
End: Mon Jan 22 2007 00:00 EST
Interval Hour Uni Electric Energy Consumption , size: ts: NOAA Temp (F)
Summary Statistics
size: Hour ts: gy p
NOAA Temp (F)
Summary Statistics
Name Central Atlantic Toyota
Unit of Measure
degrees fahrenheit(Baltimore, Baltimore-Washington International Airport)
kWh
Min 1.400 117.000
Name Central Atlantic Toyota
Unit of Measure
degrees fahrenheit(Baltimore, Baltimore-Washington International Airport)
kWh
Min 19.400 142.920
Avg 23.450 250.419
Max 39.200 418.140
Total Not Applicable 42070.32
Avg 36.211 336.711
Max 66.200 499.680
Total Not Applicable 56567.52
(56,567 – 42,027 kWh) * 52 * $0.158 / kWh = $119,000
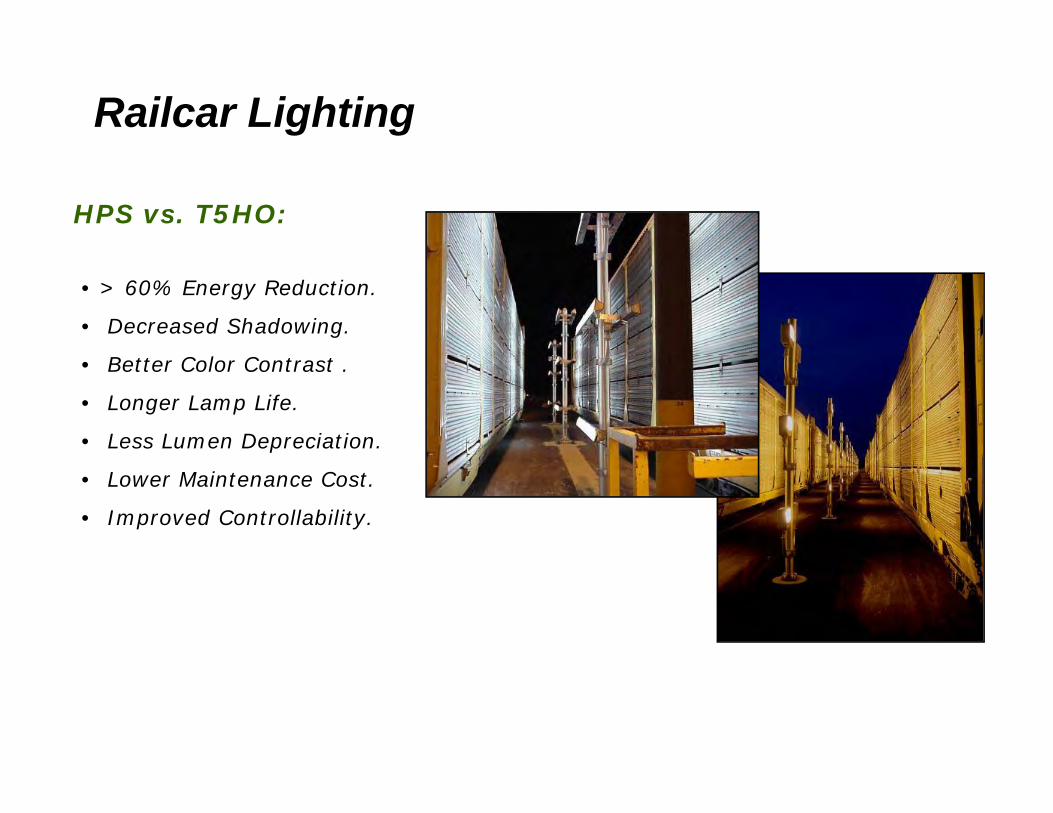
Railcar Lighting
HPS vs. T5HO:
• > 60% Energy Reduction.
• Decreased Shadowing.
• Better Color Contrast .
• Longer Lamp Life.
• Less Lumen Depreciation.
• Lower Maintenance Cost.
• Improved Controllability.
NAPCC P P h A t (PPA)
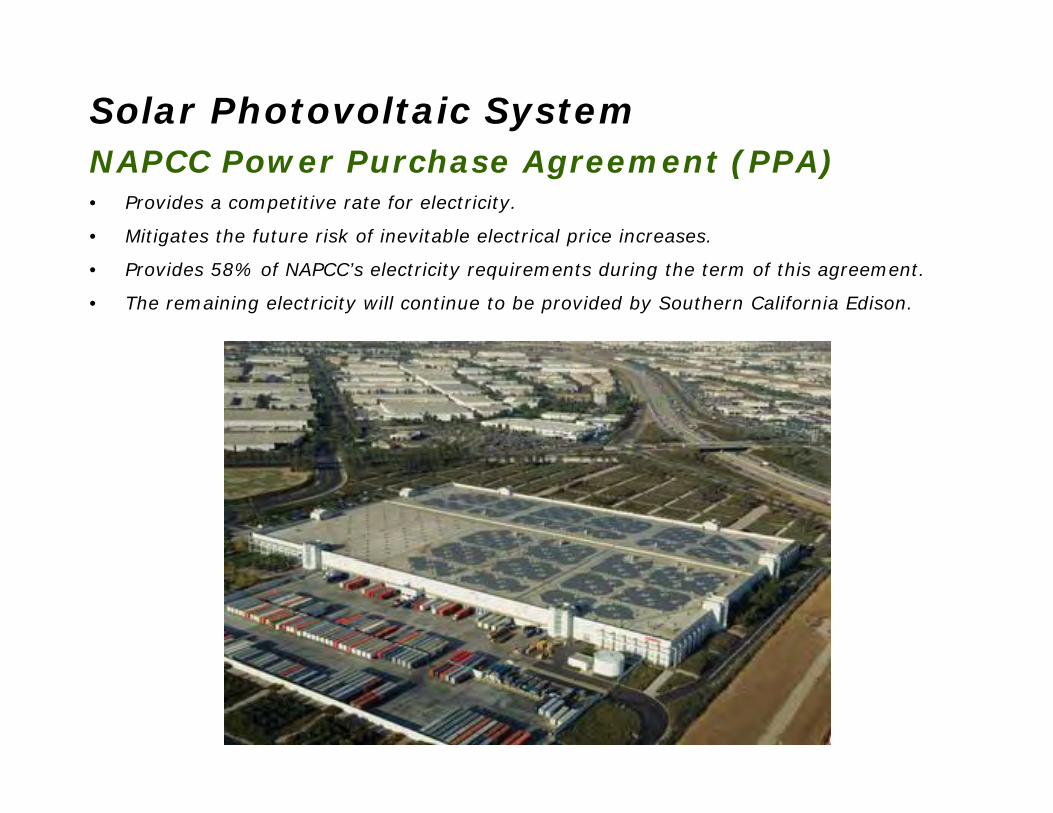
Solar Photovoltaic SystemNAPCC Power Purchase Agreement (PPA) • Provides a competitive rate for electricity.
• Mitigates the future risk of inevitable electrical price increases.
• Provides 58% of NAPCC’s electricity requirements during the term of this agreement.
• The remaining electricity will continue to be provided by Southern California Edison.
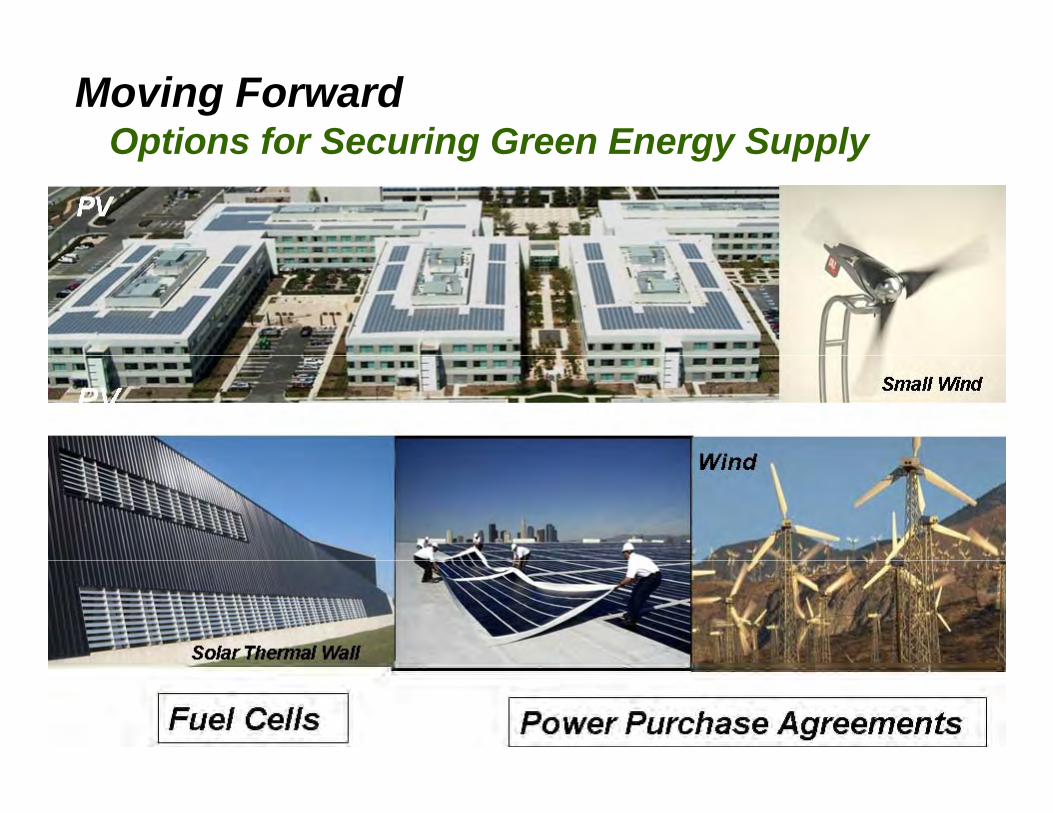
Moving ForwardOptions for Securing Green Energy SupplyOptions for Securing Green Energy Supply
PVPV

Toyota Motor Sales, U.S.A., Inc. Energy Management Program
Questions/Contact Information
Timothy J. Frank, P.E.Field Operations ManagerToyota Motor Sales, U.S.A., Inc.y(330) [email protected]