Toyota Motor HOLD - Jefferies · FY Mar--303.80--578.80--574.10--596.50 Price Performance ......
26
JPY Prev. 2012A Prev. 2013E Prev. 2014E Prev. 2015E Rev. (B) -- 22,064.2 -- 25,281.4 -- 26,299.5 -- 27,585.8 Chg (% YoY) -- 18.7% -- 14.6% -- 4.0% -- 4.9% Operating Profit (B) -- 1,320.9 -- 2,450.0 -- 2,510.0 -- 2,590.0 Chg (% YoY) -- 271.4% -- 85.5% -- 2.4% -- 3.2% OP Margin -- 6.0% -- 9.7% -- 9.5% -- 9.4% Net Profit (B) -- 962.2 -- 1,833.0 -- 1,818.0 -- 1,889.0 Chg (% YoY) -- 239.3% -- 90.5% -- (0.8)% -- 3.9% DPS -- 90.00 -- 170.00 -- 170.00 -- 180.00 EPS FY Mar -- 303.80 -- 578.80 -- 574.10 -- 596.50 Price Performance NOV-12 MAR-13 JUL-13 NOV-13 7,000 6,000 5,000 4,000 3,000 COMPANY NOTE Initiating Coverage JPN | Industrials | Autos & Auto Parts 21 November 2013 Toyota Motor (7203 JP) Initiate at Hold: No Sustained Success on Old Template EQUITY RESEARCH JAPAN HOLD Price target ¥6,700 Price ¥6,290 Price target $135.75 Price $126.05 Bloomberg TSE: 7203 JP Bloomberg NYSE: TM Financial Summary Book Value (MM): ¥12,772,856.0 Book Value/Share: ¥3,835 Net Debt (MM): (¥4,599.4)BN Return on Avg. Equity: 7.2% Net Debt/Capital: (37.9)% Market Data 52 Week Range: ¥6,800 - ¥3,350 Total Entprs. Value (MM): ¥17,088.5BN Market Cap. (MM): ¥21,687.9BN Shares Out. (MM): 3,448.0 Float (MM): 2,686.9 Avg. Daily Vol.: 8,401,656 Takaki Nakanishi * Equity Analyst [email protected] * Jefferies (Japan) Limited Key Takeaway Financial or operating leverage? Toyota offers relatively little appeal medium- term either way. Consensus has been very bullish, but a turning point is coming, and there is limited appeal in investment on a 12-month time frame unless Toyota starts emphasizing higher shareholder return and financial leverage. We initiate coverage with a Hold rating. We think the yen will have to weaken a notch further for the share price to continue to perform strongly. Investment thesis: Key arguments in our Hold rating are as follows: (1) three-year operating profit CAGR of 4% in FY3/15–FY3/17 looks mediocre, well below the sector average of 7%; (2) Toyota is unlikely to lift its 30% benchmark payout ratio anytime soon, so expectations of higher dividends are overblown, creating the risk of disappointment; (3) we take the view that the company’s business reform benefit would not be fully up and running until 2015 or beyond, creating mediocre medium-term product competitiveness, production capacity shortages hampering volume growth, and a cost-push stemming from soaring investments for the future. Price target: We initiate coverage with a Hold rating. Our price target for the coming 12 months is ¥6,700, calculated as a P/E of 12x based on our FY3/15 EPS estimate. This represents a 10% premium to the sector average of around 11x to reflect Toyota's high level of cash on hand and ability to pay out dividends. Earnings forecasts: Assuming ¥100/$, we envisage FY3/14 operating profit of ¥2.45 trillion (company guidance: ¥2.2 trillion), broadly in line with the Bloomberg consensus forecast. On the other hand, in FY3/15 we forecast growth of a mere 2% YoY to ¥2.51 trillion, 5% below consensus. Valuation/Risks Our DCF model using a discount rate of 7.0–7.5% and terminal growth of 0–1% yields a theoretical share price range of some ¥6,000–6,800. Our price target is near the top of this range, but we believe this can be supported by opportunities from the weaker yen and the FY3/14 prospective dividend yield (around 2.7%). Foreseeable risks are changes in operating profit of just over 2% for a 1% move in forex, and just under 2% for a 1% variation in sales volume. Developments with domestic consumption tax and automobile taxes represent major risks for the company. Jefferies does and seeks to do business with companies covered in its research reports. As a result, investors should be aware that Jefferies may have a conflict of interest that could affect the objectivity of this report. Investors should consider this report as only a single factor in making their investment decision. Please see analyst certifications, important disclosure information, and information regarding the status of non-US analysts on pages 23 to 26 of this report.
Transcript of Toyota Motor HOLD - Jefferies · FY Mar--303.80--578.80--574.10--596.50 Price Performance ......

JPY Prev. 2012A Prev. 2013E Prev. 2014E Prev. 2015E
Rev. (B) -- 22,064.2 -- 25,281.4 -- 26,299.5 -- 27,585.8
Chg (% YoY) -- 18.7% -- 14.6% -- 4.0% -- 4.9%
OperatingProfit (B)
-- 1,320.9 -- 2,450.0 -- 2,510.0 -- 2,590.0
Chg (% YoY) -- 271.4% -- 85.5% -- 2.4% -- 3.2%
OP Margin -- 6.0% -- 9.7% -- 9.5% -- 9.4%
Net Profit (B) -- 962.2 -- 1,833.0 -- 1,818.0 -- 1,889.0
Chg (% YoY) -- 239.3% -- 90.5% -- (0.8)% -- 3.9%
DPS -- 90.00 -- 170.00 -- 170.00 -- 180.00
EPS
FY Mar -- 303.80 -- 578.80 -- 574.10 -- 596.50
Price Performance
NOV-12 MAR-13 JUL-13 NOV-13
7,000
6,000
5,000
4,000
3,000
COMPANY NOTE
Initiating Coverage
JPN | Industrials | Autos & Auto Parts 21 November 2013
Toyota Motor (7203 JP)Initiate at Hold: No Sustained Success on OldTemplate
EQU
ITY R
ESEARC
H JA
PAN
HOLDPrice target ¥6,700
Price ¥6,290Price target $135.75
Price $126.05
Bloomberg TSE: 7203 JPBloomberg NYSE: TM
Financial SummaryBook Value (MM): ¥12,772,856.0Book Value/Share: ¥3,835Net Debt (MM): (¥4,599.4)BNReturn on Avg. Equity: 7.2%Net Debt/Capital: (37.9)%
Market Data52 Week Range: ¥6,800 - ¥3,350Total Entprs. Value (MM): ¥17,088.5BNMarket Cap. (MM): ¥21,687.9BNShares Out. (MM): 3,448.0Float (MM): 2,686.9Avg. Daily Vol.: 8,401,656
Takaki Nakanishi *Equity Analyst
* Jefferies (Japan) Limited
Key Takeaway
Financial or operating leverage? Toyota offers relatively little appeal medium-term either way. Consensus has been very bullish, but a turning point is coming,and there is limited appeal in investment on a 12-month time frame unlessToyota starts emphasizing higher shareholder return and financial leverage.We initiate coverage with a Hold rating. We think the yen will have to weakena notch further for the share price to continue to perform strongly.
Investment thesis: Key arguments in our Hold rating are as follows: (1) three-yearoperating profit CAGR of 4% in FY3/15–FY3/17 looks mediocre, well below the sectoraverage of 7%; (2) Toyota is unlikely to lift its 30% benchmark payout ratio anytime soon,so expectations of higher dividends are overblown, creating the risk of disappointment; (3)we take the view that the company’s business reform benefit would not be fully up andrunning until 2015 or beyond, creating mediocre medium-term product competitiveness,production capacity shortages hampering volume growth, and a cost-push stemming fromsoaring investments for the future.
Price target: We initiate coverage with a Hold rating. Our price target for the coming12 months is ¥6,700, calculated as a P/E of 12x based on our FY3/15 EPS estimate. Thisrepresents a 10% premium to the sector average of around 11x to reflect Toyota's high levelof cash on hand and ability to pay out dividends.
Earnings forecasts: Assuming ¥100/$, we envisage FY3/14 operating profit of ¥2.45trillion (company guidance: ¥2.2 trillion), broadly in line with the Bloomberg consensusforecast. On the other hand, in FY3/15 we forecast growth of a mere 2% YoY to ¥2.51 trillion,5% below consensus.
Valuation/Risks
Our DCF model using a discount rate of 7.0–7.5% and terminal growth of 0–1% yields atheoretical share price range of some ¥6,000–6,800. Our price target is near the top of thisrange, but we believe this can be supported by opportunities from the weaker yen and theFY3/14 prospective dividend yield (around 2.7%). Foreseeable risks are changes in operatingprofit of just over 2% for a 1% move in forex, and just under 2% for a 1% variation in salesvolume. Developments with domestic consumption tax and automobile taxes representmajor risks for the company.
Jefferies does and seeks to do business with companies covered in its research reports. As a result, investors should be aware that Jefferies may have aconflict of interest that could affect the objectivity of this report. Investors should consider this report as only a single factor in making their investmentdecision. Please see analyst certifications, important disclosure information, and information regarding the status of non-US analysts on pages 23 to 26of this report.

Band Chart 1-Yr Forward PER
Source: Bloomberg, Jefferies Estimates
Global Auto Sales Units: Regional Mix
Source: Company data
Toyota is the world's leading automaker with a full line of brands, including Toyota, Lexus,
and Scion and subsidiaries Daihatsu and Hino. It had a world top 11% global auto market
share in 2012 and was 3rd in the US. Its strengths include productivity and quality from its
production system. It is a world leader in hybrid technologies. The founding family has a
strong presence in management, President Akio Toyoda is third generation.
The market's current investment opinion
tends to be extremely bullish, and
optimistic earnings forecasts and
expectations for higher dividends are
overblown. There is a strong possibility
that management will be cautious in
quarterly results and FY3/14 guidance, and
we think overoptimistic market
expectations will be marked down. We
expect Toyota to win back market share
only gradually in markets worldwide, and
there is nothing in particular to deliver
strong momentum in sales.
Catalysts
Target Investment Thesis
(1) Three-year operating profit CAGR of 4% in
FY3/15–FY3/17 looks mediocre, well below the
sector average of 7%; (2) Toyota is unlikely to
lift its 30% benchmark payout ratio anytime
soon, so expectations of higher dividends are
overblown, creating the risk of disappointment;
(3) We take the view that the company’s
business reform benefit will not really appear
until 2015 or beyond, creating mediocre
medium-term product competitiveness,
production capacity shortages hampering
volume growth, and a cost-push stemming
from soaring investments for the future.
Upside Scenario
A weaker yen beyond our
100/$ assumption.
An increase in the dividend payout ratio
beyond our 30% estimate, the launch of a
share buyback program.
Higher-than-expected demand growth
and market share.
A bigger decline in product quality costs
than we expect (we currently put these at
2% of sales).
Target price: ¥7,370 based on a 10%
premium to our main valuation scenario.
Downside Scenario
A strong yen beyond our ¥100/$ assumption.
Economic downturn and falling automobile
demand in emerging markets, mainly in Asia.
Delays in scrapping Japanese automobile
acquisition tax, or an increase in automobile
related tax.
Relapsed US product quality problems or lawsuits.
Higher-than-expected upfront investment or
increased overheads, leading to a sharper
downturn in earnings than expected.
Target price: ¥6,030 based on a 10% discount to
our main valuation scenario.
Long Term Analysis
Scenarios
Company Description
THE LO
NG
VIE
W
Peer Group
Toyota Motor (7203 JP)
Hold: ¥6,700 Price Target
Toyota: Trend of Long-term Earnings
Source: Company data and Jefferies Estimates
Group PEs (FY2014E)
Source: Bloomberg, Jefferies Estimates
12M Stock Relative to Topix
Source: Bloomberg
Investment / Price Target
7203 JP
Initiating Coverage
21 November 2013
page 2 of 26 , Equity Analyst, [email protected] Nakanishi
Please see important disclosure information on pages 23 - 26 of this report.

Investment Thesis and Valuation We initiate coverage of Toyota with a Hold rating. Our price target for the coming 12 months is ¥6,700, calculated as a P/E of 12x based on our FY3/15 EPS estimate. This represents a 10% premium to the sector average of around 11x to reflect Toyota's high cash on hand and to pay out streams of attractive dividends. Our 2-stage DCF model assuming a discount rate of 7.0–7.5% and terminal growth of 0–1% yields a theoretical share price range of ¥6,110–6,804. Our price target is near the top of this range, but we feel this can be supported by the opportunities of a weaker yen and the expected dividend yield (around 2.7% based on our FY3/14 forecasts).
However, the 12-month expected rate of return is uninspiring at 9%, and the share price will barely outperform the sector average. Toyota’s share price has consistently performed extremely well over the past 12 months, but some concerns have started to cloud the outlook. The yen will need to weaken a notch further in order to sustain a strong share price performance to continue.
Our investment thesis rests on the following three points.
First, our three-year operating profit CAGR forecast of 4% for FY3/15–FY3/17 is well below the sector average of 7%. Sliding volumes in Asia/Japan and the rising costs of investment and related expenses for future growth will take their toll. Already elevated margins will stay flat at best, while we flag the risk of declines should Toyota accelerate for a level of future investment.
Second, the increase in its manufacturing segment net cash target to around ¥6 trillion means we think there will be no change in its dividend payout ratio guideline of 30% in the foreseeable future, and currently overblown market expectations of higher dividends could give way to disappointment.
Third, we take the view that the company’s business reform benefit will not fully appear until 2015 or beyond, creating mediocre medium-term product competitiveness, production capacity shortages hampering volume growth, and a cost-push stemming from soaring investments for the future.
Chart 1: Analysis of Discount Chas Flow
Source: Jefferies estimates, Company data
Chart 2: Band Chart – 1-Year Forward P/Es
Source: Jefferies estimate, Bloomberg
Chart 3: Band Chart – 1-Year Forward P/Bs
Source: Jefferies estimate, Bloomberg
NPV Terminal value Retirement prov ision Equity Value (¥ bn)Discount of FCF Growth rates Net debts and other adjustments Growth rates Fair Value per share(¥)
rate (¥ bn) 0.0% 1.0% (¥ bn) (¥ bn) 0.0% 1.0% Low High7.0% 4,115.3 10,278.5 11,991.6 -4,599.4 -1,724.2 20,717.5 22,430.6 6,110 6,804 7.5% 4,060.7 9,372.3 10,814.2 -4,599.4 -1,724.2 19,756.6 21,198.5 5,993 6,430
8.0x
10.0x12.0x14.0x
16.0x
01,0002,0003,0004,0005,0006,0007,0008,0009,000
10,000
00/04 02/04 04/04 06/04 08/04 10/04 12/04
(¥)
0.6x0.8x1.0x1.2x1.4x
01,0002,0003,0004,0005,0006,0007,0008,0009,000
00/04 02/04 04/04 06/04 08/04 10/04 12/04
(¥)
Our price target for the coming 12 months is ¥6,700, calculated as a P/E of 12x
7203 JP
Initiating Coverage
21 November 2013
page 3 of 26 , Equity Analyst, [email protected] Nakanishi
Please see important disclosure information on pages 23 - 26 of this report.
Medium-term fundamentals
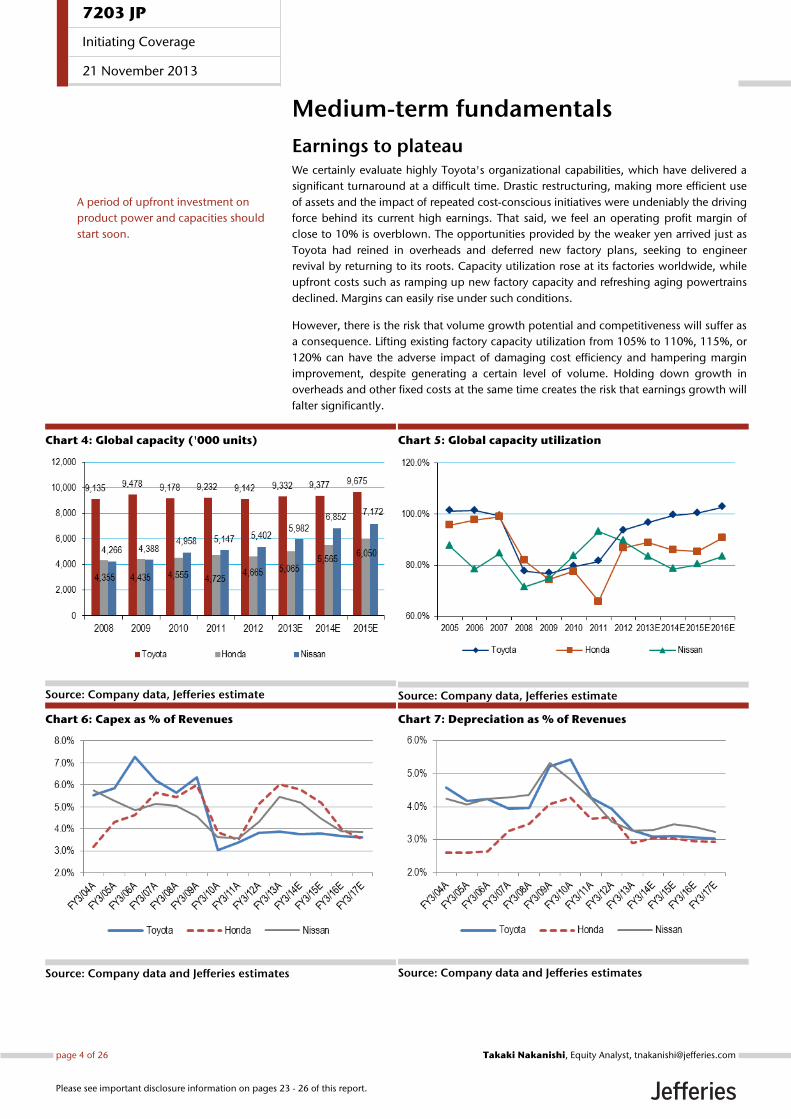
Earnings to plateau We certainly evaluate highly Toyota's organizational capabilities, which have delivered a significant turnaround at a difficult time. Drastic restructuring, making more efficient use of assets and the impact of repeated cost-conscious initiatives were undeniably the driving force behind its current high earnings. That said, we feel an operating profit margin of close to 10% is overblown. The opportunities provided by the weaker yen arrived just as Toyota had reined in overheads and deferred new factory plans, seeking to engineer revival by returning to its roots. Capacity utilization rose at its factories worldwide, while upfront costs such as ramping up new factory capacity and refreshing aging powertrains declined. Margins can easily rise under such conditions.
However, there is the risk that volume growth potential and competitiveness will suffer as a consequence. Lifting existing factory capacity utilization from 105% to 110%, 115%, or 120% can have the adverse impact of damaging cost efficiency and hampering margin improvement, despite generating a certain level of volume. Holding down growth in overheads and other fixed costs at the same time creates the risk that earnings growth will falter significantly.
Chart 4: Global capacity ('000 units)
Source: Company data, Jefferies estimate
Chart 5: Global capacity utilization
Source: Company data, Jefferies estimate
Chart 6: Capex as % of Revenues
Source: Company data and Jefferies estimates
Chart 7: Depreciation as % of Revenues
Source: Company data and Jefferies estimates
A period of upfront investment on product power and capacities should start soon.
7203 JP
Initiating Coverage
21 November 2013
page 4 of 26 , Equity Analyst, [email protected] Nakanishi
Please see important disclosure information on pages 23 - 26 of this report.

Toyota's January–September capacity utilization reached 105% in North America, 98% in Japan, 115% in Thailand, and 120% in Indonesia. Capacity utilization reaches its absolute limits at 110–120%-plus, even making full use of overtime and weekend shifts, and we feel Toyota will have to take steps to increase overseas capacity at some point in the near future.
Furthermore, upfront investment on powertrains and new models that deliver global competitive strength is unavoidable. We feel that asking Toyota's management to improve margins further under such circumstances may be the wrong pressure to apply, possibly pushing the company into the wrong order of priority among the issues it needs to address. It would be no surprise if a period of upfront investment on product power, powertrains, and production facilities caused earnings to stagnate for a while, and this is unavoidable if the company is to deliver sustained growth and build a competitive position.
FY3/15 earnings — 5% below consensus Our estimates are based on the following assumptions.
1. Exchange rates: ¥100/$ and ¥130/€.
2. US SAAR: Gradual growth from 15.6 million units in CY2013 to 16 million units in CY2014
3. Japanese SAAR: 5.51 million units (up 5.8% YoY) in FY3/14, 5.17 million units (down 6.1% YoY) in FY3/15. As a risk scenario, sales could fall well below 5 million units if the acquisition tax is not lowered, or if other vehicle automobile related taxes are increased, even if the acquisition tax is cut.
We estimate Toyota's global retail sales volume growth will slow from 9.14 million units (up 5% YoY) in FY3/14 to 9.36 million units (up 2% YoY) in FY3/15. Development costs and miscellaneous overheads will rise just as volume growth stalls and forex benefits diminish, and we estimate that the corresponding operating deleveraging will slightly erode profitability. We forecast FY3/14 operating profit of ¥2.45 trillion (company guidance: ¥2.2 trillion), broadly in line with the consensus forecast. On the other hand, in FY3/15 we see growth of a mere 2% YoY to ¥2.51 trillion, 5% below consensus.
Chart 8: Toyota Motor – Trend in Operating Income (Quarterly and Annual Base)
Source: Jefferies estimate, company data
Overblown hopes of shareholder returns After the Lehman Shock Toyota raised its manufacturing segment net cash target from ¥3 trillion to ¥5 trillion, in a financial strategy which put more priority on strengthening its financial profile than efficiency of assets. At the same time it set a benchmark dividend payout ratio of 30%, aiming to make a good balance with shareholders’ interest.
Operating deleveraging will slightly erode profitability
7203 JP
Initiating Coverage
21 November 2013
page 5 of 26 , Equity Analyst, [email protected] Nakanishi
Please see important disclosure information on pages 23 - 26 of this report.

Free cash flow turned up sharply thanks to the rapid earnings recovery in recent years and constraints on capex, so the role of a financial strategy which prioritizes margins and financial footing is coming to an end now the net cash figure of ¥5 trillion is in sight. The stock market's focus is on when and how Toyota will switch to a strategy of concentrating on sustainability and asset efficiency. A time will come when the company ought to stop accumulating unnecessary cash and move to lift its payout ratio and buy back its own shares, in our view.
At some point Toyota will presumably have to engage with this argument in earnest. Cash flow will inflate sharply if the company continues to prevaricate on upfront investment, including beefing up capacity and upgrading its engines, and it will be increasingly hard to justify holding on to such cash. At present, however, we do not believe Toyota's management will jump to any hasty conclusion, and we feel overblown expectations pinned on shareholder returns could give way to disappointment.
Since May this year, Toyota has said it has lifted the net cash range it regards as appropriate from ¥5 trillion to ¥5–6 trillion. Originally Toyota said net cash equal either to total fixed costs or three months' sales was the right level, but fixed costs have apparently risen from ¥5 trillion five years ago to ¥6 trillion at present. Three months' sales work out at ¥6.3 trillion. The company is currently considering the scale of future investment, intertwined with the Toyota New Global Architecture (TNGA) strategy, which replaces the current outdated platforms. This implies Toyota is unlikely to easily switch its financial strategy until it has ensured its can reach net cash of around ¥6 trillion, and it probably regards this as a period of grace to consider its options. According to our analysis, Toyota's net cash will exceed ¥6 trillion in FY3/16, and we think it is unlikely to change its financial strategy anytime soon.
We also think a share buyback is unlikely. Flexibly implementing share buybacks to provide a balance in this grace period before changing the financial strategy would be the wise option, in our view, and would likely also win approval from investors. However, it is important to understand that Toyota's management still carries the scars of the market's downbeat response to large-scale share buybacks in the past. Toyota's regret at the time has led to great disappointment. We see few convincing grounds for concluding that Toyota will turn voluntarily upbeat on share buybacks before building the necessary financial profile and competitive strength to ensure sustainable growth. The story could be different in a period of plentiful earnings, but it does not have the luxury of such worries at a time when we think sustaining margins will be a key issue for Toyota going forwards.
Chart 9: Toyota Motor: Outlook of manufacturing net debt (cash)
Chart 10: Toyota Motor: DPS and Dividend payout ratio
Source: company data and Jefferies estimate
Source: company data and Jefferies estimate
…but, we think it is unlikely to change its financial strategy anytime soon.
Focus is on when and how Toyota will move toward a higher dividend payout ratio and buy back its own shares.
7203 JP
Initiating Coverage
21 November 2013
page 6 of 26 , Equity Analyst, [email protected] Nakanishi
Please see important disclosure information on pages 23 - 26 of this report.

Chart 11: Analysis of manufacturing segment cashflow
Source: Jefferies estimates, company data Note: (1) Figures excluding cash, cash equivalents and short-term held marketable securities from total fund.
Chart 12: Analysis of manufacturing segment cash and debts
Source: Jefferies estimates, company data Note: (1) Total liquidity on hand excluding FINCO assets
(¥ bn) FY3/08A FY3/09A FY3/10A FY3/11A FY3/12A FY3/13A FY3/14E FY3/15E FY3/16E FY3/17E Net Income 1,671.9 -368.6 116.2 241.4 186.2 883.1 1,711.6 1,640.9 1,700.5 1,802.7 Depreciation 1,081.4 1,105.2 1,065.7 844.7 769.1 768.6 782.6 820.0 850.0 885.0 Equity Income -268.0 -53.2 -109.9 -214.2 196.5 -230.1 -276.9 -292.3 -314.6 -332.3 Changes in Assets and Liabilities -220.2 -223.1 733.3 591.4 182.9 472.5 -63.9 36.9 -100.1 -185.1 Others 0.2 0.1 0.0 0.0 -0.4 0.1 0.0 0.0 0.0 0.0Net Cash Provided by Operations 2,420.4 568.3 1,842.3 1,467.0 967.4 1,996.3 2,201.4 2,225.5 2,155.8 2,190.3 CAPEX -1,472.4 -1,358.5 -599.2 -621.3 -713.9 -839.8 -949.2 -996.3 -1,015.8 -1,240.8 Lease Assets -137.7 -82.4 -64.3 -78.6 -135.1 -129.1 -100.0 -100.0 -100.0 -100.0 Others -58.7 1,104.2 -1,475.5 -177.3 -67.3 -559.2 -300.0 0.0 -100.0 -100.0Net Cash Used for Investing -1,668.8 -336.7 -2,139.0 -877.1 -916.2 -1,528.0 -1,349.2 -1,096.3 -1,215.8 -1,440.8Free Cash Flow 751.6 231.6 -296.7 589.9 51.2 468.2 852.2 1,129.2 940.0 749.6 Dividend Paid -430.9 -440.0 -172.5 -141.1 -156.8 -190.0 -414.2 -538.4 -570.0 -601.7 Other -496.9 463.7 155.8 -410.0 -54.2 -352.1 -100.0 0.0 0.0 0.0Net Cash Provided by Financing -927.8 23.7 -16.7 -551.2 -211.0 -542.2 -514.2 -538.4 -570.0 -601.7Effect of Exchange Rates on Cash -65.4 -80.2 4.1 -77.0 -36.1 72.7 0.0 0.0 0.0 0.0Net Increase (Decrease) in Cash and Cash -241.6 175.0 -309.3 -38.3 -195.9 2.8 338.0 590.8 370.0 147.9Beginning Cash 1,714.7 1,473.1 1,648.1 1,338.8 1,300.6 1,104.6 1,107.4 1,445.4 2,036.3 2,406.3Ending Cash 1,473.1 1,648.1 1,338.8 1,300.6 1,104.6 1,107.4 1,445.4 2,036.3 2,406.3 2,554.1
Liquidity analysisTotal Cash and Cash Equivalent 1,473.1 2,444.3 1,465.7 1,300.6 1,104.6 1,107.4 1,445.4 2,036.3 2,406.3 2,554.1Investment 526.8 540.5 2,185.9 1,036.6 1,015.6 1,204.4 904.4 904.4 904.4 904.4 Adjustment (1) 2,352.6 241.1 553.8 2,606.3 2,847.8 3,571.2 3,749.8 3,749.8 3,749.8 3,749.8Total Liquidity Assets 4,352.5 3,225.9 4,205.4 4,943.4 4,968.1 5,883.1 6,099.7 6,690.5 7,060.5 7,208.4Total Manufacturing Debts 1,300.7 1,791.2 1,960.6 1,562.1 1,557.5 1,283.7 1,183.7 1,183.7 1,183.7 1,183.7Automotive Net Debts -3,051.8 -1,925.2 -2,244.8 -3,381.3 -3,410.6 -4,599.4 -4,916.0 -5,506.8 -5,876.8 -6,024.7
(¥ bn) FY3/08A FY3/09A FY3/10A FY3/11A FY3/12A FY3/13A FY3/14E FY3/15E FY3/16E FY3/17EMfg. liquidity on handCash and cash equivalent 1,473.1 1,648.1 1,338.8 1,300.6 1,104.6 1,107.4 1,445.4 2,036.3 2,406.3 2,554.1Securities 526.8 494.5 1,783.6 1,036.6 1,015.6 1,204.4 904.4 904.4 904.4 904.4Other liquidity assets 2,352.6 1,083.3 1,083.0 2,606.3 2,847.8 3,571.2 3,749.8 3,749.8 3,749.8 3,749.8 Total liquidity on hand (1) 4,352.5 3,225.9 4,205.4 4,943.4 4,968.1 5,883.1 6,099.7 6,690.5 7,060.5 7,208.4
Mfg. debtsShort-term debts 909.4 941.0 865.3 722.5 1,054.5 762.3 762.3 762.3 762.3 762.3Long-term debts 391.3 850.2 1,095.3 839.6 503.1 521.4 421.4 421.4 421.4 421.4 Total mfg. debts 1,300.7 1,791.2 1,960.6 1,562.1 1,557.5 1,283.7 1,183.7 1,183.7 1,183.7 1,183.7Mfg. net debt (cash) -3,051.8 -1,434.7 -2,244.8 -3,381.3 -3,410.6 -4,599.4 -4,916.0 -5,506.8 -5,876.8 -6,024.7
EPS (¥) 540.7 -139.1 66.8 130.2 90.2 303.8 578.8 574.1 596.5 629.6DPS (¥) 140.0 100.0 45.0 50.0 50.0 90.0 170.0 170.0 180.0 190.0Dividends payout ratio (% ) 26% -72% 67% 38% 55% 30% 29% 30% 30% 30%Dividends paid(¥bn) 430.9 440.0 172.5 141.1 156.8 190.0 414.2 538.4 570.0 601.7
7203 JP
Initiating Coverage
21 November 2013
page 7 of 26 , Equity Analyst, [email protected] Nakanishi
Please see important disclosure information on pages 23 - 26 of this report.

Risk Analysis Market and business risks Toyota is exposed to a wide range of risks, including escalating automobile market competition, changes in automobile market demand, the impact of fluctuating forex and interest rates, rising material prices, regulations, law-suits, and product quality problems.
The biggest calculable risk is from changes in exchange rates. Every ¥1 (roughly 1%) move affects operating profit by around 2%, including ¥45.0 billion for yen-dollar and ¥4 billion or so for yen-euro. A sales volume change of 1% (about 90k units) affects operating profit by ¥45.0 billion, or just under 2%.
Risks to our investment thesis Upside Scenario 1. A weaker yen beyond our ¥100/$ assumption
2. An increase in the dividend payout ratio beyond our 30% estimate, the launch of a share buyback program
3. Higher-than-expected demand growth and market share
4. A bigger decline in product quality costs than we expect (we currently put these at 2% of sales)
Downside Scenario 1. A strong yen beyond our ¥100/$ assumption
2. Economic downturn and falling automobile demand in emerging markets, mainly in Asia
3. Delays in scrapping Japanese automobile acquisition tax, or an increase in automobile related tax
4. Relapsed US product quality problems or lawsuits, and
5. Higher-than-expected upfront investment or increased overheads, leading to a sharper downturn in earnings than expected
Catalysts The main catalyst for our Hold rating is that overblown market expectations will evaporate. The market's current investment opinion tends to be extremely bullish, and optimistic earnings forecasts and expectations for higher dividends are overblown. There is a strong possibility that management will be cautious in quarterly results and FY3/14 guidance, and we think overoptimistic market expectations will be marked down. We expect Toyota to win back market share only gradually in markets worldwide, and there is nothing in particular to deliver strong momentum in sales.
7203 JP
Initiating Coverage
21 November 2013
page 8 of 26 , Equity Analyst, [email protected] Nakanishi
Please see important disclosure information on pages 23 - 26 of this report.
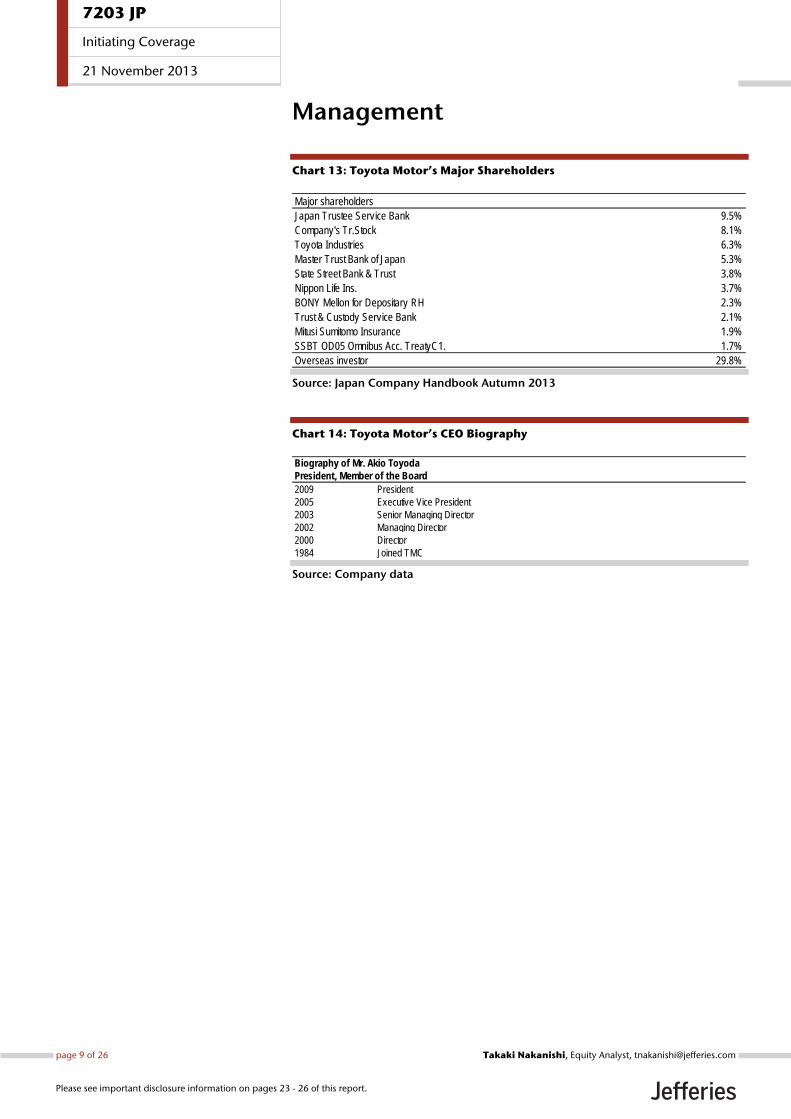
Management
Chart 13: Toyota Motor’s Major Shareholders
Source: Japan Company Handbook Autumn 2013
Chart 14: Toyota Motor’s CEO Biography
Source: Company data
Major shareholdersJapan Trustee Service Bank 9.5%Company's Tr.Stock 8.1%Toyota Industries 6.3%Master Trust Bank of Japan 5.3%State Street Bank & Trust 3.8%Nippon Life Ins. 3.7%BONY Mellon for Depositary RH 2.3%Trust & Custody Service Bank 2.1%Mitusi Sumitomo Insurance 1.9%SSBT OD05 Omnibus Acc. TreatyC1. 1.7%Overseas investor 29.8%
Biography of Mr. Akio ToyodaPresident, Member of the Board2009 President2005 Executive Vice President2003 Senior Managing Director2002 Managing Director2000 Director1984 Joined TMC
7203 JP
Initiating Coverage
21 November 2013
page 9 of 26 , Equity Analyst, [email protected] Nakanishi
Please see important disclosure information on pages 23 - 26 of this report.

Chart 15: Toyota Motor (7203) : Consolidated statement of profit/loss
Source: Jefferies estimates, company data Note: (E) Jefferies estimates
Full Year FY3/13A FY3/14E FY3/13A FY3/14E(¥ bn) FY3/11A FY3/12A FY3/13A FY3/14E FY3/15E FY3/16E FY3/17E 1HA 2HA 1HA 2HE 1QA 2QA 3QA 4QA 1QA 2QA 3QE 4QE
1 Average ¥/US$ 85.7 79.1 83.1 99.4 100.0 100.0 100.0 79.4 86.7 98.9 100.0 80.2 78.6 81.2 92.3 98.8 99.0 100.0 100.02 Average ¥/Euro 113.1 109.0 107.1 130.0 130.0 130.0 130.0 100.6 113.6 130.0 130.0 102.9 98.4 105.3 122.0 128.9 131.1 130.0 130.03 Sales of products 17,820.5 17,511.9 20,914.2 23,961.6 24,926.6 26,158.0 27,664.7 10,375.9 10,538.3 11,872.0 12,089.6 5,233.7 5,142.2 5,024.8 5,513.4 5,926.5 5,945.5 6,001.9 6,087.74 Financial operations 1,173.2 1,071.7 1,150.0 1,319.9 1,372.9 1,427.8 1,470.7 532.5 617.6 665.5 654.4 267.9 264.6 293.9 323.6 328.8 336.7 327.2 327.25 Revenues 18,993.7 18,583.7 22,064.2 25,281.4 26,299.5 27,585.8 29,135.4 10,908.4 11,155.8 12,537.5 12,743.9 5,501.6 5,406.8 5,318.8 5,837.1 6,255.3 6,282.2 6,329.1 6,414.96 YoY (% ) 0.2% -2.2% 18.7% 14.6% 4.0% 4.9% 5.6% 36.1% 5.6% 14.9% 14.2% 59.9% 18.2% 9.3% 2.4% 13.7% 16.2% 19.0% 9.9%7 Mfg. variable costs (E) 12,502.1 12,401.8 14,525.2 15,785.0 16,393.1 17,202.8 18,160.1 7,278.6 7,246.6 7,855.5 7,929.5 3,698.3 3,580.3 3,539.4 3,707.2 3,909.1 3,946.5 3,959.5 3,969.98 Variable margin (% ) 34.2% 33.3% 34.2% 37.6% 37.7% 37.6% 37.7% 33.3% 35.0% 37.3% 37.8% 32.8% 33.8% 33.5% 36.5% 37.5% 37.2% 37.4% 38.1%9 Fixed mfg. costs (E) 4,113.2 3,986.8 4,115.8 4,653.1 4,895.8 5,104.6 5,382.1 1,971.8 2,144.1 2,267.0 2,386.1 974.5 997.3 1,058.7 1,085.4 1,113.2 1,153.9 1,181.3 1,204.8
10 Fixed mfg. costs ratio (% ) 21.7% 21.5% 18.7% 18.4% 18.6% 18.5% 18.5% 18.1% 19.2% 18.1% 18.7% 17.7% 18.4% 19.9% 18.6% 17.8% 18.4% 18.7% 18.8%11 Cost of products 15,985.8 15,795.9 18,010.6 19,637.6 20,489.5 21,483.4 22,689.6 8,985.3 9,025.3 9,706.4 9,931.2 4,540.9 4,444.4 4,435.5 4,589.8 4,802.5 4,904.0 4,948.6 4,982.512 Cost of financial operations 629.5 592.6 630.4 800.6 799.3 824.0 852.7 265.1 365.4 416.2 384.4 132.0 133.1 162.5 202.8 219.8 196.4 192.2 192.213 CoGS 16,615.3 16,388.6 18,641.0 20,438.1 21,288.8 22,307.4 23,542.2 9,250.3 9,390.7 10,122.6 10,315.6 4,672.8 4,577.5 4,598.1 4,792.6 5,022.3 5,100.3 5,140.8 5,174.714 Gross profit 2,378.4 2,195.1 3,423.2 4,843.3 5,010.7 5,278.4 5,593.2 1,658.0 1,765.2 2,414.9 2,428.4 828.7 829.3 720.7 1,044.5 1,233.1 1,181.8 1,188.2 1,240.215 SG & A 1,910.1 1,839.5 2,102.3 2,393.3 2,500.7 2,688.4 2,863.2 964.3 1,138.0 1,159.4 1,233.9 475.6 488.7 595.9 542.1 569.7 589.7 603.9 629.916 Operating profit 468.3 355.6 1,320.9 2,450.0 2,510.0 2,590.0 2,730.0 693.8 627.1 1,255.5 1,194.5 353.1 340.6 124.8 502.4 663.4 592.1 584.3 610.217 YoY (% ) 217.4% -24.1% 271.4% 85.5% 2.4% 3.2% 5.4% NM 61.6% 81.0% 90.5% NM 351.8% -16.7% 110.6% 87.9% 73.8% 368.3% 21.5%18 Interest profit 90.8 99.9 98.7 98.1 100.0 110.0 120.0 54.5 44.2 58.1 40.0 34.6 19.9 29.9 14.2 38.2 20.0 20.0 20.019 Interest expenses -29.3 -22.9 -23.0 -21.7 -24.0 -24.0 -24.0 -12.8 -10.2 -9.7 -12.0 -6.0 -6.8 -6.2 -4.0 -4.6 -5.2 -6.0 -6.020 Foreign exchange gain (loss) 14.3 37.1 5.6 23.1 0.0 0.0 0.0 16.1 -10.6 16.7 6.3 0.0 16.1 -13.7 3.1 9.5 7.2 6.3 0.021 Others, net 19.3 -36.8 1.5 42.9 60.0 60.0 60.0 43.0 -41.5 22.9 20.0 33.5 9.5 -3.6 -37.9 17.7 5.2 10.0 10.022 Pretax profit 563.3 432.9 1,403.6 2,592.4 2,646.0 2,736.0 2,886.0 794.5 609.1 1,343.5 1,248.9 415.2 379.3 131.2 477.9 724.2 619.4 614.6 634.223 YoY (% ) 93.3% -23.2% 224.3% 84.7% 2.1% 3.4% 5.5% NM 40.3% 69.1% 105.0% NM 379.4% -33.9% 102.7% 74.4% 63.3% 368.3% 32.7%24 Taxes 312.8 262.3 551.7 892.9 952.6 985.0 1,039.0 310.8 240.8 437.2 455.7 164.9 145.9 67.4 173.5 210.1 227.1 227.4 228.325 Minority adjustments -57.3 -84.7 -121.3 -143.0 -167.5 -176.5 -184.9 -59.3 -62.0 -64.5 -78.5 -31.3 -28.0 -22.2 -39.9 -41.8 -22.7 -39.3 -39.326 Equity profit 215.0 197.7 231.5 276.9 292.3 314.6 332.3 123.9 107.7 158.8 118.1 71.3 52.5 58.2 49.5 89.9 68.9 59.0 59.027 Net profit 408.2 283.6 962.2 1,833.0 1,818.0 1,889.0 1,994.0 548.3 413.9 1,000.4 833.0 290.3 257.9 99.9 314.0 562.0 438.4 407.0 426.028 YoY (% ) 94.9% -30.5% 239.3% 90.5% -0.8% 3.9% 5.6% 572.1% 104.9% 82.5% 101.3% 24930% 220.7% 23.7% 159.1% 93.6% 70.0% 307.4% 35.7%29 EPS (¥)30 -Basic (¥) 130.2 90.2 303.8 578.8 574.1 596.5 629.6 173.1 130.7 315.9 263.0 91.7 81.4 31.6 99.1 177.5 138.4 128.5 134.531 DPS (¥) 50.0 50.0 90.0 170.0 170.0 180.0 190.0 30.0 60.0 65.0 105.0 0.0 30.0 0.0 60.0 0.0 65.0 0.0 105.032 CFPS (¥) 389.2 323.3 533.4 825.9 833.0 864.9 909.1 281.6 251.8 432.3 393.7 144.6 137.0 89.1 162.7 232.9 199.4 192.5 201.333 Avg. shares outstanding (m) 3,136 3,143 3,167 3,167 3,167 3,167 3,167 3,167 3,167 3,167 3,167 3,167 3,167 3,167 3,167 3,167 3,167 3,167 3,16734 Capex 642.3 706.5 852.7 949.2 996.3 1,015.8 1,240.8 319.2 533.5 427.2 522.0 139.6 179.6 211.5 322.0 203.0 224.2 234.4 287.635 Depreciation 812.3 732.7 727.2 782.6 820.0 850.0 885.0 343.6 383.6 368.7 413.9 167.7 175.9 182.3 201.3 175.5 193.2 202.5 211.436 R&Ds 730.3 779.8 804.7 949.9 980.0 1,030.0 1,090.0 404.7 400.0 476.9 473.0 194.7 210.0 198.6 201.4 244.1 232.8 240.0 233.037 Ratios (%)39 SG & A/revenue 10.1% 9.9% 9.5% 9.5% 9.5% 9.7% 9.8% 8.8% 10.2% 9.2% 9.7% 8.6% 9.0% 11.2% 9.3% 9.1% 9.4% 9.5% 9.8%40 Operating profit/revenue 2.5% 1.9% 6.0% 9.7% 9.5% 9.4% 9.4% 6.4% 5.6% 10.0% 9.4% 6.4% 6.3% 2.3% 8.6% 10.6% 9.4% 9.2% 9.5%41 Tax rates 55.5% 60.6% 39.3% 34.4% 36.0% 36.0% 36.0% 39.1% 39.5% 32.5% 36.5% 39.7% 38.5% 51.3% 36.3% 29.0% 36.7% 37.0% 36.0%42 Net profit/revenue 2.1% 1.5% 4.4% 7.3% 6.9% 6.8% 6.8% 5.0% 3.7% 8.0% 6.5% 5.3% 4.8% 1.9% 5.4% 9.0% 7.0% 6.4% 6.6%
7203 JP
Initiating Coverage
21 November 2013
page 10 of 26 , Equity Analyst, [email protected] Nakanishi
Please see important disclosure information on pages 23 - 26 of this report.

Chart 16: Toyota Motor (7203): Operating income variance analysis
Source: Jefferies estimates, company data
Full Year FY3/13A FY3/14E FY3/13A FY3/14E(¥ bn) FY3/11A FY3/12A FY3/13A FY3/14E FY3/15E FY3/16E FY3/17E 1HA 2HA 1HA 2HE 1QA 2QA 3QA 4QA 1QA 2QA 3QE 4QE
1 OP variance analysis (YoY)2 Foreign exchange rates -290.0 -250.0 150.0 873.9 0.0 0.0 0.0 -60.0 210.0 540.0 333.9 -40.0 -20.0 50.0 160.0 260.0 280.0 246.6 87.33 US $ -220.0 -220.0 150.0 675.3 20.1 0.0 0.0 -10.0 160.0 410.0 265.3 -15.0 5.0 40.0 120.0 185.6 224.4 188.3 77.04 Euro -85.0 -20.0 -10.0 100.9 0.0 0.0 0.0 -30.0 20.0 60.0 40.9 -15.0 -15.0 0.0 20.0 32.6 27.5 30.9 9.95 Sterling pound -5.0 -5.0 0.0 9.5 19.6 0.0 0.0 0.0 0.0 5.0 4.5 0.0 0.0 0.0 0.0 3.1 1.9 3.0 1.56 Canada $ 0.0 -5.0 5.0 9.1 -0.4 0.0 0.0 0.0 5.0 5.0 4.1 0.0 0.0 0.0 5.0 4.3 0.7 3.2 0.97 Australia $ 5.0 5.0 15.0 24.6 -8.3 0.0 0.0 -5.0 20.0 25.0 -0.4 -5.0 0.0 5.0 15.0 16.8 8.2 5.5 -5.98 Others 15.0 -5.0 -10.0 20.0 0.0 0.0 0.0 -10.0 0.0 10.0 10.0 5.0 -15.0 0.0 0.0 3.2 6.8 5.0 5.09 Cost reductions 180.0 150.0 450.0 220.0 196.9 235.4 232.7 230.0 220.0 140.0 80.0 70.0 160.0 90.0 130.0 70.0 70.0 40.0 40.0
10 Procurement/Cost cuts (E) 321.1 360.0 443.7 306.4 280.0 300.0 300.0 0.0 0.0 165.0 141.4 86.2 163.7 83.9 110.0 82.6 82.3 69.8 71.611 Material cost increase (E) -141.1 -210.0 0.4 -86.4 -83.1 -64.6 -67.3 -19.8 20.2 -25.0 -61.4 -16.2 -3.7 6.1 14.1 -12.6 -12.3 -29.8 -31.612 Pension one-off gains 0.0 0.0 0.0 0.0 0.0 0.0 0.0 0.0 0.0 0.0 0.0 0.0 0.0 0.0 0.0 0.0 0.0 0.0 0.013 Expense/Others -30.0 -100.0 -300.0 -162.8 -171.3 -234.8 -229.4 -20.0 -280.0 -190.0 27.2 -10.0 -10.0 -220.0 -60.0 -60.0 -130.0 84.4 -57.214 -- R&Ds -25.0 -50.0 -20.0 -143.0 -30.1 -50.0 -60.0 -30.0 10.0 -70.0 -73.0 -10.0 -20.0 -10.0 20.0 -40.0 -30.0 -41.4 -31.615 -- Depreciation 120.0 30.0 20.0 -20.3 -37.4 -30.0 -35.0 0.0 20.0 10.0 -30.3 -5.0 5.0 5.0 15.0 0.0 10.0 -20.2 -10.116 -- Labor -40.0 -100.0 -70.0 -80.0 -100.0 -100.0 -100.0 -15.0 -55.0 -40.0 -40.0 5.0 -20.0 -25.0 -30.0 -20.0 -20.0 -20.0 -20.017 -- Business expansion 0.0 0.0 0.0 0.0 -30.0 0.0 -38.0 0.0 0.0 0.0 0.0 0.0 0.0 0.0 0.0 0.0 0.0 0.0 0.018 -- Product quality related costs -66.4 120.0 -50.0 41.5 26.2 5.2 3.6 80.0 -130.0 -40.0 81.5 30.0 50.0 -90.0 -40.0 0.0 -40.0 50.0 31.519 -- Others/Quality costs -18.6 0.0 -198.5 39.0 0.0 -60.0 0.0 -55.0 -143.5 -50.0 89.0 -30.0 -25.0 -100.0 -43.5 0.0 -50.0 116.0 -27.020 Others -29.3 -62.6 15.2 13.4 0.0 0.0 0.0 -3.7 18.9 31.6 -18.2 1.1 -4.8 -24.9 43.8 10.2 21.4 -14.0 -4.221 -- Forex translation -35.7 -41.8 11.8 66.6 0.0 0.0 0.0 -19.0 30.8 41.9 24.7 -12.0 -7.0 5.0 25.8 20.0 21.9 7.0 17.722 -- TMCC SFAS Impact 6.4 -20.8 13.0 -15.2 29.2 0.0 0.0 19.0 -6.0 -12.3 -2.9 18.8 0.2 -19.5 13.5 -43.4 31.1 -1.0 -1.923 -- Others/Quality costs -66.4 120.0 -50.0 41.5 26.2 5.2 3.6 80.0 -130.0 -40.0 81.5 30.0 50.0 -90.0 -40.0 0.0 -40.0 50.0 31.524 Volume/mix/selling costs 490.0 150.0 650.0 185.6 33.9 79.9 136.9 581.1 68.9 40.0 145.6 441.1 140.0 78.0 -9.1 30.0 10.0 103.5 42.125 Parent 130.0 110.0 310.0 160.6 -115.1 -48.8 -36.7 250.0 60.0 75.0 85.6 180.0 70.0 50.0 10.0 40.0 35.0 63.7 21.926 -- Domestic vehicles -80.0 35.0 70.0 76.8 -54.3 -29.6 -19.9 80.0 -10.0 35.0 41.8 65.0 15.0 -15.0 5.0 23.4 11.6 28.4 13.427 -- Export vehicles 100.0 40.0 130.0 47.0 -46.0 -30.4 -24.0 70.0 60.0 35.0 12.0 70.0 0.0 35.0 25.0 13.1 21.9 17.6 -5.628 -- KD sets 110.0 35.0 150.0 46.7 -14.8 11.2 7.2 100.0 50.0 15.0 31.7 45.0 55.0 30.0 20.0 16.9 -1.9 17.7 14.029 Subsidiaries 360.0 55.0 311.0 16.0 149.0 128.7 173.6 313.0 -2.0 -44.0 60.0 261.1 51.9 28.0 -30.0 -42.6 -1.4 39.8 20.230 -- Japan -15.0 45.0 55.0 -25.0 37.0 22.0 33.3 90.0 -35.0 -15.0 -10.0 75.0 15.0 -25.0 -10.0 0.0 -15.0 -5.0 -5.031 -- N. America 105.0 5.0 70.0 56.8 51.2 24.8 56.1 105.0 -44.0 -10.0 66.8 95.0 10.0 -15.0 -29.0 -9.9 -0.1 38.3 28.432 -- Europe 0.0 -15.0 0.0 7.3 28.2 7.8 15.7 0.0 0.0 5.0 2.3 10.0 -10.0 -5.0 5.0 -7.1 12.1 2.0 0.333 -- Asia/RoW 105.0 5.0 145.0 -37.8 23.3 48.1 36.6 90.0 55.0 -35.0 -2.8 60.0 30.0 65.0 -10.0 -15.8 -19.2 -2.5 -0.334 -- RoW 35.0 15.0 65.0 31.5 9.2 31.0 28.0 45.0 20.0 30.0 1.5 35.0 10.0 5.0 15.0 4.6 16.4 2.7 -1.235 -- Financial services 130.0 -15.0 -10.0 -7.7 0.0 -5.0 4.0 0.0 2.0 -10.0 2.3 -25.0 -3.1 3.0 -1.0 -14.5 4.5 4.3 -2.036 -- Others -- -- -- -- -- -- -- -- -- -- -- -- -- -- -- -- -- -- --
7203 JP
Initiating Coverage
21 November 2013
page 11 of 26 , Equity Analyst, [email protected] Nakanishi
Please see important disclosure information on pages 23 - 26 of this report.

Chart 17: Toyota Motor (7203): Sales volume/mix analysis
Source: Jefferies estimates, company data Note: Revenues by region and average prices are based on Jefferies estimates
Full Year FY3/13A FY3/14E FY3/13A FY3/14E('000 units) FY3/11A FY3/12A FY3/13A FY3/14E FY3/15E FY3/16E FY3/17E 1HA 2HA 1HA 2HE 1QA 2QA 3QA 4QA 1QA 2QA 3QE 4QE
1 Retail Sales Units (000 units)2 Total Toyota Brands 7,556 7,413 8,685 9,147 9,363 9,771 10,242 4,460 4,225 4,455 4,691 2,235 2,225 2,097 2,128 2,214 2,241 2,296 2,3953 (% change YoY) 3.8% -1.9% 17.2% 5.3% 2.4% 4.4% 4.8% 36.0% 2.2% -0.1% 11.0% 54.6% 21.3% 7.8% -2.8% -0.9% 0.7% 9.5% 12.5%4 Daihatsu/Hino 829 920 1,007 1,100 1,155 1,213 1,274 456 551 526 575 250 206 248 303 266 260 259 3165 Total Toyota Group 8,440 8,333 9,692 10,247 10,518 10,985 11,516 4,916 4,776 4,981 5,266 2,485 2,431 2,345 2,431 2,480 2,501 2,555 2,7116 (% change YoY) 3.7% -1.3% 16.3% 5.7% 2.6% 4.4% #DIV/0! 33.8% 2.5% 1.3% 10.3% 53.8% 18.1% 7.9% -2.2% -0.2% 2.9% 9.0% 11.5%7 Cons. Sales Units (000 units)8 Japan 1,913 2,071 2,279 2,355 2,331 2,338 2,379 1,192 1,087 1,101 1,254 577 615 479 608 526 575 558 6969 (% change YoY) -11.5% 8.2% 10.0% 3.4% -1.0% 0.3% 1.8% 49.5% -14.7% 58.1% 13.9% 97.3% 21.9% -14.5% -14.8% -76.9% 9.4% -3.1% 24.9%
10 N. America 2,031 1,872 2,469 2,665 2,754 2,853 2,975 1,261 1,208 1,298 1,367 662 598 605 603 689 609 694 67311 (% change YoY) -3% -8% 32% 8% 3% 4% 4% 82.9% 2.1% 93% 5% 140.4% 44.6% 4.3% 0.0% -72% -12% 14% -3%12 Europe 796 798 799 811 851 864 898 412 387 407 404 209 203 190 196 193 214 207 19713 (% change YoY) -7.3% 0.3% 0.1% 1.4% 5.0% 1.5% 4.0% 14.1% -11.4% 106.4% -0.8% 19.9% 8.8% -12.7% -10.2% -75.9% 11.4% -3.7% -4.5%14 Asia 1,255 1,327 1,684 1,673 1,690 1,810 1,925 840 844 780 893 419 421 428 416 395 385 456 43715 (% change YoY) 28.1% 5.7% 26.9% -0.7% 1.1% 7.1% 6.3% 36.5% 18.6% 78.3% 14.5% 61.1% 18.5% 53.4% -3.9% -76.5% -2.6% 18.5% -4.1%16 Others 1,313 1,284 1,640 1,775 1,848 1,955 2,052 811 829 882 893 402 410 414 415 430 452 442 45017 (% change YoY) 15.3% -2.2% 27.8% 8.2% 4.1% 5.8% 4.9% 43.8% 15.2% 95.9% 1.2% 83.1% 18.8% 24.9% 6.9% -73.8% 5.1% -2.1% 1.8%18 Total 7,308 7,352 8,871 9,278 9,474 9,820 10,229 4,516 4,354 4,468 4,810 2,269 2,248 2,116 2,238 2,232 2,236 2,356 2,45419 (% change YoY) 1.0% 0.6% 20.7% 4.6% 2.1% 3.7% 4.2% 49.2% 0.7% 82.0% 7.7% 85.7% 24.5% 7.5% -5.0% -1.6% -0.5% 11.3% 9.7%20 Price per unit (excl. fin. rev.)21 Japan (¥m) 2.6145 2.5797 2.2699 2.4320 2.4563 2.5054 2.5555 2.3114 2.2245 2.5551 2.3238 2.3754 2.2514 2.3932 2.0916 2.6371 2.4802 2.4411 2.230022 N. America (US$) 26,121 26,771 29,111 26,992 27,937 28,495 28,495 26,070 32,070 27,245 26,746 25,826 26,319 26,516 36,969 26,739 27,820 26,500 27,00023 Europe (Euro) 19,934 20,905 22,206 24,109 24,832 25,328 25,328 23,336 21,223 23,624 24,597 22,774 23,925 24,674 18,294 22,893 24,250 25,168 24,00024 Asia (¥m) 2.6138 2.4754 2.3404 2.5646 2.5646 2.5646 2.6421 2.3984 2.2826 2.8216 2.3404 2.3825 2.4141 2.4463 2.1140 2.8440 2.7985 2.3404 2.340425 Others (¥m) 2.4340 2.4172 2.3956 2.3956 2.3956 2.3956 2.4680 2.5000 2.2934 2.3956 2.3956 2.5000 2.5000 2.5000 2.0873 2.3956 2.3956 2.3956 2.395626 Automobile revenues* (¥bn)27 Japan 5,001.8 5,342.1 5,172.7 5,727.7 5,724.5 5,856.9 6,080.6 2,755.0 2,417.7 2,813.7 2,914.0 1,369.8 1,385.2 1,146.4 1,271.2 1,386.5 1,427.2 1,360.9 1,553.128 N. America 4,548.3 3,964.1 5,970.4 7,152.3 7,692.4 8,130.1 8,477.3 2,610.0 3,360.4 3,496.0 3,656.3 1,371.9 1,238.1 1,301.6 2,058.9 1,818.5 1,677.5 1,838.6 1,817.829 Europe 1,793.9 1,817.9 1,901.1 2,540.5 2,747.3 2,844.9 2,958.3 967.9 933.2 1,249.7 1,290.8 489.4 478.4 494.5 438.7 568.3 681.4 675.6 615.130 Asia 3,280.4 3,284.4 3,940.2 4,289.6 4,335.3 4,642.7 5,085.6 2,014.3 1,925.9 2,199.7 2,090.0 997.7 1,016.6 1,047.2 878.7 1,123.0 1,076.6 1,067.0 1,023.031 Others 3,196.1 3,103.4 3,929.8 4,251.4 4,427.1 4,683.4 5,063.0 2,028.7 1,901.0 2,112.9 2,138.5 1,004.9 1,023.9 1,035.1 865.9 1,030.2 1,082.7 1,059.8 1,078.832 Total 17,820.5 17,511.9 20,914.2 23,961.6 24,926.6 26,158.0 27,664.7 10,375.9 10,538.3 11,872.0 12,089.6 5,233.7 5,142.2 5,024.8 5,513.4 5,926.5 5,945.5 6,001.9 6,087.733 Financial revenues (¥bn) 1,173.2 1,071.7 1,150.0 1,319.9 1,372.9 1,427.8 1,470.7 532.5 617.6 665.5 654.4 267.9 264.6 293.9 323.6 328.8 336.7 327.2 327.234 Consolidated revenues (¥bn)35 Japan 5,325.0 5,662.1 5,502.7 6,082.7 6,079.5 6,211.9 6,435.6 2,915.0 2,587.7 2,988.7 3,094.0 1,449.8 1,465.2 1,231.4 1,356.2 1,471.5 1,517.2 1,450.9 1,643.136 N. America 5,398.3 4,715.8 6,790.5 8,117.2 8,710.3 9,202.9 9,592.9 2,982.4 3,808.0 3,986.5 4,130.7 1,559.7 1,422.7 1,510.5 2,297.5 2,062.3 1,924.2 2,075.8 2,054.937 Europe 1,793.9 1,817.9 1,901.1 2,540.5 2,747.3 2,844.9 2,958.3 967.9 933.2 1,249.7 1,290.8 489.4 478.4 494.5 438.7 568.3 681.4 675.6 615.138 Asia 3,280.4 3,284.4 3,940.2 4,289.6 4,335.3 4,642.7 5,085.6 2,014.3 1,925.9 2,199.7 2,090.0 997.7 1,016.6 1,047.2 878.7 1,123.0 1,076.6 1,067.0 1,023.039 Others 3,196.1 3,103.4 3,929.8 4,251.4 4,427.1 4,683.4 5,063.0 2,028.7 1,901.0 2,112.9 2,138.5 1,004.9 1,023.9 1,035.1 865.9 1,030.2 1,082.7 1,059.8 1,078.840 Total 18,993.7 18,583.7 22,064.2 25,281.4 26,299.5 27,585.8 29,135.4 10,908.4 11,155.8 12,537.5 12,743.9 5,501.6 5,406.8 5,318.8 5,837.1 6,255.3 6,282.2 6,329.1 6,414.9
7203 JP
Initiating Coverage
21 November 2013
page 12 of 26 , Equity Analyst, [email protected] Nakanishi
Please see important disclosure information on pages 23 - 26 of this report.

Chart 18: Toyota Motor (7203): Global Retail Sales and Inventory analysis
Source: Jefferies estimates, company data Note: (1) Jefferies estimates
Full Year FY3/13A FY3/14E FY3/13A FY3/14E('000 units) FY3/11A FY3/12A FY3/13A FY3/14E FY3/15E FY3/16E FY3/17E 1HA 2HA 1HA 2HE 1QA 2QA 3QA 4QA 1QA 2QA 3QE 4QE
1 Retail Sales Units (000 units)2 Japan subtotal 1,406 1,412 1,610 1,607 1,484 1,485 1,510 812 798 752 855 383 428 346 453 353 399 355 5003 (% change YoY) -8% 0% 14% 0% -8% 0% 2% 55% -10% -7% 7% 114% 24% -2% -15% -8% -7% 3% 10%4 US 1,812 1,698 2,125 2,351 2,442 2,540 2,649 1,084 1,041 1,169 1,182 559 525 511 529 579 589 603 5805 Canada 165 167 187 198 208 218 229 107 80 113 84 58 50 44 36 61 53 46 386 Mexico 49 45 56 59 62 63 64 26 30 26 33 15 11 18 12 14 12 16 167 Puerto Rico 26 5 27 30 32 32 33 14 13 12 18 5 9 7 6 6 6 9 98 N. America subtotal 2,053 1,870 2,351 2,618 2,744 2,853 2,975 1,231 1,120 1,301 1,317 637 595 554 566 640 661 674 6439 (% change YoY) -1% -9% 26% 11% 5% 4% 4% 45% 10% 6% 18% 51% 40% 12% 7% 0% 0% 0% 0%
10 W. Europe 592 527 519 540 563 553 570 263 255 268 272 137 126 120 135 135 133 135 13711 Russia 106 139 165 174 165 180 190 93 72 94 80 48 45 40 33 48 46 40 4012 Europe subtotal 812 789 795 831 851 864 898 413 382 422 409 215 198 190 192 212 210 207 20213 (% change YoY) -5% -3% 1% 5% 2% 2% 4% 13% -10% 2% 7% 15% 11% -10% -10% -1% 6% 9% 5%14 China 886 900 826 929 1,022 1,103 1,214 435 391 459 470 232 203 204 187 235 224 235 23515 Taiwan 115 116 120 122 125 125 125 60 60 59 63 31 29 33 27 30 29 35 2916 Thailand 349 318 520 438 416 450 459 259 261 208 230 120 139 135 126 112 96 115 11517 Indonesia 299 325 401 465 465 488 517 200 201 215 250 99 101 103 98 109 106 125 12518 India 83 149 161 153 169 194 223 84 77 73 80 43 41 41 36 37 36 40 4019 Other Asia 260 250 277 282 290 305 320 139 138 137 145 83 56 75 63 72 65 79 6620 Asia subtotal 1,992 2,057 2,305 2,389 2,486 2,664 2,857 1,177 1,128 1,151 1,238 608 569 591 537 595 556 628 61021 (% change YoY) 20% 3% 12% 4% 4% 7% 7% 23% 2% -2% 10% 60% -1% 12% -6% -2% -2% 6% 14%22 Brazil 98 96 133 187 206 227 245 56 77 92 95 25 31 40 37 46 46 45 5023 Argentina 33 34 49 52 56 60 65 25 24 26 26 10 15 12 12 13 13 13 1324 Others 135 152 163 163 171 185 200 79 84 82 81 55 24 47 37 41 41 41 4125 South America subtotal 274 282 344 402 433 472 509 160 184 200 202 90 70 99 85 100 100 98 10326 (% change YoY) 22% 3% 22% 17% 8% 9% 8% 33% 14% 25% 9% 55% 13% 24% 4% 11% 43% -1% 21%27 Australia 217 187 226 234 246 258 258 115 111 114 120 55 60 61 50 60 54 60 6028 Others 31 26 34 41 43 45 47 16 18 17 24 14 2 10 8 8 9 12 1229 Oceania subtotal 247 213 260 275 289 303 305 131 129 131 144 69 62 71 58 68 63 72 7230 (% change YoY) 3% -14% 22% 6% 5% 5% 1% 34% 12% 0% 12% 59% 13% 18% 6% -1% 1% 1% 24%31 Africa subtotal 202 204 250 264 277 291 305 121 129 128 136 59 62 65 64 64 64 68 6832 (% change YoY) 3% 1% 23% 5% 5% 5% 5% 23% 22% 6% 5% 29% 18% 30% 15% 8% 4% 5% 5%33 Middle east subtotal 570 531 721 762 800 840 882 356 365 371 391 175 181 181 184 182 189 194 19734 (% change YoY) 15% -7% 36% 6% 5% 5% 5% 46% 27% 4% 7% 53% 39% 29% 25% 4% 4% 7% 7%35 Global Retail Sales Total 7,556 7,413 8,685 9,147 9,363 9,771 10,242 4,460 4,225 4,455 4,691 2,235 2,225 2,097 2,128 2,214 2,241 2,296 2,39536 (% change YoY) 4% -2% 17% 5% 2% 4% 5% 36% 2% 0% 11% 55% 21% 8% -3% -1% 1% 10% 13%37 Daihatsu/Hino subtotal 829 920 1,007 1,100 1,155 1,213 1,274 456 551 526 575 250 206 248 303 266 260 259 31638 Toyota Group Global Total 8,440 8,333 9,692 10,247 10,518 10,985 11,516 4,916 4,776 4,981 5,266 2,485 2,431 2,345 2,431 2,480 2,501 2,555 2,71139 (% change YoY) 4% -1% 16% 6% 3% 4% 5% 34% 3% 1% 10% 54% 18% 8% -2% 0% 3% 9% 12%40 Global Inventory Analysis41 Global Inventory Units (1) 1,448 1,564 1,800 1,902 1,979 2,092 2,204 1,564 1,764 1,910 1,902 1,604 1,600 1,650 1,800 1,850 1,910 1,886 1,90242 Day Supply (1) 69 76 75 75 76 77 77 63 75 77 73 65 65 71 76 75 77 74 71
7203 JP
Initiating Coverage
21 November 2013
page 13 of 26 , Equity Analyst, [email protected] Nakanishi
Please see important disclosure information on pages 23 - 26 of this report.

Chart 19: Toyota Motor (7203): Global production units and capacity utilization analysis
Source: Jefferies estimates, company data Note: (1) Jefferies estimates
Full Year FY3/13A FY3/14E FY3/13A FY3/14E('000 units) FY3/11A FY3/12A FY3/13A FY3/14E FY3/15E FY3/16E FY3/17E 1HA 2HA 1HA 2HE 1QA 2QA 3QA 4QA 1QA 2QA 3QE 4QE
1 Production Units (000 units)2 US 881 880 1,224 1,309 1,413 1,474 1,505 609 615 656 653 322 287 285 329 352 304 323 3303 Canada (TMMC) 494 421 486 534 562 561 560 257 229 259 275 139 118 121 108 142 117 137 1374 Mexico (TMMMX) 54 50 66 63 50 110 160 28 39 33 30 14 13 14 25 17 16 15 155 N. America subtotal 1,428 1,352 1,776 1,905 2,025 2,146 2,225 894 882 947 958 476 418 421 462 510 437 476 4826 UK 137 124 120 149 120 150 150 45 76 89 60 24 20 32 44 42 48 30 307 France 111 158 184 171 160 160 160 95 89 91 80 57 39 41 48 51 40 40 408 Czech 123 102 70 98 100 100 100 36 34 58 40 19 17 18 17 15 43 20 209 Russia 0 0 0 0 0 30 30 0 0 0 0 0 0 0 0 0 0 0 0
10 Turkey 78 89 65 74 90 120 150 40 25 34 40 21 19 14 11 16 18 20 2011 Europe subtotal 448 472 439 493 470 560 590 216 223 273 220 121 95 105 119 124 149 110 11012 Indonesia 288 324 416 455 480 500 520 199 218 215 240 102 96 109 108 112 103 120 12013 India 84 161 189 165 220 260 310 101 88 85 80 53 49 39 49 37 47 40 4014 Thailand 636 561 885 869 880 950 1,050 438 447 409 460 209 229 225 222 210 199 230 23015 Taiwan 127 155 167 158 160 180 170 82 86 78 80 41 41 45 40 40 38 40 4016 Philippines 30 26 31 36 40 40 40 16 15 18 18 8 8 7 7 7 11 9 917 Malaysia 66 63 71 61 80 80 80 36 35 26 35 19 17 16 19 16 11 18 1818 China 759 821 713 902 1,022 1,103 1,229 409 304 432 470 216 193 128 176 228 205 235 23519 Asia subtotal 2,068 2,185 2,535 2,722 2,967 3,208 3,494 1,314 1,221 1,299 1,423 667 647 582 639 670 630 712 71220 Australia 113 93 99 118 130 130 130 54 46 58 60 25 29 23 23 27 32 30 3021 Brazil/Argentine 120 158 204 260 260 265 320 91 113 125 135 44 48 58 55 64 61 68 6822 South Africa 106 151 149 154 175 180 200 80 69 64 90 40 40 29 40 38 26 45 4523 RoW subtotal 352 406 455 542 615 625 700 228 228 247 295 108 119 109 118 128 119 148 14824 Overseas Production Units 4,297 4,409 5,195 5,634 6,076 6,539 7,009 2,664 2,531 2,738 2,896 1,385 1,279 1,217 1,314 1,412 1,326 1,445 1,45125 (YoY % change) 6% 3% 18% 8% 8% 8% 7% 39% 1% 3% 14% 78% 13% 9% -5% 2% 4% 19% 10%26 Domestic Production Units 3,004 3,120 3,369 3,362 3,254 3,175 3,145 1,737 1,632 1,683 1,679 862 875 749 883 829 853 775 90427 (YoY % change) -6% 4% 8% 0% -3% -2% -1% 41% -13% -3% 3% 110% 6% -15% -12% -4% -2% 3% 2%28 Overseas Production Units 4,297 4,415 0 0 6,076 6,539 7,009 0 0 0 0 0 0 0 0 0 0 0 029 Toyota Global production 7,301 7,529 8,564 9,024 9,330 9,714 10,154 4,401 4,163 4,449 4,575 2,248 2,154 1,966 2,197 2,262 2,188 2,220 2,35530 (YoY % change) 0% 3% 14% 5% 3% 4% 5% 40% -5% 1% 10% 89% 10% -1% -8% 1% 2% 13% 7%31 + Daihatsu/Hino 718 826 931 880 1,059 1,059 1,059 475 456 460 420 308 290 262 319 298 306 266 27432 Group Production 8,018 8,355 9,495 9,905 10,390 10,773 11,213 4,876 4,619 4,909 4,995 2,556 2,443 2,228 2,516 2,559 2,493 2,486 2,63033 (YoY % change) 0% 4% 14% 4% 5% 4% 4% 40% -5% 1% 8% 85% 10% -2% -7% 0% 2% 12% 5%34 Production Capacity (1)35 N. America subtotal 1,580 1,730 1,770 1,800 1,800 1,800 1,800 1,770 1,770 1,800 1,800 1,770 1,770 1,770 1,770 1,800 1,800 1,800 1,80036 Latin. America subtotal 160 160 197 232 232 232 232 197 197 232 232 197 197 197 197 232 232 232 23237 Europe subtotal 870 870 870 870 870 870 870 870 870 870 870 870 870 870 870 870 870 870 87038 Asia subtotal 2,040 2,040 2,480 2,985 3,070 3,170 3,170 2,480 2,480 2,985 2,985 2,480 2,480 2,480 2,480 2,985 2,985 2,985 2,98539 Others subtotal 350 350 350 350 350 350 350 350 350 350 350 350 350 350 350 350 350 350 35040 Total overseas 5,000 5,150 5,667 6,237 6,322 6,422 6,422 5,667 5,667 6,237 6,237 5,667 5,667 5,667 5,667 6,237 6,237 6,237 6,23741 Total Japan 3,800 3,600 3,535 3,435 3,375 3,375 3,375 3,535 3,535 3,435 3,435 3,535 3,535 3,535 3,535 3,435 3,435 3,435 3,43542 Global Total 8,800 8,750 9,202 9,672 9,697 9,797 9,797 9,202 9,202 9,672 9,672 9,202 9,202 9,202 9,202 9,672 9,672 9,672 9,672
7203 JP
Initiating Coverage
21 November 2013
page 14 of 26 , Equity Analyst, [email protected] Nakanishi
Please see important disclosure information on pages 23 - 26 of this report.

Chart 20: Toyota Motor (7203): Business segment analysis
Source: Jefferies estimates, company data
Full Year FY3/13A FY3/14E FY3/13A FY3/14E(¥ bn) FY3/11A FY3/12A FY3/13A FY3/14E FY3/15E FY3/16E FY3/17E 1HA 2HA 1HA 2HE 1QA 2QA 3QA 4QA 1QA 2QA 3QE 4QE
1 Business segment2 Revenues3 Automotive 17,337.3 16,994.5 20,419.1 23,341.8 24,284.5 25,492.9 26,976.4 10,128.9 10,290.2 11,601.3 11,740.5 5,120.1 5,008.7 4,889.2 5,401.0 5,796.1 5,805.1 5,851.7 5,888.94 Financial Services 1,192.2 1,100.3 1,170.7 1,319.9 1,372.9 1,427.8 1,470.7 546.5 624.2 665.5 654.4 274.5 272.0 301.3 322.9 328.8 336.7 327.2 327.25 All Other 972.3 1,048.9 1,066.5 1,119.8 1,142.2 1,165.0 1,188.3 495.9 570.5 520.7 599.0 243.3 252.7 262.1 308.4 255.4 265.3 275.2 323.86 (Intersegment) -508.1 -560.1 -592.0 -500.0 -500.0 -500.0 -500.0 -262.9 -329.1 -250.0 -250.0 -136.3 -126.7 -133.9 -195.2 -125.0 -125.0 -125.0 -125.07 Total 18,993.7 18,583.7 22,064.2 25,281.4 26,299.5 27,585.8 29,135.4 10,908.4 11,155.8 12,537.5 12,743.9 5,501.6 5,406.8 5,318.8 5,837.1 6,255.3 6,282.2 6,329.1 6,414.98 Operating profit9 Automotive 86.0 21.7 944.7 2,137.6 2,202.2 2,264.6 2,400.3 498.1 446.6 1,102.2 1,035.4 258.7 239.4 43.7 402.9 602.1 500.1 504.7 530.7
10 Financial Services 358.3 306.4 315.8 272.4 257.8 275.4 279.7 174.5 141.3 133.3 139.1 86.7 87.8 69.0 72.3 51.3 82.0 69.5 69.511 All Other 35.2 42.1 53.6 40.0 50.0 50.0 50.0 22.5 31.2 20.0 20.0 9.3 13.1 15.4 15.7 10.0 10.0 10.0 10.012 (Intersegment) -11.2 -14.6 6.7 0.0 0.0 0.0 0.0 -1.3 8.0 0.0 0.0 -1.6 0.3 -3.4 11.5 0.0 0.0 0.0 0.013 Total 468.3 355.6 1,320.9 2,450.0 2,510.0 2,590.0 2,730.0 693.8 627.1 1,255.5 1,194.5 353.1 340.6 124.8 502.4 663.4 592.1 584.3 610.214 Assets15 Automotive 11,341.6 12,261.8 13,179.7 19,275.2 20,800.4 22,163.1 23,505.0 11,518.7 16,901.3 18,541.9 19,275.2 -- -- -- -- -- -- -- --16 Financial Services 13,365.4 13,172.5 16,231.5 13,632.7 14,041.7 14,603.4 15,041.5 13,365.4 13,365.4 13,632.7 13,632.7 -- -- -- -- -- -- -- --17 All Other 1,146.7 1,161.2 1,310.1 1,310.1 1,310.1 1,310.1 1,310.1 1,161.2 1,161.2 1,310.1 1,310.1 -- -- -- -- -- -- -- --18 (Intersegment) 3,964.5 4,055.4 4,762.0 4,762.0 4,762.0 4,762.0 4,762.0 4,055.4 4,055.4 4,762.0 4,762.0 -- -- -- -- -- -- -- --19 Total 29,818.2 30,651.0 35,483.3 38,980.0 40,914.2 42,838.5 44,618.6 30,100.7 35,483.3 38,246.7 38,980.0 -- -- -- -- -- -- -- --20 Expenditures21 Automotive 691.9 671.2 823.4 914.2 951.3 970.8 1,195.8 303.5 520.0 409.7 504.5 130.9 172.6 206.5 313.5 194.3 215.5 225.6 278.822 Financial Services 991.3 683.2 1,121.5 1,200.0 850.0 900.0 900.0 500.0 621.5 600.0 600.0 250.0 250.0 300.0 321.5 300.0 300.0 300.0 300.023 All Other 21.1 35.3 29.3 35.0 45.0 45.0 45.0 15.8 13.5 17.5 17.5 8.8 7.0 5.0 8.5 8.8 8.8 8.8 8.824 (Intersegment) 0.0 0.0 0.0 0.0 0.0 0.0 0.0 0.0 0.0 0.0 0.0 0.0 0.0 0.0 0.0 0.0 0.0 0.0 0.025 Total 1,691.2 1,532.1 1,974.2 2,149.2 1,846.3 1,915.8 2,140.8 819.2 1,155.0 1,027.2 1,122.0 389.6 429.6 511.5 643.5 503.0 524.2 534.4 587.626 Mfg. Capex 699.9 848.9 852.7 949.2 996.3 1,015.8 1,240.8 319.2 533.5 427.2 522.0 139.6 179.6 211.5 322.0 203.0 224.2 234.4 287.627 Depreciation28 Automotive 786.7 707.7 704.5 758.6 796.0 826.0 861.0 331.6 372.9 356.7 401.9 161.7 169.9 176.3 196.6 169.5 187.2 196.5 205.429 Financial Services 330.9 298.8 336.5 350.0 360.0 360.0 360.0 175.0 161.5 175.0 175.0 87.5 87.5 87.5 74.0 87.5 87.5 87.5 87.530 All Other 25.6 25.0 22.7 24.0 24.0 24.0 24.0 12.0 10.7 12.0 12.0 6.0 6.0 6.0 4.7 6.0 6.0 6.0 6.031 Total 1,143.2 1,031.5 1,063.7 1,132.6 1,180.0 1,210.0 1,245.0 518.6 545.1 543.7 588.9 255.2 263.4 269.8 275.3 263.0 280.7 290.0 298.932 Mfg. Depreciation 812.3 732.7 727.2 782.6 820.0 850.0 885.0 343.6 383.6 368.7 413.9 167.7 175.9 182.3 201.3 175.5 193.2 202.5 211.433 R&Ds 730.3 779.8 804.7 949.9 980.0 1,030.0 1,090.0 404.7 400.0 476.9 473.0 194.7 210.0 198.6 201.4 244.1 232.8 240.0 233.0
7203 JP
Initiating Coverage
21 November 2013
page 15 of 26 , Equity Analyst, [email protected] Nakanishi
Please see important disclosure information on pages 23 - 26 of this report.

Chart 21: Toyota Motor (7203): Geographical segment analysis
Source: Jefferies estimates, company data
Full Year FY3/13A FY3/14E FY3/13A FY3/14E(¥ bn) FY3/11A FY3/12A FY3/13A FY3/14E FY3/15E FY3/16E FY3/17E 1HA 2HA 1HA 2HE 1QA 2QA 3QA 4QA 1QA 2QA 3QE 4QE
1 Geographical segment2 Revenues3 Japan4 External Customers 6,966.9 7,293.8 7,910.5 8,099.7 8,079.5 8,211.9 8,435.6 4,047.9 3,862.6 4,005.7 4,094.0 2,014.5 2,033.4 1,765.7 2,096.9 1,939.1 2,066.6 1,950.9 2,143.15 Intercompany 4,019.3 3,873.5 4,910.6 5,852.0 5,630.9 5,645.5 5,674.8 2,358.4 2,552.2 2,938.1 2,913.9 1,227.8 1,130.6 1,210.6 1,341.6 1,517.1 1,420.9 1,451.7 1,462.26 Total 10,986.2 11,167.3 12,821.0 13,951.7 13,710.4 13,857.3 14,110.4 6,406.3 6,414.8 6,943.8 7,007.9 3,242.3 3,164.0 2,976.3 3,438.5 3,456.2 3,487.6 3,402.6 3,605.27 North America8 External Customers 5,327.8 4,644.3 6,167.8 8,117.2 8,630.3 9,122.9 9,512.9 2,982.4 3,185.4 3,986.5 4,130.7 1,559.7 1,422.7 1,510.5 1,674.9 2,062.3 1,924.2 2,075.8 2,054.99 Intercompany 101.3 107.5 116.6 161.5 80.0 80.0 80.0 61.3 55.3 81.5 80.0 33.1 28.2 14.5 40.8 42.9 38.6 40.0 40.0
10 Total 5,429.1 4,751.9 6,284.4 8,278.6 8,710.3 9,202.9 9,592.9 3,043.7 3,240.7 4,068.0 4,210.7 1,592.8 1,450.9 1,525.0 1,715.7 2,105.1 1,962.8 2,115.8 2,094.911 Europe12 External Customers 1,920.4 1,917.4 2,003.1 2,540.5 2,747.3 2,844.9 2,958.3 967.9 1,035.2 1,249.7 1,290.8 489.4 478.4 494.5 540.7 568.3 681.4 675.6 615.113 Intercompany 61.1 76.5 80.0 103.3 45.0 45.0 45.0 41.7 38.3 53.3 50.0 22.6 19.1 13.9 24.4 27.7 25.6 25.0 25.014 Total 1,981.5 1,993.9 2,083.1 2,643.8 2,792.3 2,889.9 3,003.3 1,009.6 1,073.5 1,303.0 1,340.8 512.0 497.6 508.4 565.1 596.0 707.0 700.6 640.115 Asia16 External Customers 3,138.1 3,116.8 4,058.6 4,289.6 4,335.3 4,642.7 5,085.6 2,014.3 2,044.3 2,199.7 2,090.0 997.7 1,016.6 1,047.2 997.1 1,123.0 1,076.6 1,067.0 1,023.017 Intercompany 236.4 217.4 326.8 350.2 350.2 350.2 350.2 147.6 179.2 200.2 150.0 76.0 71.6 65.4 113.9 95.1 105.2 75.0 75.018 Total 3,374.5 3,334.3 4,385.5 4,639.9 4,685.6 4,993.0 5,435.8 2,161.9 2,223.6 2,399.9 2,240.0 1,073.7 1,088.3 1,112.6 1,111.0 1,218.1 1,181.8 1,142.0 1,098.019 Others20 External Customers 1,640.4 1,611.2 1,924.2 2,394.4 2,747.1 3,003.4 3,383.0 895.8 1,028.3 1,095.9 1,298.5 440.2 455.7 500.9 527.5 562.7 533.2 639.8 658.821 Intercompany 168.7 148.9 170.1 176.3 176.3 176.3 176.3 88.5 81.6 96.3 80.0 43.3 45.2 29.5 52.1 46.3 49.9 40.0 40.022 Total 1,809.1 1,760.2 2,094.3 2,570.7 2,923.4 3,179.7 3,559.3 984.4 1,109.9 1,192.2 1,378.5 483.5 500.9 530.3 579.6 609.0 583.2 679.8 698.823 Elimination -4,586.8 -4,423.9 -5,604.1 -6,803.3 -6,522.5 -6,537.0 -6,566.3 -2,697.5 -2,906.6 -3,369.4 -3,433.9 -1,402.7 -1,294.8 -1,333.8 -1,572.8 -1,729.1 -1,640.3 -1,711.7 -1,722.224 Consolidated Total 18,993.7 18,583.7 22,064.2 25,281.4 26,299.5 27,585.8 29,135.4 10,908.4 11,155.8 12,537.5 12,743.9 5,501.6 5,406.8 5,318.8 5,837.1 6,255.3 6,282.2 6,329.1 6,414.925 Operating profit26 Japan -362.4 -207.0 576.3 1,464.3 1,263.8 1,249.4 1,281.7 250.8 325.5 830.0 634.3 107.1 143.7 15.7 309.8 456.1 374.0 308.2 326.127 North America 339.5 186.4 221.9 429.6 609.7 671.8 719.5 182.6 39.3 162.3 267.3 117.6 65.0 -17.1 56.4 82.7 79.6 131.2 136.228 Europe 13.1 17.8 26.5 44.2 50.3 57.8 78.1 12.1 14.4 25.4 18.8 3.4 8.7 9.3 5.2 5.3 20.1 10.5 8.329 Asia 313.0 256.8 376.1 388.9 418.6 439.1 466.2 194.5 181.5 195.6 193.2 101.6 92.9 91.8 89.7 104.2 91.5 96.6 96.630 Others 160.1 108.8 133.7 157.0 167.6 171.9 184.5 58.7 75.0 76.1 80.8 27.2 31.5 32.3 42.7 42.5 33.6 37.8 43.031 Asia/Other -- -- -- -- -- -- -- -- -- -- -- -- -- -- -- -- -- -- --32 Elimination 4.9 -7.1 -13.6 -34.1 0.0 0.0 0.0 -5.0 -8.7 -34.1 0.0 -3.8 -1.2 -7.2 -1.5 -27.3 -6.7 0.0 0.033 Consolidated Total 468.3 355.6 1,320.9 2,450.0 2,510.0 2,590.0 2,730.0 693.8 627.1 1,255.5 1,194.5 353.1 340.6 124.8 502.4 663.4 592.1 584.3 610.234 Operating margin (%)35 Japan -3.3% -1.9% 4.5% 10.5% 9.2% 9.0% 9.1% 3.9% 5.1% 12.0% 9.1% 3.3% 4.5% 0.5% 9.0% 13.2% 10.7% 9.1% 9.0%36 North America 6.3% 3.9% 3.5% 5.2% 7.0% 7.3% 7.5% 6.0% 1.2% 4.0% 6.3% 7.4% 4.5% -1.1% 3.3% 3.9% 4.1% 6.2% 6.5%37 Europe 0.7% 0.9% 1.3% 1.7% 1.8% 2.0% 2.6% 1.2% 1.3% 2.0% 1.4% 0.7% 1.7% 1.8% 0.9% 0.9% 2.8% 1.5% 1.3%38 Asia 9.3% 7.7% 8.6% 8.4% 8.9% 8.8% 8.6% 9.0% 8.2% 8.2% 8.6% 9.5% 8.5% 8.2% 8.1% 8.6% 7.7% 8.5% 8.8%39 Others 8.9% 6.2% 6.4% 6.1% 5.7% 5.4% 5.2% 6.0% 6.8% 6.4% 5.9% 5.6% 6.3% 6.1% 7.4% 7.0% 5.8% 5.6% 6.2%40 Asia/Other -- -- -- -- -- -- -- -- -- -- -- -- -- -- -- -- -- -- --41 Consolidated Total 2.5% 1.9% 6.0% 9.7% 9.5% 9.4% 9.4% 6.4% 5.6% 10.0% 9.4% 6.4% 6.3% 2.3% 8.6% 10.6% 9.4% 9.2% 9.5%
7203 JP
Initiating Coverage
21 November 2013
page 16 of 26 , Equity Analyst, [email protected] Nakanishi
Please see important disclosure information on pages 23 - 26 of this report.

Chart 22: Toyota Motor (7203): Balance sheet
Source: Jefferies estimates, company data
Full Year FY3/13A FY3/14E FY3/13A FY3/14E(¥ bn) FY3/11A FY3/12A FY3/13A FY3/14E FY3/15E FY3/16E FY3/17E 1HA 2HA 1HA 2HE 1QA 2QA 3QA 4QA 1QA 2QA 3QE 4QE
1 Current Assets :2 Cash & Equivalents 2,080.7 1,679.2 1,718.3 1,532.2 1,894.7 2,189.3 2,299.2 1,665.4 1,718.3 1,743.3 1,532.2 1,728.3 1,665.4 1,241.5 1,718.3 1,526.3 1,743.3 1,375.1 1,532.23 Time Deposits 203.9 80.3 106.7 129.1 129.1 129.1 129.1 111.8 106.7 129.1 129.1 75.4 111.8 124.1 106.7 97.6 129.1 129.1 129.14 Marketable Securities 1,225.4 1,181.1 1,445.7 2,005.3 2,005.3 2,005.3 2,005.3 1,287.5 1,445.7 2,005.3 2,005.3 1,254.8 1,287.5 1,404.1 1,445.7 2,007.9 2,005.3 2,005.3 2,005.35 A/R 1,449.2 1,999.8 1,971.7 1,968.4 2,161.6 2,267.3 2,394.7 1,697.1 1,971.7 1,788.7 1,968.4 1,770.5 1,697.1 1,568.1 1,971.7 1,838.8 1,788.7 1,942.1 1,968.46 Fin. Subs Receivables 4,136.8 4,114.9 5,117.7 5,300.8 5,300.8 5,300.8 5,300.8 4,181.5 5,117.7 5,300.8 5,300.8 4,124.1 4,181.5 4,725.2 5,117.7 5,335.7 5,300.8 5,300.8 5,300.87 Other Receivables 306.2 408.5 432.7 340.8 340.8 340.8 340.8 330.5 432.7 340.8 340.8 314.6 330.5 338.6 432.7 338.2 340.8 340.8 340.88 Inventories 1,304.2 1,622.3 1,715.8 1,984.8 2,041.4 2,139.1 2,322.0 1,567.0 1,715.8 1,885.4 1,984.8 1,625.8 1,567.0 1,623.8 1,715.8 1,863.0 1,885.4 1,971.8 1,984.89 Deferred profit Taxes 605.9 718.7 749.4 760.7 760.7 760.7 760.7 665.4 749.4 760.7 760.7 707.2 665.4 681.8 749.4 784.2 760.7 760.7 760.7
10 Prepaid Expenses/Others 517.5 516.4 527.0 651.2 691.4 788.1 763.0 455.2 527.0 628.2 651.2 506.8 455.2 546.4 527.0 578.2 628.2 707.1 651.211 Total Current Accounts 11,829.8 12,321.2 13,784.9 14,673.3 15,325.8 15,920.5 16,315.6 11,961.4 13,784.9 14,582.3 14,673.3 12,107.6 11,961.4 12,253.6 13,784.9 14,370.1 14,582.3 14,532.8 14,673.312 Finance Sub Receivables 5,556.7 5,602.5 6,943.8 7,549.5 7,549.5 7,549.5 7,549.5 5,539.7 6,943.8 7,549.5 7,549.5 5,432.1 5,539.7 6,315.8 6,943.8 7,302.1 7,549.5 7,549.5 7,549.513 Investment and Others 6,122.5 6,491.9 7,903.4 8,962.5 8,962.5 8,962.5 8,962.5 6,565.5 7,903.4 8,962.5 8,962.5 6,424.1 6,565.5 7,186.5 7,903.4 8,439.3 8,962.5 8,962.5 8,962.514 P, P, E 6,309.2 6,235.4 6,851.2 7,794.7 9,076.4 10,406.0 11,791.0 6,034.1 6,851.2 7,152.4 7,794.7 6,066.0 6,034.1 6,401.2 6,851.2 7,056.8 7,152.4 7,458.3 7,794.715 Total Assets 29,818.2 30,651.0 35,483.3 38,980.0 40,914.2 42,838.5 44,618.6 30,100.7 35,483.3 38,246.7 38,980.0 30,029.8 30,100.7 32,157.0 35,483.3 37,168.3 38,246.7 38,503.0 38,980.016 Short-term Borrowings 5,951.8 5,963.3 6,794.0 7,273.9 7,573.9 7,873.9 8,073.9 5,850.5 6,794.0 7,073.9 7,273.9 5,941.4 5,850.5 6,473.3 6,794.0 6,802.6 7,073.9 7,173.9 7,273.917 A/P 1,503.1 2,242.6 2,113.8 1,871.4 2,158.0 2,261.3 2,386.5 1,890.0 2,113.8 2,071.9 1,871.4 2,036.1 1,890.0 1,711.5 2,113.8 2,033.3 2,071.9 1,915.5 1,871.418 Other Current Liabilities 3,336.1 3,575.7 4,004.8 4,227.8 4,268.1 4,364.8 4,339.7 3,499.1 4,004.8 4,227.4 4,227.8 3,526.2 3,499.1 3,696.7 4,004.8 4,202.3 4,227.4 4,283.8 4,227.819 Total Current Liabilities 10,791.0 11,781.6 12,912.5 13,373.1 14,000.0 14,500.0 14,800.0 11,239.6 12,912.5 13,373.1 13,373.1 11,503.7 11,239.6 11,881.5 12,912.5 13,038.2 13,373.1 13,373.1 13,373.120 Long-term Debts 6,449.2 6,042.3 7,337.8 8,327.8 8,627.8 9,027.8 9,427.8 5,874.8 7,337.8 8,127.8 8,327.8 5,785.2 5,874.8 6,423.6 7,337.8 7,911.2 8,127.8 8,227.8 8,327.821 Pension and Severance 668.0 708.4 766.1 792.4 812.4 832.4 852.4 714.8 766.1 782.4 792.4 705.7 714.8 729.4 766.1 774.8 782.4 787.4 792.422 Deferred profit Taxes 810.1 908.9 1,385.9 1,586.6 1,586.6 1,586.6 1,586.6 872.0 1,385.9 1,586.6 1,586.6 874.2 872.0 1,030.2 1,385.9 1,555.5 1,586.6 1,586.6 1,586.623 Other Long-term liabilities 179.8 143.4 308.1 371.8 371.8 371.8 371.8 134.2 308.1 361.8 371.8 133.2 134.2 276.3 308.1 337.9 361.8 366.8 371.824 Total Long-term Liabilities 8,107.2 7,802.9 9,797.9 11,078.5 11,398.5 11,818.5 12,238.5 7,595.8 9,797.9 10,858.5 11,078.5 7,498.5 7,595.8 8,459.5 9,797.9 10,579.4 10,858.5 10,968.5 11,078.525 Minority Interest 587.7 516.2 624.8 645.0 645.0 645.0 645.0 526.4 624.8 645.0 645.0 517.3 526.4 554.2 624.8 653.2 645.0 645.0 645.026 Shareholders' Equity 10,920.0 11,066.5 12,772.9 14,528.3 15,515.6 16,520.0 17,580.1 11,265.3 12,772.9 14,015.0 14,528.3 11,027.6 11,265.3 11,816.0 12,772.9 13,550.7 14,015.0 14,161.4 14,528.327 Total Liabilities and Equity 29,818.2 30,651.0 35,483.3 38,980.0 40,914.2 42,838.5 44,618.6 30,100.7 35,483.3 38,246.7 38,980.0 30,029.8 30,100.7 32,157.0 35,483.3 37,168.3 38,246.7 38,503.0 38,980.028 BPS (¥) 3,295 3,332 3,835 4,383 4,695 5,012 5,347 3,391 3,835 4,221 4,383 3,319 3,391 3,556 3,835 4,072 4,221 4,267 4,383
7203 JP
Initiating Coverage
21 November 2013
page 17 of 26 , Equity Analyst, [email protected] Nakanishi
Please see important disclosure information on pages 23 - 26 of this report.

Chart 23: Toyota Motor (7203): Mfg. Business segment balance sheet
Source: Jefferies estimates, company data
Full Year FY3/13A FY3/14E FY3/13A FY3/14E(¥ bn) FY3/11A FY3/12A FY3/13A FY3/14E FY3/15E FY3/16E FY3/17E 1HA 2HA 1HA 2HE 1QA 2QA 3QA 4QA 1QA 2QA 3QE 4QEManufacturing Businesses
1 Cash & Equivalents 1,300.6 1,104.6 1,107.4 1,445.4 2,036.3 2,406.3 2,554.1 -- -- -- -- -- -- -- -- -- -- -- --2 Time Deposits 0.0 0.0 0.0 0.0 0.0 0.0 0.0 -- -- -- -- -- -- -- -- -- -- -- --3 Marketable Securities 1,036.6 1,015.6 1,204.4 904.4 904.4 904.4 904.4 -- -- -- -- -- -- -- -- -- -- -- --4 A/R 1,483.6 2,031.5 2,033.8 2,030.6 2,223.8 2,329.5 2,456.9 -- -- -- -- -- -- -- -- -- -- -- --5 Inventories 1,304.1 1,622.2 1,715.6 1,984.7 2,041.2 2,138.9 2,321.8 -- -- -- -- -- -- -- -- -- -- -- --6 Prepaid Expenses/Others 1,383.6 1,464.1 1,597.5 1,597.5 1,597.5 1,597.5 1,597.5 -- -- -- -- -- -- -- -- -- -- -- --7 Total Current Accounts 6,508.4 7,238.0 7,658.8 7,962.7 8,803.3 9,376.6 9,834.8 -- -- -- -- -- -- -- -- -- -- -- --8 Investment and Others 5,826.0 6,218.4 7,462.8 7,862.8 7,962.8 8,162.8 8,362.8 -- -- -- -- -- -- -- -- -- -- -- --9 PPE 4,608.3 4,510.7 4,741.4 4,907.9 5,084.2 5,249.9 5,605.7 -- -- -- -- -- -- -- -- -- -- -- --
10 Total Manufacturing Assets 16,942.7 17,967.1 19,863.0 20,733.3 21,850.2 22,789.3 23,803.2 -- -- -- -- -- -- -- -- -- -- -- --11 Total Fin. Services Assets 13,365.4 13,172.5 16,231.5 18,246.7 19,064.0 20,049.2 20,815.4 -- -- -- -- -- -- -- -- -- -- -- --12 Eliminations -489.9 -488.7 -611.1 0.0 0.0 0.0 0.0 -- -- -- -- -- -- -- -- -- -- -- --13 Total Assets 29,818.2 30,651.0 35,483.3 38,980.0 40,914.2 42,838.5 44,618.6 -- -- -- -- -- -- -- -- -- -- -- --14 Short-term Borrowings 478.6 715.0 576.7 576.7 576.7 576.7 576.7 -- -- -- -- -- -- -- -- -- -- -- --15 Current Portion of L/T Debt 243.8 339.4 185.6 185.6 185.6 185.6 185.6 -- -- -- -- -- -- -- -- -- -- -- --16 A/P 1,497.3 2,234.3 2,092.7 1,850.4 2,137.0 2,240.2 2,365.4 -- -- -- -- -- -- -- -- -- -- -- --17 Accrued Expenses 1,666.7 1,737.5 2,092.1 2,092.1 2,092.1 2,092.1 2,092.1 -- -- -- -- -- -- -- -- -- -- -- --18 Tax Payable 104.4 123.3 140.9 346.1 346.1 346.1 346.1 -- -- -- -- -- -- -- -- -- -- -- --19 Other Current Liabilities 1,024.7 1,175.8 1,186.9 1,049.2 962.5 959.3 734.1 -- -- -- -- -- -- -- -- -- -- -- --20 Total Current Liabilities 5,015.5 6,325.4 6,274.9 6,100.0 6,300.0 6,400.0 6,300.0 -- -- -- -- -- -- -- -- -- -- -- --21 Long-term Debts 839.6 503.1 521.4 421.4 421.4 421.4 421.4 -- -- -- -- -- -- -- -- -- -- -- --22 Pension and Severance 660.9 700.2 754.4 775.2 795.2 815.2 835.2 -- -- -- -- -- -- -- -- -- -- -- --23 Other Long-term liabilities 554.4 532.0 969.7 996.8 996.8 996.8 996.8 -- -- -- -- -- -- -- -- -- -- -- --24 Total Long-term Liabilities 2,054.9 1,735.3 2,245.5 2,193.4 2,213.4 2,233.4 2,253.4 -- -- -- -- -- -- -- -- -- -- -- --25 Total Manufacturing Liabilities 7,070.4 8,060.7 8,520.4 8,293.4 8,513.4 8,633.4 8,553.4 -- -- -- -- -- -- -- -- -- -- -- --26 Total Fin. Services Liabilities 12,317.6 12,012.5 14,803.8 16,158.2 16,885.1 17,685.1 18,485.1 -- -- -- -- -- -- -- -- -- -- -- --27 Eliminations -490.0 -488.7 -613.7 -645.0 -645.0 -645.0 -645.0 -- -- -- -- -- -- -- -- -- -- -- --28 Minority Interest 587.7 516.2 624.8 645.0 645.0 645.0 645.0 -- -- -- -- -- -- -- -- -- -- -- --29 Shareholders' Equity 10,332.4 10,550.3 12,148.0 14,528.3 15,515.6 16,520.0 17,580.1 -- -- -- -- -- -- -- -- -- -- -- --30 Total Liabilities and Equity 29,818.2 30,651.0 35,483.3 38,980.0 40,914.2 42,838.5 44,618.6 -- -- -- -- -- -- -- -- -- -- -- --31 Analysis of Mfg. Cash32 Cash and cash equivalent 1,300.6 1,104.6 1,107.4 1,445.4 2,036.3 2,406.3 2,554.1 -- -- -- -- -- -- -- -- -- -- -- --33 Securities 1,036.6 1,015.6 1,204.4 904.4 904.4 904.4 904.4 -- -- -- -- -- -- -- -- -- -- -- --34 Other liquidity assets 2,606.3 2,847.8 3,571.2 3,749.8 3,749.8 3,749.8 3,749.8 -- -- -- -- -- -- -- -- -- -- -- --35 Total liquidity on hand 4,943.4 4,968.1 5,883.1 6,099.7 6,690.5 7,060.5 7,208.4 -- -- -- -- -- -- -- -- -- -- -- --36 Mfg. debts37 Short-term debts 722.5 1,054.5 762.3 762.3 762.3 762.3 762.3 -- -- -- -- -- -- -- -- -- -- -- --38 Long-term debts 839.6 503.1 521.4 421.4 421.4 421.4 421.4 -- -- -- -- -- -- -- -- -- -- -- --39 Total mfg. debts 1,562.1 1,557.5 1,283.7 1,183.7 1,183.7 1,183.7 1,183.7 -- -- -- -- -- -- -- -- -- -- -- --40 Mfg. net debt (cash) -3,381.3 -3,410.6 -4,599.4 -4,916.0 -5,506.8 -5,876.8 -6,024.7 -- -- -- -- -- -- -- -- -- -- -- --41 Dividends payout ratio 38% 55% 30% 29% 30% 30% 30% -- -- -- -- -- -- -- -- -- -- -- --42 Dividends paid(¥bn) 141.1 156.8 190.0 414.2 538.4 570.0 601.7 -- -- -- -- -- -- -- -- -- -- -- --
7203 JP
Initiating Coverage
21 November 2013
page 18 of 26 , Equity Analyst, [email protected] Nakanishi
Please see important disclosure information on pages 23 - 26 of this report.

Chart 24: Toyota Motor (7203): US GAAP cash flow analysis
Source: Jefferies estimates, company data
Full Year FY3/13A FY3/14E FY3/13A FY3/14E(¥ bn) FY3/11A FY3/12A FY3/13A FY3/14E FY3/15E FY3/16E FY3/17E 1HA 2HA 1HA 2HE 1QA 2QA 3QA 4QA 1QA 2QA 3QE 4QE
1 Operating Activities :2 Net profit 465.5 368.3 1,083.5 1,898.1 1,818.0 1,889.0 1,994.0 607.5 475.9 1,065.1 833.0 321.6 285.9 122.1 353.9 604.0 461.2 407.0 426.03 Depreciation 1,175.6 1,067.8 1,105.1 1,184.1 1,180.0 1,210.0 1,245.0 513.0 592.1 595.2 588.9 253.1 259.9 285.9 306.2 287.7 307.5 290.0 298.94 Prov. for Doubtful accounts 4.1 9.6 27.4 27.1 0.0 0.0 0.0 3.8 23.6 17.1 10.0 6.9 -3.1 12.0 11.6 8.2 8.9 5.0 5.05 Pension costs -23.4 16.7 -20.4 20.9 20.0 20.0 20.0 12.2 -32.6 10.9 10.0 4.6 7.6 -0.9 -31.8 3.7 7.1 5.0 5.06 Disposal of Fixed Assets 36.2 33.5 32.2 12.9 0.0 0.0 0.0 17.9 14.3 12.9 0.0 6.0 12.0 8.1 6.1 5.6 7.3 0.0 0.07 Unrealized Losses 7.9 53.8 2.1 3.9 0.0 0.0 0.0 0.2 1.9 3.9 0.0 0.0 0.2 1.9 0.0 2.5 1.4 0.0 0.08 Deferred profit Taxes 85.7 6.4 160.0 5.1 0.0 0.0 0.0 42.8 117.2 5.1 0.0 5.7 37.1 3.3 113.9 -19.4 24.5 0.0 0.09 Minority Interest 0.0 0.0 0.0 0.0 0.0 0.0 0.0 0.0 0.0 0.0 0.0 0.0 0.0 0.0 0.0 0.0 0.0 0.0 0.0
10 Equity profit -215.0 -197.7 -231.5 -276.9 -292.3 -314.6 -332.3 -123.9 -107.7 -158.8 -118.1 -71.3 -52.5 -58.2 -49.5 -89.9 -68.9 -59.0 -59.011 Changes in working capital 487.4 93.9 293.0 -63.9 36.9 -100.1 -185.1 165.9 127.1 415.6 -479.5 176.0 -10.1 132.4 -5.4 227.0 188.6 -396.1 -83.412 Other 0.0 0.0 0.0 0.0 0.0 0.0 0.0 0.0 0.0 0.0 0.0 0.0 0.0 0.0 0.0 0.0 0.0 0.0 0.013 Cash Provided by Operations 2,024.0 1,452.4 2,451.3 2,811.4 2,762.5 2,704.3 2,741.7 1,239.5 1,211.8 1,967.1 844.3 702.7 536.9 506.7 705.1 1,029.3 937.8 251.8 592.414 Investing Activities :15 Finance Receivables -8,438.8 -8,333.2 -10,005.9 -12,115.9 -12,115.9 -12,115.9 -12,115.9 -4,833.2 -5,172.8 -6,115.9 -6,000.0 -2,424.2 -2,408.9 -2,512.8 -2,660.0 -3,015.5 -3,100.4 -3,000.0 -3,000.016 Proceeds from Fin. receivables 8,003.9 8,061.7 9,102.9 11,497.0 12,115.9 12,115.9 12,115.9 4,356.4 4,746.5 5,497.0 6,000.0 2,182.3 2,174.0 2,208.5 2,538.0 2,722.2 2,774.8 3,000.0 3,000.017 CAPEX -629.3 -723.5 -854.6 -976.5 -996.3 -1,015.8 -1,240.8 -351.5 -503.1 -454.6 -522.0 -183.3 -168.2 -217.0 -286.0 -239.4 -215.1 -234.4 -287.618 Lease Assets -1,061.9 -808.5 -1,119.6 -1,561.7 -1,465.4 -1,523.8 -1,389.3 -491.0 -628.5 -852.4 -709.3 -255.8 -235.3 -283.0 -345.5 -403.8 -448.5 -361.5 -347.819 Other 9.7 361.0 -151.1 -621.1 0.0 0.0 0.0 -41.8 -109.3 -621.1 0.0 -19.1 -22.6 -187.5 78.2 -372.8 -248.3 0.0 0.020 Net Cash Used for Investing -2,116.3 -1,442.7 -3,028.3 -3,778.3 -2,461.7 -2,539.6 -2,630.0 -1,361.1 -1,667.2 -2,547.0 -1,231.3 -700.1 -661.0 -991.9 -675.3 -1,309.4 -1,237.6 -595.9 -635.421 Financing Activities22 Stock Buy Back -28.6 -37.4 -43.1 -38.1 0.0 0.0 0.0 -27.5 -15.6 -38.1 0.0 -16.8 -10.7 -16.7 1.1 -18.9 -19.2 0.0 0.023 Long-term Debts 2,931.4 2,394.8 3,191.2 2,293.2 500.0 600.0 600.0 1,434.7 1,756.6 1,993.2 300.0 601.6 833.0 598.8 1,157.7 1,127.4 865.8 150.0 150.024 Payment of Long-term Debts -2,489.6 -2,867.6 -2,682.1 -1,717.5 -200.0 -200.0 -200.0 -1,566.5 -1,115.6 -1,617.5 -100.0 -664.5 -902.0 -498.4 -617.2 -821.7 -795.8 -50.0 -50.025 Incr. (decr.) in S/T Debts 162.3 311.7 201.3 626.9 300.0 300.0 200.0 422.8 -221.5 426.9 200.0 271.4 151.4 -11.4 -210.1 -43.0 469.9 100.0 100.026 Dividend Paid -141.1 -156.8 -190.0 -414.2 -538.4 -570.0 -601.7 -95.0 -95.0 -190.0 -224.1 -95.0 0.0 -95.0 0.0 -190.0 0.0 -224.1 0.027 Other 0.0 0.0 0.0 0.0 0.0 0.0 0.0 0.0 0.0 0.0 0.0 0.0 0.0 0.0 0.0 0.0 0.0 0.0 0.028 Cash Provided by Financing 434.3 -355.3 477.2 750.4 61.6 130.0 -1.7 168.4 308.9 574.5 175.9 96.7 71.7 -22.7 331.5 53.8 520.8 -24.1 200.029 Effect of Exchange Rates -127.0 -55.9 137.9 30.4 0.0 0.0 0.0 -60.6 198.4 30.4 0.0 -50.2 -10.4 83.9 114.5 34.2 -3.8 0.0 0.030 Net Change in Cash/Cash Equivalen 215.0 -401.5 38.1 -186.1 362.5 294.6 109.9 -13.8 51.9 25.0 -211.1 49.1 -62.9 -423.9 475.8 -192.0 217.0 -368.2 157.131 Beginning Cash 1,865.7 2,080.7 1,679.2 1,718.3 1,532.2 1,894.7 2,189.3 1,679.2 1,665.4 1,718.3 1,743.3 1,679.2 1,728.3 1,665.4 1,241.5 1,718.3 1,526.3 1,743.3 1,375.132 Ending Cash 2,080.7 1,679.2 1,718.3 1,532.2 1,894.7 2,189.3 2,299.2 1,665.4 1,717.3 1,743.3 1,532.2 1,728.3 1,665.4 1,241.5 1,718.3 1,526.3 1,743.3 1,375.1 1,532.2
7203 JP
Initiating Coverage
21 November 2013
page 19 of 26 , Equity Analyst, [email protected] Nakanishi
Please see important disclosure information on pages 23 - 26 of this report.

Chart 25: Toyota Motor (7203): N. American supply/demand model
Source: Jefferies estimates, company data
Full Year FY3/13A FY3/14E FY3/13A FY3/14E('000 units) FY3/11A FY3/12A FY3/13A FY3/14E FY3/15E FY3/16E FY3/17E 1HA 2HA 1HA 2HE 1QA 2QA 3QA 4QA 1QA 2QA 3QE 4QE
1 US Lt. vehicle demand ('000) 11,588 12,778 14,491 15,571 16,000 16,300 16,500 14,278 15,049 15,713 15,700 14,093 14,463 14,841 15,257 15,396 16,030 15,600 15,8002 Toyota US market shares (% ) 15.2% 12.9% 14.4% 14.8% 15.3% 15.6% 16.1% 15.2% 13.8% 14.9% 15.1% 15.9% 14.5% 13.8% 13.9% 15.1% 14.7% 15.4% 14.7%3 Sales units4 Yaris/Echoe (import) 34 36 28 24 25 26 30 14 14 12 12 10 4 7 7 5 7 6 65 Corolla/Matrix 223 179 292 319 347 365 372 151 141 145 173 81 70 68 73 79 67 84 906 Corolla (import) 56 53 11 8 0 0 0 4 7 8 0 3 1 0 7 0 8 0 07 Camry/Solara 333 334 400 435 448 462 466 209 191 218 217 108 101 90 101 107 111 115 1029 Avalon 30 32 37 71 64 66 68 12 25 36 35 7 5 8 18 20 16 18 18
10 Prius (import) 155 150 137 162 162 195 201 71 65 82 80 37 34 30 35 42 40 40 4011 Prius PHV(import) 0 0 15 12 10 15 20 8 7 6 6 4 3 5 2 2 4 3 312 Prius V (import) 0 4 38 44 50 40 40 21 17 20 24 12 9 8 9 10 10 12 1213 Prius C (import) 0 0 42 47 45 40 40 22 19 23 24 13 10 10 10 11 13 12 1214 Venza 43 39 46 44 48 51 56 23 23 18 26 11 12 12 11 10 9 13 1315 Lexus RX330 (Canada-blt.) 82 69 87 90 102 110 119 43 44 47 43 23 20 25 19 22 25 22 2116 Lexus imports (import) 145 131 165 181 194 204 214 79 86 88 94 36 43 48 38 40 48 53 4117 4Runner (import) 48 42 52 52 53 53 54 25 27 24 28 12 13 13 13 12 12 14 1418 Rav4 86 132 173 219 227 234 245 94 79 119 100 50 45 38 41 60 59 50 5019 Rav4 (import) 84 0 0 0 0 0 0 0 0 0 0 0 0 0 0 0 0 0 020 Sienna 110 110 120 124 124 124 124 63 57 65 58 35 28 28 29 34 32 28 3021 Tacoma pickup 107 118 149 165 169 166 171 71 78 82 83 35 36 38 39 42 41 42 4122 Tundra 94 83 105 115 124 135 147 55 50 58 56 25 30 27 24 28 30 29 2723 Sequoia 14 13 13 14 15 16 18 6 7 7 7 3 3 4 3 3 3 4 324 Highlander 98 101 125 135 155 158 170 64 60 65 70 31 33 31 30 32 33 35 3425 Scion series (import) 38 47 75 74 78 32 40 41 33 38 37 20 21 17 16 19 19 19 1826 Mexico-make Yaris 0 0 0 0 0 45 50 0 0 0 0 0 0 0 0 0 0 0 027 FJ Cruiser (import) 15 13 14 13 0 0 0 7 7 6 7 3 4 4 3 3 3 4 428 Others (import) 12 6 3 3 3 4 4 2 2 1 2 1 1 1 1 1 1 1 129 US dealer sales 1,812 1,698 2,125 2,351 2,442 2,540 2,649 1,084 1,041 1,169 1,182 559 525 511 529 579 589 603 58030 YoY (% ) 0.9% -6.3% 25.1% 10.7% 3.9% 4.0% 4.3% 42.5% 11.0% 7.8% 13.6% 47.5% 37.6% 13.5% 8.7% 3.7% 12.2% 17.9% 9.5%31 Canada dealer sales 165 167 188 198 208 218 229 108 80 113 84 58 50 44 36 61 53 46 3832 Mexican dealer sales 48 45 56 59 62 63 64 26 30 26 33 15 11 18 12 14 12 16 1633 Puerto Rico dealer sales 26 5 27 30 32 32 33 14 13 12 18 5 9 7 6 6 6 9 934 N. American dealer sales 2,051 1,914 2,396 2,638 2,744 2,853 2,975 1,232 1,164 1,321 1,317 637 595 580 584 660 661 674 64335 Adjustment/inventory chg. -20 -42 73 27 10 0 0 29 44 -23 50 26 3 25 19 29 -51 20 3036 Cons. N. American sales 2,031 1,872 2,469 2,665 2,754 2,853 2,975 1,261 1,208 1,298 1,367 662 598 605 603 689 609 694 67337 TMMA total 351 367 475 519 555 545 558 237 237 265 255 128 110 101 136 137 127 125 13038 TMMC total 494 409 486 534 562 561 560 257 229 259 275 139 118 121 108 142 117 137 13739 TMMI total 265 256 298 307 321 325 330 145 153 155 151 75 70 74 79 81 75 75 7740 TMMTX total 175 150 209 234 236 254 267 108 101 114 120 57 52 53 47 63 51 60 6041 TMMMS total 0 23 151 150 200 250 250 73 77 73 77 38 35 35 42 45 28 39 3942 TMM Baja total 54 47 66 63 50 110 160 28 39 33 30 14 13 14 25 17 16 15 1543 SIA (Subaru subsidiary) 90 90 90 99 100 100 100 44 46 49 50 24 20 22 24 26 23 25 2544 N. American production 1,748 1,342 1,775 1,905 2,025 2,146 2,225 893 882 947 958 475 418 421 462 510 437 476 482
7203 JP
Initiating Coverage
21 November 2013
page 20 of 26 , Equity Analyst, [email protected] Nakanishi
Please see important disclosure information on pages 23 - 26 of this report.

Chart 26: Toyota Motor (7203): Japan supply/demand model
Source: Jefferies estimates, company data
Full Year FY3/13A FY3/14E FY3/13A FY3/14E('000 units) FY3/11A FY3/12A FY3/13A FY3/14E FY3/15E FY3/16E FY3/17E 1HA 2HA 1HA 2HE 1QA 2QA 3QA 4QA 1QA 2QA 3QE 4QE
1 Registration total demand 2,977 3,064 3,238 3,313 3,162 3,148 3,053 1,612 1,626 1,525 1,787 762 849 684 942 699 826 711 1,0762 Mini total demand 1,629 1,689 1,973 2,200 2,015 1,970 1,911 979 994 1,020 1,180 497 481 408 586 484 536 495 6853 Total Sales in Japan 4,606 4,753 5,210 5,513 5,177 5,118 4,964 2,591 2,620 2,545 2,967 1,260 1,331 1,092 1,528 1,184 1,362 1,206 1,7614 Registration market share (% ) 47.2% 45.3% 48.4% 47.2% 45.0% 45.3% 47.5% 48.9% 48.0% 48.0% 46.6% 48.9% 48.9% 49.3% 46.9% 49.1% 47.1% 48.5% 45.3%5 Minivehicle market share (% ) -- 1.4% 2.1% 2.0% 3.0% 3.0% 3.1% 2.4% 1.9% 2.0% 1.9% 2.0% 2.8% 2.0% 1.8% 2.1% 1.8% 2.0% 1.9%6 Total market share (% ) 30.5% 29.7% 30.9% 29.2% 28.7% 29.0% 30.4% 31.3% 30.5% 29.5% 28.8% 30.4% 32.2% 31.7% 29.6% 29.9% 29.3% 29.4% 28.4%7 Registrations 1,406 1,387 1,568 1,564 1,424 1,425 1,450 788 780 732 832 373 415 337 442 343 389 345 4878 Minivehicle -- 24 42 43 60 60 60 23 19 20 23 10 13 8 10 10 10 10 139 Dealer sales unit 1,406 1,412 1,610 1,607 1,484 1,485 1,510 812 798 732 832 383 428 346 453 343 389 345 487
10 YoY (% ) -8% 0% 14% 0% -8% 0% 2% 55% -10% -10% 4% 114% 24% -2% -15% -79% 13% -11% 41%11 Change in dealer inventory -37 63 -40 -15 0 0 0 -4 -36 23 -38 -16 12 -30 -6 3 19 -13 -2612 Domestic factory sales unit 1,368 1,474 1,570 1,592 1,484 1,485 1,510 807 762 775 817 367 440 315 447 357 418 343 47513 Imports sales (Duo) 20 0 0 0 0 0 0 0 0 0 0 0 0 0 0 0 0 0 014 Domestic factory sales unit 1,388 1,474 1,570 1,592 1,484 1,485 1,510 807 762 775 817 367 440 315 447 357 418 343 47515 Exports sales unit 1,698 1,671 1,923 1,883 1,880 1,800 1,735 988 935 963 920 523 465 459 476 500 463 460 46016 Total factory sales unit 3,087 3,145 3,493 3,475 3,364 3,285 3,245 1,796 1,697 1,738 1,737 890 906 775 923 857 881 803 93517 Less: OEMs 24 48 124 113 110 110 100 58 66 55 58 28 31 26 40 28 27 28 3118 Factory inventory change -39 23 0 0 0 0 0 0 0 0 0 0 0 0 0 0 0 0 019 Domestic production ('000 units) 3,004 3,120 3,369 3,362 3,254 3,175 3,145 1,737 1,632 1,683 1,679 862 875 749 883 829 853 775 90420 YoY (% ) -6% 4% 8% 0% -3% -2% -1% 41% -13% -3% 3% 110% 6% -15% -12% -4% -2% 3% 2%
7203 JP
Initiating Coverage
21 November 2013
page 21 of 26 , Equity Analyst, [email protected] Nakanishi
Please see important disclosure information on pages 23 - 26 of this report.

Chart 27: Toyota Motor (7203): Parent earnings model
Source: Jefferies estimates, company data Note: (E) Jefferies estimates
Full Year FY3/13A FY3/14E FY3/13A FY3/14E(¥ bn) FY3/11A FY3/12A FY3/13A FY3/14E FY3/15E FY3/16E FY3/17E 1HA 2HA 1HA 2HE 1QA 2QA 3QA 4QA 1QA 2QA 3QE 4QE
1 Avg. exchange rate (¥/US$) 85.0 78.8 80.8 99.4 100.0 100.0 100.0 80.0 81.5 98.9 100.0 80.0 80.0 80.0 83.0 98.8 99.0 100.0 100.02 Avg. exchange rate (¥/Euro) 111.3 107.8 103.8 130.0 130.0 130.0 130.0 100.0 107.5 130.0 130.0 105.0 95.0 105.0 110.0 128.9 131.1 130.0 130.03 Total revenues (¥bn) 8,242.8 8,241.2 9,747.8 10,867.3 10,673.3 10,690.0 10,773.6 4,869.2 4,878.6 5,405.7 5,461.6 2,480.8 2,388.4 2,242.8 2,635.8 2,693.0 2,712.7 2,587.0 2,874.64 YoY (% ) -4.1% 0.0% 18.3% 11.5% -1.8% 0.2% 0.8% 45.5% -0.3% 11.0% 12.0% 105.5% 11.6% -2.0% 1.2% 8.6% 13.6% 15.3% 9.1%5 Mfg. variable costs (E) 6,242.9 6,275.8 6,970.6 6,922.8 6,777.6 6,788.2 6,841.2 3,644.7 3,325.8 3,427.4 3,495.4 1,860.6 1,784.1 1,682.1 1,643.7 1,691.2 1,736.1 1,655.7 1,839.86 Mfg. variable margin (% ) 24.3% 23.8% 28.5% 36.3% 36.5% 36.5% 36.5% 25.1% 31.8% 36.6% 36.0% 25.0% 25.3% 25.0% 37.0% 37.2% 36.0% 36.0% 36.0%7 Mfg. fixed costs (E) 1,358.2 1,466.5 1,480.1 1,631.9 1,707.4 1,781.2 1,842.3 736.1 744.0 814.2 817.7 366.9 369.1 361.8 382.2 413.0 401.2 422.7 394.98 Mfg. fixed cost ratio (% ) 16.5% 17.8% 15.2% 15.0% 16.0% 16.7% 17.1% 15.1% 15.3% 15.1% 15.0% 14.8% 15.5% 16.1% 14.5% 15.3% 14.8% 16.3% 13.7%9 CoGS 7,601.0 7,742.3 8,450.6 8,554.7 8,485.0 8,569.4 8,683.6 4,380.8 4,069.8 4,241.6 4,313.1 2,227.5 2,153.3 2,043.9 2,025.9 2,104.2 2,137.3 2,078.4 2,234.7
10 Gross profit 641.8 498.9 1,297.2 2,312.7 2,188.3 2,120.6 2,090.0 488.4 808.8 1,164.2 1,148.5 253.3 235.1 198.9 609.9 588.8 575.4 508.6 639.911 SG&A 1,122.7 938.7 1,054.4 1,055.9 971.7 974.7 981.3 420.8 633.6 518.8 537.1 234.5 186.3 245.1 388.5 246.2 272.6 239.0 298.112 Operating profit -480.9 -439.8 242.1 1,256.8 1,216.6 1,145.9 1,108.7 67.6 174.5 645.4 611.4 18.8 48.8 -46.2 220.7 342.6 302.8 269.6 341.813 YoY (% ) NM NM NM 419% -3% -6% -3% NM NM 855% 250% NM NM NM NM 1722% 521% NM 55%14 Net interest profit 347.4 493.5 529.7 753.7 750.0 750.0 750.0 296.7 233.0 448.7 305.0 202.1 94.6 238.2 -5.2 271.4 177.3 237.5 67.515 Net others 86.5 -30.6 84.4 6.8 5.0 5.0 5.0 41.2 43.2 15.6 -8.8 20.6 20.6 20.6 22.6 20.0 -4.4 -4.4 -4.416 Recurring profit -47.0 23.1 856.2 2,017.3 1,971.6 1,900.9 1,863.7 405.5 450.7 1,109.7 907.6 241.5 164.0 212.6 238.1 634.0 475.7 502.7 404.917 YoY (% ) NM NM 3607% 136% -2% -4% -2% NM 357% 174% 101% NM NM 1246% 187% 163% 190% 136% 70%18 Extraordinary, net 0.0 0.0 0.0 1.4 0.0 0.0 0.0 0.0 0.0 1.4 0.0 0.0 0.0 0.0 0.0 0.0 1.4 0.0 0.019 Pretax profit -47.0 23.1 856.2 2,018.7 1,971.6 1,900.9 1,863.7 405.5 450.7 1,111.1 907.6 241.5 164.0 212.6 238.1 634.0 477.1 502.7 404.920 Taxes -99.8 -12.7 158.4 472.6 442.2 416.4 402.9 88.8 69.6 245.5 227.1 52.7 36.1 11.8 57.8 141.3 104.2 99.8 127.321 Deferred tax 0.0 0.0 0.0 0.0 0.0 0.0 0.0 0.0 0.0 0.0 0.0 0.0 0.0 0.0 0.0 0.0 0.0 0.0 0.022 Net profit 52.8 35.8 697.8 1,546.1 1,529.4 1,484.5 1,460.9 316.7 381.1 865.6 680.5 188.8 127.9 200.8 180.3 492.7 372.9 402.9 277.723 YoY (% ) 38% -32% 1847% 122% -1% -3% -2% 537% NM 173% 79% 273% NM NM 172.1% 161.0% 191.6% 100.6% 54.0%24 EPS (¥) 16.4 11.2 217.3 481.6 476.4 462.4 455.0 100.0 120.3 273.2 214.8 59.6 40.4 63.4 56.9 155.5 117.7 127.2 87.625 CEPS (¥) 76.2 64.9 243.8 475.4 481.8 472.2 468.4 118.7 136.5 275.9 221.8 67.3 51.5 72.0 64.5 155.8 120.1 131.3 90.526 Shares outstanding (m shrs) 3,610.0 3,610.0 3,610.0 3,610.0 3,610.0 3,610.0 3,610.0 3,448.0 3,448.0 3,448.0 3,448.0 3,448.0 3,448.0 3,448.0 3,448.0 3,448.0 3,448.0 3,448.0 3,448.027 Depreciation (¥bn) 222.4 198.6 182.3 170.0 210.0 220.0 230.0 92.6 89.7 85.6 84.4 43.1 49.5 47.6 42.1 44.5 41.1 50.0 34.428 Capex (¥bn) 132.5 139.0 170.8 180.0 260.0 250.0 250.0 66.0 104.8 74.6 105.4 27.7 38.3 47.0 57.8 36.2 38.4 60.0 45.429 R&Ds (¥bn) 635.9 690.0 710.9 830.0 860.0 900.0 930.0 355.6 355.3 417.0 413.0 175.6 180.0 175.0 180.3 210.3 206.7 210.0 203.030 Export ratio (% ) 57.0% 56.2% 57.9% 61.2% 62.1% 62.2% 62.0% 57.4% 58.4% 61.8% 60.7% 60.1% 54.7% 60.9% 56.2% 64.0% 59.7% 63.8% 57.8%31 Gross profit/revenues (% ) 7.8% 6.1% 13.3% 21.3% 20.5% 19.8% 19.4% 10.0% 16.6% 21.5% 21.0% 10.2% 9.8% 8.9% 23.1% 21.9% 21.2% 19.7% 22.3%32 SG&A/revenues (% ) 13.6% 11.4% 10.8% 9.7% 9.1% 9.1% 9.1% 8.6% 13.0% 9.6% 9.8% 9.5% 7.8% 10.9% 14.7% 9.1% 10.0% 9.2% 10.4%33 Operating profit/revenues (% ) -5.8% -5.3% 2.5% 11.6% 11.4% 10.7% 10.3% 1.4% 3.6% 11.9% 11.2% 0.8% 2.0% -2.1% 8.4% 12.7% 11.2% 10.4% 11.9%34 profit tax rates (% ) NM -55.2% 18.5% 23.4% 22.4% 21.9% 21.6% 21.9% 15.4% 22.1% 25.0% 21.8% 22.0% 5.6% 24.3% 22.3% 21.8% 19.9% 31.4%35 Net profit/ revenues (% ) 0.6% 0.4% 7.2% 14.2% 14.3% 13.9% 13.6% 6.5% 7.8% 16.0% 12.5% 7.6% 5.4% 9.0% 6.8% 18.3% 13.7% 15.6% 9.7%36 OP variance analysis (YoY)37 Foreign exchange rates -330.0 -260.0 160.0 855.9 22.9 0.0 0.0 -60.0 220.0 530.0 325.9 -50.0 -10.0 50.0 170.0 260.0 270.0 245.7 80.238 Cost saving 100.0 130.0 350.0 185.0 174.0 174.6 174.8 190.0 160.0 80.0 105.0 50.0 140.0 70.0 90.0 35.0 45.0 52.3 52.839 R&Ds / others expenses -52.9 61.1 -138.4 -184.3 -122.0 -196.4 -175.3 9.9 -148.3 -104.7 -79.6 33.4 -23.5 -118.3 -30.0 -10.0 -94.7 -45.9 -33.740 Volume/mix/selling costs 130.0 110.0 310.0 160.6 -115.1 -48.8 -36.7 250.0 60.0 75.0 85.6 180.0 70.0 50.0 10.0 40.0 35.0 63.7 21.9
7203 JP
Initiating Coverage
21 November 2013
page 22 of 26 , Equity Analyst, [email protected] Nakanishi
Please see important disclosure information on pages 23 - 26 of this report.

Company DescriptionToyota is the world's leading automaker with a full line of brands, including Toyota, Lexus, and Scion and subsidiaries Daihatsu and Hino. Ithad a world top 11% global auto market share in 2012 and was 3rd in the US. Its strengths include productivity and quality from its productionsystem. It is a world leader in hybrid technologies. The founding family has a strong presence in management, President Akio Toyoda is thirdgeneration.
Analyst CertificationI, Takaki Nakanishi, certify that all of the views expressed in this research report accurately reflect my personal views about the subject security(ies) andsubject company(ies). I also certify that no part of my compensation was, is, or will be, directly or indirectly, related to the specific recommendationsor views expressed in this research report.Registration of non-US analysts: Takaki Nakanishi is employed by Jefferies (Japan) Limited, a non-US affiliate of Jefferies LLC and is not registered/qualified as a research analyst with FINRA. This analyst(s) may not be an associated person of Jefferies LLC, a FINRA member firm, and therefore maynot be subject to the NASD Rule 2711 and Incorporated NYSE Rule 472 restrictions on communications with a subject company, public appearancesand trading securities held by a research analyst.
As is the case with all Jefferies employees, the analyst(s) responsible for the coverage of the financial instruments discussed in this report receivescompensation based in part on the overall performance of the firm, including investment banking income. We seek to update our research asappropriate, but various regulations may prevent us from doing so. Aside from certain industry reports published on a periodic basis, the large majorityof reports are published at irregular intervals as appropriate in the analyst's judgement.
For Important Disclosure information on companies recommended in this report, please visit our website at https://javatar.bluematrix.com/sellside/Disclosures.action or call 212.284.2300.
Meanings of Jefferies RatingsBuy - Describes stocks that we expect to provide a total return (price appreciation plus yield) of 15% or more within a 12-month period.Hold - Describes stocks that we expect to provide a total return (price appreciation plus yield) of plus 15% or minus 10% within a 12-month period.Underperform - Describes stocks that we expect to provide a total negative return (price appreciation plus yield) of 10% or more within a 12-monthperiod.The expected total return (price appreciation plus yield) for Buy rated stocks with an average stock price consistently below $10 is 20% or more withina 12-month period as these companies are typically more volatile than the overall stock market. For Hold rated stocks with an average stock priceconsistently below $10, the expected total return (price appreciation plus yield) is plus or minus 20% within a 12-month period. For Underperformrated stocks with an average stock price consistently below $10, the expected total return (price appreciation plus yield) is minus 20% within a 12-month period.NR - The investment rating and price target have been temporarily suspended. Such suspensions are in compliance with applicable regulations and/or Jefferies policies.CS - Coverage Suspended. Jefferies has suspended coverage of this company.NC - Not covered. Jefferies does not cover this company.Restricted - Describes issuers where, in conjunction with Jefferies engagement in certain transactions, company policy or applicable securitiesregulations prohibit certain types of communications, including investment recommendations.Monitor - Describes stocks whose company fundamentals and financials are being monitored, and for which no financial projections or opinions onthe investment merits of the company are provided.
Valuation MethodologyJefferies' methodology for assigning ratings may include the following: market capitalization, maturity, growth/value, volatility and expected totalreturn over the next 12 months. The price targets are based on several methodologies, which may include, but are not restricted to, analyses of marketrisk, growth rate, revenue stream, discounted cash flow (DCF), EBITDA, EPS, cash flow (CF), free cash flow (FCF), EV/EBITDA, P/E, PE/growth, P/CF,P/FCF, premium (discount)/average group EV/EBITDA, premium (discount)/average group P/E, sum of the parts, net asset value, dividend returns,and return on equity (ROE) over the next 12 months.
Conviction List Methodology
1. The aim of the conviction list is to publicise the best individual stock ideas from Jefferies Global Research2. Only stocks with a Buy or Underperform rating are allowed to be included in the recommended list.3. Stocks are screened for minimum market capitalisation and adequate daily turnover. Furthermore, a valuation, correlation and style screen
is used to ensure a well-diversified portfolio.4. Stocks are sorted to a maximum of 30 stocks with the maximum country exposure at around 50%. Limits are also imposed on a sector basis.5. Once a month, analysts are invited to recommend their best ideas. Analysts’ stock selection can be based on one or more of the following:
non-Consensus investment view, difference in earnings relative to Consensus, valuation methodology, target upside/downside % relativeto the current stock price. These are then assessed against existing holdings to ensure consistency. Stocks that have either reached theirtarget price, been downgraded over the course of the month or where a more suitable candidate has been found are removed.
6. All stocks are inserted at the last closing price and removed at the last closing price. There are no changes to the conviction list duringthe month.
7. Performance is calculated in US dollars on an equally weighted basis and is compared to MSCI World AC US$.8. The conviction list is published once a month whilst global equity markets are closed.
7203 JP
Initiating Coverage
21 November 2013
page 23 of 26 , Equity Analyst, [email protected] Nakanishi
Please see important disclosure information on pages 23 - 26 of this report.

9. Transaction fees are not included.10. All corporate actions are taken into account.
Risk which may impede the achievement of our Price TargetThis report was prepared for general circulation and does not provide investment recommendations specific to individual investors. As such, thefinancial instruments discussed in this report may not be suitable for all investors and investors must make their own investment decisions basedupon their specific investment objectives and financial situation utilizing their own financial advisors as they deem necessary. Past performance ofthe financial instruments recommended in this report should not be taken as an indication or guarantee of future results. The price, value of, andincome from, any of the financial instruments mentioned in this report can rise as well as fall and may be affected by changes in economic, financialand political factors. If a financial instrument is denominated in a currency other than the investor's home currency, a change in exchange rates mayadversely affect the price of, value of, or income derived from the financial instrument described in this report. In addition, investors in securities suchas ADRs, whose values are affected by the currency of the underlying security, effectively assume currency risk.
Other Companies Mentioned in This Report• Honda Motor (7267 JP: ¥4,100, BUY)• Nissan Motor (7201 JP: ¥923, HOLD)
7203 JP
Initiating Coverage
21 November 2013
page 24 of 26 , Equity Analyst, [email protected] Nakanishi
Please see important disclosure information on pages 23 - 26 of this report.

Distribution of RatingsIB Serv./Past 12 Mos.
Rating Count Percent Count Percent
BUY 829 47.78% 186 22.44%HOLD 763 43.98% 121 15.86%UNDERPERFORM 143 8.24% 1 0.70%
Other Important Disclosures
Jefferies Equity Research refers to research reports produced by analysts employed by one of the following Jefferies Group LLC (“Jefferies”) groupcompanies:
United States: Jefferies LLC which is an SEC registered firm and a member of FINRA.
United Kingdom: Jefferies International Limited, which is authorized and regulated by the Financial Conduct Authority; registered in England andWales No. 1978621; registered office: Vintners Place, 68 Upper Thames Street, London EC4V 3BJ; telephone +44 (0)20 7029 8000; facsimile +44 (0)207029 8010.
Hong Kong: Jefferies Hong Kong Limited, which is licensed by the Securities and Futures Commission of Hong Kong with CE number ATS546; locatedat Suite 2201, 22nd Floor, Cheung Kong Center, 2 Queen’s Road Central, Hong Kong.
Singapore: Jefferies Singapore Limited, which is licensed by the Monetary Authority of Singapore; located at 80 Raffles Place #15-20, UOB Plaza 2,Singapore 048624, telephone: +65 6551 3950.
Japan: Jefferies (Japan) Limited, Tokyo Branch, which is a securities company registered by the Financial Services Agency of Japan and is a memberof the Japan Securities Dealers Association; located at Hibiya Marine Bldg, 3F, 1-5-1 Yuraku-cho, Chiyoda-ku, Tokyo 100-0006; telephone +813 52516100; facsimile +813 5251 6101.
India: Jefferies India Private Limited, which is licensed by the Securities and Exchange Board of India as a Merchant Banker (INM000011443) and aStock Broker with Bombay Stock Exchange Limited (INB011491033) and National Stock Exchange of India Limited (INB231491037) in the Capital MarketSegment; located at 42/43, 2 North Avenue, Maker Maxity, Bandra-Kurla Complex, Bandra (East) Mumbai 400 051, India; Tel +91 22 4356 6000.
This material has been prepared by Jefferies employing appropriate expertise, and in the belief that it is fair and not misleading. The information setforth herein was obtained from sources believed to be reliable, but has not been independently verified by Jefferies. Therefore, except for any obligationunder applicable rules we do not guarantee its accuracy. Additional and supporting information is available upon request. Unless prohibited by theprovisions of Regulation S of the U.S. Securities Act of 1933, this material is distributed in the United States ("US"), by Jefferies LLC, a US-registeredbroker-dealer, which accepts responsibility for its contents in accordance with the provisions of Rule 15a-6, under the US Securities Exchange Act of1934. Transactions by or on behalf of any US person may only be effected through Jefferies LLC. In the United Kingdom and European EconomicArea this report is issued and/or approved for distribution by Jefferies International Limited and is intended for use only by persons who have, or havebeen assessed as having, suitable professional experience and expertise, or by persons to whom it can be otherwise lawfully distributed. JefferiesInternational Limited has adopted a conflicts management policy in connection with the preparation and publication of research, the details of whichare available upon request in writing to the Compliance Officer. Jefferies International Limited may allow its analysts to undertake private consultancywork. Jefferies International Limited’s conflicts management policy sets out the arrangements Jefferies International Limited employs to manage anypotential conflicts of interest that may arise as a result of such consultancy work. For Canadian investors, this material is intended for use only byprofessional or institutional investors. None of the investments or investment services mentioned or described herein is available to other personsor to anyone in Canada who is not a "Designated Institution" as defined by the Securities Act (Ontario). In Singapore, Jefferies Singapore Limited isregulated by the Monetary Authority of Singapore. For investors in the Republic of Singapore, this material is provided by Jefferies Singapore Limitedpursuant to Regulation 32C of the Financial Advisers Regulations. The material contained in this document is intended solely for accredited, expert orinstitutional investors, as defined under the Securities and Futures Act (Cap. 289 of Singapore). If there are any matters arising from, or in connectionwith this material, please contact Jefferies Singapore Limited, located at 80 Raffles Place #15-20, UOB Plaza 2, Singapore 048624, telephone: +656551 3950. In Japan this material is issued and distributed by Jefferies (Japan) Limited to institutional investors only. In Hong Kong, this report isissued and approved by Jefferies Hong Kong Limited and is intended for use only by professional investors as defined in the Hong Kong Securities andFutures Ordinance and its subsidiary legislation. In the Republic of China (Taiwan), this report should not be distributed. The research in relation tothis report is conducted outside the PRC. This report does not constitute an offer to sell or the solicitation of an offer to buy any securities in the PRC.PRC investors shall have the relevant qualifications to invest in such securities and shall be responsible for obtaining all relevant approvals, licenses,verifications and/or registrations from the relevant governmental authorities themselves. In India this report is made available by Jefferies India PrivateLimited. In Australia this information is issued solely by Jefferies International Limited and is directed solely at wholesale clients within the meaning ofthe Corporations Act 2001 of Australia (the "Act") in connection with their consideration of any investment or investment service that is the subject ofthis document. Any offer or issue that is the subject of this document does not require, and this document is not, a disclosure document or productdisclosure statement within the meaning of the Act. Jefferies International Limited is authorised and regulated by the Financial Conduct Authorityunder the laws of the United Kingdom, which differ from Australian laws. Jefferies International Limited has obtained relief under Australian Securitiesand Investments Commission Class Order 03/1099, which conditionally exempts it from holding an Australian financial services licence under theAct in respect of the provision of certain financial services to wholesale clients. Recipients of this document in any other jurisdictions should informthemselves about and observe any applicable legal requirements in relation to the receipt of this document.
This report is not an offer or solicitation of an offer to buy or sell any security or derivative instrument, or to make any investment. Any opinion orestimate constitutes the preparer's best judgment as of the date of preparation, and is subject to change without notice. Jefferies assumes no obligationto maintain or update this report based on subsequent information and events. Jefferies, its associates or affiliates, and its respective officers, directors,and employees may have long or short positions in, or may buy or sell any of the securities, derivative instruments or other investments mentioned ordescribed herein, either as agent or as principal for their own account. Upon request Jefferies may provide specialized research products or servicesto certain customers focusing on the prospects for individual covered stocks as compared to other covered stocks over varying time horizons orunder differing market conditions. While the views expressed in these situations may not always be directionally consistent with the long-term views
7203 JP
Initiating Coverage
21 November 2013
page 25 of 26 , Equity Analyst, [email protected] Nakanishi
Please see important disclosure information on pages 23 - 26 of this report.

expressed in the analyst's published research, the analyst has a reasonable basis and any inconsistencies can be reasonably explained. This materialdoes not constitute a personal recommendation or take into account the particular investment objectives, financial situations, or needs of individualclients. Clients should consider whether any advice or recommendation in this report is suitable for their particular circumstances and, if appropriate,seek professional advice, including tax advice. The price and value of the investments referred to herein and the income from them may fluctuate. Pastperformance is not a guide to future performance, future returns are not guaranteed, and a loss of original capital may occur. Fluctuations in exchangerates could have adverse effects on the value or price of, or income derived from, certain investments. This report has been prepared independently ofany issuer of securities mentioned herein and not in connection with any proposed offering of securities or as agent of any issuer of securities. Noneof Jefferies, any of its affiliates or its research analysts has any authority whatsoever to make any representations or warranty on behalf of the issuer(s).Jefferies policy prohibits research personnel from disclosing a recommendation, investment rating, or investment thesis for review by an issuer priorto the publication of a research report containing such rating, recommendation or investment thesis. Any comments or statements made herein arethose of the author(s) and may differ from the views of Jefferies.
This report may contain information obtained from third parties, including ratings from credit ratings agencies such as Standard & Poor’s. Reproductionand distribution of third party content in any form is prohibited except with the prior written permission of the related third party. Third party contentproviders do not guarantee the accuracy, completeness, timeliness or availability of any information, including ratings, and are not responsible forany errors or omissions (negligent or otherwise), regardless of the cause, or for the results obtained from the use of such content. Third party contentproviders give no express or implied warranties, including, but not limited to, any warranties of merchantability or fitness for a particular purpose oruse. Third party content providers shall not be liable for any direct, indirect, incidental, exemplary, compensatory, punitive, special or consequentialdamages, costs, expenses, legal fees, or losses (including lost income or profits and opportunity costs) in connection with any use of their content,including ratings. Credit ratings are statements of opinions and are not statements of fact or recommendations to purchase, hold or sell securities. Theydo not address the suitability of securities or the suitability of securities for investment purposes, and should not be relied on as investment advice.
Jefferies research reports are disseminated and available primarily electronically, and, in some cases, in printed form. Electronic research issimultaneously available to all clients. This report or any portion hereof may not be reprinted, sold or redistributed without the written consent ofJefferies. Neither Jefferies nor any officer nor employee of Jefferies accepts any liability whatsoever for any direct, indirect or consequential damagesor losses arising from any use of this report or its contents.
For Important Disclosure information, please visit our website at https://javatar.bluematrix.com/sellside/Disclosures.action or call 1.888.JEFFERIES
© 2013 Jefferies Group LLC
7203 JP
Initiating Coverage
21 November 2013
page 26 of 26 , Equity Analyst, [email protected] Nakanishi
Please see important disclosure information on pages 23 - 26 of this report.