TOXICOLOGICAL REVIEW OF UREA - U.S. EPA Web Server
94
DRAFT - DO NOT CITE OR QUOTE EPA/635/R-10/005A www.epa.gov/iris TOXICOLOGICAL REVIEW OF UREA (CAS No. 57-13-6) In Support of Summary Information on the Integrated Risk Information System (IRIS) September 2010 NOTICE This document is an External Peer Review draft. This information is distributed solely for the purpose of pre-dissemination peer review under applicable information quality guidelines. It has not been formally disseminated by EPA. It does not represent and should not be construed to represent any Agency determination or policy. It is being circulated for review of its technical accuracy and science policy implications. U.S. Environmental Protection Agency Washington, DC
Transcript of TOXICOLOGICAL REVIEW OF UREA - U.S. EPA Web Server

DRAFT - DO NOT CITE OR QUOTE EPA/635/R-10/005A www.epa.gov/iris
TOXICOLOGICAL REVIEW
OF
UREA
(CAS No. 57-13-6)
In Support of Summary Information on the Integrated Risk Information System (IRIS)
September 2010
NOTICE This document is an External Peer Review draft. This information is distributed solely for the purpose of pre-dissemination peer review under applicable information quality guidelines. It has not been formally disseminated by EPA. It does not represent and should not be construed to represent any Agency determination or policy. It is being circulated for review of its technical accuracy and science policy implications.
U.S. Environmental Protection Agency
Washington, DC
ii DRAFT - DO NOT CITE OR QUOTE
DISCLAIMER This document is a preliminary draft for review purposes only. This information is distributed solely for the purpose of pre-dissemination peer review under applicable information quality guidelines. It has not been formally disseminated by EPA. It does not represent and should not be construed to represent any Agency determination or policy. Mention of trade names or commercial products does not constitute endorsement or recommendation for use.

iii DRAFT - DO NOT CITE OR QUOTE
CONTENTS—TOXICOLOGICAL REVIEW OF UREA (CAS No. 57-13-6) CONTENTS—TOXICOLOGICAL REVIEW OF UREA (CAS No. 57-13-6) ........................... iii LIST OF TABLES .......................................................................................................................... v LIST OF FIGURES ........................................................................................................................ v LIST OF ABBREVIATIONS AND ACRONYMS ...................................................................... vi LIST OF ABBREVIATIONS AND ACRONYMS ...................................................................... vi FOREWORD ............................................................................................................................... viii AUTHORS, CONTRIBUTORS, AND REVIEWERS ................................................................. ix 1. INTRODUCTION ..................................................................................................................... 1 2. CHEMICAL AND PHYSICAL INFORMATION ................................................................... 3 3. TOXICOKINETICS .................................................................................................................. 6
3.1. ABSORPTION ................................................................................................................... 7 3.2. DISTRIBUTION .............................................................................................................. 10 3.3. METABOLISM ................................................................................................................ 11 3.4. ELIMINATION ................................................................................................................ 14 3.5. PHYSIOLOGICALLY BASED TOXICOKINETIC MODELS ..................................... 17
4. HAZARD IDENTIFICATION ................................................................................................ 21 4.1. STUDIES IN HUMANS—EPIDEMIOLOGY, CASE REPORTS AND CLINICAL
CONTROLS ...................................................................................................................... 21 4.1.1. Oral Exposure ........................................................................................................... 21 4.1.2. Inhalation Exposure .................................................................................................. 22
4.1.2.1. Cohort Studies .................................................................................................. 22 4.1.2.2. Experimental Studies ....................................................................................... 24
4.1.3. Dermal Exposure ...................................................................................................... 24 4.1.4. Additional Human Studies ........................................................................................ 27
4.2. SUBCHRONIC AND CHRONIC STUDIES AND CANCER BIOASSAYS IN ANIMALS—ORAL AND INHALATION ...................................................................... 29
4.2.1. Oral Exposure ........................................................................................................... 29 4.2.1.1. Subchronic Studies ........................................................................................... 29 4.2.1.2. Chronic Studies ................................................................................................ 29
4.2.2. Inhalation .................................................................................................................. 31 4.2.3. Other routes of exposure ........................................................................................... 31
4.2.3.1. Subchronic Studies ........................................................................................... 31 4.2.3.2. Chronic Studies ................................................................................................ 31
4.3. REPRODUCTIVE/DEVELOPMENTAL STUDIES – ORAL AND INHALATION .... 31 4.3.1. Oral Exposure ........................................................................................................... 31 4.3.2. Intrauterine, Intraperitoneal, or Intravenous Exposure ............................................. 34 4.3.3. Other Studies............................................................................................................. 35
4.4. OTHER DURATION- OR ENDPOINT-SPECIFIC STUDIES ...................................... 37 4.4.1. Acute Studies ............................................................................................................ 37 4.4.2. Short-Term Studies ................................................................................................... 39 4.4.3. Cardiotoxicity ........................................................................................................... 42 4.4.4. Pituitary Effects ........................................................................................................ 45 4.4.5. Dermal Toxicity ........................................................................................................ 45 4.4.6. Intracranial and Intraocular Effects .......................................................................... 45 4.4.7. Urea Toxicity in Ruminants and Non-Laboratory Animals ..................................... 46

iv DRAFT - DO NOT CITE OR QUOTE
4.5. MECHANISTIC DATA AND OTHER STUDIES IN SUPPORT OF THE MODE OF ACTION ............................................................................................................................ 46
4.5.1. Mechanistic Data from In Vivo and In Vitro Studies ............................................... 46 4.5.1.1. Neurological Effects ......................................................................................... 46 4.5.1.2. Effects on the Renal System ............................................................................. 49 4.5.1.3. Hematological Effects ...................................................................................... 51
4.5.2. Role of UTs ............................................................................................................... 52 4.5.2.1. In Vivo Studies in Rats ..................................................................................... 52 4.5.2.2. In Vivo Studies in Mice .................................................................................... 55
4.5.3. Gene Expression Studies .......................................................................................... 55 4.5.4. Genotoxicity.............................................................................................................. 58
4.6. SYNTHESIS OF MAJOR NONCANCER EFFECTS ..................................................... 62 4.6.1. Oral Exposure ........................................................................................................... 62 4.6.2. Inhalation Exposure .................................................................................................. 64 4.6.3. Dermal Exposure ...................................................................................................... 64 4.6.4. Additional Studies..................................................................................................... 65 4.6.5. Mode of Action ......................................................................................................... 65
4.7 EVALUATION OF CARCINOGENICITY ..................................................................... 67 4.7.1. Summary of Overall Weight of Evidence................................................................. 67 4.7.2. Synthesis of Human, Animal, and Other Supporting Evidence ............................... 68
4.8. SUSCEPTIBLE POPULATIONS AND LIFE STAGES ................................................. 69 5. DOSE-RESPONSE ASSESSMENTS ..................................................................................... 70
5.1. ORAL REFERENCE DOSE (RfD) .................................................................................. 70 5.1.1. Choice of Principal Studies and Critical Effect—with Rationale and Justification . 70 5.1.2. Previous RfD Assessment ......................................................................................... 71
5.2. INHALATION REFERENCE CONCENTRATION (RfC) ............................................ 71 5.2.1. Choice of Principal Study and Critical Effect—with Rationale and Justification .... 71 5.2.2. Previous RfC Assessment ......................................................................................... 72
5.3. CANCER ASSESSMENT ................................................................................................ 72 5.3.1. Choice of Study/Data—with Rationale and Justification ......................................... 73 5.3.2. Previous Cancer Assessment .................................................................................... 73
6. MAJOR CONCLUSIONS IN THE CHARACTERIZATION OF HAZARD AND DOSE RESPONSE ........................................................................................................................... 74
6.1. HUMAN HAZARD POTENTIAL ................................................................................... 74 6.2. DOSE RESPONSE ........................................................................................................... 75
6.2.1. Noncancer/Oral ......................................................................................................... 75 6.2.2. Noncancer/Inhalation ................................................................................................ 75 6.2.3. Cancer/Oral ............................................................................................................... 75 6.2.4. Cancer/Inhalation ...................................................................................................... 75
7. REFERENCES ........................................................................................................................ 76
v DRAFT - DO NOT CITE OR QUOTE
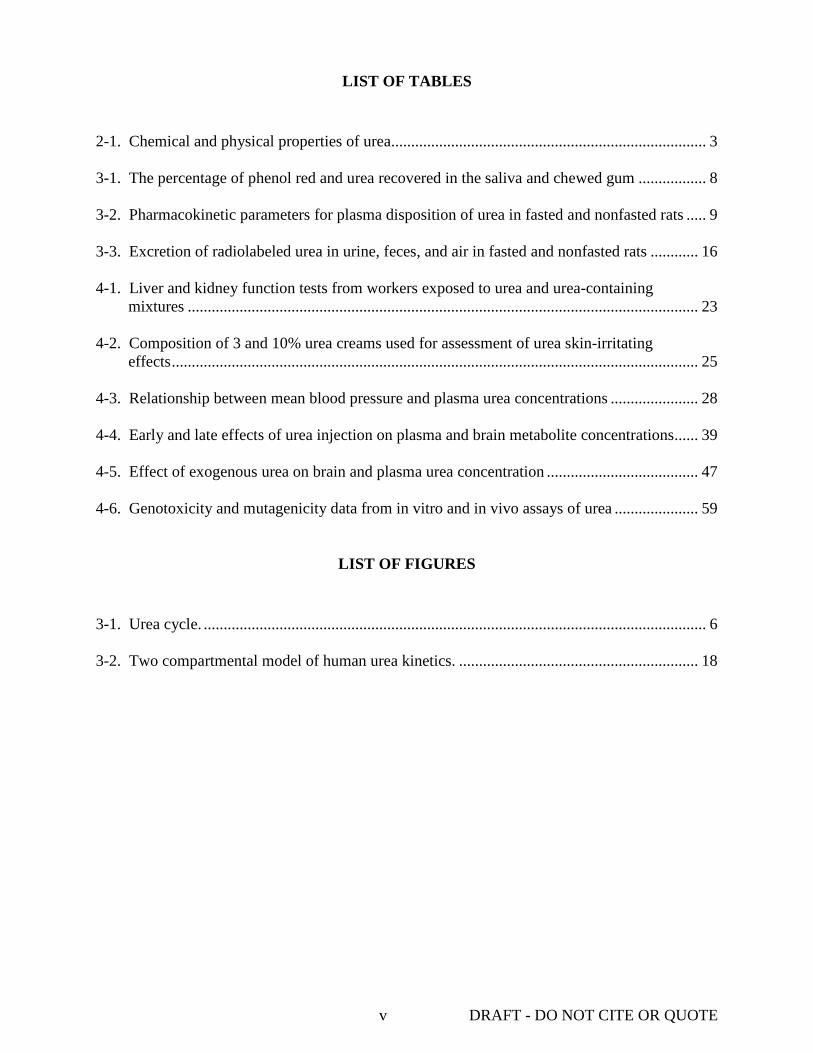
LIST OF TABLES 2-1. Chemical and physical properties of urea............................................................................... 3 3-1. The percentage of phenol red and urea recovered in the saliva and chewed gum ................. 8 3-2. Pharmacokinetic parameters for plasma disposition of urea in fasted and nonfasted rats ..... 9 3-3. Excretion of radiolabeled urea in urine, feces, and air in fasted and nonfasted rats ............ 16 4-1. Liver and kidney function tests from workers exposed to urea and urea-containing
mixtures ................................................................................................................................ 23 4-2. Composition of 3 and 10% urea creams used for assessment of urea skin-irritating
effects .................................................................................................................................... 25 4-3. Relationship between mean blood pressure and plasma urea concentrations ...................... 28 4-4. Early and late effects of urea injection on plasma and brain metabolite concentrations ...... 39 4-5. Effect of exogenous urea on brain and plasma urea concentration ...................................... 47 4-6. Genotoxicity and mutagenicity data from in vitro and in vivo assays of urea ..................... 59
LIST OF FIGURES 3-1. Urea cycle. .............................................................................................................................. 6 3-2. Two compartmental model of human urea kinetics. ............................................................ 18

vi DRAFT - DO NOT CITE OR QUOTE
LIST OF ABBREVIATIONS AND ACRONYMS AFP alpha-fetoprotein ALT alanine aminotransferase ADME absorption, distribution, metabolism, and excretion AST aspartate aminotransferase ATF3 activating transcription factor 3 AUC area under the curve BAE bovine aortic endothelial CA chromosomal aberration CASRN Chemical Abstract Services Registry Number cDNA complementary deoxyribonucleic acid CEA carcinoembryonic antigen CI confidence interval cLDL carbamylated low-density lipoprotein Cmax maximal concentration CNS central nervous system CRF chronic renal failure CSF cerebrospinal fluid DNA deoxyribonucleic acid EGF epidermal growth factor ERK extracellular signal-regulated kinase FEV1 forced expiratory volume in 1 second FSH follicle stimulating hormone FVC forced vital capacity G3PDH glyceraldehyde-3-phosphate dehydrogenase GC gas chromatography GD gestational day GnRH gonadotropin-releasing hormone IEG immediate early gene IGF insulin-like growth factor ILR irreversible loss rate iNOS inducible nitric oxide synthase i.p. intraperitoneal(ly) IP3 inositol 1,4,5-triphosphate IRIS Integrated Risk Information System IUGR intrauterine growth retardation i.v. intravenous(ly) LDH lactate dehydrogenase LOAEL lowest-observed-adverse-effect level MAPK mitogen-activated protein kinase MDCK Madin-Darby canine kidney mIMCD3 murine inner medullary collecting duct mOsm milliosmol mRNA messenger ribonucleic acid MS mass spectrometry NaCl sodium chloride NCI National Cancer Institute

vii DRAFT - DO NOT CITE OR QUOTE
NHE Na+/H+ exchange NIOSH National Institute for Occupational Safety and Health nLDL native low-density lipoprotein NOAEL no-observed-adverse-effect level NOES National Occupational Exposure Survey OR odds ratio P-gp P-glycoprotein PEF peak expiratory flow PEFR/min peak expiratory flow rate per minute PGF2α prostaglandin F2α PI3K phosphatidylinositol-3 kinase PKC protein kinase C PLC phospholipase C PND postnatal day p.o. per os, oral(ly) PSA prostate-specific antigen PUN plasma urea nitrogen RBC red blood cell RfC reference concentration RfD reference dose RME rat mesangial RNA ribonucleic acid ROS reactive oxygen species s.c. subcutaneous(ly) SCR selective catalytic reduction SD standard deviation SEM standard error of the mean SMR standardized mortality ratio SNP single nucleotide polymorphism SUN serum urea nitrogen t1/2 half-life TPA 12-O-tetradecanoylphorbol-13-acetate UER urea entry rate UF uncertainty factor U.S. EPA U.S. Environmental Protection Agency UT urea transporter VC vital capacity

viii DRAFT - DO NOT CITE OR QUOTE
FOREWORD
The purpose of this Toxicological Review is to provide scientific support and rationale for the hazard and dose-response assessment in IRIS pertaining to chronic exposure to urea. It is not intended to be a comprehensive treatise on the chemical or toxicological nature of urea.
The intent of Section 6, Major Conclusions in the Characterization of Hazard and Dose Response, is to present the major conclusions reached in the derivation of the reference dose, reference concentration and cancer assessment, where applicable, and to characterize the overall confidence in the quantitative and qualitative aspects of hazard and dose response by addressing the quality of data and related uncertainties. The discussion is intended to convey the limitations of the assessment and to aid and guide the risk assessor in the ensuing steps of the risk assessment process.
For other general information about this assessment or other questions relating to IRIS, the reader is referred to EPA’s IRIS Hotline at (202) 566-1676 (phone), (202) 566-1749 (fax), or [email protected] (email address).

ix DRAFT - DO NOT CITE OR QUOTE
AUTHORS, CONTRIBUTORS, AND REVIEWERS CHEMICAL MANAGER/AUTHOR Amanda S. Persad, Ph.D., DABT National Center for Environmental Assessment Office of Research and Development U.S. Environmental Protection Agency Research Triangle Park, NC AUTHORS John Cowden, Ph.D. National Center for Environmental Assessment Office of Research and Development U.S. Environmental Protection Agency Research Triangle Park, NC Andrew K. Hotchkiss, Ph.D. National Center for Environmental Assessment Office of Research and Development U.S. Environmental Protection Agency Research Triangle Park, NC Channa Keshava, Ph.D. National Center for Environmental Assessment Office of Research and Development U.S. Environmental Protection Agency Research Triangle Park, NC Janice S. Lee, Ph.D. National Center for Environmental Assessment Office of Research and Development U.S. Environmental Protection Agency Research Triangle Park, NC Allan Marcus, Ph.D. National Center for Environmental Assessment Office of Research and Development U.S. Environmental Protection Agency Research Triangle Park, NC Andrew Rooney, Ph.D. National Center for Environmental Assessment Office of Research and Development U.S. Environmental Protection Agency Research Triangle Park, NC

x DRAFT - DO NOT CITE OR QUOTE
Reeder Sams, Ph.D. National Center for Environmental Assessment Office of Research and Development U.S. Environmental Protection Agency Research Triangle Park, NC CONTRACTOR SUPPORT Neepa Choksi, Ph.D. Integrated Laboratory Systems, Inc. Research Triangle Park, NC Claudine Gregorio, M.A. Integrated Laboratory Systems, Inc. Research Triangle Park, NC Marc Jackson, B.A Integrated Laboratory Systems, Inc. Research Triangle Park, NC Gloria Jahnke, D.V.M. Integrated Laboratory Systems, Inc. Research Triangle Park, NC
INTERNAL EPA REVIEWERS Marion Hoyer, Ph.D. Office of Air and Radiation Office of Transportation and Air Quality Karen Hammerstrom, J.D. National Center for Environmental Assessment Office of Research and Development Samantha Jones, Ph.D. National Center for Environmental Assessment Office of Research and Development

1 DRAFT - DO NOT CITE OR QUOTE
1. INTRODUCTION
This document presents background information and justification for the Integrated Risk Information System (IRIS) Summary of the hazard and dose-response assessment of urea. IRIS Summaries may include oral reference dose (RfD) and inhalation reference concentration (RfC) values for chronic and other exposure durations, and a carcinogenicity assessment.
The RfD and RfC, if derived, provide quantitative information for use in risk assessments for health effects known or assumed to be produced through a nonlinear (presumed threshold) mode of action. The RfD (expressed in units of mg/kg-day) is defined as an estimate (with uncertainty spanning perhaps an order of magnitude) of a daily exposure to the human population (including sensitive subgroups) that is likely to be without an appreciable risk of deleterious effects during a lifetime. The inhalation RfC (expressed in units of mg/m3) is analogous to the oral RfD, but provides a continuous inhalation exposure estimate. The inhalation RfC considers toxic effects for both the respiratory system (portal-of-entry) and for effects peripheral to the respiratory system (extrarespiratory or systemic effects). Reference values are generally derived for chronic exposures (up to a lifetime), but may also be derived for acute (≤24 hours), short-term (>24 hours up to 30 days), and subchronic (>30 days up to 10% of lifetime) exposure durations, all of which are derived based on an assumption of continuous exposure throughout the duration specified. Unless specified otherwise, the RfD and RfC are derived for chronic exposure duration.
The carcinogenicity assessment provides information on the carcinogenic hazard potential of the substance in question and quantitative estimates of risk from oral and inhalation exposure may be derived. The information includes a weight-of-evidence judgment of the likelihood that the agent is a human carcinogen and the conditions under which the carcinogenic effects may be expressed. Quantitative risk estimates may be derived from the application of a low-dose extrapolation procedure. If derived, the oral slope factor is a plausible upper bound on the estimate of risk per mg/kg-day of oral exposure. Similarly, an inhalation unit risk is a plausible upper bound on the estimate of risk per μg/m3 air breathed.
Development of these hazard identification and dose-response assessments for urea has followed the general guidelines for risk assessment as set forth by the National Research Council (1983). U.S. Environmental Protection Agency (U.S. EPA) Guidelines and Risk Assessment Forum Technical Panel Reports that may have been used in the development of this assessment include the following: Guidelines for the Health Risk Assessment of Chemical Mixtures (U.S. EPA, 1986a), Guidelines for Mutagenicity Risk Assessment (U.S. EPA, 1986b), Recommendations for and Documentation of Biological Values for Use in Risk Assessment (U.S. EPA, 1988), Guidelines for Developmental Toxicity Risk Assessment (U.S. EPA, 1991), Interim Policy for Particle Size and Limit Concentration Issues in Inhalation Toxicity (U.S. EPA,

2 DRAFT - DO NOT CITE OR QUOTE
1994a), Methods for Derivation of Inhalation Reference Concentrations and Application of Inhalation Dosimetry (U.S. EPA, 1994b), Use of the Benchmark Dose Approach in Health Risk Assessment (U.S. EPA, 1995), Guidelines for Reproductive Toxicity Risk Assessment (U.S. EPA, 1996), Guidelines for Neurotoxicity Risk Assessment (U.S. EPA, 1998), Science Policy Council Handbook: Risk Characterization (U.S. EPA, 2000a), Benchmark Dose Technical Guidance Document (U.S. EPA, 2000b), Supplementary Guidance for Conducting Health Risk Assessment of Chemical Mixtures (U.S. EPA, 2000c), A Review of the Reference Dose and Reference Concentration Processes (U.S. EPA, 2002), Guidelines for Carcinogen Risk Assessment (U.S. EPA, 2005a), Supplemental Guidance for Assessing Susceptibility from Early-Life Exposure to Carcinogens (U.S. EPA, 2005b), Science Policy Council Handbook: Peer Review (U.S. EPA, 2006a), and A Framework for Assessing Health Risks of Environmental Exposures to Children (U.S. EPA, 2006b).
The literature search strategy employed for this compound was based on the Chemical Abstracts Service Registry Number (CASRN) and at least one common name. Any pertinent scientific information submitted by the public to the IRIS Submission Desk was also considered in the development of this document. The relevant literature was reviewed through August 2010.

3 DRAFT - DO NOT CITE OR QUOTE
2. CHEMICAL AND PHYSICAL INFORMATION
Urea (CASRN 57-13-6) is also known as carbamide. Other names include Aquacare, Aquadrate, Basodexan, Carbonyldiamide, Hyanit, Keratinamin, Nutraplus, Onychomal, Pastaron, Ureaphil, and Urepearl. Table 2-1 lists some chemical and physical properties of urea.
Table 2-1. Chemical and physical properties of urea
Chemical formula CH4N2O Molecular weight 60.06 Color Colorless to white State Tetragonal prisms Odor Develops slight ammonia odor Taste Cooling, saline taste
Melting point 132.7°C; upon further heating, decomposes to ammonia, biuret, and cyanuric acid
Boiling point Not applicable Density 1.3230 g/mL at 20°C Vapor pressure 1.2 × 10⁻⁵ mm mercury (Hg) at 25°C Flash point 72.7 ± 22.6°C Log Kow -1.59 at 20–25°C (experimental) Water solubility 5.45 × 10⁵ mg/L at 25°C
Solubility 1 g in 10 mL 95% alcohol, 1 mL boiling 95% alcohol, 20 mL absolute alcohol, 6 mL methanol, 2 mL glycerol; also soluble in concentrated hydrochloric acid
pH 7.2 (10% aqueous solution) Dissociation constant (pKa) 0.10 at 21°C Henry’s law constant 1.74 × 10⁻¹² atm-m3/mol at 25°C (estimated) Atmospheric OH rate constant 4.00 × 10⁻¹¹ cm3/molecule-sec at 25°C (estimated) Bioconcentration factor 1.0 at pH 1–10 and 25°C Impurities Biuret 0.3–2 weight%; cyanates Sources: NLM (2008a, b, c); OECD SIDS (2008); Registry (2008); O’Neil et al. (2006).
Urea is an endogenous product of protein and amino acid catabolism. It is formed in the
liver from ammonia, which is a deamination product of amino acids. Approximately 20–35 g of urea are excreted in human urine per day.
Urea was the first organic compound to be synthesized from inorganic reagents. It is prepared in methanol from a combination of ammonia, carbon monoxide, and sulfur. Urea can be produced as granules, flakes, pellets, and crystals, and in solutions. It is pelletized or prilled to avoid caking. Production in the United States was reported at 15.66 and 15.2 billion pounds in 1993 and 1996, respectively (NLM, 2008a, b; O’Neil et al., 2006).
4 DRAFT - DO NOT CITE OR QUOTE
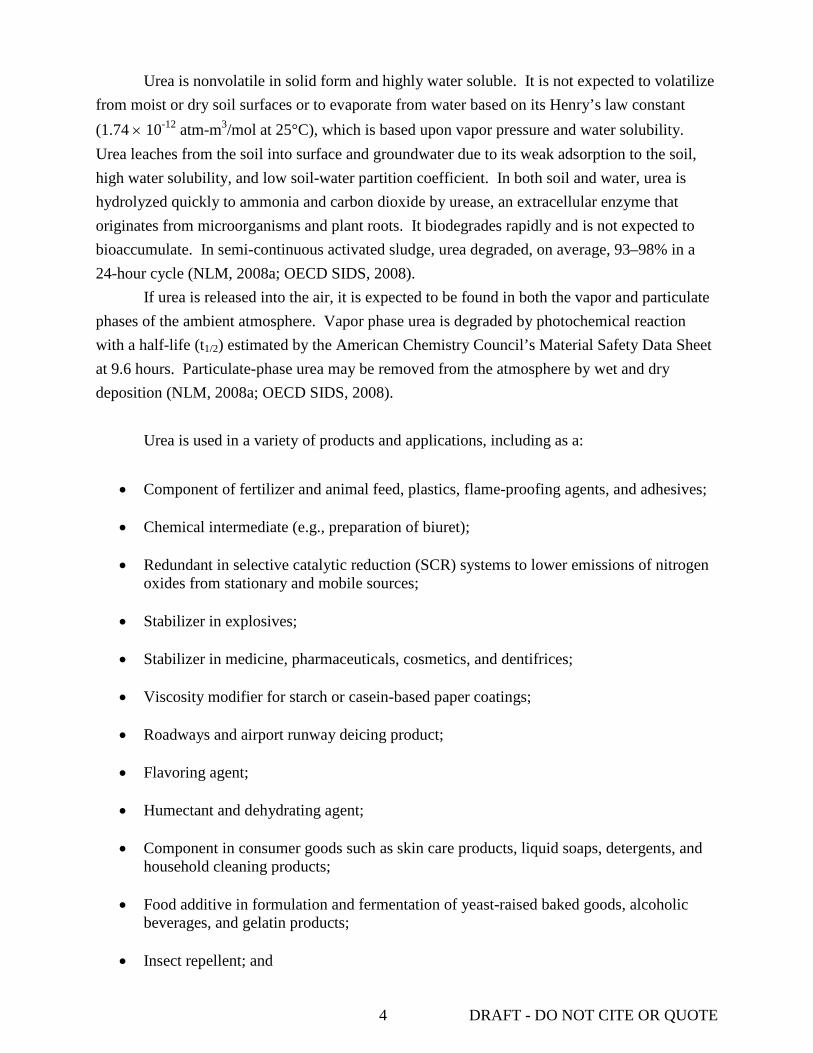
Urea is nonvolatile in solid form and highly water soluble. It is not expected to volatilize from moist or dry soil surfaces or to evaporate from water based on its Henry’s law constant (1.74 × 10⁻¹² atm-m3/mol at 25°C), which is based upon vapor pressure and water solubility. Urea leaches from the soil into surface and groundwater due to its weak adsorption to the soil, high water solubility, and low soil-water partition coefficient. In both soil and water, urea is hydrolyzed quickly to ammonia and carbon dioxide by urease, an extracellular enzyme that originates from microorganisms and plant roots. It biodegrades rapidly and is not expected to bioaccumulate. In semi-continuous activated sludge, urea degraded, on average, 93–98% in a 24-hour cycle (NLM, 2008a; OECD SIDS, 2008).
If urea is released into the air, it is expected to be found in both the vapor and particulate phases of the ambient atmosphere. Vapor phase urea is degraded by photochemical reaction with a half-life (t1/2) estimated by the American Chemistry Council’s Material Safety Data Sheet at 9.6 hours. Particulate-phase urea may be removed from the atmosphere by wet and dry deposition (NLM, 2008a; OECD SIDS, 2008).
Urea is used in a variety of products and applications, including as a:
• Component of fertilizer and animal feed, plastics, flame-proofing agents, and adhesives; • Chemical intermediate (e.g., preparation of biuret); • Redundant in selective catalytic reduction (SCR) systems to lower emissions of nitrogen
oxides from stationary and mobile sources; • Stabilizer in explosives; • Stabilizer in medicine, pharmaceuticals, cosmetics, and dentifrices; • Viscosity modifier for starch or casein-based paper coatings; • Roadways and airport runway deicing product; • Flavoring agent; • Humectant and dehydrating agent; • Component in consumer goods such as skin care products, liquid soaps, detergents, and
household cleaning products; • Food additive in formulation and fermentation of yeast-raised baked goods, alcoholic
beverages, and gelatin products; • Insect repellent; and

5 DRAFT - DO NOT CITE OR QUOTE
• Medical product for reducing cerebral edema and brain mass before and after
neurosurgery (NLM, 2008a; OECD SIDS, 2008; O’Neil et al., 2006). In work settings where urea is produced or used, such as places where urea-based
fertilizers are applied, workers are exposed via inhalation and dermal routes. The National Institute for Occupational Safety and Health (NIOSH) National Occupational Exposure Survey (NOES; conducted from 1981 to 1983) estimated that 783,504 nonfarm workers (326,824 females) were exposed to urea in the United States (NLM, 2008a). The general population may also be exposed to exogenous urea through skin contact by using urea-containing products as well as through the oral route via food and drinking water (NLM, 2008a). Urea exposure of livestock, ruminants, pets, and wild animals may occur from spreading of fertilizers to fields, accidental spills on land into ponds, and other water sources. This toxicological review will focus on exogenous urea and urea as the parent compound.
6 DRAFT - DO NOT CITE OR QUOTE
3. TOXICOKINETICS
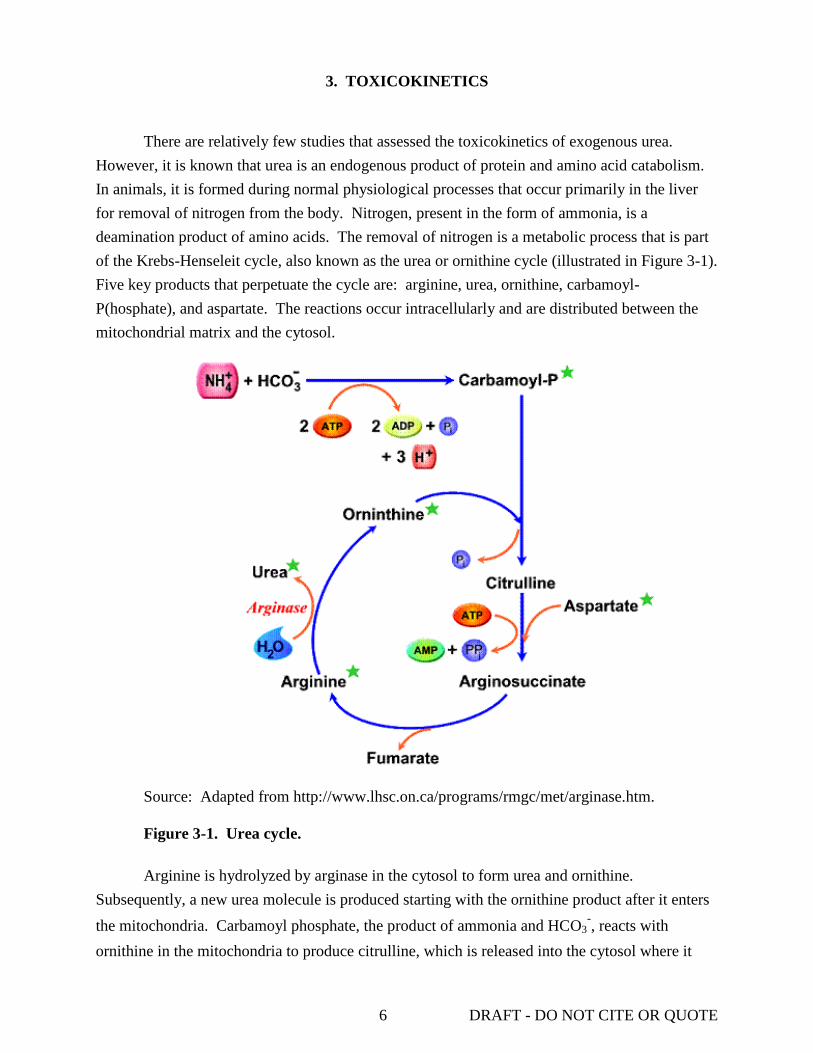
There are relatively few studies that assessed the toxicokinetics of exogenous urea. However, it is known that urea is an endogenous product of protein and amino acid catabolism. In animals, it is formed during normal physiological processes that occur primarily in the liver for removal of nitrogen from the body. Nitrogen, present in the form of ammonia, is a deamination product of amino acids. The removal of nitrogen is a metabolic process that is part of the Krebs-Henseleit cycle, also known as the urea or ornithine cycle (illustrated in Figure 3-1). Five key products that perpetuate the cycle are: arginine, urea, ornithine, carbamoyl-P(hosphate), and aspartate. The reactions occur intracellularly and are distributed between the mitochondrial matrix and the cytosol.
Source: Adapted from http://www.lhsc.on.ca/programs/rmgc/met/arginase.htm. Figure 3-1. Urea cycle. Arginine is hydrolyzed by arginase in the cytosol to form urea and ornithine.
Subsequently, a new urea molecule is produced starting with the ornithine product after it enters the mitochondria. Carbamoyl phosphate, the product of ammonia and HCO3
-, reacts with ornithine in the mitochondria to produce citrulline, which is released into the cytosol where it

7 DRAFT - DO NOT CITE OR QUOTE
reacts with aspartate to form arginosuccinate. Fumarate is then cleaved by argininosuccinate lyase to form arginine and the cycle begins again. Urea is eliminated from the body primarily through the urinary system and accounts for approximately half of the total urinary solids. Approximately 20–35 g of urea are excreted in human urine per day. Blood concentrations range from 200 to 400 mg/L (3.3–6.7 mmol/L) (OECD SIDS, 2008).
Because urea is a naturally occurring product in mammals and other biological organisms, the majority of the literature identified during the search process pertained to urea production in vivo and factors affecting its production. Relatively few studies that assessed the absorption, distribution, metabolism, and/or excretion (ADME) of exogenous urea were found. This section will only present results from studies of exogenously administered urea.
3.1. ABSORPTION
The primary route of exposure to urea is through oral exposure and, in simple stomach animals, such as humans, nonhuman primates, rodents, and pigs, ingested urea is primarily absorbed into the blood in the upper gastrointestinal tract. No studies that investigated absorption via inhalation were found. Dawes (2006) reported data for the absorption of urea through the oral mucosa in 10 adults (5 males and 5 females; age range 24–68 years; mean age 36 years) who chewed gum that contained urea as an additive. Study participants signed a consent that had been approved by the Health Research Ethics Board of the University of Manitoba and avoided eating, drinking, chewing gum, or any type of oral hygiene activities for at least 1 hour prior to the study. One group simultaneously chewed two pieces of sugar-free gum, one contained 27.30 ± 0.64 mg urea and the other contained 0.496 mg phenol red (i.e., 0.3444 ± 0.0110 mg/g gum × 1.443 g mean gum weight), which is not absorbed by the oral mucosa. The second group simultaneously chewed two pieces of gum containing only phenol red to establish the endogenous urea concentration in saliva for use as a sham control. The mean urea content (±standard deviation [SD]) was determined in saliva and residual chewed gum from each of 10 participants in the two different groups. Saliva samples were collected from each group during a 10-minute chewing time. Participants were instructed to spit into a collection vessel without swallowing any saliva. Saliva was also collected from each participant for a 5-minute period prior to initiating gum chewing. The saliva-urea content from chewing gum with only phenol was 123 ± 38 mg/L (2.05 ± 0.63 mmol/L). Based on a paired t-test, this concentration was statistically lower (p = 0.0015) than that in samples collected prior to gum chewing, 198 ± 100 mg/L (3.30 ± 1.68 mmol/L) saliva. The investigators suggested the difference was due to the higher rate of saliva production in gum chewers and longer collection time resulting in sample dilution.
The total content of urea and/or phenol red in the residual chewed gum from each participant was assayed. The concentrations were not reported; only the percentage (mean ± SD) of urea recovered was given (calculated as a function of total urea recovered in the saliva plus

8 DRAFT - DO NOT CITE OR QUOTE
residual gum, after adjusting for sham control values, and urea content of the unchewed gum). Urea absorption was determined as the percentage of urea recovered relative to the percentage of unabsorbable phenol red recovered (theoretically 100%) to adjust for sample loss due to swallowing during saliva collection. The results summarized in Table 3-1 show the percentage of phenol red and urea recovered from the saliva samples and the chewed gum residues plus saliva obtained from sham control and urea exposed participants (Dawes, 2006).
Table 3-1. The percentage of phenol red and urea recovered in the saliva and chewed gum
Groupa
Gum Saliva Chewed gum + saliva Concentration (mg)b Volumeb Percent recoveryb Percent recoveryb
Phenol red Urea (mL) Phenol red Urea Phenol red Urea Control 0.497 ND 26.31 ± 6.55 69.74 ± 8.23 91.04 ± 6.51 96.43 ± 6.43 Not done Treated 0.497 27.30 ± 0.64 24.63 ± 6.42 73.36 ± 8.34 92.72 ± 3.59 96.92 ± 6.45 85.66 ± 5.64
aControl = saliva from simultaneous chewing of two pieces of gum containing only phenol red; treated = saliva from simultaneous chewing of one piece of gum containing phenol red and one containing urea. bValues = mean ± SD. Source: Dawes (2006).
Of the total urea and phenol red recovered, 91.04 ± 6.51 and 69.74 ± 8.23%, respectively,
were attributed to release from the gum into the saliva. The mean total recovery of phenol red was 96.92 ± 6.45% (3 of the 10 values were below the lower 95% confidence limit of the assay assuming a theoretical recovery of 100%), suggesting that some participants swallowed a small amount of saliva during sample collection. By comparison, the mean total recovery of urea was 85.66 ± 5.64% (values from 9 of the 10 participants were below the lower 95% confidence limits of the assay). Based on the observation that the percentage of urea recovery was less than the nonabsorbed marker, phenol red, Dawes (2006) postulated that when the salivary urea concentration is higher than that in the plasma, urea may be absorbed through the oral mucosa. Dawes (2006) noted that calculation of an absorption coefficient was not possible since: (1) saliva urea concentrations were not maintained at a constant level, and (2) the mucosa surface area was not measured.
Nomura et al. (2006) investigated the ADME of radiolabeled urea administered by intravenous (i.v.) injection or orally (p.o.) to fasted and nonfasted male Sprague-Dawley rats (206–359 g; n = 60). Fasted rats were included in this study design as the authors were interested in the effects of diet on the disposition of urea. Uptake of urea was measured in plasma samples after i.v. injection of [14C]-urea (specific activity 32.2–35.2 MBq/mg) into either the saphenous vein or the tail vein (2 mg/1.85–3.7 MBq-kg) or p.o. administration via gavage (2–1,000 mg/1.85–3.7 MBq-kg). Nonfasted rats received food ad libitum, but the food was

9 DRAFT - DO NOT CITE OR QUOTE
removed 15 hours prior to dosing and withheld for 8 hours after treatment of the fasted rats. Urine, feces, blood, and/or tissue samples were collected at 30 minutes, and 1, 4, 8, 24, 48, 72, and/or 96 hours. In both fasted and nonfasted rats given 2 mg urea/kg body weight, plasma concentrations decreased biphasically as a function of time in both the oral and i.v. treatment groups. The pharmacokinetic parameters for the concentration and t1/2 of urea within the plasma are shown in Table 3-2.
Table 3-2. Pharmacokinetic parameters for plasma disposition of urea in fasted and nonfasted rats
Route Diet Dose
(mg/kg) Vd
a (mL/kg)
Cmaxb
(µg eq/mL) Tmax (hr)
t1/2 (hr)c AUC0-∞d
(µg eq × hr/mL) α β Intravenouse Fasted 2 749 2.0
(0.083–10) 3.5
(10–24) 8.06
Nonfasted 2 741 1.7 (0.083–10)
6.2 (10–24)
7.00
Orale Fasted 2 1.96 ± 0.17 0.5 2.1 (0.5–10)
3.4 (10–24)
7.43
Nonfasted 2 1.10 ± 0.16 1 2.5 (1–10)
7.5 (10–24)
5.18
62.5 32.1 ± 9.7 1 2.0 (2–10)
10.7 (10–24)
123.00
250 100 ± 42 1 2.1 (2–10)
9.0 (10–24)
515.00
1,000 470 ± 53 2 1.9 (2–10)
8.4 (10–24)
2,374.00
aVd: apparent volume of distribution after i.v. injection. bCmax: maximal concentration (mean ± SD, n = 3). ct1/2: calculated in each phase of the biphasic curve. In parentheses: time period (in hrs) for each phase. dArea under the curve (expressed as µg equivalents × hrs/mL). eCalculated from mean plasma concentrations of three rats. Source: Nomura et al. (2006).
The t1/2 of urea elimination in the initial phase (α) was approximately 2 hours regardless
of route of exposure or fasting condition, while the t1/2 in the second phase (β) was shorter in fasted animals for both routes of exposure (3.5 and 3.4 hours for i.v. and p.o., respectively) compared with that of the nonfasted animals (6.2 and 7.5 hours for i.v. and p.o., respectively). The α phase included the time period of approximately 0.5–10 hours and the β phase was 10–24 hours. The decrease in plasma concentrations in nonfasted rats given 62.5, 250, or 1,000 mg urea/kg p.o. was also biphasic and similar to that of the 2 mg/kg dose. The t1/2 calculated for each phase of the curve was also similar at all four doses (see Table 3-2). The maximum concentration (Cmax) and area under the curve (AUC0-∞) increased proportionally with increasing dose, indicating that urea fits a linear pharmacokinetic model across the wide range of doses

10 DRAFT - DO NOT CITE OR QUOTE
tested for both routes of exposure. The authors claim that the disposition of exogenous urea is similar to that of endogenous urea and suggests that rats have a sufficiently large capacity for disposition.
3.2. DISTRIBUTION
The disposition of urea administered exogenously is not well characterized. Two in vivo studies in rats were conducted to examine the uptake and distribution kinetics of exogenous [14C]-urea administered p.o. or intraperitoneally (i.p.) (Nomura et al., 2006; Johanson and Woodbury, 1978). The results from these studies, along with data from a more recent study by Sahin and Rowland (2007) of the hepatic kinetics of [14C]-urea in situ and the effect of erythrocytes on uptake and elimination, are presented here.
In the study by Nomura et al. (2006) described in Section 3.1, the tissue distribution of urea given p.o. was assessed in fasted (food removed 15 hours prior to treatment and withheld for 8 hours afterwards) and nonfasted (food received ad libitum) male Sprague-Dawley rats. Urine, feces, blood, and/or tissue samples (i.e., urinary bladder, kidney, gastrointestinal tissues, pancreas, liver, heart, aorta, lung, trachea, thyroid, tongue, eye ball, brain, thymus, adrenal, testes, prostate, skin, bone, and bone marrow) were collected at 30 minutes up to 96 hours after [14C]-urea (2 mg/1.85–3.7 MBq-kg) dissolved in sterilized distilled water was administered via gavage. In general, fasting had little effect on the tissue distribution but did produce a slight increase in the overall concentrations. With the exception of the brain and eyeball, the maximum tissue concentrations were recorded 30 minutes to an hour after urea administration (plasma concentration reached Cmax at 30 minutes in both the nonfasted and fasted animals; 1,231 ± 319 and 1,675 ± 938 ng eq/mL, respectively). Excluding the gastrointestinal tract (site of administration), the tissues with the highest radiolabel concentration were the kidney and urinary bladder (~2.5- and 3.2-fold higher than plasma concentrations). Fat and brain had the lowest urea concentrations (225 ± 138 and 263 ± 182 ng eq/mL, respectively) at this time point. Urea concentrations in the remaining tissues were similar to or below that in the plasma. After 24 hours, all tested tissues, with the exception of the large intestine and the Harderian gland, had below detectable levels of radiolabeled urea after 24 hours. At 72 hours, none of the tested tissues had detectable levels of radiolabeled urea.
The distribution of [14C]-urea from plasma into the lateral ventricular choroid plexus, the tissue responsible for production of cerebrospinal fluid (CSF), was investigated in adult rats to determine the permeability characteristics of the choroid plexus epithelial membrane (Johanson and Woodbury, 1978). Forty-four nephrectomized male Sprague-Dawley rats (300–425 g) were anaesthetized and injected, via i.p., with [14C]-urea (1.7 MBq [45 µCi]; dose not reported). Bilateral nephrectomy of each animal was accomplished by ligation of both renal pedicles to allow urea to reach a steady-state concentration of 370 mg/L in the plasma 8 hours after ligation. Plasma urea concentrations for control Sprague-Dawley rats ranged between 240 and 260 mg/L

11 DRAFT - DO NOT CITE OR QUOTE
(Kamm et al., 1987; Hardy et al., 1983). Rats were sacrificed 0.5, 1, 2, 3, 5, 8, 11.5, and 16 hours after injection of the isotope and samples of blood, CSF, cerebral cortex, and the lateral ventricular choroid plexus were collected. [3H]-H2O was administered, as a tracer label in the sample fluid spaces to assist in interpreting the distribution of radiolabeled urea to the brain, to 12 rats that were sacrificed 3, 6, 9, and 15 minutes after injection. The radiolabeled water and urea distribution was calculated as the ratio of radiolabel in tissue or CSF to that in plasma. Results showed that the uptake and distribution of [14C]-urea in the choroid plexus was much slower than in the skeletal muscle. A steady-state distribution was observed approximately 8 hours after injection in the choroid plexus, as well as in both the cerebral cortex and the CSF, compared with only 1 hour required to reach steady-state concentrations in muscle tissue. Evaluation of the relative concentrations (at steady-state) of radiolabeled urea in plasma, choroid epithelial cells, and CSF showed that the concentrations in the choroid epithelial cells and CSF reached a maximum concentration that was ~70% of that observed in the plasma. The authors stated that these observations, along with the lack of a concentration gradient for [14C]-urea from choroid cell to CSF, imply that the basolateral membrane of the choroid epithelial cells substantially hinders urea molecules in the plasma from entering into the epithelial cell compartment.
Sahin and Rowland (2007) evaluated the hepatic distribution kinetics of urea compared to thiourea. The effect of the presence of erythrocytes on the distribution of urea was assessed in situ using isolated perfused liver from male Sprague-Dawley rats (200–400 g). Livers were perfused in a single-pass mode (15 mL/minute) via the portal vein with Krebs-bicarbonate buffer (pH 7.4) containing 3 g/L glucose and 6 mg/L sodium taurocholate, saturated with humidified 95% O2–5% CO2. The experiments were conducted in the absence or presence of red blood cells (RBCs). In experiments with RBCs, [14C]-labeled urea (0.001 MBq [0.03 µCi]/50 µL) and the RBC suspension were incubated 30 minutes prior to injection into the liver (n = 4). The model consisted of two parallel components each representing the free and RBC-associated portions of the compound. Effluent curves were calculated based on the volume of free and RBC-associated compound. Analysis of the data showed that the presence of RBCs had no effect on urea distribution (the effluent curves from both experiments were unimodal and superimposable). These results indicate that a barrier effect by the RBCs on rapidly penetrating substances like water or urea is not expected, and therefore, RBCs could be viewed as an extension of the plasma compartment (Sahin and Rowland, 2007).
3.3. METABOLISM
There is limited information on urea metabolism. Walser and Bodenlos (1959) observed that there was no evidence that urea undergoes any metabolic transformation in humans other than hydrolysis in the gut. Results from the ADME study by Nomura et al. (2006) (previously described in Sections 3.1 and 3.2) showed no evidence of urea metabolism based on p.o.
12 DRAFT - DO NOT CITE OR QUOTE
administration of this compound to male Sprague-Dawley rats. Methanol extracts of plasma and urine samples collected at time Tmax from fasted (Tmax = 30 minutes) and nonfasted (Tmax = 1 hour) rats given [14C]-urea p.o. were analyzed by radiochromatography to identify urea metabolites. Only a single peak of unchanged urea was observed on the chromatographs regardless of time after administration or fasting condition.
In vivo colonic metabolism of urea in humans was studied by placing a tracer dose of a double labeled [15N15N]-urea into the colon of study subjects then collecting urine and stool samples for up to 72 hours to measure radiolabel (Moran and Jackson, 1990a, b). The authors noted that the Southampton Hospitals’ Ethical Committee approved these studies.
Moran and Jackson (1990a) administered 1.5 mg/kg [15N15N]-urea through the biopsy channel of a colonoscope to 12 male patients considered to have normal colons. Urine and stool samples were obtained prior to administering the radiolabeled urea to establish baseline urea concentrations. Urea was administered into the right colon (cecum) of one group of six patients and into the left colon (distal to the splenic fixture) of the remaining six patients—because it had been proposed that different segments of the colon may function differently. Urine and stool were collected for the next 72 hours and urea nitrogen in the urine was measured by mass spectrometry (MS). The concentrations of urea, ammonia nitrogen, and free nitrogen content were evaluated in samples from both groups. Unmetabolized urea excreted in the urine was detected as [15N15N]-urea. Detection of [15N14N]-urea in the urine indicated that urea had been metabolized, producing [15N]-ammonia that was reincorporated into newly synthesized urea. Following digestion of the stool samples, the nitrogen content was measured using an automatic analyzer (Kjeltec Auto 1030, Tecator Sweden).
The results showed that with the exception of one subject, <4% of the study dose (regardless of where it was administered) was recovered in the stool, indicating that >90% was absorbed. The amount of [15N14N]-urea in the urine samples ranged from 3.0 to 34.0% of the total urea dose administered to either study group. There was no indication of functional differences between the two colon segments to which urea had been administered.
In a second, similar study, Moran and Jackson (1990b) administered [15N15N]-urea (1.5 mg/kg) directly into the defunctional colons of 11 subjects (10 males and 1 female, 55–74 years old) previously diagnosed with rectal carcinomas or diverticulitis. Six of these subjects, patients who had previously received a transverse colon loop colostomy (also called a defunctioning colostomy), were in two studies. In the first study, urea was administered into the left defunctioning colon (distal to the splenic fixture) while in the second study, the test substance was infused into the right functioning colon (ascending colon). The remaining five subjects received urea via the left functioning colon (descending colon). Urine and stool samples were collected over a 72-hour period and were prepared as previously described above for analysis of [15N15N]- and [15N14N]-urea by MS. Urine and stool samples were also obtained prior to administering the radiolabeled urea to determine the baseline urea concentrations.

13 DRAFT - DO NOT CITE OR QUOTE
Nonhydrolyzed urea ([15N15N]-urea) was recovered in greater proportion in the urine of patients after placement in the defunctioned colon (median recovery 29%; range 22–74%) than it was in urine from the same patients after placement of urea in the functioning colon (median recovery 9%; range 5–14%). This was attributed to a decrease in bacterial activity in the defunctioned colon and, consequently, a decrease in urea hydrolysis. However, the recovery of hydrolyzed [15N14N]-urea in urine (expressed as a percentage of the initial dose) was similar irrespective of whether urea was administered in the patients’ left defunctioned or right functioning colon (median = 10 and 11% with ranges of 6–14 and 4–20%, respectively), indicating metabolism of the exogenously added urea. On the other hand, recovery of hydrolyzed [15N14N]-urea in urine from the five patients who were administered urea in the left functioning colon (median 21%; range 14–66%) was significantly greater (p < 0.05) than the urea recovery from the six patients given urea in the left defunctioned colon. However, recovery after placement in the left functioning colon was not significantly different from that observed after placement of urea in the right functioning colon (median recovery 11%; range 4–20%). The authors concluded that urea, when present in a functioning colon, is rapidly hydrolyzed by the bacteria present.
Forsythe and Parker (1985) studied urea synthesis and degradation in the digestive tract using New Zealand White and cross-bred Black and Brindle rabbits (2.4–3.5 kg). A cecal probe and two catheters (one in the carotid artery and one in the jugular vein) were implanted in each animal, and food and water were provided ad libitum. [14C]- or [15N]-urea (0.2 MBq [5 µCi]/hour and 976 µg urea nitrogen/hour, respectively) were infused separately into the jugular vein over a period of 7–10 hours. Samples of arterial blood from the carotid catheter and of cecal dialysate were collected over the infusion period. Urine was also collected over a 48-hour period. All values were reported as mean ± standard error of the mean (SEM). The concentrations of plasma urea and cecal dialysate ammonia remained constant (20 mg/L [0.35 mM]) throughout the infusion period, implying that urea metabolism was at steady-state. The mean irreversible loss rate (ILR) of plasma urea-carbon (26.3 ± 2.0 mg carbon urea/hour; n = 7) was calculated from the [14C]-urea infusion rate and the plateau-specific radioactivity in the plasma, a value that had to be predicted because plasma [14C] did not plateau during the infusion period. The cecal dialysate [15N]-enrichment time curve also had to be calculated because [15N]-enrichment did not plateau. The relationship between plasma [14C]-activity and cecal dialysate [15N]-enrichment time was defined by a single exponential function, suggesting that little of the urea-carbon was recycled. Therefore, the authors concluded that the ILR represented urea synthesis. Most of the [14C]-urea dose was excreted in the urine (mean fraction = 0.62 ± 0.03; n = 6), indicating that the majority of the infused urea was not metabolized but rather was absorbed directly by the gastrointestinal tract. Based on these values, the degradation rate in the gastrointestinal tract was determined to be 63 mg urea/hour. Analysis of the cecal dialysate revealed that radiolabeled urea was not present during the infusion time

14 DRAFT - DO NOT CITE OR QUOTE
period. To assess urea entry into the cecum, three animals were given [14C]-urea (0.02 MBq [0.6 µCi]/hour) intracecally along with a noncompetitive urease inhibitor. The mean cecal urea ILR was 16.8 ± 2.4 mg urea/hour (n = 3), which would represent the plasma urea entry rate (UER) if all urea in the cecum were derived from the plasma only. However, the actual calculated rate was 12.8 ± 2.3 mg urea/hour (n = 7), which represents the product of cecal ammonia nitrogen multiplied by the proportion of cecal ammonia nitrogen derived from plasma urea nitrogen (PUN). The mean PUN ILR from infusion of [15N]-urea was 40.2 ± 4.6 mg nitrogen urea/hour (n = 9). Comparison of the radiolabeled enriched nitrogen in the cecal ammonia pool with the plasma urea enriched nitrogen levels indicated that the mean proportion of cecal ammonia obtained from PUN was 0.25 ± 0.03 (n = 8). The rate of urea nitrogen reutilization after degradation in the gastrointestinal tract, calculated from the nitrogen urea synthesis rate and plasma nitrogen urea ILR, was 18.6 ± 3.5 mg nitrogen/hour (n = 7). These data show that, in the rabbit, plasma urea can enter the cecum through the blood stream where a major portion is degraded and the nitrogen is eliminated or reutilized. However, with the methodology applied here for measuring the movement and degradation of urea, only 14% of the total degraded urea could be accounted for by ileal flow into the large intestine.
3.4. ELIMINATION
A dilution technique was used to determine the urea kinetic parameters, distribution volume, production rate, and clearance using a healthy 57-year-old male (182 cm, 86 kg) compared with a 38-year-old male (177 cm, 71.5 kg) with renal failure who was receiving hemodialysis 3 times/week (Kloppenburg et al., 1997). The study was conducted with approval from the Medical Ethics Committee of the University of Groningen and informed consent from both participants. A single i.v. injection of [13C]-urea was administered to both subjects; 24 mg (0.4 mmol) to the healthy subject and 48 mg (0.8 mmol) to the patient with renal failure. Blood samples were collected at 0, 2, 5, 10, 15, and 30 minutes and then every 30 minutes thereafter up to 4 hours postinjection. Plasma was separated from the RBCs and [13C]-urea content analyzed by headspace chromatography-isotope ratio MS. The reproducibility of this method was assessed by conducting the study in the healthy volunteer 4 times over a period of 4 months. Clearance was determined by plotting logarithmic radiolabeled urea concentration versus time and doing a least squares linear regression analysis. Results show that the endogenous urea concentration in the patient with renal failure was elevated compared with the healthy subject. In addition, elimination was about sixfold greater in the healthy volunteer when compared with the renal failure volunteer (0.0674/hour vs. 0.0120/hour). Calculated urea clearance rate in the healthy subject (61.7–72.6 mL/minute; n = 4) was also higher than in the renal failure patient (7.4 mL/minute; n = 1), and the t1/2 (8.4–10.4 hours; n = 4) was shorter in the healthy subject compared with the renal failure patient (58.6 hours; n = 1).

15 DRAFT - DO NOT CITE OR QUOTE
In the Moran and Jackson (1990a, b) studies, described in Section 3.3, the excretion of [15N15N]-urea in urine and stool samples was reported. Briefly, one group of six patients received [15N15N]-urea into different segments of the colon in two separate studies. Concentrations of urea, ammonia nitrogen, and nitrogen in urine and stools collected over the next 72 hours were measured. Of the total administered dose, ranges of unmetabolized ([15N15N]) and metabolized ([15N14N]) urea recovered in the urine were 1.0–9.6 and 3.0–34.0%, respectively. The overall excretion of radiolabel in the stool was relatively low (0.4–12%) compared with the urinary concentration. The mean whole-body retention of [15N15N]-urea 72 hours after administration in the right and left colon was 74 and 82%, respectively (Moran and Jackson, 1990a).
A second study by Moran and Jackson (1990b) assessed the elimination of labeled urea in the urine and stool by MS using samples collected for 72 hours after treatment of 11 subjects (10 males and 1 female, 55–74 years old) previously diagnosed with rectal carcinomas or diverticulitis. The results showed that the majority of the radiolabeled urea was excreted through the urine and that its elimination appeared to depend upon the functional status of the colon. No radiolabel was recovered in the stool when [15N15N]-urea was placed in the left defunctioned colon. However, when [15N15N]-urea was placed into the right functioning colon of the same individuals, 1–24% of the administered radiolabel was excreted in the stool. Urinary excretion of radiolabel in these individuals was 9–29 and 35–80% of the administered dose for the left defunctioned and right functioning colon, respectively. Urinary excretion of urea from individuals with a left functioning colon was similar to that observed when urea was excreted from the right functioning colon. These results show that colonic metabolism of urea and excretion in the urine is noticeably reduced in the absence of intestinal microflora, as is the case in dysfunctional segments of the colon.
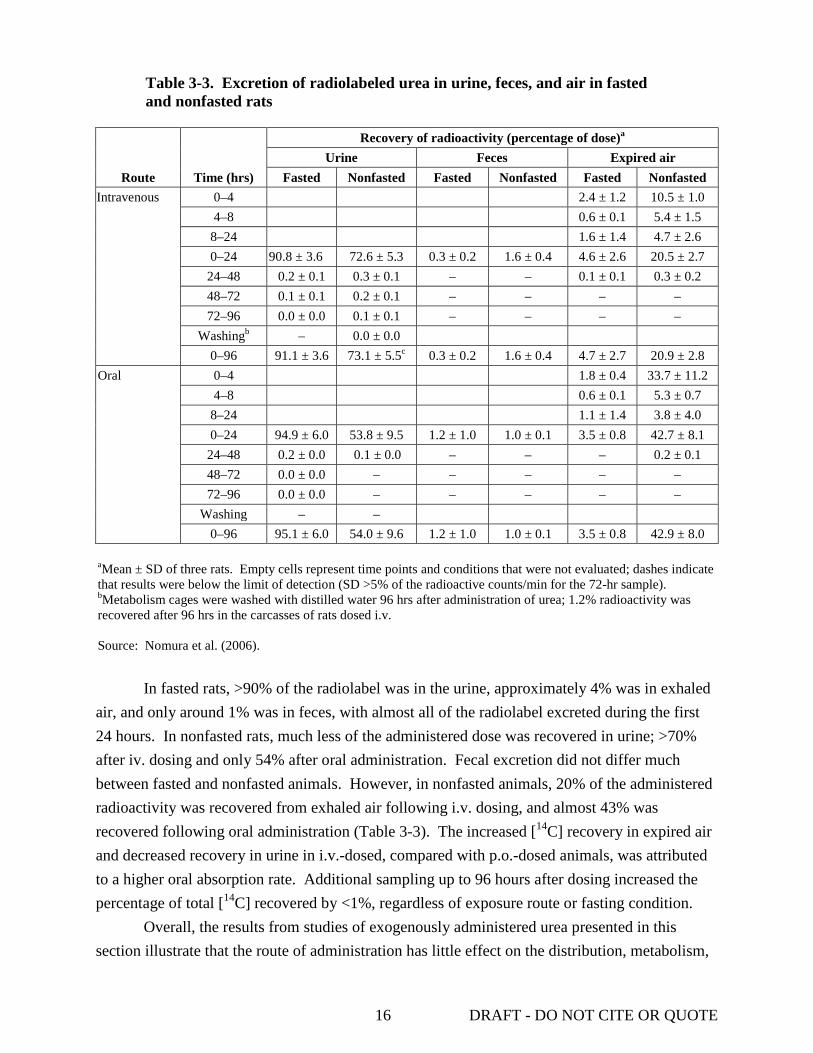
Nomura et al. (2006) studied of the elimination of [14C]-urea (specific activity 32.2–35.2 MBq/mg) administered p.o. or i.v. to fasted and nonfasted male Sprague-Dawley rats (206–359 g; n = 60). Rats were given 2 mg/kg (1.85–3.7 MBq/kg) urea dissolved in sterilized distilled water via gavage or by i.v. injection into either the saphenous vein or the tail vein (see Section 3.1 for study details). Nonfasted rats were provided food ad libitum; the food for the fasted rats was removed 15 hours prior to dosing and withheld for 8 hours after treatment. [14C] derived from radiolabeled urea was analyzed in samples of urine, feces, and expired air collected up to 96 hours after dosing. The results from this analysis are presented in Table 3-3. The total percentage of radiolabel recovered from fasted rats in urine, feces, and expired air 24 hours after dosing was comparable for each route of exposure.
16 DRAFT - DO NOT CITE OR QUOTE
Table 3-3. Excretion of radiolabeled urea in urine, feces, and air in fasted and nonfasted rats
Route Time (hrs)
Recovery of radioactivity (percentage of dose)a Urine Feces Expired air
Fasted Nonfasted Fasted Nonfasted Fasted Nonfasted Intravenous 0–4 2.4 ± 1.2 10.5 ± 1.0
4–8 0.6 ± 0.1 5.4 ± 1.5 8–24 1.6 ± 1.4 4.7 ± 2.6 0–24 90.8 ± 3.6 72.6 ± 5.3 0.3 ± 0.2 1.6 ± 0.4 4.6 ± 2.6 20.5 ± 2.7
24–48 0.2 ± 0.1 0.3 ± 0.1 – – 0.1 ± 0.1 0.3 ± 0.2 48–72 0.1 ± 0.1 0.2 ± 0.1 – – – – 72–96 0.0 ± 0.0 0.1 ± 0.1 – – – –
Washingb – 0.0 ± 0.0 0–96 91.1 ± 3.6 73.1 ± 5.5c 0.3 ± 0.2 1.6 ± 0.4 4.7 ± 2.7 20.9 ± 2.8
Oral 0–4 1.8 ± 0.4 33.7 ± 11.2 4–8 0.6 ± 0.1 5.3 ± 0.7
8–24 1.1 ± 1.4 3.8 ± 4.0 0–24 94.9 ± 6.0 53.8 ± 9.5 1.2 ± 1.0 1.0 ± 0.1 3.5 ± 0.8 42.7 ± 8.1
24–48 0.2 ± 0.0 0.1 ± 0.0 – – – 0.2 ± 0.1 48–72 0.0 ± 0.0 – – – – – 72–96 0.0 ± 0.0 – – – – –
Washing – – 0–96 95.1 ± 6.0 54.0 ± 9.6 1.2 ± 1.0 1.0 ± 0.1 3.5 ± 0.8 42.9 ± 8.0
aMean ± SD of three rats. Empty cells represent time points and conditions that were not evaluated; dashes indicate that results were below the limit of detection (SD >5% of the radioactive counts/min for the 72-hr sample). bMetabolism cages were washed with distilled water 96 hrs after administration of urea; 1.2% radioactivity was recovered after 96 hrs in the carcasses of rats dosed i.v. Source: Nomura et al. (2006).
In fasted rats, >90% of the radiolabel was in the urine, approximately 4% was in exhaled
air, and only around 1% was in feces, with almost all of the radiolabel excreted during the first 24 hours. In nonfasted rats, much less of the administered dose was recovered in urine; >70% after iv. dosing and only 54% after oral administration. Fecal excretion did not differ much between fasted and nonfasted animals. However, in nonfasted animals, 20% of the administered radioactivity was recovered from exhaled air following i.v. dosing, and almost 43% was recovered following oral administration (Table 3-3). The increased [14C] recovery in expired air and decreased recovery in urine in i.v.-dosed, compared with p.o.-dosed animals, was attributed to a higher oral absorption rate. Additional sampling up to 96 hours after dosing increased the percentage of total [14C] recovered by <1%, regardless of exposure route or fasting condition.
Overall, the results from studies of exogenously administered urea presented in this section illustrate that the route of administration has little effect on the distribution, metabolism,

17 DRAFT - DO NOT CITE OR QUOTE
or excretion of urea. In animal studies, maximum plasma and tissue concentrations were achieved 30 minutes to 1 hour after dosing. Excluding the gastrointestinal tract, the kidneys and urinary bladder tended to show the highest urea concentrations. The uptake of [14C]-urea and distribution from plasma into the lateral ventricular choroid plexus of rats was shown to be much slower than in skeletal muscle. There was little evidence that exogenously administered urea undergoes any metabolic transformation in humans or animals other than hydrolysis by bacteria in the gut. One study reported approximately 90% absorption of urea administered into the human colon, regardless of the functional condition or location within the colon. Studies also showed that urea was primarily eliminated via the urine. Although urea administered into functioning or defunctioning segments of the colon was primarily excreted via the urine, the percentage of the total dose eliminated was much lower for individuals with a defunctioning colon compared with those with a functioning colon.
3.5. PHYSIOLOGICALLY BASED TOXICOKINETIC MODELS
Marini et al. (2006) used minimally invasive catheterization protocol to study urea kinetics in conscious B6C3-derived male mice (n = 6). A single bolus dose of [15N15N]-urea (160 µg [2.66 µmol] in 9 µL pyrogen-free double-distilled water) was injected into the tail vein via an infusion/sampling catheter and blood samples were collected 5, 10, 15, 20, 25, 30, 40, 50, and 60 minutes later through the same catheter for analysis of urea content by gas chromato-graphy (GC)-MS. A continuous infusion experiment was also performed in which six male mice were infused for 6 hours with [15N15N]-urea (113 µmol/kg-hour) at a rate of 50 µL/hour and blood samples were collected from the distal tail vein catheter at 1.5, 3, 4, 5, and 6 hours after the start of infusion. Three blood samples were collected prior to infusion to establish the background urea plasma concentration.
The plasma enrichment and disappearance of urea was analyzed using a two-compartmental model previously described by Matthews and Downey (1984) and illustrated in Figure 3-2. In this model, two urea pools are assumed to be present and the flow of urea through Pool A (the primary pool) represents inflow from hepatic production of urea (Fao) and outflow of urea via renal excretion and bacterial hydrolysis in the gut (Foa). The urea mass-flow rate (F) is expressed in mmol/kg-hour. Pool B is assumed to be a secondary “blind” pool that does not have separate inflows or outflows and is connected to Pool A. The urea pool size (Q) in each compartment is reported as µmol/kg. The fractional rate constant (k) is expressed as hour-1 and is based on the tracer urea enrichment (mole percent excess) at time (t) and the rate constants from the fitted curve using nonlinear regression analysis. The subscript ba refers to flow through Pool A to B, ab refers to flow from Pool B to A, ao refers to flow from space outside the system into Pool A, and oa refers to flow from Pool A into space outside the system.

18 DRAFT - DO NOT CITE OR QUOTE
Pool A
Size = QA
Pool B
Fba
Size = QB
kba Fab
Foa
koa
Fao
kab
Pool A
Size = QA
Pool B
Fba
Size = QB
kba Fab
Foa
koa
Fao
kab
Source: Matthews and Downey (1984). Figure 3-2. Two compartmental model of human urea kinetics. Data from the single bolus injection were fit to two- or three-exponential decay curves
and analyzed based on this model. Results showed that the primary urea Pool A exchanged rapidly (Fab = Fba = 70.65 ± 14.96 mmol/kg-hour) with secondary Pool B. This resulted in the mean pool size in the secondary compartment B (QB = 4.54 ± 0.45 µmol/kg) being approximately 5 times that of the primary compartment A (QA = 0.93 ± 0.28 µmol/kg). The mean UER, also referred to as F in the model, is determined from the concentration of the single dose divided by the AUC. The UER reported for Fao, which also equals Foa in the single dose study, was 3.36 ± 0.30 mmol/kg-hour. In the continuous infusion study, plasma urea concentrations reached a plateau at 3.3 ± 0.2 hours, and a mean UER of 3.24 ± 0.23 mmol/kg-hour was calculated based on the plateau value. This rate did not differ significantly from the UER of the single dose protocol, demonstrating that the two-compartmental model can be used to analyze data obtained from different exposure types (Marini et al., 2006).
Kaplan et al. (1999) described methodologies designed to address limitations of approaches traditionally used to assess urea kinetics as they relate to dialysis challenges. A two-compartmental model such as the one described above was used to analyze urea kinetics derived from concentrations of radiolabeled and nonlabeled urea in blood and urine samples collected from dialysis patients and normal volunteers. The study protocol was approved by the Northwestern University Institutional Review Board and details of the model are described in the appendix of the published study. Five patients (four males and one female, 41–62 years old) who had received standard hemodialysis for >1 year were recruited for the study. Venous

19 DRAFT - DO NOT CITE OR QUOTE
catheters were inserted into each arm of the participants and [15N15N]-urea (3–4 g) was injected over a 5-minute period into one arm and 16 blood samples were collected via the catheter in the other arm over a period of 5–720 minutes. Dialysis began 24 hours later and nine arterial and venous blood samples were collected over a period of 15–240 minutes after dialysis was initiated. Five volunteers who were not dialysis patients (three males and two females, 36–54 years old) and who had participated in a previous study of urea kinetics based on a three-compartmental model (Odeh et al., 1993; described below), received 2 g of [15N15N]-urea and 19 blood samples were collected over a period of 5–480 minutes. Timed urine collections were also obtained from all participants throughout the study.
[15N15N]- and [15N14N]-urea concentrations in all samples collected were analyzed by GC-MS. Samples collected during the predialysis period were analyzed as a function of time using the two-compartment model. [15N14N]-Urea concentrations were modeled assuming they followed the same disposition kinetics as the radiolabeled urea; however, adjustable parameters for describing the initial concentration of urea in each compartment at time zero and the constant rate of urea production input into the primary compartment were included. The results showed that there was no difference in intercompartmental clearance rates (the rate at which the volume of the central compartment multiplied by its transfer rate constant equals the volume of the peripheral compartment multiplied by its transfer rate constant) for the predialysis (1.26 ± 0.5 L/minute), intradialysis (1.2 ± 0.5 L/minute), and normal subjects (1.14 ± 0.31 L/minute). Likewise, the nonrenal clearance rates for the pre- and intradialysis samples did not differ (5.9 ± 3.6 and 6.5 ± 2.9 mL/minute, respectively). The results from the pharmacokinetic modeling presented in this study suggest that a two-compartment model satisfies all aspects of urea distribution and removal; however, the authors noted that the compartments should not be equated with any specific physiologic spaces (Kaplan et al., 1999).
Inulin (a naturally occurring polysaccharide) and [15N15N]-urea kinetics were assessed in five healthy subjects (three males and two females, 36–54 years old) following simultaneous i.v. injection (Odeh et al., 1993). Review of the publication did not provide information on the human subjects research ethics procedures undertaken in this study, but there is no evidence that the conduct of the research was fundamentally unethical or significantly deficient relative to the ethical standards prevailing at the time the research was conducted. Blood and urine samples were collected over an 8-hour period and urea concentrations were measured as described above for the Kaplan et al. (1999) study. The data were used to describe the physiologic basis of multicompartmental systems often used to model drug distribution based on a three-compartment model that uses intravascular space as the central compartment and splanchnic and somatic tissues as two peripheral components. The results reported for urea only are discussed here. One of the unique features of this model is that it includes interstitial and intracellular fluid spaces for both of the tissue compartments; however, the transfer of urea in these spaces occurs too rapidly for characterization of the kinetics. Urea from the primary compartment (intravascular space)

20 DRAFT - DO NOT CITE OR QUOTE
distributes rapidly into the splanchnic tissue compartment but slowly into the somatic tissue compartment. The mean volume of distribution for urea calculated from the three-compartment model was 0.670 ± 0.143 L/kg, which was very similar to the value of 0.68 L/kg previously reported by Matthews and Downey (1984) using a two-compartmental model. Blood flows and permeability coefficient-surface area products for the peripheral compartments (i.e., splanchnic and somatic tissue compartments) were determined. The average sum of compartmental blood flows was 5.39 ± 0.49 L/minute, a value similar to the results of Doppler measurements of cardiac output (5.47 ± 0.40 L/minute) (Odeh et al., 1993).
[14C]-Urea concentrations in brain, plasma, and CSF obtained from rats treated with urea by three different exposure regimens were analyzed by Rapoport et al. (1982) using a four-compartmental model of the central nervous system (CNS) to determine the best-fit values for transfer constants. The four intracranial compartments used in the model were capillary blood plasma (compartment 0), brain extracellular fluid (compartment 1), brain intracellular fluid or bound space (compartment 2), and CSF (compartment 3). Steady-state urea concentrations for plasma, CSF, and brain tissue of nephrectomized rats dosed by i.p. injection, previously published by Johanson and Woodbury (1978), were used for comparison (see Section 3.2). Urea concentrations in samples from male Osborne-Mendel rats (250–350 g) infused with [14C]-urea (0.07–3.7 MBq [2–10 mCi]/mM; dose not reported) into the femoral vein at a constant rate were determined 10, 20, and 40 minutes after start of the infusion. Samples following a single i.v. bolus were taken at 10, 20, and 30 minutes post injection. The transfer constants (k) and other parameters derived from all three datasets were found to be consistent among the three dosing regimens and to agree with published values (when available). The brain/plasma distribution constant for the Johanson and Woodbury (1978) study was 1.1 × 10⁻⁴/second compared to the constants calculated from the six tissue sites in the infusion (0.6–1.1 × 10⁻⁴/second) and bolus study (0.7–0.9 × 10⁻⁴/second). The steady-state concentration ratios (k1/k2* + k5 where k1 = the transfer constant for the exchange between cerebral capillary plasma and extracellular brain space, k2* = k2 × k1 adjusted for blood flow rate /k1, k2 = the transfer constant for exchange between extracellular brain space and capillary plasma, and k5 = the transfer constant for the exchange between extracellular brain space and CSF) for the three regimens were 0.19, 0.10–0.17, and 0.09–0.19, respectively, which were comparable to values of 0.15–0.25 reported in the literature. The brain/CSF distribution constant, calculated from the Johanson and Woodbury (1978) data, was 2.0 × 10⁻⁴/second, consistent with the dispersion of a water-soluble nonelectrolyte like urea that can diffuse through the brain primarily via the aqueous intercellular matrix. Overall, the results presented in this study indicate that a four-compartmental model can be used to calculate transfer constants between plasma, brain intracellular or extracellular fluid, and CSF. All of the equations used for fitting data to a nonlinear least-squares regression and for calculating transfer constants are described in detail in the paper (Rapoport et al., 1982).
21 DRAFT - DO NOT CITE OR QUOTE
4. HAZARD IDENTIFICATION 4.1. STUDIES IN HUMANS—EPIDEMIOLOGY, CASE REPORTS AND CLINICAL CONTROLS 4.1.1. Oral Exposure
No epidemiologic studies on oral exposure to urea were identified. However, there are some volunteer or accidental exposure studies on urea toxicity after oral ingestion. In studies by Eknoyan et al. (1969), blood from 26 patients with renal disease was analyzed to assess the role of urea in the pathogenesis of thrombopathy observed in renal failure. The patients were divided into two groups, 10 who had bleeding complications and 16 who did not. A variety of platelet function studies were conducted in both groups including platelet counts, bleeding time, clotting time, prothrombin time, prothrombin consumption, thromboplastin generation, platelet adhesiveness, and activated partial thromboplastin time. Review of the publication did not provide information on the human subjects research ethics procedures undertaken in this study, but there is no evidence that the conduct of the research was fundamentally unethical or significantly deficient relative to the ethical standards prevailing at the time the research was conducted.
According to the authors, the most consistent difference observed between the two groups was a reduction in the platelet adhesiveness. Comparison of the two groups showed that platelet adhesiveness was significantly lower in patients with bleeding than in those without bleeding: mean platelet adhesiveness was 4.2 ± 7.4% in the bleeding group compared to 22 ± 17% in the nonbleeding group (p < 0.01) (below 20% was considered abnormal). Compared to a control value of 5 minutes, seven of the nine evaluated bleeders had longer bleeding times (5.5–10 minutes), while only three nonbleeding patients showed longer bleeding times (5.5–10 minutes). Overall, prothrombin consumption was only decreased in individuals with bleeding. Evaluation of the relationship between platelet adhesiveness and concentration of serum urea nitrogen (SUN) concentrations showed an inverse correlation. Platelet adhesiveness was decreased when SUN concentrations were ≥1 mg/mL (p < 0.01). Additionally, experimental azotemia was induced in 10 normal subjects. The subjects ingested 2–3 g/kg-hour urea. SUN concentrations of 0.06–1.2 g/ L were maintained for 24 hours in six subjects. In the remaining four subjects, similar SUN concentrations were maintained for 8–10 hours. As observed in the patients with renal disease, platelet adhesiveness was reduced. Among the group in which SUN concentrations were maintained for 24 hours, 83% (5/6) exhibited decreased platelet adhesiveness after urea treatment. Differences in platelet adhesiveness percent before and after administration ranged from 18 to 38%. Of the group in which urea concentrations were maintained for 8–10 hours, 75% (3/4) also exhibited decreased platelet adhesiveness after urea treatment. Differences in platelet adhesiveness percent before and after administration ranged

22 DRAFT - DO NOT CITE OR QUOTE
from 2 to 60%. The authors concluded that urea or a urea metabolite may play a role in the development of thrombopathy observed in renal failure.
Bensinger et al. (1972) evaluated the effect of oral administration of urea on erythrocyte survival in patients with sickle cell disease. Review of the publication does not provide information on the human subjects research ethics procedures undertaken in this study. Eight African-American subjects (six males and two females, 19–53 years old) with sickle cell disease ingested 8–40 g urea 2–5 times/day (total of 40–120 g/day) for at least 3 weeks. Autologous erythrocyte survival was measured by [51Cr] and/or DF[32P]. Studies indicated that urea administration increased RBC t1/2 on average by 1.2 days, which was not significant. The authors noted that isotopic techniques used in this study may not have been sensitive enough to assess slight changes in hemolysis.
A report by Steyn (1961) described an outbreak of accidental poisoning among 80 farm workers presumed to be exposed to a fertilizer containing 98% urea. The workers developed symptoms 3–5 hours after exposure. The first symptoms were nausea and persistent vomiting. This was followed by excitement and convulsions accompanied by urination. The symptoms were similar to those observed with strychnine poisoning. None of the patients died and all of them completely recovered within a few days. No quantitative data related to urea concentrations in the patients were provided. The author stated that, in a confirmatory experiment using rabbits, the suspected fertilizer was approximately 3 times more toxic than British Pharmacopoeia-quality urea, but the postmortem symptoms were similar for both agents.
4.1.2. Inhalation Exposure
Studies have been conducted to assess the impact of inhalational exposure to urea, urea-based formulations and products, and urea-containing mixtures. The following sections discuss studies and results from retrospective assessments, experimental studies, and case reports.
4.1.2.1. Cohort Studies
El Far et al. (2006) evaluated the impact of occupational exposure to industrial environmental chemicals, including urea, on liver and kidney function and on the levels of three biomarkers of carcinogenesis: carcinoembryonic antigen (CEA), alpha-fetoprotein (AFP), and prostate-specific antigen (PSA). Male workers who were negative for the hepatitis C virus and hepatitis B surface antigen were included in the study. One study group consisted of eight workers exposed to urea for an average length of 8 years, while another group consisted of 13 workers exposed to mixed vapors (phenol, formaldehyde, and urea) for an average length of 13.5 years. The average length of exposure was 8 hours/day. Fifteen subjects not exposed to urea were used as controls. Exposure concentrations were not quantified.
As shown in Table 4-1 liver and kidney function tests indicated that urea exposure, alone or in combination with other industrial chemicals, significantly increased serum aspartate
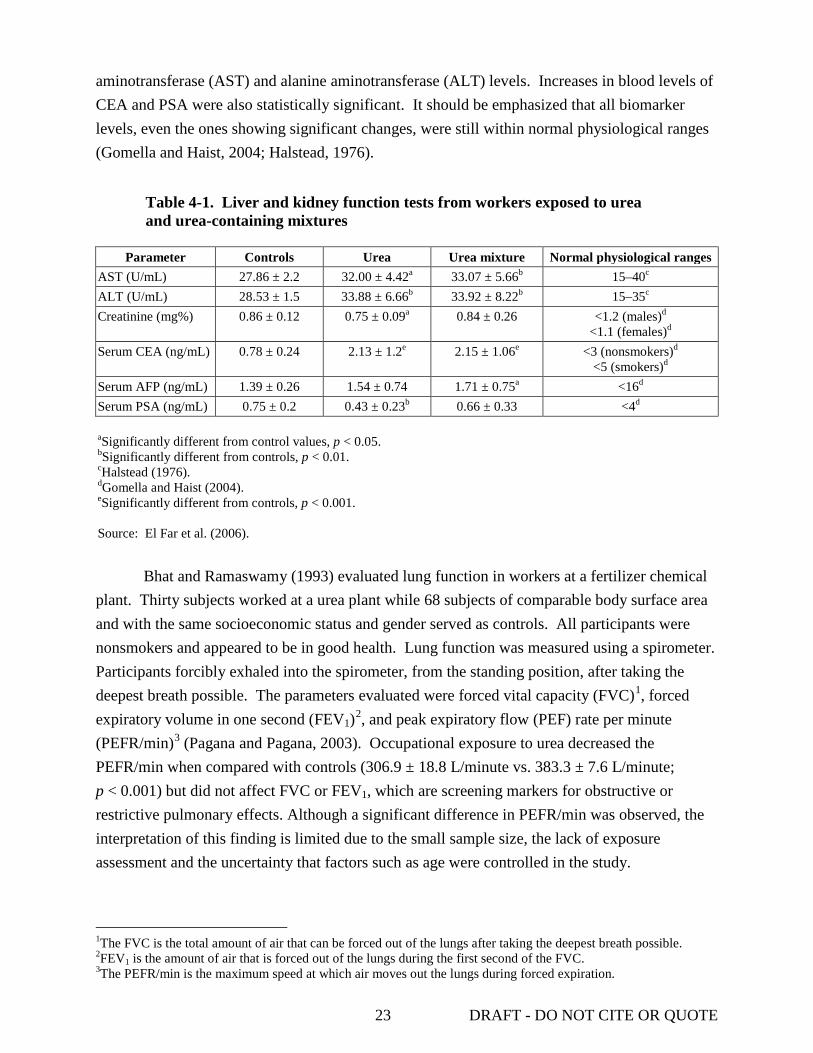
23 DRAFT - DO NOT CITE OR QUOTE
aminotransferase (AST) and alanine aminotransferase (ALT) levels. Increases in blood levels of CEA and PSA were also statistically significant. It should be emphasized that all biomarker levels, even the ones showing significant changes, were still within normal physiological ranges (Gomella and Haist, 2004; Halstead, 1976).
Table 4-1. Liver and kidney function tests from workers exposed to urea and urea-containing mixtures
Parameter Controls Urea Urea mixture Normal physiological ranges
AST (U/mL) 27.86 ± 2.2 32.00 ± 4.42a 33.07 ± 5.66b 15–40c
ALT (U/mL) 28.53 ± 1.5 33.88 ± 6.66b 33.92 ± 8.22b 15–35c
Creatinine (mg%) 0.86 ± 0.12 0.75 ± 0.09a 0.84 ± 0.26 <1.2 (males)d
<1.1 (females)d Serum CEA (ng/mL) 0.78 ± 0.24 2.13 ± 1.2e 2.15 ± 1.06e <3 (nonsmokers)d
<5 (smokers)d Serum AFP (ng/mL) 1.39 ± 0.26 1.54 ± 0.74 1.71 ± 0.75a <16d Serum PSA (ng/mL) 0.75 ± 0.2 0.43 ± 0.23b 0.66 ± 0.33 <4d aSignificantly different from control values, p < 0.05. bSignificantly different from controls, p < 0.01. cHalstead (1976). dGomella and Haist (2004). eSignificantly different from controls, p < 0.001. Source: El Far et al. (2006).
Bhat and Ramaswamy (1993) evaluated lung function in workers at a fertilizer chemical
plant. Thirty subjects worked at a urea plant while 68 subjects of comparable body surface area and with the same socioeconomic status and gender served as controls. All participants were nonsmokers and appeared to be in good health. Lung function was measured using a spirometer. Participants forcibly exhaled into the spirometer, from the standing position, after taking the deepest breath possible. The parameters evaluated were forced vital capacity (FVC)1, forced expiratory volume in one second (FEV1)2, and peak expiratory flow (PEF) rate per minute (PEFR/min)3
1The FVC is the total amount of air that can be forced out of the lungs after taking the deepest breath possible.
(Pagana and Pagana, 2003). Occupational exposure to urea decreased the PEFR/min when compared with controls (306.9 ± 18.8 L/minute vs. 383.3 ± 7.6 L/minute; p < 0.001) but did not affect FVC or FEV1, which are screening markers for obstructive or restrictive pulmonary effects. Although a significant difference in PEFR/min was observed, the interpretation of this finding is limited due to the small sample size, the lack of exposure assessment and the uncertainty that factors such as age were controlled in the study.
2FEV1 is the amount of air that is forced out of the lungs during the first second of the FVC. 3The PEFR/min is the maximum speed at which air moves out the lungs during forced expiration.

24 DRAFT - DO NOT CITE OR QUOTE
Marsh et al. (2002) evaluated a cohort of 995 workers (93.2% white) whose work histories included exposure to nitrogen products (specifically, nitric acid, ammonia, and urea) (27,666 person-years). The nitrogen products cohort consisted of workers exposure to nitrogen products only, nitrogen product followed by acrylonitrile, and potential intermittent exposure to nitrogen products. Cohort mortality from bladder cancer was compared to bladder cancer deaths from a local seven-county area to compute expected numbers of deaths. The standardized mortality ratio (SMR) for bladder cancer in the nitrogen product-exposed cohort, based on four bladder cancer cases was 3.31 (95% confidence interval [CI]: 0.90–8.47). When workers with potential intermittent exposure to nitrogen products were removed, the SMR increased to 3.77 (95% CI: 1.03–9.65) in a reduced subcohort of 820 workers. Effects based on urea exposure alone were not derived. The authors noted that a low incidence of bladder cancers deaths—four in the full and the reduced cohorts—and the mixed chemical exposure limited the power of the study, even suggesting that the bladder cancer excess may be due to occupational exposure prior to employment in the nitrogen products division.
4.1.2.2. Experimental Studies
Lung function in symptom-free asthmatic subjects was evaluated after inhalation of urea aerosol (urea was tested for asthma-inducing potential) (Cade and Pain, 1972). A total of 56 subjects (32 males and 24 females, 16–78 years, average 42 years) were evaluated. Criteria for inclusion in the study were: (1) clinical episodes of dyspnea with wheeze, (2) responsiveness of symptoms to bronchodilators, (3) intervals of complete remission, (4) absence of chronic disease, and (5) absence of complicating factors (e.g., localized disease). Review of the publication does not provide information on the human subjects research ethics procedures undertaken in this study. Urea aerosol was inhaled as a 4 M solution from a nebulizer for 10 minutes. Spirometric measurements of vital capacity (VC) and FEV1 were made. PEF was measured using an air flow meter. Additional measurements included functional residual capacity, residual volume, total lung capacity, tidal volume, and respiratory rate. Measurements (spirometric and lung volume) were taken before and 2 minutes after urea exposure. Overall, urea inhalation produced mild and variable impairments of VC (decrease 13 ± 17%; p < 0.001) and FEV1 (decrease 12 ± 20%; p < 0.001). The changes in the other evaluated parameters were not significant and there was no significant correlation between individual initial and postexposure values of VC and FEV1, respectively.
4.1.3. Dermal Exposure
Disparate results were reported for the skin-irritating effects of urea after dermal administration. Two of four studies showed that dermal application of urea produced no skin irritation (Serup, 1992; Gollhausen and Kligman, 1985). In studies by Serup (1992), forearms of healthy volunteers were treated with two applications of 3% (22 volunteers: 5 males and
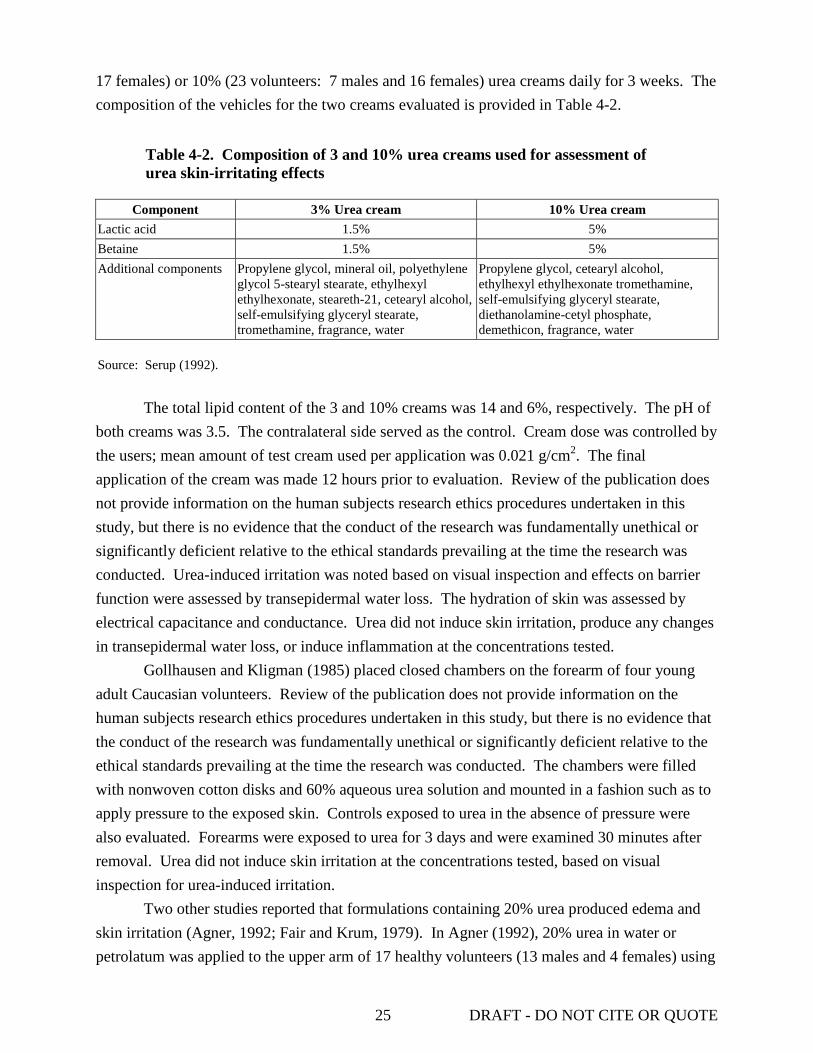
25 DRAFT - DO NOT CITE OR QUOTE
17 females) or 10% (23 volunteers: 7 males and 16 females) urea creams daily for 3 weeks. The composition of the vehicles for the two creams evaluated is provided in Table 4-2.
Table 4-2. Composition of 3 and 10% urea creams used for assessment of urea skin-irritating effects
Component 3% Urea cream 10% Urea cream
Lactic acid 1.5% 5% Betaine 1.5% 5% Additional components Propylene glycol, mineral oil, polyethylene
glycol 5-stearyl stearate, ethylhexyl ethylhexonate, steareth-21, cetearyl alcohol, self-emulsifying glyceryl stearate, tromethamine, fragrance, water
Propylene glycol, cetearyl alcohol, ethylhexyl ethylhexonate tromethamine, self-emulsifying glyceryl stearate, diethanolamine-cetyl phosphate, demethicon, fragrance, water
Source: Serup (1992).
The total lipid content of the 3 and 10% creams was 14 and 6%, respectively. The pH of
both creams was 3.5. The contralateral side served as the control. Cream dose was controlled by the users; mean amount of test cream used per application was 0.021 g/cm2. The final application of the cream was made 12 hours prior to evaluation. Review of the publication does not provide information on the human subjects research ethics procedures undertaken in this study, but there is no evidence that the conduct of the research was fundamentally unethical or significantly deficient relative to the ethical standards prevailing at the time the research was conducted. Urea-induced irritation was noted based on visual inspection and effects on barrier function were assessed by transepidermal water loss. The hydration of skin was assessed by electrical capacitance and conductance. Urea did not induce skin irritation, produce any changes in transepidermal water loss, or induce inflammation at the concentrations tested.
Gollhausen and Kligman (1985) placed closed chambers on the forearm of four young adult Caucasian volunteers. Review of the publication does not provide information on the human subjects research ethics procedures undertaken in this study, but there is no evidence that the conduct of the research was fundamentally unethical or significantly deficient relative to the ethical standards prevailing at the time the research was conducted. The chambers were filled with nonwoven cotton disks and 60% aqueous urea solution and mounted in a fashion such as to apply pressure to the exposed skin. Controls exposed to urea in the absence of pressure were also evaluated. Forearms were exposed to urea for 3 days and were examined 30 minutes after removal. Urea did not induce skin irritation at the concentrations tested, based on visual inspection for urea-induced irritation.
Two other studies reported that formulations containing 20% urea produced edema and skin irritation (Agner, 1992; Fair and Krum, 1979). In Agner (1992), 20% urea in water or petrolatum was applied to the upper arm of 17 healthy volunteers (13 males and 4 females) using

26 DRAFT - DO NOT CITE OR QUOTE
Finn chambers or Scanpore® tape. Chambers with the vehicles (water or petrolatum) served as controls. The authors noted that informed consent was obtained from all the participants and that the study was approved by the local medical ethics committee. Chambers that had been attached to the skin to allow contact with the test material were removed after 24 hours. Test sites were evaluated prior to patch testing and after 24- and 48-hour exposures. Erythema was visually scored on a scale of 0–3, inflammatory responses were assessed superficial blood flow by laser Doppler flowmeter and edema formation by ultrasound A-scan, and barrier function was assessed by transepidermal water loss. Urea in petrolatum produced visible reactions that were more pronounced than the reactions observed with urea in water. Erythema scores of 1 or 2 were observed in 10 of 17 volunteers exposed to urea in petrolatum; comparatively, 3 of 17 volunteers had a score of 1 or 2 when exposed to urea in water (p < 0.001). Petrolatum and water controls had no scores of 1 and two scores of 2. Urea in petrolatum increased blood flow and produced edema after a 24-hour exposure compared with preapplication and control values (p < 0.01) (data provided in a figure in Agner, 1992). Transepidermal water loss also significantly increased after 24 hours (p < 0.01) (data provided in a figure in Agner, 1992). The changes were transient and values returned to control levels within 24 hours. Urea in water produced edema after a 24-hour exposure. However, the increase was not significant when compared to controls (data provided in a figure in Agner, 1992).
Fair and Krum (1979) applied 0.3 g of a 10% urea base and 20% urea cream (with nonlipid emollients) daily to a paraspinal area of the skin on 16 male volunteers. Substances were applied for 21 days using a closed patch system. Irritation was evaluated 30 minutes after each daily exposure period ended. The authors noted that informed consent was obtained from all the participants. Urea-induced irritation was based on visual inspection (score from 0 to 4). The 10% urea base produced no irritation (average cumulative irritancy score = 0). By comparison, 20% urea cream was shown to be one of the most irritating substances tested. The cumulative irritancy scores for the 20% urea cream ranged from 7.5 to 43.5. The authors hypothesized that the increased irritation was due to the greater protein denaturing effect of the higher percentage of urea under occlusion.
Johnson et al. (1970) used a skin window technique to assess the effects of varying concentrations of urine and its electrolytic and nonelectrolytic components (saline and urea) on the phagocytic ability of leukocytes. Isotonic urea solutions were applied to two healthy male volunteers. The samples were applied to the arm or forearm (no further information on location provided) using the skin window technique of Rebuck and Crowley (1955). Review of the publication does not provide information on the human subjects research ethics procedures undertaken in this study, but there is no evidence that the conduct of the research was fundamentally unethical or significantly deficient relative to the ethical standards prevailing at the time the research was conducted. In this method, the skin was abraded with a sterile scalpel or razor blade to expose the corium. One drop of isotonic urea was applied to the corium that
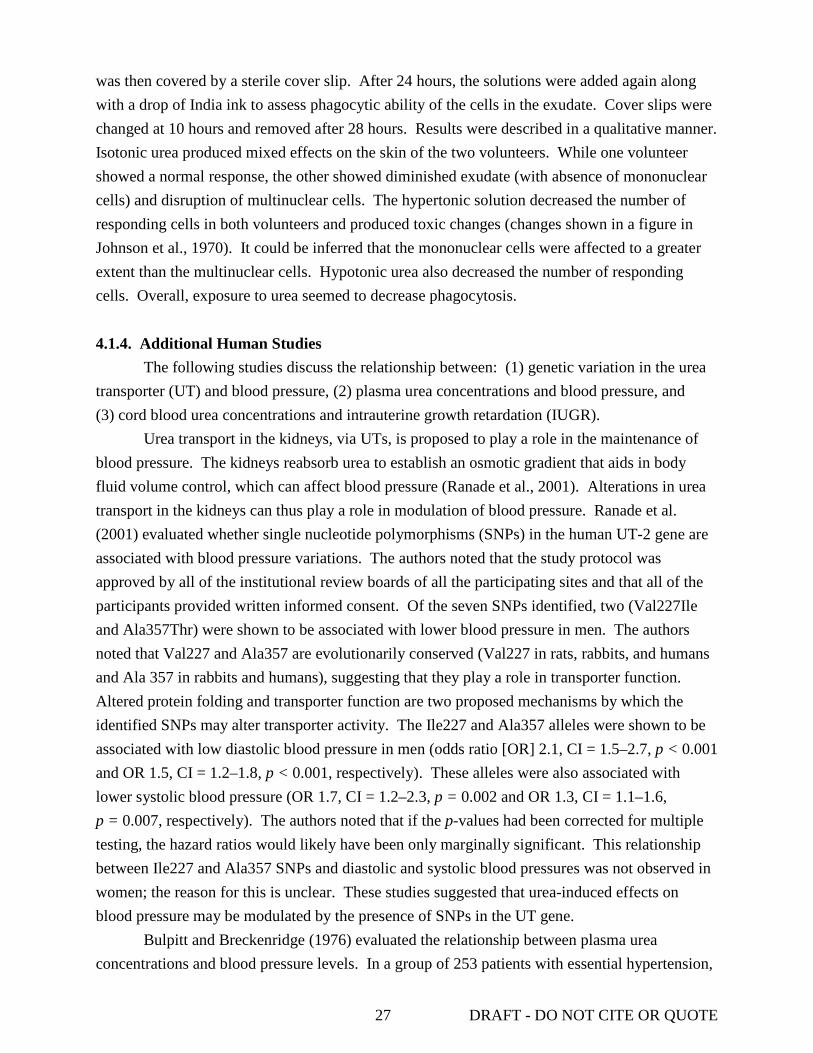
27 DRAFT - DO NOT CITE OR QUOTE
was then covered by a sterile cover slip. After 24 hours, the solutions were added again along with a drop of India ink to assess phagocytic ability of the cells in the exudate. Cover slips were changed at 10 hours and removed after 28 hours. Results were described in a qualitative manner. Isotonic urea produced mixed effects on the skin of the two volunteers. While one volunteer showed a normal response, the other showed diminished exudate (with absence of mononuclear cells) and disruption of multinuclear cells. The hypertonic solution decreased the number of responding cells in both volunteers and produced toxic changes (changes shown in a figure in Johnson et al., 1970). It could be inferred that the mononuclear cells were affected to a greater extent than the multinuclear cells. Hypotonic urea also decreased the number of responding cells. Overall, exposure to urea seemed to decrease phagocytosis.
4.1.4. Additional Human Studies
The following studies discuss the relationship between: (1) genetic variation in the urea transporter (UT) and blood pressure, (2) plasma urea concentrations and blood pressure, and (3) cord blood urea concentrations and intrauterine growth retardation (IUGR).
Urea transport in the kidneys, via UTs, is proposed to play a role in the maintenance of blood pressure. The kidneys reabsorb urea to establish an osmotic gradient that aids in body fluid volume control, which can affect blood pressure (Ranade et al., 2001). Alterations in urea transport in the kidneys can thus play a role in modulation of blood pressure. Ranade et al. (2001) evaluated whether single nucleotide polymorphisms (SNPs) in the human UT-2 gene are associated with blood pressure variations. The authors noted that the study protocol was approved by all of the institutional review boards of all the participating sites and that all of the participants provided written informed consent. Of the seven SNPs identified, two (Val227Ile and Ala357Thr) were shown to be associated with lower blood pressure in men. The authors noted that Val227 and Ala357 are evolutionarily conserved (Val227 in rats, rabbits, and humans and Ala 357 in rabbits and humans), suggesting that they play a role in transporter function. Altered protein folding and transporter function are two proposed mechanisms by which the identified SNPs may alter transporter activity. The Ile227 and Ala357 alleles were shown to be associated with low diastolic blood pressure in men (odds ratio [OR] 2.1, CI = 1.5–2.7, p < 0.001 and OR 1.5, CI = 1.2–1.8, p < 0.001, respectively). These alleles were also associated with lower systolic blood pressure (OR 1.7, CI = 1.2–2.3, p = 0.002 and OR 1.3, CI = 1.1–1.6, p = 0.007, respectively). The authors noted that if the p-values had been corrected for multiple testing, the hazard ratios would likely have been only marginally significant. This relationship between Ile227 and Ala357 SNPs and diastolic and systolic blood pressures was not observed in women; the reason for this is unclear. These studies suggested that urea-induced effects on blood pressure may be modulated by the presence of SNPs in the UT gene.
Bulpitt and Breckenridge (1976) evaluated the relationship between plasma urea concentrations and blood pressure levels. In a group of 253 patients with essential hypertension,
28 DRAFT - DO NOT CITE OR QUOTE
the average plasma urea concentrations were significantly higher in: (1) men (380 mg/L [6.35 mmol/L], n = 86) than in women (330 mg/L [5.55 mmol/L], n = 90; p < 0.001), and (2) men with secondary hypertension (430 mg/L [7.13 mmol/L], n = 33) compared to those with essential hypertension (380 mg/L [6.35 mmol/L], n = 86; p < 0.05). A group of 1,217 patients (614 men and 603 women) was also evaluated to assess the relationship between age, urea concentration, and blood pressure on presentation. As shown in Table 4-3, the mean plasma urea concentrations increased with the mean blood pressure for both sexes.
Table 4-3. Relationship between mean blood pressure and plasma urea concentrations
Sex
Mean blood pressure (mm Hg) ≤130 <140 <150 <160 <170 <180 >180
Blood urea levels (mmol/L)a Male 5.65 (86) 6.07 (89) 6.35 (98) 6.57 (100) 7.16 (100) 8.34 (68) 8.55 (73) Female 5.24 (105) 5.47 (100) 5.28 (102) 6.35 (88) 5.78 (93) 6.18 (67) 6.85 (48) aValues in parentheses are numbers of patients in the respective blood pressure groups. Source: Bulpitt and Breckenridge (1976).
McKay and Kilpatrick (1964) evaluated the relationship between plasma urea
concentrations and birth weight. Studies in 106 infants (single births) showed that mean cord plasma urea concentrations were significantly increased (p < 0.02) in those infants that were categorized as showing IUGR. Mean cord plasma urea concentration in 16 infants classified as IUGR was 232 mg/L. By comparison, mean cord plasma concentration in 90 normal infants was 186 mg/L. Further studies showed that when the infants were divided into birth weight groups, urea concentrations overall were shown to decrease with increasing birth weight (31–71 ounces: 218 mg/L; 72–79 ounces: 207 mg/L; 80–87 ounces: 206 mg/L; 88–103 ounces: 190 mg/L; 104–119 ounces: 145 mg/L; 120–152 ounces: 188 mg/L). Evaluation by analysis of variance showed that plasma concentrations for the birth weight range of 104–119 ounces were statistically different from the remaining weight groups (p < 0.05). The urea concentrations were adjusted to a common gestation length of 40 weeks to control for varying gestation lengths because it was observed that umbilical cord plasma urea concentrations increased with gestational duration. Using a multiple range test, a comparison between any two of the six adjusted means was conducted to assess significance. When controlled for gestation length, differences in mean urea concentrations between the birth weight groups became highly significant (31–71 ounces: 251 mg/L; 72–79 ounces: 218 mg/L; 80–87 ounces: 214 mg/L; 88–103 ounces: 195 mg/L; 104–119 ounces: 148 mg/L; 120–152 ounces: 184 mg/L). Results showed that birth weight over 88 ounces was associated with mean urea concentrations that were significantly lower than urea concentrations associated with birth weight under 72 ounces

29 DRAFT - DO NOT CITE OR QUOTE
(p < 0.05). Additionally, plasma urea concentrations were estimated for 27 pairs of twins. Comparison of twin birth weights and urea concentrations did not show an association between weight and urea concentrations (heavier twin: 93.35 ± 20.11 ounces, plasma urea concentrations: 236 ± 65 mg/L; lighter twin: 80.00 ± 17.13 ounces, plasma urea concentrations: 241 ± 57 mg/L).
Al-Homrany (2001) noted that the serum activities of a variety of enzymes (creatinine kinase, lactic dehydrogenase, alkaline phosphatase, ALT, and AST, and gamma-glutamyl transpeptidase) were elevated in dialysis patients but it is not known whether this was a direct effect of blood urea levels or an indicator of toxicity. Serum samples were obtained from two different groups: 100 hemodialysis patients and 80 control patients with normal renal function but high serum enzyme levels. Review of the publication does not provide information on the human subjects research ethics procedures undertaken in this study, but there is no evidence that the conduct of the research was fundamentally unethical or significantly deficient relative to the ethical standards prevailing at the time the research was conducted. For the hemodialysis patients, a portion of the sample was dialyzed against 200 mL phosphate buffered saline to remove endogenous urea. For the control patients, 10 mL of concentrated urea solution (10%) was added to a portion of the sample to increase urea concentrations by 3 mg/mL. Studies showed that removal of urea from hemodialysis patients increased lactic dehydrogenase activity significantly (7,793.71 ± 3,482.09 vs. 10,696.79 ± 12,905.51 units/mg serum protein; p = 0.0007) but the other enzyme activities were not significantly changed. Urea addition decreased gamma-glutamyl transaminase activity fivefold (4,418.67 ± 9,664.20 vs. 871.15 ± 1,368.52 units/mg serum protein after addition; p = 0.04) and increased alkaline phosphatase activity slightly (1,792.42 ± 1,712.40 vs. 1,761.23 ± 1,686.31 units/mg serum protein; p = 0.05). The author emphasized the importance of recording blood urea concentrations when assessing serum enzyme activities for diagnostic purposes.
4.2. SUBCHRONIC AND CHRONIC STUDIES AND CANCER BIOASSAYS IN ANIMALS—ORAL AND INHALATION 4.2.1. Oral Exposure 4.2.1.1. Subchronic Studies
No subchronic exposure studies were identified that addressed the toxic effects of urea in animals via the oral route.
4.2.1.2. Chronic Studies A chronic carcinogenicity assay was conducted on urea by the National Cancer Institute (NCI) (Fleischman et al., 1980). Urea was administered in ground feed to male and female F344 rats and C57BL/6 mice 7 days/week for 12 months. Technical-grade urea was supplied by Aldrich Chemical Company, Inc., Milwaukee, Wisconsin; chemical purity was not noted in this report.

30 DRAFT - DO NOT CITE OR QUOTE
Feed (Wayne Lab Blox, Allied Mills, Inc., Chicago, Illinois) in meal form was administered ad libitum alone or in combination with urea. Male and female rats and mice at 6 weeks of age were treated with 0.45, 0.9, and 4.5% urea in the diet (food consumption and dose per kg were not noted). Food consumption is calculated by using the formula feed intake (kg/day) = 0.065 × (body weight)0.7919 According to U.S. EPA (1988), the default body weights for F344 rats in a 1-year study are 0.29 kg for males and 0.175 kg for females. For C57BL/6 mice, corresponding values are 0.0238 kg for males and 0.0206 kg for females. The resulting feed intakes are 0.0244 kg/day for male rats, 0.0163 kg/day for female rats, 0.0034 kg/day for male mice, and 0.0030 kg/day for female mice. Thus, approximate dose levels for the various groups were 0, 379, 757, or 3,786 mg/kg-day for male F344 rats; 0, 419, 838, or 4,191 mg/kg-day for F344 females; 0, 644, 1,288, or 6,442 mg/kg-day for male C57BL/6 mice; and 0, 655, 1,311, or 6,553 mg/kg-day for C57BL/6 females. Dose levels were formulated each week and stability studies of urea mixed with feed were conducted on days 1 and 14. Control and treated group sizes were 50/sex for rats and 100/sex and 50/sex, respectively, for mice. Study parameters included clinical observations, body weight taken at the start and end of test, and gross and microscopic pathology on brain, lung, trachea, heart, thymus, pituitary, thyroid, parathyroid, adrenal, esophagus, stomach, duodenum, jejunum, ileum, colon, liver, gall bladder (mouse only), pancreas, kidney, bladder, gonads, accessory sex organs, spleen, lymph nodes, bone, bone marrow, skin, salivary gland, and mammary gland.
At necropsy, there was no weight depression observed in either sex of mice or rats at any of the doses. The 0.9% urea male rat group experienced slightly decreased survival (89%) compared with the control group (95%) (statistics were not noted). A statistically significant increase in malignant lymphomas was noted only in the 0.9% dose group in female mice. The incidence of malignant lymphomas among female mice were 10/92, 7/43, 10/38,(p = 0.008 by pairwise comparison with control and 9/50 in the control, 0.45, 0.9, and 4.5% dose groups, respectively. Fleischman et al. (1980) noted these incidences in the text, while the data table in the same publication cites the number of lymphomas for the control and the three dose groups as 9, 6, 9, and 8, respectively. Although clarification was unavailable regarding which set of results was more accurate or whether the reported totals reflected the numbers of lymphoma-bearing mice, the incidences in all non-zero groups were higher than in the control group. The authors considered the findings to be of questionable biological significance because the change in the incidence of malignant lymphoma did not show a dose response. Although the increased lymphomas in female mice after one year of exposure were not statistically significant overall, lifetime exposure was not evaluated.
Among urea-exposed male rats, there was a statistically significant linear trend (p = 0.008) for interstitial adenomas in the testes: 21/50, 27/48, 25/48, and 35/50 in the control, 0.45, 0.9, and 4.5% dose groups, respectively. This trend seems to be driven by the significant incidence observed in the highest dose (p = 0.004 by pairwise comparison with control). Similar

31 DRAFT - DO NOT CITE OR QUOTE
to the female mouse lymphomas, these incidences were noted in the text, while the data table in the publication cites the number of adenomas for the three non-zero dose groups slightly differently, as 25/48, 25/47, and 35/50, respectively. Although a significant linear trend is observed for interstitial adenomas in male rats, the study could have benefited from a longer exposure period, namely, lifetime exposure, to better assess potential treatment-related effects.
Krishna et al. (1990) conducted a feeding study using 0, 0.5, 1.0, and 1.5% urea in the diet of rabbits (7/group) for up to 180 days. The authors reported no clinical signs of urea toxicity or changes in body weight in any of the treatment groups. Cellular changes were noted in all treatment groups, but no incidence data or information about food consumption were provided.
4.2.2. Inhalation
Animal studies using the inhalation route of administration were not identified.
4.2.3. Other routes of exposure 4.2.3.1. Subchronic Studies
No subchronic exposure studies were identified that addressed the toxic effects of urea in animals via the subcutaneous (s.c.) or i.v. route.
4.2.3.2. Chronic Studies
A chronic study in mice was conducted by the NCI to determine if s.c. injection of urea causes tumors (Shear and Leiter, 1941). Twenty strain A and 10 C57BL male mice (3–4 months old) were injected s.c. in the left flank with 10 mg urea. The amount was progressively increased to 50 mg and repeated injections were given over an 11-month period for a total of 800 mg. No further details were reported on the injection protocol. A total of 19 mice survived to 12 months but only 5 mice remained at the termination of the experiment at 15 months. The authors stated that no induced tumors were observed at the injection site.
4.3. REPRODUCTIVE/DEVELOPMENTAL STUDIES – ORAL AND INHALATION 4.3.1. Oral Exposure
Teramoto et al. (1981) screened 11 urea compounds for developmental toxicity using urea and thiourea as a negative controls and water as a solvent control. The other nine urea compounds tested were 1-methylurea, 1-methylthiourea, 1-ethylurea, 1-ethylthiourea, 1,3-dimethylurea, 1,3-dimethylthiourea, 1,1,3,3-tetramethylurea, 1,1,3,3-tetramethylthiourea, and ethylenethiourea. Female Wistar rats (15 weeks old) or ICR mice (8 weeks old) were mated, and the day of vaginal plug detection was designated as gestational day (GD) 0. A single 2,000 mg/kg dose of urea was administered to pregnant rats (n = 4) at GD 12 and pregnant mice (n = 10) at GD 10. Vehicle control animals (17 mice and 6 rats) were dosed with an equivalent

32 DRAFT - DO NOT CITE OR QUOTE
volume of water. No maternal toxicity was noted. Rats and mice were killed on GD 20 and GD 18, respectively. The numbers of implants and live and dead fetuses were counted. Living fetuses from each litter were divided into two groups after being weighed individually and examined for gross abnormalities. Fetuses from the right uterine horn were processed for skeletal examination and those from the left horn were processed for visceral examination. For statistical comparisons, the litter was considered the experimental unit. There were no statistical differences between the vehicle control and the urea-treated rats based on the mean ± SD for number of implants (13.7 ± 1.0 vs.13.8 ± 2.2), number of live fetuses (13.3 ± 0.8 vs. 13.8 ± 2.2), percent fetal resorptions (2.4 vs. 0%), fetal body weight (3,671 ± 197 mg vs. 3,626 ± 104 mg), or percent fetuses malformed (0 vs. 1.8%). These endpoints also were unaffected in mice treated with urea (data not shown).
Seipelt et al. (1969), translated from German, investigated the effect of urea, added to the dam’s diet, on fetal kidney weights. This experiment was based on results from a previous study by MacKay et al. (1931) who reported that the addition of urea to the diet of adult male rats for 26 and 54 days increased renal weights. In the Seipelt et al. (1969) study, pregnant albino Wistar rats were divided into test and vehicle control groups (six/group). No additional information on mating procedure was provided. The test group was dosed, by gavage, with urea for 14 days starting 6 days after the last estrus. Urea was dissolved in water and administered in two doses totaling 50 g/kg-day. No maternal toxicity was reported. Within 48 hours of birth, pups were sacrificed by decapitation and kidneys removed and weighed; the right kidney was then dried at 105ºC and weighed. A total of 39 and 34 pups were delivered in the test and control groups, respectively. The authors used the total number of fetuses per group for statistical comparison. The fresh weight for the test group (n = 39) was 7.76 ± 1.33 g (mean ± SD) compared with 8.01 ± 0.88 g for the control group (n = 34). Dry weights, reported as a percentage of the fresh weights, were 14.4 ± 2.54% (≈1.12 g) for the test group compared with 14.7 ± 1.96% (≈1.18 g) for the control group. There was no statistical difference in the fresh or dry weight of the kidneys from the test group compared to the vehicle controls.
High PUN concentrations have been associated with decreased fertility in dairy cows. This effect was demonstrated in lactating cows and dairy heifers fed a diet high in crude protein to evaluate elevate PUN (Rhoads et al., 2006). Lactating Holstein dairy cows (n = 23) between 50 and 120 days in milk were used as donor cows and were given isoenergetic diets for 30 days, resulting in either moderate (<190 mg/L) or high (≥190 mg/L) PUN. The crude protein contents of the two isoenergetic diets were 15.7 and 21.9%, respectively. Estrus was synchronized in these donor cows with an injection of gonadotropin-releasing hormone (GnRH) followed by prostaglandin F2α (PGF2α) 1 week later and then follicle stimulating hormone (FSH) 9 days after estrus. PGF2α was administered simultaneously with the second-to-last injection of FSH and an additional dose was given 8 hours later. The donor cows were then artificially inseminated twice with semen from high-fertility bulls 12 and 24 hours after onset of standing estrus. A third
33 DRAFT - DO NOT CITE OR QUOTE
insemination was given at 36 hours to cows still in standing estrus after the second insemination. Embryos were then recovered from donor cows on day 7 after estrus, evaluated for quality and stage of development, and stored in liquid nitrogen until ready for transfer into virgin heifers. Heifers (n = 122; between 12 and 20 months old) were given either a low protein (9.6% crude protein) or high protein (24.4% crude protein) isoenergetic diet to yield either low or high PUN concentrations, respectively, for approximately 30 days. (There was no discussion as to why different protein concentrations were used in the diets of the donor cows compared to the heifers.) As with the donors, an injection of GnRH was administered to synchronize estrus cycles followed by PGF2α 7 days later. An embryo was then nonsurgically transferred on approximately day 7 after estrus synchronization to each heifer having a corpus luteum on one or both ovaries (n = 57 for low protein group and n = 37 for high protein group). Pregnancy status was examined 28–40 days after transfer (i.e., 35–47 days of pregnancy). Blood samples were obtained from donor cows daily from day 0 to 7 after embryo implant and from embryo recipient heifers daily from day 0 to 7, on day 10, and then twice weekly until pregnancy diagnosis.
In donor cows, the moderate protein and high protein isoenergetic diets resulted in PUN values of 155 ± 7 and 244 ± 10 µg/mL (p < 0.001), respectively. Recipient heifers had PUN values of 77 ± 9 and 252 ± 15 µg/mL for the low protein and high protein diets, respectively (p < 0.001). Grade, stage, and number of embryos collected (n = 41 from moderate donor cows and n = 55 from high donor cows) were not affected by the PUN level of the donor cows. Additionally, embryo recovery and quality were similar in the two groups and were not affected by sire (data not provided). Pregnancy rates were similar between recipient heifers on the low protein and high protein diets (21 and 23%, respectively). However, the transfer pregnancy rates from donor cows on a high protein diet (high PUN) were lower (11%) than those from cows on a low protein diet (moderate PUN) (35%), independent of the recipient heifer’s diet (p < 0.02). Plasma progesterone concentrations were not significantly different between heifers with low or high PUN (data not provided). The authors concluded that high PUN concentrations alter the viability of the bovine oocyte or embryo prior to day 7 of pregnancy (Rhoads et al., 2006).
Results from a similar study by Ordóñez et al. (2007) showed that high urea concentrations in the serum of pasture-fed dairy cows did not affect reproductive performance. Spring-calved Holstein-Friesian cows (20/group) were grazed for 101 days on either five pasture paddocks without fertilizer (controls) or on four paddocks to which supplementary urea nitrogen fertilizer (approximately 40–50 kg nitrogen/hectare [1 hectare is approximately 2.5 acres] was added every 4–6 weeks, 1–3 days after grazing). The amount of fertilizer varied during the study to maintain a significant difference (p = 0.05) in crude protein content of pastures between treatments. Control animals (n = 20) were grazed on similar paddocks that had no application of fertilizer during the same period. Cows were weighed and body condition was assessed weekly; at the same time, blood samples were collected from the tail vein for urea measurement. Milk samples were collected every second day before the morning milking throughout the study for

34 DRAFT - DO NOT CITE OR QUOTE
progesterone determination. Ovarian activity was assessed using ultrasound every other morning (after milking) and categorized into one of three periods: the first to assess follicular dynamics during the resumption of ovarian activity, the second to monitor the development of the dominant follicle that would lead to ovulation, and the third to observe corpus luteum development and establishment of pregnancy. Serum urea concentrations were significantly higher in the animals on urea-fertilized pastures than those on control pastures (mean 500 vs. 325 mg/L [8.3 vs. 5.4 mmol/L]; p < 0.001). Change in body weight over time was not significantly different (p > 0.40) between treated and control cows; however, treated cows did show lower body weights than control animals during weeks 6–9 of the study (data provided in a figure in Ordóñez et al., 2007). The authors reported no difference between groups for the following ovarian parameters: intervals between calving and first estrus (25.8 ± 2.5 days for treated cows vs. 31.9 ± 2.7 days for controls), emergence of first ovulated follicle and its ovulation (7.0 ± 0.8 vs. 7.0 ± 0.9 days), maximum diameter of first dominant follicle to be ovulated (20.0 ± 0.1 vs. 19.0 ± 0.1 mm), and emergence of follicle of conception cycle to ovulation (6.0 ± 0.8 vs. 5.8 ± 0.7 days). The maximum diameter of dominant follicles resulting in conception, however, was higher in control cows compared with cows grazing on pastures fertilized with urea (20.2 ± 0.1 mm for controls vs. 17.1 ± 0.1 mm for treated cows; p = 0.02). The numbers of luteal phases ≤10 and >10 days during the study were identical for both groups of cows. Additionally, milk progesterone concentrations did not differ between the two groups (178.6 ± 17.5 ng/mL for treated cows vs. 155.4 ± 7.5 ng/mL for controls). Overall, the authors showed that there were no negative effects on the reproductive performance of dairy cows that ate in pastures supplemented with urea nitrogen fertilizer compared with control cows. Treated and control cows exhibited similar intervals from calving to second estrus (29.5 ± 3.6 vs. 25.6 ± 3.2 days), from calving to first insemination (82.8 ± 2.5 vs. 85.1 ± 1.8 days), and from calving to conception (87.2 ± 1.9 vs. 88.3 ± 1.9 days, respectively). The period from calving to first estrus, however, was higher in control animals compared to treated cows (58.7 ± 5.4 and 54.3 ± 3.7 days, respectively). In addition, services per conception were not significantly different (1.35 ± 0.1 for treated cows vs. 1.19 ± 0.1 for controls).
4.3.2. Intrauterine, Intraperitoneal, or Intravenous Exposure
Conner et al. (1976) tested the efficacy of urea as a contragestational agent in rats. Female Sprague-Dawley rats (200–250 g) were mated at the supplier’s facility and conception monitored by the presence of a vaginal plug (day 1 of pregnancy). Animals were shipped to the laboratory on day 2. Dams were injected on GD 3 or 7 with 0.9% sodium chloride (NaCl) into one uterine horn (0.05 mL) and either 29% (58 mg/kg) or 58% (116 mg/kg) urea (w/v) into the other horn (0.05 mL; n = 4–6/group). Implantation sites were counted before injection on GD 7. Rats were killed on GD 15 and corpora lutea, resorptions, and conceptuses were counted. The

35 DRAFT - DO NOT CITE OR QUOTE
authors reported that the animals injected on GD 3 with 58% urea had approximately 1% viable fetuses, while animals injected with 29% urea had approximately 40% viable fetuses. By comparison, 80–85% fetus viability was observed when 0.9% NaCl was injected into uterine horn (statistics not reported; numbers estimated from figures in report). However, when injected on GD 7, the effect of urea injection was comparable to that of 0.9% NaCl.
Blake et al. (1976) investigated the abortifacient (abortion-inducing) effect of intraamniotic, i.v., and i.p. injections of urea into adult rhesus monkeys. Nonpregnant and pregnant rhesus monkeys (no control animals were noted) were placed under halothane anesthesia during the administration of the chemical. Four pregnant monkeys were administered a single intraamniotic injection of urea (2.2, 2.3, 2.5, or 12.5 g/kg) via a transabdominal catheter. Two pregnant monkeys were administered urea (1.6 and 1.8 g/kg) through a catheter placed into the peritoneal cavity. A single pregnant monkey was administered urea (1.8 g/kg) by injection into a superficial leg vein. Oxytocin, at a human abortifacient dose, was administered immediately after all urea injections. Two nonpregnant monkeys were included in each of the i.v. and i.p. injection groups. The sole pregnant monkey in the i.v. injection group was euthanized 4 hours after injection due to nonsterile procedures. One monkey (receiving 1.8 g urea/kg) died approximately 24 hours after i.p. injection. The authors attributed the death to hemorrhage caused by an incomplete abortion. Death (no clinical signs described) occurred 20 hours after intraamniotic dosing of the single animal that received 12.5 g urea/kg; SUN concentration was 14 mg/mL in this animal. There were “no serious side effects” noted by the authors. The remaining monkeys in the intraamniotic injection group resorbed their fetus and survived. The remaining monkey in the i.p. injection group spontaneously aborted the fetus and survived. The nonpregnant monkeys all survived.
4.3.3. Other Studies
Urea may be transported via UTs. In mammals, two genes have been identified as UTs: UT-A and UT-B (additional information on these transporters can be found in Section 4.5). Previous studies have shown that UT-A5 and UT-B are localized in the testis; UT-A5 is expressed in the outer cell layer of seminiferous tubules and UT-B is expressed in Sertoli cells of seminiferous tubules (Fenton et al., 2000; Tsukaguchi et al., 1997).
Guo et al. (2007) used UT-B null male mice to investigate the effect of the lack of this protein on male fertility. Brain, liver, and testis from transgenic knockout mice (CD-1 background) deficient in UT-B protein and wild-type CD-1 mice were homogenized and the urea concentrations in the resulting centrifugation supernatants and in serum were measured by colorimetry. Furthermore, histological examination of one testis from each animal was performed at selected ages from 10 to 84 days. Urea concentrations (as measured in 84-day-old mice) were statistically significantly higher (p < 0.01) in serum and testis from UT-B null mice (9.3 ± 0.6 mM and 57.5 ± 2.6 mmol/kg tissue weight, respectively) than from wild-type mice

36 DRAFT - DO NOT CITE OR QUOTE
(7.6 ± 0.1 mM and 46.9 mmol/kg tissue weight, respectively), but not in the brain and liver. Total testis urea contents were 335.4 ± 43.8 µg in UT-B null mice and 196.3 ± 18.2 µg in wild-type mice (p < 0.01). Testis weights in UT-B null mice were statistically significantly higher (p < 0.05) than in wild-type animals from postnatal day (PND) 17 throughout the experimental period. On PND 84, testis weights were 103.7 ± 6.9 mg in UT-B null males compared with 80.3 ± 6.7 mg in controls (p-value not provided); testis-to-body weight ratios were 0.31 ± 0.02 and 0.22 ± 0.03% (p < 0.05), respectively. Water content in testes was similar in both groups of mice. Histological examination showed that there was no difference in the features or distribution of stages of spermatogenesis between the two groups. Additionally, no differences were observed in cellular integrity of the epithelium, sperm numbers in caudal epididymes, or sperm morphology. Elongating spermatids were detected in all the null animals by PND 28, but they were not detected in the wild-type animals until PND 36. Other than the detection of elongated spermatids, there were no other differences in testicular morphology noted between the two groups.
UT-B null and wild-type mice were also used in competing mating studies (Guo et al., 2007). One UT-B null male and one wild-type male (35 days old) from the same litter were mated with one 70-day-old wild-type female. In the control groups, two wild-type males were mated with one wild-type female. The litter size and gender of the pups were noted and all pups were genotyped. The time to first litter in null mouse groups (n = 7) was 69 ± 3 days, which was notably earlier than 77 ± 2 days in control groups (n = 7; statistics not reported). All pups in the competing groups were UT-B heterozygotes, suggesting that they were sired by the UT-B null male and not by the wild-type male. The number and gender of pups in the test and control groups were similar. The authors estimated the average mating age of males, based upon time to first litter, as 48 ± 3 days and 56 ± 2 days for test groups and control groups, respectively. These data supported the conclusion that testicular development occurred earlier in UT-B null mice. In addition, earlier Sertoli cell development was observed in UT-B null mice, as indicated by the occurrence of significantly higher FSH receptor and androgen binding protein messenger ribonucleic acid (mRNA) expression levels at 10 days in null males compared with 17 days after birth in wild-type males (p < 0.01) (data provided in a figure in Guo et al., 2007). At 10 days of age, testis urea concentration was significantly higher (p < 0.05) in UT-B null mice (34.3 ± 1.6 mM) than in wild-type mice (31.4 ± 0.5 mM); the difference became more significant with age. Serum urea concentrations were also observed to be significantly higher in UT-B null mice compared with wild-type mice at all ages (10–<45 days old; p < 0.05) (data provided in a figure in Guo et al., 2007). Guo et al. (2007) concluded that UT-B deletion resulted in urea accumulation in the testis and early maturation of the male reproductive system.

37 DRAFT - DO NOT CITE OR QUOTE
4.4. OTHER DURATION- OR ENDPOINT-SPECIFIC STUDIES 4.4.1. Acute Studies
A pilot study was initiated prior to the screening of 11 urea compounds for developmental toxicity to evaluate acute toxicity in female mice and rats and establish dose ranges for testing (Teramoto et al., 1981). ICR mice (8 weeks old) and Wistar rats (15 weeks old) were dosed with urea by gavage. Mice (n = 3) received single 1,000 or 2,000 mg/kg doses of urea. Rats (n = 4) received a single 1,000 mg/kg dose. Animals were observed for clinical signs of toxicity (e.g., diarrhea) for 1 week. None of the animals displayed any sign of toxicity, and there were no deaths.
Blake et al. (1976) investigated the effect of intraamniotic, i.v., and i.p. injection of urea into pregnant and nonpregnant adult rhesus monkeys (reproductive and developmental outcomes discussed in Section 4.3). Monkeys (no control animals were noted) were placed under halothane anesthesia during the administration of the chemical. Urine was collected through a Foley catheter and the animals received a continuous i.v. infusion of 5% dextrose in 0.45% saline. A 58% (w/v) urea solution (approximately 2 g/kg) was administered over 3.5 minutes via intraamniotic (three pregnant monkeys), i.v. (one pregnant and two nonpregnant monkeys), or i.p. (two pregnant and two nonpregnant monkeys) injection. An additional pregnant monkey received an intraamniotic injection of urea solution at a dose of 12.5 g/kg. Immediately after urea injection, 24 mU/minute of oxytocin (often used as an augmenting agent chemically) was added to the dextrose/saline infusion. Urea absorption and elimination were recorded by adding radioactive urea (0.92 MBq [25 µCi] of [14C]-urea) to the injection solution. Arterial pressure, CSF pressure, heart rate, and respiratory rate were monitored. Physiologic monitoring was continued for 4 hours, after which time all incisions were sutured and the animals were allowed to recover from the anesthesia. Total voided urine was collected for 7 days. Venous blood was collected prior to the start of the experiment and at 1, 4, and 7 days after urea injection. Hematocrit, total white blood cells, sodium, potassium, chloride, bicarbonate, glucose, and urea nitrogen were also monitored. Animals were observed for 3–6 months after injection.
Three monkeys died during the course of the study. One pregnant monkey treated with 1.8 g urea/kg had to be euthanized 4 hours after i.v. dosing because of complications following a nonsterile procedure. Another pregnant monkey died approximately 24 hours after intraamniotic administration of 1.8 g urea/kg under signs of excessive bleeding from an incomplete abortion. The authors considered the two deaths nontreatment related. Death (no clinical signs described) occurred 20 hours after intraamniotic dosing of the single (pregnant) monkey with urea solution at 12.5 g/kg; SUN concentration was 14 mg/mL shortly after death in this animal. In comparison, average SUN concentrations shortly after intraamniotic exposure in the remaining animals were <1 mg/mL and near baseline levels 1 day after exposure (data provided in a figure in Blake et al., 1976).

38 DRAFT - DO NOT CITE OR QUOTE
The authors reported a rapid fall in arterial pressure after i.v. injection of hyperosmolar urea, followed by a rise above preexposure levels, and then a return to normal within 30 minutes; consistent changes in heart rate were not noted during the same time period. Intraperitoneal injection increased systolic and diastolic pressures during the injection procedure peaking approximately 1.5 minutes after completion of the injection; both pressures returned to preinjection levels within another 10 minutes (data provided in a figure in Blake et al., 1976). Decreases of 5–15 mm Hg in CSF pressures at 2 hours, followed by a gradual rise to baseline values were noted after i.v. and i.p. injections (data provided in a figure in Blake et al., 1976). Intraamniotic injections decreased the CSF pressure by an average of 5 mm Hg at 1 hour, returning to baseline values by 4 hours after injection. The rate of spontaneous respiration was not affected by any of the dosing regimens used. Based on the graphs provided, urea administration by i.v. or i.p produced a persistent decrease in serum potassium and glucose. (The results for i.v. and i.p. injection were combined by the authors for comparison to intraamniotic injection since absorption rate and maximal SUN concentrations after i.v. and i.p. injections were similar.) Based on the graphs presented, intraamniotic administration decreased serum chloride concentrations. Hematological studies indicated that hematocrit decreased in all animals between days 1 and 4 (which was likely due to blood withdrawal for studies) and was approaching preexposure levels by day 7. White blood cell counts increased (50–200% above preexposure level) in all animals within 24 hours. White blood cell counts remained increased in animals administered urea via i.p or i.v. injection (data provided in a figure in Blake et al., 1976). As mentioned previously, no control animals were noted; thus, interpretation of treatment-related effects is limited.
Thurston et al. (1986) evaluated the effects of acute hyperosmolar urea injection in normal suckling/weanling mice. Sixty-five mice (17 to 23 days old, strain and sex not provided) were treated with equimolar solutions of either 2 M urea (calculated as 7.2 g/kg) or 1 M NaCl in two concurrent 30 mL/kg doses, one s.c. to the back and another via i.p. injection. Weight-matched controls received equivalent volumes of 0.9% NaCl. Mice were killed by decapitation at selected time points and blood was collected. Soon after injection, the following behaviors were observed in the urea-treated mice: staggering, hopping, running in circles, head shaking, walking on toes, and hypersensitivity to touch. Improvement occurred rapidly; 1 hour after dosing, the behavior of treated animals was indistinguishable from controls. Treated animals lost 10% of their body weight by 6 hours after urea injection compared with 5% observed in control animals; the authors noted that the initial injections had added 6% to each animal’s body weight. Hemorrhagic encephalopathy, similar to what was observed in NaCl-loaded animals, was noted by gross evaluation of the brain 1 hour after urea administration. Histological evaluations were not made.
Urea-treated mice had approximately 14% lower plasma sodium concentration within 15 minutes after injection, as compared with time zero concentrations. Concentrations began to

39 DRAFT - DO NOT CITE OR QUOTE
recover quickly, reaching ~7% above normal by 3 hours after dosing (data estimated from figure). By comparison, plasma potassium levels were not affected during the experiment (data not provided). Plasma osmolality was calculated based on the concentrations of sodium, potassium, glucose, and urea. After a rapid initial increase in osmolality from 312 at 0 hours to 412 at 15 minutes to 427 at 1 hour, there was a steady decline to 352 milliosmol (mOsm)/kg H2O at 6 hours after injection. The osmolality measurements at 2, 3, and 6 hours after dosing were statistically significantly lower (p < 0.01) than the peak value at 1 hour. Brain dehydration and decreased brain sodium concentrations were observed in the treated animals. However, all effects were reversed 6 hours after injection (data provided in a figure in Thurston et al., 1986). Additionally, mice exhibited no changes in brain potassium concentrations (data not provided). The t1/2 of urea, calculated by assuming elimination by first-order kinetics, in the brain (t1/2 = 4.7 hours) was approximately 2 times longer than in plasma (t1/2 = 2.2 hours). Urea concentrations in the brain were in equilibrium with those in plasma at about 2.5 hours after injection. As illustrated in Table 4-4, urea affected several metabolic energy-related parameters in the brain 10 and 45–60 minutes after injection.
Table 4-4. Early and late effects of urea injection on plasma and brain metabolite concentrations
Measurement
Early effects (10 min after injection) Late effects (45–60 min after injection) 0.9% NaCl
(mmol/kg) (n = 6) 2 M urea
(mmol/kg) (n = 4) 0.9% NaCl
(mmol/kg) (n = 11) 2 M urea
(mmol/kg) (n = 3) Lactate 2.37 ± 0.19 3.21 ± 0.03a 2.60 ± 0.27 1.81 ± 0.11 α-Ketoglutarate 0.044 ± 0.003 0.059 ± 0.003a 0.095 ± 0.012 0.085 ± 0.005 Malate 0.596 ± 0.019 0.722 ± 0.012a 0.574 ± 0.030 0.530 ± 0.016 Adenosine 5´-triphosphate 2.49 ± 0.03 2.77 ± 0.03b 2.48 ± 0.03 2.81 ± 0.02b Glycogen 1.42 ± 0.05 1.67 ± 0.05 1.53 ± 0.08 0.96 ± 0.03b Aspartate 3.77 ± 0.19 4.15 ± 0.05 3.25 ± 0.08 4.44 ± 0.07b Glutamate 12.31 ± 0.40 14.13 ± 0.11 11.74 ± 0.13 13.45 ± 0.13b Phosphocreatine 2.88 ± 0.07 3.15 ± 0.10 2.40 ± 0.09 3.34 ± 0.02a aSignificantly different from 0.9% NaCl control, p < 0.05. bSignificantly different from 0.9% NaCl control, p < 0.01. Source: Thurston et al. (1986).
4.4.2. Short-Term Studies
Safety concerns about the consumption of urea-adulterated milk in India resulted in the study of the possible genotoxic and toxic effects of urea (Kommadath et al., 2001). Swiss Albino male mice (12 animals/group, 3–4 months old,) were administered urea-adulterated cow’s milk by gavage in three treatment groups: 0.73, 0.365, and 0.1825 mg urea/day for 28 days. Based on an average body weight of 25 g, the calculated doses per treatment group
40 DRAFT - DO NOT CITE OR QUOTE
were 29.2, 14.6, and 7.3 mg/kg-day. A control group was dosed with cow’s milk. Animals were killed on treatment days 7 and 28, and kidney and liver samples were taken from three animals in each group. Samples were fixed with 40% formaldehyde, paraffin-embedded, and stained with hematoxylin and eosin. Incidence data were not reported. Pathological changes were noted in the liver and kidney of all treated animals on day 7, with an increase in severity on day 28. No pathological changes were noted in the control group. In the liver, degenerative and necrotic changes in hepatocytes, focal areas of necrosis, and initiation of lymphoid follicle formation were reported. In the kidney, fatty changes in the perirenal tissue, mild necrosis, mild glomerulitis, mild to moderate congestion, leukocytic infiltration of interstitial tissue, and lymphoid cell aggregates in perivascular tissue were described for the animals treated with the high dose of urea. The severity of the renal lesions decreased with decreasing dose; animals treated with 7.3 mg/kg-day did not exhibit fatty changes, and congestion was limited to larger blood vessels. The authors concluded that urea was hepatotoxic and nephrotoxic in adulterated milk at the concentrations tested. As the authors reported that pathological changes were noted in all treated animal, the lowest dose of 7.3 mg/kg-day could be interpreted as a lowest-observed-adverse-effect level (LOAEL).
Levine and Saltzman (2001) investigated whether urea is a major toxin in renal failure in Lewis rats. Male rats (age not provided) had their right kidney surgically removed. Laboratory Rodent Diet 5001, given ad libitum, was replaced with sucrose cubes saturated with olive oil. One week after the first surgery, the left kidney was surgically removed and 3 days before the second surgery, 120 mg neomycin and 50 mg dihydrostreptomycin were added to 100 mL drinking water. For 3 days after the second surgery, treatment groups received an i.p. injection of 2 mL/100 g of either water (n = 8), 1.5 M urea (1,800 mg/kg) (n = 12), or 0.033, 0.067, or 0.1 M (100, 200, or 300 mg/kg) creatinine (n = 8/dose). Four animals per group were necropsied on the fourth day and serum was obtained. Spleen and thymus were fixed in Bouin’s fixative, paraffin embedded, sectioned, and stained with hematoxylin and eosin. Urea treatment did not affect creatinine serum concentration, but creatinine treatment increased urea serum concentration above control values (1.98 and 2.48 mg/mL with 100 and 200 mg/kg, respectively, vs. 1.87 mg/mL with water; p < 0.01). Serum osmolality was significantly increased after urea injection compared with water-injected controls (472 vs. 368 mOsm/kg; p < 0.05); creatinine injections (364 and 379 mOsm/kg with 100 and 200 mg/kg, respectively; p < 0.05) were also significantly increased. The i.p. injection of urea in nephrectomized rats also decreased survival time (5.7 days with urea vs. 8.3 days with water and 7.0 days with no injections), and increased atrophy of thymus and spleen (i.e., more severe atrophy of the thymic cortex and splenic lymphoid follicles) when compared with control nephrectomized animals. The authors stated that the elevation in serum osmolality with urea injections may be important in uremic toxicity and in decreased survival time.
41 DRAFT - DO NOT CITE OR QUOTE
Finlayson and Baumann (1956) investigated the effect on rats fed urea mixed with a diet given ad libitum as compared with a spaced feeding of 2 hours/day. Holtzman male albino rats (21 days old) were fed a casein/corn oil diet containing vitamins and mineral supplements ad libitum for 10 days and then habituated to a 2-hour/day feeding schedule for 2 weeks. Five rats per group received a diet containing 0, 5, or 10% urea for 2 hours/day or a diet containing 0, 20, and 30% urea ad libitum. Rats were weighed weekly and daily food consumption was determined. After 5 weeks, weight gain was decreased with increased urea concentration for both diets. A 5% urea diet administered with the spaced feeding and a 30% urea fed ad libitum diet decreased the growth to similar extents, even though the daily urea intake was 12-fold greater in the latter group (0.4 vs. 4.8 g/day). In a subsequent experiment, blood urea nitrogen (BUN) concentrations were compared for these two groups. Adult rats (n = 3/group) were fed 5% urea 2 hours/day or 30% urea ad libitum for 6 days. After 6 days, blood of animals fed the 5% urea diet was taken by cardiac puncture 2 hours after eating and BUN was determined. BUN values were comparable between the two treatment groups. The authors concluded that growth depression was related to the rate of urea ingestion.
The role of urea in uremia was studied in 12 mongrel dogs (Balestri et al., 1971). Animals had a kidney surgically removed and were allowed to recover for 10–15 days (control period). A 10% urea solution (at a dose of 3–4 g/kg) was injected s.c. every 8 hours for 30–45 days. In four of the dogs, spontaneous movements were continuously recorded for 3 days during the control period and 3 days during the test period. Permanent electrodes were implanted for electroencephalogram recording in two additional dogs. Hematocrit and platelet counts were performed in five dogs at intervals of 5 days. All animals were necropsied at the end of the experiment. Gross pathology was negative and the liver, heart, kidney, stomach, and duodenum had normal histology. Plasma urea concentrations ranged from 6 to 7 mg/mL at 20–30 minutes after injection to 2–3 mg/mL just prior to the next injection. Concentrations during the control period were not provided. Following urea injection, the only symptoms noted were mild drowsiness and a reduction of spontaneous movements. During the test period, diuresis was increased and the animals drank more water, but there were no obvious gastrointestinal disturbances and the dogs ate normally. Weights, hematocrit values, platelet counts, and bleeding times did not change over the course of study. The authors concluded that urea does not induce severe toxicity in dogs at blood concentrations up to 7 g/L.
In an earlier study of the role of urea in canine uremia, Grollman and Grollman (1959) removed both kidneys from six dogs with an interval of 7–14 days recovery between each kidney removal. One liter of commercially available sterile peritoneal lavage solution was administered i.p. and exchanged twice a day. Urea (5–30 g/L) was added to this solution. Animals were maintained for 4–9 days. Anorexia, weakness, diarrhea, and vomiting were early symptoms followed by hemorrhage from the bowel, coma, and death. The authors attributed these clinical signs to urea toxicity.

42 DRAFT - DO NOT CITE OR QUOTE
Urea toxicity in 10-week-old male cross-Landrace piglets was assessed over a 15-day exposure period (Button et al., 1982). A single piglet was used per dose group (no control animals noted). Acute oral doses of urea (1–4 g/kg) were administered with a dosing gun on day 1. Two piglets received meal containing doses up to 10% urea in feed over a 15-day period. One piglet received doses up to 5% urea in feed over a 10-day period followed by two additional doses of urea (8 and 16 g urea/kg) by mouth on days 12 and 14. The authors reported no diarrhea or symptoms of urea intoxication for any of the study animals.
Das et al. (1997) fed urea to day-old chicks for 8 weeks. Chicks (30/group) were divided into eight treatment groups: 0, 0.25, 0.5, 0.75, 1.0, 1.5, 2.0, and 2.5% urea. Decreased body weight was noted in chicks fed diets containing 2 and 2.5% urea. The authors also noted enlarged and mottled kidneys and livers. However, no incidence data were provided, nor was there information with regard to food consumption.
4.4.3. Cardiotoxicity
Studies have evaluated the effects of urea on the cardiovascular system. Overall, the studies indicate that urea and its metabolites have various cardiotoxic effects including protein carbamylation, nitric oxide synthase inhibition, and mechanical and electrical alterations.
Urea may carbamylate proteins, which in turn produce a variety of toxic effects. During carbamylation, urea is spontaneously degraded to cyanate. The active form of cyanate, isocyanic acid, may then react with nonprotonated amino groups of proteins. The carbamylation of these proteins can lead to altered protein structure and activity. Ok et al. (2005) evaluated whether protein carbamylation was related to atherosclerosis. Human coronary artery endothelial cells and human coronary artery smooth muscle cells were treated in vitro with carbamylated low-density lipoprotein (cLDL) or native low-density lipoprotein (nLDL). Studies showed that cLDL produces morphological changes in human coronary artery endothelial cells at concentrations ranging from 50 to 400 μg/mL after exposure for 24 hours. Many of the treated cells decreased in size and detached from the plate. Additionally, cellular debris was observed. cLDL increased the release of lactate dehydrogenase (LDH) (marker for cytotoxicity) in a dose- and time-dependent manner; cytotoxicity was shown to increase linearly (data provided in a figure in Ok et al., 2005). At a concentration of 200 μg/mL, cytotoxicity, as measured by trypan blue exclusion in several experiments, was 10–20% (expressed as the ratio of LDH released by treated cells into medium to the total LDH) with cLDL vs. 0–7% with nLDL. Endothelial cells exposed to cLDL exhibited a higher percentage of apoptosis (as measured by annexin V binding) than nLDL-exposed cells (24 ± 4 vs. 14 ± 3%; p < 0.01) but there was no significant change in the percentage of necrotic cells. Further studies demonstrated that cLDL induced proliferation (as measured by bromodeoxyuridine incorporation) of human coronary artery smooth muscle cells. Bromodeoxyuridine incorporation showed that cLDL induced cellular proliferation at concentrations ranging from 0 to 200 μg/mL in a dose-dependent manner.

43 DRAFT - DO NOT CITE OR QUOTE
Based on prior studies that indicated that chronic kidney disease was a risk factor for cardiovascular disease, the authors evaluated total protein carbamylation and cLDL levels in patients with renal disease (Ok et al., 2005). Total plasma protein carbamylation and plasma cLDL levels were measured by homocitrulline assay and enzyme-linked immunosorbent assay, respectively. Hemodialysis patients with advanced renal disease (n = 13) exhibited elevated levels of protein carbamylation when compared with controls (n = 11) (42 ± 4 vs. 12 ± 3 nmol homocitrulline/mg protein; p < 0.01). cLDL levels also were increased 267% in hemodialysis patients when compared with controls (p < 0.001; no biological values given). Combined, the studies suggest that cLDL, which may be formed by high concentrations of urea, produces a variety of biological effects that may be relevant to the development of arthrosclerosis.
Studies by Moeslinger and Spieckermann (2001) showed that urea induced a dose-dependent inhibition of inducible nitric oxide synthase (iNOS) in stimulated mouse macrophages without any impact on cell viability. The monocyte/macrophage RAW264.7 cell line was incubated with 0–9 g/L (0–150 mmol/L) urea for 48 hours. Cellular proliferation was assessed by cell counting, incorporation of [3H]-thymidine, protein expression (as assessed by Western blots), and apoptosis. Increasing concentrations of urea were associated with a dose-dependent decrease in iNOS production in RAW264.7 cells, with decreases becoming statistically significant at 0.36–7.2 g/L (60–120 mmol/L; p < 0.05) (data provided in a figure in Moeslinger and Spieckermann, 2001). A concomitant decrease in cell viability was not observed (>95% cell viability at concentrations up to 9 g/L [150 mmol/L]). While iNOS protein levels were decreased by urea at concentrations up to 7.2 g/L (120 mmol/L) (data provided in a figure in Moeslinger and Spieckermann, 2001), mRNA levels were not affected (data not provided). Additionally, urea was shown to significantly stimulate macrophage proliferation at concentrations ranging from 0.36 to 9 g/L (60–150 mmol/L) after incubation for 48 hours (control: 2.09 ± 0.12 × 10⁵ cells/well; 9 g/L (150 mmol/L): 3.36 ± 0.38 × 10⁵ cells/well; p < 0.05). The authors noted that the in vitro concentration of 360 mg/L (60 mmol/L) corresponded to a BUN concentration of approximately 3.6 g/L. The authors suggested that the inhibition of iNOS decreases nitric oxide-induced apoptosis, and may contribute to the development of atherosclerosis due to the increased cellular proliferation of macrophages.
A study in apolipoprotein E knockout mice (Apo E–/– mice), which have delayed lipoprotein clearance, was conducted to assess the impact of the uremic state on development of atherosclerosis (Massy et al., 2005). At 8 weeks of age, mice were divided into two groups, uremic (8 males and 14 females) and nonuremic control (6 males and 19 females). Chronic renal failure (CRF) was initiated to induce uremia by cauterizing the right kidney cortical region of mice in the uremic group and then performing a total nephrectomy of the left kidney 2 weeks later. Control animals underwent sham operation (decapsulation of both kidneys). Mice were killed at 6 weeks after surgery. The authors noted that all procedures were conducted in accordance with National Institutes of Health guidelines for the care and use of experimental

44 DRAFT - DO NOT CITE OR QUOTE
animals. Plaque area was significantly increased in the thoracic aorta (p < 0.04) (data provided in a figure in Massy et al., 2005), but not the aortic root, 6 weeks after uremia was induced when compared with nonuremic animals. Areas of athermanous and medial calcification in uremic animals were larger than in nonuremic animals. Assessment of the composition of the lesions in uremic animals indicated increases in collagen (control mice: 12.5 ± 1.0%; CRF mice: 18.9 ± 2.3%; p = 0.012), calcite, and hydroxyapatite content (data provided in a figure in Massy et al., 2005).
Urea was shown to produce mechanical and electrical alterations in isolated papillary muscles and in Langendorff perfused rat hearts (Abaurre et al., 1992). EPM strain of Wistar rats (both sexes) were placed into one of three groups. The left ventricle papillary muscles were obtained from one group while isolated rat hearts were obtained from the other two groups and perfused according to the Langendorff technique at a constant pressure of 75 mm Hg. A balloon mounted on the tip of a plastic tube was placed in the left ventricle and used to modify the diastolic pressure. Papillary muscles were exposed to test media containing17 mM urea because it is similar to the concentration of plasma urea (1 g/L) in patients with severe renal insufficiency. Contraction recordings in papillary muscles were taken before exposure, during exposure (30 minutes), and after washout of the test chemical. Urea reduced the isometric force (77% of control; p < 0.05) and rate of force development (85% of control; p < 0.05) in the papillary muscles. Additionally, urea was shown to decrease isovolumic systolic pressure (33% of control; p < 0.05), but not heart rate, as measured in perfused hearts. Electrocardiographic studies showed that 17 mM urea reduced the total QRS4 amplitude by 4.16 ± 1.58 mm (p < 0.05), increased QRS duration, decreased P wave5 amplitude, and elevated the ST segment6
An additional foreign language article, which had an accompanying English summary, discussed cardiotoxic effects of exogenous urea (Cuparencu et al., 1961). This summary reported that i.v. injection of urea (0.17–0.5 g/kg) in dogs induced a short-lasting hypertension followed by a longer-lasting pronounced hypotension. The authors suggested that the hypertension was induced by a vasoconstrictor reflex of the veins while the hypotension might have been caused by an exocrine vasoactive substance. Intraarterial injection of urea at the same doses produced an increase in blood pressure that was occasionally followed by hypotension
in a majority of the samples evaluated. (The authors noted that the changes could not be quantified since the changes were not uniform.) Evaluation of changes in ventricular isovolumic systolic pressure as a function of diastolic pressure showed that exposure to urea produced a depressant effect (data provided in a figure in Abaurre et al., 1992). Biochemical studies indicated that urea reduces calcium binding to the glycocalyx outside the sarcolemma, which is proposed to decrease contraction force.
4QRS wave represents ventricular depolarization of the heart in an electrocardiogram tracing. 5P wave represents atrial depolarization of the heart in an electrocardiogram tracing. 6ST segment isoelectric period following the QRS wave is the time at which the entire ventricle of the heart is depolarized.

45 DRAFT - DO NOT CITE OR QUOTE
caused by a vasodilator reflex from the arteries. Both administration methods were shown to induce tachyphylaxis. The authors also hypothesized that urea affected the vagal control center in the CNS resulting in a stimulation of vasomotor and respiratory control centers, an effect that may be masked by a urea-induced inhibitory action of the sinus caroticus.
4.4.4. Pituitary Effects
Okada and Kobayashi (1989) showed that short-term administration of urea produced alterations in intermediate cells of the mouse pituitary. Jcl/ICR male mice (numbers not provided) were given urea mixed in food at concentrations of 6, 12, and 24% for 14 days. Urea produced significant (p-value not provided), dose-dependent increases in protein synthesis (287.5% of control levels at the highest dose) and decreased density of secretory granules (44% of control levels at the highest dose).
4.4.5. Dermal Toxicity
A 24-hour dermal exposure study on skin penetration enhancers evaluated their potential to induce skin irritation (Lashmar et al., 1989). Male MF l h nude mice (4 weeks old) were exposed to a 10% w/v urea solution in water (n = 3) or control vehicle (1% w/w Carbopol 940 neutralized with sodium hydroxide). The test chemical was filled into a polyvinyl chloride cup and fastened to the dorsum of the animal using surgical tape and Superglue then left in contact with the skin for 24 hours. Animals were sacrificed and specimens of the exposed area and an adjacent untreated skin area were taken for histological examination. Tissues were fixed in formalin, paraffin-embedded, and stained with hematoxylin and eosin. Treated skin samples from each animal were randomly selected and microscopically examined and scored using a standard scoring system. The authors reported that urea did not cause any significant change in skin histology after the 24-hour exposure period.
4.4.6. Intracranial and Intraocular Effects
Intravenous urea (30% concentration) has been used to lower the intracranial and intraocular pressure in humans (Javid and Anderson, 1958). Javid and Anderson (1958) investigated these effects in adult female rhesus monkeys to determine the optimal rate of administration of a lower urea concentration and the effect of s.c. injections. Animals (average body weight 4.5 kg) were under Nembutal anesthesia during the study period. In the first set of experiments, CSF pressure was measured; urea doses of 1 g/kg were injected i.v. as 2.5, 5, 10, and 30% solutions at varying rates (15–120 minutes). Decreases in CSF pressure were found to be proportional to the rate of urea administration, but not the dose (data provided in a figure in Javid and Anderson, 1958). In another set of experiments, intraocular pressure measurements on three monkeys were taken every 30 minutes with a McLean tonometer, and in one animal, CSF was also measured. In the experiments, 10 and 30% urea solutions (dose of 1.5 g/kg) were

46 DRAFT - DO NOT CITE OR QUOTE
administered s.c. to the monkeys. Urea was effective in lowering intraocular and CSF pressure when given by the s.c. route, but CSF pressure was not lowered to the extent observed when urea was given by the i.v. route (data provided in a figure in Javid and Anderson, 1958).
4.4.7. Urea Toxicity in Ruminants and Non-Laboratory Animals
Case reports of probable urea toxicity are primarily reported in ruminants, although other species can be affected. Urea readily degrades to ammonia in water and therefore, urea or urea-based fertilizers mixed with water can be a biological hazard (Raidal and Jaensch, 2006; Zarnke and Taylor, 1982).
Ruminants are more sensitive to oral urea toxicity than monogastric animals. This is because the rumen contains microbes that can hydrolyze urea to ammonia. Urease produced by bacteria in the rumen converts urea to ammonia, which then combines with ketoacids formed by the bacteria to produce amino acids. If too much urea is present, ammonia will still be formed, but there will be insufficient amounts of ketoacids to prevent the absorption of ammonia (Decker, 1996). Ammonia in the blood can be detoxified by the liver and excreted as urea. However, if that safeguard is overwhelmed, acute ammonia toxicity results (Ortolani et al., 2000; Word et al., 1969).
In simple stomach animals, such as humans, nonhuman primates, rodents, and pigs, ingested urea is primarily absorbed into the blood in the upper gastrointestinal tract and excreted by the kidneys. Some nonruminant mammals, such as rabbits, guinea pigs, and horses, have a sizable fermentation sac, the cecum (which does not have that function in humans), which digests roughage such as grasses. Most ingested urea is absorbed before reaching the cecum and any ammonia generated would readily enter the portal vein and be detoxified by the liver. Diets containing 1–2% urea and supplemented with amino acids have been shown to increase the rate of weight gain in growing pigs (Kornegay et al., 1970). Horses fed up to 5% urea in the grain ration or up to 0.44 kg/day over 4 weeks had increased weight and improvement of physical condition (Rusoff et al., 1965). In this study, no signs of urea toxicity were observed.
4.5. MECHANISTIC DATA AND OTHER STUDIES IN SUPPORT OF THE MODE OF ACTION 4.5.1. Mechanistic Data from In Vivo and In Vitro Studies 4.5.1.1. Neurological Effects
Neurological complications of uremia can include seizures, lethargy, jerking movements, and stimulus-sensitive myoclonus. Chung et al. (1985) investigated whether the mechanism by which urea produces myoclonus was similar to strychnine, which inhibits glycinergic neurotransmission in the medulla. Sprague-Dawley rats (n = 6 for highest dose group, number of rats for lower dose groups not provided; sex not specified) were administered 0.5–2.0 g/kg of urea (33% urea in 10% invert sugar) via i.p. injection every 15 minutes for a total of 4–14

47 DRAFT - DO NOT CITE OR QUOTE
injections. Animals were monitored for stimulus-induced (auditory, tactile, and air puffs) and spontaneous behavioral changes. Minimal observed neurological changes (exaggerated sensitivity to stimuli) were reported in animals that received 10 injections of 0.5 g/kg. At a dose rate of 1.0 g/kg, for a total dose of 4–6 g/kg, stimulus-induced and some spontaneous myoclonus was observed. Three injections of 2 g/kg (total of 6 g/kg) produced jerking movement and spontaneous myoclonus 1 and 1.5 hours after the initial injection, respectively. The behaviors were gone 3–4 hours after the first injection. Four injections of 2 g urea/kg produced spontaneous moderate intensity myoclonus that lasted for 30–50 minutes. The rats then appeared cyanotic and exhibited decreased locomotor activity before convulsions occurred and death followed. No information was provided on animal behavior when more than four injections were given at any of the noted doses.
Brain and plasma urea concentrations were evaluated at the peak of myoclonus in rats given four i.p. injections of 2 g urea/kg every 15 minutes. Six rats each in the control and treated group were sacrificed by decapitation 45 minutes after the last injection. Cervical blood, the medulla, frontal cortex, and spinal cord were evaluated for urea concentrations. Studies showed that urea concentrations in the brain tissues were 5–8-fold higher than control values and plasma urea concentrations were 18-fold greater than control values (p < 0.0001 for brain tissues and plasma; see Table 4-5).
Table 4-5. Effect of exogenous urea on brain and plasma urea concentration
Tissue source Urea concentration (mM)
Controls Treated animals Medulla 10.2 ± 0.8 68.7 ± 10.5 Spinal cord 13.3 ± 0.7 69.2 ± 4.7 Frontal cortex 9.7 ± 1.0 78.7 ± 5.3 Plasma 14.0 ± 0.7 248.0 ± 21.0 Source: Chung et al. (1985).
Control and urea-treated rats exhibited similar glycine levels in whole or crude
synaptosomal fractions of the medulla. Additionally, 0.1–100 mM urea had no effect on uptake of [3H]-glycine into prepared synaptosomes (0.32 M sucrose homogenates centrifuged at 1,000 × g for 10 minutes) (Chung et al., 1985).
In a separate set of experiments, the affinity of urea for a variety of receptors in rat medulla and spinal cord membrane preparations was evaluated (Chung et al., 1985). Urea (0.1–100 mM) and mannitol (n = 4/concentration of chemical tested) were tested for their potency to inhibit membrane binding of [3H]-strychnine, [3H]-gamma-aminobutyric acid, [3H]-quinuclidinyl benzilate, [3H]-diazepam, or [3H]-glutamate. Mannitol was used as a positive control in order to determine if the inhibitory effect of urea was due to its hyperosmotic action.

48 DRAFT - DO NOT CITE OR QUOTE
Urea inhibited [3H]-strychnine and [3H]-diazepam binding to the spinal cord and medulla at 10–100 mM, which is comparable to blood concentrations of urea that induced myoclonus in the rat. To assess whether urea binding was due to its hyperosmotic action, the authors evaluated the effect of mannitol on [3H]-strychnine and [3H]-diazepam binding. At concentrations up to 100 mM, mannitol did not alter [3H]-strychnine binding. However, 10–100 mM mannitol significantly decreased [3H]-diazepam binding (p < 0.05). The authors proposed that the inhibition of [3H]-strychnine binding is not likely related to the osmotic action of urea, while it may play a role in its affinity for [3H]-diazepam binding sites. In vivo studies, similar to those described above, with 6 g mannitol/kg (equimolar concentration to 2 g urea/kg) injected i.p. every 15 minutes for four doses induced seizures and then death. Myocolonus was not observed. Comparison of the effects produced by 50 µg strychnine and 40–800 µg urea after stereotaxic injection into the nucleus gigantocellularis showed that while strychnine produced moderately intense generalized myoclonus, urea produced tremors that were induced by stimuli or voluntary movements.
Maddock and Westenfelder (1996) evaluated the effect of urea on human neuroblastoma cells (SK-N-SH). Cells were exposed to 0.2–2 g/L urea and regulation of heat shock response was evaluated. Studies showed that clinically relevant concentrations (0.4–2 g/L corresponding to BUN concentrations of 1.9–9.5 g/L) induced production of Hsp72. The increase in production of Hsp72 plateaued at a concentration of 1.5 g/L. Time-course studies indicated that the protein is present 30 minutes after the addition of urea and the response was maximal after 10 hours (9.8-fold over the 30-minute value). The response then returned to baseline 48 hours after the addition of urea. Similar responses were not observed with other chemicals tested (mannitol, NaCl, or glycerol) at equivalent osmolalities. In addition to upregulation of Hsp72, urea induced carbamylation of proteins in a time-dependent manner. The authors suggested that urea induces cellular stress via its ability to produce cyanate, which may carbamylate cellular proteins. It was proposed that this carbamylation may induce the observed heat shock response. Since the cells seemed to recover after approximately 10 hours, the authors further proposed that these cells may be able to adapt to the effects of urea.
The potential neuroexcitatory effect of 17 candidate neurotoxins associated with uremia was studied in dissociated mouse spinal cord neurons (D’Hooge et al., 2003). Whole cell recordings were made using a single-patch pipette with a resistance of 3–5 Ohms. Urea (300 mg/L [5 mmol/L]) was used as a reference and at this concentration did not produce an effect.
Together, these studies suggest that urea may produce some of the observed neurological effects (e.g., altered locomotion) through interaction with strychnine-sensitive glycine receptors, which are ligand-gated ion channels (D’Hooge et al., 2003; Maddock and Westenfelder, 1996; Chung et al., 1985). Binding and modulation of these ion channels by urea may affect neurotransmission. Additionally, modification of proteins through carbamylation likely plays a

49 DRAFT - DO NOT CITE OR QUOTE
general role in the effects produced by urea. Protein carbamylation may induce production of heat shock proteins.
4.5.1.2. Effects on the Renal System
P-glycoprotein (P-gp) is an adenosine 5´-triphosphate-dependent transporter found in the apical portion of the proximal tubule. The putative function of P-gp is to pump hydrophobic drugs out of cells, decreasing their intracellular concentrations and their toxicity. In mice, there are two genes encoding drug-transporting P-gps, mdrla and mdrlb, whereas in humans, a similar function is filled by MDR1.
Miryata et al. (2002) investigated the effect of hyperosmotic urea on Na+/H+ exchange (NHE) in mouse proximal tubules and whether P-gp is involved. NHE was measured in isolated mouse proximal tubule S2 segments incubated in bicarbonate-free HEPES media. Na+-dependent acid extrusion rate (JH) was assessed using a pH-sensitive fluorescent dye after an acid load with ammonium chloride prepulse. Hyperosmotic urea (500 mOsm/kg H2O) induced NHE activation in wild-type (p < 0.05, n = 13) and in mdrla and mdrlb knockout mice (p < 0.05, n = 8). Genistein (10 µM), a tyrosine kinase inhibitor, inhibited NHE activation by hyperosmotic urea (n = 7). Hyperosmotic mannitol (500 mOsm/kg H2O) induced NHE activation in knockout mice (p < 0.05, n = 13) but had no effect on NHE activation in wild-type mice (n = 16). The authors concluded that NHE activation by hyperosmotic urea is mediated by tyrosine kinase and is independent of P-gp.
Zhang et al. (2004) investigated the effect of oxidative stress on deoxyribonucleic acid (DNA) and protein in renal murine inner medullary collecting duct (mIMCD3) cells. The level of reactive oxygen species (ROS) was measured by fluorescence of dichlorodihydrofluorescein diacetate. Oxidative damage to protein was measured by detection of protein carbonyl content after urea exposure (0–300 mM). Increasing the osmolality of cells to 600 mOsm/kg by urea addition increased the levels of ROS approximately 2.6-fold when compared to the basic 300 mOsm/kg (mean relative fluorescence values: 638 ± 112 vs. 243 ± 31; p < 0.05). Protein carbonylation peaked at 20 mM urea (p < 0.05 vs. 300 mOsm/kg, n = 3) and decreased slightly at higher concentrations but remained above control levels at concentrations up to 300 mM (data provided in a figure in Zhang et al., 2004). The authors noted that plasma urea concentrations observed during uremia range from 20 to 80 mM (normal plasma concentration are 5 mM). Time course studies showed that protein carbonylation occurred rapidly (300 mM increased protein carbonylation within 5 minutes) (data provided in a figure in Zhang et al., 2004). The authors proposed that carbonylation at higher urea concentrations may decrease because available carbonyl groups may oxidize to carboxylic acids. Urea did not cause protein carbonylation directly as evidenced by the lack of protein carbonylation when 300 mM urea were added for 15 minutes to cell homogenates (data not provided). Furthermore, carbonylation was not an effect secondary to protein carbamylation because direct addition of cyanate, which is

50 DRAFT - DO NOT CITE OR QUOTE
formed from urea under physiological conditions and causes carbamylation, did not cause carbonylation (data provided in a figure in Zhang et al., 2004). Extensive protein carbonylation was also detected in the inner medulla of the normal mouse kidney but not in the renal cortex (data provided in a figure in Zhang et al., 2004). These results suggest that hyperosmolality as a result of urea exposure can cause oxidative stress in renal medullary cells in vitro and in vivo via protein carbonylation.
Esaian et al. (1997), translated from Russian, evaluated the role of increasing plasma urea concentrations in renal failure progression in Wistar rats. Wistar rats (200 g, n = 18) were subjected to surgical removal of 2/3 of one kidney under diethyl ether anesthesia. After 1 week, the contralateral kidney was removed. Urine was collected noncontinuously every week in a metabolic chamber under water deprivation conditions from the first stage of the subtotal nephrectomy. A blood sample was taken from a tail vein when urine was collected. Urea, creatinine, and electrolytes were determined in the serum. The authors also evaluated proteinuria and clearance of endogenous creatinine. The animals were divided into three groups (n = 6): Group 1 rats received a diet with at least 40% protein, Group 2 rats received a diet with 4–5% protein and 0.01 g urea/kg, and Group 3 control rats received a diet with 4–5% protein. The rats were sacrificed by ether narcosis 1.5 months after the second surgery. The remaining kidney was fixed in formalin; paraffin sections were prepared and stained with hematoxylin and eosin, chromotrope, and periodic acid-Schiff stain. Histological changes were observed in the glomerulus, renal tubules, and interstitium. Serum urea concentrations were significantly lower in control animals (Group 3) when compared to Group 1 and Group 2 rats; serum urea concentrations did not differ between Group 1 and Group 2 rats (results provided in a figure). A similar pattern was observed in the evaluation of the proteinuria index and serum creatinine concentrations. At day 60, Groups 1 and 2 proteinuria index values (0.83 ± 0.27 and 0.74 ± 0.26 g/L, respectively) were significantly higher than those of the control group (0.36 ± 0.042 g/L) (p-value not provided). Control values of serum creatinine concentrations were also lower than those of Groups 1 and 2 (control: 0.091 ± 0.007 mmol/L; Group 1: 0.125 ± 0.009 mmol/L; Group 2: 0.121 ± 0.01 mmol/L). (There is a discrepancy between the text and figure provided. The text states serum concentrations while the figure states plasma concentrations.) Histological evaluation showed that expressed renal structural changes were less severe in the control group compared with the test groups. Observable protein cylinders in the lumen of the proximal tubules were absent in control and Group 2 rats, but were marked in Group 1 rats. Markers of intraglomular hypertension were associated with increased size of the glomerulus, proliferation of mesangium, and an increase in mesangial matrix in the test rats and scarcely noted in the control rats.
Cohen and Gullans (1993a) evaluated a proposed growth-promoting effect of urea on renal epithelial cells. In these studies, a variety of confluent, growth suppressed cell types were exposed for 24 hours to urea at concentrations ranging from 0 to 300 mM (concentrations that

51 DRAFT - DO NOT CITE OR QUOTE
are typically found in the renal medulla), and [3H]-thymidine uptake was evaluated. The cell types included two lines of renal epithelial cells, Madin-Darby canine kidney (MDCK) and LLC-PK1 cells; renal, nonepithelial rat mesangial (RME) cells; nonrenal, epithelial T84 human colon carcinoma cells; and nonrenal, nonepithelial bovine aortic endothelial (BAE) cells. Urea addition increased [3H]-thymidine uptake incorporation up to 2.5-fold in MDCK cells (p < 0.05 compared with urea-free culture media). The half-maximal effect occurred at approximately 100 mM. By comparison, 100 mM NaCl inhibited [3H]-thymidine uptake by 57%, glycerol produced no effect, and 10% serum increased [3H]-thymidine uptake by 34%. Similar to MDCK cells, renal epithelial LLC-PK1 cells also increased [3H]-thymidine uptake in response to urea exposure (p-value not provided). On the other hand, [3H]-thymidine uptake was not increased by urea in RME, T84 human colon carcinoma, or BAE cells. The incorporation may be unique to cells of renal epithelial origin. No increase in thymidine transport or cellular proliferation (cell number, total protein content, or cell cycle distribution) and no induction of aneuploidy or polyploidy were observed; however, a 15% increase in total DNA content was seen in MDCK cells treated with urea compared with controls (p < 0.05). In this system, urea was able to increase DNA synthesis without increasing cellular proliferation or inducing polyploidy or aneuploidy, potentially through a novel mechanism.
In summary, urea may produce a variety of effects in the renal system. Urea has been shown to modulate NHE and induce the formation of ROS (Zhang et al., 2004; Mirayata et al., 2002). The formation of ROS is proposed to lead to the carbonylation of proteins, which may lead to protein denaturation and altered enzyme and protein activities (Zhang et al., 2004). Furthermore, urea may produce unique effects in specific cell types, such as increased DNA synthesis in cells of renal epithelial origin (Cohen and Gullans, 1993a).
4.5.1.3. Hematological Effects
Uremia leads to impaired RBC survival and function (Wardle, 1970). Normal human RBCs from a single donor were incubated with various reagents including urea (2.5 g/L incubation volume) under a variety of culture conditions and assayed from 2 hours to overnight. Endpoints evaluated included urea effects on pyruvate kinase and glutathione reductase activities, reduced glutathione concentration, uptake of [32P]-orthophosphate, methemoglobin concentration, Heinz body formation, [42K] uptake, and autohemolysis. Incubation of urea for 2 hours at pH 7.8 increased reduced glutathione concentration in the cells by 1 SD (control value: 600 ± 105 mg/L RBC at pH 7.8; no other data provided), but urea had no effect after incubation for 2 hours and overnight at lower pHs (6.8 and 7.4). Urea also increased [32P]-orthophosphate uptake after a 4-hour incubation (7,053 counts/300 seconds vs. 6,563 ± 180 counts/300 seconds for controls; SD = +2) but not after 2 hours (4,677 counts/300 seconds vs. 4,478 ± 280 counts/300 seconds). An increase in [42K] uptake by RBCs was observed during the first 2 hours but not thereafter, resulting in an average potassium uptake similar to controls

52 DRAFT - DO NOT CITE OR QUOTE
(1.50 vs. 1.47 mEq/L cells-hour). Compared with controls, urea impaired pyruvate kinase activity (1.9 vs. 3.3–4.0 U/1010 RBCs) and glutathione reductase activity (37 vs. 50 U/minute-mL RBCs). Urea did not trigger methemoglobin production and had no effect on the osmotic fragility of the cells, but it induced ring forms with abnormally crenated and distorted cells after 2 hours. No Heinz bodies were observed. While urea did produce some effects (e.g., increased potassium influx, inhibited pyruvate kinase activity), the author concluded that overall, it did not cause significant toxicity in RBCs (Wardle, 1970).
4.5.2. Role of UTs
Urea can permeate cell membranes by passive diffusion or urea transport proteins. Two mammalian UT genes have been identified: UT-A and UT-B (for a review, see Sands, 2003). In the kidney, splice variants of UT-A are expressed in the inner and outer medullary collecting ducts and thin and long descending limbs of the loop of Henle (Fenton et al., 2002), while UT-B is expressed in the descending vasa recta of the renal medulla (Lucien et al., 2005). UT-B was identified in the ureter and urinary bladder of the dog and rat and found to have a role in the regulation of urea excretion (Spector et al., 2007).
Both transporters are also expressed in a number of extrarenal tissues and in RBCs. For example, UT-A and UT-B proteins are expressed in the colon, heart, liver, brain, and testis (Doran et al., 2006; Lucien et al., 2005; Stewart et al., 2004; Sands, 2003; Fenton et al., 2002, 2000). Transporter presence in extrarenal tissues suggests that they play a role in accelerating efflux of urea after ureagenesis, which may occur normally (as it does in the liver) or as a byproduct of polyamine synthesis (Sands, 2003). Additionally microorganisms that are present in the colon have high urease activity. It is proposed that colon UTs transport urea to the microorganisms for breakdown into carbon dioxide and ammonia and play a role in gastro-intestinal health (Bagnasco, 2005; Stewart et al., 2004). A study using volunteers (Wolpert et al., 1971) provided early evidence that transport of urea from plasma into the colon occurred and that urea was hydrolyzed by bacteria in the colon.
4.5.2.1. In Vivo Studies in Rats
Hu et al. (2000) studied the effect of CRF on expression of UTs in the kidney. Male Sprague-Dawley rats had two thirds of the right kidney removed. One week later, the left kidney was completely removed. Control rats underwent sham surgery and kidney decapsulation with both kidneys left intact. Animals had free access to water and received 20 g/day standard rat diet with 25% protein. mRNA expression of UTs was studied 1 and 5 weeks after surgery. Five days prior to sacrifice, animals were placed in metabolic cages and urine was collected. Blood, the remaining kidney, brain, and one testis were collected and used in the measurement of hematocrit levels and plasma concentrations of urea. Tissues were weighed and medullas were dissected from the kidney. Urea concentration as well as urine and plasma osmolality was also

53 DRAFT - DO NOT CITE OR QUOTE
measured. Ribonucleic acid (RNA) was isolated from the renal medulla, brain, and testis and Northern blot analysis was performed. Complementary deoxyribonucleic acid (cDNA) probes for UT-A1/2 and UT-B1 were used with glyceraldehyde-3-phosphate dehydrogenase (G3PDH) as a reference for RNA loading; abundance of UT mRNA was expressed relative to G3PDH. Protein expression by Western blot analysis was measured in tissues from three rats with CRF and three control rats.
One week after surgery, urine and blood clinical parameters were indicative of renal failure in the animals undergoing partial nephrectomy as evidenced by increased dilute urine flow (control: 14.9 ± 62.4 mL/day, nephrectomy: 48.16 ± 3.8 mL/day; p < 0.001), decreased urea excretion (control: 14.6 ± 0.6 mmol/day, nephrectomy: 9.5 ± 1.1 mmol/day; p < 0.05), and increased plasma creatinine and urea concentrations (2.8- and 4.1-fold increases, respectively; p < 0.001). Additionally, UT-A1 mRNA expression in the renal medulla had decreased to 29% of control values (p < 0.01, n = 6) after only 1 week and to 3% of control values (p < 0.001, n = 6) after 5 weeks. UT-A2 and UT-B1 mRNA expressions were also significantly decreased in the renal medulla by 5 weeks (p < 0.001) (data provided in a figure in Hu et al., 2000). In the brain, UT-B1 mRNA expression was decreased to approximately one-third of control (p < 0.01) by 5 weeks, but there was no change in UT-B1 transcript expression in the testes. As determined by Western blotting, isoforms of UT-A1 in CRF animals were undetectable in renal medullary extracts and UT-A2 and UT-B1 bands were reduced at 5 weeks, compared with sham-operated animals (data provided in a figure in Hu et al., 2000). Thus, renal failure reduced the expression of UTs in the kidney and to a lesser extent in the brain, but not in the testes (Hu et al., 2000).
Inoue et al. (2005) examined the expression of UT-B in the renal medulla, colon, and ileum of male Sprague-Dawley rats (125–200 g; four to six rats/group). Animals were fed a 14% protein diet (low protein diet) or a 23% protein (standard) diet supplemented with 20% urea. All animals were fed for 12 days. Control rats received the standard 23% protein diet. All animals had unrestricted access to water. Urine was collected over 24 hours and urea concentration was measured in urine and blood. In another group, uremia was induced by a 7/8 unilateral nephrectomy and then feeding a 43% protein diet for 2 weeks; control rats were sham-operated and fed a 43% protein diet. Both groups had free access to water containing 25% normal saline to avoid salt depletion. At the end of treatments, animals were sacrificed, kidneys were removed and dissected into cortex, outer medulla, and inner medulla, and the internal mucosal layers of the ileum and colon were harvested. UT-B protein was identified by immunohistochemistry using an antibody to the carboxyl terminus of the rat UT-B. In rats fed a 14% protein diet or a 20% urea-supplemented diet, UT-B protein levels increased in the outer medulla (25 and 60%, respectively; p < 0.05), but did not change in the inner medulla. In rats fed a 43% protein diet, UT-B protein levels decreased significantly in both the outer and inner renal medulla (50 and 54%, respectively; p < 0.05, n = 4). UT-B mRNA levels in the outer medulla were significantly increased (approximately twofold) in urea-supplemented rats (data provided in a figure in Inoue
54 DRAFT - DO NOT CITE OR QUOTE
et al., 2005) and in rats fed a high protein diet (p < 0.05, n = 4). Levels in the inner medulla were only increased in rats fed the low protein diet (p < 0.05, n = 4) (data provided in a figure in Inoue et al., 2005). UT-B protein levels were decreased in the colon mucosa of rats fed the 14% protein or 20% urea-supplemented diets (34 and 37%, respectively; p < 0.05) (data provided in a figure in Inoue et al., 2005). Overall, the study by Inoue et al. (2005) suggested that UT mRNA and protein levels are differentially regulated by urea concentrations depending on the tissue under observation and the origin of elevated urea levels.
Kim et al. (2005) investigated UT abundance during osmotic diuresis induced by high glucose, NaCl, or urea loads in male Sprague-Dawley rats (125–200 g; six rats/group). Diuresis was induced by feeding standard diets augmented with 2.5 or 4% NaCl or 5 or 20% urea. Glucose diuresis was induced by streptozotocin and monitored by detection of glucose in spot urine samples. Additional groups of glucose diuresis and 4% NaCl diuresis rats were fed a diet supplemented with 10 and 3% urea, respectively, to keep the percentage of urea in total urinary solute at the control level. Animals were sacrificed after 15–20 days, kidneys were removed, and medullas were dissected. One kidney per rat was processed to determine interstitial urea concentration and the contralateral kidney was processed for Western blot analysis using antibodies to UT-A1, UT-A2, and UT-B. (Detailed specificities of the antibodies were not provided.) UT-A1 levels in both portions of the inner medulla were significantly increased in diabetic rats (255% of control in inner medullary base, 171% of control in inner medullary tip; p < 0.05) and in rats under 4% NaCl diuresis for 15 days (166% of control in inner medullary base, 162% of control in inner medullary tip; p < 0.05). Rats under 4% NaCl diuresis for 5 days exhibited significantly increased levels of UT-A1 protein only in the inner medullary base (p < 0.05) (data provided in a figure in Kim et al., 2005). By comparison, UT-A2 levels in the outer medulla were significantly (p < 0.05) decreased in diabetic rats (66% of control) and in rats with 2.5% NaCl diuresis (72% of control). UT-B levels were unchanged in both the diabetic rats and the 4% NaCl diuresis rats. By comparison, UT-A1, UT-A2, and UT-B levels were not different from control levels in diabetic rats and 4% NaCl diuretic rats fed a urea-supplemented diet. UT-A1 levels in the inner medullary base or tip were not different from control animals in rats fed a urea-supplemented diet. However, UT-A2 and UT-B levels were significantly (p < 0.05) increased in both urea-supplemented dose groups in the outer medulla (5% urea group: 163 and 150% of controls, respectively; 20% urea group: 155 and 130% of controls, respectively). The authors concluded that during osmotic diuresis, UT-A1 expression increases with decreasing urea concentration in the urine and/or percentage of urea in total urinary solute and UT-A2 and UT-B expressions increase when urea concentration in the medullary interstitium is high. The increase in UT-A1 protein level is proposed to increase the transport of urea from the inner medullary collecting duct lumen to the inner medullary interstitium, while the increase in UT-A2 and UT-B abundance is proposed to increase intrarenal urea recycling (Kim et al., 2005).

55 DRAFT - DO NOT CITE OR QUOTE
4.5.2.2. In Vivo Studies in Mice
Lucien et al. (2005) examined the role of dehydration on UT-B1 transporter protein regulation. Adult male C57BL/6 mice (n = 4–5) were given free access to food and water. Water was then withdrawn for 48 hours to induce dehydration as determined by weight loss and increased plasma osmolality. Animals were killed and urinary bladder, ureter, kidney medulla, colon, testis, and brain were evaluated for altered protein levels. Immunoblot analysis showed that dehydration significantly decreased UT-B1 protein levels in the urinary bladder and ureter by 43 and 38%, respectively (p < 0.01). Protein levels in kidney medulla, colon, testis, and brain were unaffected by dehydration.
Overall, UTs play a critical role in the movement of urea and are important in the maintenance of normal physiological function in a variety of tissues. Additionally, these studies show that urea transport expression in different tissues is differentially regulated by urea concentration (Inoue et al., 2005; Kim et al., 2005; Lucien et al., 2005; Hu et al., 2000). Altered urea concentrations may lead to decreased levels of the transporter. This could then lead to a variety of toxicological effects including oxidative stress, disruption of protein structure, and altered protein function.
4.5.3. Gene Expression Studies
Urea exposure results in many changes in gene expression in renal medullary cells. How urea activates or depresses these signaling pathways is an area of active investigation (reviewed by Burg et al., 2007; Cohen, 1999). Transcriptional expression and translation of two immediate early genes (IEGs), Egr-1 and c-fos, were identified in response to hyperosmotic urea (Cohen and Gullans, 1993b). The effect was found to be specific to cells of renal epithelial origin. (See Cohen and Gullans [1993a] in Section 4.5.1.2 for descriptions of the cell types evaluated.) In confluent, growth-suppressed MDCK cells, urea (200 mM) increased the Egr-1 mRNA level by almost threefold at 30 minutes and fourfold at 2 hours and the c-fos mRNA level by approximately fourfold at 30 minutes and threefold at 2 hours; the changes were time and dose dependent (0–300 mM urea tested for 30 minutes). The changes occurred in the absence of cytotoxicity or inhibition of protein synthesis, both potential nonspecific inducers of IEG expression. Control treatment (NaCl) had no effect in the cells. LLC-PK1 cells exhibited a response to urea comparable to the one observed in MDCK cells. However, urea did not increase Egr-1 mRNA levels in RME, C6 rat glioma, or T84 human colon carcinoma cells. Urea induced Egr-1 expression via transcriptional activation rather than increased message stability because, in the presence of the transcription inhibitor actinomycin D, urea-induced Egr-1 mRNA t1/2 was similar to that following treatment with 12-O-tetradecanoylphorbol-13-acetate [TPA], a known transcriptional activator of Egr-1. Overall, the authors concluded that renal epithelial

56 DRAFT - DO NOT CITE OR QUOTE
cells can increase expression of c-fos and Egr-1 through transcriptional activation in response to hyperosmotic urea.
Cohen et al. (1996) evaluated the mechanism by which urea induces IEG transcription. mIMCD3 cells were transiently transfected with a luciferase reporter plasmid linked to the murine Egr-1 5’ flanking sequence. Urea was found to induce Egr-1 expression through a protein kinase C (PKC)-dependent mechanism (evidenced by abrogation of urea-inducible reporter gene activity by the PKC inhibitors staurosporine and calphostin C or downregulation of PKC through chronic treatment with TPA) (Cohen et al., 1996) (data provided in figures in Cohen et al., 1996). In growth-suppressed mIMCD3 cells, urea (200 mOsm) increased inositol 1,4,5-triphosphate (IP3) release threefold within 5 minutes of exposure (IP3 formation was measured using a radioreceptor binding assay). In lysates from mIMCD3 cell monolayers treated with urea (200 mM for 10 minutes), the degree of phosphorylation of the receptor tyrosine kinase-specific phospholipase C (PLC) isoform, PLC-γ, was upregulated (quantitative data not provided). The authors stated that these data suggest that urea induced IEG expression (specifically Egr-1) via a cell surface or cytoplasmic tyrosine kinase, which leads to, sequentially, activation of PLC-γ, IP3 release, and PKC activation.
Urea treatment has been shown to be associated with increased oxidative stress and the stress-responsive transcription factor Gadd153 (Zhang et al., 1999). In mIMCD3 cells, urea (200 mM) markedly increased Gadd153 mRNA (>10-fold) and protein levels, but did not increase protein levels of the molecular chaperone grp78 (data provided in figures in Zhang et al., 1999). Urea-induced increase in Gadd153 mRNA levels was shown not to be associated with an increase in RNA stability. Furthermore, urea-induced Gadd153 mRNA and protein expression was found to be antioxidant sensitive; expression was inhibited by pretreatment with the antioxidants, N-acetylcysteine and dimethylthiourea. Furthermore, urea-induced transcription of Egr-1 (transiently transfected in mIMCD3 cells) was decreased by 55% in renal cells pretreated with N-acetylcysteine. Intracellular reduced glutathione content, a biochemical indicator of oxidative stress, was decreased in urea-treated cells within 15 minutes of exposure.
The role of Ras protein in urea signaling and induction of IEG expression was also investigated in mIMCD3 cells (Tian et al., 2000). Compared to basal conditions (where approximately 5% of the immunoprecipitable Ras was activated), urea (12 g/L [200 mM]) increased Ras activation to 15.3% of the immunoprecipitable material (p < 0.05) (data provided in a figure in Tian et al., 2000) within 2 minutes of treatment. Urea had no effect on Ras in the nonrenal 3T3 cell line (data not provided). A stably transfected cell line with an expression plasmid containing a dominant-negative N17Ras mutation was used to further characterize the intracellular signaling pathway (defined as N17Ras-B7 cells). N17Ras induction inhibited urea-inducible Egr-1 and Gadd153 transcription, indicating a role for wild-type Ras signaling in response to urea (data not provided). However, N17Ras overexpression only partially inhibited urea-induced extracellular signal-regulated kinase (ERK) phosphorylation (38% at 15 minutes

57 DRAFT - DO NOT CITE OR QUOTE
and no effect at 5 minutes), indicating that activation of ERK may involve other signaling pathways. Effects on other mitogen-activated protein kinases (MAPKs) (i.e., p-38 and SAPK) were not observed in N17Ras–B7 cells treated with urea. Overexpression of N17Ras also had no effect on urea-inducible apoptosis (400 mM urea) (data provided in a figure in Tian et al., 2000) or phosphorylation of Akt, which is associated with urea-induced apoptosis (data not provided). Finally, urea treatment induced recruitment of SOS, a guanine nucleotide exchange factor and Ras activator, to the cell membrane (SOS levels increased by approximately 100%), suggesting that SOS may mediate Ras activation by urea. Together, these studies suggest that Ras signaling may play a role in renal epithelial cell responses to urea-induced oxidative stress.
Zhang et al. (2000a) evaluated the role of phosphatidylinositol-3 kinase (PI3K) in the urea signaling pathway in mIMCD3 cells. Urea (200 mOsm/kg) increased PI3K activity (assessed using immunoprecipitation) 3.2-fold within 1 minute of treatment and 2.5-fold after 5 minutes of treatment in confluent, serum-deprived mIMCD3 cells. PI3K activity returned to control levels by 15 minutes. Urea was shown to increase PI3K activity at up to the highest concentration tested, 800 mM, with a peak at 600 mM. PI3K activation was not involved in induction of Egr-1 transcription as evidenced by the fact that PI3K inhibitors, wortmannin and LY-294002, did not block urea-induced transcription of Egr-1 (data provided in a figure). Urea (200 mM) significantly increased p70 S6 kinase activity by 75% (p < 0.05) within 5 minutes of treatment. The observed effect was inhibited by wortmannin (10 nM) and LY-294002 (10 µM) pretreatment. Urea treatment (200 mM) also increased Akt phosphorylation and wortmannin (10 and 100 nM) and LY-294002 (10 and 30 μM) inhibited the effect. Shc activation and recruitment of Grb2 (as assessed by immunoblots) were also observed after urea treatment (200 mM) (data provided in a figure in Zhang et al., 2000a). The authors noted that 400 mM, but not 200 mM, urea increased caspase-3 activity (data not provided) and that this effect was increased by 266% after pretreatment of wortmannin (100 nM). Urea induced annexin V binding (a biochemical marker of apoptosis) increased 178% (compared to control) after pretreatment of wortmannin. These studies suggest that activation of PI3K may play a role in renal cell responses to urea.
Pretreatment with urea can protect renal medullary cells, but not 3T3 cells, from the proapoptotic effect of NaCl (Zhang et al., 2000b). This was exemplified by using two biochemical indices of apoptosis, caspase-3 activation and annexin V binding. In mIMCD3 cells, urea (200 mM) did not exert a proapoptotic effect (i.e., increase caspase-3 activity) in accordance with the results from Zhang et al. (2000a). However, when urea was applied before NaCl treatment, a 61% inhibition of the NaCl-induced caspase-3 activation and a 63% inhibition of the NaCl-induced annexin V binding were observed (p < 0.05 when compared to NaCl alone). Urea also was shown to block the proapoptotic effects of mannitol (data not provided). Urea treatment by itself decreased annexin V binding by 18%, which was statistically not significant. The proapoptotic effect (as evaluated by caspase-3 activation) was not observed when

58 DRAFT - DO NOT CITE OR QUOTE
fibroblastic 3T3 cells were used (data provided in a figure in Zhang et al., 2000b). The protective effect of urea against NaCl-induced apoptosis was found to be similar to that of the mitogens epidermal growth factor (EGF) and insulin-like growth factor (IGF). When applied simultaneously with IGF, a potentiation in effect was observed (p < 0.05 when compared to urea pretreatment alone). Urea, however, failed to protect mIMCD3 and 3T3 cells from another proapoptotic stressor, ultraviolet B irradiation, suggesting that the protective effects of urea are cell type- and stimulus-specific.
In a study of gene expression using microarrays, exposure of mIMCD3 cells to high urea concentration (200 mM) was compared to exposure to EGF, NaCl, and mannitol (Tian and Cohen, 2002). Urea exposure resulted in downregulation of approximately 6% of 12,000 genes on the Murine Genome U74A GeneChip (Affymetrix) array, whereas 0.8% were upregulated. Of the upregulated genes, only 21 were upregulated significantly (threefold or more) in response to urea. Most notable was a 27-fold increase in activating transcription factor 3 (ATF3) mRNA. Expression of ATF3 protein in mIMCD3 cells also increased as evidenced by Western blotting (data provided in a figure in Tian and Cohen, 2002). In contrast, NaCl (100 mM) upregulated approximately 4% of the genes evaluated; 71 genes were upregulated sevenfold or more. Additionally, NaCl downregulated expression of approximately 12% of the 12,000 transcripts studied. These data supported earlier speculation that hyperosmotic urea and NaCl have different signaling mechanisms (Cohen and Gullans, 1993b). However, the profile of IEG expression in response to urea stress was more similar to treatment of cells by EGF (100 nM) than to hypertonic stress induced by mannitol (200 mM). Urea pretreatment for 30 minutes partially restored genes affected by hypertonic NaCl stress to basal levels of expression. The authors suggested that urea may play a cytoprotective role in response to hypertonicity induced by other substances (e.g., NaCl).
4.5.4. Genotoxicity
The genotoxic effects of urea have been studied in a variety of short-term test systems, in vitro (bacteria and mammalian cells) and in vivo (mouse bone marrow). A summary of the results from these genotoxicity assays of urea discussed in the following section is presented in Table 4-6.

59 DRAFT - DO NOT CITE OR QUOTE
Table 4-6. Genotoxicity and mutagenicity data from in vitro and in vivo assays of urea
Species/ cell line
Test system (strain/species) Exposure
Metabolic activation Reference –S9 +S9
In vitro Bacterial systems
Salmonella typhimurium
Reverse mutation (TA98, TA100, TA1535, TA1537)
0–10,000 µg/plate – – Mortelmans et al. (1986)
Reverse mutation (TA98, TA100, TA1535, TA1537, TA1538)
0–5,000 µg/plate – – Shimizu et al. (1985)
Reverse mutation (TA98, TA100, TA1537)
Not available – Not detected
Ishidate et al. (1981)
Escherichia coli Differential DNA repair test (K-12/343/113)
Up to 375 mM – Not detected
Hellmer and Bolcsfoldi (1992)
Mammalian cells – rodent Mouse renal inner medullary collecting duct (mIMCD3) cells
Alkaline comet assay (single strand breaks)
300 and 600 mOsm/kg
+ Not detected
Zhang et al. (2004)
Neutral comet assay (double strand breaks)
600 mOsmol/kg _ Not detected
Zhang et al. (2004)
Neutral comet assay (double strand breaks)
600 mOsm/kg – Not detected
Kultz and Chakravarty (2001)
Mouse lymphoma cells L5178Y TK+/–
Micronucleus assay 500–2,000 µg/mL – – Nesslany and Marzin (1999)
Alkaline unwinding 0–0.718 mol/l +a Not detected
Garberg et al. (1988)
Forward mutation 0–0.662 mol/l +a Not detected
Wangenheim and Bolcsfoldi (1988)
Rat hepatocytes Alkaline elution 0.03–3.0 mM – Not detected
Sina et al. (1983)
Chinese hamster lung
Chromosomal aberrations (CAs)
Not available + + Ishidate and Yoshikawa (1980)
Not available + Not detected
Ishidate et al. (1981)
≤16 mg/mL (266 mM)
+a Not detected
Ishidate and Odashima (1977)
Intercellular communication
0–5 mg/mL +a Umeda et al. (1980)
Epithelioid C3H mouse embryo cells
Multinucleated cells 1–10 µg/mL – Not detected
De Brabander et al. (1976)
Mammalian cells – human Lymphocyte CAs 0.01–1.0 mg/mL – Not
detected Zhurkov (1975)
0.06 and 3.0 mg/mL (1 and 50 mM)
+b Not detected
Oppenheim and Fishbein (1965)
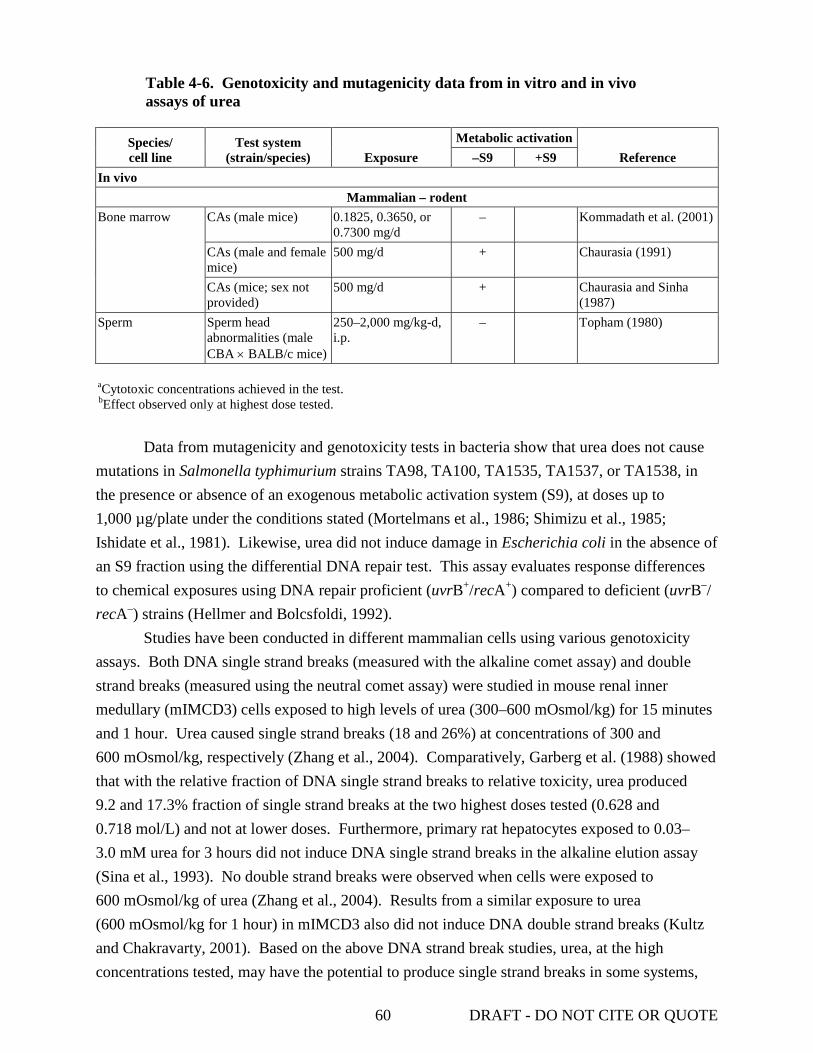
60 DRAFT - DO NOT CITE OR QUOTE
Table 4-6. Genotoxicity and mutagenicity data from in vitro and in vivo assays of urea
Species/ cell line
Test system (strain/species) Exposure
Metabolic activation Reference –S9 +S9
In vivo Mammalian – rodent
Bone marrow CAs (male mice) 0.1825, 0.3650, or 0.7300 mg/d
– Kommadath et al. (2001)
CAs (male and female mice)
500 mg/d + Chaurasia (1991)
CAs (mice; sex not provided)
500 mg/d + Chaurasia and Sinha (1987)
Sperm Sperm head abnormalities (male CBA × BALB/c mice)
250–2,000 mg/kg-d, i.p.
– Topham (1980)
aCytotoxic concentrations achieved in the test. bEffect observed only at highest dose tested.
Data from mutagenicity and genotoxicity tests in bacteria show that urea does not cause
mutations in Salmonella typhimurium strains TA98, TA100, TA1535, TA1537, or TA1538, in the presence or absence of an exogenous metabolic activation system (S9), at doses up to 1,000 µg/plate under the conditions stated (Mortelmans et al., 1986; Shimizu et al., 1985; Ishidate et al., 1981). Likewise, urea did not induce damage in Escherichia coli in the absence of an S9 fraction using the differential DNA repair test. This assay evaluates response differences to chemical exposures using DNA repair proficient (uvrB+/recA+) compared to deficient (uvrB–/recA–) strains (Hellmer and Bolcsfoldi, 1992).
Studies have been conducted in different mammalian cells using various genotoxicity assays. Both DNA single strand breaks (measured with the alkaline comet assay) and double strand breaks (measured using the neutral comet assay) were studied in mouse renal inner medullary (mIMCD3) cells exposed to high levels of urea (300–600 mOsmol/kg) for 15 minutes and 1 hour. Urea caused single strand breaks (18 and 26%) at concentrations of 300 and 600 mOsmol/kg, respectively (Zhang et al., 2004). Comparatively, Garberg et al. (1988) showed that with the relative fraction of DNA single strand breaks to relative toxicity, urea produced 9.2 and 17.3% fraction of single strand breaks at the two highest doses tested (0.628 and 0.718 mol/L) and not at lower doses. Furthermore, primary rat hepatocytes exposed to 0.03–3.0 mM urea for 3 hours did not induce DNA single strand breaks in the alkaline elution assay (Sina et al., 1993). No double strand breaks were observed when cells were exposed to 600 mOsmol/kg of urea (Zhang et al., 2004). Results from a similar exposure to urea (600 mOsmol/kg for 1 hour) in mIMCD3 also did not induce DNA double strand breaks (Kultz and Chakravarty, 2001). Based on the above DNA strand break studies, urea, at the high concentrations tested, may have the potential to produce single strand breaks in some systems,

61 DRAFT - DO NOT CITE OR QUOTE
but not double strand breaks. It is possible that urea is forming ROS resulting in single strand breaks.
Forward mutations in mouse lymphoma L5178Y thymidine kinase locus were determined in cells exposed to several different compounds, including urea, for 4 hours (Wangenheim and Bolcsfoldi, 1988). In this study, mutation frequency was significantly increased; however, no dose-response relationship was observed except for the two highest doses tested (0.53 and 0.662 mol/L) in the absence of S9. It should be noted that the total growth (suspension growth × clonal efficiency) was only 24 and 8% compared to control in the highest two doses tested. Nesslany and Marzin (1999) studied micronucleus formation as a result of exposure to urea, in which mouse lymphoma L5178Y TK+/– cells were exposed to 500, 1,000, or 2,000 μg/mL of urea for 4 hours in both the presence and absence of S9. An increase in micronuclei frequency was not observed at any of the concentrations tested.
In vitro studies were conducted (Ishidate et al., 1981; Ishidate and Yoshikawa, 1980; Ishidate and Odashima, 1977) to examine chromosomal aberrations (CAs) in Chinese hamster lung cells after 24- or 48-hour exposures to urea concentrations up to 266 mM. In the first study (Ishidate and Odashima, 1977), at a maximum effective dose of 16 mg/mL, 37% of cells showed CA of one or more types including gaps, breaks, translocations, and fragmentation. In a second study (Ishidate and Yoshikawa, 1980), although details are not provided about the experimental design, the authors state that urea (among several other compounds) was positive in the CA test. In a follow-up study (Ishidate et al., 1981), urea was judged to be positive (a determination of “positive” was defined by the authors as when the incidence of polyploidy cells or cells with structural aberrations exceeded 10%, since the incidence in both untreated and solvent-treated control cells was usually <5%) based on the number of CAs. Urea at a concentration of 13 mg/mL showed that >20% of the metaphases had CAs.
Similarly, Oppenheim and Fishbein (1965) reported that exposure of cultured normal human leukocytes to 50 mM (3.0 mg/mL) urea for 72 hours increased the incidence of CAs twofold over controls. Zhurkov (1975) also exposed human leukocytes to urea but at lower concentrations (up to 1.0 mg/mL) and reported no increase in CAs. Along with chromosome fragmentations, there were other signs suggesting cell toxicity such as an increased proportion of damaged cells and metaphase breakage occurring concurrently. Umeda et al. (1980) reported that urea (5 mg/mL) inhibited intercellular communication between wild-type Chinese hamster V79 lung cells and a 6-thioguanine-resistant clone in vitro. However, it was noted that toxic effects were also observed at this dose. De Brabander et al. (1976) reported no multinucleation or major toxicity among epitheloid C3H mouse embryo cells exposed to urea concentrations up to 10 μg/mL.
Chaurasia (1991) and Chaurasia and Sinha (1987) conducted in vivo experiments in 7–10-week-old male Swiss albino mice fed with urea (500 mg/kg-day) for 5–7 days. Bone marrow samples were collected 7 days after the last treatment and a minimum of 100 metaphases were

62 DRAFT - DO NOT CITE OR QUOTE
examined. Both studies showed that urea was capable of inducing CAs. Among several types of CAs found, chromatid breaks were the most frequent. The authors concluded that urea may be a potent clastogen. On the contrary, urea exposure of 3–4-month-old male Swiss albino mice to 0.1825–0.7300 mg/day via food for up to 28 days did not show an increase in bone marrow CAs (Kommadath et al., 2001). The lack of consistency between the two groups of studies is likely due to the difference in the dose. Additionally, urea did not induce sperm head abnormalities in five male (CBA BALB/c) F1 mice that were assayed 5 weeks after receiving five daily i.p. injections of urea (up to 2,000 mg/kg-day) (Topham, 1980).
In summary, data from various genotoxicity assays show that urea produces both positive and negative results in several test systems. It should be noted that in many of these studies, urea is one of the several compounds tested with the objective of either comparing different types or the sensitivity of different genotoxicity assays; hence, specific study details were not reported in these studies. Urea does not induce mutations in bacterial or E. coli systems. Based on results of specific assays that detect DNA strand breaks, urea, at high concentrations, may have the potential to produce single strand breaks in some systems, but not double strand breaks. It is possible that urea forms ROS resulting in single strand breaks. In vitro and in vivo CA studies have demonstrated mixed results with some studies showing CAs while others show no indication of chromosomal damage. This is particularly true among the in vivo studies. It is likely that this lack of consistency is due to the difference in dose. Some of the positive responses that have been reported are at high doses and test concentrations. As noted above, one of the constraints in making specific conclusions is the lack of study details, especially in studies that evaluated the genotoxicity of multiple chemicals. Therefore, although there is inadequate information to consider urea to act specifically through a mutagenic mode of action, based on the induction of CAs in certain mammalian test systems, the role of genotoxicity in the process of urea-induced carcinogenicity cannot be eliminated.
4.6. SYNTHESIS OF MAJOR NONCANCER EFFECTS 4.6.1. Oral Exposure
There are limited studies that evaluated the possible association between oral exposure to urea and noncancer effects in humans. The human-based literature includes two studies that investigated the potential relationship between urea exposure and altered hematological endpoints. Eknoyan et al. (1969) showed that ingestion of urea by patients with experimentally induced azotemia decreased platelet adhesiveness. Additionally, the reduction in platelet adhesiveness was greater in subjects where high SUN concentrations were maintained for 24 hours compared to subjects where SUN concentrations were maintained for 8–10 hours. Bensinger et al. (1972) reported that ingestion of urea by patients with sickle cell disease did not produce a statistically significant effect on RBC survival. In addition to these studies, a single report on an accidental urea poisoning stated that symptoms resembling strychnine poisoning

63 DRAFT - DO NOT CITE OR QUOTE
(loss of appetite, nausea, vomiting, extreme excitement, severe general convulsions) developed relatively soon (3–5 hours after ingestion); however, none of the patients died and all recovered within a few days (Steyn, 1961). Review of all three publications does not provide information on human subjects research ethics procedures undertaken in these studies. Studies in pigs, rats, and mice showed that urea did not induce general toxic effects (e.g., death or decreased body weight) at a variety of doses and dosing regimens. Studies by Button et al. (1982), Teramoto et al. (1981), Fleischman et al. (1980), and Seipelt et al. (1969) showed that oral administration of urea, via gavage or feed, did not produce toxicity, decreased body weight, or other symptoms of urea intoxication in tested animal models. These studies are in contrast to the Finlayson and Baumann (1956) study, which showed that urea-induced decreases in body weight depended upon the dose as well as the rate of administration.
There are conflicting results from the reproductive and developmental studies that have been conducted to date. Teramoto et al. (1981) showed that a single, high dose of urea did not affect the number of implants, number of live fetuses, percent fetal resorptions, mean fetal body weight, or percent of malformed fetuses in mice and rats. However, studies by Seipelt et al. (1969) suggest that maternal exposure may decrease the number of pups/litter.
There are also conflicting results reported in studies on the effect of urea on reproductive performance in cows maintained on feeding regimens that increased blood urea concentrations. Rhoads et al. (2006) modulated plasma urea concentrations by using different protein-enriched diets and found that a high protein diet altered the viability of the bovine oocyte or embryo. Ordóñez et al. (2007) evaluated cows that were grazed on pastures to which supplementary urea nitrogen fertilizer was applied. Evaluation of several ovarian parameters, the number of luteal phases, and milk progesterone concentrations indicated no difference between control cows and urea-grazed cows. An explanation for the different results could be due to the difference in urea sources between the studies.
Limited data suggest that the liver, kidney, and/or pituitary could be targets of urea toxicity. One study by Kommadath et al. (2001) indicated that urea may induce liver and kidney toxicity. Mice given urea-adulterated milk orally (dose range 0.1825–0.73 mg/kg-day) exhibited degenerative and necrotic changes in hepatocytes and lymphoid follicle formation of the liver. Additionally, fatty changes in the perirenal tissue, mild necrosis, glomerulitis, and leukocytic infiltration were observed in the kidney. Furthermore, studies showed that urea increased protein synthesis and decreased the density of secretory granules in pituitary intermediate cells after urea administration via food (Okada and Kobayashi, 1989).
Overall, the available studies provide a limited indication of the effects of urea after oral exposure.

64 DRAFT - DO NOT CITE OR QUOTE
4.6.2. Inhalation Exposure While there are several studies that have evaluated the toxicological effects of urea-
containing mixtures, few studies have specifically correlated the effects of urea inhalation to observed toxicological effects. Similar to experimental outcomes from oral studies, the hepatic system may be a target of inhaled urea. An occupational exposure study by El Far et al. (2006) showed that exposure to urea increased AST and ALT activities by 15 and 19%, respectively, and decreased creatinine concentrations by 13%. The same authors also reported statistically significant urea-induced increases in the blood levels of CEA and PSA; however, it should be noted that all biomarker changes, despite statistical significance, were well within the normal physiological range (Gomella and Haist, 2004).
Studies assessing the impact of urea exposure on lung function indicate that the effects are minimal. A retrospective cohort study (Bhat and Ramaswamy, 1993) and a therapeutic study (Cade and Pain, 1972) showed that urea inhalation caused mild impairment of lung function. An occupational exposure study on urea reported a decrease in PEFR/min (approximately 20%) but provide limited information to support an effect or a dose-response relationship (Bhat and Ramaswamy, 1993). The therapeutic study in asthmatics showed that a single exposure to urea only produced variable effects on VC and FEV1 (Cade and Pain, 1972).
4.6.3. Dermal Exposure
There are limited human and animal studies on the effects of urea after dermal exposure. The majority of the human studies suggest that dermal exposure to urea at concentrations up to 60% does not produce skin irritation. However, two studies showed that a 20% urea formulation did produce edema and skin irritation (Agner, 1992; Fair and Krum, 1979). Interestingly, in those cases where urea was shown to produce skin irritation, petrolatum was present in the formulation. Agner (1992) also noted that previous studies had indicated that penetration of urea into human skin strongly depends on the vehicle used. Furthermore, Johnson et al. (1970) showed that hypotonic, hypertonic, and isotonic urea solutions all produced different effects in the abraded skin of two healthy male volunteers. While isotonic urea produced mixed effects, hypertonic and hypotonic solutions decreased the number of dermal macrophages in both volunteers.
A single short-term study in mice by Lashmar et al. (1989) indicated that dermal urea exposure did not produce changes in skin histology or irritation, as determined by visual inspection, after a 24-hour occluded exposure to a 10% aqueous urea solution.
Based on the limited information available, studies suggest that dermatotoxic effects of urea are greatly dependent upon the vehicle used and manifest primarily as skin irritation; however, further studies are needed to corroborate the results (Agner, 1992; Fair and Krum, 1979; Johnson et al., 1970).

65 DRAFT - DO NOT CITE OR QUOTE
4.6.4. Additional Studies In vitro and in vivo studies have shown that the cardiovascular system may be a target for
urea. Induction of a uremic state in Apo E–/– mice was shown to increase aortic plaque area. Compositional analysis of these lesions showed an increase in collagen, calcite, and hydroxyapatite when compared with control animals (Massy et al., 2005). Urea also produced electromechanical alterations and hypotension when applied to rat hearts in vitro (Abaurre et al., 1992) and induced changes in blood pressure and heart rate in dogs in vivo (Cuparencu et al., 1961). Abaurre et al. (1992) showed that at a concentration of 17 mM, urea reduced the isometric force and rate of force development in papillary muscles. Urea also decreased isovolumic systolic pressure, as measured in Langendorff perfused hearts. Electrocardiographic studies showed that urea reduced the total QRS amplitude, increased QRS duration, decreased P wave amplitude, and elevated the ST segment in a majority of the samples evaluated. Cuparencu et al. (1961) showed that i.v. or intraarterial injection of urea in dogs caused opposite effects on blood pressure that were caused by vascular reflexes, endocrine vasoactive substances, and/or nervous regulation. Both i.v. and intraarterial administration methods were shown to induce tachyphylaxis.
4.6.5. Mode of Action
Urea has been shown to target a variety of organ systems including cardiovascular, renal, hepatic, nervous, and pituitary. The spectrum of effects produced within these systems suggests that urea may produce effects through a variety of molecular mechanisms.
Structural modification of proteins, either through protein carbamylation or protein carbonylation, is one proposed mode of action for urea. Urea breakdown leads to the formation of cyanate and ammonia. The active form of cyanate, isocyanic acid, may be formed and then react with nonprotonated amino groups of proteins. The carbamylation and carbonylation of these proteins may then lead to altered protein structure and protein activity. Protein carbamylation has been implicated in the development of atherosclerosis (Ok et al., 2005) and in the induction of heat shock proteins in a neuronal cell line (Maddock and Westenfelder, 1996). Further, Zhang et al. (2004) showed that protein carbonylation may occur in renal cells. The mechanism (i.e., enzymatic vs. nonenzymatic) by which protein carbonylation and carbamylation occur is currently unclear. Zhang et al. (2004) showed that direct application of urea to homogenized cellular preparations did not induce protein carbonylation, suggesting either that the levels of ROS are insufficient to induce carbonylation or that the necessary enzymatic cofactors to induce carbonylation are diluted in the preparation. However, there is no additional information on the mechanism(s) of action for urea carbonylation and carbamylation.
Uremia complications include seizures, lethargy, and locomotor alterations, suggesting that urea may induce these effects through the nervous system. As noted above, urea has been implicated in the induction of heat shock proteins, which play a role in protein folding and

66 DRAFT - DO NOT CITE OR QUOTE
intracellular trafficking (Maddock and Westenfelder, 1996). Specific interactions within the glycinergic pathway is another proposed mechanism by which urea may produce neurotoxicological effects. In the CNS, glycine has been shown to act as an inhibitory neurotransmitter (i.e., induces hyperpolarization of neurons) and inhibitory activity has been shown to occur between spinal interneurons and motoneurons (Bloom, 1990). Glycine-induced hyperpolarization occurs through increased chloride conductance (Bloom, 1990), which is antagonized by strychnine. Chung et al. (1985) showed that urea can specifically inhibit binding of strychnine to glycine receptors and that this effect is reversible. Studies by Chung et al. (1985) suggested that the observed binding inhibition is not due to osmotic effects of urea. Furthermore, urea was shown to not inhibit glycine uptake suggesting that urea-induced alteration of glycinergic neurotransmission occurs through direct modulation of the anion channel (Chung et al., 1985). Disinhibition of the glycinergic pathway by urea may play a role in the altered locomotor effects observed after urea administration.
The effects of urea may also occur through modulation of IEGs, such as c-fos and Egr-1. Increased expression of IEGs is proposed to occur through two pathways: (1) a PKC-dependent mechanism, and (2) Shc protein (Tian and Cohen, 2002; Tian et al., 2000; Zhang et al., 2000a; Cohen et al., 1996; Cohen and Gullans, 1993b). Activation of the PKC-dependent pathway is proposed to lead to increased activation of MAPKs, which then induce transcription of IEGs. Activation of Shc protein, via phosphorylation, is proposed to lead to recruitment of Grb2. This would lead to downstream activation of Ras, via recruitment of the guanine nucleotide exchange factor SOS, and increased transcription of IEGs. The full effect of the upregulation of these genes and their roles in producing the observed toxicological effects continue to be under evaluation.
Urea has also been shown to modulate transcription of the oxidative stress response factor Gadd153 (Zhang et al., 1999). This increase was shown to occur at concentrations where oxidative stress was induced in cells. The effect of urea on gene transcription was shown to be sensitive to the presence of antioxidants, suggesting that reactive oxygen intermediates may play a role in the signaling mechanism. Zhang et al. (1999) also showed that a component of Egr-1 transcriptional activation is sensitive to antioxidants. While the effect was studied only in renal cells, it may occur in other cell types. As discussed with the IEGs, the role that this mechanism may play in producing the observed toxicological effects needs further evaluation.
Urea has been shown to differentially modulate levels of UTs depending on the tissue evaluated (Inoue et al., 2005; Kim et al., 2005; Lucien et al., 2005; Hu et al., 2000). Altered transporter levels may significantly alter the osmotic balance present in tissues and lead to the development of oxidative stress. As discussed previously in this section, oxidative stress can produce a variety of effects, including disruption of protein structure and upregulation of oxidative stress factors.

67 DRAFT - DO NOT CITE OR QUOTE
4.7 EVALUATION OF CARCINOGENICITY 4.7.1. Summary of Overall Weight of Evidence
Under the Guidelines for Carcinogen Risk Assessment (U.S. EPA, 2005a), there is inadequate information to access the carcinogenic potential of urea. Fleishman et al. (1980) observed an increase in malignant lymphomas in the mid-dose group of female mice (incidences: 10/92, 7/43, 10/38, and 9/50 in the control, 0.45, 0.9, and 4.5% dose groups, respectively) in a 12-month feeding study. The female mice results were not statistically significant by a trend test, but incidences among the treated groups (using data from the text or data table) were higher than in control. A pairwise comparison with control indicated statistical significance (p = 0.008) in the mid-dose (0.9%) group only. In addition, there was a statistically significant linear trend (p = 0.008) and a statistically significant occurrence in tumor incidence at the high dose for interstitial adenomas in the testes in male rats (incidences: 21/50, 27/48, 25/48, and 35/50 (p = 0.004) in the control, 0.45, 0.9, and 4.5% dose groups, respectively). As discussed in Section 4.2.1.2, there were reporting problems with this study such that the exact number of animals used for histopathological evaluation is unknown. A chronic study (11-month treatment period with follow-up to 15 months) by Shear and Leiter (1941) showed no treatment related increase in tumors following s.c. administration in mice. Epidemiologic studies of humans chronically exposed to urea alone or urea-containing mixtures are limited. One occupational study showed that exposure to urea increased levels of carcinogenic biomarkers (e.g., CEA and PSA), but these changes were within the normal physiologic range (El Far et al., 2006). Urea has been tested for its genotoxic potential and has showed little capacity to produce genotoxic effects in bacterial test strains. Results from in vitro and in vivo studies in mammalian systems were mixed. The determination that there is inadequate information to assess the carcinogenic potential is
appropriate when the available data are judged inadequate for applying one of the other descriptors.
There is some uncertainty associated with the choice of this cancer descriptor for urea. For example,
in the 12 month feeding study (Fleischman et al., 1980), a statistically significant increase in
interstitial adenomas in the testes was observed at the high dose in male rats, and while the female
mice results were not statistically significant by a trend test, all instances were higher than control.
An additional year of exposure may have led to the formation of more tumors as the duration of the
Fleischman et al (1980) study (i.e., 12 months) is not representative of a lifetime exposure scenario.
For these reasons, evidence supporting the proximate descriptor, in this case suggestive
evidence of carcinogenic potential, was also considered (U.S. EPA, 2005). However, when the
limitations in the available studies are taken into consideration, the data are considered inadequate to
determine the carcinogenic potential.

68 DRAFT - DO NOT CITE OR QUOTE
4.7.2. Synthesis of Human, Animal, and Other Supporting Evidence The human carcinogenicity potential of urea and urea-containing mixtures has been
evaluated in a limited number of studies. While some of the results from studies that evaluated urea-containing mixtures indicated that urea exposure may have contributed to the occurrence of tumor development or increased sister chromatid exchange and CA frequency, its role in producing the observed effects was not clearly established. Therefore, the available data do not permit a conclusion about human carcinogenicity potential from exposure to urea alone.
El Far et al. (2006) evaluated the effect of occupational inhalational exposure to urea or urea mixed with other vapors (phenol and formaldehyde) on the levels of three carcinogenic biomarkers. Their studies showed that serum concentrations of CEA were significantly increased in both exposure groups while AFP concentrations were increased in the group exposed to a mixture of vapors including urea. PSA concentrations were decreased in the group exposed to urea alone. All biomarker effects reported by El Far et al. (2006) were within physiologically normal ranges and exposure levels were not estimated in the study. These results provide no relevant evidence that urea may play a role in tumorigenesis.
Two chronic studies in laboratory animals have evaluated the carcinogenic potential of urea (Fleischman et al., 1980; Shear and Leiter, 1941). Fleischman et al. (1980) conducted a study in which male and female F344 rats and C57BL/6 mice were exposed to urea (0.45–4.5%) in feed for 12 months. Only female mice in the middle dose group exhibited a significant increase in malignant lymphomas. A statistically significant increase in interstitial adenomas in the testes was observed in male rats in the high dose group. There were reporting inconsistencies within this study. Shear and Leiter (1941) evaluated the carcinogenic potential of urea when administered by s.c. injection (<20 doses over 11 months) to strain A and C57BL male mice. The authors stated that no tumors at the injection site were observed. Neither study treated or observed the animals for the typical 24-month period.
Genotoxicity and mutagenicity studies in bacterial strains indicate that urea may not be mutagenic in S. typhimurium (with or without metabolic activation) or E. coli (Hellmer and Bolcsfoldi, 1992; Mortelmans et al., 1986; Shimizu et al., 1985; Ishidate et al., 1981). Based on the results of specific assays that detect DNA strand breaks, urea, at high concentrations, may have the potential to produce single strand breaks in some test systems, but not double strand breaks. It is possible that urea forms ROS resulting in single strand breaks (Zhang et al., 2004; Kultz and Chakravarty, 2001; Garberg et al., 1988). Urea produced CAs in different mammalian cell types and test systems (e.g., mouse lymphoma forward mutation assay and mouse renal inner medullary collecting duct cells evaluated using the alkaline comet assay), generally at high concentrations (approximately 5–38 mg/mL) (Zhang et al., 2004; Garberg et al., 1988; Wangenheim and Bolcsfoldi, 1988, Ishidate et al., 1981; Ishidate and Yoshikawa, 1980; Umeda et al., 1980; Ishidate and Odashima, 1977). However, several of the studies observed effects that were accompanied by a concomitant decrease in cell viability (Garberg et al., 1988;

69 DRAFT - DO NOT CITE OR QUOTE
Wangenheim and Bolcsfoldi, 1988; Umeda et al., 1980) or occurred at high concentrations (e.g., 50 mM; Oppenheim and Fishbein, 1965). In vivo, urea produced CAs in bone marrow cells of Swiss albino mice fed high doses of urea (500 mg/kg-day for 5–7 days) but not in mice fed doses of 7.3, 14.6, and 29.2 mg/kg-day for up to 28 days (Kommadath et al., 2001; Chaurasia, 1991; Chaurasia and Sinha, 1987). Additionally, urea did not induce sperm head abnormalities in male mice that received five daily i.p. injections of urea (up to 2,000 mg/kg-day) (Topham, 1980). Based on the available genotoxicity information, even though the studies that detect mutations were negative in Salmonella strains, based on the induction of chromosomal aberrations in certain mammalian test systems, the role of genotoxicity in the process of urea-induced carcinogenicity cannot be eliminated.
4.8. SUSCEPTIBLE POPULATIONS AND LIFE STAGES
The reproductive and developmental studies of urea that have been conducted in animals to date (described in Section 4.3) present limited and conflicting data that are insufficient to determine if urea is a teratogen or a developmental toxicant. No human studies directly relating to susceptible populations and life stages are available. However, studies on patients with renal disease and asthma have been identified that may be informative for identification of susceptible populations. For example, Eknoyan et al. (1969) showed that patients with experimentally induced azotemia or uremia displayed decreased platelet adhesiveness. An additional study by Cade and Pain (1972) showed that inhaled urea caused mild hypoxemia, impairment of gas transfer, and ventilation-blood-flow inequality in symptom-free asthmatic patients. Cade and Pain (1972) noted that these bronchoactive effects of urea were only observed in asthmatics and were not observed in normal subjects.

70 DRAFT - DO NOT CITE OR QUOTE
5. DOSE-RESPONSE ASSESSMENTS 5.1. ORAL REFERENCE DOSE (RfD)
The RfD is an estimate (with uncertainty spanning perhaps an order of magnitude) of a daily oral exposure to the human population (including sensitive subgroups) that is likely to be without an appreciable risk of deleterious effects during a lifetime. It can be derived from a no-observed-adverse-effect level (NOAEL), LOAEL, or benchmark dose, with uncertainty factors (UFs) generally applied to reflect limitations of the data used.
5.1.1. Choice of Principal Studies and Critical Effect—with Rationale and Justification
Information regarding the potential toxicity of oral exposure to exogenous urea in humans is limited to accounts of accidental exposure (Steyn, 1961), studies on volunteers with renal disease (Eknoyan et al., 1969), and studies where therapeutic uses of urea were employed (Bensinger et al., 1972). These studies are of limited value in developing a chronic RfD due to the acute nature of exposure to urea, evaluation of high doses, lack of observed toxicity, limited study design, and insufficient exposure characterization (Bensinger et al., 1972; Eknoyan et al., 1969; Steyn, 1961).
Two human studies investigated the potential relationship between urea exposure and altered hematological endpoints. Eknoyan et al. (1969) showed that ingestion of urea by patients with experimentally induced azotemia decreased platelet adhesiveness. Additionally, the reduction in platelet adhesiveness was greater in subjects where SUN concentrations were maintained for 24 hours compared to subjects where SUN concentrations were maintained for 8–10 hours. Ingestion of urea by patients with sickle cell disease did not produce a statistically significant effect on RBC survival (Bensinger et al., 1972). In addition to these studies, a single report on an accidental urea poisoning stated that symptoms resembling strychnine poisoning developed relatively soon (3–5 hours after ingestion); however, all patients recovered within a brief period of time (Steyn, 1961).
The limited data available suggest that the liver and kidney could be potential target organs of urea toxicity (Kommadath et al., 2001; Das et al., 1997; Krishna et al., 1990), and decreased weight gain may occur following urea exposure (Finlayson and Baumann, 1956). Exposure to urea via food caused an increase in protein synthesis and decreased the density of secretory granules in pituitary intermediate cells (Okada and Kobayashi, 1989). Button et al. (1982), Teramoto et al. (1981), Fleischman et al. (1980), and Seipelt et al. (1969) showed no effects from oral administration of urea, via gavage or feed, in tested animal models. These studies are in contrast to the Finlayson and Baumann (1956) study, which compared the effect of feeding rats urea mixed with a diet given ad libitum to a spaced feeding scheduled of 2 hours/day. For both feeding schedules, a decrease in weight gain was observed with increased urea

71 DRAFT - DO NOT CITE OR QUOTE
doses. However, no information was provided to assess whether this observation could be associated with decreased food consumption due to palatability.
A 28-day study by Kommadath et al. (2001) showed degenerative and necrotic changes in hepatocytes and lymphoid follicle formation of the liver in mice at the lowest tested dose of 7.3 mg/kg-day. Fatty changes in the perirenal tissue, mild necrosis, glomerulitis, and leukocytic infiltration were also observed in the kidney. However, Kommadath et al. (2001) did not report incidence data for these effects.
Overall, the available studies provide limited information on the potential toxicity of urea following oral exposure. The studies identify the liver and kidney as potential target organs for the toxicity of urea; however, the available information is either from short-term studies (e.g., 28-day exposures), or is insufficient to characterize a dose-response relationship due to a lack of incidence reporting. The 28-day study conducted by Kommadath et al. (2001) is the only study that provides an effect level that could be used for the derivation of an RfD (i.e., a LOAEL of 7.3 mg/kg-day based on degenerative effects in the liver and kidney in male mice). The use of this LOAEL for the derivation of an RfD is confounded by the significant uncertainty associated with the short duration of the study, extrapolation of this dose to humans, accounting for susceptible populations and the limited database of studies. Therefore, information on the oral toxicity of urea is considered insufficient for the derivation of an RfD.
5.1.2. Previous RfD Assessment
An IRIS assessment does not currently exist on the IRIS database.
5.2. INHALATION REFERENCE CONCENTRATION (RfC) The inhalation RfC is an estimate (with uncertainty spanning perhaps an order of
magnitude) of a continuous inhalation exposure to the human general population (including sensitive subgroups) that is likely to be without an appreciable risk of deleterious effects over a lifetime. It can be derived from a NOAEL, a LOAEL, or a benchmark concentration, with UFs generally applied to reflect uncertainties and/or limitations in the data used.
5.2.1. Choice of Principal Study and Critical Effect—with Rationale and Justification
Limited information is available regarding the inhalation toxicity of exogenous urea. Four studies (three occupational and one therapeutic) have been identified and are discussed in Section 4.1.2. Briefly, El Far et al. (2006) compared liver and kidney function as well as carcinogenicity biomarkers in eight workers exposed to urea for an average of 8 years to 15 nonexposed subjects. This study reported elevated AST, ALT, and PSA levels among exposed workers as compared to controls; however, all results were within the normal physiological range. Bhat and Ramaswamy (1993) evaluated lung function in 30 workers at a fertilizer chemical plant. Compared to the 68 controls, exposed workers had decreased

72 DRAFT - DO NOT CITE OR QUOTE
PEFR/minute rates; however, limitations with the study including the lack of exposure information hinder the consideration for the derivation of a reference value. No change in FVC or FEV1 was observed. For both studies (El Far et al., 2006; Bhat and Ramaswamy, 1993), no quantitative exposure levels were provided. Marsh et al. (2002) observed a low incidence of bladder cancers deaths—4 in a cohort of 995 workers—among workers at a nitrogen products plant. The mixed chemical exposure limits the specificity and power of the study. The authors stated that the bladder cancer excess may be due to occupational exposure prior to employment in the nitrogen products division. Cade and Pain (1972) investigated the impact of inhaled urea aerosol (4 M solution from a nebulizer for 10 minutes) on lung function in symptom-free asthmatics. The study authors reported that urea produced mild and variable impairments in VC and FEV1. However, correlation between individual initial and postexposure for VC and FEV1 was not noted.
In summary, no studies of inhaled urea in experimental animals were identified and human studies involving possible inhalation exposure to urea are limited and inconclusive. Therefore, information on the inhalation toxicity of urea is insufficient to derive an RfC.
5.2.2. Previous RfC Assessment
An IRIS assessment for urea does not currently exist on the IRIS database.
5.3. CANCER ASSESSMENT Under the Guidelines for Carcinogen Risk Assessment (U.S. EPA, 2005a), there is
inadequate information to assess the carcinogenic potential of urea (see Section 4.7). Epidemiologic studies of humans exposed to urea alone or urea-containing mixtures are limited. A single study showed that occupational exposure to urea increased levels of potential carcinogenic biomarkers (e.g., CEA and PSA), but these increases were within the normal physiologic range (El Far et al., 2006). One additional study indicated that urea was a possible risk factor in bladder cancer deaths (Marsh et al., 2002). However, the low incidence of bladder cancers deaths and the possibility of coexposure to other chemicals (nitric acid and acrylonitrile) limited the power of the study.
Two chronic studies in laboratory animals have evaluated the carcinogenic potential of urea (Fleischman et al., 1980; Shear and Leiter, 1941). Fleischman et al. (1980) reported a nondose-related statistically significant (pairwise comparison to control) increase in the incidence of malignant lymphomas among the mid-dose female mice after 12 months of exposure and a statistically significant increase in the incidence of interstitial cell adenomas of the testes in high-dose male rats. Discrepancies in data reporting were noted. Shear and Leiter (1941) reported no treatment-related tumors in mice that were administered urea via s.c. injection for 12 months. Genotoxicity assays show that urea did not induce mutations in bacterial or E. coli systems. Urea may have the potential to induce single strand breaks in some systems, but

73 DRAFT - DO NOT CITE OR QUOTE
not double strand breaks. In vitro and in vivo CA studies have demonstrated mixed results, with some studies showing CAs while others indicate no chromosomal damage. In several studies, specific details of the results were not provided.
5.3.1. Choice of Study/Data—with Rationale and Justification
The limitations of the data available to assess the carcinogenic potential of urea preclude
the derivation of an oral cancer slope factor or inhalation unit risk.
5.3.2. Previous Cancer Assessment An assessment for urea does not currently exist on the IRIS database.

74 DRAFT - DO NOT CITE OR QUOTE
6. MAJOR CONCLUSIONS IN THE CHARACTERIZATION OF HAZARD AND DOSE RESPONSE
6.1. HUMAN HAZARD POTENTIAL
Urea (CAS No. 57-13-6), also known as carbamide, is an endogenous product of protein and amino acid catabolism. It can also be produced synthetically by combining ammonia, carbon monoxide, and sulfur in methanol. It is used in a variety of applications including fertilizers, animal feed, plastics, flame-proofing agents, diesel-SCR, flavoring agent in foods, and in the manufacture of consumer goods such as liquid soaps, detergents, and household cleaning products.
In the occupational setting, the most notable routes of exposure are inhalation and dermal, while the general population might be exposed to urea through consumption of food and drinking water and through dermal contact with urea-containing products.
There is limited ADME information on exogenous urea. There are limited studies that evaluate the possible association between oral exposure to urea and noncancer effects in humans. There is limited information to suggest that the liver, kidney, and pituitary could be targets of urea toxicity. Results from reproductive and developmental studies have been inconclusive. There have been few studies that have evaluated the effects of urea via inhalation. The available studies suggest that the impact of urea exposure on lung function is minimal. With regard to dermal effects, the available studies showed that there is a dependence on the vehicle used and effects are typically manifested in the form of skin irritations.
The human carcinogenic potential of urea and urea-containing mixtures has been evaluated in a limited number of studies. Some studies that evaluated urea-containing mixtures indicate that urea exposure may have contributed to the occurrence of tumor development, or increased sister chromatid exchange and CA frequency, but its role in producing the observed effects was not clearly established. One occupational study showed that exposure to urea increased levels of potential carcinogenic biomarkers (e.g., CEA and PSA), but these increases were within the normal physiologic range (El Far et al., 2006). Two chronic studies in rats and mice showed no treatment-related increase in tumors following either oral or s.c. administration (Fleischman et al., 1980; Shear and Leiter, 1941).
Under the Guidelines for Carcinogen Risk Assessment (U.S. EPA, 2005a), there is inadequate information to access the carcinogenic potential of urea. Epidemiologic studies of humans chronically exposed to urea alone or urea-containing mixtures are limited. Urea has been tested for genotoxic potential and has shown no mutagenic effects in bacterial systems; however, CAs have been noted in certain mammalian test systems, and hence, the role of genotoxicity in the process of urea-induced carcinogenicity cannot be eliminated.

75 DRAFT - DO NOT CITE OR QUOTE
6.2. DOSE RESPONSE 6.2.1. Noncancer/Oral
Oral exposure studies of urea were not adequate for the determination of an RfD. The available animal studies identify the liver and kidney as a potential target organs for the toxicity of urea; however, the available information is insufficient to fully characterize toxicity outcomes or dose-response relationships.
6.2.2. Noncancer/Inhalation
Inhalation data were inadequate for the determination of an RfC. The occupational data lacked quantitative exposure measurements. The cited therapeutic study on lung function was based on acute exposure and had limited information on which to derive an RfC. No studies of inhaled urea in experimental animals were identified.
6.2.3. Cancer/Oral
One oral cancer bioassay is available for consideration for the derivation of an oral slope factor for urea. However, the limitations of the study data preclude the derivation of an oral cancer slope factor.
6.2.4. Cancer/Inhalation
Inhalation studies for urea were not adequate for the determination of an inhalation unit risk value. Route extrapolation from oral bioassay data was not performed due to the lack of oral data and suitable kinetic data.
76 DRAFT - DO NOT CITE OR QUOTE
7. REFERENCES Abaurre, PF; Stefanon, I; Mill, JG; et al. (1992) Electromechanical effects of urea on the isolated rat heart. Braz J Med Biol Res 25(7):717–726. Agner, T. (1992) An experimental study of irritant effects of urea in different vehicles. Acta Derm Venereol Suppl (Stockh) 177:44–46. Al-Homrany, M. (2001) In vitro effect of urea on serum enzymes levels. Biomed Res 12(2):87–89. Bagnasco, SM. (2005) Role and regulation of urea transporters. Pflugers Arch 450(4):217–226. Balestri, PL; Rindi, P; Biagini, M. (1971) Chronic urea intoxication in dogs. Experientia 27(7):811–812. Bensinger, TA; Mahmood, L; Conrad, ME; et al. (1972) The effect of oral urea administration on red cell survival in sickle cell disease. Am J Med Sci 264(4):283–287. Bhat, MR; Ramaswamy, C. (1993) Effect of ammonia, urea and diammonium phosphate (DAP) on lung functions in fertilizer plant workers. Indian J Physiol Pharmacol 37(3):221–224. Blake, DA; Burnett, LS; Miyasaki, BC; et al. (1976) Comparative effects of hyperosmolar urea administered by intra-amniotic, intravenous, and intraperitoneal routes in Rhesus monkeys. Am J Obstet Gynecol 124(3):239–244. Bloom, FE. (1990) Neurohumoral transmission and the central nervous system. In: Gilman, AG; Rall, TW; Nies, AS; et al.; eds. Goodman’s and Gilman’s the pharmacological basis of therapeutics. 8th edition. Elmsford, NY: Pergamon Press, Inc., pp. 244–268. Bulpitt, CJ; Breckenridge, A. (1976) Plasma urea in hypertensive patients. Br Heart J 38(7):689–694. Burg, MB; Ferraris, JD; Dmitrieva, NI. (2007) Cellular response to hyperosmotic stresses. Physiol Rev 87(4):1441–1474. Button, C; Joubert, JP; Maartens, BP. (1982) Absence of urea toxicity in young pigs. J S Afr Vet Assoc 53(1):67–68. Cade, JF; Pain, MC. (1972) Lung function in provoked asthma: responses to inhaled urea, methacholine and isoprenaline. Clin Sci 43(6):759–769. Chaurasia, OP. (1991) Randomness of chromosome breaks in bone marrow cells of fertilizer-fed mice, Mus musculus. Cytobios 67(268):7–12. Chaurasia, OP; Sinha, SP. (1987) Effects of urea on mitotic chromosomes of mice and onion. Cytologia 52(4):877–882. Chung, E; Yocca, F; Van Woert, MH. (1985) Urea-induced myoclonus: medullary glycine antagonism as mechanism of action. Life Sci 36(11):1051–1058. Cohen, DM. (1999) Signalling and gene regulation by urea and NaCl in the renal medulla. Clin Exp Pharmacol Physiol 26(1):69–73. Cohen, DM; Gullans, SR. (1993a) Urea selectively induces DNA synthesis in renal epithelial cells. Am J Physiol 264(4 Pt 2):F601–F607. Cohen, DM; Gullans, SR. (1993b) Urea induces EGR-1 and c-fos expression in renal epithelial cells. Am J Physiol 264(4 Pt 2):F593–F600.

77 DRAFT - DO NOT CITE OR QUOTE
Cohen, DM; Gullans, SR; Chin, WW. (1996) Urea signaling in cultured murine inner medullary collecting duct (mIMCD3) cells involves protein kinase c, inositol 1,4,5-trisphosphate (IP3), and a putative receptor tyrosine kinase. J Clin Invest 97(8):1884–1889. Conner, EA; Blake, DA; Parmley, TH; et al. (1976) Efficacy of various locally applied chemicals as contragestational agents in rats. Contraception 13(5):571–582. Cuparencu, B; Grosu, L; Tomus, L; et al. (1961) Research on the pharmacodynamic effects of urea on the cardiovascular system. Acta Biol Med Ger 6:123–140. Das, KC; Sahu, BK; Dehuri, PK; et al. (1997) Urea toxicity in chicks: histopathology. Indian J Vet Pathol 21:113–115. Dawes, C. (2006) Absorption of urea through the oral mucosa and estimation of the percentage of secreted whole saliva inadvertently swallowed during saliva collection. Arch Oral Biol 51(2):111–116. De Brabander, M; Van de Veire, R; Aerts, F; et al. (1976) A new culture model facilitating rapid quantitative testing of mitotic spindle inhibition in mammalian cells. J Natl Cancer Inst 56(2):357–363. Decker, D. (1996) Ammonia (urea) toxicosis in ruminants. Indiana Animal Disease Diagnostic Laboratory, West Lafayette, IN. Available online at http://www.addl.purdue.edu/newsletters/1996/winter/ammonia.shtml (accessed February 2008). D’Hooge, R; Van de Vijver, G; Van Bogaert, P-P; et al. (2003) Involvement of voltage- and ligand-gated Ca2+ channels in the neuroexcitatory and synergistic effects of putative uremic neurotoxins. Kidney Int 63(5):1764–1775. Doran, JJ; Klein, JD; Kim, YH; et al. (2006) Tissue distribution of UT-A and UT-B mRNA and protein in rat. Am J Physiol Regul Integr Comp Physiol 290(5):R1446-R1459. Eknoyan, G; Wacksman, SJ; Glueck, HI; et al. (1969) Platelet function in renal failure. N Engl J Med 280(13):677–681. El Far, M; El Naggar, M; Elkhawaga, OA; et al. (2006) Carcinoembryonic antigen, alpha-fetoprotein, and prostate-specific antigen in the sera of industrial workers exposed to phenol, formaldehyde, urea, and mixed vapors. Inhal Toxicol 18(13):1041–1046. Esaian, AM; Titova, VA; Shishkina, LI; et al. (1997) Effect of urea on the course of experimental uremia in subtotally nephrectomized rats. Patol Fiziol Eksp Ter 2:39–41. Fair, RH; Krum, RJ. (1979) Double blind irritation study of a new stabilized base hydrocortisone cream. Curr Ther Res Clin Exp 26(5):611–614. Fenton, RA; Howorth, A; Cooper, GJ; et al. (2000) Molecular characterization of a novel UT-A urea transporter isoform (UT-A5) in testis. Am J Physiol Cell Physiol 279(5):C1425–C1431. Fenton, RA; Stewart, GS; Carpenter, B; et al. (2002) Characterization of mouse urea transporters UT-A1 and UT-A2. Am J Physiol Renal Physiol 283:F817–F825. Finlayson, JS; Baumann, CA. (1956) Responses of rats to urea and related substances. The use of a spaced-feeding technique. J Nutr 59(2):211–221. Fleischman, RW; Baker, JR; Hagopian, M; et al. (1980) Carcinogenesis bioassay of acetamide, hexanamide, adipamide, urea and p-tolylurea in mice and rats. J Environ Pathol Toxicol 3:149–170. Forsythe, SJ; Parker, DS. (1985) Urea turnover and transfer to the digestive tract in the rabbit. Br J Nutr 53(1):183–190. Garberg, P; Akerblom, E; Bolcsfoldi, G. (1988) Evaluation of a genotoxicity test measuring DNA-strand breaks in mouse lymphoma cells by alkaline unwinding and hydroxyapatite elution. Mutat Res 203(3):155–176.

78 DRAFT - DO NOT CITE OR QUOTE
Gollhausen, R; Kligman, AM. (1985) Effects of pressure on contact dermatitis. Am J Ind Med 8(4–5):323–328. Gomella, LG; Haist, SA. (2004) Clinician’s pocket reference. New York, NY: McGraw-Hill.. Grollman, EF; Grollman, A. (1959) Toxicity of urea and its role in the pathogenesis of uremia. J Clin Invest 38(5):749–754. Guo, L; Zhao, D; Song, Y; et al. (2007) Reduced urea flux across the blood-testis barrier and early maturation in the male reproductive system in UT-B-null mice. Am J Physiol Cell Physiol 293(1):C305–C312. Halsted, JA. (1976) The laboratory in clinical medicine. Philadelphia, PA: W.B. Saunders Company. Hardy, RN; Lowe, KC; McNaughton, DC. (1983) Acute responses during blood substitution in the conscious rat. J Physiol 338:451–461. Hellmer, L; Bolcsfoldi, G. (1992) An evaluation of the E. coli k-12 UVRB/RECA DNA repair host-mediated assay. I. In vitro sensitivity of the bacteria to 61 compounds. Mutat Res 272(2):145–160. Hu, M-C; Bankir, L; Michelet, S; et al. (2000) Massive reduction of urea transporters in remnant kidney and brain of uremic rats. Kidney Int 58(3):1202–1210. Inoue, H; Kozlowski, SD; Klein, JD; et al. (2005) Regulated expression of renal and intestinal UT-B urea transporter in response to varying urea load. Am J Physiol Renal Physiol 289(2):F451–F458. Ishidate, M, Jr; Odashima, S. (1977) Chromosome tests with 134 compounds on Chinese hamster cells in vitro—a screening for chemical carcinogens. Mutat Res 48(3–4):337–353. Ishidate, M, Jr; Yoshikawa, K. (1980) Chromosome aberration tests with Chinese hamster cells in vitro with and without metabolic activation—a comparative study on mutagens and carcinogens. Arch Toxicol Suppl 4:41–44. Ishidate, M; Sofuni, T; Yoshikawa, K. (1981) Chromosomal aberration tests in vitro as a primary screening tool for environmental mutagens and/or carcinogens. GANN Monogr Cancer Res 27:95–108. Javid, M; Anderson, J. (1958) Observations on the use of urea in rhesus monkeys. Surg Forum 9:686–690. Johanson, CE; Woodbury, DM. (1978) Uptake of [14C]urea by the in vivo choroid plexus--cerebrospinal fluid--brain system: identification of sites of molecular sieving. J Physiol 275:167–176. Johnson, AJ; Rebuck, JW; Knoll, BF. (1970) The effect of autogenous urine on leukocytic defenses in man. II. The response to varied concentrations of saline, urea, and urine. Invest Urol 8(2):224-230. Kamm, DE; Wu, L; Kuchmy, BL. (1987) Contribution of the urea appearance rate to diuretic—induced azotemia in the rat. Kidney Int 32:47–56. Kaplan, B; Wang, Z; Siddhom, O; et al. (1999) Evaluation of urea kinetics utilizing stable isotope urea and pharmacokinetic modeling. Artif Organs 23(1):44–50. Kim, D; Klein, JD; Racine, S; et al. (2005) Urea may regulate urea transporter protein abundance during osmotic diuresis. Am J Physiol Renal Physiol 288(1):F188–F197. Kloppenburg, WD; Wolthers, BG; Stellaard, F; et al. (1997) Determination of urea kinetics by isotope dilution with [13C]urea and gas chromatography-isotope ratio mass spectrometry (GC-IRMS) analysis. Clin Sci 93(1):73–80. Kommadath, A; Sharma, A; Jakhar, KK. (2001) Hepatotoxic, nephrotoxic and genotoxic effects in mice fed urea adulterated milk. Indian J Dairy Sci 54(6):316–321. Kornegay, ET; Mosanghini, V; Snee, RD. (1970) Urea and amino acid supplementation of swine diets. J Nutr 100(3):330–340.

79 DRAFT - DO NOT CITE OR QUOTE
Krishna, L; Makkar, HPS; Singh, B. (1990) Urea utilization by rabbits fed low protein diets. II. Pathological studies. J Appl Rabbit Res 13:83–86. Kultz, D; Chakravarty, D. (2001) Hyperosmolality in the form of elevated NaCl but not urea causes DNA damage in murine kidney cells. Proc Natl Acad Sci USA 98(4):1999–2004. Lashmar, UT; Hadgraft, J; Thomas, N. (1989) Topical application of penetration enhancers to the skin of nude mice: a histopathological study. J Pharm Pharmacol 41(2):118–122. Levine, S; Saltzman, A. (2001) Are urea and creatinine uremic toxins in the rat? Ren Fail 23(1):53–59. Lucien, N; Bruneval, P; Lasbennes, F; et al. (2005) UT-B1 urea transporter is expressed along the urinary and gastrointestinal tracts of the mouse. Am J Physiol Regul Integr Comp Physiol 288(4):R1046–R1056. MacKay, L; MacKay, E; Addis, T. (1931) Factors which determine renal weight. XII. The nitrogen intake as varied by the addition of urea to the diet. J Nutr 4(3):379–383. Maddock, AL; Westenfelder, C. (1996) Urea induces the heat shock response in human neuroblastoma cells. J Am Soc Nephrol 7(2):275–282. Marini, JC; Lee, B; Garlick, PJ. (2006) In vivo urea kinetic studies in conscious mice. J Nutr 136:202–206. Marsh, GM; Gula, MJ; Youk, AO; et al. (2002) Bladder cancer among chemical workers exposed to nitrogen products and other substances. Am J Ind Med 42(4):286–295. Massy, ZA; Ivanovski, O; Nguyen-Khoa, T; et al. (2005) Uremia accelerates both atherosclerosis and arterial calcification in apolipoprotein e knockout mice. J Am Soc Nephrol 16(1):109–116. Matthews, DE; Downey, RS. (1984) Measurement of urea kinetics in humans: a validation of stable isotope tracer methods. Am J Physiol 246(6 Pt 1):E519–E527. McKay, E; Kilpatrick, SJ. (1964) Maternal and infant plasma urea at delivery. J Obst Gynaecol Brit Comm 71:449–452. Miryata, Y; Asano, Y; Muto, S. (2002) Hyperosmotic urea activates basolateral NHE in proximal tubule from P-GP null and wild-type mice. Am J Physiol Renal Physiol 283(4):F771–F783. Moeslinger, T; Spieckermann, PG. (2001) Urea-induced inducible nitric oxide synthase inhibition and macrophage proliferation. Kidney Int Suppl 78:S2–S8. Moran, BJ; Jackson, AA. (1990a) 15N-urea metabolism in the functioning human colon: luminal hydrolysis and mucosal permeability. Gut 31(4):454–457. Moran, BJ; Jackson, AA. (1990b) Metabolism of 15N-labelled urea in the functioning and defunctioned human colon. Clin Sci 79(3):253–258. Mortelmans, K; Haworth, S; Lawlor, T; et al. (1986) Salmonella mutagenicity tests: II. Results from the testing of 270 chemicals. Environ Mutagen 8 (Suppl 7):1–119. National Research Council. (1983) Risk assessment in the federal government: managing the process. Washington, DC: National Academy Press. Nesslany, F; Marzin, D. (1999) A micromethod for the in vitro micronucleus assay. Mutagenesis 14(4):403–410. NLM (National Library of Medicine). (2008a) Urea. HSDB (Hazardous Substances Data Bank). National Institutes of Health, U.S. Department of Health and Human Services, Bethesda, MD. Available online at http://toxnet.nlm.nih.gov/cgi-bin/sis/search/f?./temp/~9kT1QB:1 (accessed February 2008).

80 DRAFT - DO NOT CITE OR QUOTE
NLM (National Library of Medicine). (2008b) Urea. ChemIDplus Advanced. National Institutes of Health, U.S. Department of Health and Human Services, Bethesda, MD. Available online at http://chem.sis.nlm.nih.gov/chemidplus/ProxyServlet?objectHandle=Search&actionHandle=getAll3DMViewFiles&nextPage=jsp%2Fcommon%2FChemFull.jsp%3FcalledFrom%3D&chemid=000057136&formatType=_3D (accessed February 2008). NLM (National Library of Medicine). (2008c) Urea. PubChem. National Institutes of Health, U.S. Department of Health and Human Services, Bethesda, MD. Available online at http://pubchem.ncbi.nlm.nih.gov/summary/summary.cgi?cid=1176 (accessed February 2008). Nomura, N; Matsumoto, S; Nishimura, Y; et al. (2006) Disposition of exogenous urea and effects of diet in rats. Arzneimittelforschung 56(3):258–266. NRC (National Research Council). (1983) Risk assessment in the federal government: managing the process. Washington, DC: National Academy Press. NTP (National Toxicology Program). (2009) Oral,feed – testes, ademomas. NTP historical controls for NTP-2000 diet. Available online at http://ntp.niehs.nih.gov/?objectid=92E705C7-F1F6-975E-72D23026B1645EB9#9 (accessed December 2009). Odeh, YK; Wang, Z; Ruo, TI; et al. (1993) Simultaneous analysis of inulin and 15N2-urea kinetics in humans. Clin Pharmacol Ther 53(4):419–425. OECD SIDS (Organisation for Economic Co-operation and Development Screening Information Data Set). (2008) Urea. CAS No: 57-13-6. Available online at http://www.inchem.org/documents/sids/sids/57136.pdf (accessed February 2008). Ok, E; Basnakian, AG; Apostolov, EO; et al. (2005) Carbamylated low-density lipoprotein induces death of endothelial cells: a link to atherosclerosis in patients with kidney disease. Kidney Int 68(1):173–178. Okada, M; Kobayashi, Y. (1989) Fine structural alterations in mouse pituitary intermediate lobe cells following oral urea administration. Zoolog Sci 6(6):4–6. O’Neil, MJ; Heckelman, PE; Koch, CB; et al.; eds. (2006) The Merck index: an encyclopedia of chemicals, drugs, and biologicals. 14th edition. Whitehouse Station, NJ: Merck and Co., Inc., p. 9867. Oppenheim, JJ; Fishbein, WN. (1965) Induction of chromosome breaks in cultured normal human leukocytes by potassium arsenite, hydroxyurea and related compounds. Cancer Res 25(7):980–985. Ordóñez, A; Parkinson, TJ; Matthew, C; et al. (2007) Effects of application in spring of urea fertiliser on aspects of reproductive performance of pasture-fed dairy cows. N Z Vet J 55(2):69–76. Ortolani, EL; Mori, CS; Rodrigues Filho, JA. (2000) Ammonia toxicity from urea in a Brazilian dairy goat flock. Vet Hum Toxicol 42(2):87–89. Pagana, KD; Pagana, TJ. (2003) Mosby’s diagnostic and laboratory test reference. 6th edition. St. Louis, MO: Mosby, Inc., pp. 738–741. Raidal, SR; Jaensch, SM. (2006) Acute poisoning of silver gulls (Larus novaehollandiae) following urea fertilizer spillage. Avian Pathol 35(1):38–41. Ranade, K; Wu, KD; Hwu, CM; et al. (2001) Genetic variation in the human urea transporter-2 is associated with variation in blood pressure. Hum Mol Genet 10(19):2157–2164. Rapoport, SI; Fitzhugh, R; Pettigrew, KD; et al. (1982) Drug entry into and distribution within brain and cerebrospinal fluid: [14C]urea pharmacokinetics. Am J Physiol 242(3):R339–R348. Rebuck, JW; Crowley, JH. (1955) A method of studying leukocytic functions in vivo. Ann NY Acad Sci 59(5):757–805.

81 DRAFT - DO NOT CITE OR QUOTE
Registry. (2008) RN 57-13-6. Database produced by Chemical Abstract Service (CAS) and available on STN International. Rhoads, ML; Rhoads, RP; Gilbert, RO; et al. (2006) Detrimental effects of high plasma urea nitrogen levels on viability of embryos from lactating dairy cows. Anim Reprod Sci 91(1–2):1–10. Rusoff, LL; Lank, RB; Spillman, TE; et al. (1965) Non-toxicity of urea feeding to horses. Vet Med Small Animal Clin 60(11):1123–1126. Sahin, S; Rowland, M. (2007) Influence of erythrocytes on the hepatic distribution kinetics of urea and thiourea. Eur J Pharm Sci 31(3–4):180–189. Sands, JM. (2003) Mammalian urea transporters. Annu Rev Physiol 65:543–566. Seipelt, H; Zoellner, K; Hilgenfeld, E; et al. (1969) Untersuchungen an nieren neugeborener ratten nach chronischer harnstoffapplikation beim muttertier [Studies on kidneys of newborn rats after chronic urea administration to the mother]. Z Urol Nephrol 62(8):623–627. Serup, J. (1992) A double-blind comparison of two creams containing urea as the active ingredient. Assessment of efficacy and side-effects by non-invasive techniques and a clinical scoring scheme. Acta Derm Venereol Suppl (Stockh) 177:34–43. Shear, MJ; Leiter, J. (1941) Studies in carcinogenesis. XVI. Production of subcutaneous tumors in mice by miscellaneous polycyclic compounds. J Natl Cancer Inst 2:241–258. Shimizu, H; Suzuki, Y; Takemura, N; et al. (1985) The results of microbial mutation test for forty-three industrial chemicals. Sangyo Igaku 27(6):400–419. Sina, JF; Bean, CL; Dysart, GR; et al. (1983) Evaluation of the alkaline elution/rat hepatocyte assay as a predictor of carcinogenic/mutagenic potential. Mutat Res 113(5):357–391. Spector, DA; Yang, Q; Wade, JB. (2007) High urea and creatinine concentrations and urea transporter B in mammalian urinary tract tissues. Am J Physiol Renal Physiol 292(1):F467–F474. Stewart, GS; Fenton, RA; Thevenod, F; et al. (2004) Urea movement across mouse colonic plasma membranes is mediated by UT-A urea transporters. Gastroenterology 126(3):765–773. Steyn, DG. (1961) An outbreak of urea poisoning among Bantu farm laborers in the Potgietersrust District, Transvaal. S African Med J 35(35):721–722. Teramoto, S; Kaneda, M; Aoyama, H; et al. (1981) Correlation between the molecular structure of N-alkylureas and N-alkylthioureas and their teratogenic properties. Teratology 23(3):335–342. Thurston, J; Hauhart, R; Dirgo, J; et al. (1986) Effects of acute hyperosmolar NaCl or urea on brain H2O, Na+, K+, carbohydrate, and amino acid metabolism in weanling mice: NaCl induces insulin secretion and hypoglycemia. Metab Brain Dis 1(2):129–146. Tian, W; Cohen, DM. (2002) Urea stress is more akin to EGF exposure than to hypertonic stress in renal medullary cells. Am J Physiol Renal Physiol 283(3):F388–F398. Tian, W; Boss, GR; Cohen, DM. (2000) RAS signaling in the inner medullary cell response to urea and NaCl. Am J Physiol Cell Physiol 278(2):C372–C380. Topham, JC. (1980) Do induced sperm-head abnormalities in mice specifically identify mammalian mutagens rather than carcinogens? Mutat Res 74(5):379–387. Tsukaguchi, H; Shayakul, C; Berger, UV; et al. (1997) Cloning and characterization of the urea transporter UT3: localization in rat kidney and testis. J Clin Invest 99:1506–1515.
82 DRAFT - DO NOT CITE OR QUOTE
Umeda, M; Noda, K; Ono, T. (1980) Inhibition of metabolic cooperation in Chinese hamster cells by various chemicals including tumor promoters. Jpn J Cancer Res 71:614–620. U.S. EPA (Environmental Protection Agency). (1986a) Guidelines for the health risk assessment of chemical mixtures. Federal Register 51(185):34014–34025. Available online at http://www.epa.gov/iris/backgrd.html (accessed April 20, 2010). U.S. EPA (Environmental Protection Agency). (1986b) Guidelines for mutagenicity risk assessment. Federal Register 51(185):34006–34012. Available online at http://www.epa.gov/iris/backgrd.html (accessed April 20, 2010). U.S. EPA (Environmental Protection Agency). (1988) Recommendations for and documentation of biological values for use in risk assessment. Prepared by the Environmental Criteria and Assessment Office, Office of Health and Environmental Assessment, Cincinnati, OH for the Office of Solid Waste and Emergency Response, Washington, DC; EPA 600/6-87/008. Available online at http://www.epa.gov/iris/backgrd.html (accessed April 20, 2010). U.S. EPA (Environmental Protection Agency). (1991) Guidelines for developmental toxicity risk assessment. Federal Register 56(234):63798–63826. Available online at http://www.epa.gov/iris/backgrd.html (accessed April 20, 2010). U.S. EPA (Environmental Protection Agency). (1994a) Interim policy for particle size and limit concentration issues in inhalation toxicity studies. Federal Register 59(206):53799. Available online at http://www.epa.gov/iris/backgrd.html (accessed April 20, 2010). U.S. EPA (Environmental Protection Agency). (1994b) Methods for derivation of inhalation reference concentrations and application of inhalation dosimetry. Office of Research and Development, Washington, DC; EPA/600/8-90/066F. Available online at http://www.epa.gov/iris/backgrd.html (accessed April 20, 2010). U.S. EPA (Environmental Protection Agency). (1995) Use of the benchmark dose approach in health risk assessment. Risk Assessment Forum, Washington, DC; EPA/630/R-94/007. Available online at http://cfpub.epa.gov/ncea/raf/recordisplay.cfm?deid=42601 (accessed March 11, 2010). U.S. EPA. (1996) Guidelines for reproductive toxicity risk assessment. Federal Register 61(212):56274–56322. Available online at http://www.epa.gov/iris/backgrd.html (accessed April 20, 2010). U.S. EPA (Environmental Protection Agency). (1998) Guidelines for neurotoxicity risk assessment. Federal Register 63(93):26926–26954. Available online at http://www.epa.gov/iris/backgrd.html (accessed April 20, 2010). U.S. EPA (Environmental Protection Agency). (2000a) Science policy council handbook: risk characterization. Office of Science Policy, Office of Research and Development, Washington, DC; EPA 100-B-00-002. Available online at http://www.epa.gov/iris/backgrd.html (accessed April 20, 2010). U.S. EPA (Environmental Protection Agency). (2000b) Benchmark dose technical guidance document. External review draft. Risk Assessment Forum, Washington, DC; EPA/630/R-00/001. Available online at http://www.epa.gov/iris/backgrd.html (accessed April 20, 2010). U.S. EPA (Environmental Protection Agency). (2000c) Supplementary guidance for conducting health risk assessment of chemical mixtures. Risk Assessment Forum, Washington, DC; EPA/630/R-00/002. Available online at http://www.epa.gov/iris/backgrd.html (accessed April 20, 2010). U.S. EPA (Environmental Protection Agency). (2002) A review of the reference dose and reference concentration processes. Risk Assessment Forum, Washington, DC; EPA/630/P-02/0002F. Available online at http://www.epa.gov/iris/backgrd.html (accessed April 20, 2010). U.S. EPA (Environmental Protection Agency). (2005a) Guidelines for carcinogen risk assessment. Risk Assessment Forum, Washington, DC; EPA/630/P-03/001F. Available online at http://www.epa.gov/iris/backgrd.html (accessed April 20, 2010).

83 DRAFT - DO NOT CITE OR QUOTE
U.S. EPA (Environmental Protection Agency). (2005b) Supplemental guidance for assessing susceptibility from early-life exposure to carcinogens. Risk Assessment Forum, Washington, DC; EPA/630/R-03/003F. Available online at http://www.epa.gov/iris/backgrd.html (accessed April 20, 2010). U.S. EPA (Environmental Protection Agency). (2006a) Science policy council handbook: peer review. Third edition. Office of Science Policy, Office of Research and Development, Washington, DC; EPA/100/B-06/002. Available online at http://www.epa.gov/iris/backgrd.html (accessed April 20, 2010). U.S. EPA (Environmental Protection Agency). (2006b) A framework for assessing health risk of environmental exposures to children. National Center for Environmental Assessment, Washington, DC, EPA/600/R-05/093F. Available online at http://cfpub.epa.gov/ncea/cfm/recordisplay.cfm?deid=158363 (accessed March 11,, 2010). Walser, M; Bodenlos, LJ. (1959) Urea metabolism in man. J Clin Invest 38:1617–1626. Wangenheim, J; Bolcsfoldi, G. (1988) Mouse lymphoma L5178Y thymidine kinase locus assay of 50 compounds. Mutagenesis 3(3):193–205. Wardle, EN. (1970) A study of the effects of possible toxic metabolites of uraemia on red cell metabolism. Acta Haematol 43(3):129–143. Wolpert, E; Phillips, SF; Summerskill, WH. (1971) Transport of urea and ammonia production in the human colon. Lancet 2(7739):1387–1390. Word, JD; Martin, LC; Williams, DL; et al. (1969) Urea toxicity studies in the bovine. J Anim Sci 29(5):786–791. Zarnke, RL; Taylor, WP, Jr. (1982) Urea poisoning in free-ranging Alaskan bison. J Am Vet Med Assoc 181(11):1417. Zhang, Z; Yang, X-Y; Cohen, DM. (1999) Urea-associated oxidative stress and GADD153/CHOP induction. Am J Physiol 276(5, Pt. 2):F786–F793. Zhang, Z; Yang, XY; Soltoff, SP; et al. (2000a) PI3K signaling in the murine kidney inner medullary cell response to urea. Am J Physiol Renal Physiol 278(1):F155–F164. Zhang, Z; Tian, W; Cohen, DM. (2000b) Urea protects from the proapoptotic effect of NaCl in renal medullary cells. Am J Physiol Renal Physiol 279(2):F345–F352. Zhang, Z; Dmitrieva, NI; Park, JH; et al. (2004) High urea and NaCl carbonylate proteins in renal cells in culture and in vivo, and high urea causes 8-oxoguanine lesions in their DNA. Proc Natl Acad Sci USA 101(25):9491–9496. Zhurkov, VS. (1975) Investigation of the mutagenic activity of drug preparations and food additives in a culture of human lymphocytes. Sov Genet 11:528–530.