
Toxicological Review of cis- and trans-1,2 ...€¦ · This document has been reviewed in...
174
EPA/635/R-09/006F www.epa.gov/iris TOXICOLOGICAL REVIEW OF cis-1,2-DICHLOROETHYLENE and trans-1,2-DICHLOROETHYLENE (CAS Nos. cis: 156-59-2; trans: 156-60-5; mixture: 540-59-0) In Support of Summary Information on the Integrated Risk Information System (IRIS) September 2010 U.S. Environmental Protection Agency Washington, DC
Transcript of Toxicological Review of cis- and trans-1,2 ...€¦ · This document has been reviewed in...

EPA/635/R-09/006F
www.epa.gov/iris
TOXICOLOGICAL REVIEW
OF
cis-1,2-DICHLOROETHYLENE
and trans-1,2-DICHLOROETHYLENE
(CAS Nos. cis: 156-59-2; trans: 156-60-5; mixture: 540-59-0)
In Support of Summary Information on the Integrated Risk Information System (IRIS)
September 2010
U.S. Environmental Protection Agency Washington, DC

ii
DISCLAIMER
This document has been reviewed in accordance with U.S. Environmental Protection Agency policy and approved for publication. Mention of trade names or commercial products does not constitute endorsement or recommendation for use.

iii
CONTENTS—TOXICOLOGICAL REVIEW OF cis-/trans-1,2-DICHLOROETHYLENE (CAS Nos. cis: 156-59-2; trans: 156-60-5; mixture: 540-59-0)
LIST OF TABLES ........................................................................................................................ vi LIST OF FIGURES ...................................................................................................................... vii LIST OF ABBREVIATIONS AND ACRONYMS .................................................................... viii FOREWORD .................................................................................................................................. x AUTHORS, CONTRIBUTORS, AND REVIEWERS ................................................................. xi 1. INTRODUCTION ..................................................................................................................... 1 2. CHEMICAL AND PHYSICAL INFORMATION ................................................................... 3 3. TOXICOKINETICS .................................................................................................................. 5
3.1. ABSORPTION .................................................................................................................. 5 3.1.1. Oral ............................................................................................................................ 5 3.1.2. Inhalation ................................................................................................................... 5 3.1.3. Dermal ....................................................................................................................... 6
3.2. DISTRIBUTION ............................................................................................................... 7 3.3. METABOLISM ................................................................................................................ 8
3.3.1. Metabolism in Animals ............................................................................................. 9 3.3.2. Metabolism in Human Preparations In Vitro .......................................................... 13 3.3.3. CYP2E1 Inactivation by 1,2-DCE .......................................................................... 13
3.4. ELIMINATION .............................................................................................................. 14 3.5. PHYSIOLOGICALLY BASED PHARMACOKINETIC MODELS ............................ 14
4. HAZARD IDENTIFICATION ............................................................................................... 18
4.1. STUDIES IN HUMANS ................................................................................................. 18 4.2. SHORT-TERM, SUBCHRONIC, AND CHRONIC STUDIES AND CANCER
BIOASSAYS IN ANIMALS—ORAL AND INHALATION ....................................... 18 4.2.1. Oral Exposure .......................................................................................................... 18
4.2.1.1. Short-term Studies ......................................................................................... 18 4.2.1.2. Subchronic Studies ........................................................................................ 20 4.2.1.3. Chronic Studies .............................................................................................. 31
4.2.2. Inhalation Exposure ................................................................................................. 31 4.2.2.1. Short-term Studies ......................................................................................... 31 4.2.2.2. Subchronic Studies ........................................................................................ 31 4.2.2.3. Chronic Studies .............................................................................................. 36
4.3. REPRODUCTIVE/DEVELOPMENTAL STUDIES—ORAL AND INHALATION ................................................................................................................ 36
4.3.1. Oral Exposure .......................................................................................................... 36 4.3.1.1. cis-1,2-DCE ................................................................................................... 36 4.3.1.2. trans-1,2-DCE ................................................................................................ 36 4.3.1.3. Mixtures of cis- and trans-1,2-DCE............................................................... 37
4.3.2. Inhalation Exposure ................................................................................................. 38
iv
4.3.2.1. cis-1,2-DCE ................................................................................................... 38 4.3.2.2. trans-1,2-DCE ................................................................................................ 38 4.3.2.3. Mixtures of cis- and trans-1,2-DCE............................................................... 39
4.4. OTHER DURATION- OR ENDPOINT-SPECIFIC STUDIES ..................................... 39 4.4.1. Acute Studies ........................................................................................................... 39
4.4.1.1. Oral Exposure ................................................................................................ 39 4.4.1.2. Inhalation Exposure ....................................................................................... 41
4.4.2. In Vivo Neurological Behavioral Studies ............................................................... 43 4.4.3. Immunological Studies ............................................................................................ 44
4.4.3.1. cis-1,2-DCE ................................................................................................... 44 4.4.3.2. trans-1,2-DCE ................................................................................................ 45 4.4.3.3. Mixtures of cis- and trans-1,2-DCE............................................................... 47
4.4.4. Toxicity Studies by Other Routes ........................................................................... 47 4.4.4.1. Intraperitoneal Injection................................................................................. 47 4.4.4.2. Dermal Application ....................................................................................... 49 4.4.4.3. Eye Irritation .................................................................................................. 49 4.4.4.4. Skin Irritation ................................................................................................. 50
4.5. MECHANISTIC DATA AND OTHER STUDIES IN SUPPORT OF THE MODE OF ACTION ....................................................................................................... 50
4.5.1. Hepatotoxicity Studies ............................................................................................ 50 4.5.2. Nephrotoxicity Studies ............................................................................................ 52 4.5.3. Studies with Cell Cultures ....................................................................................... 53 4.5.4. Genotoxicity ............................................................................................................ 54
4.5.4.1. In Vitro Studies .............................................................................................. 54 4.5.4.2. In Vivo Studies .............................................................................................. 58
4.5.5. Quantitative Structure-Activity Relationship (QSAR) Studies ............................... 59 4.6. SYNTHESIS OF MAJOR NONCANCER EFFECTS ................................................... 62
4.6.1. Oral .......................................................................................................................... 65 4.6.1.1. cis-1,2-DCE ................................................................................................... 65 4.6.1.2. trans-1,2-DCE ................................................................................................ 67 4.6.1.3. Mixtures of cis- and trans-1,2-DCE............................................................... 73
4.6.2. Inhalation ................................................................................................................. 73 4.6.2.1. cis-1,2-DCE ................................................................................................... 73 4.6.2.2. trans-1,2-DCE ................................................................................................ 74 4.6.2.3. Mixtures of cis- and trans-1,2-DCE............................................................... 77
4.6.3. Mode-of-Action Information ................................................................................... 77 4.7. EVALUATION OF CARCINOGENICITY ................................................................... 78
4.7.1. Summary of Overall Weight of Evidence ............................................................... 78 4.7.2. Synthesis of Human, Animal, and Other Supporting Evidence .............................. 79
4.8. SUSCEPTIBLE POPULATIONS AND LIFE STAGES ............................................... 80 4.8.1. Possible Childhood Susceptibility ........................................................................... 80 4.8.2. Possible Gender Differences ................................................................................... 80 4.8.3. Other—Genetic Polymorphisms ............................................................................. 80
4.8.3.1. CYP450 2E1 .................................................................................................. 81 4.8.3.2. Glutathione S-Transferase ............................................................................. 81
5. DOSE-RESPONSE ASSESSMENT ....................................................................................... 83
5.1. ORAL REFERENCE DOSE (RfD) ................................................................................ 83 5.1.1. cis-1,2-DCE ............................................................................................................. 83
v
5.1.1.1. Choice of Principal Study and Critical Effect—with Rationale and Justification ................................................................................................... 83
5.1.1.2. Methods of Analysis, Including Models ........................................................ 84 5.1.1.3. RfD Derivation—Including Application of Uncertainty Factors (UFs) ........ 87 5.1.1.4. Previous Oral Assessment ............................................................................. 88
5.1.2. trans-1,2-DCE .......................................................................................................... 88 5.1.2.1. Choice of Principal Studies and Critical Effects—with Rationale and
Justification ................................................................................................... 88 5.1.2.2. Methods of Analysis—Including Models ...................................................... 90 5.1.2.3. RfD Derivation—Including Application of Uncertainty Factors (UFs) ........ 94 5.1.2.4. Previous Oral Assessment ............................................................................. 95
5.2. INHALATION REFERENCE CONCENTRATION (RfC) ........................................... 96 5.2.1. cis-1,2-DCE ............................................................................................................. 96 5.2.2. trans-1,2-DCE .......................................................................................................... 96
5.3. UNCERTAINTIES IN THE ORAL REFERENCE DOSE ............................................ 98 5.4. CANCER ASSESSMENT ............................................................................................ 101
6. MAJOR CONCLUSIONS IN THE CHARACTERIZATION OF HAZARD AND
DOSE RESPONSE ............................................................................................................... 102 6.1. HUMAN HAZARD POTENTIAL ............................................................................... 102 6.2. DOSE RESPONSE ....................................................................................................... 104
6.2.1. Noncancer – Oral Exposure .................................................................................. 104 6.2.1.1. cis-1,2-DCE ................................................................................................. 104 6.2.1.2. trans-1,2-DCE .............................................................................................. 105
6.2.2. Noncancer – Inhalation Exposure ......................................................................... 106 6.2.2.1. cis-1,2-DCE ................................................................................................. 106 6.2.2.2. trans-1,2-DCE .............................................................................................. 106
6.2.3. Cancer .................................................................................................................... 107 7. REFERENCES ...................................................................................................................... 108 APPENDIX A: SUMMARY OF EXTERNAL PEER REVIEW, PUBLIC COMMENTS,
AND DISPOSITION ....................................................................................... A-1 APPENDIX B: BENCHMARK DOSE MODELING RESULTS AND OUTPUTS ............... B-1
B.1. RfD for cis-1,2-DCE .................................................................................................... B-1 B.1.1. Relative Liver Weight ........................................................................................... B-1 B.1.2. Relative Kidney Weight ....................................................................................... B-8
B.2. RfD for trans-1,2-DCE ............................................................................................... B-14 B.2.1. Decreased Antibody Directed Against sRBC (Shopp et al., 1985) .................... B-14 B.2.2. Absolute Thymus Weight (Barnes et al., 1985) ................................................. B-17 B.2.3. Relative Liver Weight (NTP, 2002a) .................................................................. B-20
vi
LIST OF TABLES 2-1. Properties of the 1,2-DCE isomers and their mixture ............................................................ 4 3-1. Tissue:air partition coefficients of the 1,2-DCE isomers in the rat (in vitro) ......................... 8 4-1. Body weights and selected organ weights of rats exposed to cis-1,2-DCE by gavage
for 90 days ............................................................................................................................ 22 4-2. Absolute kidney weights in rats treated with trans-1,2-DCE via drinking water for
90 days .................................................................................................................................. 24 4-3. Final body weights (g; mean ± SE) in rats exposed to trans-1,2-DCE in the feed for
14 weeks ............................................................................................................................... 26 4-4. RBC counts (106/µL, mean ± SE) in rats exposed to trans-1,2-DCE in the feed for
14 weeks ............................................................................................................................... 26 4-5. Relative liver weights (mean ± SE) in mice and rats exposed to trans-1,2-DCE in the
feed for 14 weeks .................................................................................................................. 27 4-6. Results of 90-day study in CD-1 mice exposed to trans-1,2-DCE in the drinking
water ..................................................................................................................................... 29 4-7. Histopathological changes in subchronic inhalation study of trans-1,2-DCE ...................... 32 4-8. Selected hematology findings in rats exposed to trans-1,2-DCE by inhalation for
90 days .................................................................................................................................. 34 4-9. Humoral immune response to sRBCs in CD-1 mice exposed to trans-1,2-DCE in
drinking water for 90 days (day 4) ....................................................................................... 46 4-10. Effect of 1,2-DCE isomers on urinary protein and glucose 24 hours after i.p. treatment
of male Swiss mice ............................................................................................................. 53 4-11. In vitro genotoxicity studies using cis- and trans-1,2-DCE ................................................ 56 4-12. In vivo genotoxicity studies using cis- and trans-1,2-DCE ................................................ 59 4-13. Summary of major noncancer subchronic studies for oral exposure to 1,2-DCE .............. 62 4-14. Summary of major noncancer subchronic studies for inhalation exposure to
1,2-DCE .............................................................................................................................. 64 5-1. Relative liver and relative kidney weights of rats exposed to cis-1,2-DCE by gavage
for 90 days ............................................................................................................................ 84

vii
5-2. Humoral immune response to sRBCs in CD-1 mice exposed to trans-1,2-DCE in drinking water for 90 days (day 4) ....................................................................................... 91
5-3. Absolute thymus weights in female mice exposed to trans-1,2-DCE in the drinking water
for 90 days ............................................................................................................................ 92 5-4. Relative liver weights in male and female mice and rats exposed to trans-1,2-DCE in
the feed for 14 weeks ............................................................................................................ 93 B-1. BMDS modeling summary of relative liver weights in female rats exposed to
cis-1,2-DCE by gavage for 90 days ................................................................................... B-1 B-2. BMDS modeling summary of relative liver weights in male rats exposed to
cis-1,2-DCE by gavage for 90 days ................................................................................... B-5 B-3. BMDS modeling summary of relative kidney weight in male rats exposed to
cis-1,2-DCE by gavage for 90 days ................................................................................... B-8 B-4. BMDS modeling summary of relative kidney weight in female rats exposed to
cis-1,2-DCE by gavage for 90 days ................................................................................. B-11 B-5. BMDS modeling summary of decreased antibody directed against sRBC in male
mice exposed to trans-1,2-DCE in drinking water for 90 days ........................................ B-14 B-6. BMDS modeling summary of decreased absolute thymus weight in female mice
exposed to trans-1,2-DCE in drinking water for 90 days ................................................ B-17 B-7. BMDS modeling summary of relative liver weight in male mice exposed to
trans-1,2-DCE in the feed for 14 weeks ........................................................................... B-20 B-8. BMDS modeling summary of relative liver weight in female mice exposed to
trans-1,2-DCE in the feed for 14 weeks ........................................................................... B-24 B-9. BMDS modeling summary of relative liver weight in female rats exposed to
trans-1,2-DCE in the feed for 14 weeks ........................................................................... B-25
LIST OF FIGURES 2-1. Chemical structures of cis- and trans-1,2-DCE ...................................................................... 3 3-1. Proposed metabolic scheme for cis- and trans-1,2-DCE ........................................................ 9 3-2. PBPK model for cis- and trans-1,2-DCE in rats ................................................................... 16
viii
LIST OF ABBREVIATIONS AND ACRONYMS AAP 4-aminoantipyrine ACGIH American Conference of Governmental Industrial Hygienists ADH alcohol dehydrogenase AFC antibody-forming cell AH aniline hydroxylation AIC Akaike’s Information Criterion ALP alkaline phosphatase ALT alanine aminotransferase AST aspartate aminotransferase BMD benchmark dose BMDL 95% lower confidence limit on the benchmark dose BMDS benchmark dose software BMR benchmark response BUN blood urea nitrogen CAS Chemical Abstracts Service CASRN Chemical Abstracts Service Registry Number CHL Chinese hamster lung CHO Chinese hamster ovary CI confidence interval CNS central nervous system Con A concanavalin A CYP450 cytochrome P450 DCA dichloroacetic acid DCE dichloroethylene DTH delayed-type hypersensitivity EC10 concentration causing 10% change in effect ED50 median effective dose EN-D ethylmorphine N-demethylation G-6-Pase glucose-6-phosphatase GC gas chromatography GD gestation day GSH reduced glutathione GST glutathione S-transferase GSTZ glutathione S-transferase zeta HID highest ineffective dose IC50 concentration to achieve 50% decrease in immobility or 50% inhibitory dose to
growth of cells ID50 50% inhibitory dose to growth of cells i.p. intraperitoneal or intraperitoneally IRIS Integrated Risk Information System KM Michaelis constant LC50 median lethal concentration LD50 median lethal dose LDH lactate dehydrogenase LED lowest effective dose LOAEL lowest-observed-adverse-effect level

ix
LPS lipopolysaccharide MS mass spectrometry MTD maximum tolerated dose NOAEL no-observed-adverse-effect level NLM National Library of Medicine NRC National Research Council NTP National Toxicology Program PBPK physiologically based pharmacokinetic POD point of departure PSP phenolsulfonephthalein QSAR quantitative structure-activity relationship RAM rate of metabolism RBC red blood cell RfC reference concentration RfD reference dose RVMT rate of change of inhibitable metabolism S9 supernatant fraction SAP serum alkaline phosphatase SD standard deviation SDH sorbitol dehydrogenase SE standard error SGOT glutamate oxaloacetate transaminase (now called AST) SGPT glutamate pyruvate transaminase (now called ALT) sRBC sheep red blood cell TBARS thiobarbituric acid-reactive substances TLV threshold limit value UF uncertainty factor U.S. EPA U.S. Environmental Protection Agency Vmax maximum substrate turnover velocity VOC volatile organic compound WBC white blood cell

x
FOREWORD
The purpose of this Toxicological Review is to provide scientific support and rationale for the hazard and dose response assessment in IRIS pertaining to chronic exposure to cis- and trans-1,2-dichloroethylene. It is not intended to be a comprehensive treatise on the chemical or toxicological nature of cis- and trans-1,2-dichloroethylene.
The intent of Section 6, Major Conclusions in the Characterization of Hazard and Dose Response, is to present the major conclusions reached in the derivation of the reference dose, reference concentration and cancer assessment, where applicable, and to characterize the overall confidence in the quantitative and qualitative aspects of hazard and dose response by addressing the quality of data and related uncertainties. The discussion is intended to convey the limitations of the assessment and to aid and guide the risk assessor in the ensuing steps of the risk assessment process.
For other general information about this assessment or other questions relating to IRIS, the reader is referred to EPA’s IRIS Hotline at (202) 566-1676 (phone), (202) 566-1749 (fax), or [email protected] (email address).

xi
AUTHORS, CONTRIBUTORS, AND REVIEWERS CHEMICAL MANAGER Audrey Galizia, Dr. PH Office of Research and Development U.S. Environmental Protection Agency Edison, NJ AUTHORS Audrey Galizia, Dr. PH Office of Research and Development U.S. Environmental Protection Agency Edison, NJ D. Charles Thompson, R.Ph., Ph.D., DABT Office of Research and Development U.S. Environmental Protection Agency Washington, DC CONTRIBUTORS Ted Berner, M.S. Office of Research and Development U.S. Environmental Protection Agency Washington, DC Christine Cai, M.S. Office of Research and Development U.S. Environmental Protection Agency Washington, DC Susan Rieth, MPH Office of Research and Development U.S. Environmental Protection Agency Washington, DC CONTRACTOR SUPPORT C. Clifford Conaway, Ph.D., DABT Consulting Toxicologist Mahopac, NY Janusz Z. Byczkowski, Ph.D., DABT Toxicology Consultant Fairborn, OH

xii
Susan Goldhaber, M.S. Toxicology Consultant Raleigh, NC George Holdsworth, Ph.D. Lutz W. Weber, Ph.D., DABT Oak Ridge Institute for Science and Education Oak Ridge, TN REVIEWERS
This document has been provided for review to EPA scientists, interagency reviewers from other federal agencies and White House offices, and the public, and peer reviewed by independent scientists external to EPA. A summary and EPA’s disposition of the comments received from the independent external peer reviewers and from the public is included in Appendix A. INTERNAL EPA REVIEWERS Andrew Rooney, Ph.D. Office of Research and Development U.S. Environmental Protection Agency Research Triangle Park, NC Channa Keshava, Ph.D. Office of Research and Development U.S. Environmental Protection Agency Research Triangle Park, NC Allan Marcus, Ph.D. Office of Research and Development U.S. Environmental Protection Agency Research Triangle Park, NC Karen Hogan, M.S. Office of Research and Development U.S. Environmental Protection Agency Washington, DC Lynn Flowers, Ph.D., DABT Office of Research and Development U.S. Environmental Protection Agency Washington, DC

xiii
EXTERNAL PEER REVIEWERS James V. Bruckner, Ph.D. University of Georgia Robert A. Howd, Ph.D. Office of Environmental Health Hazard Assessment (OEHHA) California Environmental Protection Agency Ralph L. Kodell, Ph.D. University of Arkansas for Medical Sciences Janice Longstreth, Ph.D., DABT The Institute for Global Risk Research, LLC Michael I. Luster, Ph.D. M. I. Luster and Associates, LLC
1
1. INTRODUCTION
This document presents background information and justification for the Integrated Risk Information System (IRIS) Summaries of the hazard and dose-response assessments of cis- and trans-1,2-dichloroethylene (cis- and trans-1,2-DCE). Toxicological assessment of mixtures of cis- and trans-1,2-DCE is beyond the scope of this document. IRIS Summaries may include oral reference dose (RfD) and inhalation reference concentration (RfC) values for chronic and other exposure durations, and a carcinogenicity assessment.
The RfD and RfC, if derived, provide quantitative information for use in risk assessments for health effects known or assumed to be produced through a nonlinear (presumed threshold) mode of action. The RfD (expressed in units of mg/kg-day) is defined as an estimate (with uncertainty spanning perhaps an order of magnitude) of a daily exposure to the human population (including sensitive subgroups) that is likely to be without an appreciable risk of deleterious effects during a lifetime. The inhalation RfC (expressed in units of mg/m3) is analogous to the oral RfD, but provides a continuous inhalation exposure estimate. The inhalation RfC considers toxic effects for both the respiratory system (portal-of-entry) and for effects peripheral to the respiratory system (extrarespiratory or systemic effects). Reference values are generally derived for chronic exposures (up to a lifetime), but may also be derived for acute (≤24 hours), short-term (>24 hours up to 30 days), and subchronic (>30 days up to 10% of lifetime) exposure durations, all of which are derived based on an assumption of continuous exposure throughout the duration specified. Unless specified otherwise, the RfD and RfC are derived for chronic exposure duration.
The carcinogenicity assessment provides information on the carcinogenic hazard potential of the substance in question and quantitative estimates of risk from oral and inhalation exposure may be derived. The information includes a weight-of-evidence judgment of the likelihood that the agent is a human carcinogen and the conditions under which the carcinogenic effects may be expressed. Quantitative risk estimates may be derived from the application of a low-dose extrapolation procedure. If derived, the oral slope factor is a plausible upper bound on the estimate of risk per mg/kg-day of oral exposure. Similarly, a plausible inhalation unit risk is an upper bound on the estimate of risk per µg/m3 air breathed.
Development of these hazard identification and dose-response assessments for cis- and trans-1,2-DCE has followed the general guidelines for risk assessment as set forth by the National Research Council (NRC, 1983). U.S. Environmental Protection Agency (U.S. EPA) Guidelines and Risk Assessment Forum Technical Panel Reports that may have been used in the development of this assessment include the following: Guidelines for the Health Risk Assessment of Chemical Mixtures (U.S. EPA, 1986a), Guidelines for Mutagenicity Risk Assessment (U.S. EPA, 1986b), Recommendations for and Documentation of Biological Values

2
for Use in Risk Assessment (U.S. EPA, 1988), Guidelines for Developmental Toxicity Risk Assessment (U.S. EPA, 1991), Interim Policy for Particle Size and Limit Concentration Issues in Inhalation Toxicity (U.S. EPA, 1994a), Methods for Derivation of Inhalation Reference Concentrations and Application of Inhalation Dosimetry (U.S. EPA, 1994b), Use of the Benchmark Dose Approach in Health Risk Assessment (U.S. EPA, 1995), Guidelines for Reproductive Toxicity Risk Assessment (U.S. EPA, 1996), Guidelines for Neurotoxicity Risk Assessment (U.S. EPA, 1998), Science Policy Council Handbook: Risk Characterization (U.S. EPA, 2000a), Benchmark Dose Technical Guidance Document (U.S. EPA, 2000b), Supplementary Guidance for Conducting Health Risk Assessment of Chemical Mixtures (U.S. EPA, 2000c), A Review of the Reference Dose and Reference Concentration Processes (U.S. EPA, 2002), Guidelines for Carcinogen Risk Assessment (U.S. EPA, 2005a), Supplemental Guidance for Assessing Susceptibility from Early-Life Exposure to Carcinogens (U.S. EPA, 2005b), Science Policy Council Handbook: Peer Review (U.S. EPA, 2006a), and A Framework for Assessing Health Risks of Environmental Exposures to Children (U.S. EPA, 2006b).
The literature search strategy employed for this compound was based on the Chemical Abstracts Service Registry Number (CASRN) and at least one common name. Any pertinent scientific information submitted by the public to the IRIS Submission Desk was also considered in the development of this document. The relevant literature was reviewed through January 2010. It should be noted that references have been added to the Toxicological Review after the external peer review in response to peer reviewers’ comments and for the sake of completeness. These references have not changed the overall qualitative and quantitative conclusions. See Section 7 for a list of references added after peer review.

3
2. CHEMICAL AND PHYSICAL INFORMATION
There are two isomers of 1,2-DCE, the cis- isomer and the trans- isomer. The cis- isomer is configured with the chlorine atoms on the same side of the C=C double bond, while in the trans- isomer, the chlorine atoms are on opposite sides, resulting in different physical, chemical, and biological properties (Figure 2-1). In general, 1,2-DCE has historically been used as a solvent for waxes, resins, and acetylcellulose, in the extraction of rubber, and as a coolant in refrigeration plants (NLM, 2006). Currently, only the trans- isomer is commercially available in the United States (ACGIH, 2001). Current uses for trans-1,2-DCE include its use as a degreasing agent and as one component of formulated products used for precision cleaning of electronic components. A small amount is used as a blowing agent for specialty foam.
Figure 2-1. Chemical structures of cis- and trans-1,2-DCE. Chemical and physical properties of cis-1,2-DCE, trans-1,2-DCE, and a mixture of both
isomers are listed in Table 2-1 (NLM, 2006; ATSDR, 1996). Exposure to cis- and trans-1,2-DCE may occur after the chemicals are released to the environment from industrial emissions, leached from landfills, or evaporated from wastewater streams. The estimated half-lives of cis- and trans-1,2-DCE in air are 12 and 5 days, respectively. Volatilization is the major fate process when the chemicals are released to surface water, with an estimated half-life of about 3–6 hours. In soil, cis- and trans-1,2-DCE may leach through the subsurface and contaminate groundwater. The chemicals may also be found in groundwater due to anaerobic degradation of more highly chlorinated chemicals, such as trichloroethylene and tetrachloroethylene (ATSDR, 1996). Although no degradation occurs in sterile microcosms, anaerobic biodegradation of the cis- isomer to chloroethane and vinyl chloride and biodegradation of the trans- isomer to vinyl chloride have been reported (Barrio-Lage et al., 1986, as cited in ATSDR, 1996). The cis- isomer is degraded more readily than the trans- isomer (Barrio-Lage et al., 1986, as cited in ATSDR, 1996). The rates of degradation of both isomers are dependent on the availability of an electron donor and the presence of active anaerobes.
C C
H H
ClCl
C C
H
H
Cl
Clcis trans

4
Table 2-1. Properties of the 1,2-DCE isomers and their mixture
Descriptor cis- Isomer trans- Isomer Mixture CAS name cis-1,2-Dichloroethylene trans-1,2-Dichloroethylene 1,2-Dichloroethylene CAS number 156-59-2 156-60-5 540-59-0 Primary synonyms cis-1,2-Dichloroethene,
1,2-cis-dichloroethylene, cis-acetylene dichloride, cis-1,2-DCE
trans-1,2-Dichloroethene, 1,2-trans-dichloroethylene, trans-acetylene dichloride, trans-1,2-DCE
1,2-Dichloroethene, acetylene dichloride, 1,2-DCE
Chemical formula C2H2Cl2 Molecular weight 96.95 Boiling point 60.1°C at 760 mm Hg 48.7°C at 760 mm Hg Approximately 55°C Melting point -80°C -49.8°C -50°C Specific gravity 1.2837 at 20°C/4°C 1.2565 at 20°C/4°C Approximately 1.28 Vapor pressure 2.00 × 102 mm Hg at 25°C 3.31 × 102 mm Hg at 25°C 2.01 × 102 mm Hg at 25°C Solubility Miscible with alcohol, ether,
acetone, benzene, and chloroform; solubility in water = 6.41 g/L at 25°C
Miscible with alcohol, ether, acetone, benzene, and chloroform; solubility in water = 4.52 g/L at 25°C
Miscible with alcohol, ether, acetone, benzene, and chloroform; solubility in water = 3.5 g/L at 25°C
Odor Ethereal, slightly acrid, sweet, pleasant Odor threshold (air) Not available 0.085 ppm Not available Partition coefficients: Log Kow Log Koc
1.86 1.69 (estimated)
2.06 1.56 (estimated)
2.00 Not available
Henry’s law constant 4.08 × 10⁻³ atm-m3/mol at 24.8°C
9.28 × 10⁻³ atm-m3/mol at 24.8°C
Approximately 4.08 × 10⁻³ atm-m3/mol at 24.8°C
Flash point 2–4°C 2°C 2°C Conversion factor 1 mg/m3 = 0.252 ppm; 1 ppm = 3.97 mg/m3 Sources: NLM (2006); ATSDR (1996).
Both cis- and trans-1,2-DCE are highly flammable; the vapors may explode when heated
or exposed to an open flame. Combustion byproducts of 1,2-DCE include hydrogen chloride and phosgene (NLM, 2006).

5
3. TOXICOKINETICS
3.1. ABSORPTION 3.1.1. Oral
No studies were identified that examined oral absorption of either cis- or trans-1,2-DCE. 3.1.2. Inhalation
The absorption of inhaled isomers of 1,2-DCE has been examined in a number of animal studies designed to determine parameters applicable to physiologically based pharmacokinetic (PBPK) modeling.
Filser and Bolt (1979) studied the uptake of cis- and trans-1,2-DCE in male Wistar rats (250 g). The animals were exposed to various initial concentrations of the substances in a closed chamber, and the decline of the substance with time was monitored by gas-liquid chromatography. The authors did not report initial airborne concentrations, but, judging from time zero in their graphs (Filser and Bolt, 1979), they ranged from about 20 to 1,000 ppm. Plots by the authors of chamber concentration vs. time displayed two or three phases, depending on the initial concentration. A first phase of rapid decline of gas concentration in the chamber represented the initial uptake of gas and its equilibration with the chamber atmosphere that lasted about 2 hours for cis-1,2-DCE and 1.5 hours for trans-1,2-DCE. The second phase was typical of a first-order metabolic disappearance of the substance when initial gas concentrations were sufficiently low but took on the characteristics of zero-order elimination with high gas concentrations, saturating the metabolic capacity of the animals in the chamber. A third phase was seen in cases with high initial gas concentration, where, with time, the concentration in the chamber fell low enough to no longer saturate the metabolic enzymes, displaying first-order disappearance characteristics from there on.
Filser and Bolt (1979) analyzed the disappearance curves mathematically and established saturation points for both cis- and trans-1,2-DCE (i.e., gas concentrations at which the metabolic capacities of the experimental animals became saturated and gas disappearance from the chamber changed from first to zero order). These values were given as 20 ppm for cis-1,2-DCE and 15 ppm for trans-1,2-DCE. The shorter equilibration time and lower saturation point concentration for trans-1,2-DCE were interpreted by the authors to indicate slower metabolic removal of trans-1,2-DCE, as compared with cis-1,2-DCE.
In vitro gas/blood distribution data indicate that trans-1,2-DCE is less soluble in blood than cis-1,2-DCE, which would suggest that inhalation uptake of trans-1,2-DCE is less than that of cis-1,2-DCE. Eger et al. (2001) conducted experiments with male Sprague-Dawley rats and found that the alveolar concentration of trans-1,2-DCE required to induce anesthesia in 50% of the animals was about twice as high as that of cis-1,2-DCE. Gargas et al. (1989, 1988) published
6
blood:air partition coefficients of 21.6 and 9.58 in rats and 9.85 and 6.04 in humans for cis- and trans-1,2-DCE, respectively. Sato and Nakajima (1987) also reported values of 9.2 and 5.8 for cis- and trans-1,2-DCE, respectively, but the species in which these values were obtained was not specified. A comparison of values given by Gargas et al. (1989) for humans, rats, and, to a lesser extent, mice indicated that, for most of the chlorinated aliphatics examined, human blood had only about one-half the affinity of that measured in rat and mouse blood. Equilibrium constants for inhalation uptake over exhalation elimination calculated by Filser and Bolt (1979) showed the same approximate 2:1 ratio (i.e., 20 and 11.5 for cis- and trans-1,2-DCE, respectively). Therefore, several studies support the conclusion that cis- and trans-DCE are absorbed relatively quickly by the lungs in a ratio of 2:1.
Andersen et al. (1980) used male F344 rats (180–280 g) to conduct inhalation experiments with trans-1,2-DCE, using a closed chamber system with gas recirculation. The results were similar to those obtained by Filser and Bolt (1979) in that the uptake of trans-1,2-DCE leveled off after about 2 hours, with about 40–60% of the gas remaining in the chamber at exposure concentrations of 10,000, 1,000, and 30 ppm. Using a model developed earlier (Ramsey and Andersen, 1984), Gargas et al. (1988) calculated the maximum substrate turnover velocity (Vmax) values for pulmonary uptake of both cis- and trans-1,2-DCE of 30.9 µmol/kg-hour (3 mg/kg-hour) for rats (this value is likely true only for trans-1,2-DCE, as estimated by Andersen et al. [1980]). Both Andersen et al. (1980) and Filser and Bolt (1979) noted that results obtained in a given rat strain could not be extrapolated to another strain. In addition, Gargas et al. (1990) pointed out that the uptake of gaseous cis- or trans-1,2-DCE could be approximated only by using a model that corrected for suicide inhibition of the cytochrome P450 (CYP450) enzymes that metabolize these agents.
In an experiment using isolated perfused liver from female Wistar rats and exposing the perfusate to cis- or trans-1,2-DCE in the gas phase, Bonse et al. (1975) found that, at a given concentration in the gas phase, trans-1,2-DCE attained less than one-half the concentration of cis-1,2-DCE in liver, which was attributed by the study authors, in part, to inhibition of CYP450 by the trans- isomer.
3.1.3. Dermal
No studies were located that investigated the dermal uptake of cis- or trans-1,2-DCE either as a liquid or from the vapor phase. Pleil and Lindstrom (1997) conducted experiments with volunteers who were exposed to cis-1,2-DCE via showering with contaminated water (informed consent from the volunteers and institutional approval were obtained). Appearance of the substance in exhaled air, collected as single breaths of 1 L volume, was monitored by gas chromatography (GC)/mass spectrometry (MS). Samples of microenvironmental air from the exposure area and control samples of inspired air after the exposure were also collected and analyzed using the same equipment. In two separate experiments, two volunteers were exposed

7
under a shower for 10 minutes each to an environment with 125 and 83.9 µg/m3 cis-1,2-DCE in the air and 28.4 and 20.4 µg/L in the water, respectively. Samples of exhaled air and blood were collected for 30 minutes after exposure. Samples of air from the exposure area and control samples of inspired air after the exposure were also collected and analyzed. The authors calculated total exposure doses of 1.19 and 2.34 µg, while the corresponding maximum blood concentrations were 0.25 and 0.18 µg/L. The authors considered these values as indicative of efficient absorption of cis-1,2-DCE with mixed inhalation and dermal exposure.
The interim report, Dermal Exposure Assessment (U.S. EPA, 1992), provides a dermal permeability coefficient, Kp, of 1.0 × 10⁻² cm/hour for human skin. This value references uptake from aqueous solution, but there is uncertainty regarding whether it refers to cis-1,2-DCE, trans-1,2-DCE, or mixed isomers. By using a formula for dermal absorption of liquids proposed by Potts and Guy (1992):
log Kp = -2.7 + 0.71 × log Kow – (0.0061 × molecular weight) Kp values of 1.07 × 10⁻² and 1.55 × 10⁻² cm/hour are obtained for cis- and trans-1,2-DCE, respectively. Such values indicate efficient dermal absorption, comparable to that of lipophilic aromatics, such as cresols, chlorophenols, or hexanol (U.S. EPA, 1992). These values also suggest that the higher lipophilicity of trans-1,2-DCE may increase its dermal absorption.
3.2. DISTRIBUTION
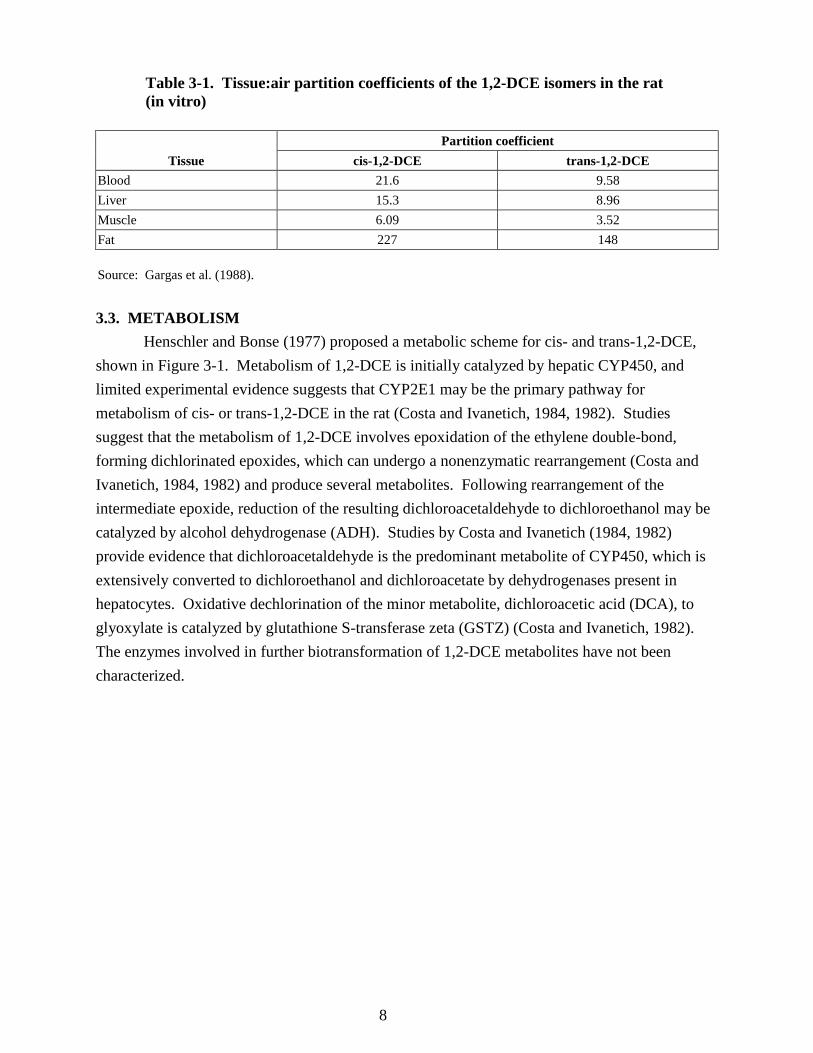
No in vivo studies pertaining to organ and/or tissue distribution of cis- or trans-1,2-DCE have been reported in the literature. However, Bonse et al. (1975) reported that in an experiment using isolated perfused liver from female Wistar rats, at equimolar concentrations in the perfusate (with chlorinated ethylenes added as vapors at constant rates that allowed for steady-state conditions of substrate uptake and conversion), uptake for cis-1,2-DCE was about 3 times faster than for trans-1,2-DCE. Gargas et al. (1988) reported tissue:air partition coefficients (at 37°C) for rat (species not specified) tissues in vitro (see Table 3-1). These data provide further support, albeit indirectly, that the trans- isomer is likely to be taken up less efficiently by mammalian tissues than the cis- isomer. Furthermore, if the previously discussed relationship between rat and human blood:air partition coefficients is assumed to be predictive, then the extent of uptake of the two isomers into human tissues would be roughly half that of the corresponding rat tissues (Table 3-1).
8
Table 3-1. Tissue:air partition coefficients of the 1,2-DCE isomers in the rat (in vitro)
Tissue Partition coefficient
cis-1,2-DCE trans-1,2-DCE Blood 21.6 9.58 Liver 15.3 8.96 Muscle 6.09 3.52 Fat 227 148 Source: Gargas et al. (1988). 3.3. METABOLISM
Henschler and Bonse (1977) proposed a metabolic scheme for cis- and trans-1,2-DCE, shown in Figure 3-1. Metabolism of 1,2-DCE is initially catalyzed by hepatic CYP450, and limited experimental evidence suggests that CYP2E1 may be the primary pathway for metabolism of cis- or trans-1,2-DCE in the rat (Costa and Ivanetich, 1984, 1982). Studies suggest that the metabolism of 1,2-DCE involves epoxidation of the ethylene double-bond, forming dichlorinated epoxides, which can undergo a nonenzymatic rearrangement (Costa and Ivanetich, 1984, 1982) and produce several metabolites. Following rearrangement of the intermediate epoxide, reduction of the resulting dichloroacetaldehyde to dichloroethanol may be catalyzed by alcohol dehydrogenase (ADH). Studies by Costa and Ivanetich (1984, 1982) provide evidence that dichloroacetaldehyde is the predominant metabolite of CYP450, which is extensively converted to dichloroethanol and dichloroacetate by dehydrogenases present in hepatocytes. Oxidative dechlorination of the minor metabolite, dichloroacetic acid (DCA), to glyoxylate is catalyzed by glutathione S-transferase zeta (GSTZ) (Costa and Ivanetich, 1982). The enzymes involved in further biotransformation of 1,2-DCE metabolites have not been characterized.

9
Sources: Adapted from U.S. EPA (2003); Henschler and Bonse (1977). Figure 3-1. Proposed metabolic scheme for cis- and trans-1,2-DCE.
3.3.1. Metabolism in Animals Bonse et al. (1975) studied the metabolism of several chlorinated C2-compounds,
including cis- and trans-1,2-DCE, in isolated perfused livers from female Wistar rats (170–230 g). The perfusate was supplemented with various concentrations of the compounds in the gas phase. Concentrations of 1,2-DCE and metabolites in liver tissue and perfusate were

10
monitored with GC. Bonse et al. (1975) expected to find epoxide isomers (oxiranes) as the primary metabolites of 1,2-DCE. Both cis- and trans-epoxides are unstable, however, and were shown to rearrange spontaneously to form dichloroacetaldehyde, which was then readily converted to DCA and 2,2-dichloroethanol. Levels of enzymes from liver cells in the perfusate (i.e., lactate dehydrogenase [LDH], aspartate aminotransferase [AST] (glutamate oxaloacetate transaminase [SGOT], or alanine aminotransferase [ALT] (glutamate pyruvate transaminase [SGPT]) increased with time. The authors interpreted these findings to be indicative of liver damage. Higher activity levels of these enzymes were detected in the cis-1,2-DCE perfusate compared with corresponding activities in the trans-1,2-DCE perfusate.
For cis-1,2-DCE, Bonse et al. (1975) identified 2,2-dichloroethanol as the major metabolite and DCA as a minor metabolite; for trans-1,2-DCE, only small amounts of these two metabolites could be identified. Uptake of cis-1,2-DCE in liver tissue was demonstrated to be at least 2 times faster than the uptake of trans-1,2-DCE, which may partially account for the lower concentrations of metabolites of trans-1,2-DCE in liver tissue. The authors also observed that the amount of metabolites in liver tissue did not correlate with tissue uptake for these two substances, thus confirming differing rates of metabolism (RAMs) as well.
Leibman and Ortiz (1977) studied the metabolism of the 1,2-DCE isomers in rat liver homogenate supernatants (9,000 × g supernatant fraction [S9]) and suggested metabolic schemes for the chlorinated ethylenes. For 1,2-DCE (isomer not specified), they proposed the same sequence of events that Bonse et al. (1975) and Henschler and Bonse (1977) had proposed, although Leibman and Ortiz (1977) were not able to experimentally identify DCA as a metabolite of 1,2-DCE. They were, however, able to mechanistically describe the chemical rearrangement via an epoxide intermediate that explains the formation of asymmetrically substituted DCA from both symmetrically substituted 1,2-DCE isomers.
Costa and Ivanetich (1982) investigated the metabolism of the chlorinated ethylenes ex vivo, using the S9 fraction from the livers of male Long-Evans rats. Some of the rats were pretreated with enzyme inducers, such as β-naphthoflavone or phenobarbital, prior to sacrifice and microsome preparation. The 1,2-DCE isomers were added as ethanolic solutions to the microsomal preparations. Metabolite identification was performed by gas/liquid chromato-graphy. Following treatment with both cis- and trans-1,2-DCE, measurable amounts of 2,2-dichloroethanol and dichloroacetaldehyde were detected, with trans-1,2-DCE yielding about 25% the amount of 2,2-dichloroethanol that cis-1,2-DCE yielded. DCA was also formed from both substances, although the amount was about 6 times less from trans-1,2-DCE than from cis-1,2-DCE. The authors could not identify any of the dechlorination metabolites of cis- or trans-1,2-DCE shown in the metabolic scheme in Figure 3-1, possibly because the S9 mix used did not contain considerable glutathione S-transferase (GST) activity. Overall, the authors estimated the in vitro CYP450-mediated metabolism of cis-1,2-DCE to be 4 times that of trans-1,2-DCE. Suicide inhibition of the CYP450 activity via covalent binding of a reactive intermediate to the
11
heme moiety was also observed; this propensity to bind heme was independent of the enzymatic degradation of any DCE substrate. However, it was noted that substances with epoxides that rearranged to an aldehyde (e.g., cis- or trans-1,2-DCE) bound to heme, while those that formed acylchlorides (e.g., 1,1-DCE) did not bind to heme.
Costa and Ivanetich (1982) also found that metabolite binding to hepatic microsomes induced a spectral shift indicative of binding to the active center of CYP450. Hanes plots of substance concentration vs. spectral shift revealed two binding constants, suggesting that more than one CYP450 isoform in the microsomes was involved. Pretreatment of the animals with phenobarbital increased the affinity of the substrate for the low affinity binding site, but did not affect that of the high affinity binding site. Biphasic Hanes plots were observed with cis-1,2-DCE when either phenobarbital-noninduced or -induced liver microsomes were used; with trans-1,2-DCE, the plots were monophasic unless phenobarbital-induced microsomes were used. Treatment with the nonspecific inhibitors, carbon monoxide and SKF-525A, suppressed the formation of dichloroacetaldehyde or 2,2-dichloroethanol from both cis- and trans-1,2-DCE. However, while metyrapone, a specific CYP3A4 inhibitor, was minimally effective in inhibiting metabolism of cis-1,2-DCE, it was most effective in suppressing trans-1,2-DCE metabolism. Accordingly, pretreatment with phenobarbital, which induces CYP3A4, among others, increased the metabolism of trans-1,2-DCE more than cis-1,2-DCE. Therefore, CYP3A4 may play a role in the metabolism of 1,2-DCE, but the exact nature and extent of this role need to be further characterized. These researchers also conducted experiments that suggested that the formation of 2,2-dichloroethanol from dichloroacetaldehyde was catalyzed by an NADPH-dependent ADH that contaminated their microsomal preparations. Filser and Bolt (1980) also reported that disulfiram, an ADH inhibitor, caused changes in the response of rats to inhaled trans-1,2-DCE that were suggestive of ADH involvement in its metabolism.
In a subsequent publication, Costa and Ivanetich (1984) used hepatocytes from male Long-Evans rat livers to study the metabolism of cis- and trans-1,2-DCE. After incubation, cells were destroyed with sulfuric acid and sodium tungstate and the supernatants were extracted for gas/liquid chromatography. Isolated rat hepatocytes metabolized cis-1,2-DCE primarily to 2,2-dichloroethanol (2.4 nmol/106 cells/10 minutes) with the formation of smaller amounts of DCA (0.3 nmol/106 cells/10 minutes) and dichloroacetaldehyde (0.04 nmol/106 cells/10 minutes). No other chlorinated metabolites were produced from cis-1,2-DCE in measurable amounts. The metabolism of trans-1,2-DCE in isolated rat hepatocytes gave rise to DCA (0.05 nmol/106 cells/10 minutes), traces of dichloroacetaldehyde (0.008 nmol/106 cells/10 minutes), and 2,2-dichloroethanol (0.01 nmol/106 cells/10 minutes). This study by Costa and Ivanetich (1984) showed that the total amount of trans-1,2-DCE metabolized was 8–25 times less than that of cis-1,2-DCE, yielding only small amounts of DCA and trace amounts of 2,2-dichloroethanol and dichloroacetaldehyde.

12
Costa and Ivanetich (1984) estimated Michaelis constant (KM) values of 0.67 mM for the formation of DCA from cis-1,2-DCE (the metabolic yield with trans-1,2-DCE was too small for rate estimation), 2.15 mM for the formation of dichloroacetaldehyde, and 2.55 mM for the formation of 2,2-dichloroethanol when phenobarbital-induced hepatocytes were used. These researchers also incubated the known metabolites of cis- and trans-1,2-DCE with cultured hepatocytes. They observed that DCA and dichloroacetaldehyde were largely (~90%) metabolized within 60 minutes in phenobarbital-induced hepatocyte culture. Degradation of dichloroacetaldehyde yielded primarily DCA, with the formation of a small amount of 2,2-dichloroethanol.
The question of further metabolism of 2,2-dichloroethanol or DCA has not been investigated in the context of cis- and/or trans-1,2-DCE metabolism. Barton et al. (1995), in an attempt to model the toxicokinetics of chloroethylene mixtures, found that exposing male Sprague-Dawley rats to 40 ppm trans-1,2-DCE for 4.5 hours did not affect nonprotein sulfhydryl content (essentially reduced glutathione [GSH]) in the livers. This could be seen as an indication that metabolites of trans-1,2-DCE do not undergo GSH conjugation to any major extent. Similarly, Dowsley et al. (1999) were not able to detect any GSH conjugates of 1,1-DCE in experiments with microsomal preparations from female CD-1 mice, although 1,1-DCE forms the same metabolite, dichloroacetaldehyde, as the 1,2-DCE isomers. According to a metabolic scheme provided in that paper, formation of acetyl chloride or its derivative would be a prerequisite for GSH conjugation. McMillan (1986) found slight yet statistically significant reductions in hepatic GSH concentrations following high single doses of cis- or trans-1,2-DCE (10% reduction following 4.4 g/kg trans-1,2-DCE orally, 22% reduction following 1.9 g/kg trans-1,2-DCE intraperitoneally [i.p.], and 17% reduction following 2 g/kg cis-1,2-DCE i.p.).
DCA is metabolized via oxidative dechlorination, a cytosolic process that does not involve CYP450 but instead involves GSH, NADPH, and GSTZ (U.S. EPA, 2003). The resulting metabolite is glyoxylate, which can undergo further oxidation to oxalate, reduction to glycolic acid, and transamination to glycine with subsequent formyl group transfer to form serine. This pathway is also presented in Figure 3-1. DCA stimulates peripheral glucose utilization and has therefore been proposed as an agent for treatment of several metabolic disorders, including diabetes and myocardial ischemia (Stacpoole, 1989). Oxalate can form insoluble crystals of calcium oxalate that can cause kidney damage. The ultimate products of glyoxylate biotransformation, glycine and serine, are utilized in protein synthesis.
Nakajima (1997) presented some evidence that both cis- and trans-1,2-DCE are metabolized by CYP2E1. By using microsomal preparations from untreated, fasted, or ethanol-pretreated rats, they found a twofold increase in the RAM of cis-1,2-DCE in microsomes from fasting rats and a threefold increase in its metabolism in microsomes from ethanol-treated rats. Fasting and dietary ethanol are widely known to induce the activity of CYP2E1 (Cederbaum, 2006; Wan et al., 2006). A comparatively low RAM of trans-1,2-DCE by microsomes from

13
ethanol-treated rats was reported, which was not measurable using microsomes from untreated or fasted rats. The results obtained with ethanol-induced liver microsomes provide inferential evidence that CYP2E1 is involved in the metabolism of 1,2-DCE.
In summary, the metabolism of 1,2-DCE is initially catalyzed by hepatic CYP450. The available evidence suggests that CYP2E1 may be the primary pathway for metabolism of cis- or trans-1,2-DCE in the rat (Nakajima, 1997; Costa and Ivenetich, 1984, 1982). The metabolism of cis- or trans-1,2-DCE is thought to involve spontaneous formation of epoxides, which can rearrange to produce several metabolites (Costa and Ivenetich, 1984, 1982). These epoxides are unstable and have been shown by Bonse et al. (1975) to rearrange spontaneously to form dichloroacetaldehyde, which is then readily converted to DCA and 2,2-dichloroethanol. For cis-1,2-DCE, Bonse et al. (1975) identified 2,2-dichloroethanol as the major metabolite and DCA as a minor metabolite; for trans-1,2-DCE, only small amounts of these two metabolites could be identified. There is also some evidence that both cis- and trans-1,2-DCE are metabolized by CYP2E1 (Cederbaum, 2006; Wan et al., 2006; Nakajima, 1997).
The further metabolism of 2,2-dichloroethanol or DCA has not been investigated in the context of cis- and/or trans-1,2-DCE metabolism. However, a study by Barton et al. (1995) indicates that metabolites of trans-1,2-DCE do not undergo GSH conjugation to any major extent.
3.3.2. Metabolism in Human Preparations In Vitro
Doherty et al. (1996) investigated the potential clastogenic activity of several chlorinated hydrocarbons, among them 1,2-DCE (likely a mixture of both isomers), using several human cell lines with variable CYP450 enzyme expression profiles. Their findings suggest that a direct-acting genotoxic effect without the need for metabolic activation is possible and the production of a metabolite that was less genotoxic than the parent compounds is also possible. 3.3.3. CYP2E1 Inactivation by 1,2-DCE
Both cis- and trans-1,2-DCE are metabolized by microsomal oxidation (Filser and Bolt, 1979). In vitro studies indicate that cis- and trans-1,2-DCE cause a loss of hepatic microsomal CYP450 and heme, thus suggesting CYP450 inactivation by reaction products (Costa and Ivanetich, 1982). Lilly et al. (1998) reported that cis- and trans-1,2-DCE inactivated CYP2E1 in rats. As inhibitors of CYP2E1, an isoform of P450 that plays a role in the bioactivation of a number of volatile organic compounds (VOCs) and other chemicals (Seaton et al., 1994; Brady et al., 1991; Guengerich et al., 1991; Nakajima et al., 1997, 1990), sufficiently high exposures to 1,2-DCE are expected to inhibit the CYP-mediated activation of a wide variety of VOCs. For example, Barton et al. (1995) discovered that preexposure of rats to 40 ppm trans-1,2-DCE for 1.5 hours resulted in marked inhibition of trichloroethylene and vinyl chloride metabolism by competitive inhibition.

14
3.4. ELIMINATION
Information on the elimination of cis- or trans-1,2-DCE or its metabolites is limited. However, Pleil and Lindstrom (1997) have estimated elimination rate constants for the disappearance from human blood of certain halogenated VOCs, including cis-1,2-DCE. Estimates were based on decay of exhaled breath concentrations following a 10-minute shower exposure to contaminated water and published blood/air partition coefficients for the VOC in question. Two volunteers were exposed in separate showering episodes, in which estimated total absorbed doses of cis-1,2-DCE were 1.19 and 2.34 µg, respectively. The kinetics of elimination of the parent compound from breath suggested the existence of two biological distribution compartments, which were presumed to represent the blood and “highly perfused tissues” (e.g., liver). In the first fast-elimination compartment (presumed to represent disappearance of cis-1,2-DCE from the blood), elimination half-lives of 0.82 and 2.37 minutes were estimated in the two subjects; corresponding half-lives in the slower, highly perfused tissue compartment were 8.96 and 29.33 minutes, respectively. These limited data suggest the potential for variability in the elimination of cis-1,2-DCE in humans.
Considering the metabolic fates of the various possible metabolites of 1,2-DCE, it may be assumed that whatever portion of dichloroethanol is not transformed to DCA will be ultimately exhaled. For dichloroacetaldehyde and DCA, the IRIS Toxicological Review for Dichloroacetic Acid (U.S. EPA, 2003) provides some useful information. Accordingly, glyoxylate formed via GSTZ is ultimately broken down to carbon dioxide or oxidized to oxalate, which is excreted in the urine. Dechlorination products, such as monochloroacetic acid, also are said to exist, but, for the case of cis- or trans-1,2-DCE, this is at odds with the findings of the Costa and Ivanetich (1984, 1982) study, which did not detect dechlorination products of 1,2-DCE in vitro with rat microsomes or hepatocytes. A possible explanation is that, given the comparatively poor uptake and slow metabolism of cis- and trans-1,2-DCE, tissue levels of DCA never become high enough to allow for any measurable dechlorination reaction to occur.
3.5. PHYSIOLOGICALLY BASED PHARMACOKINETIC MODELS
A toxicokinetic description of distribution and elimination of inhaled cis- and trans-1,2-DCE in rats was reported by Filser and Bolt (1979), who analyzed experimental data by using a simplified compartmental model. However, their interpretation of the metabolic clearance of 1,2-DCE failed to address the inactivation of CYP2E1 that had been observed both in vivo and in vitro by Freundt and Macholz (1978) and later quantified in hepatic microsomal preparation in vitro by Costa and Ivanetich (1982). This metabolic inactivation phenomenon also complicated the fitting of experimental data, which had been obtained with different concentrations of cis- and trans-1,2-DCE vapors in a closed gas chamber, to a typical PBPK model for VOCs, using only the metabolic constants, Vmax and KM.

15
Gargas et al. (1990) updated the PBPK model for rats with an algorithm that described CYP2E1 suicide inhibition-resynthesis. In this algorithm (Clewell and Andersen, 1987), the rate of enzyme inactivation was proportional to a second-order rate constant (kd), multiplied by the square of the initial RAM, thereby representing the reaction of free metabolite(s) with the enzyme-substrate complex. The algorithm also included a term for the zero-order rate of enzyme resynthesis (ks) during exposure. Subsequently, the PBPK model for cis- and trans-1,2-DCE in rats was extended by Lilly et al. (1998) to quantitatively describe the mechanisms of both suicidal inhibition of CYP2E1 by metabolic intermediate(s) and CYP2E1 resynthesis. This algorithm (“Model 1” in Lilly et al., 1998) required four parameters, or kinetic constants: VmaxC (maximum RAM), KM (pseudo-Michaelis constant), kd (inhibition constant), and Kde (enzyme degradation constant). The model-estimated kinetic constants VmaxC and KM were 4.53 mg/hour/kg and 0.19 mg/L for cis-1,2-DCE and 4.27 mg/hour/kg and 0.08 mg/L for trans-1,2-DCE, respectively, with cis-1,2-DCE metabolite(s) being less potent inhibitor(s) of CYP2E1 (kd = 2.07 [mg/hour] × [hour]-1) than the metabolite(s) of trans-1,2-DCE (kd = 496 [mg/hour] × [hour]-1) under a similar enzyme degradation constant (Kde about 0.025 [hour]-1) (Lilly et al., 1998).
The PBPK model structure (Figure 3-2) consists of five dynamic tissue compartments representing the lungs, fat, rapidly perfused tissues, slowly perfused tissues, and liver. All perfusion-limited tissue compartments are linked through blood flow, following an anatomically accurate, typical, physiologically based description (Lilly et al., 1998).

16
Source: Lilly et al. (1998) (reproduced with permission of Springer Verlag, Heidelberg/New York). Figure 3-2. PBPK model for cis- and trans-1,2-DCE in rats.
Briefly, because cis- and trans-1,2-DCE are retained by the tissue(s) in each compartment
according to their tissue/blood partition coefficients (measured in vitro by Gargas et al., 1988), the concentrations of both chemicals in venous blood (leaving the tissue) are lower than those in arterial blood during the equilibration phase. Therefore, the rate of change in the amount of either chemical in each tissue compartment (i) is given by the difference between concentration in blood entering (Ca) and exiting (Cvi) the tissue, multiplied by the blood flow (Qi). The differential equations for each tissue compartment (except lungs) are integrated over time, giving the amounts of cis- or trans-1,2-DCE present in the tissue. Because the partition coefficient (Pi) and the actual volume of each tissue are known from the literature (Ramsey and Andersen, 1984), concentrations of cis- or trans-1,2-DCE in each tissue can be calculated over time.
For the lung compartment with two mass inputs (mixed venous blood and inhaled air) and two outputs (arterial blood and exhaled air), at steady state, the amount of either chemical in alveolar air is in equilibrium with the amount in lung blood, and, thus, concentrations of cis- or trans-1,2-DCE in arterial blood can be calculated from the simple mass balance equations, taking into account the alveolar ventilation rate and the rate of blood flow through the lung (equal to cardiac output), both known from the literature (Ramsey and Andersen, 1984). For the liver

17
compartment, with mass input from blood and two outputs (venous blood and metabolism; biliary excretion was not considered), the chemical mass transfer is given by the difference between concentrations in portal (Ca) and venous (Cvl) blood multiplied by hepatic blood flow (Ql) and corrected for metabolic clearance of cis- or trans-1,2-DCE.
The RAMs (see Figure 3-2) of cis- and trans-1,2-DCE are calculated from the Michaelis-Menten equation (using “metabolic capacity remaining” instead of initial velocity Vmax0) and subtracted from the rate of change in chemical mass in the liver. Rates of change of inhibitable metabolism (RVMT) (see Figure 3-2), under the assumption that a reactive metabolite reacts with enzyme-substrate complex (“Model 1” in Lilly et al., 1998), can be calculated also from the Michaelis-Menten equation with a negative inhibition term (rate constant –kd multiplied by RAM), whereas rates of change of metabolism due to enzyme resynthesis can be calculated by a zero-order term, multiplying Vmax by Kde (Bae et al., 2005; Lilly et al., 1998).
A simplified scheme of the mass flow in the PBPK model for cis- and trans-1,2-DCE is shown in Figure 3-2, according to Lilly et al. (1998). This model was calibrated with data obtained in closed-chamber gas uptake studies with rats, as reported by Gargas et al. (1990). From four different algorithms tested by Lilly et al. (1998), “Model 1,” which assumes that reactive metabolite(s) of cis- and trans-1,2-DCE inactivate the CYP2E1 enzyme-substrate complex, gave the best approximation of experimentally obtained data (Bae et al., 2005). One could extrapolate the model to humans by allometrically scaling Vmax in the absence of exposure and the resynthesis rate for CYP2E1, while assuming that the molecular rate of suicide inhibition is the same for human and rat CYP2E1. However, in the absence of human data with which to validate or calibrate this model, such an extrapolation would involve considerable uncertainty, much greater than cases without suicide inhibition. (The data on human exhalation subsequent to exposure in a shower is likely most sensitive to the parameters describing respiration, cardiac output, and the blood:air partition coefficient, and these data are expected to provide little information on metabolic rates.) Therefore, such extrapolation of the model is not attempted in this assessment.
Since this PBPK model was not calibrated with human data, it cannot be scaled allometrically to humans, whose liver CYP2E1 activity, resynthesis rate, and sensitivity to inhibition differ from those in rats. Given the current state of knowledge, this PBPK model is not useful for estimating the human equivalent dose from the available animal data for cis- or trans-1,2-DCE. No other valid PBPK models of cis- or trans-1,2-DCE were identified.

18
4. HAZARD IDENTIFICATION
4.1. STUDIES IN HUMANS There are limited data available from studies of effects of 1,2-DCE in humans. In an
early study (Lehmann and Schmidt-Kehl, 1936, as cited in ATSDR, 1996), the threshold for odor detection of trans-1,2-DCE by two human subjects was reported to be 280 ppm (1,100 mg/m3). Slight eye irritation occurred after 30 minutes of inhalation exposure to 830 ppm (3,300 mg/m3), while at exposure concentrations of 1,200 ppm (4,800 mg/m3) to 2,200 ppm (8,800 mg/m3) for 5–10 minutes, both subjects reported symptoms of nausea, drowsiness, fatigue, vertigo, and a feeling of intracranial pressure. Hamilton (1934, as cited in Dow, 1962) reported that a worker who entered a vat containing rubber dissolved in 1,2-DCE of unknown isomeric composition was found dead the following morning. The exposure concentration and duration of exposure were unknown. A human threshold limit value (TLV) of 200 ppm for cis- or trans-1,2-DCE and mixtures of the two isomers has been established by American Conference of Governmental Industrial Hygienists (ACGIH, 2001).
4.2. SHORT-TERM, SUBCHRONIC, AND CHRONIC STUDIES AND CANCER BIOASSAYS IN ANIMALS—ORAL AND INHALATION
A number of studies in animals have investigated the short-term and subchronic toxicity of cis- or trans-1,2-DCE by either the oral or inhalation route. Presented below are summaries of these investigations. No chronic studies for cis- or trans-1,2-DCE or their mixtures were identified. No cancer studies for cis- or trans-1,2-DCE or their mixtures were identified.
4.2.1. Oral Exposure 4.2.1.1. Short-term Studies 4.2.1.1.1. cis-1,2-DCE. McCauley et al. (1990, unpublished) conducted a 14-day gavage study of cis-1,2-DCE in male and female Sprague-Dawley rats. The study was subsequently published (McCauley et al., 1995). Upon review and comparison of the unpublished McCauley report (McCauley et al., 1990) and the published study (McCauley et al., 1995), errors in the documentation of doses and other minor inconsistencies were noted. These errors were not considered to compromise the reliability of the findings. Cis-1,2-DCE was administered by gavage in corn oil vehicle to approximately 10-week-old Sprague-Dawley rats (10/sex/dose) at doses of 0, 1, 3, 10, and 20 mmol/kg-day (equivalent to 0, 97, 291, 970, and 1,940 mg/kg-day,

19
respectively).1
During the study, male and female rats in the 1,940 mg/kg-day groups released excessive clear secretions around the nose and/or mouth and appeared agitated, followed by lethargy and ataxia. These symptoms were most common immediately after dosing. Gavage-related deaths were reported in the 1,940 mg/kg-day group (2/10 males and 3/10 females) and 970-mg/kg-day group (1/10 males and 1/10 females). Increases in water consumption were also seen in both male and female rats in the 1,940 mg/kg-day groups.
At the end of the exposure period, animals were sacrificed and the brain, gonads, heart, kidneys, adrenals, liver, spleen, and thymus were weighed and examined for gross pathology. Blood samples were collected for hematological and clinical chemistry examination. Tissues from controls and the high-dose group animals were examined for histopathologic changes.
With the exception of a 10% decrease in male rat body weights in the 1,940 mg/kg-day dose group, there were no significant changes in the final mean body weights. Significant dose-related increases in relative liver weight were reported in both males (16–38%) and females (15–39%) at all dose levels. Statistically significant increases were observed for relative kidney weights in females in the 970 and 1,940 mg/kg-day groups (14 and 12%, respectively) and for relative testes weights in males in the 1,940 mg/kg-day group (23%). Serum phosphorus levels were significantly elevated in females in all experimental groups, and serum cholesterol was increased in the 1,940 mg/kg-day group. Serum calcium was statistically significantly increased in male groups dosed with 970 and 1,940 mg/kg-day. Decreases in blood urea nitrogen (BUN) occurred in females at doses of 291(14%), 970 (28%), and 1,940 mg/kg-day (17%). (Increases in BUN are generally indicative of an effect on kidney function.) Hematocrit values for females were decreased by 8–11% at the 291, 970, and 1,940 mg/kg-day dose groups; similar effects did not occur in males. The authors considered most of the clinical chemistry and hematology effects to be marginal and not biologically meaningful or dose related. No compound-related histopathological changes were found at sacrifice. The authors noted that cis-1,2-DCE affected organ-to-body-weight ratios at relatively low exposure levels, but in light of negative histopathology, these data were difficult to interpret.
4.2.1.1.2. trans-1,2-DCE. Barnes et al. (1985) conducted a 14-day gavage study in male and female CD-1 mice. Concentrations of trans-1,2-DCE were prepared so that each mouse received approximately 1/100 and 1/10 of the lethal dose (LD50) (21 and 210 mg/kg) daily. No significant differences in weight gain were observed among the treated groups. Weights of the brain, liver,
1Doses in the 1995 study were incorrectly converted from mmol/kg-day to mg/kg-day. The doses presented here are the correctly converted doses. In addition, the doses for the acute and subchronic study as presented in the 1995 published paper were reversed (i.e., the doses listed for the 14-day study are really for the 90-day study and vice-versa). According to the unpublished report (McCauley et al., 1990), only half the controls, rather than all controls as reported in McCauley et al. (1995), were examined for histopathologic changes. (confirmed by study author)

20
spleen, lungs, thymus, kidney, and testes were not altered by DCE exposure. All organ weights were within the limits of historical controls, and there was no treatment-related effect when the weights were expressed as absolute weight, percent of body weight, or organ-to-brain ratios. There were no changes seen in hematocrit or hemoglobin values. Fibrinogen levels were decreased by 12% in the 210 mg/kg treatment group, and prothrombin activity increased slightly as manifested by a 7% decrease in prothrombin time. There were no significant differences in SGPT (ALT) activity or BUN levels; however, a statistically significant decrease (29%) in the LDH levels of the 210 mg/kg trans-1,2-DCE group was observed. In a study by the same laboratory, discussed below in Section 4.4.3.2, values for leukocyte counts, hematocrit, hemoglobin, fibrinogen, and prothrombin time did not differ significantly from control values when identical experiments were conducted in male CD-1 mice (Munson et al., 1982).
4.2.1.1.3. Mixtures of cis- and trans-1,2-DCE. In a dissertation, McMillan (1986) reported a statistically significant increase in kidney weight in male Sprague-Dawley-derived rats (6/group) administered a dose of 5 mmol (485 mg/kg-day) of a 50:50 mixture of cis-1,2-DCE and trans-1,2-DCE (in a sesame seed oil vehicle, 1 mL/kg) in a 14-day gavage study. Slight reductions (statistically significant) in plasma creatinine and BUN levels, and an increase in plasma calcium levels were also recorded at termination.
4.2.1.2. Subchronic Studies 4.2.1.2.1. cis-1,2-DCE. In a 90-day study, 10 Sprague-Dawley rats/sex/group, approximately 70 days old at study initiation, were administered 97% pure cis-1,2-DCE in corn oil by gavage (3 mL/kg) at doses of 0, 32, 97, 291, and 872 mg/kg-day (McCauley et al., 1995, 1990). Comparison of the unpublished McCauley report (McCauley et al., 1990) and the published study (McCauley et al., 1995) revealed errors in the documentation of administered doses and other minor inconsistencies.2
2The administered doses in McCauley et al. (1995) were reported as 0, 0.33, 1, 3, and 9 mmol/kg-day, which when converted to mg/kg-day, are 0, 32, 97, 291, and 872 mg/kg-day. McCauley et al. (1995), however, reported the converted doses incorrectly as 0, 10, 32, 98, and 206 mg/kg-day. The doses presented here are the correctly calculated doses of doses of 0, 32, 97, 291, and 872 mg/kg-day, as reported in McCauley et al. (1990). In addition, the summary of clinical chemisty findings in McCauley et al. (1995) did not adjust for early gavage-related deaths in the number of animals studied. In addition, the doses for the acute and subchronic study as presented in the 1995 published paper were reversed (i.e., the doses listed for the 14-day study are really for the 90-day study and vice-versa). The correct doses for both the 14- and 90-day studies are presented here. According to the unpublished report (McCauley et al., 1990), only half the controls, rather than all controls as reported in McCauley et al. (1995), were examined for histopathologic changes. (confirmed by study author)
These errors and inconsistencies were not considered to compromise the reliability of the 90-day study findings. At the end of the 90-day exposure period, animals were sacrificed and the brain, gonads, heart, kidneys, adrenals, liver, spleen, and thymus were weighed and examined for gross pathology. Blood samples were collected for

21
hematological and clinical chemistry examinations. Tissues from controls and the high-dose group animals were examined for histopathologic changes.
Clinical observations during the study were reported by the authors as minimal and not compound-related. Gavage deaths were present in both the treated and control groups (1/10 female rats at 32 mg/kg-day; 1/10 female rats at 97 mg/kg-day; 1/10 male controls; 3/10 male rats at 291 mg/kg-day; 4/10 male rats at 872 mg/kg-day).
Terminal body weights in male rats at the two highest dose groups were lower than controls by 10–11%, but were not considered by the author as statistically significant; no treatment-related effects on body weight were reported in female rats.
Absolute liver weights were statistically significantly increased by 10, 15, and 24% in female rats at doses of 97, 291, and 872 mg/kg-day, respectively. The increases in absolute liver weight of 6, 13, 5, and 15% in male rats of the 32, 97, 291, and 872 mg/kg-day dose groups, respectively, were not statistically significant or dose related (McCauley et al., 1990). Relative liver weights (expressed as a ratio of liver weight to body weight) were statistically significantly increased in a dose-related manner in males and females (Table 4-1). The increases were 15, 17, and 32% for males and 14, 19, and 30% for females at 97, 291, and 872 mg/kg-day, respectively. Histopathological evaluation revealed no specific hepatic injury. The authors concluded that there was a consistent, dose-related increase in relative liver weight in both sexes and that this effect, in light of the negative histopathology findings, may reflect hypertrophy and hyperplasia.

22
Table 4-1. Body weights and selected organ weights of rats exposed to cis-1,2-DCE by gavage for 90 days ANOVA
p-valuea Control Dose (mg/kg-d)
32 97 291 872 Malesb
Mean final body weight (g)
NS 578 ± 62.0 558 ± 75.1 569 ± 55.7 520 ± 46.6 512 ± 55.1
Kidney weight Absolute NS 4.02 ± 0.56
4.40 ± 0.57
(9%) 4.70 ± 0.59
(17%) 4.3 ± 0.77
(7%) 4.58 ± 0.74
(14%) Relative <0.001 0.70 ± 0.06 0.80 ± 0.06c
(14%) 0.83 ± 0.06c
(19%) 0.83 ± 0.10c
(19%) 0.89 ± 0.06c
(27%) Liver weight Absolute NS 16.6 ± 3.07
17.6 ± 3.12
(6%) 18.7 ± 2.09
(13%) 17.5 ± 3.71
(5%) 19.1 ± 1.92
(15%) Relative <0.001 2.85 ± 0.26 3.15 ± 0.27
(10%) 3.28 ± 0.18c
(15%) 3.34 ± 0.44c
(17%) 3.75 ± 0.20c
(32%) Femalesb
Mean final body weight (g)
NS 315 ± 23.4 316 ± 26.7 305 ± 38.2 303 ± 24.8 301 ± 40.7
Kidney weight Absolute NS 2.18 ± 0.22 2.24 ± 0.29
(3%) 2.53 ± 1.01
(16%) 2.55 ± 0.49
(17%) 2.55 ± 0.37
(17%) Relative NS 0.69 ± 0.06 0.71 ± 0.05
(3%) 0.82 ± 0.23
(19%) 0.85 ± 0.21
(23%) 0.85 ± 0.06
(23%) Liver weight Absolute 0.001 8.89 ± 0.81
9.16 ± 0.56
(3%) 9.80 ± 1.55c
(10%) 10.2 ± 0.89c
(15%) 11.0 ± 1.34c
(24%) Relative <0.001 2.82 ± 0.19 2.91 ± 0.18
(3%) 3.21 ± 0.22c
(14%) 3.36 ± 0.18c
(19%) 3.67 ± 0.27c
(30%)
aMeans were compared across dose groups using a one-way analysis of variance (ANOVA). A p-value <0.05 indicates at least one of the means is statistically significantly different from the others. In these cases, a Tukey’s pairwise multiple comparison test was applied to determine which of the means were statistically significantly different from each other. An “NS” indicates that the ANOVA was nonsignificant (i.e., p > 0.05) and thus the means are not statistically significantly different from one another. bValues are mean ± standard deviation (SD). Values in parentheses are percent increases from control group. cStatistically significantly different from control group; p ≤ 0.05 by Tukey’s multiple comparison test. Sources: McCauley et al. (1995, 1990).
Absolute kidney weights in female rats were increased by 3, 16, 17, and 17% compared to the control at doses of 32, 97, 291, and 872 mg/kg-day, respectively, but were not statistically significant. In male rats increases in absolute kidney weight of 9, 17, 7, and 14% for the 32, 97, 291, and 872 mg/kg-day dose groups, respectively, were not statistically significantly elevated compared to the control nor dose related (McCauley et al., 1990). Statistically significant increases in relative kidney weights (as a ratio of kidney weight to body weight) were recorded

23
in male rats in all dose groups (14, 19, 19, and 27% at 32, 97, 291, and 872 mg/kg-day, respectively) (Table 4-1). Female rats exhibited increased (although not statistically significant) relative kidney weights in the three highest doses (19, 23, and 23% at 97, 291, and 872 mg/kg-day, respectively). Relatively large variances in the female dose groups may explain why relative kidney weight increases in females were not statistically significant. Histopathological findings for kidney effects were negative, leading the authors to hypothesize that the increases in relative kidney weight may be due at least in part to decreased body weight gain.
Sporadic changes (although noted as statistically significant) in some clinical chemistry parameters were observed. BUN levels were significantly decreased (40%) at the highest dose in males but not in females. Serum calcium levels were significantly elevated by 8 and 10% in males at the 32 and 97 mg/kg-day doses, respectively, and serum phosphorus was significantly decreased by 14% in males exposed to 32 mg/kg-day. In females, serum phosphorus was significantly increased by 34 and 25% in the groups dosed with 97 and 291 mg/kg-day, respectively. No significant changes were reported in AST activity. Hemoglobin and hematocrit levels and red blood cell (RBC) count were significantly decreased in female rats dosed with 291 mg/kg-day, while only hematocrit was significantly decreased in females dosed with 872 mg/kg-day. In males, similar decreases (ranging from 6 to 10% compared with the control) occurred in hemoglobin in the 291 and 872 mg/kg-day groups and in hematocrit in the 97, 291, and 872 mg/kg-day groups. Overall, the changes in clinical chemistry and hematology parameters were considered by the authors to be marginal and of questionable biological significance. No noteworthy compound-related histopathological changes were observed in any dose group.
4.2.1.2.2. trans-1,2-DCE. There are three subchronic studies that evaluated oral exposure to trans-1,2-DCE (NTP, 2002a; Hayes et al., 1987; Barnes et al., 1985, with a companion immunology study by Shopp et al., 1985, which is discussed in Section 4.4.3.2). In a 90-day study by Hayes et al. (1987), groups of 20 male and 20 female rats, approximately 29–37 days of age, were administered 98% pure trans-1,2-DCE in drinking water containing 1% emulphor to promote solubility. The experimental groups consisted of an untreated control group, a 1% emulphor control group, and three test groups receiving drinking water containing trans-1,2-DCE sufficient to provide approximate daily doses of 500, 1,500, and 3,000 mg/kg. Based on fluid consumption measured twice weekly, actual mean doses were 0, 402, 1,314, and 3,114 mg/kg-day for males and 0, 353, 1,257, and 2,809 mg/kg-day for females. Effects on body weight, organ weights, hematology, urine, and blood chemistries were examined. Gross pathological examinations were performed after removing and weighing selected organs.
A dose-related increase in fluid consumption was observed among the groups receiving drinking water with emulphor, but the differences did not attain statistical significance. No trans-1,2-DCE-related changes in behavior or interim deaths were observed. The mean body
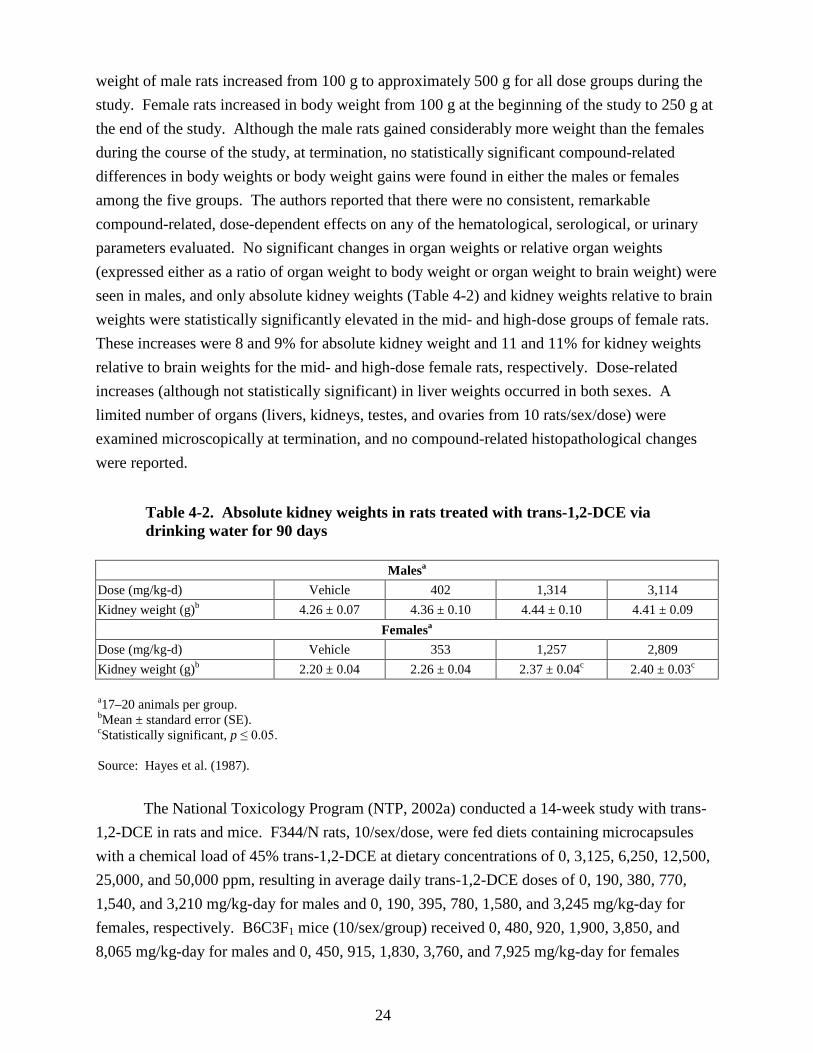
24
weight of male rats increased from 100 g to approximately 500 g for all dose groups during the study. Female rats increased in body weight from 100 g at the beginning of the study to 250 g at the end of the study. Although the male rats gained considerably more weight than the females during the course of the study, at termination, no statistically significant compound-related differences in body weights or body weight gains were found in either the males or females among the five groups. The authors reported that there were no consistent, remarkable compound-related, dose-dependent effects on any of the hematological, serological, or urinary parameters evaluated. No significant changes in organ weights or relative organ weights (expressed either as a ratio of organ weight to body weight or organ weight to brain weight) were seen in males, and only absolute kidney weights (Table 4-2) and kidney weights relative to brain weights were statistically significantly elevated in the mid- and high-dose groups of female rats. These increases were 8 and 9% for absolute kidney weight and 11 and 11% for kidney weights relative to brain weights for the mid- and high-dose female rats, respectively. Dose-related increases (although not statistically significant) in liver weights occurred in both sexes. A limited number of organs (livers, kidneys, testes, and ovaries from 10 rats/sex/dose) were examined microscopically at termination, and no compound-related histopathological changes were reported.
Table 4-2. Absolute kidney weights in rats treated with trans-1,2-DCE via drinking water for 90 days
Malesa Dose (mg/kg-d) Vehicle 402 1,314 3,114 Kidney weight (g)b 4.26 ± 0.07 4.36 ± 0.10 4.44 ± 0.10 4.41 ± 0.09
Femalesa Dose (mg/kg-d) Vehicle 353 1,257 2,809 Kidney weight (g)b 2.20 ± 0.04 2.26 ± 0.04 2.37 ± 0.04c 2.40 ± 0.03c a17–20 animals per group. bMean ± standard error (SE). cStatistically significant, p ≤ 0.05. Source: Hayes et al. (1987).
The National Toxicology Program (NTP, 2002a) conducted a 14-week study with trans-1,2-DCE in rats and mice. F344/N rats, 10/sex/dose, were fed diets containing microcapsules with a chemical load of 45% trans-1,2-DCE at dietary concentrations of 0, 3,125, 6,250, 12,500, 25,000, and 50,000 ppm, resulting in average daily trans-1,2-DCE doses of 0, 190, 380, 770, 1,540, and 3,210 mg/kg-day for males and 0, 190, 395, 780, 1,580, and 3,245 mg/kg-day for females, respectively. B6C3F1 mice (10/sex/group) received 0, 480, 920, 1,900, 3,850, and 8,065 mg/kg-day for males and 0, 450, 915, 1,830, 3,760, and 7,925 mg/kg-day for females

25
(NTP, 2002a). Additional groups (10 males and 10 females) of rats and mice served as untreated and vehicle controls (animals that received feed with unloaded microcapsules). Animals were evaluated for survival, body weight (weekly), and feed consumption (weekly). Necropsies were performed on all animals. Organ weights were measured for the heart, right kidney, liver, lung, right testis, and thymus. Clinical findings, including hematology (rats only), clinical chemistry, and histopathology, were performed. Hematology parameters included hematocrit; hemoglobin concentration; erythrocyte, reticulocyte, and platelet counts; erythrocyte and platelet morphology; mean cell volume; mean cell hemoglobin; mean cell hemoglobin concentration; and leukocyte count and differentials. Complete histopathology was performed on all rats and mice in the untreated control, vehicle control, and 50,000 ppm groups (3,210 and 3,245 mg/kg-day in male and female rats, respectively; 8,065 and 7,925 mg/kg-day in male and female mice, respectively). In addition to gross lesions and tissue masses, the following tissues were examined: adrenal gland, bone with marrow, brain, clitoral gland, esophagus, gallbladder (mice only), heart, large intestine (cecum, colon, rectum), small intestine (duodenum, jejunum, ileum), kidney, liver, lung, lymph nodes (mandibular and mesenteric), mammary gland, nose, ovary, pancreas, parathyroid gland, pituitary gland, preputial gland, prostate gland, salivary gland, skin, spleen, stomach (forestomach and glandular), testis with epididymis and seminal vesicle, thymus, thyroid gland, trachea, urinary bladder, uterus, and Zymbal’s gland.
In the rat study, there were no exposure-related deaths. The final mean body weight and body weight gain of male rats exposed to trans-1,2-DCE in the 3,210 mg/kg-day group were reduced by about 6% (statistically significant, p < 0.01) below controls (Table 4-3). Feed consumption in the exposed groups was similar to that in the vehicle controls. On day 21 and at week 14, there were mild decreases (generally <5% below the values in controls) in hematocrit values, hemoglobin concentrations, and erythrocyte counts in 1,540 and 3,210 mg/kg-day males and 1,580 and 3,245 mg/kg-day female rats. At week 14, these effects were also seen in male rats exposed to 380 and 770 mg/kg-day trans-1,2-DCE. Females exposed to ≥780 mg/kg-day had statistically significantly decreased serum alkaline phosphatase (ALP) activities compared with the vehicle controls on day 21. These decreases were noted by the authors to be minimal in severity, no greater than about 13%, and transient, with activities in the affected groups returning to vehicle control levels by week 14. On day 21, it was also noted that there was a minimal suppression of serum 5'-nucleotidase activities in the 3,210 mg/kg-day male and the 3,245 mg/kg-day female rats. According to the authors, these sporadic differences in clinical chemistry parameters at various time points generally did not demonstrate exposure concentration relationships or were inconsistent between males and females. These differences were not considered by the authors to be toxicologically relevant.
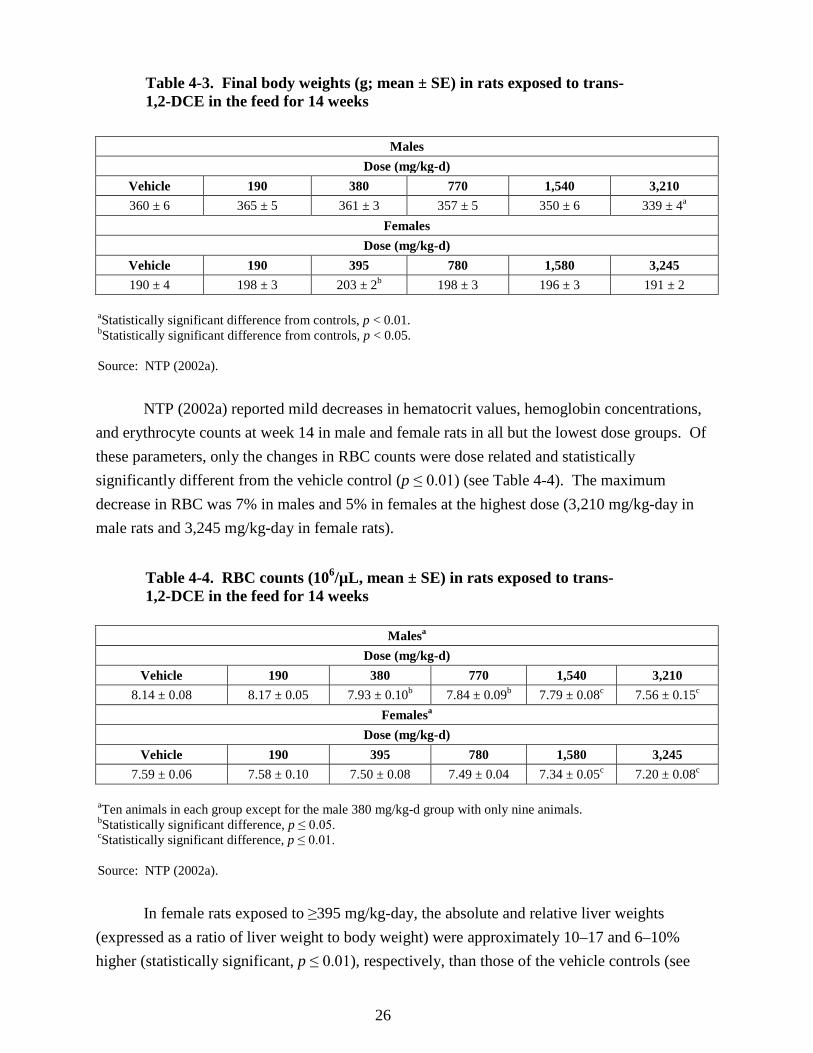
26
Table 4-3. Final body weights (g; mean ± SE) in rats exposed to trans-1,2-DCE in the feed for 14 weeks
Males Dose (mg/kg-d)
Vehicle 190 380 770 1,540 3,210 360 ± 6 365 ± 5 361 ± 3 357 ± 5 350 ± 6 339 ± 4a
Females Dose (mg/kg-d)
Vehicle 190 395 780 1,580 3,245 190 ± 4 198 ± 3 203 ± 2b 198 ± 3 196 ± 3 191 ± 2
aStatistically significant difference from controls, p < 0.01. bStatistically significant difference from controls, p < 0.05. Source: NTP (2002a).
NTP (2002a) reported mild decreases in hematocrit values, hemoglobin concentrations,
and erythrocyte counts at week 14 in male and female rats in all but the lowest dose groups. Of these parameters, only the changes in RBC counts were dose related and statistically significantly different from the vehicle control (p ≤ 0.01) (see Table 4-4). The maximum decrease in RBC was 7% in males and 5% in females at the highest dose (3,210 mg/kg-day in male rats and 3,245 mg/kg-day in female rats).
Table 4-4. RBC counts (106/µL, mean ± SE) in rats exposed to trans-1,2-DCE in the feed for 14 weeks
Malesa Dose (mg/kg-d)
Vehicle 190 380 770 1,540 3,210 8.14 ± 0.08 8.17 ± 0.05 7.93 ± 0.10b 7.84 ± 0.09b 7.79 ± 0.08c 7.56 ± 0.15c
Femalesa Dose (mg/kg-d)
Vehicle 190 395 780 1,580 3,245 7.59 ± 0.06 7.58 ± 0.10 7.50 ± 0.08 7.49 ± 0.04 7.34 ± 0.05c 7.20 ± 0.08c
aTen animals in each group except for the male 380 mg/kg-d group with only nine animals. bStatistically significant difference, p ≤ 0.05. cStatistically significant difference, p ≤ 0.01. Source: NTP (2002a).
In female rats exposed to ≥395 mg/kg-day, the absolute and relative liver weights
(expressed as a ratio of liver weight to body weight) were approximately 10–17 and 6–10% higher (statistically significant, p ≤ 0.01), respectively, than those of the vehicle controls (see

27
Table 4-5). The greatest increases were observed at the 395 mg/kg-day dose. Absolute kidney weights of male rats exposed to 1,540 or 3,210 mg/kg-day trans-1,2-DCE were decreased by about 7%. No gross or histological lesions were observed in rats that were attributed to exposure to trans-1,2-DCE.
Table 4-5. Relative liver weights (mean ± SE) in mice and rats exposed to trans-1,2-DCE in the feed for 14 weeks
Male micea Dose (mg/kg-d)
0 480 920 1,900 3,850 8,065 4.347 ± 0.056 4.552 ± 0.113 4.597 ± 0.115 4.745 ± 0.084b 4.736 ± 0.079b 4.979 ± 0.111b
Female micea Dose (mg/kg-d)
0 450 915 1,830 3,760 7,925 4.621 ± 0.07 4.738 ± 0.068 4.970 ± 0.127 4.813 ± 0.05 5.115 ± 0.139b 5.117 ± 0.08b
Male ratsa Dose (mg/kg-d)
0 190 380 770 1,540 3,210 3.465 ± 0.058 3.538 ± 0.032 3.658 ± 0.099 3.524 ± 0.050 3.492 ± 0.048 3.634 ± 0.056
Female ratsa Dose (mg/kg-d)
0 190 395 780 1,580 3,245 2.937 ± 0.038 3.040 ± 0.052 3.220 ± 0.066b 3.100 ± 0.051b 3.132 ± 0.052b 3.216 ± 0.051b
aTen animals per group. bStatistically significant, p ≤ 0.01. Source: NTP (2002a).
In the mouse study, no exposure-related deaths occurred. Mean body weights of
8,065 mg/kg-day males and 7,925 mg/kg-day females were significantly less (both by about 7%) than those of the vehicle controls. Mean body weight gains of female mice in the 1,830 and 3,760 mg/kg-day groups were also significantly less (6 and 4%, respectively) than in vehicle controls. Feed consumption in the exposed groups was similar to that in the vehicle controls. No exposure-related alterations in clinical chemistry parameters were observed.
As shown in Table 4-5, the relative liver weights (expressed as a ratio of liver weight to body weight) of male mice exposed to ≥1,900 mg/kg-day and female mice exposed to 3,760 or 7,925 mg/kg-day were significantly greater than those of the vehicle controls. Relative liver weight increases in the male mice were 10% or less except for the high dose (8,065 mg/kg-day), which showed a 14% increase compared with the vehicle control. The relative liver weights in the two highest female mice dose groups (3,760 and 7,925 mg/kg-day) were increased by about 12% over vehicle controls. Other than a statistically significant increase of 16% in the

28
915 mg/kg-day female mice, there was no significant dose-related change in absolute liver weight. No gross or microscopic lesions were observed in mice that could be attributed to trans-1,2-DCE exposure.
It was concluded by NTP (2002a) that little toxicity was associated with ingestion of microencapsulated trans-1,2-DCE, and that the histopathology and clinical chemistry data combined with organ and body weight data revealed that the maximum tolerated dose (MTD) had not been reached in this study.
In a 90-day drinking water study conducted by Barnes et al. (1985), groups of male and female CD-1 mice (24 mice/sex in the control group and 16 mice/sex in the treatment groups) were exposed to trans-1,2-DCE (purity 98%) dissolved in deionized water at 0, 0.1, 1.0, or 2.0 mg/mL. Target daily doses were 1/100, 1/10, and 1/5 the acute oral LD50; actual time-weighted average daily doses calculated on the basis of water consumption were 0, 17, 175, and 387 mg/kg-day for males and 0, 23, 224, and 452 mg/kg-day for females. Body and organ weights, hematology, serum chemistries, and hepatic microsomal activities were measured. Fluid consumption by both male and female mice progressively decreased throughout the duration of the experiment, with comparable changes occurring in the control group. Few trans-1,2-DCE-induced changes in terminal body weight gain or gross pathology were observed at the time of necropsy in either sex. As shown in Table 4-6, male mice receiving 175 mg/kg-day trans-1,2-DCE demonstrated a statistically significant increase in mean absolute liver weights and relative liver weights (expressed as a ratio of liver weight to body weight); however, absolute liver weights were less than those of the controls in the low- and high-dose groups. Females receiving 452 mg/kg-day demonstrated an 11% decrease (statistically significant) in absolute lung weights. Additionally, absolute thymus weight was reduced by 24% (statistically significant) at the high dose in females and relative thymus weights were statistically significantly reduced in the mid- and high-dose females.

29
Table 4-6. Results of 90-day study in CD-1 mice exposed to trans-1,2-DCE in the drinking water
Parameterb
Malesa Dose (mg/kg-d)
Vehicle 17 175 387 Liver weight (mg) [% body weight]
2,029 ± 43 [5.10]
2,007 ± 62 [5.01]
2,288 ± 60c (8%) [5.53c]
2,022 ± 85 [5.17]
Lung weight (mg) [% body weight]
232 ± 4 [0.58]
228 ± 5 [0.57]
236 ± 6 [0.57]
223 ± 5 [0.58]
Thymus weight (mg) [% body weight]
48 ± 3 [0.12]
47 ± 3 [0.12]
54 ± 2 [0.13]
48 ± 2 [0.12]
Kidney weight (mg) [% body weight]
651 ± 21 [1.64]
637 ± 22 [1.59]
658 ± 19 [1.59]
634 ± 27 [1.63]
Prothrombin time (sec) 10.0 ± 0.2 8.5 ± 0.2c (15%) 8.8 ± 0.3c (12%) 9.8 ± 0.2 Leukocytes (103/mm3) 5.30 ± 0.32 4.95 ± 0.42 4.83 ± 0.24 5.16 ± 0.40 Glucose (mg %) 153 ± 7 195 ± 8c (27%) 184 ± 5c (20%) 190 ± 7c (24%) LDH (IU/L) 677 ± 33 605 ± 47 449 ± 22c (34%) 587 ± 56 SGPT (IU/L) (or ALT) 44.3 ± 3.3 55.1 ± 7.1 45.0 ± 6.8 41.2 ± 4.7 SGOT (IU/L) (or AST) 74.0 ± 6.5 110.0 ± 7.8c (48%) 65.3 ± 5.0 69.9 ± 5.8 SAP (IU/L) (or ALP) 34.3 ± 1.8 37.6 ± 5.1 55.5 ± 5.4c (62%) 45.6 ± 2.4c (33%)
Parameter
Femalesd Dose (mg/kg-d)
Vehicle 23 224 452 Liver weight (mg) [% body weight]
1,712 ± 57 [5.27]
1,839 ± 51 [5.44]
1,864 ± 38 [5.49]
1,741 ± 57 [5.46]
Lung weight (mg) [% body weight]
254 ± 11 [0.79]
255 ± 7 [0.76]
244 ± 7 [0.72]
222 ± 8c (11%) [0.70c]
Thymus weight (mg) [% body weight]
71 ± 3 [0.22]
67 ± 4 [0.20]
61 ± 4 [0.18c]
54 ± 4c (24%) [0.17c]
Kidney weight (mg) [% body weight]
461 ± 12 [1.43]
456 ± 9 [1.35]
465 ± 13 [1.37]
428 ± 8 [1.35]
Prothrombin time (sec) 9.7 ± 0.2 9.8 ± 0.3 9.1 ± 0.2 9.0 ± 0.6 Leukocytes (103/mm3) 7.27 ± 0.32 6.98 ± 0.50 8.95 ± 0.61c (23%) 7.79 ± 0.60 Glucose (mg %) 122 ± 3 156 ± 6c (28%) 147 ± 5c (20%) 156 ± 6c (28%) LDH (IU/L) 511 ± 22 377 ± 20c (26%) 452 ± 23 559 ± 42 SGPT (IU/L) (or ALT) 49.9 ± 6.4 38.3 ± 3.0 33.5 ± 3.6c (33%) 30.4 ± 1.6c (39%) SGOT (IU/L) (or AST) 91.7 ± 6.6 77.8 ± 6.0 66.9 ± 4.5c (27%) 58.9 ± 8.8c (36%) SAP (IU/L) (or ALP) 44.0 ± 2.3 47.6 ± 4.2 51.0 ± 3.0 45.4 ± 2.9 aTwenty-three animals/sex in the control group and 15–16 animals/sex in the treatment groups. bValues presented are mean ± SE. cDiffers statistically significantly from controls, p ≤ 0.05; Duncan’s multiple range test was used to determine statistical significance. dTwenty-four animals/sex in the control group and 16 animals/sex in the treatment groups. SAP = serum alkaline phosphatase Source: Barnes et al. (1985).

30
Few changes in hematological parameters were seen; prothrombin time was significantly
decreased by 15 and 12% in male mice exposed to 17 and 175 mg/kg-day trans-1,2-DCE, respectively, and only decreased by 2% at the high dose (387 mg/kg-day) in the male mice. In female mice exposed to 224 mg/kg-day, an increase (23%) in blood leukocytes and a decrease (42%) in polymorphonuclear leukocytes occurred. Slight changes in several clinical chemistry parameters were observed. Although some values were statistically significantly different from those of the controls, there were no consistent trends or any large deviations from historical control values. The most noteworthy change was a statistically significant increase in the serum glucose levels at all dose levels in both males and females. However, the toxicological significance of these increases is unknown because the values were well within the wide range of measured values for control mice and a dose response was not demonstrated, even though the range of doses was 20-fold.
In male mice, significant changes in serum LDH, AST (SGOT) enzymes, and ALP activities, which provide some indication of hepatocellular injury, were reported. Significant increases of 62 and 33% were observed in serum ALP levels at the 175 and 387 mg/kg-day doses, respectively, in male mice. Such increases, however, showed no dose-response relationship and were not found in the female mice. In female mice, ALT and AST were depressed at all levels of exposure to trans-1,2-DCE; the decreases were statistically significant at the two higher dose levels. In both sexes, sporadic elevations in serum potassium and depressions in serum sodium and calcium were not considered biologically significant. In males, serum GSH levels were depressed 21% in the highest dose group.
In this same study (Barnes et al., 1985), possible effects of trans-1,2-DCE exposure on hepatic microsomal drug metabolism potential were assessed by measuring hexobarbital sleeping time and by evaluating microsomal protein/g liver, CYP450 and cytochrome b5 concentrations, and microsomal activities for aminopyrine N-demethylase and aniline hydroxylase. Hexobarbital sleeping times were not affected in the various dose groups exposed to trans-1,2-DCE in either sex. In male mice, exposure to 175 mg/kg-day trans-1,2-DCE significantly decreased the microsomal metabolizing activities of both aminopyrine N-demethylase (17%) and aniline hydroxylase (27%). In contrast, no significant changes in these enzyme activities were observed in the 387 mg/kg-day exposure group in males. In female mice, aniline N-hydroxylase activity was statistically significantly depressed in all exposure groups, although the decreases (21, 33, and 28%, respectively) were not dose-dependent.
4.2.1.2.3. Mixtures of cis- and trans-1,2-DCE. McMillan (1986) conducted a 30-day subchronic study with a 50% mixture of the cis- and trans-1,2-DCE orally administered in sesame seed oil (1 mL/kg) to male Sprague-Dawley-derived rats (six/group) at a daily dose of 5 mmol (485 mg/kg-day); control rats received the vehicle alone. At termination, the mean

31
relative liver weight in the treated group (expressed as a ratio of liver weight to body weight) was 19% greater (statistically significant) than that of control rats, while the mean relative weight of the lungs was significantly reduced by 14%. Mean values for plasma AST activity and creatinine levels in the treated group were significantly reduced by 25 and 17%, respectively, at sacrifice. The mean plasma calcium level in the treatment group was elevated by about 14%, as was plasma chloride by about 3%, while plasma potassium and CO2 were slightly depressed. Reductions in erythrocyte count, hemoglobin, and hematocrit were also recorded as decreases of 6, 5, and 5%, respectively.
4.2.1.3. Chronic Studies
No chronic toxicity studies for the cis- and trans- isomers of 1,2-DCE administered by the oral route were found.
4.2.2. Inhalation Exposure 4.2.2.1. Short-term Studies
No short-term inhalation studies of cis-1,2-DCE, trans-1,2-DCE, or mixtures of cis- and trans-1,2-DCE were identified.
4.2.2.2. Subchronic Studies 4.2.2.2.1. cis-1,2-DCE. No subchronic inhalation studies of cis-1,2-DCE were identified. 4.2.2.2.2. trans-1,2-DCE. Freundt et al. (1977) exposed six mature female SPR Wistar rats/group for 8 hours/day, 5 days/week to air containing 200 ppm (792 mg/m3) trans-1,2-DCE for 1, 2, 8, and 16 weeks. Concentrations were monitored by GC. Selected tissues (lung, heart, liver, kidney, spleen, brain, muscle, and sciatic nerve) were examined for gross and histopathological changes. Blood samples were analyzed for clinical chemistry and hematology parameters.
Changes in alveolar septal distension of the lungs and slight to severe fatty degeneration of the liver lobules and Kupffer cells were observed (see Table 4-7). Pathological changes in the lung were noted and consisted of pulmonary capillary hyperemia and alveolar septal distention in all six rats in all four exposure duration groups. These changes in the lung were considered by the authors to be slight. These changes were also seen in one of the control animals exposed for 1 week and in two of the control animals exposed for 2 weeks, but not in any of the control animals exposed at either 8 or 16 weeks. This is the only reported study of lung pathology in animals exposed to trans-1,2-DCE. The evaluation of respiratory effects is limited by the following: pulmonary capillary hyperemia and alveolar septal distention was also present in the control animals; there were a small number of animals examined; and the upper respiratory tract

32
was not examined for pathology. A statistical evaluation of the histological data on the respiratory system was not presented in this study.
Table 4-7. Histopathological changes in subchronic inhalation study of trans-1,2-DCE
Exposure Rat
Liver effect: fat accumulation—
liver lobulea
Liver effect: fat accumulation—
Kupffer cells Rat
Lung effect: capillary hyperemia, alveolar septum distention
Controls 1–6 0 0 1–5 6
0 +
200 ppm/8 hr for 1 wk (5 d)
1–4 5,6
0 +
0 +
1–6 +
Controls 1–6 0 0 1–4 5,6
0 +
200 ppm/8 hr for 2 wks (5 d/wk)
1,2 3–6
0 +
0 +
1–6 +
Controls 1–5 6
0 0
0 ++
1–6 0
200 ppm/8 hr for 8 wks (5 d/wk)
1–3 4–6
0 +
0 ++
1–6 +
Controls 1–4 5,6
0 +
0 +
1–6 0
200 ppm/8 hr for 16 wks (5 d/wk)
1 2,3 4–6
0 +
++
0 + +
1–6 +
0 = no change; + = slight change; ++ = severe change Source: Freundt et al. (1977).
Histopathological changes were also observed in the liver and included fat accumulation
of liver lobules and Kupffer cells. After exposure to 792 mg/m3 for 1 week, slight fat accumulation in liver lobules and Kupffer cells occurred in two of six rats but not in any of the controls. When rats were exposed for 2 weeks under the same conditions, slight fat accumulation in liver lobules and Kupffer cells occurred in four of the six rats but not in any of the controls. After exposure to 792 mg/m3 for 8 weeks, three of the six rats showed evidence of slight changes in the liver lobules and severe changes in the Kupffer cells. At this exposure for 8 weeks, severe fat accumulation was also noted in the Kupffer cells in one of the six controls. When rats were exposed for 16 weeks under the same conditions, slight changes in the Kupffer cells and severe changes in the liver lobule were noted in three of the six exposed rats. Slight changes in both the Kupffer cells and in the liver lobules occurred in two other treated animals in this 16-week exposure group for a total of five of the six rats showing some liver effect in this exposure group. However, slight changes in both the Kupffer cells and in the liver lobule also
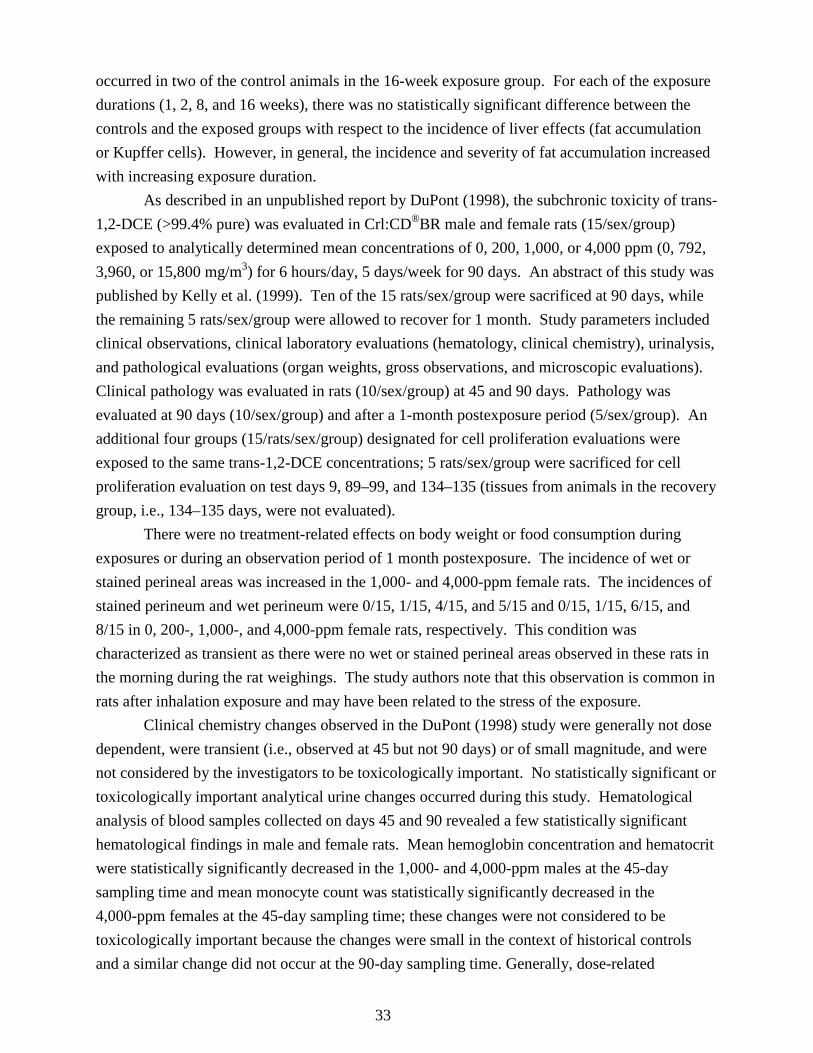
33
occurred in two of the control animals in the 16-week exposure group. For each of the exposure durations (1, 2, 8, and 16 weeks), there was no statistically significant difference between the controls and the exposed groups with respect to the incidence of liver effects (fat accumulation or Kupffer cells). However, in general, the incidence and severity of fat accumulation increased with increasing exposure duration.
As described in an unpublished report by DuPont (1998), the subchronic toxicity of trans-1,2-DCE (>99.4% pure) was evaluated in Crl:CD®BR male and female rats (15/sex/group) exposed to analytically determined mean concentrations of 0, 200, 1,000, or 4,000 ppm (0, 792, 3,960, or 15,800 mg/m3) for 6 hours/day, 5 days/week for 90 days. An abstract of this study was published by Kelly et al. (1999). Ten of the 15 rats/sex/group were sacrificed at 90 days, while the remaining 5 rats/sex/group were allowed to recover for 1 month. Study parameters included clinical observations, clinical laboratory evaluations (hematology, clinical chemistry), urinalysis, and pathological evaluations (organ weights, gross observations, and microscopic evaluations). Clinical pathology was evaluated in rats (10/sex/group) at 45 and 90 days. Pathology was evaluated at 90 days (10/sex/group) and after a 1-month postexposure period (5/sex/group). An additional four groups (15/rats/sex/group) designated for cell proliferation evaluations were exposed to the same trans-1,2-DCE concentrations; 5 rats/sex/group were sacrificed for cell proliferation evaluation on test days 9, 89–99, and 134–135 (tissues from animals in the recovery group, i.e., 134–135 days, were not evaluated).
There were no treatment-related effects on body weight or food consumption during exposures or during an observation period of 1 month postexposure. The incidence of wet or stained perineal areas was increased in the 1,000- and 4,000-ppm female rats. The incidences of stained perineum and wet perineum were 0/15, 1/15, 4/15, and 5/15 and 0/15, 1/15, 6/15, and 8/15 in 0, 200-, 1,000-, and 4,000-ppm female rats, respectively. This condition was characterized as transient as there were no wet or stained perineal areas observed in these rats in the morning during the rat weighings. The study authors note that this observation is common in rats after inhalation exposure and may have been related to the stress of the exposure.
Clinical chemistry changes observed in the DuPont (1998) study were generally not dose dependent, were transient (i.e., observed at 45 but not 90 days) or of small magnitude, and were not considered by the investigators to be toxicologically important. No statistically significant or toxicologically important analytical urine changes occurred during this study. Hematological analysis of blood samples collected on days 45 and 90 revealed a few statistically significant hematological findings in male and female rats. Mean hemoglobin concentration and hematocrit were statistically significantly decreased in the 1,000- and 4,000-ppm males at the 45-day sampling time and mean monocyte count was statistically significantly decreased in the 4,000-ppm females at the 45-day sampling time; these changes were not considered to be toxicologically important because the changes were small in the context of historical controls and a similar change did not occur at the 90-day sampling time. Generally, dose-related

34
decreases in white blood cell (WBC) and lymphocyte counts were observed at both 45 and 90 days in male and female rats. These data are summarized in Table 4-8.
Table 4-8. Selected hematology findings in rats exposed to trans-1,2-DCE by inhalation for 90 days
Parameter Concentration
(ppm) Sampling time
45-d 90-d Males
WBC (× 103/µL)a 0 17.2 ± 2.3 15.7 ± 2.0 200 (792 mg/m3) 15.0 ± 2.3 13.6 ± 2.5
1,000 (3,960 mg/m3) 16.5 ± 4.1 13.6 ± 3.4 4,000 (15,800 mg/m3) 13.9 ± 1.6b 12.6 ± 1.8
Lymph (/µL)a 0 13,953 ± 2,321 12,901 ± 1,961 200 (792 mg/m3) 12,187 ± 2,293 10,670 ± 2,189
1,000 (3,960 mg/m3) 13,766 ± 3,455 10,706 ± 2,766 4,000 (15,800 mg/m3) 10,451 ± 900b 9,597 ± 1,230b
Females WBC (× 103/µL)a 0 15.5 ± 4.9 11.7 ± 4.5
200 (792 mg/m3) 13.5 ± 2.7 10.1 ± 0.9 1,000 (3,960 mg/m3) 13.2 ± 3.3 9.0 ± 2.3
4,000 (15,800 mg/m3) 12.1 ± 2.2 9.6 ± 2.1 Lymph (/µL)a 0 13,295 ± 4,389 10,239 ± 4,147
200 (792 mg/m3) 11,508 ± 2,792 8,337 ± 892 1,000 (3,960 mg/m3) 11,244 ± 2,880 7,705 ± 2,147
4,000 (15,800 mg/m3) 10,516 ± 1,989 7,948 ± 1,943 aGroup means ± SD. bSignificantly different from the control (p < 0.05) by Dunnett’s criteria. Source: DuPont (1998).
At the high dose, WBC count decreased about 20% in male rats and 18% in female rats
compared to the control; lymphocyte levels decreased about 25% in males and about 22% in females.
In general, organ weights in exposed rats showed no statistically or biologically significant changes (<10%) relative to the control (DuPont, 1998). Relative adrenal weight (as percent of body weight) was statistically significantly reduced in male rats at 1 month recovery at the mid concentration (1,000 ppm or 3,960 mg/m3) but not at the high concentration (4,000 ppm or 15,800 mg/m3) of trans-1,2-DCE. In male rats at zero day recovery, increases in relative liver weight (as percent of body weight) ranged from 4 to 8% and were not dose related. Similarly, increases in relative liver weight (as organ to brain weight ratio) in male rats were 4, 4, and 6% at concentrations of 200, 1,000, and 4,000 ppm (or 792, 3,960, and 15,800 mg/m3), respectively. In female rats at zero day recovery, increases in relative liver weight (as percent of

35
body weight) were 1, 5, and 6% at concentrations of 200, 1,000, and 4,000 ppm (or 792, 3,960, and 15,800 mg/m3), respectively. Increases in relative liver weight (as organ to brain weight ratio) in female rats at zero day recovery were 2, 8, and 8% at concentrations of 200, 1,000, and 4,000 ppm (or 792, 3,960, and 15,800 mg/m3), respectively. Increases in relative kidney weight for male and female rats (both as percent of body weight and as organ to brain ratio) were <10% and were not generally dose-related. For male rats, relative kidney weights ranged from 0 to 6% and from 3 to 5% as percent of body weight and as organ to brain weight ratio, respectively. Relative kidney weight for female rats ranged from 2 to 5% as percent of body weight and from 5 to 8% as organ to brain weight ratio. No histopathological changes were related to exposure to trans-1,2-DCE.
4.2.2.2.3. Mixtures of cis- and trans-1,2-DCE. A subchronic inhalation study was conducted by Dow (1962) in which rats, rabbits, guinea pigs (strains not stated), and beagle dogs were exposed to 0, 500, or 1,000 ppm (0, 1,980, or 3,960 mg/m3) 1,2-DCE mixture (58% cis-, 42% trans- isomer), 7 hours/day for 6 months. The 1,980 mg/m3 exposure groups consisted of 24 male and 35 female rats, 7 male and 8 female guinea pigs, 3 male and 3 female rabbits, and 2 female dogs, while the 3,960 mg/m3 exposure groups consisted of 12 male and 12 female rats and 2 male and 2 female rabbits. In addition to the animals receiving daily 7-hour exposures, separate groups of 10 male rats were exposed to 1,980 mg/m3 1,2-DCE for 4, 2, or 1 hour(s)/day for a total duration of 5 months. In all studies, each animal was weighed twice per week until growth was determined to be normal; afterwards, each animal was weighed once per week. Hematological analyses and clinical chemistry determinations were performed on all rabbits, on five male and five female rats exposed to 3,960 mg/m3, and on all dogs exposed to 1,980 mg/m3.
Rats and rabbits exposed to 3,960 mg/m3 of 1,2-DCE, 7 hours/day (136 exposures in 195 days) did not exhibit increased mortality or clinical signs of toxicity. Growth of animals was normal, and final body weights and weights of lungs, heart, spleen, and testes were not significantly different from controls. Hematology and biochemical values were within normal limits. The average relative kidney weight (expressed as a ratio of kidney weight to body weight) in male and female rats were increased by 16 and 9%, respectively (statistically significant only in the males). The average relative liver weight in female rats (expressed as a ratio of liver weight to body weight) was statistically significantly increased by 23%. Liver weight in both male and female rabbits were also increased, but statistical significance was not determined because of the small number of rabbits tested.
Rats exposed to 1,980 mg/m3 of 1,2-DCE, 7 hours/day, for 6 months did not demonstrate excess mortality or adverse clinical effects. Hematology and clinical chemistry values were within normal limits. Terminal body weights and relative lung, heart, spleen, and testes weight were not significantly different from controls, but relative kidney weight of male and female rats were increased by 9 and 18%, respectively (statistically significant only in the male rats). Liver

36
weights of female rats were significantly increased by 19%. No noteworthy effects on mortality, behavior, or appearance were observed in the guinea pigs exposed to 1,980 mg/m3 on 81 of 117 days. Final average body weights and organ weights were not significantly different from controls. Rabbits exposed to 1,980 mg/m3 for 131 exposures in 181 days exhibited no effects, except that increases in liver weights of both male and female rabbits occurred at termination (statistical evaluations were not performed because of the small number of experimental animals). Female dogs exposed to 1,980 mg/m3 tolerated 129 exposures in 183 days without biologically significant effects. Clinical chemistry and hematology data were essentially identical to values obtained prior to initiation of the 1,980 mg/m3 exposure regimen.
In rats exposed to 1,980 mg/m3 1,2-DCE for shorter periods of 4, 2, or 1 hour/day, 5 days/week, for 5 months (136 exposures in a period of 195 days), no clinical or behavioral abnormalities were seen, and final body weight and organ weight data were not significantly different from control values. The BUN and ALP values were within normal limits.
4.2.2.3. Chronic Studies
No chronic inhalation exposure studies were identified for either cis- or trans-1,2-DCE.
4.3. REPRODUCTIVE/DEVELOPMENTAL STUDIES—ORAL AND INHALATION The available studies of reproductive and developmental outcomes are limited for both
the cis- and trans- isomers of 1,2-DCE. In an inhalation teratogenicity study of trans-1,2-DCE (DuPont, 1988a), few developmental parameters were affected by treatment and these were observed only in the high-exposure groups. Range-finding studies on the developmental toxicity of a mixture of 1,2-DCE (composition of isomers unknown) via the oral route of exposure (NTP, 1991a, b, c) found no signs of developmental or maternal toxicity at any of the initial doses tested (up to 2,918 mg/kg-day), but at higher doses (up to 6,906 mg/kg-day), showed maternal toxicity in the form of reduced maternal body weight and reduced maternal weight gain.
4.3.1. Oral Exposure 4.3.1.1. cis-1,2-DCE
No studies of reproductive or developmental toxicity of cis-1,2-DCE in animals following oral exposure were found.
4.3.1.2. trans-1,2-DCE
In a 14-week toxicity study described above in Section 4.2.1.2.2, NTP (2002a) fed F344/N rats and B6C3F1 mice diets containing microcapsules with a chemical load of 45% trans-1,2-DCE. The rats (10/sex/group) received average daily trans-1,2-DCE dietary doses of 0, 190, 380, 770, 1,540, and 3,210 mg/kg-day for males and 0, 190, 395, 780, 1,580, and 3,245 mg/kg-day for females. In the mouse study (10/sex/group), males received 0, 480, 920,

37
1,900, 3,850, and 8,065 mg/kg-day and females received 0, 450, 915, 1,830, 3,760, and 7,925 mg/kg-day (NTP, 2002a). There were no organ weight changes or gross or microscopic lesions observed in the reproductive organs of rats or mice that would suggest that trans-1,2-DCE targets the reproductive system.
4.3.1.3. Mixtures of cis- and trans-1,2-DCE
NTP conducted a series of developmental toxicity range-finding studies in mice and rats with a mixture of 1,2-DCE isomers (composition unknown). The test compound was administered in the feed in the form of microcapsules. Macroscopic or microscopic testing for malformations was not conducted. In the mouse study (NTP, 1991a), 12 pregnant CD-1 mice/group were given feed containing 1,2-DCE mixture at concentrations of 0, 0.05, 0.25, 0.5, 1, and 1.5% on gestation days (GDs) 6–16. Doses were calculated based on feed intake and body weight as 0, 97, 505, 979, 2,087, and 2,918 mg/kg-day, respectively. Body weight, feed consumption, and any signs of toxicity were monitored. Dams were sacrificed on GD 17 and their uteri were examined. Gravid uterus weights, fetal body weights, and numbers of fetuses (live/dead), implantation sites, and resorptions were recorded. None of the parameters showed any deviation from control values. The authors concluded that, based on this range-finding study, 1,2-DCE treatment did not cause maternal or developmental toxicity in mice at any of the tested dose levels.
Ten pregnant Sprague-Dawley rats/group were subjected to the same experimental protocol as above (NTP, 1991b) and received feed containing 0, 0.2, 1, 2, or 4% 1,2-DCE mixture on GDs 6–16, resulting in doses of 0, 135, 672, 1,228, 1,966, and 2,704 mg/kg-day, respectively. Dams were sacrificed on GD 20. The same parameters as in the mouse study were examined. There were no signs of developmental or maternal toxicity at any of the levels tested. Four animals of the highest dose group were found not to be pregnant; the study authors considered this to be an isolated event not related to chemical treatment. A repeat of this study was then undertaken with higher doses (NTP, 1991c). Pregnant Sprague-Dawley rats were exposed on GDs 6–16 to feed containing 0, 4, 7.5, or 10% 1,2-DCE mixture, corresponding to doses of 0, 3,134, 5,778, and 6,906 mg/kg-day. Dams were sacrificed on GD 20. The same parameters as above were monitored. There was no mortality. Feed intake was dose-dependently reduced. Maternal weight gain was dose-dependently reduced and statistically significantly different from controls in the mid- and high-dose groups. Maternal body weights were statistically significantly reduced at the 3,134 (3 and 15% on GDs 14 and 16, respectively), 5,778 (6, 7, 7, 9, and 8% on GDs 9, 11, 14, 16, and 20, respectively), and 6,904 mg/kg-day doses (11, 12, 12, 14, and 10% on GDs 9, 11, 14, 16, and 20, respectively). Pregnancy outcome numbers or fetal body weights were not affected by the treatment. Based on the dose ranges used in this dose range-finding study, the authors concluded that DCE treatment caused maternal

38
toxicity at all dose levels based on reduced body weight. However, no changes were noted in the limited number of fetal parameters evaluated in the study.
4.3.2. Inhalation Exposure 4.3.2.1. cis-1,2-DCE
No studies of reproductive or developmental toxicity of cis-1,2-DCE in animals following inhalation exposure were found.
4.3.2.2. trans-1,2-DCE
In a study conducted by DuPont (1988a), and published in Hurtt (1993), trans-1,2-DCE was administered to 24 pregnant female Crl:CD®BR rats/group by inhalation, 6 hours daily, on GDs 7–16. Selection of the exposure levels was based on an MTD study conducted with pregnant female rats prior to the actual experiment. On the basis of the pilot study, exposure levels chosen for the actual study were 0, 2,000, 6,000, and 12,000 ppm (0, 7,920, 23,760, and 47,520 mg/m3, respectively). The low-exposure group concentration level was chosen to be 10 times the ACGIH TLV. Maternal body weight and feed consumption data were observed and analyzed. Fetal weights were also noted. During the first 2 days of dosing, dams exposed to 23,760 mg/m3 showed slight weight gain suppression, and the 47,520 mg/m3 exposure group showed statistically significant weight loss. Additionally, a statistically significant suppression of body weight gain was noted in animals at the 23,760 mg/m3 concentration on GDs 11–13. For the entire dosing period, a significantly reduced weight gain was observed only at the 47,520 mg/m3 concentration. Feed consumption was significantly reduced in the 23,760 and 47,520 mg/m3 groups throughout the exposure period. In the 7,920 mg/m3 group, there was a significant decrease in feed consumption during GDs 13–15, although no significant effects on body weight were reported. No significant changes in body weight or food consumption were observed in any other group. As seen in maternal body weight change, no significant differences were noted in feed consumption in the pre- or postexposure periods. Eye irritation was observed in rats at all exposure levels. The only other compound-related clinical or postmortem findings were increases in alopecia, salivation, and lethargy in rats during the periods of exposure, especially in the high-exposure group.
Dams were sacrificed on GD 22 and their uteri were examined. The mean number of resorptions per litter was statistically significantly increased in dams in the 23,760 and 47,520 mg/m3 exposure groups. The values for resorptions in mid- and high-exposure groups were within the range of historical controls in recent studies (past 2 years) conducted by the laboratory and were not considered to be biologically significant but rather an artifact of the unusually low resorption rate in the concurrent control group (0.3 mean resorptions per litter). There were no differences in the pregnancy rate, fetuses per litter, number of stunted fetuses, or number of corpora lutea observed per female. Developmental variations per litter were not
39
significantly increased in any of the exposure groups. No significant differences were detected in the mean percent of fetuses per litter with malformations at any exposure level.
In conclusion, treatment-related maternal and developmental toxicities were only observed in high-concentration groups. Maternal toxicity was evidenced by statistically significant decreases in body weight and feed consumption at 47,520 mg/m3 (the highest exposure concentration tested), and by significant decreases in feed consumption at 23,760 and 7,920 mg/m3. The decrease in feed consumption at 23,760 mg/m3 was expressed as an observed effect on body weights only on GDs 11–13. At 7,920 mg/m3, the effect on feed consumption, seen only on GDs 13–15, was minimal and not accompanied by a significant body weight change. Although the body weight change was lower for this group compared with controls, their feed consumption was consistently lower than controls throughout the study. According to the authors, this change was not accompanied by a statistically significant decrease in body weight, and, therefore, its biological significance is questionable. Additionally, a statistically significant trend was noted in the incidence of females with clinical findings on GDs 7–16, but this was the result of ocular irritation in most animals. Significant developmental toxicity (decreased mean fetal weight) was evident among fetuses exposed to 47,520 mg/m3 trans-1,2-DCE.
4.3.2.3. Mixtures of cis- and trans-1,2-DCE
No studies of reproductive or developmental toxicity of mixtures of 1,2-DCE in animals following inhalation exposure were found.
4.4. OTHER DURATION- OR ENDPOINT-SPECIFIC STUDIES 4.4.1. Acute Studies 4.4.1.1. Oral Exposure 4.4.1.1.1. cis-1,2-DCE. In an acute hepatotoxicity study reported in a dissertation by McMillan (1986), cis-1,2-DCE was administrated by gavage at doses of 26 mmol/kg (2,521 mg/kg) and 51 mmol/kg (4,944 mg/kg) in sesame seed oil to six male Sprague-Dawley rats/dose. The GSH levels were statistically significantly elevated by 19 and 28% at doses of 2,521 and 4,944 mg/kg, respectively. ALT activity was unchanged at either dose, but AST activity was statistically significantly elevated by 56% at 4,944 mg/kg cis-1,2-DCE. 4.4.1.1.2. trans-1,2-DCE. Male and female Sprague-Dawley-derived CD rats, 22–30 days of age, were administered a range of single doses of trans-1,2-DCE via corn oil gavage in a study conducted by Hayes et al. (1987). The total volume of solution administered in this acute study was 10 mL/kg. There were five dosage groups (exact doses not given), consisting of 10 rats/sex/group. Symptoms of dose-dependent central nervous system (CNS) depression, ataxia, and depressed respiration were observed at all doses; all deaths occurred within 30 hours
40
of dosing. Although the exact dosages were not reported in this study, the authors determined that the LD50 was 7,902 mg/kg (95% confidence interval [CI] 6,805–9,175 mg/kg) and 9,939 mg/kg (95% CI 6,494–15,213 mg/kg) for male and female rats, respectively. Gross necropsy findings of all rats that died were negative. No consistent compound-related gross pathological findings were observed at necropsy.
An oral LD50 test was performed by Freundt et al. (1977) in which mature female SPF Wistar rats received doses of 2–8 mL/kg trans-1,2-DCE dissolved in olive oil (totaling 10 mL/kg each dose) via gavage. The LD50 was reported to be 1.0 mL/kg (95% CI 0.9–1.1 mL/kg) (1,280 mg/kg) for the rats treated via gavage. (The action of trans-1,2-DCE given orally is more pronounced than after i.p. doses; described in Section 4.4.4.1). One rat exhibited gross pathology including pulmonary capillary hyperemia and alveolar septal distention and fibrous swelling and hyperemia with incipient disorganization of the cardiac muscle. In two rats, severe fatty infiltration of the liver lobules and Kupffer cells was found.
In an acute hepatotoxicity study reported in a dissertation by McMillan (1986), trans-1,2-DCE was administered orally as a single dose of 51 mmol/kg (4,944 mg/kg). As with the study conducted on the cis- isomer, six male rats were in each dose group. No differences were seen between the controls and rats administered the single 4,922 mg/kg-day dose of trans-1,2-DCE.
Barnes et al. (1985) also evaluated the acute oral toxicity of trans-1,2-DCE in 6-week-old male and female CD-1 mice. Trans-1,2-DCE was administered via gavage as a single dose after an 18-hour fast. Nine different doses, ranging from 800 to 3,500 mg/kg of trans-1,2-DCE in 0.01 mL 1:9 emulphor:water vehicle per gram body weight, were used to generate dose-response curves for DCE-induced mortality. The mice were observed continuously for 4 hours following gavage and then twice daily for 14 days. All decedents and mice surviving the 14-day period were subjected to gross necropsy. The LD50 was determined by log probit analysis to be 2,122 mg/kg (95% CI 1,874–2,382) for male mice and 2,391 mg/kg (95% CI 2,055–2,788) for female mice. Upon gross necropsy, target organs were the lungs and liver. The lethality of the test agent was attributed to depression of the CNS, as signs of decreased activity, ataxia, suppression of the righting reflex, ruffled fur, and hunched back were seen. Hyperemia of the mucosal surface of the stomach and small intestines was also observed at necropsy.
4.4.1.1.3. Mixtures of cis- and trans-1,2-DCE. Dow (1960) reported that a dose of 2,000 mg/kg 1,2-DCE (isomer composition not stated) as a 10% solution in corn oil administered by gavage was not lethal to the exposed rats in this range-finding study. The Dow (1960) study noted that “some kidney injury” was observed at necropsy, but that no other reactions were noteworthy.

41
4.4.1.2. Inhalation Exposure 4.4.1.2.1. cis-1,2-DCE. A 4-hour inhalation median lethal concentration (LC50) study with groups of five male and five female Crl:CD®BR rats was conducted with cis-1,2-DCE (DuPont, 1999). The exposure concentrations were 0, 12,100 ppm (47,900 mg/m3), 13,500 ppm (53,400 mg/m3), 15,700 ppm (62,200 mg/m3), and 23,200 ppm (91,900 mg/m3). During a 14-day recovery period, rats were weighed and observed for signs of clinical toxicity. All rats underwent gross pathological examination immediately after death or at the end of the recovery period and the liver, kidney, heart, and lung were evaluated histologically. The LC50 was calculated to be 54,200 mg/m3. It was noted that the rats were prostrate, with eyes open, but were unresponsive to alerting stimuli during exposure. Other clinical signs included weakness and irregular respiration immediately after exposure. After the 47,900 mg/m3 cis-1,2-DCE exposure, rats showed weakness, but there were no effects on body weight at this concentration. Rats that did not die (two of five males and two of five females) at the 53,400 mg/m3 exposure showed weakness and irregular respiration immediately after the exposure and slight to severe weight loss for 1 day after exposure, followed by a normal weight gain rate. All five of the male rats exposed (all of which had died during the study) to 62,200 mg/m3 of the cis- isomer had minimal hepatic centrilobular vacuolation. One male rat in each of the lower exposure levels (47,900 and 53,400 mg/m3) also had minimal hepatic centrilobular vacuolation upon microscopic examination. There was one male rat in the highest exposure group with this lesion. Since all five male rats at the high concentration died during exposure, these animals may not have survived long enough to develop the lesion. There were no exposure-related effects observed in female rats exposed to cis-1,2-DCE. No effects were seen in the heart, kidney, or lungs in exposed rats.
4.4.1.2.2. trans-1,2-DCE. In studies similar to those conducted with the cis- isomer, DuPont (1999) conducted a 4-hour acute inhalation study with trans-1,2-DCE, using five male and five female Crl:CD®BR rats per exposure level. The exposure concentrations used in this study were 0, 12,300 ppm (48,700 mg/m3), 22,500 ppm (89,100 mg/m3), 28,100 ppm (111,300 mg/m3), and 34,100 ppm (135,000 mg/m3). At the 48,700 mg/m3 exposure, rats recovered and resumed a normal appearance within about 30 minutes after the end of the exposure. There were no effects on body weight at this concentration. Rats that survived the 89,100 mg/m3 exposure showed lethargy and irregular respiration immediately after exposure and showed slight weight loss for 1 day, followed by a normal weight gain rate. Rats exposed to 111,300 mg/m3 showed weakness immediately after exposure and slight to severe weight loss for 1 day. Unlike effects seen with cis-1,2-DCE, no compound-related effects were observed in livers of rats exposed to trans-1,2-DCE at concentrations up to 135,000 mg/m3. No effects were seen in heart, kidneys, or lungs of exposed rats. The LC50 was determined to be 95,400 mg/m3; the authors concluded that trans-1,2-DCE was about half as acutely toxic as cis-1,2-DCE by the inhalation route.

42
Freundt et al. (1977) exposed six mature female SPR Wistar rats/group once to trans-1,2-DCE (purity unspecified) at concentrations of 0, 200, 1,000, and 3,000 ppm (0, 792, 3,960, and 11,880 mg/m3, respectively) for 8 hours. Test agent concentrations were monitored by GC. Various parameters including symptoms of CNS depression, quantitative determination of serum components (cholesterol, calcium, inorganic phosphate, total bilirubin, albumin, total protein, uric acid, urea nitrogen, glucose, ALP), and hematological parameters (hemoglobin, cell volume, mean corpuscular volume, mean corpuscular hemoglobin) were evaluated.
No symptoms of CNS depression were observed at the concentrations used. Clinical chemistry values for serum albumin, BUN, and ALP were statistically significantly depressed (11, 20, and 16%, respectively) in the rats exposed to 3,960 mg/m3; values for the 11,880 mg/m3 exposure were not reported. Freundt et al. (1977) noted pathological changes in the hearts of rats exposed to trans-1,2-DCE after a single 8-hour exposure to 11,880 mg/m3 but not after exposures to lower levels. These changes were described as severe fibrous swelling of the myocardium and hyperemia. Blood leukocyte counts were reduced in rats exposed to 792 and 3,960 mg/m3, while erythrocyte counts were significantly reduced in rats exposed to 3,960 mg/m3 trans-1,2-DCE. (The actual blood leukocyte counts and erythrocyte counts were not provided.) Histopathological changes were seen, including fatty degeneration of liver lobules and Kupffer cells and capillary hyperemia with distension of the alveolar septa of lungs. At 792 mg/m3 (the TLV), slight fatty degeneration of the liver occurred in one of six rats, and hyperemia of the lung with alveolar septum distention occurred in all members of the group. At 3,960 mg/m3, liver degeneration was seen in two of six rats, and lung changes were seen in five of six rats. The same incidence (two of six rats) of liver degeneration was noted at 11,880 mg/m3, and five of six rats had lung effects. In addition to effects on liver and lungs, severe fibrous swelling and hyperemia with barely maintained striation of the myocardium were noted (percentage not indicated) at 11,880 mg/m3.
Gradiski et al. (1978) evaluated the toxicity of trans-1,2-DCE by using groups of 20 female OF1 mice exposed for 6 hours to five airborne concentrations. The LC50 was determined graphically to be 21,723 ppm (86,000 mg/m3). On the basis of the high LC50, the inhalation toxicity of trans-1,2-DCE was judged by the study authors to be lower than that of nine other chlorinated aliphatic solvents that were tested concurrently.
4.4.1.2.3. Mixtures of cis- and trans-1,2-DCE. Lehmann (1911) reported inhalation experiments in which four cats were exposed to 50–72 mg/L (50,000–72,000 mg/m3) 1,2-DCE; the isomer composition was not stated. The cats demonstrated varying degrees of narcosis, with symptoms of salivation, sneezing, disturbance of balance, and prostration. Two of the cats died.
In acute inhalation studies (Dow, 1960), male rats (9/group) were exposed to 0, 7,297, 14,814, 16,810, 29,035, and 50,123 ppm (28,900, 58,740, 66,650, 115,120, and 198,700 mg/m3) 1,2-DCE (isomer composition not stated) for periods up to 7 hours. Rats exposed to

43
concentrations >115,120 mg/m3 rapidly became unconscious, with rapid breathing and tremors, and exposures lasting >0.2 hours were fatal. Six of nine rats exposed to 66,650 mg/m3 for 4 or 7 hours died. One hour after exposure at this concentration, the rats developed tremors and made running movements while lying on their sides. Slight liver and lung pathology were observed 1 day after exposures; 1 week after exposures, slight liver and lung injury plus moderate kidney injury were reported. No rats died after exposure to 28,900 mg/m3 1,2-DCE for 7 hours or after exposure to 58,740 mg/m3 for 1 hour. No LC50 was calculated.
4.4.2. In Vivo Neurological Behavioral Studies
Inhibition of propagation and maintenance of an electrically evoked seizure discharge was used as a criterion for neurotropic effects in experimental animals by Frantik et al. (1994). The studies were designed to measure the concentrations of 1,2-DCE (isomer not stated) and 47 other volatile solvents required to inhibit electrically evoked acute neurotoxic symptoms, a measure of subclinical CNS depression. Effect-air concentration regressions for 1,2-DCE and 47 other volatile solvents were determined after 4-hour inhalation exposures in adult male Wistar-derived rats (0.5–1 year old) and H strain female mice (2–4 months old). Four exposed animals and four untreated controls were tested at four to five solvent concentrations, ranging from 90 to 21,000 ppm (373–83,370 mg/m3) in rats and 300–24,000 ppm (1,191–95,280 mg/m3) in mice. Each experiment was repeated.
As measured by the tonic extension of hind limbs in rats and the velocity of tonic hind-limb extension in mice, the mean latency of responses to short electrical stimuli (0.2 seconds, 50 Hz, 180 V in rats and 90 V in mice) was evaluated graphically. The critical level of effect (the effect in the lower third part of the dose-response function corresponding to the shortening of the tonic extension of hind-limbs by 3 seconds in rats and the lengthening of the latency of extension by 0.6 seconds in mice) and the threshold for slowing the propagation or shortening of the duration of seizures by 10% of the maximum effect possible (EC10) were determined. Values for this critical level of effect were generally several times lower than airborne concentrations evoking behavioral inhibition in animals and 1–2 orders of magnitude lower than concentrations inducing narcosis. The mean concentration of 1,2-DCE evoking a 30% depression in response in rats was 1,810 ppm with a one-sided 90% CI of 245 ppm and a slope of the regression line of 0.022%/ppm. Equivalent data for mice were 3,400 ppm for a 30% depression in response with a one-sided 90% CI of 490 ppm and a slope of the regression line of 0.02%/ppm. Frantik et al. (1994) proposed that their EC10 values could be used to evaluate the efficacy of short-term exposure limits for protection of workers from acute nervous depression and other subnarcotic effects, such as headaches, impairment of vigilance, and lowered reliability of performance.
Concentration-dependent behavioral changes in male Swiss OF1 mice, following a 4-hour exposure to 1,2-DCE (isomer not stated) and to 12 other aliphatic and aromatic solvents, were evaluated by DeCeaurriz et al. (1983). Tests were conducted to determine whether the test

44
agent reduced immobility developed in the “behavior despair” swimming test, a test of nonconditioned neurobehavioral performance. Concentration-related reductions in immobility during a 3-minute test were seen for all solvents; the percent decreases in immobility vs. exposure concentration for each agent (4–5 concentrations) were graphically depicted. The concentration of 1,2-DCE required for a 50% decrease in immobility (ID50) was 1,983 ppm (95% CI 1,708–2,309 ppm). Most of the solvents tested were considerably more effective than 1,2-DCE as inhibitors of immobility; only methyl ethyl ketone and 1,1,1-trichloroethane were less effective than 1,2-DCE. A good correlation (r = 0.93) between ID50 values and ACGIH (1981) occupational exposure standards for the chemicals tested was demonstrated.
Kallman and Balster (1983) studied disruption of reinforced operant behavior in groups of nine mice. The animals were trained to depress a lever, and the correct behavior was reinforced with sweetened milk. Mice were gavaged with daily doses of ≥100 mg/kg 1,2-DCE (isomer not stated) for 30 minutes after the daily operant session for a minimum period of 1 week. Doses of ≥300 mg/kg-day disrupted the reinforced operant behavior. Continued exposure at this level produced initial decreases with a gradual return to baseline performance within 2 days. This pattern was maintained at doses below the MTD (800 mg/kg-day). When 1,2-DCE exposure was terminated, the mice recovered their conditioned behavior within 15 days.
Taste aversion to saccharin induced by 1,2-DCE in male CD-1 mice was also reported by Kallman et al. (1983). In conditioning trials for a period of 7 days, groups of seven mice were accustomed to 30-minute sessions of drinking from two spouts that provided access to 0.3% sodium saccharin or deionized water. Five minutes after session completion, gavage doses of 30–2,000 mg/kg 1,2-DCE in 1:9 emulphor:water were administered. Twenty-four hours after the final conditioning treatment, the groups of mice were subjected to the 30-minute two-bottle choice test (saccharin vs. deionized water), with careful monitoring of fluid consumption of saccharin and water from the bottles. Doses of 300–2,000 mg/kg 1,2-DCE (but not lower concentrations of 30 and 100 mg/kg) significantly depressed consumption of sodium saccharin offered in the 30-minute preference test. The effective dose (ED50), the dose of 1,2-DCE that reduced saccharin solution consumption by 50%, was graphically determined to be 144.5 mg/kg. Intake of deionized water was also reduced when offered after daily gavage doses of 1,2-DCE, but was statistically significantly reduced only after a dose of 2,000 mg/kg. Other halogenated compounds, such as chloral, 1,1,2-trichloroethane, and 1,2-dichloroethane, were more potent than 1,2-DCE in inducing conditioned taste aversion. The threshold for behavioral effects of 1,2-DCE in these studies was about 100 mg/kg.
4.4.3. Immunological Studies 4.4.3.1. cis-1,2-DCE
No immunotoxicity studies of cis-1,2-DCE were located.
45
4.4.3.2. trans-1,2-DCE
In a short-term assessment of immunotoxicity, 4-week-old male CD-1 mice (10–12/group) with an average initial weight of approximately 30 g were gavaged with solutions of trans-1,2-DCE (0, 22, and 222 mg/kg, or 0, 1/100, and 1/10 the LD50) on 14 consecutive days (Munson et al., 1982). At necropsy, there were no significant effects on liver, spleen, lungs, thymus, kidney, or brain weights. Leukocyte counts for the experimental groups did not differ significantly from the untreated control group. Munson et al. (1982) evaluated humoral immune function as indicated by the ability of the spleen cells to produce IgM antibody-forming cells (AFCs) following challenge with sheep red blood cells (sRBCs). The authors reported the antibody response to sRBCs challenge on day 11 as the number of AFCs per spleen and per 106 spleen cells from animals killed 24 hours after the last treatment. A trend towards suppression of the number of AFCs expressed per spleen basis (significant at p < 0.1 level) was observed with trans-1,2-DCE; however, this response was not statistically significant at the p < 0.05 level or when expressed per 106 spleen cells. Munson et al. (1982) also assessed cell-mediated immune response as measured by the delayed-type hypersensitivity (DTH) response to sRBCs. The response was characterized as slight but significant (p < 0.05) and not dose-dependent in the abstract of the journal article. However, in the results section of the article, the authors stated that trans-1,2-DCE showed no effect in the DTH response. This contradictory presentation of the data between the abstract and results sections renders these study findings unreliable. It is unknown whether the slight reduction in DTH was associated with trans-1,2-DCE or trichloroethylene, another chemical tested in the study. The authors concluded that mice exposed to trans-1,2-DCE for 14 days at doses up to 222 mg/kg-day showed no significant change in cell-mediated or humoral immunity (Munson et al., 1982).
The immunotoxicity of trans-1,2-DCE was also investigated in studies in which three concentrations, 0.1, 1.0, and 2.0 mg/mL, were provided to male and female CD-1 mice (10 mice/group) in drinking water containing 1% emulphor (Barnes et al., 1985; Shopp et al., 1985). These drinking water concentrations were equivalent to doses of 17, 175, and 387 mg/kg-day in male mice and 23, 224, and 452 mg/kg-day in female mice. The study by Shopp et al. (1985) reported assays for effects of the test agent on the immune system, while Barnes et al. (1985) reported the study details and systemic toxicity findings.
In a preliminary 14-day study involving gavage exposure to the test agent at 0.1 or 1.0 mg/mL (21 or 210 mg/kg), Shopp et al. (1985) reported no statistically significant effects of trans-1,2-DCE on the humoral immune status of male mice as measured by the production of AFCs against sRBCs. Cell-mediated immune status, measured by the DTH response to sRBCs, was also unaffected in male mice dosed with trans-1,2-DCE for 14 days. Body weight was not affected in male or female mice at either dose of trans-1,2-DCE in the 14-day study.
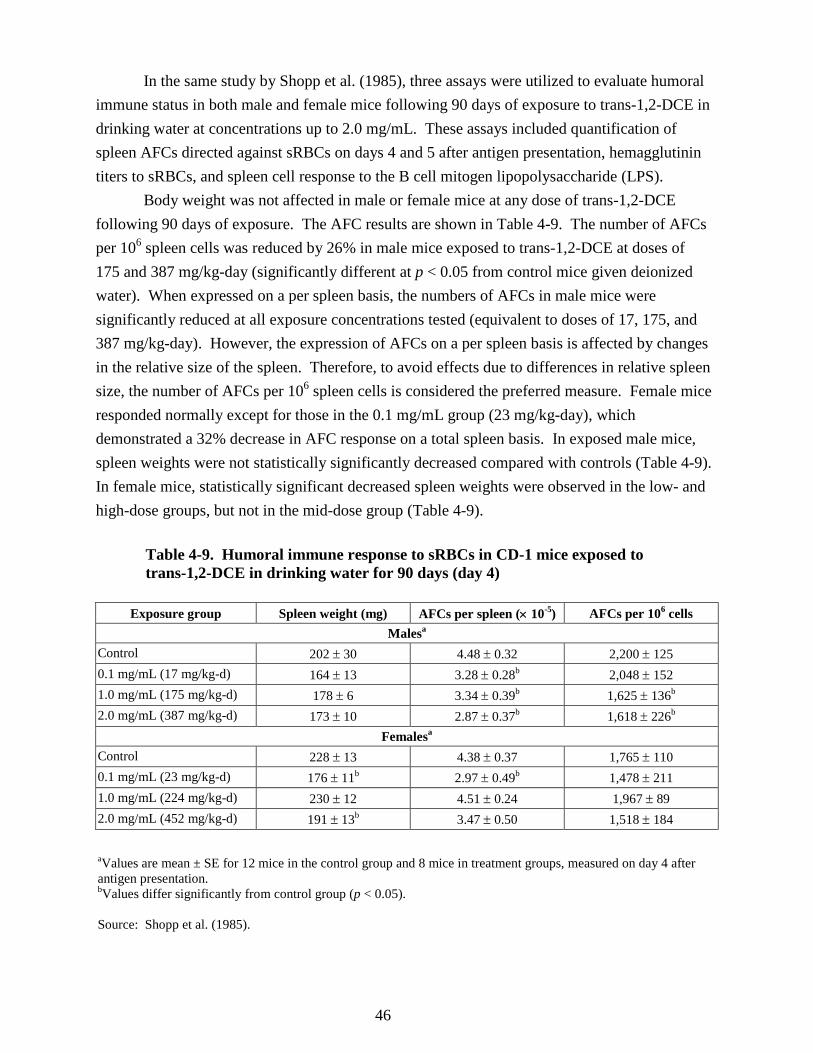
46
In the same study by Shopp et al. (1985), three assays were utilized to evaluate humoral immune status in both male and female mice following 90 days of exposure to trans-1,2-DCE in drinking water at concentrations up to 2.0 mg/mL. These assays included quantification of spleen AFCs directed against sRBCs on days 4 and 5 after antigen presentation, hemagglutinin titers to sRBCs, and spleen cell response to the B cell mitogen lipopolysaccharide (LPS).
Body weight was not affected in male or female mice at any dose of trans-1,2-DCE following 90 days of exposure. The AFC results are shown in Table 4-9. The number of AFCs per 106 spleen cells was reduced by 26% in male mice exposed to trans-1,2-DCE at doses of 175 and 387 mg/kg-day (significantly different at p < 0.05 from control mice given deionized water). When expressed on a per spleen basis, the numbers of AFCs in male mice were significantly reduced at all exposure concentrations tested (equivalent to doses of 17, 175, and 387 mg/kg-day). However, the expression of AFCs on a per spleen basis is affected by changes in the relative size of the spleen. Therefore, to avoid effects due to differences in relative spleen size, the number of AFCs per 106 spleen cells is considered the preferred measure. Female mice responded normally except for those in the 0.1 mg/mL group (23 mg/kg-day), which demonstrated a 32% decrease in AFC response on a total spleen basis. In exposed male mice, spleen weights were not statistically significantly decreased compared with controls (Table 4-9). In female mice, statistically significant decreased spleen weights were observed in the low- and high-dose groups, but not in the mid-dose group (Table 4-9).
Table 4-9. Humoral immune response to sRBCs in CD-1 mice exposed to trans-1,2-DCE in drinking water for 90 days (day 4)
Exposure group Spleen weight (mg) AFCs per spleen (× 10-5) AFCs per 106 cells Malesa
Control 202 ± 30 4.48 ± 0.32 2,200 ± 125 0.1 mg/mL (17 mg/kg-d) 164 ± 13 3.28 ± 0.28b 2,048 ± 152 1.0 mg/mL (175 mg/kg-d) 178 ± 6 3.34 ± 0.39b 1,625 ± 136b
2.0 mg/mL (387 mg/kg-d) 173 ± 10 2.87 ± 0.37b 1,618 ± 226b
Femalesa Control 228 ± 13 4.38 ± 0.37 1,765 ± 110 0.1 mg/mL (23 mg/kg-d) 176 ± 11b 2.97 ± 0.49b 1,478 ± 211 1.0 mg/mL (224 mg/kg-d) 230 ± 12 4.51 ± 0.24 1,967 ± 89
2.0 mg/mL (452 mg/kg-d) 191 ± 13b 3.47 ± 0.50 1,518 ± 184
aValues are mean ± SE for 12 mice in the control group and 8 mice in treatment groups, measured on day 4 after antigen presentation. bValues differ significantly from control group (p < 0.05). Source: Shopp et al. (1985).

47
Hemagglutinin titers in CD-1 mice exposed to trans-1,2-DCE at all dose levels were not significantly changed from control values. Spleen lymphocyte responsiveness to LPS was not altered in the males, but the female mice at the highest dose level demonstrated a statistically significantly enhanced spleen cell response to LPS.
Three assays were also used to evaluate the status of cellular immunity: (1) DTH response to sRBCs challenge, (2) popliteal lymph node proliferation in response to sRBCs, and (3) spleen cell response to concanavalin A (Con A). Male mice exposed to trans-1,2-DCE did not show changes in either the DTH or popliteal lymph node proliferation response to sRBCs, but females exposed to 1.0 mg/mL had a slight increase in the DTH response. No alterations in spleen lymphocyte response to Con A were noted. In addition, the ability of bone marrow cells from mice exposed to trans-1,2-DCE for 90 days to incorporate [125I]-labeled deoxyuridine was essentially unaffected by the treatments (Shopp et al., 1985).
In summary, repeated exposure of mice to trans-1,2-DCE in drinking water for 90 days had no effect on the cell-mediated immune status of either sex or on the humoral immune status of females. Shopp et al. (1985) concluded that there was marked suppression in humoral immune status in male mice and that the decrease in AFCs was significantly decreased in these mice. However, the authors also suggested that the decrease in AFCs was not severe enough to depress the functional ability of the humoral immune system because there was no change in hemagglutination titers to sRBCs or lymphoproliferative response of spleen cells to the B-cell mitogen LPS. Overall, the authors concluded that the immune system of CD-1 mice was not overly sensitive to the effects of trans-1,2-DCE and that the few effects that were seen were probably the result of general toxicity rather than specific target organ toxicity. Additional discussion of these study findings is given in Section 4.6.1.2.
Freundt et al. (1977) reported that inhalation exposure of female SPF Wistar rats to ≥200 ppm caused slight to severe fatty degeneration of Kupffer cells in the liver. In addition, decreased leukocyte counts were observed in rats exposed to 200 and 1,000 ppm trans-1,2-DCE for 8 hours, and pneumonic infiltration was observed in the lungs after exposure to 200 ppm for 8 and 16 weeks, suggesting that inhalation of the test agent may have immunological effects.
4.4.3.3. Mixtures of cis- and trans-1,2-DCE
No immunotoxicity studies of mixtures of cis- and trans-1,2-DCE were located.
4.4.4. Toxicity Studies by Other Routes 4.4.4.1. Intraperitoneal Injection 4.4.4.1.1. cis-1,2-DCE. In an acute hepatotoxicity study reported in a dissertation by McMillan (1986), cis-1,2-DCE was administrated by intraperitoneal injection (i.p.) at doses of 21 mmol/kg (2,039 mg/kg) and 26 mmol/kg (2,521 mg/kg) in sesame seed oil to six male Sprague-Dawley rats/dose, so that each rat received 4 mL/kg of body weight. The GSH levels and plasma enzyme

48
activities (ALT, AST, sorbitol dehydrogenase [SDH]), indicators of liver toxicity, were measured. The GSH and ALT activities were not significantly altered by either dose, but both plasma AST and SDH activities were statistically significantly elevated. For AST, both doses had more than a twofold increase over that seen in controls, while for SDH, there was at least a threefold increase when compared with the control.
In a study (Plaa and Larson, 1965) to obtain data regarding the relative nephrotoxic properties of a series of chlorinated methane, ethane, and ethylene derivatives in mice, kidney function was assessed for cis- and trans-1,2-DCE as well as other chlorinated derivatives by measurement of the excretion of phenolsulfonephthalein (PSP) and by the use of an indicator strip to measure protein and glucose in the urine. In addition to these tests of kidney function, kidney sections were examined histologically. For evaluating cis-1,2-DCE’s potential for nephrotoxicity, doses of 0.1 (10 mice), 1.0 (10 mice), and 2.0 mL/kg (6 mice) were dissolved in corn oil and administered i.p. The results show that cis-1,2-DCE failed to cause renal dysfunction. None of the mice examined histologically showed necrosis or swelling.
4.4.4.1.2. trans-1,2-DCE. An LD50 test was performed by Freundt et al. (1977) in which mature female SPF Wistar rats and mature female NMRI mice were exposed to trans-1,2-DCE via the i.p. route. The LD50 was reported to be 6.0 mL/kg (95% CI 5.1–7.1 mL/kg) (7,680 mg/kg) for the rats. The LD50 for mice was 3.2 mL/kg (95% CI 2.8–3.7 mL/kg) (4,096 mg/kg). The mouse was more sensitive to the effects of trans-1,2-DCE than the rat after i.p. dosage, whereas the rat appears to be more sensitive to trans-1,2-DCE given orally (rat oral LD50 = 1,280 mg/kg; mouse LD50 = 2,122–2,391 mg/kg, see Section 4.4.1.1.2). The postmortem gross pathology in the mice after administration of trans-1,2-DCE showed hyperemia involving the liver, kidneys, urinary bladder, and intestines. The number of dead mice ranged from 1/10 to 10/10 per dose group. Clinical signs of toxicity were not reported for mice. In one rat, gross pathology included pulmonary capillary hyperemia and alveolar septal distention and fibrous swelling and hyperemia with incipient disorganization of the cardiac muscle.
The LD50 for trans-1,2-DCE in female OF1 mice via i.p. injection was reported by Gradiski et al. (1978) to be 2,940 mg/kg.
In an acute hepatotoxicity study reported in a dissertation by McMillan (1986), trans-1,2-DCE was administered i.p. at doses of 20 mmol/kg (1,939 mg/kg-day) and 25 mmol/kg (2,424 mg/kg) in sesame oil (4 mL/kg) to male Sprague-Dawley rats (6/group). The results of this set of experiments show that trans-1,2-DCE administered i.p. depressed GSH content (statistically significant) at the 2,424 mg/kg dose and increased plasma AST and SDH activities in a dose-related (although not statistically significant) manner. Plasma ALT activity was unchanged. The effects of trans-1,2-DCE on GSH content and plasma ALT, AST, and SDH activities with respect to time were also examined. Two groups of 30 male rats each were used; one group was the control and the other group was treated i.p. with trans-1,2-DCE. At time
49
intervals of 2, 4, 8, 12, 24, and 48 hours, five animals from each group were killed. Blood was collected for plasma enzyme determination and livers were removed for GSH analysis. SDH activity was maximally elevated (fivefold) at 4 hours after administration of trans-1,2-DCE and remained elevated. AST activity was elevated over the entire time course (fivefold greater than the control at the maximally elevated point at 4 hours), while ALT activity was elevated over control levels for the first 8 hours of the study (fivefold greater than the control at the maximally elevated point of 4 hours). Histopathological results of slight to moderate necrosis show that the greatest potential hepatotoxicity occurred at 4 and 8 hours. The effects of the trans- isomer were maximal at 4 hours after administration, using plasma enzyme elevations as the indicator of toxicity. Glutathione depression occurred between 4 and 8 hours after administration. It is important to note that all of the parameters measured, with the exception of AST activity, returned to near control levels by 12 hours (i.e., the effects were not sustained). The histopathological results indicated the same time course.
Nakahama et al. (2000) treated 7-week-old Wistar rats (sex not stated) with 0.5 g/kg cis- or trans-1,2-DCE with or without co-treatment with phenobarbital (80 mg/kg). Animals were sacrificed 24 hours after treatment, and body weights as well as relative liver and lung weights (as compared to body weight) were measured. Cis-1,2-DCE caused a small but statistically significant decrease in body weight gain. Both isomers caused increases (although not statistically significant) in relative liver weights. Lung weights were not affected. Pretreatment with phenobarbital had no noteworthy effect on these observations.
4.4.4.2. Dermal Application
In dermal toxicity studies (Brock, 1990; DuPont, 1988b), a single dose of 5,000 mg/kg trans-1,2-DCE was applied onto the clipped, intact skin of two male and three female New Zealand white rabbits under an occlusive wrapping. At the end of a 24-hour exposure period, the test material was removed. Test rabbits were examined for clinical signs of toxicity and mortality for 14 days after treatment. No animals died, but signs of severe skin irritation remained throughout the observation period. Mild-to-severe erythema and no-to-severe edema, necrosis, and fissuring of the skin with raw areas and epidermal scaling were observed. Body weight losses of up to 3% of initial weight were observed in three rabbits 1 day following treatment. Under conditions of the assay, the dermal LD50 was >5,000 mg/kg body weight. 4.4.4.3. Eye Irritation
Brock (1990) reported results of an irritation test with trans-1,2-DCE (99.64% pure) that was conducted at DuPont (1988c). The test agent (0.01 mL) was instilled into the lower conjunctival sac of two female New Zealand white rabbits. Twenty seconds later, the eyes of one rabbit were washed with lukewarm tap water, while the eye of the other rabbit remained unwashed. Eyes were scored for irritation at 1 and 4 hours and after 1, 2, and 3 days. Severe

50
corneal opacity was observed in the washed eye, and moderate iritis and conjunctivitis were observed in both the washed and unwashed treated eyes. Copious blood-tinged discharge was seen in both treated eyes, with moderate and mild chemosis in the washed eye and unwashed eye, respectively. The maximum Draize score was 17/110 for the unwashed eye and 41/110 for the washed eye. Fluorescein stain examinations were positive for corneal opacity in the washed eye and negative in the unwashed eye. Three days after treatment, the eyes of both rabbits had returned to normal. Under conditions of the study, trans-1,2-DCE was a severe eye irritant.
Moderate pain and conjunctivitis were reported after 1,2-DCE (isomer not stated) was administered to the eyes of rabbits (Dow, 1960). Some of the eyes were washed after administration. Reactions to the test agent had not completely subsided 1 week after dosing. 4.4.4.4. Skin Irritation
Brock (1990) reported results of a skin irritation test with trans-1,2-DCE (99.64% pure) conducted at DuPont (1988d). The test agent, 0.5 mL, was applied onto the clipped, intact skin of one female and five male New Zealand white rabbits under an occlusive wrapping. At the end of a 24-hour exposure period, the material was removed. The site of application was scored for irritation at 24, 48, and 72 hours posttreatment. Mild or moderate erythema was observed at all observation times. Under conditions of the study, trans-1,2-DCE was a moderate skin irritant.
In skin irritation studies, 1,2-DCE mixture was applied undiluted 10 times to the intact skin of ears of white rabbits (Dow, 1960). Essentially no irritation was reported following the first eight applications, but slight hyperemia was observed thereafter. The ears of the rabbits appeared normal 21 days after cessation of treatments. Four applications of undiluted 1,2-DCE to the intact belly skin of rabbits caused slight to moderate hyperemia. Slight edema and moderate necrosis of the skin appeared after the third and fourth applications. Undiluted 1,2-DCE was also applied twice to the abraded belly of rabbits. Slight to moderate hyperemia and edema with slight necrosis occurred after the first application, and moderate edema and necrosis were seen after the second application. Slight exfoliation, scabs, and scars were seen 21 days after treatments.
4.5. MECHANISTIC DATA AND OTHER STUDIES IN SUPPORT OF THE MODE OF ACTION 4.5.1. Hepatotoxicity Studies
Trans-1,2-DCE (20 mmol [1,940 mg]/kg i.p.) depressed liver aniline hydroxylation (AH), ethylmorphine N-demethylation (EN-D), and CYP450 content, but no effect was seen on NADPH:cytochrome c reductase activity (McMillan, 1986). Administration of phenobarbital with trans-1,2-DCE caused a further depression of all parameters except CYP450. Treatment with β-naphthoflavone and trans-1,2-DCE elevated AH and CYP450 levels but slightly depressed NADPH:cytochrome c reductase activity. When given prior or subsequent to

51
trans-1,2-DCE, SKF-525A had a cumulative depressive effect on all parameters except NADPH:cytochrome c reductase activity. According to McMillan (1986), these data indicate an enhanced depressive effect of trans-1,2-DCE plus phenobarbital with respect to aniline hydroxylase and EN-D activity. The author also concluded that, with respect to CYP450 and cytochrome c reductase, exposure to phenobarbital plus trans-1,2-DCE partially alleviated the depression seen in these parameters with trans-1,2-DCE treatment only.
Freundt and Macholz (1978) exposed adult female Wistar rats (10/group) to single 8-hour inhalation exposures of cis- or trans-1,2-DCE and evaluated hexobarbital sleeping time, zoxazolamine paralysis time, and formation of 4-aminoantipyrine (AAP) from aminopyrine. Exposure levels of 0, 200, 600, or 1,000 ppm (0, 792, 2,380, or 3,960 mg/m3) of either isomer resulted in statistically significant, concentration-related increases in hexobarbital sleeping time and zoxazolamine paralysis time at all exposure levels, with the exception of the zoxazolamine paralysis time for rats exposed to the trans- isomer at 200 ppm. The cis- isomer was the more potent of the two isomers at every exposure level. Inhalation of cis- and trans-1,2-DCE for 8 hours also caused a statistically significant, exposure-dependent inhibition of renal excretion of AAP after gavage administration of 20 mg aminopyrine immediately following the exposures. The cis- isomer was also the more potent isomer in this experiment. The 1,2-DCE-induced effect was reversible by 6 hours after termination of exposures. These experiments indicated that phase I oxidative metabolism of hexobarbital, zoxazolamine, and aminopyrine was inhibited by exposures to either isomer of 1,2-DCE; the lowest-observed-adverse-effect level (LOAEL) was 200 ppm (792 mg/m3). The dose received by these rats was estimated to be 198 mg/kg, based on a conversion factor of 3.96 mg/m3 per ppm, 0.30 m3/day breathing rate for adult female rats weighing 0.2 kg, and 8 hours/day of exposure with an estimated net inhalation retention of 50%. N-acetylation of AAP and O-glucuronidation of 4-hydroxyantipyrine were not affected by an 8-hour exposure of rats to 1,000 ppm trans-1,2-DCE, indicating that phase II enzymes are considerably less sensitive to induction or inhibition by 1,2-DCE. In in vitro studies, N-demethylation of aminopyrine and O-demethylation of p-nitroanisole were competitively inhibited by addition of trans-1,2-DCE to a reaction mixture containing liver microsomes from untreated rats (Freundt and Macholz, 1978). On the basis of these findings, the authors concluded that 1,2-DCE competed for the type I binding site of CYP450.
Jenkins et al. (1972) evaluated the effects of cis- and trans-1,2-DCE on enzyme activities in liver and plasma of adult male Holtzman rats. Twenty hours after administration of 400 or 1,500 mg/kg (4.1 or 15.5 mmol/kg) cis- or trans-1,2-DCE in corn oil by gavage (2 mL/kg) to 3–4 rats/group, liver glucose-6-phosphatase (G-6-Pase), ALP, and tyrosine transaminase activities were statistically significantly increased by the cis- isomer; with the exception of G-6-Pase activity in animals receiving 400 mg/kg, these enzyme activities were not significantly elevated after treatment with trans-1,2-DCE. In most instances, plasma ALP and ALT activities did not

52
differ significantly from controls after treatment with either isomer. The authors concluded that the cis- isomer caused a slightly greater biochemical response than the trans- isomer.
Moore (1978), in an abstract, reported that administration of 0.1–1 mL/kg 1,2-DCE (isomer not stated) to rats (strain not given) inhibited the hepatic microsomal calcium pump 24 hours after treatment in a dose-dependent manner by up to 70% at the highest dose. This finding is of some interest in light of several other studies that reported increases in blood calcium levels following 1,2-DCE treatment (McCauley et al., 1995; McMillan, 1986; Barnes et al., 1985).
Sipes and Gandolfi (1980) used uninduced and phenobarbital-, 3-methylcholanthrene-, or Aroclor 1254-induced rat liver microsomes to demonstrate that several halogenated hydrocarbons, including 1,2-DCE (isomer not stated), bind covalently to protein and lipid, and that binding was increased up to eightfold when induced microsomes were used. However, 1,2-DCE displayed low protein and lipid binding compared with halogenated methanes and ethanes. Furthermore, these authors could not demonstrate any DNA binding with 1,2-DCE, even when phenobarbital-induced microsomal preparations were used, while all other compounds tested positive for this characteristic. The lowest DNA-binding activities were observed with dichloromethane, iodomethane, 1,2-dichloroethane, and 1,1,1-trichloroethane, while the highest activities came from 1,2-dibromoethane, bromotrichloromethane, chloroform, and carbon tetrachloride (Sipes and Gandolfi, 1980). 4.5.2. Nephrotoxicity Studies
The degree of nephrotoxicity elicited by cis- or trans-1,2-DCE administered i.p. to male Swiss mice was evaluated by monitoring urinary excretion of PSP and by detection of urinary protein and glucose excretion with indicator strips (Plaa and Larson, 1965). The chemicals were dissolved in corn oil and administered to 10 mice/dose at doses of 0.1, 1.0, or 2.0 mL/kg (128, 1,280, and 2,560 mg/kg) and 1.0, 2.0, or 4.0 mL/kg (1,280, 2,560, and 5,120 mg/kg) for the cis- and trans- isomer, respectively. Surviving mice in the treatment groups where lethality occurred exhibited a delay in excretion (<40% excreted within 2 hours) of the administered dose of 1 mg/kg PSP, while normal untreated mice excreted 67% of the administered dose within 2 hours. Mice in dose groups where no animals died exhibited normal urinary excretion of PSP. Urine was collected from mice surviving 24 hours for evaluation of excretion of protein and glucose. An increased occurrence of urinary excretion of protein (≥100 mg/100 mL) in high-dose animals (Table 4-10) was observed with both isomers. There was no detectable amount of glucose in 60 control mice, and no detectable protein in 32 of the controls; 23 controls exhibited trace amounts of protein and 5 contained 30 mg. Histologic examination of kidneys of mice treated with 1.0 mL/kg cis-1,2-DCE or 2.0 mL/kg trans-1,2-DCE failed to reveal proximal convoluted tubule necrosis or swelling.

53
Table 4-10. Effect of 1,2-DCE isomers on urinary protein and glucose 24 hours after i.p. treatment of male Swiss mice
Agent Dose (mL/kg) Number of mice
testeda Number of mice with
urinary proteinb cis-1,2-DCE 0.1 10 2
1.0 10 2 2.0 6 3
trans-1,2-DCE 1.0 10 0 2.0 10 1 4.0 5 3
aEach group originally contained 10 mice; at the high dose, only survivors were tested. bSignificant urinary protein excretion if ≥100 mg/100 mL. Source: Plaa and Larson (1965).
4.5.3. Studies with Cell Cultures
Mochida et al. (1995) used cultured human oral carcinoma cells (KB cells) to compare the toxicity of cis- and trans-1,2-DCE. Cells were exposed to various concentrations of the test agent for 72 hours. On the basis of cell counts, the 72-hour-ID50 value (which represents 50% inhibitory dose to growth of cells) was determined to be 3,900 µg/mL culture medium for the trans- isomer and 5,800 µg/mL culture medium for the cis- isomer. No explanation for the relative toxicity of the two isomers in KB cells was provided. Isomers of 1,2-DCE were considerably less toxic to KB cells than other chlorinated organic compounds that are common contaminants in groundwater. It is noted that these ID50 values are in the range of the solubility limits for these isomers.
The cytotoxicity of cis-1,2-DCE to isolated rat hepatocytes was reported by Suzuki et al. (1994). Hepatocyte cultures were incubated for 2 hours in Eagle’s medium, containing 10% calf serum and 10 mM cis-1,2-DCE. No effect was seen on release of LDH or formation of thiobarbituric acid-reactive substances (TBARS). Extracted cellular lipids from hepatocytes exposed to cis-1,2-DCE did not show significant increases in phospholipid hydroperoxides, in contrast to cells exposed to carbon tetrachloride, 1,1,1-trichloroethane, and 1,3-dichloropropene. Thus, no indication of cis-1,2-DCE-induced lipid peroxidation in hepatocyte membranes was seen at the dose level tested.
No effect of trans-1,2-DCE on lipid peroxidation, measured as TBARS, was observed in cultured bovine pulmonary arterial endothelial cells or rabbit aortic smooth muscle cells (Tse et al., 1988). However, lipid peroxidation was seen in the presence of 2% (volume/volume) trans-1,2-DCE in Medium 199 supplemented with 10–20% fetal calf serum in the presence of extracellular Fe(III)ADP (6.2 µM), suggesting that a synergistic interaction between iron and the test agent may occur (Tse et al., 1990).
54
4.5.4. Genotoxicity
A number of studies have evaluated the genotoxicity of cis- and trans-1,2-DCE as individual isomers and as a mixture of both. In vitro studies include tests in prokaryotic organisms such as Salmonella typhimurium (Ames assay) and Escherichia coli, and eukaryotic organisms including Saccharomyces cerevisiae and Aspergillus nidulans. Genotoxic effects of 1,2-DCE have also been studied in Chinese hamster cells and human lymphocytes in vitro. Further, in vivo studies have been conducted in the host-mediated assay, micronucleus test in mice, and mitotic recombination in Drosophila melanogaster. 4.5.4.1. In Vitro Studies
Gene mutation studies in S. typhimurium and E. coli using cis- or trans-1,2-DCE or a mixture of both isomers were mainly nonpositive (Mersch-Sundermann, 1989; Mersch-Sundermann et al., 1989; Zeiger et al., 1988; Calandra et al., 1987; Strobel and Grummt, 1987; Mortelmans et al., 1986; Nohmi et al., 1985; Cerna and Kypenova, 1977; Greim et al., 1977, 1975; Simmon et al., 1977). However, Mersch-Sundermann (1989) reported positive results in a Salmonella strain, TA98, for the trans- isomer with or without metabolic activation by S9. Nonpositive results were reported in the same study for the cis- isomer with or without metabolic activation.
Strobel and Grummt (1987) tested trans-1,2-DCE at concentrations of 0.01–1 mg/plate in Salmonella strains TA97, TA98, TA100, and TA104. Although there were increases in the number of revertants in some strains (TA97, TA100), they were not dose-dependent. Up to a 5.5-fold increase in revertant numbers was observed in strain TA97. 1,2-DCE did not have any effect on strains TA97 or TA98 in the absence of S9. However, in the presence of S9, TA97 showed a maximum (5.5-fold) response at doses 0.025 and 0.25 mg/plate. Furthermore, even at the lowest concentration (0.01 mg/plate), a fivefold increase in revertants was observed. In the case of strain TA98, an approximate twofold increase in revertants at 1 mg/plate was observed compared with the control. Strain TA100 displayed up to a 2.5-fold increase in revertants at different doses both in the absence and presence of S9. Exposure of 1,2-DCE to the TA104 strain resulted in an increase in the number of revertants both in the absence and presence of S9; however, the response was not dose-dependent. Since many strains had responses, even at the lowest concentrations, that were close to the maximum (TA97 and TA98, +S9; TA104, +S9 and –S9), the results are difficult to interpret. The authors offered no discussion or rationale for the high revertant rates that occurred at the low concentrations. Cerna and Kypenova (1977) similarly reported decreasing number of revertants with increasing concentrations of DCE. However, these concentrations were lower than in assays that measured similar gene reversions and, therefore, it is unlikely that these concentrations were causing cell toxicity.
55
Studies in yeast, using the diploid S. cerevisiae strain D7 for gene conversion, reverse mutation, or mitotic recombination, were mostly nonpositive for cis- and trans-1,2-DCE (Koch et al., 1988; Galli et al., 1982; Bronzetti et al., 1981; Simmon et al., 1977). However, Bronzetti et al. (1984) reported positive results in S. cerevisiae D7 for both isomers with metabolic activation and for the cis- isomer only without metabolic activation. In addition, a positive result was reported by Koch et al. (1988) for aneuploidy in S. cerevisiae D61.M with the trans- isomer with or without metabolic activation. However, Koch et al. (1988) cautioned that the effect noted in the D61.M strain could have been intensified due to the long incubation period required with this strain, and storage of the test tubes in an ice bath during part of the incubation period. Positive results were also seen for aneuploidy and mitotic segregation in A. nidulans diploid strain P1 exposed to a mixture of both isomers (Crebelli et al., 1992; Crebelli and Carere, 1987). No chromosomal aberrations or sister chromatid exchanges were reported in Chinese hamster cells for either cis- or trans-1,2-DCE (Sawada et al., 1987; Sofuni et al., 1985). However, Doherty et al. (1996) investigated the activation and deactivation of chlorinated hydrocarbons, including 1,2-DCE, in metabolically competent human cells. The authors used human lymphoblastoid AHH-1 (containing native CYP1A1 activity), MCL-5 (stably expressing human CYP1A2, 2A6, 3A4, 2E1, and microsomal epoxide hydrolase), and h2E1 (containing cDNA for CYP2E1) cell lines. 1,2-DCE produced an increase in micronuclei at concentrations between 0 and 10 mM in the AHH-1 and h2E1 cell lines. The micronuclei contained approximately equal frequencies of both kinetochore-positive and kinetochore-negative signals. At concentrations ≤10 mM, no increase in micronuclei was observed in the MCL-5 cell line.
Tafazoli and Kirsch-Volders (1996) compared the cytototoxic, genotoxic, and mutagenic activity of a number of chlorinated aliphatic hydrocarbons including 1,2-DCE. The mutagenicity and cytotoxicity of 1,2-DCE was evaluated in an in vitro micronucleus assay using human lymphocytes in the presence or absence of S9. A low but positive response (p < 0.05) was obtained at the 20 mM concentration both with and without S9. The authors stated that this increase was not accompanied by a substantial decrease in cell proliferation. In addition to the micronucleus assay, a comet assay was employed to examine the capacity of 1,2-DCE to induce DNA damage in in vitro isolated human lymphocytes. Positive responses for tail length were found at 6 and 8 mM (p < 0.01) and for tail movement at 2 mM (p < 0.01) with S9. A summary of the in vitro genetic toxicology studies is presented in Table 4-11.

56
Table 4-11. In vitro genotoxicity studies using cis- and trans-1,2-DCE
Test system Strain/ cell line
Result Dose/plate Compound Effect Reference –S9 +S9
Bacterial systems S. typhimurium
TA98 TA100 TA1535 TA1538 TA1950 TA1951 TA1952
– NT 0.5–50 µL cis-, trans- Reverse mutation
Cerna and Kypenova, 1977
TA1535 TA1538
– – NA cis-, trans- Reverse mutation
Greim et al., 1977
TA98 TA100 TA1535 TA1537 TA1538
– NT Up to 5 mg cis-, trans- Reverse mutation
Simmon et al., 1977
TA98 TA100 TA1535 TA1537
– –
– –
33–5,555 µg 101–104 µg
mixture trans-
Reverse mutation
Mortelmans et al., 1986
TA97 TA98 TA1535 TA1537
– – 33–10,000 µg cis- Reverse mutation
Zeiger et al., 1988
TA97a TA98 TA100 TA102
NT – NA trans- Reverse mutation
Calandra et al., 1987
TA97 TA98 TA100
– – NA cis- Reverse mutation
Mersch-Sundermann, 1989
TA97 TA98 TA100
– + +
– + +
NA trans- Reverse mutation
Mersch-Sundermann, 1989
TA97 TA98 TA100 TA104
– – + +?
+?a +? + +?
0.01–1.0 mg trans- Reverse mutation
Strobel and Grummt, 1987
TA87 TA98 TA100 TA102
– – 1.0–50 mg cis- Reverse mutation
Nohmi et al., 1985
E. coli K12 – – 2.9 mM 2.3 mM
cis- trans-
DNA damage Greim et al., 1977, 1975
PQ37 – – NA cis-, trans- Mersch-
Sundermann et al., 1989

57
Table 4-11. In vitro genotoxicity studies using cis- and trans-1,2-DCE
Test system Strain/ cell line
Result Dose/plate Compound Effect Reference –S9 +S9
S. cerevisiae D7 – NA 100 mM cis-, trans- Gene conversion, reverse mutation, or mitotic recombination
Bronzetti et al., 1981
D7 +
–
+
+
100 mM 40 mM 100 mM 80 mM
cis- trans-
Bronzetti et al., 1984
D7 – – 100 mM cis-, trans- Galli et al., 1982
D3 – NT Up to 0.2 mL cis-, trans- Simmon et al., 1977
D7 – – 77.3 mM trans- Koch et al., 1988
D61.M + + 77.3 mM trans- Aneuploidy Koch et al., 1988
A. nidulans Diploid P1 –
+
NT 1–2.5 mL in 20 L (24-hr vapor)
mixtureb Mitotic recombination, mutation Aneuploidy
Crebelli and Carere, 1987
Diploid P1 + NT 0.05–0.175% (v/v)
mixture Mitotic segregation
Crebelli et al., 1992
Mammalian cells Chinese hamster CHL – – 7.5 mg/mL cis- Chromosomal
aberrations Sofuni et al., 1985
V79 lung + NT 6.5 × 10⁻³ M trans- c–Mitosis, aneuploidy
Önfelt, 1987
CHL – – 2.0 mg/mL cis-, trans- Chromosomal aberrations, sister chromatid exchange
Sawada et al., 1987
CHO ND –
? ?
160–5,000 µg/mL
cis- trans-
Sister chromatid exchange
Galloway et al., 1987 (as cited in NTP, 2002a)
CHO + + 126–12,630 µg/mL
mixture Galloway et al., 1987 (as cited in NTP, 2002a)
CHO –
–
500–5,000 1,600–5,000 455–12,630 (µg/mL)
cis- trans- mixture
Chromosomal aberrations
Galloway et al., 1987 (as cited in NTP, 2002a)

58
Table 4-11. In vitro genotoxicity studies using cis- and trans-1,2-DCE
Test system Strain/ cell line
Result Dose/plate Compound Effect Reference –S9 +S9
Human lymphoblastoid
AHH-1 h2E1 MCL-5
+ + –
NT 2.5 mM 2.5 mM 10 mM
mixture Micronucleus assay
Doherty et al., 1996
Human lymphocytes
+ + 20 mM mixture Micronucleus assay
Tafazoli and Kirsch-Volders, 1996
+ + 6 mM 4 mM
mixture Comet assay, DNA breakage
Tafazoli and Kirsch-Volders, 1996
aIncrease in revertants in mid-dose range, decrease at high doses; poor dose response (see text). bAuthors state CASRN for mixture, but chemical name is given as 1,2-dichloroethane. + = positive; – = nonpositive; ? = inconclusive; CHL = Chinese hamster lung; CHO = Chinese hamster ovary; NT = not tested; NA = not available
4.5.4.2. In Vivo Studies
In the host-mediated assay in mice, Cerna and Kypenova (1977) reported an increase in mutation and chromosomal aberrations for cis-1,2-DCE, with no increase noted for trans-1,2-DCE. Also, in a similar host-mediated assay, Bronzetti et al. (1984) reported positive results for the cis- isomer and nonpositive results for the trans- isomer. No increase in micronucleus induction was reported in the bone marrow of CD-1 mice exposed by i.p. injection to a mixture of the cis- and trans- isomers (Crebelli et al., 1999). Since none of the 10 halogenated aliphatic hydrocarbons studied (including 1,2-DCE) showed any evidence of micronucleus induction, the authors concluded that the in vivo mouse bone marrow test may not be sensitive enough to detect the genotoxic effects of this group of compounds. However, an increase in mitotic recombination was observed in Drosophila larvae exposed to the vapors of a mixture of both isomers at 2,000 ppm (Vogel and Nivard, 1993). See Table 4-12 for a summary of the in vivo genetic toxicology studies using cis- and trans-1,2-DCE.

59
Table 4-12. In vivo genotoxicity studies using cis- and trans-1,2-DCE
Test system Strain/cells Result Dose (LED/HID) Compound Effect Reference Host: mouse; S. cerevisiae
CD D7
– 3,000 mg/kg cis-, trans- Host-mediated assay
Bronzetti et al., 1981
+ –
1,300 mg/kg cis- trans-
Bronzetti et al., 1984
Host: mouse; S. typhimurium
ICR TA1950 TA1951 TA1952
+
–
½, 1 LD50 (i.p.)
cis- trans-
Cerna and Kypenova, 1977
Mouse, female Bone marrow + –
5 × 1/6 LD50 (i.p.)
cis- trans-
Chromosomal aberrations
Cerna and Kypenova, 1977
Mouse, male – 500–2,000 mg/kg cis-, trans- Tice et al., 1987 (as cited in NTP, 2002a)
Mouse, male and female
Peripheral erythrocytes
– 280–490 mg/kg (i.p.)
mixture Micronucleus test
Crebelli et al., 1999
Mouse, male and female
– 3,125–50,000 ppm in feed for 14 wks
trans- MacGregor et al., 1990
Mouse, male Bone marrow – 500–2,000 mg/kg cis-, trans- Sister chromatid exchange
Tice et al., 1987 (as cited in NTP, 2002a)
D. melanogaster larvae
Cross of y × w
+ 2,000 ppm (vapor) mixture Eye mosaic assay
Vogel and Nivard, 1993
+ = Positive; – = nonpositive; HID = highest ineffective dose; LED = lowest effective dose
In conclusion, both cis- and trans-1,2-DCE have been evaluated for genotoxicity and mutagenicity using various in vitro and in vivo assays in both nonmammalian and mammalian systems. Most gene mutation assays both in S. typhimurium strains and E. coli were nonpositive as a result of exposure to 1,2-DCE. Studies in yeast, using the diploid S. cerevisiae strain for gene conversion, reverse mutation, or mitotic recombination, were also mostly nonpositive for cis- and trans-1,2-DCE. No chromosomal aberrations or sister chromatid exchanges were reported in Chinese hamster cells when exposed to either isomer of 1,2-DCE; however, micronucleus formation was observed in human lymphocytes. Overall, data for 1,2-DCE are generally nonpositive for genotoxicity and mutagenicity. The positive studies are inconsistent and need further confirmation.
4.5.5. Quantitative Structure-Activity Relationship (QSAR) Studies
Greim et al. (1975) used a number of chlorinated ethylenes in an E. coli mutation assay with metabolic activation by S9. They observed that ethylenes with an asymmetric arrangement of the chlorines across the double bond were mutagenic (vinyl chloride > trichloroethylene > 1,1-DCE), while those with a symmetric arrangement (tetrachloroethylene, cis- and
60
trans-1,2-DCE) were not. No mutagenic activity was observed in any test in the absence of S9. Greim et al. (1975) explained this finding on the basis of likely differences in the chemical stabilities of the respective oxiranes that were formed by S9. Jones and Mackrodt (1982) developed a theoretical model for oxirane reactivity, specifically targeting the energy required to split the weaker of the two C–O bonds in the oxirane ring. They compared these energies to the mutational potencies observed by Greim et al. (1975) and confirmed the C–O bond split energy to be a good predictor of mutational potency. In a correlation of mutagenic potency vs. C–O bond split energy, there was a region of no mutational potency with decreasing bond strength, and both cis- and trans-1,2-DCE fell within that portion of the curve. There followed a region where mutational potency increased strongly with decreasing bond strength (trichloroethylene; maximal potency with chloroethylene) but then turned and decreased with decreasing bond strength; this part of the curve was represented by 1,1-DCE. In a subsequent paper, Jones and Mackrodt (1983) included carcinogenicity data for several halogenated ethylenes in their calculations and found that carcinogenicity and mutagenicity data formed almost overlapping bell-shaped curves when correlated with C–O bond split energy.
Loew et al. (1983) used a molecular orbital method to evaluate the carcinogenic potencies of chloroethylenes, including cis- and trans-1,2-DCE. They proposed that CYP450 metabolism of the parent compound results in an initial radical intermediate from which either epoxides or reactive carbonyl compounds could be formed, suggesting three possible alternate pathways of toxic activation. The authors considered the carbonyl compound (i.e., the acyl chloride or aldehyde) rather than the epoxide to be the ultimate carcinogen in a genotoxic (DNA adduct formation) or epigenetic (macromolecule alkylation and necrosis) process. Their findings indicated that the amount of reactive carbonyl compound formed by metabolism, rather than its electrophilic reactivity, was a determinant of carcinogenic potency. For the purpose of their evaluations, they assumed that carbonyl compounds were formed by both the radical and the epoxidation pathway and that the protonated forms of the epoxides could also act as the ultimate carcinogens.
Loew et al. (1983) used three parameters as molecular indicators of carcinogenic potency: the activation energy required to create a reactive intermediate in all three alternate pathways; the electrophilic potency of the putative active carcinogen to form a covalent bond; and its long-range electrostatic interactions. They used the “Modified Neglect of Diatomic Overlap” method in their calculations. Activation energy turned out to be a useful predictor only for compounds with few chlorine substituents, and predictions became increasingly inaccurate with increasing degree of chlorination. Electrophilicity turned out to be unsuitable as a predictor of carcinogenicity. Assuming the carbonyl compounds to be the ultimate carcinogen, the authors proposed a carcinogenicity ranking of vinyl chloride = 1,1-DCE > 1,2-DCE > tetrachloro-ethylene > trichloroethylene. Assuming the epoxide carbocation as the ultimate carcinogen, the authors proposed a similar ranking in which 1,2-DCE was placed tentatively in the same
61
position. Vinyl chloride is a confirmed human and animal carcinogen; the other compounds, with the exception of 1,2-DCE, are all animal carcinogens without evidence of carcinogenicity in humans. The approach and ranking, as proposed by Loew et al. (1983), are therefore of limited use. In the evaluation of Jones and Mackrodt (1983), vinyl chloride was listed as about 100 times as potent a carcinogen as 1,1-DCE, with no oncogenicity attributed to 1,2-DCE.
Crebelli et al. (1995) evaluated a set of 55 halogenated hydrocarbons for their ability to induce mitotic chromosome malsegregation, mitotic arrest, and lethality in A. nidulans. The 1,2-DCE isomer mixture was about one-half as potent in inducing malsegregation as 1,1-DCE but only slightly less potent in inducing growth arrest. The most potent malsegregation inducers in this test were 1,1,1-trichloropropene and 1,1,2,2-tetrabromoethane, with more than 20 times the potency of 1,2-DCE. Tetrabromomethane was about 2,500 times more effective in arresting A. nidulans growth than 1,2-DCE. The QSAR evaluations did not include 1,2-DCE; although the authors reported high correlation coefficients between measured and calculated values for 20 compounds that were subjected to QSAR, a visual inspection of the values for individual compounds was not convincing.
Liu et al. (1997) used the computer software MultiCASE (designed to identify as yet unknown portions in a chemical structure that confer specific reactivity) to evaluate 93 chemicals, including trans-1,2-DCE and several mono-, tri-, or tetrachlorinated alkanes and alkenes that had been tested experimentally for their ability to induce chromosome malsegregation in S. cerevisiae. A subset of the NTP Salmonella mutagenicity database was used for comparison. They identified the trans-1,2-DCE structure and the vinylidene chloride portion of the tetrachloroethylene structure as having activity in the malsegregation assay.
Cronin (1996) used the original values of Frantik et al. (1994) (see Section 4.4.2) for a QSAR analysis of the neurotoxicity of 47 compounds that comprised benzene and many of its alkylated congeners, halogenated alkanes and alkenes (including the 1,2-DCE mixture), alcohols, ketones, esters, and a few unsubstituted alkanes (n-pentane, n-hexane, n-heptane, and cyclohexane). In a first attempt, using rat data, stepwise regression through all 44 data sets (that included boiling and melting points, a hydrophobicity factor, and several other specific molecular parameters for each compound) afforded an equation to describe the neurotoxicities of these compounds that included the respective boiling points and specific molecular parameters, but no term for hydrophobicity. After removing four evident outliers from the data set—interestingly, those were the four unsubstituted alkanes mentioned above—another equation was obtained that was based only on a specific hydrophobicity factor. By using mouse data, an equation was obtained that again did not contain the hydrophobicity factor. The same four unsubstituted alkanes were outliers, and their removal resulted in an equation that was based on boiling point, hydrophobicity, and an additional molecular factor. Regression curves described by the respective equations for rats and mice had similar slopes and intercepts. The author was able to obtain a description that separated highly neurotoxic compounds from less neurotoxic
62
ones. 1,2-DCE fell in the middle range of the 47 chemicals tested for neurotoxicity. The author pointed out that solubility of the compounds played a minor role in their neurotoxicity, while hydrophobicity was more useful in predicting this effect.
4.6. SYNTHESIS OF MAJOR NONCANCER EFFECTS
A general overview of toxicity studies conducted with cis- or trans-1,2-DCE indicates that both compounds display low toxicity. Although most of the 1,2-DCE literature suggests that the liver and kidney are the organs most affected by exposure to 1,2-DCE at high doses, evidence of any specific pathological event is limited based on the available information (NTP, 2002a; DuPont, 1998; McCauley et al., 1995; Hayes et al., 1987; Freundt et al., 1977). Tables 4-13 and 4-14 present a summary of the major subchronic studies and the observed effects for oral and inhalation exposure, respectively to cis- and trans-1,2-DCE.

62
Table 4-13. Summary of major noncancer subchronic studies for oral exposure to 1,2-DCE
Reference Isomer Dosing vehicle
Treatment period
Species, number of
animals Dose (mg/kg-d) Effects observed at the LOAEL NOAELa (mg/kg-d)
LOAELb (mg/kg-d)
NTP, 2002a
trans- Oral (feed)
14 wks Rat, 9–10/sex/dose
M: 0, 190, 380, 770, 1,540, or 3,210 F: 0, 190, 395, 780, 1,580, or 3,245
M: Decreased BW gain (6%) at the high dose was not considered a LOAEL. F: ↑ Rel liver wt (10%). The biological significance of ↓ RBC count in M (≥380 mg/kg-d) and F (≥1,580 mg/kg-d) was unclear and not used to identify the LOAEL.
M: 3,210 F: 190
M: ND F: 395
NTP, 2002a
trans- Oral (feed)
14 wks Mouse, 10/sex/dose
M: 0, 480, 920, 1,900, 3,850, or 8,065 F: 0, 450, 915, 1,830, 3,760, or 7,925
M: ↑ Rel liver wt (9%). At 8,065 mg/kg-d, ↓ BW gain (~7%). F: ↑ Rel liver wt (11%). Decreased body weight gain (6%) at 1,830 mg/kg-d was not considered a LOAEL.
M: 920 F: 1,830
M: 1,900 F: 3,760
Hayes et al., 1987
trans- Oral (dw) 90 d Rat, 20/sex/dose
M: 0, 402, 1,314, or 3,114` F: 0, 353, 1,257, or 2,809
F: ↑ Abs kidney wt (8%). M: 3,114 F: 353
M: ND F: 1,257
Barnes et al., 1985
trans- Oral (dw) 90 d Mouse, 15–23/sex/dose
M: 0, 17, 175, or 387 F: 0, 23, 224, or 452
M: ↑ Rel liver wt (8%). F: ↓ Rel thymus wt (18%). Changes in clinical chemistry parameters were sporadic and not used to identify a LOAEL.
M: 17 F: 23
M: 175 F: 224
Shopp et al., 1985
trans- Oral (dw) 90 d Mouse, 8–12/sex/dose
M: 0, 17, 175, or 387 F: 0, 23, 224, or 452
M: ↓ sRBC-responsive cells (26%). M: 17 F: 452
M: 175 F: ND

63
Table 4-13. Summary of major noncancer subchronic studies for oral exposure to 1,2-DCE
Reference Isomer Dosing vehicle
Treatment period
Species, number of
animals Dose (mg/kg-d) Effects observed at the LOAEL NOAELa (mg/kg-d)
LOAELb (mg/kg-d)
McCauley et al., 1995
cis- Gavage 90 d Rat, 10/sex/dose
Reported: 0, 10, 32, 98, or 206 EPA calculated: 0, 32, 97, 291, or 872
M: ↑ Rel. kidney wt (14%). Liver wt significantly increased at ≥97. F: ↑ Rel. liver wt (14%). Changes in clinical chemistry and hematology parameters were sporadic and not used to identify the LOAEL.
M: ND F: 32
M: 32 F: 97
↓ = decrease; ↑ = increase; abs = absolute; BW = body weight; dw = drinking water; F = females; M = males; ND = not determined; NOAEL = no-observed-adverse-effect level; rel = relative; wt = weight
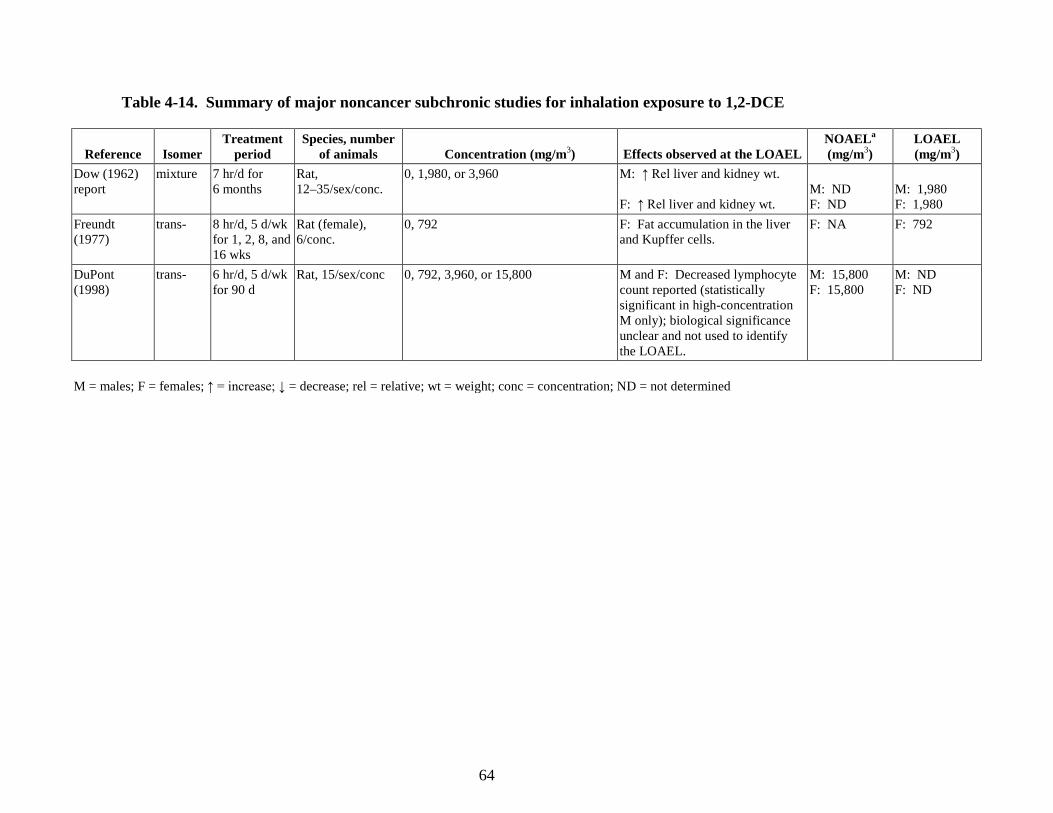
64
Table 4-14. Summary of major noncancer subchronic studies for inhalation exposure to 1,2-DCE
Reference Isomer Treatment
period Species, number
of animals
Concentration (mg/m3) Effects observed at the LOAEL NOAELa (mg/m3)
LOAEL (mg/m3)
Dow (1962) report
mixture 7 hr/d for 6 months
Rat, 12–35/sex/conc.
0, 1,980, or 3,960 M: ↑ Rel liver and kidney wt. F: ↑ Rel liver and kidney wt.
M: ND F: ND
M: 1,980 F: 1,980
Freundt (1977)
trans- 8 hr/d, 5 d/wk for 1, 2, 8, and 16 wks
Rat (female), 6/conc.
0, 792 F: Fat accumulation in the liver and Kupffer cells.
F: NA F: 792
DuPont (1998)
trans- 6 hr/d, 5 d/wk for 90 d
Rat, 15/sex/conc 0, 792, 3,960, or 15,800 M and F: Decreased lymphocyte count reported (statistically significant in high-concentration M only); biological significance unclear and not used to identify the LOAEL.
M: 15,800 F: 15,800
M: ND F: ND
M = males; F = females; ↑ = increase; ↓ = decrease; rel = relative; wt = weight; conc = concentration; ND = not determined
65
4.6.1. Oral 4.6.1.1. cis-1,2-DCE
No studies of the effects of oral exposure to cis-1,2-DCE in humans were identified, and the experimental toxicity database for this isomer is limited. The only investigation of repeat-dose toxicity of cis-1,2-DCE by the oral route is McCauley et al. (1995, 1990). As noted in Sections 4.2.1.1 and 4.2.1.2, comparison of the unpublished report (McCauley et al., 1990) and the published study (McCauley et al., 1995) revealed certain errors and inconsistencies in the documentation of the study protocol and results that were determined not to have compromised the integrity of the data since the inconsistencies were more likely a data reporting issue rather than an issue with the findings themselves.
McCauley et al. (1995, 1990) reported statistically significant increases in relative (to body weight) liver weights in rats following both 14- and 90-day exposures (up to 38 and 32% in males and 38 and 30% in females, respectively). These investigators reported that there were no histopathological changes in the liver. Clinical chemistry indicators of liver function were limited to serum AST. There were no statistically significant changes in AST levels at any dose in either sex. The absence of compound-related histopathological changes in the liver, the absence of AST changes, and the lack of measurements of other clinical chemistry indicators of liver function in the McCauley et al. (1995, 1990) study create difficulties in interpreting the relative liver weight findings.
Limited data from studies of shorter (acute and short-term) duration suggest that the liver is a target organ for cis-1,2-DCE, although responses, at least under the conditions studied, were minimal. Liver enzymes were measured in an acute toxicity study of cis-1,2-DCE (McMillan, 1986). Following a single gavage dose of 4,944 mg/kg-day cis-1,2-DCE, GSH levels were elevated by 28% and AST activity increased by 56%; ALT activity was unchanged. Minimal hepatic centrilobular vacuolation was reported in rats exposed to lethal or near-lethal concentrations (≥47,900 mg/m3) of cis-1,2-DCE in an acute inhalation study (DuPont, 1999), and concentration-related increases in relative liver weights were reported in male and female rats in the 14-day oral toxicity study by McCauley et al. (1995, 1990).
In studies of 1,2-DCE mixtures, slight liver pathology was observed in rats 1 week after an acute 7-hour inhalation exposure to 66,740 mg/m3 1,2-DCE (isomer composition not stated)—a concentration lethal to six of the nine exposed rats (Dow, 1960)—and relative liver weight was increased following exposure to 1,2-DCE (58% cis-, 42% trans- isomer) by inhalation intermittently for up to 195 days at concentrations of 1,980 mg/m3 (rabbits) or 3,960 mg/m3 (rats) (Dow, 1962). In the Dow (1962) study, clinical chemistry values were reported to fall within normal values. Overall, these studies show elevated liver weight to be the most consistent finding in studies of cis-1,2-DCE or mixed isomers of 1,2-DCE. Reported increases in liver enzymes have been small, and slight liver pathology has been documented only following acute inhalation exposure at or near lethal exposure concentrations.

66
The increased liver weight observed in the McCauley et al. (1995, 1990) study was related to administration of cis-1,2-DCE; however, in the absence of elevated liver enzymes or histopathology, the change in liver weight is difficult to interpret.
Increased relative kidney weight (as a percent of body weight) was also observed by McCauley et al. (1995, 1990). In male rats, statistically significant increases in relative kidney weight were observed at all doses in the 90-day study, but not in the 14-day study. In female rats, relative kidney weight was not statistically elevated following 90 days of exposure, but was elevated in the two highest dose groups following 14 days of exposure. The absence of compound-related histopathological changes in the kidney in the McCauley et al. (1995, 1990) study raises questions about the biological significance of the relative kidney weight findings. BUN and creatinine, two clinical chemistry parameters that are indicators of kidney function, did not provide supporting evidence for functional damage to the kidney (McCauley et al., 1995, 1990). In the 90-day study, BUN and creatinine were only marginally decreased (although statistically significant) in high-dose (872 mg/kg-day) male rats; values in treated females were similar to controls.
The observed increases in liver and kidney weight could represent early indicators or precursors of liver and kidney toxicity; however, toxicity information is limited. Additionally, it is not possible to predict whether liver or kidney damage would or would not occur at higher concentrations or in studies of longer exposure duration (i.e., chronic studies).
McCauley et al. (1995, 1990) also reported decreases in hematological parameters (hemoglobin and hematocrit) in male and female rats at doses ≥97 mg/kg-day that were not dose-related and were considered by the study investigators to be marginal. Comparison of hemoglobin and hematocrit findings with normal values for Sprague-Dawley rats suggests that these hematological parameters were not affected by cis-1,2-DCE treatment. Based on blood samples collected from 25 male and 25 female Sprague-Dawley rats, Leonard and Rubin (1986) reported the following means (and ranges): hemoglobin—16.1 g/dL (13.3–17.3 g/dL) in males and 16.2 g/dL (14.6–17.2 g/dL) in females and hematocrit—42.4% (36.7–46.4%) in males and 41.6% (37.6–44.3%) in females. With the exception of the 291 mg/kg-day-dosed female rats, values for hemoglobin and hematocrit in cis-1,2-DCE-treated rats were within the normal range reported by Leonard and Rubin (1986). Matsuzawa et al. (1993) examined hematological data from >2,700 male and >2,600 female Sprague-Dawley rats. Values within 2 SDs of the mean were considered by the study authors to be within the normal range. For hemoglobin and hematocrit in male and female rats, 2 SDs from the mean as reported by Matsuzawa et al. (1993) is equivalent to approximately 12–13% of the mean. This compares to decreases in hematological parameters in the McCauley et al. (1995, 1990) study of only 6–10% of the control mean. Thus, based on normal ranges for hematologic parameters, the hematology findings in McCauley et al. (1995, 1990) are not considered biologically significant.
67
There is limited evidence that oral exposures to cis-1,2-DCE affect the CNS. In a 14-day gavage study, McCauley et al. (1995, 1990) reported signs of CNS depression in male and female rats. Immediately following gavage dosing, animals appeared agitated followed by lethargy and ataxia. In the 90-day study (McCauley et al., 1995, 1990), however, the investigators reported no compound-related clinical effects.
There are no oral studies of chronic, reproductive, or developmental toxicity of cis-1,2-DCE. The findings from developmental toxicity range-finding studies for a mixture of 1,2-DCE isomers (NTP, 1991a, b, c) are summarized in Section 4.6.1.3. 4.6.1.2. trans-1,2-DCE
No human studies involving oral exposure to trans-1,2-DCE were identified. The oral toxicity of trans-1,2-DCE was evaluated in four subchronic toxicity studies—NTP (2002a) (rats and mice), Barnes et al. (1985) (mice), Hayes et al. (1987) (rats), and Shopp et al. (1985) (mice). The drinking water study by Barnes et al. (1985) exposed mice at doses up to approximately 400 mg/kg-day, whereas the drinking water study by Hayes et al. (1987) and dietary study by NTP (2002a) exposed mice and rats to doses almost an order of magnitude higher. These three studies identified a range of effects associated with trans-1,2-DCE exposure, including decreased body weight gain, effects on organ weights (liver, kidney, thymus, and lung), minimal changes in liver function enzymes, decreased mean body weight, and minimal decreases in hematological parameters. A fourth subchronic study in mice (Shopp et al., 1985) evaluated the immunotoxic potential of trans-1,2-DCE. Information on developmental toxicity is limited to developmental range-finding studies on a mixture of 1,2-DCE isomers (NTP, 1991a, b, c), which is summarized in Section 4.6.1.3. No chronic bioassays of trans-1,2-DCE toxicity have been performed.
Statistically significant effects on the liver were observed by Barnes et al. (1985) and NTP (2002a), but not Hayes et al. (1987). In the 90-day Barnes et al. (1985) study, male and female mice were exposed to trans-1,2-DCE in drinking water at doses up to 387 mg/kg-day for males and up to 452 mg/kg-day for females. A significant increase in mean liver weights was noted at the mid-dose (175 mg/kg-day), but not at the highest dose, in male mice. No DCE-induced changes in terminal body weight were observed. Significant increases in serum ALP levels of 62 and 33% were reported at the 175 and 387 mg/kg-day doses, respectively, in male mice. These increases showed no dose-response relationship, were within the normal range for this mouse strain, and were not observed in female mice. In female mice, ALT and AST levels were depressed at all doses, with statistical significance at the two highest dose levels. Increases in ALT and AST levels are indications of liver damage; the implication of decreases in these enzymes is unknown. The findings of Barnes et al. (1985) suggest that trans-1,2-DCE, via drinking water, does not induce hepatotoxicity at doses up to 387 mg/kg-day in male mice and up to 452 mg/kg-day in female mice.
68
NTP (2002a) conducted a 14-week dietary study of trans-1,2-DCE in rats and mice at doses ranging from approximately 190 to 3,200 mg/kg-day in rats and from approximately 450 to 8,000 mg/kg-day in mice. Table 4-5 shows the relative liver weight changes (expressed as a ratio of liver weight to body weight) in mice and rats. Absolute and relative liver weights of female rats exposed to ≥395 mg/kg-day were statistically significantly higher by 8–17 and 6–10%, respectively, than those of the vehicle controls; liver weights of male rats were not affected by trans-1,2-DCE exposure. In mice, relative liver weights were statistically significantly increased over controls in males (by 9–15%) exposed to doses ≥1,900 mg/kg-day and in females (by 11%) exposed to doses ≥3,760 mg/kg-day. Clinical chemistry data did not suggest hepatotoxicity in either species. Statistically significant decreases in serum ALP activities were reported in female rats exposed to the three highest doses compared with the vehicle controls; these decreases were minimal in severity (<13%) and transient (i.e., present at day 21 but not week 14). No exposure-related changes in ALP activities were observed in male rats or mice of either sex. No changes were observed in other clinical chemistry parameters, including cholesterol, ALT, and SDH levels, in rats or mice of either sex.
As with cis-1,2-DCE, consideration was given to the possibility that the observed liver effects for trans-1,2-DCE are early indicators or precursors of liver toxicity. It is not possible to predict whether liver damage would or would not occur at higher concentrations or in studies of longer (i.e., chronic) exposure duration.
In interpreting the liver weight findings from subchronic oral exposure to trans-1,2-DCE, consideration was given to the entire database for trans-1,2-DCE, including acute gavage studies, inhalation study findings, and 1,2-DCE mixture information. McMillan et al. (1986) reported no effects on ALT in rats following a single gavage dose of 4,944 mg/kg trans-1,2-DCE; acute i.p. injection caused transient increases in liver enzymes and histopathology (maximally elevated at 4 hours and near control levels at 12 hours postexposure). In an oral LD50 test in female Wistar rats (Freundt et al., 1977), severe fatty infiltration of the liver lobules and Kupffer cells was observed in some animals receiving a single gavage dose of trans-1,2-DCE. Barnes et al. (1985) indicated that based on gross necropsy findings, the liver was a target following single acute gavage administration of trans-1,2-DCE. By inhalation, Freundt et al. (1977) found fatty effects on the liver following single and repeated (up to 16 weeks) exposures to 792 mg/m3; in contrast, DuPont (1999) found no compound-related liver pathology in rats following acute inhalation exposures at lethal concentrations (48,700–135,000 mg/m3) or a 90-day inhalation exposure at concentrations up to 15,800 mg/m3. In studies of 1,2-DCE mixtures, slight liver pathology was observed in rats 1 week after an acute 7-hour inhalation exposure to 66,740 mg/m3 1,2-DCE (isomer composition not stated)—a concentration lethal to 6/9 exposed rats (Dow, 1960)—and relative liver weights were increased following exposure to 1,2-DCE (58% cis-, 42% trans- isomer) by inhalation intermittently for up to 195 days at concentrations of 1,980 mg/m3 (rabbits)

69
or 3,960 mg/m3 (rats) (Dow, 1962). In the Dow (1962) study, clinical chemistry values were reported to be within normal values.
The increased liver weight observed in NTP (2002a) and Barnes et al. (1985) was related to administration of trans-1,2-DCE; however, in the absence of elevated liver enzymes or histopathology, the change in liver weight is difficult to interpret.
In the 90-day drinking water study by Hayes et al. (1987), kidney weight (absolute and relative to body weight) was statistically significantly increased in female rats (by 11–13%) at doses of 1,257 and 2,809 mg/kg-day trans-1,2-DCE, but not in male rats in any dose groups. The kidney weight changes in female rats were not accompanied by histopathologic changes. In the dietary study by NTP (2002a), absolute kidney weight was decreased (up to 9%) in female rats (1,580 and 3,245 mg/kg-day) and female mice (7,925 mg/kg-day), but relative kidney weight (as a ratio to body weight) was similar to controls in all dosed groups. No gross or histopathological lesions in the kidney were observed in rats or mice that were attributed to exposure to trans-1,2-DCE (NTP, 2002a). Similarly, clinical chemistry findings, BUN, creatinine, total protein, and albumin levels did not provide evidence of any functional changes in the kidney. NTP (2002a) observed that sporadic differences in clinical chemistry parameters at various time points generally did not demonstrate an exposure response relationship or were inconsistent between males and females.
Overall, the findings from Hayes et al. (1987) and NTP (2002a) provide limited evidence that trans-1,2-DCE affects the kidney. The findings from these two studies are inconsistent, with Hayes et al. (1987) reporting an increase in relative kidney weight and NTP (2002a) reporting a decrease. Neither NTP (2002a) nor Hayes et al. (1987) found any treatment-related histopatho-logical changes of the kidney in rats and mice. Additionally, NTP (2002a) did not find any clinical chemistry changes indicative of nephrotoxicity. Therefore, the kidney weight data are difficult to interpret.
There is limited evidence in the trans-1,2-DCE database for effects on the thymus. In a 90-day drinking water study, Barnes et al. (1985) reported decreased relative (as a ratio of body weight) and absolute thymus weight in mid- (224 mg/kg-day) and high-dose (452 mg/kg-day) female mice, but not in any of the treated male mice. Hayes et al. (1987) reported no changes in absolute and relative thymus weight or histopathologic changes in the thymus at doses almost 10-fold higher than the doses used in Barnes et al. (1985). NTP (2002a) reported no changes in absolute and relative thymus weight in rats and mice, except for a statistically significant increase in absolute (27%) and relative (25%) thymus weight in female mice at the low dose, and no significant histopathologic lesions.
Inconsistent hematological findings have been associated with trans-1,2-DCE exposure. In a 90-day drinking water study, Barnes et al. (1985) reported sporadic changes in hematology parameters (prothrombin time, leukocytes, and polymorphonuclear leukocytes) in mice; changes in these parameters were not dose-related or consistent across sexes. In a second subchronic
70
drinking water study of trans-1,2-DCE, Hayes et al. (1987) reported no treatment-related effects on hematologic parameters in rats at doses up to approximately 3,000 mg/kg-day.
NTP (2002a) reported mild decreases in hematocrit values, hemoglobin concentrations, and erythrocyte counts at week 14 in male and female rats in all (380–3,245 mg/kg-day) but the lowest dose groups (190 mg/kg-day). Only decreased RBC counts showed a dose-response and statistical significance. This effect was demonstrated in male rats with significant decreases at doses ≥380 mg/kg-day (p ≤ 0.05), although the maximum decrease in RBC was only 7% in males and 5% in females at the highest dose (3,210 and 3,245 mg/kg-day for males and females, respectively). NTP (2002a) further observed the following: (1) McCauley et al. (1995) reported a decrease in the circulating erythroid mass in Sprague-Dawley rats exposed to 872 mg/kg cis-1,2-DCE by gavage for 90 days, but this response was not dose-related and not considered by the study investigators to be biologically relevant, and (2) no hematologic response was observed by Barnes et al. (1985) in male or female CD-1 mice exposed to 387 mg/kg-day trans-1,2-DCE for 90 days. NTP (2002a) concluded that the trans- (and cis-) isomer may have an effect on hematologic endpoints but more consistency between studies is necessary before the biological significance (if any) is known.
The immunotoxicity associated with oral exposure to trans-1,2-DCE was investigated in mice treated for 14 or 90 days (Shopp et al., 1985; Munson et al., 1982). In male CD-1 mice administered trans-1,2-DCE for 14 consecutive days at doses up to 222 mg/kg-day by gavage, Munson et al. (1982) evaluated humoral immune function as indicated by the ability of spleen cells to produce IgM AFCs following challenge with sRBCs. Munson et al. (1982) also assessed cell-mediated immune function as indicated by the DTH response to sRBCs. The authors described the antibody response to sRBCs as the number of AFCs per spleen and per 106 spleen cells. Munson et al. (1982) reported a trend toward suppression of the number of AFCs expressed on a per-spleen basis (significant at p < 0.1), but this response was not statistically significant at the p < 0.05 level or when expressed per 106 spleen cells. The DTH response was characterized as slight but significant (p < 0.05) and not dose-dependent in the abstract of the journal article. However, in the results section of the article the authors state that trans-1,2-DCE showed no effect in the DTH response. This contradictory reporting of the DTH response data renders these findings questionable. It is unknown whether the slight reduction in DTH was associated with trans-1,2-DCE or some other test chemical evaluated in the study. The authors concluded that mice exposed to trans-1,2-DCE for 14 consecutive days at doses up to 222 mg/kg-day showed no significant change in cell-mediated or humoral immunity (Munson et al., 1982). Data from a longer duration (90-day) oral exposure study demonstrate that suppression of the antibody response to sRBCs is associated with exposure trans-1,2-DCE, but do not support an effect of trans-1,2-DCE on the DTH response.
In a 90-day drinking water study in mice (Shopp et al., 1985), a dose-related suppression of the humoral immune status, as measured by spleen cell antibody production directed against

71
sRBCs, was observed in male mice treated with trans-1,2-DCE. When expressed as AFCs per 106 spleen cells, the number of AFCs was reduced by 26% in male mice at doses of 175 and 387 mg/kg-day (significantly different at p < 0.05 from control mice). Shopp et al. (1985) reported that there was marked suppression in humoral immune status in male mice, as indicated by the significantly decreased number of AFCs in these mice. However, the authors also stated that the decrease in AFCs was not severe enough to depress the functional ability of the humoral immune system because there was no change in hemagglutination titers to sRBCs or lymphoproliferative response of spleen cells to the B-cell mitogen LPS. The authors concluded that the immune system of CD-1 mice does not appear to be overly sensitive to trans-1,2-DCE and that the observed effects were probably the result of general toxicity as opposed to specific target organ toxicity.
EPA evaluated the findings from Shopp et al. (1985) and determined, in contrast to the study authors, that suppression in the number of AFCs in male CD-1 mice represents functional suppression of the humoral immune system and not general toxicity. No indicators of general toxicity, such as reduced body weight, were reported.
Loss of immune function has been shown to increase susceptibility to infection. Luster et al. (1993) identified animal studies where decreases of <20% in the AFC (compared to a 26% reduction in AFC in male mice treated with trans-1,2-DCE in the Shopp et al. [1985] study) are likely to increase susceptibility to infection when the animal is challenged with an infectious agent. Measurement of the antibody response to a T-dependent antigen, such as sRBCs that are used as a surrogate for a typical foreign material or infectious agent in toxicology studies, represents a sensitive and reproducible biomarker of immune function (WHO, 1996). A functional immune system is required by the host to properly defend against infections, as most recently evidenced by the numerous fatalities from infectious diseases in individuals with AIDS or increased deaths from influenza in individuals with compromised immune systems. The exact quantitative association between loss in immune function (or the AFC response) and development of infectious disease is difficult to ascertain. Luster et al. (1993) conducted mouse studies in which groups of mice were administered increasing doses of an immunosuppressive drug (cyclophosphamide) and increasing amounts of infectious agents (e.g., Listeria). Although no longer used as an endpoint, survival was monitored as the indicator to resist Listeria infection. The data were modeled and the results indicated that decreases of even <20% in the AFC response decreases the ability of the host to survive infection.
Luster et al. (2004) summarized effects of moderate losses in immune function on infectious diseases in humans. A number of studies have examined both infectious disease incidence and immune function in groups of individuals with moderately compromised immune systems. For example, studies in immunosuppressed patients following hematopoietic stem cell transplantation showed a 1.7-fold higher rate of infections with only twofold decreases in certain types of CD4 T cells (Storek et al., 2000). Similarly, transplant patients, even when on very low

72
levels of immunosuppressive therapy, show a 1.5-fold increased risk of in immune function and associated increased levels of antibodies to latent viruses, such as CMV, EBV, and HSV, an indication of viral reactivation (Kiecolt-Glaser et al., 2002).
EPA’s testing guidelines for immunotoxicity require testing the antibody response to a T-cell-dependent antigen (and suggest the use of sRBCs) as the primary assay to determine functional responsiveness of major components of the immune system following chemical exposure in mice and rats (U.S. EPA, 1998b). To evaluate the antibody response, EPA’s testing guidelines require the measurement of splenic anti-sRBC AFCs or serum levels of anti-sRBC IgM. Reduction in either of these measures of the antibody response represents evidence of chemical immunosuppression. The AFC assay is a well-validated endpoint in immuno-toxicology and has been characterized across multiple labs (Ladics, 2007; Loveless, 2007). While serum measurements of anti-sRBC IgM levels such as the hemagglutination test are more convenient than AFC assays because of the ability to obtain values from frozen serum rather than viable animal cells, the two assays provide an evaluation of different aspects of the antibody response. The AFC assay provides a measure of the antibody-producing cells of the spleen, and this measure is highly predictive of the overall immunotoxicity of a chemical (Luster et al., 1993, 1992). Serum anti-sRBC IgM values are a general measure of the antibody response because these values reflect antibodies produced from multiple sources, including spleen, lymph nodes, and bone marrow. Therefore, the AFC assay is not expected to provide evidence of chemical immunosuppression at the level of splenic antibody production that might not be identified by measurements of serum levels of anti-sRBC IgM. Data on the antibody response for two well-known immunotoxicants (cyclophosphamide and dexamethasone) demonstrate that the AFC assay can be a more sensitive assay for the determination of suppression of the antibody response than measurement of serum levels of anti-sRBC IgM in an enzyme-linked immunosorbent assay (Loveless et al., 2007). Loveless et al. (2007) reported that the AFC assay was consistently better at identifying suppression of the T-dependent antibody response across laboratories and that the AFC detected suppression at lower concentrations for dexamethasone than were observed by measurement of serum levels of anti-sRBC IgM. In addition to the negative data from the hemagglutination assay, Shopp et al. (1985) uses a lack of an observed effect of trans-1,2-DCE on the proliferative response of splenocytes to LPS to suggest that the functional ability of the humoral immune system in male mice was not suppressed.
The proliferative response to LPS is not a reliable indicator of humoral immune suppression, and is listed as one of the poorest predictors for potential immunotoxicity in the review of sensitivity and predictability of immune tests by Luster et al. (1992). In addition, the LPS response is a nonspecific activation of certain B cells, is a fairly insensitive assay, and is seldom used today in immunology testing (Luster et al., 1992). In contrast, suppression of T-cell-dependent antibody response as determined by the AFC assay is one of the most

73
predictive assays for chemical immunotoxicity (Herzyk and Holsapple, 2007; Luster et al., 1992).
Therefore, EPA determined that the 26% suppression in the number of sRBC-specific AFCs per 106 spleen cells of male mice in Shopp et al. (1985) is a biologically significant measure indicating suppressed immune function associated with oral exposure to trans-1,2-DCE that is not contradicted by a lack of observed change in the hemagglutination assay to sRBCs or proliferative response to LPS.
4.6.1.3. Mixtures of cis- and trans-1,2-DCE
There is inadequate information available on the mixtures of cis- and trans-1,2-DCE to support a separate health assessment; however, effects observed in studies of the mixture of isomers are generally consistent with those of the individual isomers. Dow (1960) reported that a dose of 2,000 mg/kg 1,2-DCE (isomer composition not stated) as a 10% solution in corn oil administered to rats by gavage was not lethal, but some kidney injury was observed at necropsy. In a 14-day gavage study in which a 50% mixture of both 1,2-DCE isomers was administered in a sesame seed oil vehicle (1 mL/kg) at a dose of 5 mmol (485 mg/kg-day) to male Sprague-Dawley-derived rats, McMillan (1986) reported a statistically significant increase in kidney weights, slight but significant reductions in plasma creatinine and BUN, and an increase in plasma calcium. In a 30-day study by McMillan (1986), the mean relative weight of the liver (expressed as a ratio to body weight) in the treated group at termination was significantly greater by 19% than that of control rats. Additionally, the treated rats exhibited significant reductions in mean relative weight of the lungs (14%), mean values for plasma AST (25%) and creatinine levels (17%); erythrocyte count; and hemoglobin and hematocrit levels were also reduced by 6, 5, and 5%, respectively. A series of developmental range-finding studies in rats and mice (NTP, 1991a, b, c) conducted with a mixture of 1,2-DCE (composition of isomers unknown) via the oral route found no signs of developmental or maternal toxicity at any of the initial doses tested (up to 2,918 mg/kg-day), but found maternal toxicity in the form of reduced maternal body weight and reduced maternal weight gain at higher doses (up to 6,906 mg/kg-day).
4.6.2. Inhalation 4.6.2.1. cis-1,2-DCE
No studies of the effects of cis-1,2-DCE by inhalation exposure in humans were identified. There are no inhalation studies of subchronic, chronic, reproductive, or developmental toxicity of cis-1,2-DCE. Investigation of the inhalation toxicity of cis-1,2-DCE is limited to an acute 4-hour inhalation LC50 study in rats (DuPont, 1999). The LC50 was calculated to be 54,200 mg/m3. Effects associated with acute inhalation exposure to cis-1,2-DCE at concentrations near the LC50 included severe weight loss and clinical signs suggestive of effects

74
on the CNS, including unresponsiveness, weakness, and irregular respiration immediately after exposure, and minimal hepatic centrilobular vacuolation upon microscopic observation.
4.6.2.2. trans-1,2-DCE
The human database for trans-1,2-DCE is limited to one study from the 1930s involving only two subjects (Lehmann and Schmidt-Kehl, 1936, as cited in ATSDR, 1996). This study provides limited evidence that trans-1,2-DCE can cause eye irritation and CNS depression (nausea, drowsiness, fatigue, vertigo) following acute inhalation exposures. Information on the potential health effects of inhaled trans-1,2-DCE comes from studies in animals, including two acute inhalation studies (DuPont, 1999; Freundt et al., 1977) and two subchronic inhalation studies (DuPont, 1998; Freundt et al., 1977), of which only one (Freundt et al., 1977) is a published peer-reviewed study. In addition, one study evaluated the effects of inhalation exposure on developmental outcomes (DuPont, 1988a; published in Hurtt et al., 1993).
Evidence for liver toxicity associated with inhaled trans-1,2-DCE is inconsistent. In the only published peer-reviewed subchronic inhalation study, Freundt et al. (1977) reported slight to severe fatty accumulation in the liver lobules and Kupffer cells in rats exposed for 8 hours/day, 5 days/week to air containing 792 mg/m3 trans-1,2-DCE for 1, 2, 8, or 16 weeks. These effects occurred in two of the six rats exposed for 1 week, in four of the six rats exposed for 2 weeks, in three of the six rats exposed for 8 weeks, and in five of the six rats exposed for 16 weeks. These effects were also seen in one of the six controls at 8 weeks and in two of the six controls at 16 weeks. In general, the incidence and severity of fat accumulation increased with increasing exposure duration. Similar effects were reported in an acute inhalation study by the same investigators (Freundt et al., 1977).
In the 90-day inhalation toxicity study (DuPont, 1998), rats were exposed to analytically determined mean concentrations of 0, 792, 3,960, or 15,800 mg/m3 trans-1,2-DCE for 6 hours/day, 5 days/week. Effects on the liver were limited to increases in relative and absolute liver weights of ≤8% compared to the control. No evidence of fatty accumulation was observed at any exposure concentration.
Changes in some hematological parameters were reported in the DuPont (1998) study. Significantly decreased mean hemoglobin concentrations and hematocrit were observed in male rats and decreased monocyte count in female rats at the 45-day sampling time; similar changes did not occur at the 90-day sampling time, and thus, were not considered to be toxicologically important.
Decreases in WBC and lymphocyte counts were also observed at the 45- and 90-day sampling times in male and female rats that were generally concentration related.3
3WBCs (or leukocytes) consist of different cell types, including neutrophils, basophils, eosinophils, lymphocytes and monocytes. In the DuPont (1998) study, the reduced WBC count generally reflected the reduced lymphocyte count.
The decreases were statistically different from the control at 45 and 90 days only in the 15,800 mg/m3 (high-
75
dose) males. WBCs decreased by approximately 18–20% in male and female rats, and lymphocyte levels decreased by approximately 22–25%. These findings were not considered by the authors to be toxicologically important because the magnitude of the changes was considered small in the context of historical controls and because a common cause of decreased lymphocyte counts in rodents is the release of endogenous glucocorticoids. Endogenous glucocorticoids can cause redistribution of lymphocytes from the circulation into the lymphoid tissue and is a secondary effect associated with stress (Brondeau et al., 1990; Jensen, 1969). The authors of the DuPont (1998) report noted that this type of stress-related response has been observed in other inhalation studies at that laboratory and elsewhere (Brondeau et al., 1990). Brondeau et al. (1990) examined the effects of a single 4-hour exposure to airborne chemicals (but not 1,2-DCE) at irritant levels on blood cell counts in rats and found that leucopenia was related to the irritant potencies of the test compounds. Since stimulation of the hypophysis-adrenal axis can account for many of the physiological effects associated with an extensive variety of stressors (Yannai, 1983), Brondeau et al. (1990) also examined the effects of exposure to irritant levels in adrenalectomized rats and found that the leucopenic effect were adrenal-dependent. Similarly, Shimizu et al. (2000) demonstrated decreased leukocyte counts after 12 or 24 hours of restraint stress and showed that the lymphocytopenia induced by restraint stress was absent in adrenalectomized mice. Dhabhar et al. (1995) suggested that stress-induced increases in plasma corticosterone were accompanied by significant decreases in numbers and percentages of lymphocytes and that the effects of stress were largely dependent on adrenal hormones because the magnitude of the stress-induced changes was significantly reduced in adrenalectomized animals.
In the DuPont (1998) study, the authors failed to identify the cause of stress in exposed animals. In other studies, trans-1,2-DCE was reported as irritating in humans at a concentration of 950 ppm (3,772 mg/mg3) (Lehmann and Schmidt-Kehl, 1936, as cited in ATSDR, 1996) and in rats at a concentration of 2,000 ppm (7,940 mg/m3) (Hurtt et al., 1993). Therefore, it is plausible that the decrease in lymphocyte count reflects a stress-related increase in glucocorticoid levels and a secondary effect on trafficking and redistribution of WBC between the blood and other immune components in the rat, but direct evidence is not available.
The possibility exists that the decreased WBC and lymphocyte counts in rats in the DuPont (1998) inhalation study represent an effect on the immune system. Oral toxicity findings for the trans-isomer provide limited support for this possibility. Shopp et al. (1985) reported suppression in humoral immune status (i.e., decrease in AFC in response to sRBC challenge) in male mice exposed to trans-1,2-DCE by ingestion, but cell-mediated immune status in these mice was unaffected. Statistically significant changes in WBC and lymphocyte counts were not identified by NTP (2002a) in their 90-day oral (feed) study. It is noteworthy that no histopathological changes of the spleen and thymus were seen in rats at any exposure concentration in the DuPont (1998) study—findings that would be consistent with a direct effect

76
of trans-1,2-DCE on the immune system. The considerable variability in WBC and lymphocyte counts across studies and with the age of the rat within a study was also taken into consideration in evaluating the toxicological significance of these hematologic endpoints. For example, mean lymphocyte counts in control male and female rats ranged from 4,250-6,160/μL (males) and 3,390-7,400/μL (females) in seven recent NTP 90-day inhalation toxicity studies in rats.4
In a single-exposure concentration inhalation study by Freundt et al. (1977), histopathological changes of the lung (hyperemia and alveolar septal distension) were reported in rats exposed to 11,880 mg/m3 for 8 hours. Similar effects were reported by these investigators in animals exposed to 792 mg/m3 trans-1,2-DCE for 8 hours/day, 5 days/week for up to 16 weeks. The pathological changes in the lung were considered by the authors to be slight in severity and were present in all six rats in all four exposure groups, in one of the six control animals exposed for 1 week, and in two of the six control animals exposed for 2 weeks, but not in any of the control animals exposed at either 8 weeks or 16 weeks. No lung pathology was observed in the 90-day study by DuPont (1998) at a concentration approximately 20-fold higher than that used by Freundt et al. (1977). The finding of lung effects in the Freundt et al. (1977) study is difficult to interpret as this study is the only report of lung pathology in animals exposed to trans-1,2-DCE, a small number of animals were examined, several of the controls also developed this effect, and the upper respiratory tract was not examined for pathology.
Lymphocyte counts in controls in the DuPont (1998) study similarly showed considerable variability; control lymphocyte counts (mean ± SD) (in /μL) were 12,901 ± 1,961 (male rat) and 10,239 ± 4,147 (female rat). Therefore, the decreases in WBC and lymphocyte count in the DuPont (1998) study, while treatment related, are of uncertain toxicological significance.
Only one study investigated the developmental toxicity of trans-1,2-DCE in pregnant rats that were exposed via inhalation to 7,930, 23,790, or 47,580 mg/m3 trans-1,2-DCE for 6 hours/day (DuPont, 1988a; published in Hurtt et al., 1993). The two high concentrations were overtly maternally toxic, while the 7,930 mg/m3 concentration (chosen at 10 times the TLV) was slightly maternally toxic. There were no changes in numbers of fetuses or implantations, but a statistically significant decrease in fetal weight was reported at the highest concentration. No malformations were observed. Oral administration of a 1,2-DCE mixture to pregnant mice and rats similarly provided no evidence for developmental toxicity and showed maternal toxicity only at high doses.
Evidence for CNS toxicity following trans-1,2-DCE exposure by the inhalation pathway comes from studies of acute inhalation exposure only. Freundt et al. (1977) reported no symptoms of CNS depression in rats that received an 8-hour inhalation exposure to
4Control lymphocyte data at 13- or 14-weeks on study were taken from NTP 90-day inhalation toxicity studies in the rat for vanadium pentoxide (NTP, 2002b), propylene glycol mono-t-butyl ether (NTP, 2004a), stoddard solvent IIC (NTP, 2004b), decalin (NTP, 2005), divinylbenzene-HP (NTP, 2006), α-methylstyrene (NTP, 2007), and cumene (NTP, 2009).

77
concentrations up to 11,880 mg/m3. Lethargy and irregular respiration were reported immediately after exposure to a concentration of 89,100 mg/m3 (DuPont, 1999).
4.6.2.3. Mixtures of cis- and trans-1,2-DCE
There is inadequate information available on the mixtures of cis- and trans-1,2-DCE to support a separate human health assessment; however, effects observed in studies of the mixture of isomers are generally consistent with those of the individual isomers. At concentrations of approximately 115,270 mg/m3, rats exposed to a mixture of 1,2-DCE isomers (unspecified composition) rapidly became unconscious, and exposures lasting >0.2 hours were fatal (Dow, 1960). In another Dow study (1962), rats, rabbits, guinea pigs, and beagle dogs were exposed to 0, 1,980, or 3,960 mg/m3 of a 1,2-DCE mixture (58% cis-, 42% trans- isomer) 7 hours/day for 6 months. The only notable effects in rats and rabbits exposed to the highest concentration (3,960 mg/m3) were an increase in the average relative kidney weights (expressed as a ratio to body weight) in male and female rats by 16 and 9%, respectively (only statistically significant in males), and an increase of 23% in the average relative liver weights of female rats (statistically significant). Liver weights in both male and female rabbits were also increased, but statistical significance was not determined because of the small number of rabbits tested. At the mid-concentration of 1,980 mg/m3, the relative kidney weights of male and female rats were statistically significantly increased by 9 and 18%, respectively; liver weights of female rats were also significantly increased by 19%. In addition, increases in liver weights of both male and female rabbits occurred at termination (statistical evaluations were not performed because of the small number of experimental animals). Thus, data from studies on the inhalation of mixtures of 1,2-DCE support the conclusion that the liver and kidney may be target organs for 1,2-DCE. This is consistent with the findings from the oral subchronic studies of cis-1,2-DCE (McCauley, 1995, 1990), the oral subchronic studies of trans-1,2-DCE (NTP, 2002a), and the inhalation subchronic studies of trans-1,2-DCE (Freundt et al., 1977). 4.6.3. Mode-of-Action Information
The available information on the toxic responses to either cis- or trans-1,2-DCE is limited and precludes the determination of a mode of toxic action. The acute toxicity (and possibly behavioral toxicity) of both isomers is likely the result of CNS toxicity related to the anesthetic and narcotic properties of both compounds. The nonspecific effects observed (NTP, 2002a; McCauley et al., 1995; Hayes et al., 1987; Freundt et al., 1977) do not point to any particular mode of action (e.g., covalent binding of a metabolite). However, elucidating the reaction of metabolites of cis- and trans-1,2-DCE with cell components and their possible binding to a cell component may inform a possible mode of action.
In vitro studies indicate that the biotransformation of cis- and trans-1,2-DCE involves the hepatic CYP450 system. Furthermore, it has been proposed that multiple forms of hepatic
78
CYP450 bind and metabolize cis- and trans-1,2 DCE (Costa and Ivanetich, 1982). The study by Costa and Ivanetich (1982) suggests that the hepatic CYP450 system is closely associated with the metabolism and toxicity of 1,2-DCEs. In addition, a number of studies indicate that both the cis- and the trans- isomers are able to induce (at the protein synthesis levels) and/or inhibit (via suicide inhibition of the enzyme or suppression of protein synthesis) CYP450s (Nakahama et al., 2000; Hanioka et al., 1998; Mathews et al., 1997; Paolini et al., 1995, 1992; Testai et al., 1982; Freundt and Macholz, 1978).
Filser et al. (1982, 1978) and Filser and Bolt (1980) observed the production of acetone following exposure to cis- and trans-1,2-DCE (and other halogenated ethanes). When male Wistar rats were exposed to cis- or trans-1,2-DCE at various concentrations in a closed-system chamber, the authors found acetone in the exhaled air (Filser et al., 1978). Chloroacetate, a known metabolite of haloethanes, also caused acetone exhalation; thus, the study authors proposed that the effect was caused by inhibition of the citric acid cycle. Similar to the results of Freundt and Macholz (1978), Filser et al. (1978) found that cis-1,2-DCE was more potent than the trans- isomer in eliciting acetone production. Subsequently, Filser and Bolt (1980) reported that the amount of acetone exhaled far exceeded the amount of cis- or trans-1,2-DCE metabolized in the animals, suggesting that the exhaled acetone was not a metabolite of the test agent. The authors found that acetone formation did not increase further when cis- or trans-1,2-DCE exposure surpassed concentrations that saturated the metabolic capacity of the test animals; however, induction and inhibition of CYP450 increased and decreased acetone formation, respectively. Filser and Bolt (1980) concluded that metabolic transformation of cis- or trans-1,2-DCE was a prerequisite for acetone formation. Based on a further study using only trans-1,2-DCE, Filser et al. (1982) suggested that the exhaled acetone was likely a by-product of increased lipid metabolism (a ketone body).
In summary, both cis- and trans-1,2-DCE induced synthesis of specific CYP450 isozymes to some extent (e.g., CYP1A1/2 2B1 and CYP2E1 in mice). The trans-1,2-DCE is an effective but transient inhibitor of CYP2E1 that by itself is metabolized poorly. Downstream metabolites may affect the citric acid cycle and, secondarily, lipid metabolism, causing ketogenesis, but, because of the likely low in vivo concentrations of metabolites resulting from 1,2-DCE exposure, it is probably biologically ineffective.
4.7. EVALUATION OF CARCINOGENICITY 4.7.1. Summary of Overall Weight of Evidence
Under the Guidelines for Carcinogen Risk Assessment (U.S. EPA, 2005a), there is “inadequate information to assess the carcinogenic potential” of cis- and trans-1,2-DCE. This cancer descriptor is based on the absence of epidemiological studies in humans and lack of animal studies designed to evaluate the carcinogenic potential of cis- or trans-1,2-DCE.

79
4.7.2. Synthesis of Human, Animal, and Other Supporting Evidence No epidemiologic studies evaluating possible long-term health effects of cis-1,2-DCE,
trans-1,2-DCE, or their mixture in humans were identified. The longest duration animal study, a 6-month inhalation study in four species (Dow, 1962), did not evaluate any histology or cancer endpoints. The 90-day feeding study by NTP (2002a) evaluated cancer endpoints but no positive findings were reported.
Evidence from genotoxicity and mutagenicity studies is inconclusive. For example, cis-1,2-DCE, trans-1,2-DCE, and their mixture have been mostly nonpositive in bacterial genotoxicity assays for gene reversion or DNA damage but gave positive results in some bacterial assays for mitotic recombination or aneuploidy, frequently in the absence of metabolic activation by S9. Results for chromosomal aberrations or sister chromatid exchanges in mammalian cells in culture were mixed, providing positive findings in the presence or absence of metabolic activation. Some in vivo assays gave positive results (host-mediated assay, chromosomal aberrations) for cis-1,2-DCE only, possibly reflecting the fact that hepatic uptake of cis-1,2-DCE is higher than that of trans-1,2-DCE.
Both cis- and trans-1,2-DCE are converted into reactive epoxides (oxiranes) by CYP450 enzymes. It is likely that epoxides are responsible for the inactivation of CYP2E1 by binding to its heme moiety, and protein adduct formation via sulfhydryl groups of amino acids has been shown to occur with 1,2-DCE (Maiorino et al., 1982; Sipes and Gandolfi, 1980). However, DNA adduct formation has not been demonstrated. DNA binding of 1,2-DCE was negative in an in vitro assay where other chlorinated hydrocarbons gave positive results (Sipes and Gandolfi, 1980).
Positive results have been obtained with cis-1,2-DCE in several genotoxicity assays in the absence of metabolic activation, suggesting that the C=C double bond positioned next to two chlorine substituents might be reactive on its own. However, Henschler (1977), in an evaluation of the mutagenicity of halogenated olefins, pointed out that asymmetric distribution of chlorine substituents across the C–C bond, such as exists in 1,1-DCE, was far more likely to give rise to mutagenic events because the resulting epoxides are unstable, as compared with a symmetric distribution of the chlorines as exists in both cis- and trans-1,2-DCE. Evidence for other effects that could potentially lead to tumor formation, such as redox cycling, GSH depletion, or lipid peroxidation, has not been shown for cis- or trans-1,2-DCE.
The fact that both cis- and trans-1,2-DCE form epoxides and/or radicals as active metabolites raises the question of whether these intermediates represent structural alerts. Laurence et al. (1984) performed a computational study of the reactivities of vinyl chloride and trans-1,2-DCE by evaluating the bond energies of protonated chlorine or oxygen in the corresponding chlorooxiranes. Their assessment indicated that the oxirane from trans-1,2-DCE should form a guanine N7 adduct analogous to the one found after vinyl chloride exposure that is thought to be the cause of vinyl chloride-related cancer. However, this evaluation also predicted

80
that the trans-1,2-DCE oxirane would be far more reactive than the one formed by vinyl chloride, rapidly reacting with other cellular nucleophiles before sufficient quantities could reach critical targets in the DNA, and thus predicting a lack of carcinogenicity associated with trans-1,2-DCE. 4.8. SUSCEPTIBLE POPULATIONS AND LIFE STAGES 4.8.1. Possible Childhood Susceptibility
No information is available concerning maternal exposure or health effects in developing humans exposed to cis- and/or trans-1,2-DCE. One animal study (DuPont, 1988a; published in Hurtt et al., 1993) investigated the potential for trans-1,2-DCE to induce fetotoxicity or developmental toxicity in pregnant rats exposed to this agent via inhalation at concentrations of 7,930–47,580 mg/m3 for 6 hours daily on GDs 7–16. The results were negative; no malformations were identified, and fetal weight loss was associated only with concentrations that were overtly maternally toxic. On the basis of this study, trans-1,2-DCE is not expected to cause fetotoxicity or developmental effects in humans; however, the limited information does not support an assessment of potential developmental toxicity. No studies were conducted that addressed childhood susceptibility to either cis- or trans-1,2-DCE.
4.8.2. Possible Gender Differences
Acute toxicity studies in animals provide suggestive evidence that males may be more sensitive than females to either cis- or trans-1,2-DCE (McCauley et al., 1995; Hayes et al., 1987). Hanioka et al. (1998) demonstrated that both cis- and trans-1,2-DCE were far more effective in affecting the activity of CYP450s in male rat hepatic microsomes as compared with female preparations. However, conclusions about gender differences in response to 1,2-DCE exposure cannot be drawn based on this limited information.
4.8.3. Other—Genetic Polymorphisms Four specific enzymes have been associated with the metabolism of cis- or
trans-1,2-DCE: CYP2E1, CYP3A4, ADH, and GSTZ. Of the CYP450s, CYP3A4 is active toward these compounds in rats (Costa and Ivanetich, 1982) but most likely not in humans (Guengerich et al., 1991) (for details, see Sections 3.3.1 and 3.3.2). ADHs represent a whole family of enzymes, several members of which display gene polymorphism. Because the specific type of ADH, that according to Costa and Ivanetich (1982) and Filser and Bolt (1980) may be involved in 1,2-DCE metabolism, has not been characterized, possible variation in susceptibility associated with ADHs is not further considered here. CYP2E1 and GSTZ, as enzymes whose polymorphisms might affect the susceptibility of humans towards cis- or trans-1,2-DCE, are discussed below.

81
4.8.3.1. CYP450 2E1 CYP2E1 is constitutively expressed in human liver but is inducible by a variety of
factors, prominently by ethanol consumption, diabetes, or hunger, with in vivo activity levels varying up to 20-fold (Rannug et al., 1995). At least six allelic variants of CYP2E1 are known to exist in humans (Bartsch et al., 2000). Variation in the expression of CYP2E1 could influence susceptibility to the effects of cis- or trans-1,2-DCE. Quantitative information on variation in human hepatic levels of CYP2E1 and other CYP450 enzymes demonstrates considerable intrahuman variability. Lipscomb et al. (1997) reported a sevenfold range in activity of CYP2E1 among hepatic microsomal samples from 23 subjects. Snawder and Lipscomb (2000) demonstrated a 12-fold difference in CYP2E1 between the highest and lowest samples from 40 samples of microsomes from adult human liver organ donors. Qualitatively, the presence of multiple susceptibility factors will increase the variability that is seen in a population response to 1,2-DCE toxicity.
In Caucasians, so far, no variation in catalytic activity has been associated with genotype; >90% of Caucasians carry the homozygous wild-type c1/c1 allele. Asians, however, also carry the variant c2 allele, and the homozygous form of that allele, c2/c2, has been shown to have lower catalytic activity than the wild-type or the c1/c2 heterozygote (Bartsch et al., 2000). The frequency of the c2 allele has been reported to be 19–24% in Asians, and the frequencies of other variants are also much higher in Asians than in Caucasians (Rannug et al., 1995). There is evidence that the homozygous allele c2/c2 and, to a lesser extent, the heterozygote c1/c2 are associated with an increased risk for several cancer types (Bartsch et al., 2000). Thus, the possibility exists that polymorphism of the CYP2E1 gene may affect the susceptibility of humans to the effects of cis- and/or trans-1,2-DCE.
4.8.3.2. Glutathione S-Transferase
Although DCA is likely a minor metabolite of cis- and trans-1,2-DCE, it is considered a likely human carcinogen, and therefore, genetic polymorphism of the enzyme that metabolizes DCA, GSTZ, may play a role in human susceptibility. GSTZ is polymorphic in humans; at this time, five variants have been described that carry combinations of two possible A/G and/or two possible T/C transitions (U.S. EPA, 2003). The known variants are designated GSTZ1a-1a, GSTZ1b-1b, GSTZ1c-1c, GSTZ1d-1d, and GSTZ1e-1e (Blackburn et al., 2001, 2000; Tzeng et al., 2000). Blackburn et al. (2000) analyzed blood samples of Caucasians (68 female and 73 male Australians of European descent, ages 16–69) and demonstrated that allele frequencies for variants 1a, 1b, and 1c were 0.09, 0.28, and 0.63, respectively. In the following year, Blackburn et al. (2001) refined their analysis to comprise all five variants, using 128 Australian subjects of European descent, and found variant distributions of 0.086, 0.285, 0.473, 0.156, and 0 for GSTZ1a-1a, GSTZ1b-1b, GSTZ1c-1c, GSTZ1d-1d, and GSTZ1e-1e, respectively. Board et al. (2001) produced recombinant versions of variants GSTZ*A through GSTZ*D—

82
corresponding to the variant alleles GSTZ1a-1a through GSTZ1d-1d—and tested their in vitro catalytic activities toward DCA. GSTZ*A had the highest activity with 1.61 µmol/minute/mg protein, followed by *B and *C each with 0.45, and *D with 0.3 µmol/minute/mg protein. Given the fact that only 9% of Caucasians carry the high-activity allele, the low-activity allelic variants may contribute to an increased susceptibility to the effects of DCA and, thus, also of cis- or trans-1,2-DCE.
83
5. DOSE-RESPONSE ASSESSMENT
5.1. ORAL REFERENCE DOSE (RfD) 5.1.1. cis-1,2-DCE 5.1.1.1. Choice of Principal Study and Critical Effect—with Rationale and Justification
The effects of oral exposure to cis-1,2-DCE in humans have not been investigated. McCauley et al. (1995, 1990) is the only published oral toxicity study of cis-1,2-DCE. Male and female Sprague-Dawley rats were administered 0, 32, 97, 291, or 872 mg/kg-day cis-1,2-DCE by corn oil gavage for 90 days. Terminal body weights of male rats in the two highest dose groups were lower than controls by 10–11%, but were not statistically significantly reduced. Relative liver weight (expressed as a ratio to body weight) was significantly increased in male and female rats at doses ≥97 mg/kg-day and relative kidney weight was significantly increased in male rats at all dose levels. Investigators reported no significant compound-related histopathological lesions of the liver or kidney. Statistically significant, but marginal, decreases in certain hematological parameters (primarily hemoglobin and hematocrit) were observed at doses ≥97 mg/kg-day. As discussed in Section 4.2.1.2.1, some errors and inconsistencies were identified upon examination of the unpublished (McCauley et al., 1990) and published (McCauley et al., 1995) versions of the study, principally related to the documentation of administered doses by the study authors, inconsistencies in reporting of methods, and some transcription or calculation errors in the unpublished report and published paper. These errors and inconsistencies suggest data reporting issues, but not issues with the study findings themselves. As the only repeat-dose study of cis-1,2-DCE toxicity, this study was used as the basis for the oral RfD.
There were overall increasing trends for both absolute and relative liver and kidney weight in rats exposed to cis-1,2-DCE. Increases in liver weight alone (increases in relative liver weight of up to 32 and 30% in high-dose male and female rats, respectively) are difficult to interpret. Liver weight changes occurred in the absence of compound-related changes in liver histopathology and AST, and measurements of other clinical chemistry indicators of liver function were not performed as part of this study. Similarly, increases in kidney weight in high-dose male and female rats (increases in relative kidney weight of up to 27 and 23%, respectively) occurred in the absence of renal histopathology and BUN and creatinine levels indicative of renal dysfunction. As discussed in Section 4.6.1.1, the biological significance of liver and kidney weight changes in the absence of other histopathologic and clinical chemistry changes is difficult to interpret. Because these organ weight changes could represent early indicators of liver and kidney toxicity, increased liver and kidney weight, as reported McCauley et al. (1995, 1990), were considered as candidate critical effects. Because relative organ weight changes (i.e., expressed as a percent of body weight) adjust for any changes in body weight, data for relative
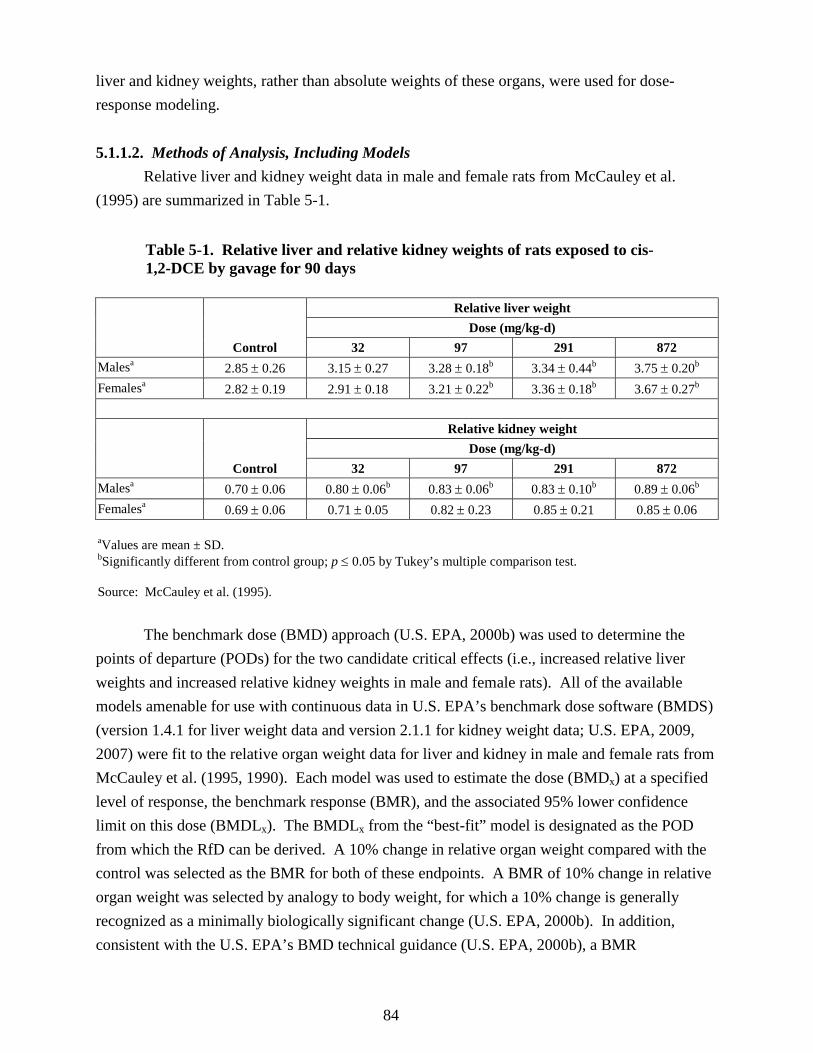
84
liver and kidney weights, rather than absolute weights of these organs, were used for dose-response modeling.
5.1.1.2. Methods of Analysis, Including Models
Relative liver and kidney weight data in male and female rats from McCauley et al. (1995) are summarized in Table 5-1.
Table 5-1. Relative liver and relative kidney weights of rats exposed to cis-1,2-DCE by gavage for 90 days
Control
Relative liver weight Dose (mg/kg-d)
32 97 291 872 Malesa 2.85 ± 0.26 3.15 ± 0.27 3.28 ± 0.18b 3.34 ± 0.44b 3.75 ± 0.20b Femalesa 2.82 ± 0.19 2.91 ± 0.18 3.21 ± 0.22b 3.36 ± 0.18b 3.67 ± 0.27b
Control
Relative kidney weight Dose (mg/kg-d)
32 97 291 872 Malesa 0.70 ± 0.06 0.80 ± 0.06b 0.83 ± 0.06b 0.83 ± 0.10b 0.89 ± 0.06b Femalesa 0.69 ± 0.06 0.71 ± 0.05 0.82 ± 0.23 0.85 ± 0.21 0.85 ± 0.06
aValues are mean ± SD. bSignificantly different from control group; p ≤ 0.05 by Tukey’s multiple comparison test. Source: McCauley et al. (1995).
The benchmark dose (BMD) approach (U.S. EPA, 2000b) was used to determine the points of departure (PODs) for the two candidate critical effects (i.e., increased relative liver weights and increased relative kidney weights in male and female rats). All of the available models amenable for use with continuous data in U.S. EPA’s benchmark dose software (BMDS) (version 1.4.1 for liver weight data and version 2.1.1 for kidney weight data; U.S. EPA, 2009, 2007) were fit to the relative organ weight data for liver and kidney in male and female rats from McCauley et al. (1995, 1990). Each model was used to estimate the dose (BMDx) at a specified level of response, the benchmark response (BMR), and the associated 95% lower confidence limit on this dose (BMDLx). The BMDLx from the “best-fit” model is designated as the POD from which the RfD can be derived. A 10% change in relative organ weight compared with the control was selected as the BMR for both of these endpoints. A BMR of 10% change in relative organ weight was selected by analogy to body weight, for which a 10% change is generally recognized as a minimally biologically significant change (U.S. EPA, 2000b). In addition, consistent with the U.S. EPA’s BMD technical guidance (U.S. EPA, 2000b), a BMR
85
corresponding to a change in the mean response equal to 1 SD of the control mean was also used to generate estimated BMDs and BMDLs for comparison purposes.
Details of the BMD modeling conducted for each endpoint presented in Table 5-1 are provided in Appendix B. In general, consistent with U.S. EPA’s technical guidance (U.S. EPA, 2000b), model fit was assessed by a chi-square goodness-of-fit test (i.e., models with p < 0.1 failed to meet the goodness-of-fit criterion) and the Akaike’s Information Criterion (AIC) value (i.e., a measure of the deviance of the model fit that allows for comparison across models for a particular endpoint). Of the models exhibiting adequate fit (as assessed by the chi-square test), the model yielding the lowest AIC value was selected as the best-fit model (as long as the BMDL estimates across the models exhibiting adequate fit were sufficiently close). If the BMDL estimates across the adequately fitting models were not sufficiently close, the model yielding the lowest BMDL was selected as the best-fit model. If more than one model shared the lowest AIC, BMDL values from these models were averaged to obtain a POD (U.S. EPA, 2000b).
Relative liver weight In the female rat, only the Hill model (with the power parameter restricted to be >1) adequately fit the relative liver weight data (Test 4: χ2 p > 0.1). The other two continuous models fit to these data, the first-degree polynomial and power models, exhibited significant lack of fit (p < 0.1). Table B-1 in Appendix B presents the goodness-of-fit statistics and corresponding BMD and BMDL estimates for all three continuous models (i.e., first-degree polynomial, power, and Hill models) fit to these data. The Hill model predicted a BMD10 and BMDL10 of 80.5 and 42.3 mg/kg-day, respectively. For comparison purposes, this same model was fit to these data using a BMR corresponding to a change in the mean response equal to one standard deviation (SD) of the control mean, and yielded BMD1SD and BMDL1SD estimates of 53.2 and 28.8 mg/kg-day, respectively. In this particular case, 1 SD of the control mean represented about a 7% change in relative liver weight.
For the male rat, only the Hill model (with power restricted to be >1) adequately fit the relative liver weight data (Test 4: χ2 p > 0.1). The other two continuous models fit to these data, the first-degree polynomial and power models, exhibited significant lack of fit (p < 0.1). Table B-2 in Appendix B presents the goodness-of-fit statistics and corresponding BMD and BMDL estimates for all three continuous models (i.e., first-degree polynomial, power, and Hill models) fit to these data. The variance model employed was not satisfactory (Test 3: χ2 p = 0.049), but because the selected BMR is not expressed on the basis of the SD, the impact on the POD is minimal. Therefore, the Hill model was considered to provide an adequate fit to the male rat relative liver weight data. This model predicted a BMD10 and BMDL10 of 54.4 and 18.6 mg/kg-day, respectively. For comparison purposes, this same model was fit to these data using a BMR corresponding to a change in the mean response equal to 1 SD of the control mean, and yielded

86
BMD1SD and BMDL1SD estimates of 40.4 and 13.0 mg/kg-day, respectively. In this particular case, 1 SD of the control mean represented about a 9% change in relative liver weight. See Appendix B for further details regarding the BMD modeling of male and female rat relative liver weight data for cis-1,2-DCE.
The BMDL10 estimates corresponding to a 10% increase in relative liver weight in male and female rats were 18.6 and 42.3 mg/kg-day, respectively. The candidate POD for the RfD for cis-1,2-DCE based on liver weight changes in male and female rats was chosen to be 18.6 mg/kg-day, the lower of the two BMDL10 values.
Relative kidney weight For the male rat, BMDS modeling of relative kidney weight data showed that only the Hill model adequately fit the data (Test 4: χ2 p > 0.1). The other continuous models fit to these data, the polynomial (linear and degree >2) and power models, exhibited significant lack of fit (p < 0.1). Table B-3 in Appendix B presents the goodness-of-fit statistics and corresponding BMD and BMDL estimates for all continuous models fit to these data (i.e., linear, polynominal, power, and Hill models). The Hill model estimated BMD10 and BMDL10 values of 19.8 and 5.1 mg/kg-day, respectively. For comparison purposes, this same model was fit to these data using a BMR corresponding to a change in the mean response equal to 1 SD of the control mean, and yielded BMD1SD and BMDL1SD estimates of 19.0 and 5.1 mg/kg-day, respectively.
For the female rat, Table B-4 in Appendix B presents the goodness-of-fit statistics and corresponding BMD and BMDL estimates for all four models fit to the relative kidney weight data (i.e., second-degree polynominal, first-degree polynomial, power, and Hill models). The Hill model provided the best fit, estimating BMD10 and BMDL10 values of 55.2 and 10.4 mg/kg-day, respectively. For comparison purposes, this same model was fit to these data using a BMR corresponding to a change in the mean response equal to 1 SD of the control mean; BMDS failed to generate a BMDL when this model was fit to these data. The candidate POD based on relative kidney weight changes in male and female rats was chosen to be 5.1 mg/kg-day, the lower of the two BMDL10 values. Selection of critical effect and POD
The BMDL10 estimate for a 10% increase in relative liver weight in the male rat was 18.6 mg/kg-day and the BMDL10 estimate for 10% increase in relative kidney weight in the male rat was 5.1 mg/kg-day. Increased relative kidney weight was selected as the critical effect on which to base the derivation of the RfD because it yielded the lowest BMDL10 (i.e., is the more sensitive of the two endpoints).

87
5.1.1.3. RfD Derivation—Including Application of Uncertainty Factors (UFs) An RfD of 0.002 mg/kg-day for cis-1,2-DCE was derived by applying a composite
uncertainty factor (UF) of 3,000 to the BMDL10 (POD) for the critical effect of increased relative kidney weight in the male rat of 5.1 mg/kg-day, as follows:
RfD = BMDL10/UF = 5.1 mg/kg-day/3,000 = 0.002 mg/kg-day The composite UF of 3,000 includes factors of 10 to protect susceptible individuals, 10 to
extrapolate from animals to humans, 10 for use of a study of subchronic duration, and 3 to account for database deficiencies.
• An intraspecies UF (UFH) of 10 was applied to account for potentially sensitive human subpopulations in the absence of quantitative information on the variability of response to cis-1,2-DCE in the human population. Factors that could contribute to a range of human response to cis-1,2-DCE were discussed in Section 4.8. Intrahuman variability in CYP450 levels that are responsible for metabolism of cis-1,2-DCE to reactive metabolites has been documented (see Section 4.8). This variation in CYP450 could alter susceptibility to cis-1,2-DCE toxicity. Individual variability in nutritional status, alcohol consumption, or the presence of underlying disease could also alter metabolism of cis-1,2-DCE. To account for these uncertainties, a factor of 10 was included for individual variability.
• An interspecies UF of 10 (UFA) was applied to account for variability in extrapolating
from laboratory animals to humans. Chemical-specific data are unavailable regarding the toxicokinetic or toxicodynamic differences between rats and humans. In the absence of information to quantify these differences, a factor of 10 was applied.
• An UF of 1 was used to account for extrapolation from a LOAEL to a no-observed-
adverse-effect level (NOAEL) (UFL) because the current approach is to address this factor as one of the considerations in selecting a BMR for BMD modeling. In this case, a BMR of a 10% change in relative kidney weight compared with the control was selected under an assumption that it represents a minimal biologically significant change.
• An UF of 10 was used to account for extrapolating from a POD for a subchronic
exposure duration to estimate chronic exposure conditions (UFS). • An UF of 3 was used to account for database deficiencies (UFD). The study used in this
RfD derivation, McCauley et al. (1995, 1990), is the only study of repeat-dose toxicity available for cis-1,2-DCE. The database for this isomer is missing studies of reproductive toxicity, including a two-generation reproductive toxicity study, and developmental toxicity; however, the developmental toxicity potential for cis-1,2-DCE is informed by a series of range-finding studies of the developmental toxicity of a mixture of 1,2-DCE isomers (composition of isomers unknown) (NTP, 1991a, b, c). No evidence of developmental toxicity was observed in mice or rats based on the parameters evaluated
88
in these range-finding studies (gravid uterus weight, fetal body weight, number of fetuses [live/dead], implantation sites, and resorptions).
5.1.1.4. Previous Oral Assessment
An oral RfD for cis-1,2-DCE was not previously available on IRIS. 5.1.2. trans-1,2-DCE 5.1.2.1. Choice of Principal Studies and Critical Effects—with Rationale and Justification
The effects of oral exposure to trans-1,2-DCE in humans have not been investigated. No chronic studies of trans-1,2-DCE in experimental animals are available. There are four subchronic studies of oral exposure to trans-1,2-DCE (NTP, 2002a; Hayes et al., 1987; Barnes et al., 1985; Shopp et al., 1985). Table 4-13 presents a summary of these studies.
In a 14-week gavage study, NTP (2002) examined the effects of trans-1,2-DCE in both sexes of F344/N rats and B6C3F1 mice. Doses ranged from 190 to 3,210 mg/kg-day in male rats; 190–3,245 mg/kg-day in female rats; 480–8,065 mg/kg-day in male mice; and 450–7,925 mg/kg-day in female mice. Both untreated and vehicle controls were used. Rats exhibited a decrease (approximately 6%) in final mean body weight and body weight gain, a minimal (no greater than 13%), but transient, decrease in ALP activity that was not considered by the authors to be toxicologically relevant, a significant increase in relative liver weight (up to approximately a 10% increase in females), and a significant decrease in kidney weight (up to a 7% decrease in males), but no gross or histological lesions in these organs. The relative liver weight changes in treated female rats were statistically significantly increased (about 6–10%) compared with controls at doses of ≥395 mg/kg-day; male rats exhibited slight increases (<6%). Similarly, in mice, there were generally no dose-related alterations in clinical chemistry parameters and no dose-related deaths. Mice exhibited an approximate 4–7% decrease in final mean body weight and body weight gain, and a significant increase in relative liver weight (9–15% increase at doses ≥1,900 mg/kg-day in males and an approximately 11% increase at doses ≥3,760 mg/kg-day in females), but no gross or histological lesions were observed in these organs.
Barnes et al. (1985) and Hayes et al. (1987) are 90-day drinking water studies. The most prominent effect observed by Barnes et al. (1985) was a statistically significant increase in serum ALP levels of 62 and 33% in male mice at the 175 and 387 mg/kg-day doses, respectively. These increases showed no dose-response relationship, were not found in the female mice, and were within the normal range for this strain of mouse. A statistically significant increase in mean absolute liver weights and relative liver weights (expressed as a ratio of liver weight to body weight) was also demonstrated in male mice at the mid dose in the Barnes et al. (1985) study; however, absolute liver weights in the low- and high-dose groups were less than those of the controls. Additionally, absolute thymus weight was reduced by 24% (statistically significant) at the high dose in females, and relative thymus weights were statistically significantly reduced
89
in the mid- and high-dose females. The only treatment-related effects observed by Hayes et al. (1987) were small, but statistically significant, increases in absolute kidney weight (8–9%) in female rats at doses of 1,257 and 2,809 mg/kg-day.
Immunotoxicity of trans-1,2-DCE in CD-1 mice was assessed in a 90-day drinking water study by Shopp et al. (1985). A dose-related suppression of sRBC-specific AFCs was observed in the spleens of male mice treated with trans-1,2-DCE. Shopp et al. (1985) reported marked suppression in humoral immune status in male mice at 175 and 387 mg/kg-day as indicated by the significantly decreased number of AFCs in these mice (when expressed as AFCs per 106 cells).
The subchronic studies by NTP (2002a), Hayes et al. (1987), and Barnes et al. (1985) provide limited evidence for effects of trans-1,2-DCE on other organs. Although there are some positive hematological findings associated with trans-1,2-DCE exposure (NTP, 2002a; Hayes et al.,1987; Barnes et al.,1985), changes in these parameters were not dose-related or consistent across sexes except for decreases in RBC counts (NTP, 2002a). Decreases in the RBC count were small and were not considered biologically significant. Therefore, the available evidence does not support consideration of changes in hematological parameters as a critical effect for trans-1,2-DCE. Body weights were dose-dependently reduced in male rats (NTP, 2002a) by about 6%. Such reductions were not observed in other oral studies of trans-1,2-DCE.
Decreased number of AFCs against sRBCs (Shopp et al., 1985), decreased absolute thymus weight (Barnes et al. (1985), and increased liver weight (NTP, 2002a) were considered for derivation of potential PODs to serve as the basis of the trans-1,2-DCE RfD. The immunological response reported in Shopp et al. (1985) is regarded as a biologically significant response and was observed at relatively low doses (≥175 mg/kg-day) of trans-1,2-DCE. Absolute thymus weight was reduced by 24% (statistically significant) at the high dose in females, and relative thymus weights were statistically significantly reduced in the mid- and high-dose females. Changes in thymus weight were not consistently observed across oral toxicity studies of trans-1,2-DCE (see Section 4.6.1.2); however, the reduction in thymus weight observed in Barnes et al. (1985) is considered consistent with the immunological response reported by Shopp et al. (1985). Because there was no treatment-related effect on body weight, absolute thymus weight was used as a candidate critical effect. A review of the subchronic toxicity studies for trans-1,2-DCE provides support for the liver as a target organ of toxicity. Liver weight changes were observed in female rats and male and female mice exposed to trans-1,2-DCE in NTP (2002a). The female rats exposed to trans-1,2-DCE (190–3,245 mg/kg-day) exhibited statistically significant increases in liver weight at doses ≥395 mg/kg-day. Liver weights were increased in both male and female mice exposed to trans-1,2-DCE (450–8,065 mg/kg-day), although the male mice were more sensitive with significant increases at doses ≥1,900 mg/kg-day compared with the increases in females at doses ≥3,760 mg/kg-day. To adjust

90
for treatment-related changes in body weight, relative liver weight was used as the candidate critical effect.
5.1.2.2. Methods of Analysis—Including Models
The benchmark dose (BMD) approach (U.S. EPA, 2000b) was used to determine the PODs for the three candidate critical effects (i.e., decreased number of AFCs against sRBCs in male and female mice (Shopp et al., 1985), decreased absolute thymus weight in female mice (Barnes et al., 1985), and increased relative liver weight in male and female mice and rats (NTP, 2002a)). All of the available models amenable for use with continuous data in U.S. EPA’s benchmark dose software (BMDS, version 1.4.1 or 2.1.1) were fit to these data. Each model was used to estimate the dose (BMDx) at a specified level of response, the BMR, and the associated 95% lower confidence limit on this dose (BMDLx). The BMDLx from the “best-fit” model is designated as the POD from which the RfD can be derived. For absolute thymus weight and relative liver weight, a 10% change compared with the control was selected as the BMR. A BMR of 10% change in organ weight was selected by analogy to body weight, for which a 10% change is generally recognized as a minimally biologically significant change (U.S. EPA, 2000b). In addition, consistent with the U.S. EPA’s BMD technical guidance (U.S. EPA, 2000b), for all three endpoints, a BMR corresponding to a change in the mean response equal to 1 SD of the control mean was used to generate estimated BMDs and BMDLs.
Details of the BMD modeling conducted using the data for each endpoint presented in Tables 5-2, 5-3, and 5-4 are provided in Appendix B. In general, consistent with U.S. EPA’s technical guidance (U.S. EPA, 2000b), model fit was assessed by a chi-square goodness-of-fit test (i.e., models with p < 0.1 failed to meet the goodness-of-fit criterion) and the Akaike’s Information Criterion (AIC) value (i.e., a measure of the deviance of the model fit that allows for comparison across models for a particular endpoint). Of the models exhibiting adequate fit (as assessed by the chi-square test), the model yielding the lowest AIC value was selected as the best-fit model (as long as the BMDL estimates across the models exhibiting adequate fit were sufficiently close). If the BMDL estimates across the adequately fitting models were not sufficiently close, the model yielding the lowest BMDL was selected as the best-fit model. If more than one model shared the lowest AIC, BMDL values from these models were averaged to obtain a POD (U.S. EPA, 2000b). AFC response to sRBCs
Immune response data for trans-1,2-DCE (i.e., decreased number of AFCs against sRBCs) based on Shopp et al. (1985) are summarized in Table 5-2.

91
Table 5-2. Humoral immune response to sRBCs in CD-1 mice exposed to trans-1,2-DCE in drinking water for 90 days (day 4)
Exposure group Spleen weight (mg) AFCs per spleen (× 10-5) AFCs per 106 cells Malesa
Control 202 ± 30 4.48 ± 0.32 2,200 ± 125 0.1 mg/mL (17 mg/kg-d) 164 ± 13 3.28 ± 0.28b 2,048 ± 152 1.0 mg/mL (175 mg/kg-d) 178 ± 6 3.34 ± 0.39b 1,625 ± 136b
2.0 mg/mL (387 mg/kg-d) 173 ± 10 2.87 ± 0.37b 1,618 ± 226b
Femalesa Control 228 ± 13 4.38 ± 0.37 1,765 ± 110 0.1 mg/mL (23 mg/kg-d) 176 ± 11b 2.97 ± 0.49b 1,478 ± 211 1.0 mg/mL (224 mg/kg-d) 230 ± 12 4.51 ± 0.24 1,967 ± 89
2.0 mg/mL (452 mg/kg-d) 191 ± 13b 3.47 ± 0.50 1,518 ± 184
aValues are mean ± SE for 12 mice in the control group and 8 mice in treatment groups, measured on day 4 after antigen presentation. bValues differ significantly from control group, p < 0.05. Source: Shopp et al. (1985).
Little information exists concerning the biological significance of particular changes in AFC levels in rodents, and what these changes would correspond to in humans. Therefore, as recommended for continuous data in the Benchmark Dose Technical Guidance Document (U.S. EPA, 2000b), a change in the mean response equal to 1 SD of the control mean was used as the BMR to facilitate a consistent basis of comparison across assessments for this endpoint in the absence of information regarding the level of change considered to be biologically significant. In this case, a BMR of 1 SD corresponds to a 20% decrease in AFCs per 106 spleen cells.
Table B-5 in Appendix B presents the goodness-of-fit statistics and corresponding BMD1SD and BMDL1SD estimates for all four models fit to these data (i.e., second-degree polynominal, first-degree polynomial, power, and Hill models). The best-fitting model chosen, based on the model selection criteria outlined above, was a second-degree polynomial model, yielding a BMD1SD of 125.6 mg/kg-day and a BMDL1SD of 65 mg/kg-day. The BMDL1SD of 65 mg/kg-day was identified as a candidate POD for trans-1,2-DCE. Absolute thymus weight
Thymus weight data for female mice from Barnes et al. (1985) are summarized in Table 5-3. No treatment-related effects on thymus weight were observed in male mice.
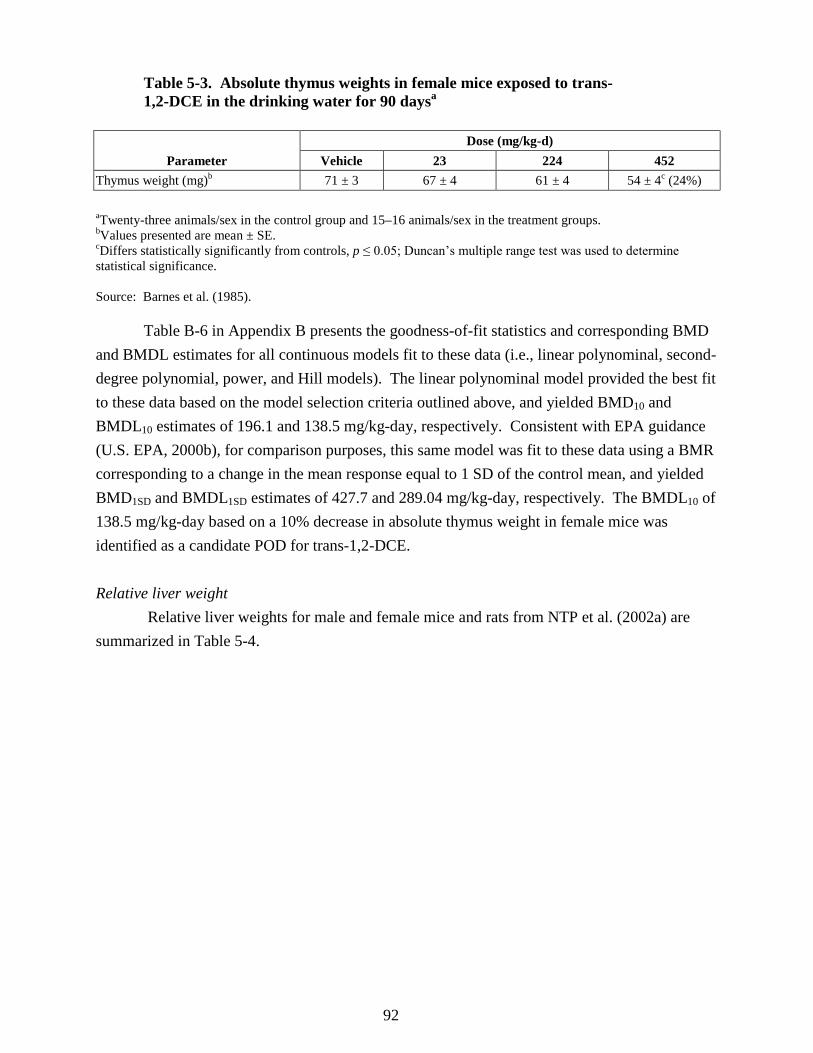
92
Table 5-3. Absolute thymus weights in female mice exposed to trans-1,2-DCE in the drinking water for 90 daysa
Parameter Dose (mg/kg-d)
Vehicle 23 224 452 Thymus weight (mg)b 71 ± 3 67 ± 4 61 ± 4 54 ± 4c (24%) aTwenty-three animals/sex in the control group and 15–16 animals/sex in the treatment groups. bValues presented are mean ± SE. cDiffers statistically significantly from controls, p ≤ 0.05; Duncan’s multiple range test was used to determine statistical significance. Source: Barnes et al. (1985).
Table B-6 in Appendix B presents the goodness-of-fit statistics and corresponding BMD and BMDL estimates for all continuous models fit to these data (i.e., linear polynominal, second-degree polynomial, power, and Hill models). The linear polynominal model provided the best fit to these data based on the model selection criteria outlined above, and yielded BMD10 and BMDL10 estimates of 196.1 and 138.5 mg/kg-day, respectively. Consistent with EPA guidance (U.S. EPA, 2000b), for comparison purposes, this same model was fit to these data using a BMR corresponding to a change in the mean response equal to 1 SD of the control mean, and yielded BMD1SD and BMDL1SD estimates of 427.7 and 289.04 mg/kg-day, respectively. The BMDL10 of 138.5 mg/kg-day based on a 10% decrease in absolute thymus weight in female mice was identified as a candidate POD for trans-1,2-DCE. Relative liver weight Relative liver weights for male and female mice and rats from NTP et al. (2002a) are summarized in Table 5-4.

93
Table 5-4. Relative liver weights in male and female mice and rats exposed to trans-1,2-DCE in the feed for 14 weeksa
Male mice Dose (mg/kg-d)
0 480 920 1,900 3,850 8,065 4.347 ± 0.056 4.552 ± 0.113 4.597 ± 0.115 4.745 ± 0.084b 4.736 ± 0.079b 4.979 ± 0.111b
Female mice Dose (mg/kg-d)
0 450 915 1,830 3,760 7,925 4.621 ± 0.07 4.738 ± 0.068 4.970 ± 0.127 4.813 ± 0.05 5.115 ± 0.139b 5.117 ± 0.08b
Male rats Dose (mg/kg-d)
0 190 380 770 1,540 3,210 3.465 ± 0.058 3.538 ± 0.032 3.658 ± 0.099 3.524 ± 0.050 3.492 ± 0.048 3.634 ± 0.056
Female rats Dose (mg/kg-d)
0 190 395 780 1,580 3,245 2.937 ± 0.038 3.040 ± 0.052 3.220 ± 0.066b 3.100 ± 0.051b 3.132 ± 0.052b 3.216 ± 0.051b
aTen animals per group; values are mean ± SE. bStatistically significant, p ≤ 0.01. Source: NTP (2002a).
Only the male mouse relative liver weight data could be adequately modeled by the
continuous models currently available in BMDS. For these data, the Hill model (with the power parameter restricted to be >1) and two other continuous models, the first-degree polynomial and power models, did not exhibit significant lack of fit (based on χ2 p-value > 0.1). The Hill model exhibited the best fit of these data based on the model selection criteria outlined above. Table B-7 in Appendix B presents the goodness-of-fit statistics and corresponding BMD and BMDL estimates for all three continuous models fit to these data (i.e., first-degree polynomial, power, and Hill models). The Hill model estimated BMD10 and BMDL10 values of 3,241.9 and 867.3 mg/kg-day, respectively. Consistent with EPA guidance (U.S. EPA, 2000b), for comparison purposes, this same model was fit to these data using a BMR corresponding to a change in the mean response equal to 1 SD of the control mean, yielding BMD1SD and BMDL1SD estimates of 1,348.7 and 395.9 mg/kg-day, respectively. In this case, 1 SD of the control mean represented about a 4% change in relative liver weight. See Appendix B for further details regarding the BMD modeling of male mouse relative liver weight data for trans-1,2-DCE. The BMDL10 of 867.3 mg/kg-day based on a 10% increase in relative liver weight in male mice was identified as a candidate POD for trans-1,2-DCE.
Increased relative liver weight was observed in female mice and rats (Table 5-4), although these data sets were not amenable to BMD modeling because at least one of the mid-
94
level dose groups exhibited a decrease in relative liver weight yielding a nonmonotonically increasing dose-response function (see Tables B-8 and B-9 in Appendix B for further model details). Therefore, a NOAEL/LOAEL approach was applied to these data. In female mice, the NOAEL was 1,830 mg/kg-day and the LOAEL was 3,760 mg/kg-day, based on statistically significant increases in relative liver weight. In female rats, the NOAEL was 190 mg/kg-day and the LOAEL was 395 mg/kg-day, based on statistically significant increases in relative liver weight. The NOAEL of 190 mg/kg-day, based on a statistically significant increase in relative liver weight in female rats, was identified as a candidate POD for trans-1,2-DCE.
Selection of principal study, critical effect, and POD
The dose-response analysis of the immune, thymus, and liver endpoints, with PODs of 65.0, 138.5, and 190 mg/kg-day, respectively, suggests that the immune system is more sensitive to the effects of trans-1,2-DCE. Suppression of the humoral immune system, as measured by spleen cell antibody production directed against sRBCs, was selected as the critical effect for the trans-1,2-DCE RfD, and the Shopp et al. (1985) study was identified as the principal study. The BMDL1SD of 65 mg/kg-day was selected as the POD for deriving the RfD for trans-1,2-DCE.
5.1.2.3. RfD Derivation—Including Application of Uncertainty Factors (UFs)
To derive an RfD for trans-1,2-DCE, the BMDL1SD (POD) of 65 mg/kg-day (Shopp et al., 1985) was divided by a composite UF of 3,000. Therefore, the RfD for trans-1,2-DCE is calculated as follows:
RfD = BMDL1SD ÷ UF = 65 mg/kg-day ÷ 3,000 = 0.02 mg/kg-day The composite UF of 3,000 includes factors of 10 to protect sensitive individuals, 10 to
extrapolate from animals to humans, 10 for use of a study of subchronic duration, and 3 to account for database deficiencies.
• An intraspecies UF (UFH) of 10 was applied to account for potentially sensitive human
subpopulations in the absence of quantitative information on the variability of response to trans-1,2-DCE in the human population. Factors that could contribute to a range of human response to trans-1,2-DCE were discussed in Section 4.8. Intrahuman variability in CYP450 levels that are responsible for metabolism of trans-1,2-DCE to reactive metabolites has been documented (see Section 4.8). This variation in CYP450 could alter susceptibility to trans-1,2-DCE toxicity. Individual variability in nutritional status, alcohol consumption, or the presence of underlying disease could also alter metabolism of trans-1,2-DCE. To account for these uncertainties, a factor of 10 was included for individual variability.

95
• An interspecies UF of 10 (UFA) was applied to account for variability in extrapolating from laboratory animals to humans. Chemical-specific data are unavailable regarding the toxicokinetic or toxicodynamic differences between mice and humans. In the absence of information to quantify these differences, a factor of 10 was applied.
• An UF of 1 was used to account for extrapolation from a LOAEL to a NOAEL (UFL)
because the current approach is to address this factor as one of the considerations in selecting a BMR for BMD modeling. In this case, a BMR of 1 SD in spleen cell antibody production was selected under an assumption that it represents a minimal biologically significant change.
• An UF of 10 was used to account for extrapolating from a POD for a subchronic
exposure duration to estimate chronic exposure conditions (UFS).
• An UF of 3 was used to account for database deficiencies (UFD). There are several subchronic oral studies of trans-1,2-DCE (NTP, 2002a; Hayes, 1987; Barnes, 1985; Shopp, 1985). One study investigated developmental toxicity of trans-1,2-DCE via inhalation (DuPont, 1988a) and showed few developmental parameters to be affected by treatment. In this study developmental toxicity was manifest only in high-dose groups. Developmental toxicity potential for trans-1,2-DCE is also informed by a series of oral range-finding studies of the developmental toxicity of a mixture of 1,2-DCE isomers (composition of isomers unknown) (NTP, 1991a, b, c). No evidence of developmental toxicity was observed in mice or rats based on the parameters evaluated in these range-finding studies (gravid uterus weight, fetal body weight, and number of fetuses [live/dead], implantation sites, and resorptions). The database for trans-1,2-DCE is missing studies of reproductive toxicity, including a two-generation reproductive toxicity study.
5.1.2.4. Previous Oral Assessment The previous RfD of 0.02 mg/kg-day for trans-1,2-DCE was based on the 90-day
subchronic drinking water study in mice (Barnes et al., 1985). The critical effect was increased serum ALP in male mice. The LOAEL/NOAEL approach was used to derive the RfD. A POD of 17 mg/kg-day (NOAEL) was identified and a combined UF of 1,000 was applied, resulting in an RfD of 0.02 mg/kg-day. The UF of 1,000 accounted for the uncertainty in the extrapolation of dose levels from laboratory animals to humans (UFA = 10), uncertainty in the threshold for sensitive humans (UFH = 10), and uncertainty in extrapolating from subchronic to chronic exposure (UFS = 10), but did not account for database deficiencies.
The current assessment uses a different principal study and a different approach for the derivation of the RfD from the previous oral assessment. The Shopp et al. (1985) study was selected as the principal study. A decrease in spleen cell antibody production directed against sRBCs was identified as the critical effect. BMD modeling was used to analyze the data from the Shopp et al. (1985) study rather than a LOAEL/NOAEL approach as in the previous assessment. The composite UF of 3,000 includes an UF of 3 for deficiencies in the database that was not included in the derivation of the previous RfD.

96
5.2. INHALATION REFERENCE CONCENTRATION (RfC) 5.2.1. cis-1,2-DCE
There are no human, chronic, or subchronic inhalation studies for cis-1,2-DCE. The inhalation toxicity database for cis-1,2-DCE is limited to an acute study (DuPont, 1999) in male and female Crl:CD®BR rats from which an LC50 of 54,200 mg/m3 was calculated. Therefore, in the absence of repeat-dose toxicity studies, the available inhalation data for cis-1,2-DCE do not support derivation of an RfC.
An inhalation assessment for cis-1,2-DCE was not previously developed for the IRIS database.
5.2.2. trans-1,2-DCE
No epidemiological studies of the effects of inhalation exposure to trans-1,2-DCE in humans are available, and case reports involving acute exposure to 1,2-DCE do not provide data useful for derivation of an RfC. There are two ≥90-day duration studies using trans-1,2-DCE (DuPont, 1998; Freundt et al., 1977). The Freundt et al. (1977) subchronic study is a single dose study with liver endpoint data collected over several exposure durations and the DuPont (1998) report is available only as an unpublished study.
Freundt et al. (1977) exposed six rats/group for 8 hours/day, 5 days/week to air containing 792 mg/m3 (200 ppm) trans-1,2-DCE for 1, 2, 8, and 16 weeks. As shown in Table 4-7, histological changes included slight to severe fatty accumulation in the liver lobules and Kupffer cells after exposure to 792 mg/m3 for 1, 2, 8, and 16 weeks. For each of the exposure durations, there was no statistically significant difference between the controls and the exposed groups with respect to the incidence of liver effects (fat accumulation). In general, however, the incidence and severity of fat accumulation increased with increasing exposure duration.
In the DuPont (1998) study, male and female rats (15/sex/dose) were exposed to 0, 792, 3,960, or 15,800 mg/m3 (0, 200, 1,000, or 4,000 ppm) trans-1,2-DCE for 6 hours/day, 5 days/week for 90 days. Changes in relative and absolute liver and kidney weight were not statistically significant compared to controls. No exposure-related effects were seen in clinical or pathology parameters or on liver cell proliferation. The only hematological changes that showed dose-related trends at both 45 and 90 days in male and female rats were changes in WBC and lymphocyte counts. WBC decreased by up to 18–20% in male and female rats, and lymphocyte levels decreased by up to 22–25%.
Although Freundt et al. (1977) reported histopathologic changes in the liver of rats, the DuPont (1998) study did not corroborate the Freundt et al. (1977) study findings. DuPont (1998) reported relatively small increases in relative and absolute liver weight (1–8%) and no gross or microscopic changes of the liver attributable to trans-1,2-DCE at an exposure concentration

97
20-fold higher than that used in the Freundt et al. (1977) study. NTP (2002a) similarly found no histopathologic changes in the liver when trans-1,2-DCE was administered for 90 days by the oral route at dietary concentrations as high as 50,000 ppm. In light of the results of DuPont (1998) and NTP (2002a), it is difficult to explain the liver findings in the single-exposure concentration study by Freundt et al. (1977). Given the limitations of the Freundt et al. (1977) study (i.e., small sample size, use of only one exposure concentration, and observation of fatty accumulation in the liver lobules and Kupffer cells in control animals at some exposure durations) and lack of corroboration from other studies, the Freundt et al. (1977) study was not used as the basis for deriving an RfC for trans-1,2-DCE.
The findings from the DuPont (1998) study were also considered as the basis for RfC derivation. As noted above, increases in relative and absolute liver and kidney weight ranged from 1 to 8% but were not statistically significant.
As discussed in Section 4.6.2.2, the decreases in WBC and lymphocyte count reported in DuPont (1998), while treatment related, are of uncertain toxicological significance. The study authors suggested that the decreases in WBC and lymphocyte counts were attributable to the release of endogenous glucocorticoids that can cause redistribution of lymphocytes from the circulation into the lymphoid tissue and may, therefore, be considered a secondary effect associated with stress (Brondeau et al., 1990; Jensen, 1969). While plausible, specific support for this hypothesis was not provided.
The possibility exists that the decreased WBC and lymphocyte counts in rats in the DuPont (1998) inhalation study represent an effect on the immune system; however, the lack of histopathological changes of the spleen and thymus in the DuPont (1998) study are not consistent with a direct immunotoxic effect of trans-1,2-DCE. As discussed further in Section 4.6.2.2, the considerable variability in WBC and lymphocyte count across studies and with age of the rat within a study complicates the interpretation of the toxicological significance of these hematologic endpoints.
Further, the hematological findings from oral trans-1,2-DCE toxicity studies do not support a determination that trans-1,2-DCE induces toxicologically significant effects on these hematologic parameters. In a 90-day drinking water study, Barnes et al. (1985) reported sporadic changes in hematology parameters (prothrombin time, leukocytes, and polymorphonuclear leukocytes) in mice; changes in these parameters were not dose-related or consistent across sexes. In a second subchronic drinking water study of trans-1,2-DCE, Hayes et al. (1987) reported no treatment-related effects on hematologic parameters in rats at doses up to approximately 3,000 mg/kg-day. The NTP (2002a) 90-day oral study found slight changes in WBC and lymphocyte counts in male and female rats that were not statistically significantly different from the control and generally showed poor dose-response relationships.
98
In summary, the available inhalation data from DuPont (1998) and Freundt et al. (1977) were considered insufficient to support reference value derivation and, therefore, an RfC for trans-1,2-DCE was not derived.
No inhalation assessment for trans-1,2-DCE was previously included in the IRIS database.
5.3. UNCERTAINTIES IN THE ORAL REFERENCE DOSE
Risk assessments need to describe associated uncertainty. The following discussion identifies uncertainties associated with the RfDs for cis- and trans-1,2-DCE. RfC values were not derived for cis- or trans-1,2-DCE in this assessment. As presented earlier in this section, the UF approach, following EPA practices and RfD and RfC guidance (U.S. EPA, 2002b, 1994b) was applied to POD (BMDL10) values for the cis- and trans-1,2-DCE RfDs. Using this approach, the POD was divided by a set of factors to account for uncertainties associated with a number of steps in the analysis, including extrapolation from responses observed in animal bioassays to humans, extrapolation of data from subchronic exposure to chronic exposure, to account for a diverse population of varying susceptibilities, and to account for database deficiencies. Because information specific to cis- and trans-1,2-DCE was limited, default factors were generally applied for these extrapolations.
The human database for 1,2-DCE is limited to two early studies (from the 1930s) involving acute inhalation exposure; one of the two was a case report of 1,2-DCE (of unknown isomeric composition) and the other was a human subject study of trans-1,2-DCE with only two subjects. The animal database available to assess cis-1,2-DCE hazard is limited, consisting of limited acute oral and inhalation studies and a 14-day and 90-day toxicity study. The database for the trans- isomer, which includes multiple studies of acute and subchronic toxicity, developmental toxicity, and immunotoxicity, is more extensive (see Section 4). Uncertainties associated with gaps in the databases for both 1,2-DCE isomers and uncertainties associated with the data sets used to derive the RfDs for both 1,2-DCE isomers are more fully discussed below.
Selection of the critical effect for reference value determination. The selection of the
critical effect is a source of uncertainty for the oral RfD for both cis- and trans-1,2-DCE. For cis-1,2-DCE, kidney effects were noted as the critical effect. Increases in relative kidney weight up to 27% in high-dose male rats and up to 23% in female rats occurred in the absence of renal histopathology, and BUN and creatinine levels did not indicate renal dysfunction (McCauley et al., 1995, 1990). The biological significance of kidney weight changes in the absence of other histopathologic and clinical chemistry changes is difficult to interpret. Such increases in relative kidney weight could represent an early indicator of kidney toxicity. The absence of supporting evidence for kidney toxicity makes interpretation of the kidney weight findings difficult and the biological relevance of increased kidney weight uncertain.

99
The critical effect for the RfD for trans-1,2-DCE is based on decreased antibody production directed against sRBCs in male mice (Shopp et al., 1985). The AFC response exhibited a dose response. EPA determined that the 26% suppression in the number of sRBC-specific AFCs per 106 spleen cells of male mice in Shopp et al. (1985) is a biologically significant measure indicating suppressed antibody response associated with oral exposure to trans-1,2-DCE that is not contradicted by a lack of observed change in the hemagglutination assay to sRBCs or proliferative response to LPS. Suppression of T-cell-dependent antibody response as determined by the AFC assay to sRBCs is a well-validated endpoint that is highly predictive for immunotoxicity (Herzyk and Holsapple, 2007; Luster et al., 1992). Support for this critical effect can be found in the decreased thymus weight in the Barnes et al. (1985) study. Decreased thymus weight can be a good indicator of immunotoxicity and, when accompanied by decreased AFC response in the absence of general toxicity, serves as a predictor of immunotoxicity (Luster et al., 1992). In the case of trans-1,2-DCE, it should be noted, however, that decreased thymus weight was observed in female mice, whereas decreased AFC response was observed in male mice. Confidence in the critical effect for the trans-1,2-DCE RfD would be increased if the positive immune response reported by Shopp et al. (1985) was corroborated by similar findings in a second study.
Dose-response modeling. BMD modeling was used to estimate the POD for the cis- and trans-1,2-DCE RfDs. BMD modeling has advantages over a POD based on a NOAEL/LOAEL approach because the latter is a reflection of the particular doses (and dose spacing) selected in the principal study. The NOAEL/LOAEL approach lacks characterization of the dose-response curve and for this reason is less informative than a POD obtained from BMD modeling. The selected models used to derive the cis- and trans-1,2-DCE PODs provided the best mathematical fits to the experimental data sets, but do not represent all possible models one might fit. Other models could be selected to yield more extreme results, both higher and lower than those used to derive the cis- and trans- isomer RfDs in the current assessment.
Animal to human extrapolation. Extrapolating dose-response data from animals to
humans is another source of uncertainty. The effect and magnitude at the POD in rodents are extrapolated to human response. Uncertainty in interspecies extrapolation can be separated into two general areas—toxicokinetic and toxicodynamic. In the absence of information to quantitatively assess either toxicokinetic or toxicodynamic differences between animals and humans, a 10-fold UF was used to account for uncertainty in extrapolating from laboratory animals to humans in the derivation of the RfDs for cis- and trans-1,2-DCE. Toxicokinetic and toxicodynamic information for the isomers of 1,2-DCE is not available to inform the potential magnitude of over- or underestimation of this UF. A PBPK model adequately parameterized for

100
both animals and humans could reduce uncertainty in the pharmacokinetic portion of interspecies extrapolation; however, such a model is not available for cis- or trans-1,2-DCE.
Intrahuman variability. Heterogeneity among humans is another source of uncertainty.
Cis- and trans-1,2-DCE-specific data on human variation in response to exposure to these isomers is not available. Data on variation in human hepatic levels of CYP2E1 and other CYP450 enzymes that are responsible for metabolizing 1,2-DCE, however, demonstrate considerable intrahuman variability (see Section 4.8 for additional information). Accordingly, a default UF of 10 was used to account for uncertainty associated with human variation in the derivation of the RfDs for cis- and trans-1,2-DCE. Human variation may be larger or smaller; however, 1,2-DCE-specific data to examine the potential magnitude of over- or underestimation are unavailable.
Subchronic to chronic exposure extrapolation. Because no chronic toxicity studies for
the cis- or trans- isomers of 1,2-DCE are available, a factor was applied to extrapolate data obtained from studies of subchronic exposure to chronic exposure. This factor is based on the assumption that an effect seen at a shorter duration will also be seen after a lifetime of exposure, but with greater severity or at a lower exposure level. In the absence of information to inform this extrapolation, a default UF of 10 was applied. The magnitude of uncertainty associated with this extrapolation and UF cannot be quantified.
Vehicle effects. Another potential source of uncertainty associated with the candidate critical effects considered in deriving the cis-1,2-DCE RfD concerns the use of corn oil as a vehicle in the McCauley et al. (1995, 1990) study. There are conflicting results in the literature concerning the effect of corn oil as a gavage vehicle on the toxicity of haloalkanes and alkenes (Raymond and Plaa, 1997). For example, Raymond and Plaa (1997) found that corn oil enhanced the acute toxicity of carbon tetrachloride on the liver and chloroform on the kidney compared with aqueous vehicles. Use of corn oil gavage led to increased hepatotoxicity, measured by altered liver weight, serum chemistry, and histopathological examination, of chloroform when compared to administration via drinking water in F344/N rats (Larson et al., 1995) and B6C3F1 mice (Bull et al., 1986). Lilly et al. (1996), however, found that 6-week pretreatment of rats with corn oil did not enhance the acute hepato- or nephrotoxicity of bromodichloromethane. Investigators have variably reported that (compared to an aqueous vehicle) corn oil either enhanced carbon tetrachloride toxicity (Narotsky et al., 1997; Condie et al., 1986), did not significantly affect toxicity (Kaporec et al., 1995), or reduced toxicity (Kim et al., 1990), or that influences of vehicle could be dose-dependent (Narotsky et al., 1997; Raymond and Plaa, 1997). Sato et al. (2000) reported that administration of 10 mL/kg corn oil as a vehicle to pregnant and lactating

101
rats resulted in necrosis and fatty degeneration of the proximal tubule of the kidney; however, effects were not similarly noted in non-pregnant female and male rats.
Thus, it is possible that the vehicle used in the oral gavage study by McCauley et al. (1995, 1990) could have influenced the observed toxicity in the liver and kidney; however, given the variable effects of corn oil (versus an aqueous vehicle) in studies of other haloalkanes and the lack of information specific on 1,2-DCE, the magnitude of the confounding and the nature of the interaction with corn oil remain uncertain.
Data gaps. The cis- and trans-1,2-DCE database lacks a multigenerational study of
reproductive toxicity by any route of exposure, and the cis-1,2-DCE database lacks studies of developmental toxicity. The absence of these studies introduces uncertainty in the RfDs. Uncertainty resulting from gaps in developmental toxicity data specific to the cis- and trans-1,2-DCE isomers was reduced by developmental toxicity studies of mixed 1,2-DCE isomers. Additionally, histopathology data from subchronic studies have shown that organs of the reproductive system are unlikely targets for 1,2-DCE toxicity. The magnitude of the uncertainty associated with database deficiencies for these chemicals cannot be quantified. However, a database UF of 3 was used to account for the lack of reproductive and developmental toxicity studies.
5.4. CANCER ASSESSMENT
Epidemiologic studies of 1,2-DCE are not available, and chronic bioassays in experimental animals have not been performed. Thus, the toxicological databases for both isomers provide inadequate information to assess the carcinogenic potential.

102
6. MAJOR CONCLUSIONS IN THE CHARACTERIZATION OF HAZARD AND DOSE RESPONSE
6.1. HUMAN HAZARD POTENTIAL 1,2-DCE exists as two isomers, cis- and the trans- forms, with a molecular mass of 96.95.
Both are colorless, flammable liquids that are heavier than water, with a chloroform-like, sweet, pungent smell. With boiling points between 48 and 60°C, they are volatile. At approximately 5 g/L, both are moderately water soluble. Their oil:water partition coefficients, at around 100, suggest that these chemicals will preferentially partition into lipophilic media. The two isomers may be used in their pure forms or as a mixture of varying isomer composition, typically a 60:40 cis-/trans-mixture.
The trans- isomer is the most commonly used form of 1,2-DCE, and is currently the only isomer commercially available in the United States. DCE was used historically as a solvent for polymers and rubber; these uses are no longer in practice. Currently, trans-1,2-DCE is used as an effective degreasing agent and as a component of formulated products used for precision cleaning of electronic components. It can also used as a blowing agent for speciality foams.
Little information is available regarding the potential toxicity of cis- or trans-1,2-DCE in humans by either the oral or the inhalation route of exposure. Acute effects described for inhaled trans-1,2-DCE in humans include eye irritation, drowsiness, nausea, vertigo, narcosis, and death. No long-term effects are known. There are no chronic exposure studies in animals. Several subchronic oral exposure studies in animals have been conducted, including a 90-day gavage study of the cis- isomer in rats (McCauley et al., 1995, 1990), 90-day drinking water studies of the trans- isomer in rats (Hayes et al., 1987) and mice (Barnes et al., 1985), and a 90-day feed study in rats and mice (NTP, 2002a). Studies of inhalation exposure consist of two 90-day studies of the trans- isomer (DuPont, 1998; Freundt et al., 1977) and one study of a mixture of cis- and trans- isomers in rats (Dow, 1962). Changes in liver and kidney weight were the most frequently observed effects following exposure to 1,2-DCE; however, there is limited evidence for any specific pathological event (NTP, 2002a; DuPont, 1998; McCauley et al., 1995, 1990; Hayes et al., 1987; Freundt et al., 1977).
Only one subchronic oral study (McCauley et al., 1995, 1990) was conducted with cis-1,2-DCE. Statistically significant increases in liver weight in both male and female rats, increases in kidney weight in male rats, and inconsistent hematological responses were noted in this study (McCauley et al., 1995, 1990). No histopathologic changes of the liver and kidney were observed, and clinical chemistry findings were of questionable biological significance.
The subchronic oral toxicity of trans-1,2-DCE has been investigated by NTP (2002a), Hayes et al. (1987), Barnes et al. (1985), and Shopp et al. (1985). Hayes et al. (1987) found no significant differences in body weight or body weight gain in either male or female rats or effects

103
on any of the hematological, serological, or urinary parameters evaluated. In addition, there were no significant changes in organ weights or relative organ weights in males, and only a significant elevation in absolute kidney weights and kidney weights relative to brain weights in females, with no evidence of microscopic histopathological changes in the female kidney. In the Barnes et al. (1985) study, changes in relative organ weights were few, sporadic, and not believed by the authors to be treatment-related. Few changes in hematological parameters were seen in this study, and slight changes in several clinical chemistry parameters were observed. Although some values were significantly different from those of the controls, there were no consistent trends or deviations from historical control values. A statistically significant increase in relative liver weight at the mid-dose (175 mg/kg-day), but not at the highest dose, was seen in male mice in the Barnes et al. (1985) study, and statistically significant changes in liver function enzymes, including LDH, AST (SGOT), and ALP activities, in male mice occurred. Significant increases of 62 and 33% in serum ALP levels were reported at the 175 and 387 mg/kg-day doses, respectively. These increases showed no dose-response relationship, were within the normal range for the CD-1 mouse strain, and were not observed in female mice. The findings of Barnes et al. (1985) provide no evidence that trans-1,2-DCE induces hepatotoxicity in mice at doses up to 387 mg/kg-day in males and 452 mg/kg-day in females.
In NTP (2002a), the final mean body weight and body weight gain of male rats exposed to trans-1,2-DCE were reduced by about 6% below controls (a statistically significant decrease). In general, no exposure-related alterations in clinical chemistry parameters in rats were observed. NTP (2002a) reported statistically significant changes in absolute and relative liver weights in rats for the females only. The relative liver weights of female rats exposed to ≥395 mg/kg-day were significantly higher (~6–10%) than the control. No gross or histological lesions were observed in rats that were attributed to exposure to trans-1,2-DCE. In mice, statistically significant, dose-dependent increases in relative liver weights in both sexes were observed in the NTP (2002a) study. The maximum changes in liver weights in mice were increases of 15 and 11% at the highest dose for males and females, respectively. No gross or histological lesions were observed in mice. The liver weight changes may be early indicators or precursors of liver toxicity, and it is not possible to determine whether overt liver damage would occur at higher doses or in studies of longer exposure duration (i.e., chronic studies).
Shopp et al. (1985) reported a dose-related suppression of the humoral immune status in male mice treated with trans-1,2-DCE as indicated by a reduction in sRBC-specific AFCs in the spleen. When expressed as AFCs per 106 spleen cells, the number of AFCs was reduced by 26% in male mice at doses of 175 and 387 mg/kg-day (significantly different at p < 0.05 from control mice). Suppression of T-cell-dependent antibody response as determined by the AFC response to sRBCs is a well-validated endpoint that is one of the most predictive assays for chemical immunotoxicity (Herzyk and Holsapple, 2007; Luster et al., 1992). EPA concluded that the reduced number of sRBC-specific AFCs per 106 spleen cells of male mice in Shopp et al. (1985)

104
is a biologically significant measure indicating suppressed antibody response associated with oral exposure to trans-1,2-DCE.
For the inhalation route of exposure, there are no human, chronic, or subchronic studies for the cis- isomer and three ≥90-day duration studies using trans-1,2-DCE (DuPont, 1998; Freundt et al., 1977) or the isomer mixture (Dow, 1962). The unpublished DuPont (1998) report in male and female rats demonstrated small increases (1–8%) in liver and kidney weights and some hematological effects of uncertain toxicological significance. The Dow (1962) report is an unpublished study and reported increased liver and kidney weights in rats and increased liver weights in rabbits. The Freundt et al. (1977) subchronic inhalation study is a one-concentration study in which animals were exposed for periods of 1–16 weeks. This study reported liver effects (fatty accumulation in liver lobules and Kupffer cells) that were also seen in some of the controls. For each of the exposure durations, the incidence and severity of fat accumulation increased with increasing exposure duration; however, these increases were not statistically significantly different from the controls. Similar histopathologic findings in the liver were not observed in DuPont (1998) at exposure concentrations 20-fold higher than the concentration used in Freundt et al. (1977), nor in the NTP 90-day oral study at concentrations in the diet up to 50,000 ppm.
Under the Guidelines for Carcinogen Risk Assessment (U.S. EPA, 2005a), there is “inadequate information to assess the carcinogenic potential” of cis- or trans-1,2-DCE. This descriptor reflects the lack of human epidemiological investigations or chronic animal bioassays.
6.2. DOSE RESPONSE 6.2.1. Noncancer – Oral Exposure 6.2.1.1. cis-1,2-DCE
McCauley et al. (1995, 1990) conducted the only available subchronic study of cis-1,2-DCE. This 90-day gavage study was used as the basis for the oral RfD. An increase in relative kidney weight in male rats was selected as the critical effect for derivation of the RfD. Relative kidney weights were increased by up to 27% in high-dose males and 23% in high-dose females. There were no histopathological changes in the kidney. A 10% change in relative kidney weight compared with the control was selected as the BMR level for this endpoint. BMD modeling was used to calculate the POD by estimating the effective dose at a specified level of response (BMD10) and its 95% lower confidence limit (BMDL10). All of the continuous models in U.S. EPA’s BMDS (version 1.4.1) (U.S. EPA, 2007) were fit to the relative kidney weight data. For both male and female rat relative kidney weight data, the Hill model (restricted) provided the best fit of the data, yielding a BMD10 and BMDL10 of 19.8 and 5.1 mg/kg-day, respectively, in males, and 55.2 and 10.4 mg/kg-day, respectively, in females. The POD for the RfD for cis-1,2-DCE was chosen as 5.1 mg/kg-day, the lower of the male and female BMDL10 values. Applying a composite UF of 3,000 to the POD of 5.1 mg/kg-day yields an RfD of

105
0.002 mg/kg-day. The composite UF of 3,000 includes factors of 10 to protect sensitive individuals, 10 to extrapolate from animals to humans, 10 for use of a study of subchronic duration, and 3 to account for database deficiencies. Information was unavailable to quantitatively assess toxicokinetic or toxicodynamic differences between experimental animals and humans (applied a factor of 10) or the potential variability in human susceptibility (applied a factor of 10) to cis-1,2-DCE. In the absence of any chronic toxicity studies, an UF of 10 was used to account for extrapolating from a subchronic study to estimate chronic exposure conditions. An UF of 3 was used to account for deficiencies in the database, including lack of reproductive and developmental toxicity data for the cis- isomer. The potential for developmental toxicity of cis-1,2-DCE, however, is informed by a series of oral range-finding studies of the developmental toxicity of a mixture of 1,2-DCE isomers (composition of isomers unknown) (NTP, 1991a, b, c). No evidence of developmental toxicity was observed in mice or rats based on the parameters evaluated in these range-finding studies (gravid uterus weight, fetal body weight, and number of fetuses [live/dead], implantation sites, and resorptions).
Confidence in the principal study (McCauley et al., 1995, 1990) is medium. The 90-day gavage study (McCauley et al., 1995, 1990) used four dose groups plus a control and measured multiple parameters, including body weight, liver weight, kidney weight, clinical chemistry, and hematology parameters. There are no oral studies of chronic, reproductive, or developmental toxicity of cis-1,2-DCE. The McCauley et al. (1995, 1990) study is the only available subchronic study of cis-1,2-DCE and was used as the basis for the oral RfD. However, the developmental toxicity potential is informed by several range-finding studies for a mixture of cis-1,2-DCE isomers (NTP, 1991a,b,c) that showed no evidence of developmental toxicity. Thus, the confidence in the database is low to medium. The overall confidence in the RfD is low.
6.2.1.2. trans-1,2-DCE
The Shopp et al. (1985) study was chosen as the principal study. Shopp et al. (1985) reported a statistically significant dose-related suppression of sRBC-specific AFCs in the spleen in male mice exposed to trans-1,2-DCE in drinking water for 90 days. The authors of this study reported marked suppression in humoral immune status in male mice as indicated by the significantly decreased number of AFCs. As described in more detail in Section 4.6.1.2, EPA concluded that the 26% suppression in the number of sRBC-specific AFCs per 106 spleen cells of male mice in Shopp et al. (1985) is a biologically significant measure indicating suppressed antibody response associated with oral exposure to trans-1,2-DCE.
BMD modeling methods were used to calculate the POD by estimating the effective dose at a specified level of response (BMDx) and its 95% lower confidence limit (BMDLx). A BMR of 1 SD from the control mean number of AFCs per 106 spleen cells was used. All of the continuous models in U.S. EPA’s BMDS (version 1.4.1c) (U.S. EPA, 2007) were fit to the data
106
on numbers of AFCs (i.e., AFCs per 106 spleen cells) observed in male CD-1 mice. A second-degree polynomial model provided the best fit to these data, yielding a BMDL1SD of 65 mg/kg-day. Thus, the POD for the RfD for trans-1,2-DCE was the BMDL1SD of 65 mg/kg-day. Applying a composite UF of 3,000 to the POD of 65 mg/kg-day yields an RfD of 0.02 mg/kg-day. The composite UF of 3,000 includes an UF of 10 for intraspecies variability, an UF of 10 for interspecies variability, an UF of 10 for extrapolation from a subchronic to a chronic study, and an UF of 3 for database uncertainties. Information was unavailable to quantitatively assess toxicokinetic or toxicodynamic differences between experimental animals and humans (applied a factor of 10) or the potential variability in human susceptibility (applied a factor of 10) to trans-1,2-DCE. In the absence of any chronic toxicity studies, an UF of 10 was used to account for extrapolating from a subchronic study to estimate chronic exposure conditions. An UF of 3 was used to account for deficiencies in the database, including lack of a multigeneration reproductive toxicity study.
Confidence in the principal study (Shopp et al., 1985) is medium. This 90-day immunotoxicity study of oral exposure of male and female CD-1 mice to trans-1,2-DCE (administered in drinking water) is a well-conducted, peer reviewed study. The Shopp et al. (1985) study included three dose groups as well as a vehicle control group. Animals were evaluated for humoral immune status as measured by the ability of spleen cells from these mice to produce splenic IgM AFCs against sRBC, hemagglutination titers to sRBC, and by spleen cell response to LPS. Confidence in the oral database is low to medium. Four subchronic studies were considered in the evaluation of oral exposure to trans-1,2-DCE (NTP, 2002a; Hayes et al., 1987; Barnes et al., 1985; Shopp et al., 1985). These studies evaluated a wide range of toxicity endpoints, including hematology, urinalysis, clinical chemistry, histopathology, and immune system function. Developmental toxicity potential for trans-1,2-DCE is informed by a series of oral range-finding studies of a mixture of 1,2-DCE isomers (NTP, 1991a, b, c) that showed no evidence of developmental toxicity. There are no chronic studies of trans-1,2-DCE toxicity. The overall confidence in the RfD is low.
6.2.2. Noncancer – Inhalation Exposure 6.2.2.1. cis-1,2-DCE
There are no human studies, nor chronic or subchronic inhalation studies in animals for cis-1,2-DCE. In the absence of a long-term inhalation study, no RfC was derived.
6.2.2.2. trans-1,2-DCE
The available inhalation data for trans-1,2-DCE were considered insufficient to support reference value derivation. An RfC for trans-1,2-DCE was not derived.

107
6.2.3. Cancer Epidemiologic studies of 1,2-DCE are not available, and chronic bioassays in
experimental animals have not been performed. Thus, the toxicological databases for both isomers provide inadequate information to assess the carcinogenic potential.

108
7. REFERENCES ACGIH (American Conference of Governmental Industrial Hygienists). (1981) 1,2-Dichloroethylene. In: Documentation of the threshold limit values and biological exposure indices. Cincinnati, OH. . ACGIH. (2001) 1,2-Dichloroethylene. In: Documentation of the threshold limit values and biological exposure indices. 7th edition. Cincinnati, OH. Andersen, ME; Gargas, ML; Jones, R; et al. (1980) Determination of the kinetic constants for metabolism of inhaled toxicants in vivo using gas uptake measurements. Toxicol Appl Pharmacol 54:100–116. ATSDR (Agency for Toxic Substances and Disease Registry). (1996) Toxicological profile for 1,2-dichloroethene. Public Health Service, U.S. Department of Health and Human Services, Atlanta, GA. Available online at http://www.atsdr.cdc.gov/toxpro2.html. Bae, D-S; Andersen, ME; Clewell, HJ, III. (2005) Halogenated alkenes. In: Reddy, M; Yang, R; Clewell, HJ, III; et al.; eds. Physiologically based pharmacokinetic modeling: science and applications. Hoboken, NJ: John Wiley and Sons, Inc. Barnes, DW; Sanders, VM; White, KL, Jr; et al. (1985) Toxicology of trans-1,2-dichloroethylene in the mouse. Drug Chem Toxicol 8:373–392. Barton, HA; Creech, JR; Godin, CS; et al. (1995) Chloroethylene mixtures: pharmacokinetic modeling and in vitro metabolism of vinyl chloride, trichloroethylene, and trans-1,2-dichloroethylene in rat. Toxicol Appl Pharmacol 130:237–247. Bartsch, H; Nair, U; Risch, A; et al. (2000) Genetic polymorphism of CYP genes, alone or in combination, as a risk modifier of tobacco-related cancers. Cancer Epidemiol Biomarkers Prevent 9:3–28. Blackburn, AC; Tzeng, H-F; Anders, MW; et al. (2000) Discovery of a functional polymorphism in human glutathione transferase zeta by expressed sequence tag database analysis. Pharmacogenetics 10:49–57. Blackburn, AC; Coggan, M; Tzeng, H-F; et al. (2001) GSTZ1d: a new allele of glutathione transferase zeta and maleylacetoacetate isomerase. Pharmacogenetics 11:671–678. Board, PG; Chelvanayagam, G; Jermiin, LS; et al. (2001) Identification of novel glutathione transferases and polymorphic variants by expressed sequence tag database analysis. Drug Metab Dispos 29:544–547. Bonse, G; Urban, T; Reichert, D; et al. (1975) Chemical reactivity, metabolic oxirane formation and biological reactivity of chlorinated ethylenes in the isolated perfused rat liver preparation. Biochem Pharmacol 24:1829–1834. Brock, W. (1990) Acute toxicity studies with trans-1,2-dichloroethylene (DCE). J Am Coll Toxicol 1:10–11. Bronzetti, G; Bauer, C; Corsi, C; et al. (1981) Genetic effects of chlorinated ethylenes: in vitro and in vivo studies using d7 strain of S. cerevisiae. Effects on enzymes involved in xenobiotic metabolism. Atti Assoc Genet Ital 27:77–80. Bronzetti, G; Bauer, C; Corsi, C; et al. (1984) Comparative genetic activity of cis- and trans-1,2-dichloroethylene in yeast. Teratog Carcinog Mutagen 4:365–375. Calandra, TD; Caruso, JE; Shahied, SI. (1987) Mutagenicity of volatile organic compounds commonly found as contaminants in potable water supplies. Environ Mutagen 9(Suppl. 8):22. Cederbaum, AI. (2006) CYP2E1—biochemical and toxicological aspects and role in alcohol-induced liver injury. Mt Sinai J Med 73:657–672.
109
Cerna, M; Kypenova, H. (1977) Mutagenic activity of chloroethylenes analyzed by screening system tests. Mutat Res 46:214–215. Clewell, HJ; Andersen, ME. (1987) Dose, species, and route extrapolation using physiologically based pharmacokinetic models. Pharmacokinetics Risk Assess 8:159–182. Costa, AK; Ivanetich, KM. (1982) The 1,2-dichloroethylenes: their metabolism by hepatic cytochrome p-450 in vitro. Biochem Pharmacol 31:2093–2102. Costa, AK; Ivanetich, KM. (1984) Chlorinated ethylenes: their metabolism and effect on DNA repair in rat hepatocytes. Carcinogenesis 5:1629–1636. Crebelli, R; Carere, A. (1987) Chemical and physical agents assayed in tests for mitotic intergenic and intragenic recombination in Aspergillus nidulans diploid strains. Mutagenesis 2(6):469–476. Crebelli, R; Andreoli, C; Carere, A; et al. (1992) The induction of mitotic chromosome malsegregation in Aspergillus nidulans. Quantitative structure activity relationship (QSAR) analysis with chlorinated aliphatic hydrocarbons. Mutagenesis 266(2):117–134. Crebelli, R; Andreoli, C; Carere, A; et al. (1995) Toxicology of halogenated aliphatic hydrocarbons: structural and molecular determinants for the disturbance of chromosome segregation and the induction of lipid peroxidation. Chem Biological Interact 98:113–129. Crebelli, R; Carere, A; Leopardi, P; et al. (1999) Evaluation of 10 aliphatic halogenated hydrocarbons in the mouse bone marrow micronucleus test. Mutagenesis 14:207–215. Cronin, M. (1996) Quantitative structure-activity relationship (QSAR) analysis of the acute sublethal neurotoxicity of solvents. Toxicology In Vitro 10:103–110. DeCeaurriz, J; Desiles, JP; Bonnet, P; et al. (1983) Concentration-dependent behavioral changes in mice following short-term inhalation exposure to various industrial solvents. Toxicol Appl Pharmacol 67:383–389. Doherty, AT; Ellard, S; Parry, EM; et al. (1996) An investigation into the activation and deactivation of chlorinated hydrocarbons to genotoxins in metabolically competent human cells. Mutagenesis 11:247–274. Dow (Dow Chemical Company). (1960) Results of range finding toxicological tests on 1,2-dichloroethylene, mixed isomers, with cover letter dated 05/10/94 (sanitized). The Dow Chemical Company, Midland, MI. Submitted under TSCA Section 8D; EPA Document No. 86940000836S; NTIS No. OTS0557246. Dow. (1962) The toxicity of 1,2-dichloroethylene as determined by repeated exposures on laboratory animals, with cover letter dated 05/10/94 (sanitized). The Dow Chemical Company, Midland, MI. Submitted under TSCA Section 8D; EPA Document No. 86940000837S; NTIS No. OTS0557247. Dowsley, TF; Reid, K; Petsikas, D; et al. (1999) Cytochrome P-450-dependent bioactivation of 1,1-dichloroethylene to a reactive epoxide in human lung and liver microsomes. J Pharmacol Exp Ther 289(2):641–648. DuPont. (1988a) Teratogenicity study of trans-1,2-dichloroethylene in rats with cover letter dated 05/10/94 (sanitized). E.I. DuPont de Nemours and Company, Wilmington, DE. Submitted under TSCA Section 8D; EPA Document No. 86940000765S; NTIS No. OTS0557175. DuPont. (1988b) Acute dermal toxicity study of trans-1,2-dichloroethylene in rabbits with cover letter dated 05/10/94 (sanitized). E.I. DuPont de Nemours and Company, Wilmington, DE. Submitted under TSCA Section 8D; EPA Document No. 86940000762S; NTIS No. OTS0557172. DuPont. (1988c) Eye irritation test in rabbits of trans-1,2-dichloroethylene with cover letter dated 05/10/94 (sanitized). E.I. DuPont de Nemours and Company, Wilmington, DE. Submitted under TSCA Section 8D; EPA Document No. 86940000763S; NTIS No. OTS0557173.

110
DuPont. (1988d) Skin irritation test in rabbits of trans-1,2-dichloroethylene with cover letter dated 05/10/94 (sanitized). E.I. DuPont de Nemours and Company, Wilmington, DE. Submitted under TSCA Section 8D; EPA Document No. 86940000764S; NTIS No. OTS0557174. DuPont. (1999) Initial submission: letter from DuPont Haskell Laboratory to U.S. EPA re results of 4-hour inhalation median lethality study (LC50) in rats w/cis-1,2-dichloroethylene, dated 8/26/99. E.I. DuPont de Nemours and Company, Wilmington, DE. Submitted under TSCA Section 8E; EPA Document No. 88990000257; NTIS No. OTS0559785. Eger, EI; Halsey, MJ; Koblin, DD; et al. (2001) The convulsant and anesthetic properties of cis-trans isomers of 1,2-dichlorohexafluorocyclobutane and 1,2-dichloroethylene. Anesth Analg 93:922–927. Filser, JG; Bolt, H. (1979) Pharmacokinetics of halogenated ethylenes in rats. Arch Toxicol 42:123–136. Filser, JG; Bolt, H. (1980) Characteristics of haloethylene-induced acetonemia in rats. Arch Toxicol 45:109–116. Filser, JG; Bolt, H; Kimmich, K; et al. (1978) Exhalation of acetone by rats on exposure to trans-1,2-dichloroethylene and related compounds. Toxicol Lett 2:247–252. Filser, JG; Jung, P; Bolt, H. (1982) Increased acetone exhalation induced by metabolites of halogenated C1 and C2 compounds. Arch Toxicol 49:107–116. Frantik, E; Hornychova, M; Horvath, M. (1994) Relative acute neurotoxicity of solvents: isoeffective air concentrations of 48 compounds evaluated in rats and mice. Environ Res 66:173–185. Freundt, KJ; Macholz, J. (1978) Inhibition of mixed function oxidases in rat liver by trans- and cis-1,2-dichloroethylene. Toxicology 10:131–139. Freundt, KJ; Liebaldt, GP; Lieberwirth, E. (1977) Toxicity studies on trans-1,2-dichloroethylene. Toxicology 7:141–153. Galli, A; Bauer, C; Bronzetti, G; et al. (1982) [Genetic activity of 1,2-dichloroethylene. A. In vitro studies]. Boll Soc Ital Biol Sper 58:860–863. Gargas, ML; Seybold, PG; Andersen, ME. (1988) Modeling the tissue solubilities and metabolic rate constant (Vmax) of halogenated methanes, ethanes, and ethylenes. Toxicol Lett 43:235–256. Gargas, ML; Burgess, RJ; Voisard, DE; et al. (1989) Partition coefficients of low-molecular-weight volatile chemicals in various liquids and tissues. Toxicol Appl Pharmacol 98:87–99. Gargas, ML; Clewell, HJ; Andersen, ME. (1990) Gas uptake inhalation techniques and the rates of metabolism of chloromethanes, chloroethanes, and chloroethylenes in the rat. Inhal Toxicol 2:295–319. Gradiski, D; Bonnet, P; Raoult, G; et al. (1978) Comparative acute inhalation toxicity of the principal chlorinated aliphatic solvents. Arch Mal Prof Med Trav Secur Sot 39:249–257. Greim, H; Bonse, G; Radwan, Z; et al. (1975) Mutagenicity in vitro and potential carcinogenicity of chlorinated ethylenes as a function of metabolic oxirane formation. Biochem Pharmacol 24:2013–2017. Greim, H; Bimboes, D; Egert, G; et al. (1977) Mutagenicity and chromosomal aberrations as an analytical tool for in vitro detection of mammalian enzyme-mediated formation of reactive metabolites. Arch Toxicol 39:159–169. Guengerich, FP; Kim, D-H; Iwasaki, M. (1991) Role of human cytochrome P-450 IIE1 in the oxidation of many low molecular weight cancer suspects. Chem Res Toxicol 4:168–179. Hanioka, N; Jinno, H; Nishimura, T; et al. (1998) Changes in hepatic cytochrome P450 enzymes by cis- and trans-1,2-dichloroethylenes in rat. Xenobiotica 28:41–51.
111
Hayes, JR; Condie, LW, Jr; Egle, JL, Jr; et al. (1987) The acute and subchronic toxicity in rats of trans-1,2-dichloroethylene in drinking water. J Am Coll Toxicol 6:471–478. Henschler, D. (1977) Activation mechanisms in chlorinated aliphatic compounds: experimental possibilities and clinical significance. Arzneim Forsch 27:1827–1832. Henschler, D; Bonse, G. (1977) Metabolic activation of chlorinated ethylenes: dependence of mutagenic effect on electrophilic reactivity of the metabolically formed epoxides. Arch Toxicol 39:7–12. Herzyk, DJ, Holsapple, M. (2007) Immunotoxicity evaluation by immune function tests: Focus on the T-dependent antibody response (TDAR) [Overview of a Workshop Session at the 45th Annual Meeting of the Society of Toxicology (SOT) March 5-9, 2006 San Diego, CA]. J Immunotox 4:143–147. Hurtt, ME; Valentine, R; Alvarez, L. (1993) Developmental toxicity of inhaled trans-1,2-dichloroethylene in the rat. Fundam Appl Toxicol 20:225–230. Jenkins, LJ; Trabulus, MJ; Murphy, SD. (1972) Biochemical effects of 1,1-dichloroethylene in rats: comparison with carbon tetrachloride and 1,2-dichloroethylene. Toxicol Appl Pharmacol 23:501–510. Jones, R; Mackrodt, W. (1982) Structure-mutagenicity relationships for chlorinated ethylenes: a model based on the stability of the metabolically derived epoxides. Biochem Pharmacol 31:3710–3713. Jones, R; Mackrodt, W. (1983) Structure-genotoxicity relationship for aliphatic epoxides. Biochem Pharmacol 32:2359–2362. Kallman, MJ; Balster, R. (1983) Disruption of differential reinforcement of low rate performance in mice by repeated exposure to 1,2-dichloroethylene. Fed Proc 42:363. Kallman, MJ; Lynch, MR; Landauer, MR. (1983) Taste aversions to several halogenated hydrocarbons. Neurobehav Toxicol Teratol 5:23–27. Kelly, DP; Rose, PW; Brock, WJ; et al. (1999) Ninety-day inhalation toxicity of trans-1,2-dichloroethylene in rats. Toxicologist 48:119. Koch, R; Schlegelmilch, R; Wolf, HU. (1988) Genetic effects of chlorinated ethylenes in the yeast Saccharomyces cerevisiae. Mutat Res 206:209–216. Ladics, GS. (2007) Primary immune response to sheep red blood cells (SRBC) as the conventional T-cell dependent antibody response (TDAR) test. J Immunotox 4:149–152. Laurence, PR; Proctor, TR; Politzer, P. (1984) Reactive properties of trans-dichlorooxirane in relation to the contrasting carcinogenicities of vinyl chloride and trans-dichloroethylene. Int J Quantum Chem 26:425–438. Lehmann, KB. (1911) [Experimental studies of the effects of technical and occupational gases and vapors on the organism. XVI-XXIII. The chlorinated aliphatic hydrocarbons]. Arch Hyg 74:1–60. [German] Leibman, KC; Ortiz, E. (1977) Metabolism of halogenated ethylenes. Environ Health Perspect 21:91–97. Leonard, R; Rubin, Z. (1986) Hematology reference values for peripheral blood of laboratory rats. Lab Anim Sci 36(3):277–281. Lilly, PD; Thornton-Manning, JR; Gargas, ML; et al. (1998) Kinetic characterization of CYP2E1 inhibition in vivo and in vitro by the chloroethylenes. Arch Toxicol 72:609–621. Liu, M; Grant, S; Macina, O; et al. (1997) Structural and mechanistic bases for the induction of mitotic chromosomal loss and duplication (“malsegregation”) in the yeast Saccharomyces cerevisiae: relevance to human carcinogenesis and developmental toxicology. Mutat Res 374:209–231.

112
Loew, G; Kurkjian, E; Rebagliati, M. (1983) Metabolism and relative carcinogenic potency of chloroethylenes: a quantum chemical structure-activity study. Chem Biol Interact 43:33–66. Loveless, SE; Ladics, GS; Smith, C; et al. (2007) Interlaboratory study of the primary antibody response to sheep red blood cells in outbred rodents following exposure to cyclophosphamide or dexamethasone. J Immunotox 4:233–238. Luster, MI; Portier, C; Pait, DG; et al. (1992) Risk assessment in immunotoxicology. I. Sensitivity and predictability of immune tests. Fundam Appl Toxicol 18:200–210. Luster, MI; Portier, C; Pait, DG; et al.(1993) Risk assessment in immunotoxicology. II. Relationships between immune and host resistance tests. Fundam Appl Toxicol 21:71–82. Maiorino, RM; Gandolfi, AJ; Brendel, K; et al. (1982) Chromatographic resolution of amino acid adducts of aliphatic halides. Chem Biol Interact 38(2):175–188. Mathews, JM; Raymer, JH; Etheridge, AS; et al. (1997) Do endogenous volatile organic chemicals measured in breath reflect and maintain CYP2E1 levels in vivo? Toxicol Appl Pharmacol 146:255–260. Matsuzawa, T; Nomura, M; Unno, T. (1993) Clinical pathology reference ranges of laboratory animals. Working Group II, Nonclinical Safety Evaluation Subcommittee of the Japan Pharmaceutical Manufacturers Association. J Vet Med Sci 55(3):351–362. McCauley, PT; Robinson, M; Daniel, FB; et al. (1990) The effects of subacute and subchronic oral exposure to cis-1,2-dichloroethylene in rats. Health Effects Research Laboratory, U.S. Environmental Protection Agency, Cincinnati, OH and Toxic Hazards Division, Air Force Aerospace Medical Research Laboratory, Wright-Patterson Air Force Base, OH; unpublished report. McCauley, PT; Robinson, M; Daniel, FB; et al. (1995) The effects of subacute and subchronic oral exposure to cis-1,2-dichloroethylene in Sprague-Dawley rats. Drug Chem Toxicol 18:171–184. McMillan, DA. (1986) Toxicity of the cis- and trans-isomers of 1,2-dichloroethylene [PhD Dissertation]. The University of Nebraska Medical Center, Omaha, Nebraska. Doc. No. 8607184. Available from Proquest, Ann Arbor, MI. http://www.il.proquest.com. Mersch-Sundermann, V. (1989) Examination of mutagenicity of organic microcontaminations on the environment. Communication II: The mutagenicity of halogenated aliphatic hydrocarbons with the salmonella microsome test (Ames test) as to contamination of ground and drinking water. Zentralbl Bakteriol Mikrobiol Hyg Ser B 187:230–243. Mersch-Sundermann, V; Mueller, G; Hofmeister, A. (1989) Examination of mutagenicity of organic microcontaminations of the environment: Communication IV. The mutagenicity of halogenated aliphatic hydrocarbons with the SOS-chromotest. Zentralbl Hyg Umweltmed 189:266–271. Mochida, K; Gomyoda, M; Fujita, T. (1995) Toxicity of 1,1-dichloroethane and 1,2-dichloroethylene determined using cultured human KB cells. Bull Environ Contam Toxicol 55:316–319. Moore, L. (1978) Calcium transport by rat liver microsomes inhibition by halogenated hydrocarbons. Pharmacologist 20:251. Mortelmans, K; Haworth, S; Lawlor, T; et al. (1986) Salmonella mutagenicity tests. 2. Results from the testing of 270 chemicals. Environ Mutagen 8:1–119. Munson, AE; Sanders, VM; Douglas, KA; et al. (1982) In vivo assessment of immunotoxicity. Environ Health Perspect 43:41–52. Nakahama, T; Sarutani, S; Inouye, Y. (2000) Effects of chlorinated ethylenes on expression of rat cyp forms: comparative study on correlation between biological activities and chemical structures. J Health Sci 46:251–258.
113
Nakajima, T. (1997) Cytochrome P450 isoforms and the metabolism of volatile hydrocarbons of low relative molecular mass. J Occup Health 39:83–91. NLM (National Library of Medicine). (2006) Cis-1,2-Dichloroethylene, trans-1,2-dichloroethylene, and 1,2-dichloroethylene. HSDB (Hazardous Substances Data Bank). National Institutes of Health, U.S. Department of Health and Human Services, Bethesda, MD. Available online at http://toxnet.nlm.nih.gov accessed. Nohmi, T; Miyata, R; Yoshikawa, K; et al. (1985) Mutagenicity tests on organic chemical contaminants in city water and related compounds. I. Bacterial mutagenicity tests. Eisei Shikenjo Hokoku (Bull Natl Inst Hyg Sci Tokyo) 103:60–64. NRC (National Research Council). (1983) Risk assessment in the federal government: managing the process. Washington, DC: National Academy Press. NTP (National Toxicology Program). (1991a) Range finding studies: developmental toxicity 1,2-dichloroethylene when administered via feed in Swiss CD-1 mice. Public Health Service, U.S. Department of Health and Human Services; NTP TRP 91022. Available from the National Institute of Environmental Health Sciences, Research Triangle Park, NC. NTP. (1991b) Range finding studies: developmental toxicity 1,2-dichloroethylene when administered via feed in CD Sprague-Dawley rats. Public Health Service, U.S. Department of Health and Human Services; NTP TRP 91032. Available from the National Institute of Environmental Health Sciences, Research Triangle Park, NC. NTP. (1991c) Range finding studies: developmental toxicity 1,2-dichloroethylene (repeat) when administered via feed in CD Sprague-Dawley rats. Public Health Service, U.S. Department of Health and Human Services; NTP TRP 91033. Available from the National Institute of Environmental Health Sciences, Research Triangle Park, NC. NTP. (2002a) NTP technical report on the toxicity studies of trans-1,2-dichloroethylene (CAS No. 156-60-5) administered in microcapsules in feed to F344/N rats and B6C3F1 mice. Public Health Service, U.S. Department of Health and Human Services; NTP TR 55. Available from the National Institute of Environmental Health Sciences, Research Triangle Park, NC and online at http://ntp.niehs.nih.gov/ntp/htdocs/ST_rpts/tox055.pdf. Önfelt, A. (1987) Spindle disturbances in mammalian cells. 3. Toxicity, c-mitosis and aneuploidy with 22 different compounds. Specific and unspecific mechanisms. Mutat Res 182:135–154. Paolini, M; Mesirca, R; Pozzetti, L; et al. (1992) Selective induction of murine liver cytochrome P450 IIB 1 by halogenated hydrocarbons. Toxicol Environ Chem 36:235–249. Paolini, M; Mesirca, R; Pozzetti, L; et al. (1995) Induction of CYP2B1 mediated pentoxyresorufin O-dealkylase activity in different species, sex and tissue by prototype 2B1-inducers. Chem-Biol Interact 95:127–139. Plaa, G; Larson, R. (1965) Relative nephrotoxic properties of chlorinated methane, ethane, and ethylene derivatives in mice. Toxicol Appl Pharmacol 42:37–44. Pleil, J; Lindstrom, A. (1997) Exhaled human breath measurement method for assessing exposure to halogenated volatile organic compounds. Clin Chem 43:723–730. Potts, RO; Guy, RH. (1992) Predicting skin permeability. Pharm Res 9(5):663–669. Ramsey, JC; Andersen, ME. (1984) A physiologically based description of the inhalation pharmacokinetics of styrene monomer in rats and humans. Toxicol Appl Pharmacol 73:159–175. Rannug, A; Alexandrie, A-K; Persson, I; et al. (1995) Genetic polymorphism of cytochromes P450 1A1, 2D6 and 2E1: regulation and toxicological significance. JOEM 37(1):25–36. Sato, A; Nakajima, T. (1987) Pharmacokinetics of organic solvent vapors in relation to their toxicity. Scand J Work Environ Health 13:81–93.
114
Sawada, M; Sofuni, T; Ishidate, MJ. (1987) Cytogenetic studies on 1,1-dichloroethylene and its two isomers in mammalian cells in vitro and in vivo. Mutat Res 187:157–164. Shopp, GM, Jr; Sanders, VM; White, KL, Jr; et al. (1985) Humoral and cell-mediated immune status of mice exposed to trans-1,2-dichloroethylene. Drug Chem Toxicol 8:393–407. Simmon, V; Kauhanen, K; Tardiff, R. (1977) Mutagenic activity of chemicals identified in drinking water. Dev Toxicol Environ Sci 2:249–258. Sipes, IG; Gandolfi, A. (1980) In vitro comparative bioactivation of aliphatic halogenated hydrocarbons. Toxicol Lett 1:33. Sofuni, T; Hayashi, M; Matsuoka, A; et al. (1985) Mutagenicity tests on organic chemical contaminants in city water and related compounds. II. Chromosome aberration tests in cultured mammalian cells. Bull Natl Inst Hyg Sci (Tokyo) 103:64–75. Stacpoole, PW. (1989) The pharmacology of dichloroacetate. Metabolism 38:1124–1144. Strobel, K; Grummt, T. (1987) Aliphatic and aromatic halocarbons as potential mutagens in drinking water. 3. Halogenated ethanes and ethenes. Toxicol Environ Chem 15:101–128. Suzuki, T; Nezu, K; Sasaki, H; et al. (1994) Cytotoxicity of chlorinated hydrocarbons and lipid peroxidation in isolated rat hepatocytes. Biol Pharm Bull 17:82–86. Tafazoli, M; Kirsch-Volders, M. (1996) In vitro mutagenicity and genotoxicity study of 1,2-dichloroethylene, 1,1,2-trichloroethane, 1,3-dichloropropane, 1,2,3-trichloropropane and 1,1,3-trichloropropene, using the micronucleus test and the alkaline single cell gel electrophoresis technique (comet assay) in human lymphocytes. Mutat Res 371:185–202. Testai, E; Citti, L; Gervasi, PG; et al. (1982) Distruzione in vitro del citocromo P-450 epatico causata da 1,2-dicloroetilene. Boll Soc It Biol Sper 58:513–519. Tse, SY; Mak, IT; Weglicki, WB; et al. (1988) Chlorinated hydrocarbons enhance lipid peroxidation in cultured endothelial cells and smooth muscle cells. J Mol Cell Cardiol 20(Suppl. 3):S36 Tse, SY; Mak, IT; Weglicki, WB; et al. (1990) Chlorinated aliphatic hydrocarbons promote lipid peroxidation in vascular cells. J Toxicol Environ Health 31:217–226. Tzeng, H-F; Blackburn, AC; Board, PG; et al. (2000) Polymorphism- and species-dependent inactivation of glutathione transferase zeta by dichloroacetate. Chem Res Toxicol 13:231–236. U.S. EPA (Environmental Protection Agency). (1986a) Guidelines for the health risk assessment of chemical mixtures. Federal Register 51(185):34014–34025. Available online at http://www.epa.gov/iris/backgrd.html. U.S. EPA. (1986b) Guidelines for mutagenicity risk assessment. Federal Register 51(185):34006-34012. Available online at http://www.epa.gov/iris/backgrd.html. U.S. EPA. (1988) Recommendations for and documentation of biological values for use in risk assessment. Prepared by the Environmental Criteria and Assessment Office, Office of Health and Environmental Assessment, Cincinnati, OH for the Office of Solid Waste and Emergency Response, Washington, DC; EPA 600/6-87/008. Available online at http://www.epa.gov/iris/backgrd.html. U.S. EPA. (1991) Guidelines for developmental toxicity risk assessment. Federal Register 56(234):63798–63826. Available online at http://www.epa.gov/iris/backgrd.html. U.S. EPA. (1992) Dermal exposure assessment: principles and applications [interim report]. Office of Research and Development, Washington, DC; EPA/600/8-91/011B. Available from the National Technical Information Service, Springfield, VA; PB92-205665.
115
U.S. EPA. (1994a) Interim policy for particle size and limit concentration issues in inhalation toxicity studies. Federal Register 59(206):53799. Available online at http://www.epa.gov/iris/backgrd.html. U.S. EPA. (1994b) Methods for derivation of inhalation reference concentrations and application of inhalation dosimetry. Office of Research and Development, Washington, DC; EPA/600/8-90/066F. Available online at http://www.epa.gov/iris/backgrd.html. U.S. EPA. (1995) Use of the benchmark dose approach in health risk assessment. Risk Assessment Forum, Washington, DC; EPA/630/R-94/007. Available online at http://cfpub.epa.gov/ncea/raf/recordisplay.cfm?deid=42601. U.S. EPA. (1996) Guidelines for reproductive toxicity risk assessment. Federal Register 61(212):56274–56322. Available online at http://www.epa.gov/iris/backgrd.html. U.S. EPA. (1998a) Guidelines for neurotoxicity risk assessment. Federal Register 63(93):26926–26954. Available online at http://www.epa.gov/iris/backgrd.html. U.S. EPA. (1998b) Health Effects Test Guidelines OPPTS 870.7800 Immunotoxicity. Available online at http://www.epa.gov/ncea/raf/rafguid.htm. U.S. EPA. (2000a) Science policy council handbook: risk characterization. Office of Science Policy, Office of Research and Development, Washington, DC; EPA 100-B-00-002. Available online at http://www.epa.gov/iris/backgrd.html. U.S. EPA. (2000b) Benchmark dose technical guidance document. External review draft. Risk Assessment Forum, Washington, DC; EPA/630/R-00/001. Available online at http://www.epa.gov/iris/backgrd.html. U.S. EPA. (2000c) Supplementary guidance for conducting health risk assessment of chemical mixtures. Risk Assessment Forum, Washington, DC; EPA/630/R-00/002. Available online at http://www.epa.gov/iris/backgrd.html. U.S. EPA. (2002a) Toxicological review of 1,1-dichloroethylene (CAS No. 75-35-4) in support of summary information on the Integrated Risk Information System (IRIS). Integrated Risk Information System (IRIS). National Center for Environmental Assessment, Washington, DC. Available online at http://www.epa.gov/iris. U.S. EPA. (2002b) A review of the reference dose and reference concentration processes. Risk Assessment Forum, Washington, DC; EPA/630/P-02/0002F. Available online at http://www.epa.gov/iris/backgrd.html. U.S. EPA. (2003) Toxicological review for dichloroacetic acid. Integrated Risk Information System (IRIS), National Center for Environmental Assessment, Washington, DC. Available online at http://www.epa.gov/iris/toxreviews/0654-tr.pdf. U.S. EPA. (2005a) Guidelines for carcinogen risk assessment. Risk Assessment Forum, Washington, DC; EPA/630/P-03/001F. Available online at http://www.epa.gov/iris/backgrd.html. U.S. EPA. (2005b) Supplemental guidance for assessing susceptibility from early-life exposure to carcinogens. Risk Assessment Forum, Washington, DC; EPA/630/R-03/003F. Available online at http://www.epa.gov/iris/backgrd.html. U.S. EPA. (2006a) Science policy council handbook: peer review. Third edition. Office of Science Policy, Office of Research and Development, Washington, DC; EPA/100/B-06/002. Available online at http://www.epa.gov/iris/backgrd.html. U.S. EPA. (2006b) A framework for assessing health risk of environmental exposures to children. National Center for Environmental Assessment, Washington, DC, EPA/600/R-05/093F. Available online at http://cfpub.epa.gov/ncea/cfm/recordisplay.cfm?deid=158363. U.S. EPA. (2007) Benchmark dose software (BMDS) version 1.4.1. (last modified February 2007). Available online at: http://www.epa.gov/ncea/bmds/about.html.

116
U.S. EPA. (2008) Benchmark dose software (BMDS) version 2.1 (last modified November 2009). Available online at: http://www.epa.gov/ncea/bmds/about.html. Vogel, EW; Nivard, MJ. (1993) Performance of 181 chemicals in a drosophila assay predominantly monitoring interchromosomal mitotic recombination. Mutagenesis 8:57–81. Wan, J; Ernstgard, L; Song, BJ; et al. (2006) Chlorzoxazone metabolism is increased in fasted Sprague-Dawley rats. J Pharm Pharmacol 58:51–61. Zeiger, E; Anderson, B; Haworth, S; et al. (1988) Salmonella mutagenicity tests. 4. Results from the testing of 300 chemicals. Environ Mol Mutagen 11:1–158. REFERENCES ADDED AFTER EXTERNAL PEER REVIEW Brady, JF; Ishizaki, H; Fukuto, JM; et al. (1991) Inhibition of cytochrome P-450 2E1 by diallyl sulfide and its metabolites. Chem Res Toxicol 4(6):642–647. Brondeau, MT; Bonnet, P; Guenier, JP; et al. (1990) Adrenal dependent leucopenia after short-term exposure to various airborne irritants in rats. J Appl Toxicol 10(2):83–86. Bull, RJ; Brown, JM; Meierhenry, EA; et al. (1986) Enhancement of the hepatotoxicity of chloroform in B6C3F1 mice by corn oil: implications for chloroform carcinogenesis. Environ Health Perspect 69:49–58. Condie, LW; Laurie, RD; Mills, T; et al. (1986) Effect of gavage vehicle on hepatotoxicity of carbon tetrachloride in CD-l mice: corn oil versus Tween-60 aqueous emulsion. Fundam Appl Toxicol 7:199–206. Dhabhar, FS; Miller, AH; McEwen, BS; et al. (1995) Effects of stress on immune cell distribution. Dynamics and hormonal mechanisms. J Immunol 154(10):5511–5527. DuPont. (1998) Trans-1,2-Dichloroethylene: 90-day inhalation toxicity study in rats, dated December 1, 1998. E.I. duPont de Nemours and Company, Haskell Laboratory for Toxicology and Industrial Medicine. Laboratory Project ID: HL-1998-00952. Jensen, MM. (1969) Changes in leukocyte counts associated with various stressors. J Reticuloendothelial Soc 6:457–465. Kaporec, KP; Kim, HJ; MacKenzie, WF; et al. (1995) Effect of oral dosing vehicles on the subchronic hepatotoxicity of carbon tetrachloride in the rat. J Toxicol Environ Health 44:13–27. Kiecolt-Glaser, JK; McGuire, L; Robles ,TF; et al. (2002) Psychoneuroimmunology: Psychological influences on immune function and health. Psychosom Med 64(1):15–28. Kim, HJ; Odendhal, S; Bruckner, JV. (1990) Effect of oral dosing vehicles on the acute hepatotoxicity of carbon tetrachloride in rats. Toxicol Appl Pharmacol 102:34–49. Larson, JL; Wolf, DC; Butterworth, BE. (1995) Induced regenerative cell proliferation in livers and kidneys of male F344/N rats given chloroform in corn oil by gavage or ad libitum in drinking water. Toxicology 95(1-3):73–86. Lilly, PD; Simmons, JE; Pegram, RA. (1996) Effect of subchronic corn oil gavage on the acute toxicity of orally administered bromodichloromethane. Toxicol Lett. 87:93-102. Lipscomb, JC; Kedderis, GL. (2002) Incorporating human interindividual biotransformation variance in health risk assessment. Sci Total Environ 288:13–21. Lipscomb, JC; Garrett, CM; Snawder, JE. (1997) Cytochrome P450-dependent metabolism of trichloroethylene: interindividual differences in humans. Toxicol Appl Pharmacol 142:311–318.
117
Luster, MI; Blanciforti, LM; Germolec, DR; et al. (2004) Associating changes in the immune system with clinical diseases for interpretation in risk assessment. In Current protocols in toxicology. Lawrence, DA, et al., ed. New York, NY:, Wiley and Sons, pp 18.1–18.20. Nakajima, T; Wang RS; Murayama, N; Sato, A. (1990) Three forms of triethylene-metabolizing enzymes in rat liver induced by ethanol, phenobarbital, and 3-methylcholanthrene. Tox Appl Pharmacol 102(3):546–552. Narotsky, MG; Pegram, RA; Kavlock, RJ. (1997) Effect of dosing vehicle on the developmental toxicity of bromodichloromethane and carbon tetrachloride in rats. Fundam Appl Toxicol 40:30–36. NTP. (2002b) NTP technical report on the toxicology and carcinogenesis studies of vanadium pentoxide (CAS No. 1314-62-1) in F344/N rats and B6C3F1 mice (inhalation studies). Public Health Service, U.S. Department of Health and Human Services; NTP TR 507, NIH Publication No. 03-4441, Available from the National Institute of Environmental Health Sciences, Research Triangle Park, NC and online at http://ntp.niehs.nih.gov/ntp/htdocs/LT_rpts/tr507.pdf (accessed September 17, 2010). NTP. (2004a) Toxicology and carcinogenesis studies of propylene glycol mono-t-butyl ether (CAS No. 57018-52-7) in F344/N rats and B6C3F1 mice and a toxicology study of propylene glycol mono-t-butyl ether in male NBR rats (inhalation studies). Public Health Service, U.S. Department of Health and Human Services; NTP TR 515, NIH Publication No. 04-4449. Available from the National Institute of Environmental Health Sciences, Research Triangle Park, NC and online at http://ntp.niehs.nih.gov/ntp/htdocs/LT_rpts/tr515.pdf (accessed September 17, 2010). NTP. (2004b) NTP technical report on the toxicology and carcinogenesis studies of stoddard solvent IIC (CAS No. 64742-88-7) in F344/N rats and B6C3F1 mice (inhalation studies). Public Health Service, U.S. Department of Health and Human Services; NTP TR 519, NIH Publication No. 04-4453. Available from the National Institute of Environmental Health Sciences, Research Triangle Park, NC and online at http://ntp.niehs.nih.gov/files/tr519-full.pdf (accessed September 17, 2010). NTP. (2005) NTP technical report on the toxicology and carcinogenesis studies of decalin (CAS NO. 91-17-8) in F344/N rats and B6C3F1 mice and a toxicology study of decalin in male NBR rats (inhalation studies). Public Health Service, U.S. Department of Health and Human Services; NTP TR 513, NIH Publication No. 05-4447. Available from the National Institute of Environmental Health Sciences, Research Triangle Park, NC and online at http://ntp.niehs.nih.gov/files/TR-513.pdf (accessed September 17, 2010). NTP. (2006) NTP technical report on the toxicology and carcinogenesis studies of divinylbenzene-HP (CAS No. 1321-74-0) in F344/N rats and B6C3F1 mice (inhalation studies). Public Health Service, U.S. Department of Health and Human Services; NTP TR 534, NIH Publication No. 07-4470. Available from the National Institute of Environmental Health Sciences, Research Triangle Park, NC and online at http://ntp.niehs.nih.gov/files/534_Web1.pdf (accessed September 17, 2010). NTP. (2007) NTP technical report on the toxicology and carcinogenesis studies of α-methylstyrene (CAS No. 98-83-9) in F344/N rats and B6C3F1 mice (inhalation studies). Public Health Service, U.S. Department of Health and Human Services; NTP TR 543, NIH Publication No. 08-4474. Available from the National Institute of Environmental Health Sciences, Research Triangle Park, NC and online at http://ntp.niehs.nih.gov/files/TR543_web.pdf (accessed September 17, 2010). NTP. (2009) NTP technical report on the toxicology and carcinogenesis studies of cumene (CAS No. 98-82-8) in F344/N rats and B6C3F1 mice (inhalation studies). Public Health Service, U.S. Department of Health and Human Services; NTP TR 542, NIH Publication No. 09-5885. Available from the National Institute of Environmental Health Sciences, Research Triangle Park, NC and online at http://ntp.niehs.nih.gov/files/542_Final_web.pdf (accessed September 17, 2010). Raymond, P; Plaa, GL. (1997) Effect of dosing vehicle on the hepatotoxicity of CCl4 and nephrotoxicity of CHCl3 in rats. J Toxicol Environ Health 51(5):463–476. Sato, M; Wada, K; Marumo, H; et al. (2000) Influence of corn oil and diet on reproduction and the kidney in female Sprague-Dawley rats. Toxicol Sci 56:156-164.

118
Seaton, MJ; Schlosser, PM; Bond, JA; et al. (1994) Benzene metabolism by human liver microsomes in relation to cytochrome P4502E1 activity. Carcinogenesis 15(9):1799–1806. Shimizu, T; Kawamura, T; Miyaji, C; et al. (2000) Resistance of extrathymic T cells to stress and the role of endogenous glucocorticoids in stress associated immuno suppression. Scand J Immunol 51:285–292. Snawder, JE; Lipscomb, JC. (2000) Interindividual variance of cytochrome P450 forms in human hepatic microsomes: correlation of individual forms with xenobiotic metabolism and implications in risk assessment. Regul Toxicol Pharmacol 32:200–209. Storek, J; Espino, G; Dawson, MA; et al. (2000) Low B-cell and monocyte counts on day 80 are associated with high infection rates between days 100 and 365 after allogenic marrow transplantation. Blood 96:3290–3293. WHO (World Health Organization). (1996) Principles and methods for assessing direct immunotoxicity associated with exposure to chemicals. A report of the International Programme on Chemical Safety (Environmental Health Criteria; 180, World Health Organization, Geneva. Yannai, S. (1983) Adrenocortical response to single and repeated doses of chloroform in rats. Arch Toxicol 54:145–156.

A-1
APPENDIX A: SUMMARY OF EXTERNAL PEER REVIEW, PUBLIC COMMENTS, AND DISPOSITION
The Toxicological Review of cis-1,2-Dichloroethylene and trans-1,2-Dichloroethylene (August, 2009) has undergone a formal external peer review performed by scientists in accordance with EPA guidance on peer review (U.S. EPA, 2006a, 2000a). An external peer review meeting was held December 17, 2009. The external peer reviewers were tasked with providing written answers to general questions on the overall assessment and on chemical-specific questions in areas of scientific controversy or uncertainty. A summary of significant comments made by the external reviewers and EPA’s responses to these comments arranged by charge question follow. In many cases the comments of the individual reviewers have been synthesized and paraphrased in development of Appendix A. EPA also received scientific comments from the public. These comments and EPA’s responses are included in a separate section of this appendix.
EXTERNAL PEER REVIEW PANEL COMMENTS
The reviewers made several editorial suggestions to clarify specific portions of the text. These changes were incorporated in the document as appropriate and are not discussed further. When the external peer reviewers commented on decisions and analyses in the Toxicological Review under multiple charge questions, these comments were organized under the most appropriate charge question.
I. General Charge Questions and Comments 1. Is the Toxicological Review logical, clear and concise? Has EPA accurately, clearly and objectively represented and synthesized the scientific evidence for noncancer and cancer hazard?
Comment
: In general, the reviewers observed that the Toxicological Review was logical, clear, and concise, and that EPA accurately and clearly represented and synthesized the scientific information. One reviewer stated that the Toxicological Review was not concise and that format requirements resulted in redundancy. One reviewer suggested that a new subsection entitled “Interactions with Other Chemicals” be added under Toxicokinetics to emphasize that DCEs may be protective against cytotoxic and mutagenic/carcinogenic actions of VOCs and other chemicals that undergo CYP2E1-catalyzed metabolic activation. Another reviewer suggested that a summary paragraph on 1,2-DCE metabolism be added that includes a discussion of the likely toxic metabolite and the suicide inhibition effect.

A-2
Response
: The Toxicological Review was revised to eliminate redundant text wherever possible. A new section, Section 3.3.3, CYP2E1 Inactivation by 1,2-DCE, was added to the toxicokinetics section to describe the potential role that DCEs may play in the metabolism of other chemicals that undergo CYP2E1-catalyzed metabolic activation. Section 3.3, Metabolism, was revised to include a summary paragraph on 1,2-DCE metabolism.
Comment
: One reviewer suggested that the document indicate that, based on the toxicity data available from the general literature, the relative potency of cis- and trans-1,2-DCE is not high. This reviewer also suggested adding to the Toxicological Review that the toxicity of 1,2-DCE has not been intentionally understudied, but rather that preliminary testing that demonstrated that the compounds are not particularly toxic or genotoxic provided little impetus to conduct studies of chronic and reproductive toxicity.
Response
: The relatively low toxicity of 1,2-DCE is discussed in Section 4.6. The observation that demonstration of limited toxicity in the available animal studies provided little impetus to conduct more extensive testing of these chemicals, while possibly correct, is speculative and was not added to the Toxicological Review.
Comment
: One reviewer stated that the synthesis of the evidence for hazard was superficial with respect to concerns that corn oil may exacerbate hepatotoxicity of chloroalkenes and concerns about whether the database supports deriving an RfD for the trans- isomer.
Response
: The RfD for trans-1,2-DCE is based on immunotoxicity. While effects on the liver were considered as candidate critical effects, oral toxicity values for 1,2-DCE isomers were not based on hepatotoxicity. A discussion of the potential influence of corn oil on hepato- and nephrotoxicity (two candidate critical effects for the cis-1,2-DCE RfD) was added to Section 5.3.
2. Please identify any additional studies that should be considered in the assessment of the noncancer and cancer health effects of cis- and trans-1,2-dicholoroethylene. Comment
: The following additional papers were identified by the peer reviewers for consideration in the assessment:
Ahmed, U; Redgrave, TG; Oates, PS. (2009) Effect of dietary fat to produce non-alcoholic fatty liver in the rat. J Gastroenterol Hepatol 24(8):1463–1471. Caldwell, JC; Keshava, N. (2006) Key issues in the modes of action and effects of trichloroethylene metabolites for liver and kidney tumorigenesis. Environ Health Perspect 114(9):1457–1463.
A-3
Chetty, KN; Calahan, L; Oliveriii, R; et al. (2006) Cholesterol-induced alteration in liver mineral concentrations in corn oil and olive oil fed rats. Pathophysiology 13(1):35–37.
Condie, LW. (1985) Target organ toxicology of halocarbons commonly found contaminating drinking water. Sci Total Environ 47:433–442.
Huber, WW; Grasl-Kraupp, B; Stekel, H; et al. (1997) Inhibition instead of enhancement of lipid peroxidation by pretreatment with the carcinogenic peroxisome proliferator nafenopin in rat liver exposed to a high single dose of corn oil. Arch Toxicol 71(9):575–581.
Raymond, P; Plaa, GL. (1997) Effect of dosing vehicle on the hepatotoxicity of CCl4 and nephrotoxicity of CHCl3 in rats. J Toxicol Environ Health 51(5):463–476. Rivera, CA; Abrams, SH; Tcharmtchi, MH; et al. (2006) Feeding a corn oil/sucrose-enriched diet enhances steatohepatitis in sedentary rats. Am J Physiol Gastrointest Liver Physiol 290(2):G386–G393.
Response
: These references were examined and all but one (Raymond and Plaa, 1997) have not been added to the Toxicological Review, as these references do not contribute significant information to the discussion and analysis in the document. Relevant information from Raymond and Plaa (1997) was incorporated into the Toxicological Review.
II. Chemical-Specific Charge Questions and Comments (A) Oral Reference Dose (RfD) for cis-1,2-DCE 1. The McCauley et al. (1990, 1995) subchronic gavage study in rats was selected as the basis for the derivation of the RfD for cis-1,2-DCE. Please comment on whether the selection of this study as the principal study is scientifically justified. Please identify and provide the rationale for any other study that should be selected as the principal study. Comment: Four reviewers agreed that the McCauley et al. (1995) study is the best available study and should be used as the principal study for the derivation of the RfD for cis-1,2-DCE. The fifth reviewer recommended that an RfD for cis-1,2-DCE not be derived in light of the discrepancies noted between the published and unpublished versions of the McCauley et al. (1995, 1990) study and use of corn oil as the vehicle in this gavage study. This reviewer suggested contacting the study authors to resolve the discrepancies. With regard to the vehicle, this reviewer observed that corn oil by itself can enhance hepatic lipid peroxidation and thereby the toxicity of the compounds and that such interactions have been noted between corn oil and chloroalkenes. One of the reviewers who agreed with using McCauley et al. (1995, 1990) as the principal study also suggested that documentation of the inconsistencies between the published and unpublished McCauley et al. studies be provided.

A-4
Response
A discussion of the potential influence of corn oil on the toxicity of 1,2-DCE was added to Section 5.3. Corn oil is frequently used as a vehicle in oral toxicity studies and is not considered a basis for rejecting a study from use in deriving a toxicity value.
: McCauley et al. (1995, 1990) was retained as the principal study for derivation of the RfD for cis-1,2-DCE. Text was added to Sections 4.2.1.1.1 and 4.2.1.2.1 to more specifically describe the discrepancies between the published and unpublished versions of this study. These discrepancies were not considered to compromise the integrity of the data since the inconsistencies involved data reporting issues rather than issues with the findings themselves. Resolution of the discrepancies between the two versions of the study was confirmed by one of the study authors.
Comment
: One reviewer suggested the historical ranges for liver and kidney weights and absolute organ weight be provided in Table 4-1.
Response
: No historical ranges for liver and kidney weight from this laboratory were available. Because absolute liver and kidney weight data were not reported in the published McCauley et al. (1995) study, these values were not added to Table 4-1; however, absolute liver and kidney weights as reported in the unpublished McCauley et al. (1990) report were added to the text of Section 4.2.1.2.1.
2. Increased relative liver weight in male rats (McCauley et al., 1990, 1995) was selected as the critical effect for the RfD for cis-1,2-DCE. Please comment on whether the selection of this critical effect is scientifically justified. Please identify and provide the rationale for any other endpoint that should be considered in the selection of the critical effect. Comment
: One reviewer questioned whether absolute liver weights were significantly elevated and stated that an increase in absolute liver weight would be more toxicologically significant than the increase in relative liver weight.
Response
: Absolute liver weights as reported in the unpublished McCauley et al. (1990) study and results of statistical significance testing were added to Section 4.2.1.2.1. For cis-1,2-DCE, relative weight is considered more toxicologically relevant as a measure of effect on organ weight than absolute organ weight because relative organ weight adjusts for any effect of the chemical on body weight. Thus, relative organ weight changes were used over absolute organ weight changes as candidate critical effects.

A-5
Comment
: One reviewer concurred with the selection of liver weight over kidney weight as the critical effect but asked for a more explicit discussion of the quantitative effect of this choice in light of the fact that a significant effect on kidney weight in male rats was observed at a lower dose than the liver effect. Another reviewer believed that increased liver weight represented the critical effect and that a convincing argument had been presented that the liver weight effect was chemical-related, but observed that the effect was relatively small and not associated with histopathology or serum liver enzyme changes. This reviewer recommended that the Toxicological Review provide a more scientifically based argument for increased liver weight as an adverse effect or precursor to an adverse effect. Three reviewers suggested that it may be worthwhile to look at the kidney as a potential critical target organ. One reviewer suggested that hypercalcinemia be considered as a potential critical effect.
Response
In light of the DuPont (1998) study, a 90-day inhalation study of trans-1,2-DCE that became available during the public comment period, the statement in the external review draft that the liver was the most sensitive and consistent target of 1,2-DCE toxicity was no longer clearly supported. The most compelling evidence for the liver as a target of 1,2-DCE toxicity had come from the inhalation toxicity study of trans-1,2-DCE by Freundt et al. (1977). Freundt et al. reported fatty infiltration of the liver lobules and Kupffer cells. These findings, however, were not corroborated by DuPont (1998). The DuPont (1998) study found no compound-related liver pathology in rats following acute inhalation at lethal concentrations or in a 90-day inhalation exposure at concentrations up to 15,800 mg/m3, a concentration 20-fold higher than the concentration used in the Freundt et al. (1977) study.
: Increased relative kidney weight in the McCauley et al. (1995) study was considered as a potential critical effect in response to peer reviewer recommendations. In McCauley et al. (1995, 1990), both relative liver and kidney weight in male and female rats showed an overall increasing trend. Relative kidney weight was statistically significantly increased in male rats (p ≤ 0.05) at the lowest dose tested (32 mg/kg-day); relative liver weight was statistically significantly increased at the next higher dose (97 mg/kg-day). Overall, the magnitude of change relative to the control was similar for both organs. A POD based on increased relative kidney weight was derived using BMDS modeling methods. Tables B-3 and B-4 present the goodness-of-fit statistics and BMD and BMDL estimates for all continuous models fit to these data for male and female rats, respectively. BMDS modeling of relative kidney weight data for the male and female rat yielded BMDL10 values of 5.1 and 10.4 mg/kg-day, respectively.
Both relative liver and kidney weight increases were presented as potential candidates for the critical effect. Because the BMDL10 of 5.1 mg/kg-day based on male rat kidney data is more sensitive than the BMDL10 of 18.6 mg/kg-day based on relative liver weight data, and since the strength of the evidence for the kidney as a target of toxicity was considered similar to the liver,

A-6
increased relative kidney weight in male rats was selected as the critical effect. Sections 5.1.1.1 to 5.1.1.3, 6.1, 6.2, and Appendix B were revised to reflect this change.
Hypercalcinemia was also evaluated as a potential critical effect. Calcium levels in the 90-day McCauley et al. (1995) study were statistically significantly increased as compared to controls at the two low doses in male rats only; no increases in calcium levels were seen in female rats. In the 14-day study, there were statistically significant increases at the two high doses in male rats (10 and 12%, respectively), but no significant increases were noted in female rats. Since there was no evidence of a dose-response relationship for hypercalcinemia in the 90-day study despite suggestion of an increase in the 14-day study, the increased levels of calcium were considered to be transient and not biologically significant. 3. BMD modeling methods were applied to liver weight data to derive the POD for the RfD. Has the BMD modeling been appropriately conducted? Is the BMR selected for use in deriving the POD (i.e., a 10% change in relative liver weight) scientifically justified? Please identify and provide the rationale for any alternative approaches (including the selection of the BMR, model, etc.) for the determination of the POD and discuss whether such approaches are preferred to EPA’s approach. Comment
: Four reviewers agreed that BMD modeling is a reasonable or appropriate approach to dose-response modeling. The fifth reviewer did not comment on the BMD modeling of increased relative liver weight, but noted that BMD modeling should be applied to kidney effects. In response to other charge questions, this reviewer indicated her preference for a simpler NOAEL/LOAEL approach for 1,2-DCE RfD derivation rather than BMD modeling, which she characterized as more sophisticated, presumably more precise, more opaque, and appropriate for chemicals with robust databases.
Response
: EPA considers BMD methods to be preferred over a NOAEL-LOAEL approach where the data set is amenable to BMD modeling. The application of BMD methods is not generally influenced by the nature and extent of the database. As described in response to a comment on charge question A2 for the cis-1,2-DCE RfD, relative kidney weight data for male and female rats were modeled to produce candidate PODs. Increased relative kidney weight in the male rat was selected as the basis for the POD for the RfD.
4. Please comment on the rationale for the selection of the uncertainty factors (UFs) applied to the POD for the derivation of the RfD. If changes to the selected UFs are proposed, please identify and provide a rationale(s).

A-7
Comment
: Three reviewers considered the intraspecies UF of 10 to be justified, with one of the three noting that this UF was justified in the absence of information to suggest a smaller value, and a second stating that the UF was justified by known gender, age, and genetic differences. One reviewer recommended that the intraspecies UF of 10 be reduced to 3. This reviewer noted that the effects of 1,2-DCE are generally believed to be due to their metabolites (via CYP2E1), that quantities of CYP2E1 and other constitutive CYP isozymes in all persons are far in excess of the amounts necessary to metabolize all low levels of 1,2-DCE, and therefore that elevated CYP2E1 activity in some individuals is inconsequential to the total amount of bioactive metabolite formed (i.e., eliminating the need for the toxicokinetic component of the intraspecies UF). This peer reviewer cited a paper on PBPK modeling by Kedderis (Chem-Biol Interact 107:109-121, 1997) as support, noting that simulating a 10-fold increase in CYP2E1 activity in humans inhaling 5 ppm DCE for 4 hours would result in only a 7% increase in DCE liver metabolism.
Response
: No information specific to variation in response to 1,2-DCE within the human population is available to support a decrease from the intraspecies UF of 10. The paper by Kedderis (1997) cited by one peer reviewer in support of eliminating the toxicokinetic component of the intraspecies UF of 3 included modeling results for 1,1-DCE, and not 1,2-DCE. Kedderis presented simulated results for 10 hazardous air pollutants, showing the effect on liver metabolism with a simulated 10-fold increase in enzyme induction. The increase in chemical metabolism for a number of the chemicals was small (e.g., 7% increase for 1,1-DCE); however, the simulated increases for other chemicals were considerably greater (e.g., 2.5-fold for carbon tetrachloride and 3.8-fold for tetrachloroethylene). Therefore, the results of the Kedderis simulations do not clearly support elimination of the toxicokinetic component of the intraspecies UF. Additional information was added to Section 4.8.3.1 on variation in human hepatic levels of CYP2E1, the enzyme primarily responsible for metabolizing 1,2-DCE, that demonstrates considerable intrahuman variability in enzyme activity and potential for differential susceptibility. The intraspecies UF of 10 was retained, although the justification for this UF in Sections 5.1.1.3 and 5.1.2.3 was expanded.
Comment: One reviewer considered an interspecies UF of 10 to be reasonable. Another reviewer stated that the interspecies UF should be reduced if documentation can be provided that cis-1,2-DCE is less toxic to humans than to rats. Two reviewers recommended an interspecies UF of 3 instead of 10 to account for potential toxicodynamic differences between animals and humans; it was suggested that the toxicokinetic component of the UF be removed. One of these reviewers noted that rodents metabolize short-chain aliphatic hydrocarbons to a greater extent than humans and that although the mode of action of cis-1,2-DCE is unknown, it is generally
A-8
accepted that oxidative metabolites (e.g., epoxides) are the most likely candidates for proximate toxicants. Response
: An interspecies UF is applied to account for differences in toxicokinetics and toxicodynamics between a test species and humans. Data to support the conclusion that the test species is more or equally as susceptible to the chemical as are humans and specific toxicokinetic or toxicodynamic data would inform the application of this UF. For cis-1,2-DCE, chemical-specific data are unavailable regarding the toxicokinetic or toxicodynamic differences between rats and humans. In the absence of information to quantify these differences, a factor of 10 to extrapolate from rats to humans was retained.
Comment
: One reviewer preferred an extrapolation from the LOAEL to NOAEL of 3 instead of the UF of 1 used in the derivation of the RfD for the cis- isomer.
Response
: It is current EPA practice to use an UF of 1 for the extrapolation of LOAEL to NOAEL when BMDS modeling is used. As noted in Section 5.1.1.3, the LOAEL to NOAEL UF is addressed as one of the considerations in selection of a BMR that represents a minimally biologically significant change.
Comment
: Three reviewers considered the subchronic to chronic UF of 10 to be appropriate. One reviewer considered an UF of 10 for lack of chronic data to be probably too high in view of the absence of adverse effects in inhalation experiments with cis-1,2-DCE or experiments with mixed isomers, and the likelihood that DCE isomers will continue to inhibit their own metabolic activation and thereby prevent adverse effects; this reviewer did not propose an alternate UF.
Response
: An UF of 10 to account for extrapolation from a subchronic to chronic exposure duration was retained in the absence of any chronic toxicity data to inform this extrapolation. The data on CYP2E1 inactivation by 1,2-DCE is limited to short-term exposure or in vitro studies; the suggestion by one peer reviewer that DCE isomers will continue to inhibit their own metabolic action does not have experimental support.
Comment: Three reviewers supported the database UF of 3. One reviewer did not see how database deficiencies could be assigned a quantitative value in the form of an UF and for that reason, proposed a database UF of 1. Another reviewer proposed a database UF of 10 on the basis of having only a single corn oil gavage study with a liver endpoint that cannot be confirmed with any subchronic toxicity studies. This reviewer would have been comfortable with a database UF of 5 if kidney data were used to derive the RfD since the evidence for

A-9
interactions between corn oil and kidney toxicity are much weaker and some internal data from the study support a potential effect on the kidney. Response
: The database UF of 3 was retained to address the lack of studies of reproductive toxicity for this isomer consistent with Agency practice (U.S. EPA, 2002b). It is also Agency practice to apply UFs of 1, 100.5 (rounded to 3), or 10 (U.S. EPA, 2002b); unless supported by chemical-specific data, values for UFs other than 1, 3, or 10 are generally not applied in deriving a reference value. Additionally, as noted in response to comments under charge question A2 for cis-1,2-DCE, the kidney data were used to derive the RfD.
(B) Oral Reference Dose (RfD) for trans-1,2-DCE 1. The 90-day immunotoxicity study by Shopp et al. (1985) was selected as the basis for the RfD for trans-1,2-DCE. Please comment on whether the selection of this study as the principal study is scientifically justified. Please identify and provide the rationale for any other study that should be selected as the principal study. Comment
: Four of the five reviewers supported selection of the immunotoxicity study by Shopp et al. (1985) as the principal study and agree that its selection has been scientifically justified in the document. One reviewer recommended the use of the NTP study as the principal study rather than Shopp et al. (1985) because it is a well-conducted study that did not use corn oil as the vehicle of administration, thus avoiding any potential interaction between the test compound and the corn oil vehicle, and because the authors of the Shopp et al. (1985) study did not find any compelling evidence that trans-1,2-DCE was responsible for a biologically significant adverse effect on the immune system.
Response
: The Shopp et al. (1985) study was retained as the principal study. The NTP study was considered as a candidate study for RfD derivation but was not chosen as the principal study because the candidate critical effect from this study (i.e., increased liver weight) was less sensitive and yielded a higher BMDL10 (837 mg/kg-day) than the BMDL1SD of 65 mg/kg-day for suppression of the immune system from Shopp et al. (1985). The relevance and biological significance of the immunotoxicity study by Shopp et al. (1985), as well as the basis for EPA’s interpretation of the study findings that differs from the study authors, is described in Section 4.6.1.2.
Comment: One reviewer suggested that consideration be given to the Barnes et al. (1985) study as a co-principal study unless a stronger rationale is given for excluding it because of observed

A-10
effects on absolute thymus weight. Additional comments offered by this reviewer on the analysis of thymus weight data are addressed in charge question B2. Response
: Section 5.1.2 was revised to include Barnes et al. (1985) as a candidate principal study in light of the reported effects on thymus weight.
2. Immune suppression, as indicated by the decrease of sheep red blood cell (sRBC)-specific IgM antibody-forming cells (AFCs) in the spleen in male mice, was selected as the critical effect for the RfD. Please comment on whether the selection of this critical effect is scientifically justified. Please identify and provide the rationale for any other endpoint that should be considered in the selection of the critical effect. Comment
: Four of the five reviewers supported immune suppression, as indicated by the decrease of sRBC-specific IgM AFCs in the spleen in male mice, as the critical effect for the RfD. One reviewer did not favor use of immune suppression as reported by Shopp et al. (1985) because of the authors’ interpretation that the AFC assay did not represent an immune response to trans-1,2-DCE (but rather reflected general toxicity).
Response
: A decrease of sRBC-specific IgM AFCs in the spleen in male mice was retained as the critical effect for the trans-1,2-DCE RfD. Differences in the interpretation of the Shopp et al. (1985) study findings reached by the study investigators and by the EPA are discussed in Section 4.6.1.2 and in the consideration of confidence in this study in Section 6.2.1.2.
Comment
: One reviewer suggested that decreased absolute thymus weight in female mice in the Barnes et al. (1985) study should be considered as a potential critical effect for developing a candidate POD.
Response
: Section 5.1.2 was revised to include decreased absolute thymus weight data from Barnes et al. (1985) in female mice as a candidate critical effect. These data were modeled using BMD methods. Because the BMDL1SD based on AFC assay data was more sensitive than the BMDL10 based on absolute thymus weight, no change was made in the selection of the critical effect.
Comment: One reviewer described the strengths and limitations of using decreased AFC response as the critical effect for the derivation of the RfD for trans-1,2-DCE and suggested that support for this endpoint be added by pointing out that decreased thymus weights can be a good indication for immunotoxicity and when accompanied by decreased AFC response, in the absence of general toxicity, provides an excellent predictor of immunotoxicity (Luster et al.,

A-11
1992). Response
: The discussion of uncertainties in the selection of decreased AFC response as the critical effect for the trans-1,2-DCE RfD (Section 5.3) was expanded to address these strengths and limitations.
Comment
: One reviewer noted that the Toxicological Review did not provide a sufficiently detailed scientific explanation of decrease in AFC response as adverse and biologically significant to support selection of this endpoint as the critical effect.
Response
: Text was added to Section 4.6.1.2 in support of a decrease in the AFC response as biologically significant.
3. BMD modeling was applied to data for suppression of AFCs in the spleen in male mice in the Shopp et al. (1985) study to derive the POD for the RfD. Has the BMD modeling been appropriately conducted? Is the BMR selected for use in deriving the POD (i.e., a change in response of 1 standard deviation from the control mean) scientifically justified? Please identify and provide the rationale for any alternative approaches (including the selection of the BMR, model, etc.) for the determination of the POD and discuss whether such approaches are preferred to EPA’s approach. Comment
: Four of the five reviewers noted that the BMD modeling was appropriately conducted and that the BMR of a change in response of 1 SD from the control mean was scientifically justified. One reviewer, who disagreed with EPA’s interpretation of the Shopp et al. (1985) findings, suggested that the traditional NOAEL approach would be more defensible than the BMD modeling approach.
Response
: The estimation of the POD using BMD modeling methods was retained. EPA’s justification for interpretation of the Shopp et al. (1985) findings is provided in Section 4.6.1.2.
4. Please comment on the rationale for the selection of the UFs applied to the POD for the derivation of the RfD. If changes to the selected UFs are proposed, please identify and provide a rationale(s). Comment
: One reviewer agreed with the composite UF of 3,000 considering the uncertainty in the toxicity of this compound, but did not provide comments on the individual UFs.
Response: No response is required.

A-12
Comment
: Three reviewers considered the intraspecies UF of 10 to be justified. As with the cis-1,2-RfD, one reviewer recommended that the intraspecies UF of 10 be reduced to 3 because the toxicokinetic component of the intraspecies UF was not necessary.
Response
: No information specific to variation in response to 1,2-DCE within the human population is available to support a decrease from the intraspecies UF of 10. Therefore, the intraspecies UF of 10 was retained. As for the cis-1,2-DCE RfD, the justification for the intraspecies UF (Section 5.1.2.3) was expanded to take into consideration variation in human CYP2E1, the enzyme primarily responsible for 1,2-DCE metabolism.
Comment
: Two reviewers concurred with the interspecies UF of 10. Two reviewers recommended an interspecies UF of 3 instead of 10 to account for potential toxicodynamic differences between animals and humans; it was suggested that the toxicokinetic component of the UF be removed.
Response
: An interspecies UF is applied to account for differences in toxicokinetics and toxicodynamics between a test species and humans. Data to support the conclusion that the test species is more or equally as susceptible to the chemical as are humans and specific toxicokinetic or toxicodynamic data would inform the application of this UF. For trans-1,2-DCE, chemical-specific data are unavailable regarding the toxicokinetic or toxicodynamic differences between mice and humans. In the absence of information to quantify these differences, a factor of 10 to extrapolate from mice to humans was retained.
Comment
: One reviewer concurred with the LOAEL to NOAEL UF of 1 (used because the current approach is to address this factor as one of the considerations in selecting a BMR for BMD modeling). A second reviewer noted that the value of 1 for this UF may be justified, although a dose corresponding to a mean change of 1 SD could be interpreted as an excess risk of 10% above an assumed 1% background risk, which may represent more than a minimal biologically significant change and therefore may warrant a large UF.
Response
: It is current EPA practice to use an UF of 1 for LOAEL to NOAEL extrapolation when BMD modeling is used to derive the POD. The magnitude of change in the AFC assay that represents a biologically significant effect has not been defined; therefore, a BMR of 1 SD was applied consistent with current Agency practice under the assumption that it represents a minimally biologically significant change (U.S. EPA, 2000b).

A-13
Comment
: Three reviewers considered the subchronic to chronic UF of 10 to be appropriate. The other reviewers did not offer a specific comment on this UF.
Response
: No response is required.
Comment
: Three reviewers supported the database UF of 3. As with the cis-1,2-DCE RfD, one reviewer did not see how database deficiencies could be assigned a quantitative value in the form of an UF and for that reason proposed a database UF of 1.
Response
: The database UF of 3 was retained to account for the lack of a multigenerational reproductive study.
(C) Inhalation Reference Concentration (RfC) for cis-1,2-DCE 1. An RfC was not derived due to the lack of available studies to characterize the health effects associated with cis-1,2-DCE administered via the inhalation route. Are there available data that might support development of an RfC for cis-1,2-DCE? Comment
: Four of the reviewers were not aware of any other available study that might support development of an RfC for cis-1,2-DCE. One reviewer considered all the oral data to be relevant for the estimation of an effect level for the inhalation route since the effects of cis-1,2-DCE used for the RfD are systemic.
Response
: In the absence of physiologically based pharmacokinetic models for rats and humans, EPA did not consider route-to-route extrapolation to be supported.
(D) Inhalation Reference Concentration (RfC) for trans-1,2-DCE 1. An RfC was not derived for trans-1,2-DCE. Has the scientific justification for not deriving an RfC been clearly described in the document? Are there available data that might support development of an RfC for trans-1,2-DCE? Comment: One reviewer expressed serious reservations about using the findings of Freundt et al. (1977) for the trans-1,2-DCE RfC, noting that the study is quite old, does not establish the purity of the test chemical, does not clearly report the frequency or magnitude of the fatty changes that are statistically significant, and the lack of concordance with the DuPont (1998) study which showed an absence of adverse hepatic effects. Three reviewers proposed an evaluation of the DuPont (1998) study as a possible basis for deriving an RfC for trans-1,2-DCE.

A-14
One of these three reviewers did not agree with the authors’ interpretation of the hematology findings, observing that the decreased WBC and lymphocyte counts may represent leucopenia and would constitute an adverse effect. This reviewer further observed that the DuPont (1998) study authors did not provide sufficient scientific support for their argument that the hematology findings were secondary to stress and lacked biological significance. Another reviewer suggested that EPA evaluate organ weight changes reported in the DuPont (1998) study for possible RfC derivation. This reviewer further recommended that if the organ weight data were not suitable, then EPA should simply state that the database is inadequate for deriving an RfC. Response
The Freundt et al. (1977) study was reevaluated in light of the findings from the DuPont (1998) study and determined not to be adequate for consideration as a principal study for RfC derivation. Therefore, the available inhalation data were not considered sufficient to derive an RfC for trans-1,2-DCE and Section 5.2.2 was revised accordingly.
: The RfC for trans-1,2-DCE was reevaluated in light of the submission of an unpublished report by DuPont (1998) (previously described in the Kelly (1999) abstract) during the public comment period. The DuPont (1998) study was reviewed and considered as a potential principal study for RfC derivation. A summary and evaluation of the study findings were added to Sections 4.2.2.2, 4.6.2.2, and 5.2.2. Relative liver and kidney weight changes in the DuPont (1998) study, while likely treatment related, were relatively small, not generally statistically significant and, therefore, were not considered to be an appropriate basis for the derivation of an RfC. Some statistically significant hematology findings were reported in the DuPont (1998) study (see a summary and discussion of these findings in Sections 4.6.2.2 and 5.2.2). The toxicological significance of these effects is not clear. No effects on spleen or thymus weight were found at 90 days, and no histopathological changes in these organs were reported. DuPont suggested that decreases in WBC count and lymphocytes were secondary to “stress” and elevated endogenous glucocorticoids. While the study authors did not provide support for this hypothesis, the phenomenon of irritation/stress leading to decreased WBC or lymphocyte counts has been observed following other chemical exposures (see discussion in Section 5.2.2). Further, a similar reduction in WBC and lymphocyte counts was not observed in the 90-day NTP (2002a) dietary study of trans-1,2-DCE. For these reasons, identification of hematological changes as a potential critical effect was not considered scientifically supported. Therefore, while changes in some endpoints in the DuPont (1998) study were attributed to trans-1,2-DCE exposure, none of the effects were identified as potential critical effects because of the magnitude of the effect or questions about the biological significance of the effect.
Comment: One reviewer disagreed with the decision not to extrapolate data from the oral route to derive an inhalation RfC and the decision not to use PBPK modeling for route-to-route extrapolation.

A-15
Response
: It is EPA practice to perform route-to-route extrapolation for derivation of an RfD or RfC only where such extrapolation can be conducted using PBPK modeling. As discussed in Section 3.5, a PBPK model for cis- and trans-1,2-DCE has been developed for the rat, but this model was not calibrated with human data. Therefore, route-to-route extrapolation using PBPK modeling was not considered appropriate.
Comment
: One reviewer proposed an UF of 3 for subchronic to chronic extrapolation and an intraspecies UF of 3 instead of 10 thereby allowing derivation of an RfC for trans-1,2-DCE. One reviewer disagreed with the decision not to derive an RfC for trans-1,2-DCE because the combined UF would be 10,000. This reviewer proposed that uncertainty be truncated at 3,000 for estimation of a health protective level.
Response
: In the absence of chemical-specific information on variation in response to trans-1,2-DCE in the human population and the lack of information on effects following a chronic exposure, EPA considers the use of 10-fold UFs for intraspecies and subchronic to chronic extrapolation to be appropriate. Where the composite UF for a reference value exceeds 3,000 (or where there is uncertainty in more than four areas of extrapolation), the RfD/RfC Technical Panel concluded that it is unlikely that the database is sufficient to derive a reference value (U.S. EPA, 2002b). EPA’s treatment of the inhalation data for trans-1,2-DCE in the External Review draft of the Toxicological Review was consistent with the recommendations of the Technical Panel. Upon reevaluation of the trans-1,2-DCE inhalation database (i.e., DuPont, 1998 and Freundt et al., 1977), EPA determined that the database was insufficient to support derivation of an RfC for trans-1,2-DCE. The selection of principal study, critical effect and application of UFs was removed from Section 5.2.2.
Comment
: One reviewer stated that EPA’s method for calculating human equivalent concentrations for inhaled halocarbons such as DCE is unsuitable and questioned whether the properties of 1,2-DCE were consistent with the qualifier for a category 2 gas (i.e., reactive in respiratory tissue). This reviewer stated that DCE is lipophilic and has quite limited water solubility, and therefore, its ability to penetrate the mucus layer in the upper respiratory tract should be limited.
Response: EPA’s evaluation of the human equivalent concentration for trans-1,2-DCE in the External Review draft of the Toxicological Review was consistent with the Methods for Derivation of Inhalation Reference Concentrations and Application of Inhalation Dosimetry (U.S. EPA, 1994b). The approach considers the physicochemical characteristics of the gas or vapor in question as well as the toxicological specifics of the target tissue (respiratory versus
A-16
systemic and, in the former case, extrathoracic, thoracic, tracheobronchial, or pulmonary) and separates gases into three categories. Trans-1,2-DCE qualifies as a category 2 gas: moderately water soluble, reactive in respiratory tissue, and toxicologically active at remote sites (U.S. EPA, 1994b). For category 2 gases, human equivalent concentration values are calculated by using methods for category 1 gases for portal-of-entry effects and category 3 methods for systemic effects (U.S. EPA, 1994b). The candidate critical effects considered in the derivation of an RfC were systemic effects (e.g., effects on the liver); thus, the methods for category 3 gases were considered appropriate. Based on comments from peer reviewers and critical review of the unpublished DuPont (1998) study, EPA determined that derivation of an RfC for trans-1,2-DCE was not supported. Therefore, the human equivalent concentration calculation was removed from Section 5.2.2. (E) Carcinogenicity of cis- and trans-1,2-DCE 1. Under the EPA’s 2005 Guidelines for Carcinogen Risk Assessment (www.epa.gov/iris/backgr-d.htm), the Agency concluded that there is inadequate information to assess the carcinogenic potential of cis- and trans-1,2-DCE. Please comment on the cancer weight-of-evidence characterization. Is the cancer weight of evidence characterization scientifically justified? Comment
: All the reviewers agreed that there is inadequate information to assess the carcinogenicity of 1,2-DCE isomers and that the cancer weight of evidence characterization applied to these chemicals is scientifically justified.
Response
: No response is required.
PUBLIC COMMENTS General Comment
: A public commenter noted that the description of uses of DCEs was correct historically, but that these uses did not reflect current use patterns. According to this commenter, use of DCEs as a solvent for polymers and rubber is no longer in practice. Trans-1,2-DCE, currently the only isomer commercially available in the United States, is now used as a degreasing agent and as one component of formulated products used for precision cleaning of electronic components, and (in small amounts) as a blowing agent for specialty foams.
Response
: Use information for 1,2-DCEs in Sections 2 and 6.1 was updated.
A-17
Oral Reference Dose (RfD) for trans-1,2-DCE Comment
: A public commenter stated that there seemed to be no scientific justification to base a proposed RfD for trans-1,2-DCE on AFC changes, an effect of unknown biological significance, and recommended that the RfD be based on liver effects, an effect with commonly recognized biological significance, as observed in Barnes et al. (1985).
Response
: Three endpoints were considered as candidates for the critical effect: decreased number of AFCs against sRBCs (Shopp et al., 1985), decreased absolute thymus weight (Barnes et al., 1985), and increased relative liver weight (NTP, 2002a). The dose-response analysis of the immune, thymus, and liver endpoints suggests that the immune system is more sensitive to the effects of trans-1,2-DCE. Therefore, suppression of the humoral immune system, as measured by spleen cell antibody production directed against sRBCs, was selected as the critical effect for the trans-1,2-DCE RfD, and the Shopp et al. (1985) study was identified as the principal study. Support for the biological significance of this effect in Section 4.6.1.2 was expanded.
Inhalation Reference Concentration (RfC) for trans-1,2-DCE Comment
: A public commenter submitted a complete study report of inhalation exposure to trans-1,2-DCE (DuPont. 1998. trans-1,2-Dichloroethylene: 90-day inhalation toxicity study in rats, E.I. duPont de Nemours and Company, Laboratory Project ID: HL-1998-00952) that was previously available as an abstract only (i.e., Kelly, 1999). This public commenter recommended that the DuPont (1998) study serve as the principal study for the trans-1,2-DCE RfC, and that the highest exposure concentration in this study (identified as a NOAEL) be used as the POD. The commenter questioned the use of fatty accumulation in the liver lobules and Kupffer cells from the Freundt et al. (1977) study as the basis for the RfC, noting that interpretation of these findings was complicated by the finding of similar effects in some control animals, lack of statistical significance between control and exposed groups, no evidence of functional changes in the livers of exposed animals, and lack of corroboration of the liver findings in the DuPont (1998) study.
Response: A summary of the complete study report (DuPont, 1998) was added to Section 4.2.2.2.2 and the findings were considered in Sections 4.6.2.2 and 5.2.2. Findings from the DuPont (1998) study were considered as the basis for the trans-1,2-DCE RfC. As discussed in response to peer reviewer comments on charge question D.1, EPA concluded that the available inhalation toxicity database for trans-1,2-DCE, including DuPont (1998) and Freundt et al. (1977), was insufficient for derivation of an RfC for this isomer.

B-1
APPENDIX B: BENCHMARK DOSE MODELING RESULTS AND OUTPUTS B.1. RfD for cis-1,2-DCE B.1.1. Relative Liver Weight Relative liver weight, female rat (McCauley et al., 1995, 1990)
Table B-1. BMDS modeling summary of relative liver weights in female rats exposed to cis-1,2-DCE by gavage for 90 days
Model Test 3
p-value Test 4
p-value AIC BMD10
(mg/kg-d) BMDL10
(mg/kg-d) Linear, polynomial (restricted) 0.6325 0.0014 -84.9916 339.0 278.3 Power (≥1) 0.6325 0.0014 -84.9916 339.0 278.3 Hill (≥1) 0.6325 0.3208 -96.2572 80.5 42.3 BMR = 10% change in mean relative liver weight relative to the control mean Constant variance
Only the Hill model [restricted] adequately described the data (test 4 χ2 p > 0.1). ==================================================================== Hill Model. (Version: 2.12; Date: 02/20/2007) Input Data File: G:\IRIS_CHEMICALS\DCE\BMD -- MCCAULEY\RELLIVERWTFEMALE.(d) Gnuplot Plotting File: G:\IRIS_CHEMICALS\DCE\BMD -- MCCAULEY\RELLIVERWTFEMALE.plt ==================================================================== BMDS MODEL RUN ~~~~~~~~~~~~~~~~~~~~~~~~~~~~~~~~~~~~~~~~~~~~~~~~~~~~~~~~~~~~~~~~~~~~~ The form of the response function is: Y[dose] = intercept + v*dose^n/(k^n + dose^n) Dependent variable = MEAN Independent variable = Dose(mg/kg/d) rho is set to 0 Power parameter restricted to be greater than 1 A constant variance model is fit Total number of dose groups = 5 Total number of records with missing values = 0 Maximum number of iterations = 250 Relative Function Convergence has been set to: 1e-008 Parameter Convergence has been set to: 1e-008 Default Initial Parameter Values alpha = 0.0446279 rho = 0 Specified intercept = 2.82 v = 0.85 n = 0.3078 k = 439.733

B-2
Asymptotic Correlation Matrix of Parameter Estimates ( *** The model parameter(s) -rho -n have been estimated at a boundary point, or have been specified by the user, and do not appear in the correlation matrix ) alpha intercept v k alpha 1 -4.5e-008 -7.8e-009 -2.9e-008 intercept -4.5e-008 1 -0.021 0.6 v -7.8e-009 -0.021 1 0.7 k -2.9e-008 0.6 0.7 1 Parameter Estimates 95.0% Wald Confidence Interval Variable Estimate Std. Err. Lower Conf. Limit Upper Conf. Limit alpha 0.0419186 0.0085566 0.025148 0.0586893 intercept 2.81563 0.0589669 2.70006 2.93121 v 1.04577 0.140777 0.76985 1.32169 n 1 NA k 218.547 103.222 16.235 420.858 NA - Indicates that this parameter has hit a bound implied by some inequality constraint and thus has no standard error. Table of Data and Estimated Values of Interest Dose N Obs Mean Est Mean Obs Std Dev Est Std Dev Scaled Res. ------ --- -------- -------- ----------- ----------- ---------- 0 10 2.82 2.82 0.19 0.205 0.0675 32 9 2.91 2.95 0.18 0.205 -0.574 97 9 3.21 3.14 0.22 0.205 1.07 291 10 3.36 3.41 0.18 0.205 -0.817 872 10 3.67 3.65 0.27 0.205 0.281 Model Descriptions for likelihoods calculated Model A1: Yij = Mu(i) + e(ij) Var{e(ij)} = Sigma^2 Model A2: Yij = Mu(i) + e(ij) Var{e(ij)} = Sigma(i)^2 Model A3: Yij = Mu(i) + e(ij) Var{e(ij)} = Sigma^2 Model A3 uses any fixed variance parameters that were specified by the user Model R: Yi = Mu + e(i) Var{e(i)} = Sigma^2

B-3
Likelihoods of Interest Model Log(likelihood) # Param's AIC A1 53.265523 6 -94.531046 A2 54.549420 10 -89.098840 A3 53.265523 6 -94.531046 fitted 52.128602 4 -96.257205 R 23.670875 2 -43.341750 Explanation of Tests Test 1: Do responses and/or variances differ among Dose levels? (A2 vs. R) Test 2: Are Variances Homogeneous? (A1 vs A2) Test 3: Are variances adequately modeled? (A2 vs. A3) Test 4: Does the Model for the Mean Fit? (A3 vs. fitted) (Note: When rho=0 the results of Test 3 and Test 2 will be the same.) Tests of Interest Test -2*log(Likelihood Ratio) Test df p-value Test 1 61.7571 8 <.0001 Test 2 2.56779 4 0.6325 Test 3 2.56779 4 0.6325 Test 4 2.27384 2 0.3208 The p-value for Test 1 is less than .05. There appears to be a difference between response and/or variances among the dose levels. It seems appropriate to model the data The p-value for Test 2 is greater than .1. A homogeneous variance model appears to be appropriate here. The p-value for Test 3 is greater than .1. The modeled variance appears to be appropriate here. The p-value for Test 4 is greater than .1. The model chosen seems to adequately describe the data. Benchmark Dose Computation Specified effect = 0.1 1 Risk Type = Relative risk Standard deviation Confidence level = 0.95 0.95 BMD = 80.5212 53.2 BMDL = 42.3183 28.7

B-4
2.6
2.8
3
3.2
3.4
3.6
3.8
0 100 200 300 400 500 600 700 800 900
Mea
n Re
spon
se
dose
Hill Model with 0.95 Confidence Level
15:30 08/29 2007
BMDBMDL
Hill
Figure displayed above is for a BMR = 10% change in mean relative liver weight relative to the control mean.

B-5
Relative liver weight, male rat (McCauley et al., 1995, 1990)
Table B-2. BMDS modeling summary of relative liver weights in male rats exposed to cis-1,2-DCE by gavage for 90 days
Model Test 3
p-value Test 4
p-value AIC BMD10
(mg/kg-d) BMDL10 (mg/kg-d) Linear, polynomial (restricted) 0.04879 0.04268 -54.8404 379.4 281.1 Power (≥1) 0.04879 0.04268 -54.8404 379.4 281.1 Hill (≥1) 0.04879 0.1662 -57.4185 54.4 18.6 BMR = 10% change in mean relative liver weight relative to the control mean Constant variance
Only the Hill model [restricted] adequately described the data (test 4 χ2 p > 0.1). Modeling of the variance (i.e., test 3 statistic in BMDS output) was not adequate (i.e., test 3 χ2 p > 0.1), but since BMR is not on a SD basis, fitting a homogeneous variance model is not essential. ==================================================================== Hill Model. (Version: 2.12; Date: 02/20/2007) Input Data File: G:\IRIS_CHEMICALS\DCE\BMD -- MCCAULEY\RELLIVERWTMALE.(d) Gnuplot Plotting File: G:\IRIS_CHEMICALS\DCE\BMD -- MCCAULEY\RELLIVERWTMALE.plt ===================================================================== BMDS MODEL RUN ~~~~~~~~~~~~~~~~~~~~~~~~~~~~~~~~~~~~~~~~~~~~~~~~~~~~~~~~~~~~~~~~~~~~~ The form of the response function is: Y[dose] = intercept + v*dose^n/(k^n + dose^n) Dependent variable = MEAN Independent variable = Dose(mg/kg/d) Power parameter restricted to be greater than 1 The variance is to be modeled as Var(i) = exp(lalpha + rho * ln(mean(i))) Total number of dose groups = 5 Total number of records with missing values = 0 Maximum number of iterations = 250 Relative Function Convergence has been set to: 1e-008 Parameter Convergence has been set to: 1e-008 Default Initial Parameter Values lalpha = -2.56356 rho = 0 intercept = 2.85 v = 0.9 n = 0.109937 k = 420.333 Asymptotic Correlation Matrix of Parameter Estimates ( *** The model parameter(s) -n
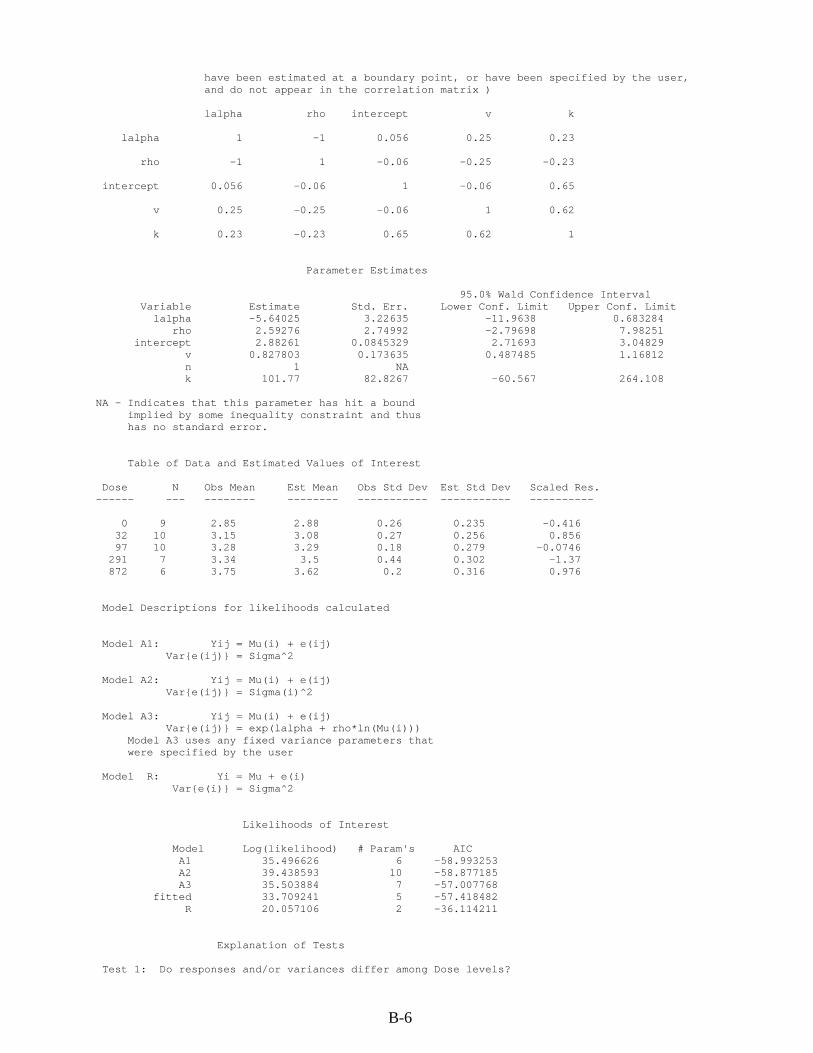
B-6
have been estimated at a boundary point, or have been specified by the user, and do not appear in the correlation matrix ) lalpha rho intercept v k lalpha 1 -1 0.056 0.25 0.23 rho -1 1 -0.06 -0.25 -0.23 intercept 0.056 -0.06 1 -0.06 0.65 v 0.25 -0.25 -0.06 1 0.62 k 0.23 -0.23 0.65 0.62 1 Parameter Estimates 95.0% Wald Confidence Interval Variable Estimate Std. Err. Lower Conf. Limit Upper Conf. Limit lalpha -5.64025 3.22635 -11.9638 0.683284 rho 2.59276 2.74992 -2.79698 7.98251 intercept 2.88261 0.0845329 2.71693 3.04829 v 0.827803 0.173635 0.487485 1.16812 n 1 NA k 101.77 82.8267 -60.567 264.108 NA - Indicates that this parameter has hit a bound implied by some inequality constraint and thus has no standard error. Table of Data and Estimated Values of Interest Dose N Obs Mean Est Mean Obs Std Dev Est Std Dev Scaled Res. ------ --- -------- -------- ----------- ----------- ---------- 0 9 2.85 2.88 0.26 0.235 -0.416 32 10 3.15 3.08 0.27 0.256 0.856 97 10 3.28 3.29 0.18 0.279 -0.0746 291 7 3.34 3.5 0.44 0.302 -1.37 872 6 3.75 3.62 0.2 0.316 0.976 Model Descriptions for likelihoods calculated Model A1: Yij = Mu(i) + e(ij) Var{e(ij)} = Sigma^2 Model A2: Yij = Mu(i) + e(ij) Var{e(ij)} = Sigma(i)^2 Model A3: Yij = Mu(i) + e(ij) Var{e(ij)} = exp(lalpha + rho*ln(Mu(i))) Model A3 uses any fixed variance parameters that were specified by the user Model R: Yi = Mu + e(i) Var{e(i)} = Sigma^2 Likelihoods of Interest Model Log(likelihood) # Param's AIC A1 35.496626 6 -58.993253 A2 39.438593 10 -58.877185 A3 35.503884 7 -57.007768 fitted 33.709241 5 -57.418482 R 20.057106 2 -36.114211 Explanation of Tests Test 1: Do responses and/or variances differ among Dose levels?
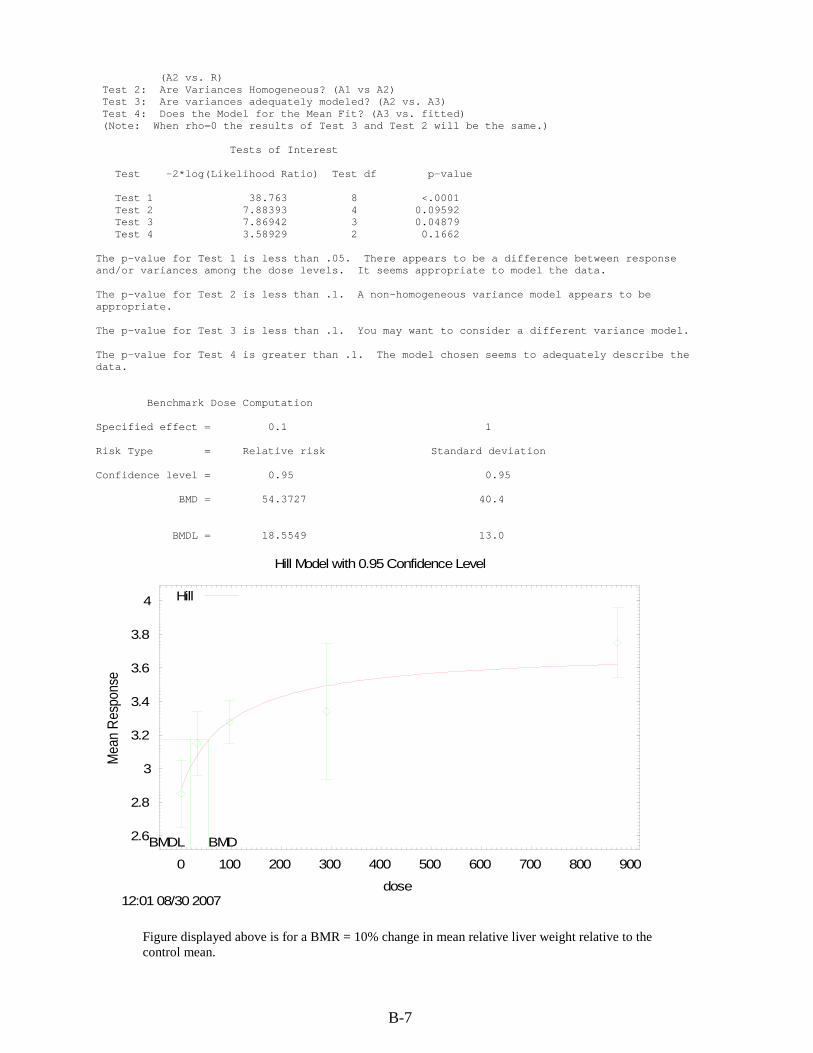
B-7
(A2 vs. R) Test 2: Are Variances Homogeneous? (A1 vs A2) Test 3: Are variances adequately modeled? (A2 vs. A3) Test 4: Does the Model for the Mean Fit? (A3 vs. fitted) (Note: When rho=0 the results of Test 3 and Test 2 will be the same.) Tests of Interest Test -2*log(Likelihood Ratio) Test df p-value Test 1 38.763 8 <.0001 Test 2 7.88393 4 0.09592 Test 3 7.86942 3 0.04879 Test 4 3.58929 2 0.1662 The p-value for Test 1 is less than .05. There appears to be a difference between response and/or variances among the dose levels. It seems appropriate to model the data. The p-value for Test 2 is less than .1. A non-homogeneous variance model appears to be appropriate. The p-value for Test 3 is less than .1. You may want to consider a different variance model. The p-value for Test 4 is greater than .1. The model chosen seems to adequately describe the data. Benchmark Dose Computation Specified effect = 0.1 1 Risk Type = Relative risk Standard deviation Confidence level = 0.95 0.95 BMD = 54.3727 40.4 BMDL = 18.5549 13.0
2.6
2.8
3
3.2
3.4
3.6
3.8
4
0 100 200 300 400 500 600 700 800 900
Mea
n Re
spon
se
dose
Hill Model with 0.95 Confidence Level
12:01 08/30 2007
BMDBMDL
Hill
Figure displayed above is for a BMR = 10% change in mean relative liver weight relative to the control mean.
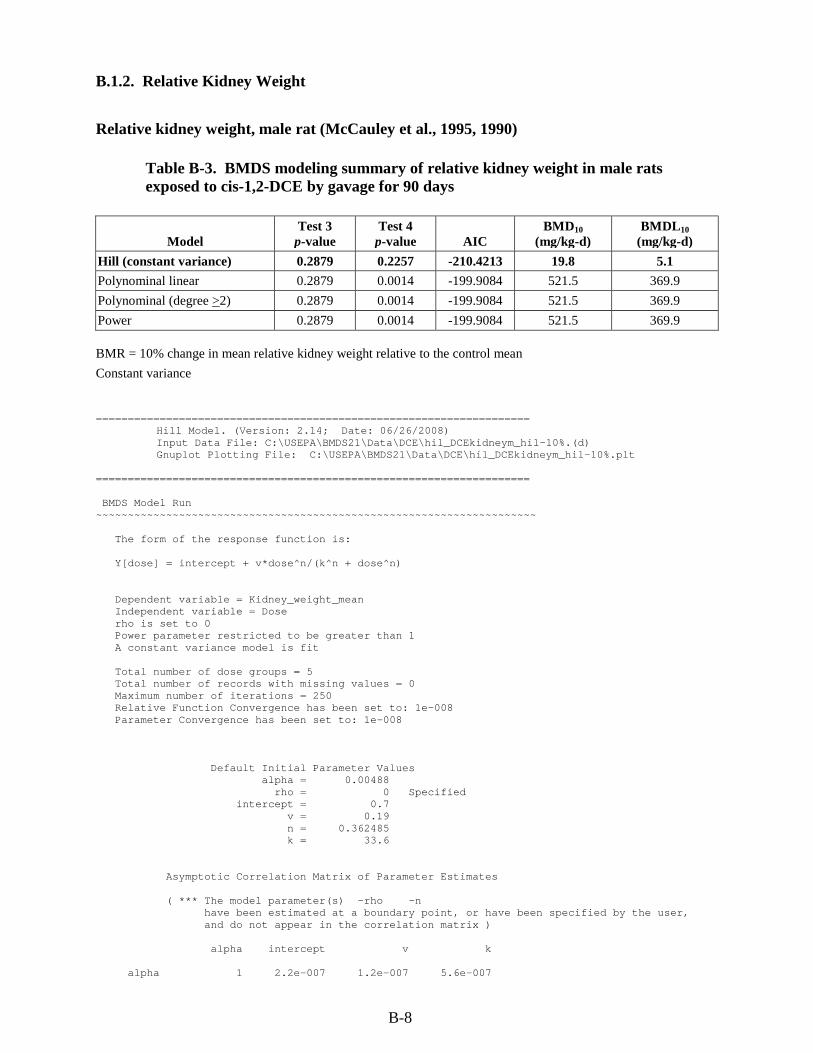
B-8
B.1.2. Relative Kidney Weight Relative kidney weight, male rat (McCauley et al., 1995, 1990)
Table B-3. BMDS modeling summary of relative kidney weight in male rats exposed to cis-1,2-DCE by gavage for 90 days
Model Test 3
p-value Test 4
p-value AIC BMD10
(mg/kg-d) BMDL10
(mg/kg-d) Hill (constant variance) 0.2879 0.2257 -210.4213 19.8 5.1 Polynominal linear 0.2879 0.0014 -199.9084 521.5 369.9 Polynominal (degree >2) 0.2879 0.0014 -199.9084 521.5 369.9 Power 0.2879 0.0014 -199.9084 521.5 369.9 BMR = 10% change in mean relative kidney weight relative to the control mean Constant variance ==================================================================== Hill Model. (Version: 2.14; Date: 06/26/2008) Input Data File: C:\USEPA\BMDS21\Data\DCE\hil_DCEkidneym_hil-10%.(d) Gnuplot Plotting File: C:\USEPA\BMDS21\Data\DCE\hil_DCEkidneym_hil-10%.plt ==================================================================== BMDS Model Run ~~~~~~~~~~~~~~~~~~~~~~~~~~~~~~~~~~~~~~~~~~~~~~~~~~~~~~~~~~~~~~~~~~~~~ The form of the response function is: Y[dose] = intercept + v*dose^n/(k^n + dose^n) Dependent variable = Kidney_weight_mean Independent variable = Dose rho is set to 0 Power parameter restricted to be greater than 1 A constant variance model is fit Total number of dose groups = 5 Total number of records with missing values = 0 Maximum number of iterations = 250 Relative Function Convergence has been set to: 1e-008 Parameter Convergence has been set to: 1e-008 Default Initial Parameter Values alpha = 0.00488 rho = 0 Specified intercept = 0.7 v = 0.19 n = 0.362485 k = 33.6 Asymptotic Correlation Matrix of Parameter Estimates ( *** The model parameter(s) -rho -n have been estimated at a boundary point, or have been specified by the user, and do not appear in the correlation matrix ) alpha intercept v k alpha 1 2.2e-007 1.2e-007 5.6e-007
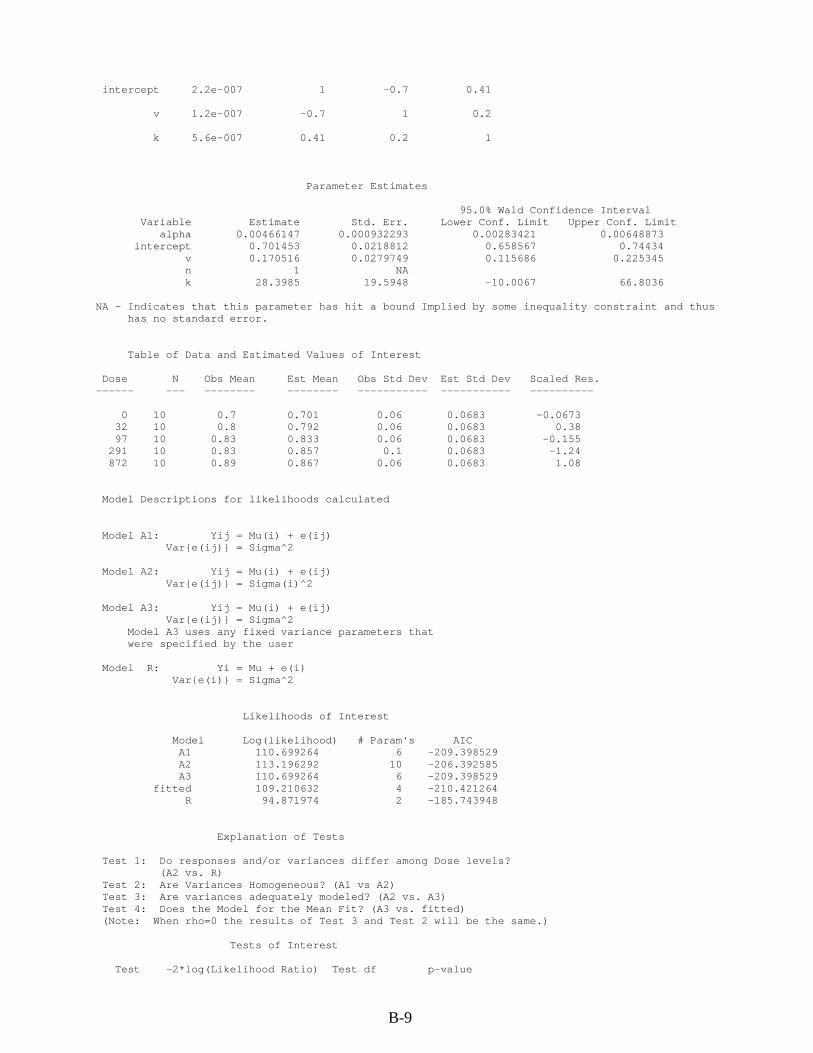
B-9
intercept 2.2e-007 1 -0.7 0.41 v 1.2e-007 -0.7 1 0.2 k 5.6e-007 0.41 0.2 1 Parameter Estimates 95.0% Wald Confidence Interval Variable Estimate Std. Err. Lower Conf. Limit Upper Conf. Limit alpha 0.00466147 0.000932293 0.00283421 0.00648873 intercept 0.701453 0.0218812 0.658567 0.74434 v 0.170516 0.0279749 0.115686 0.225345 n 1 NA k 28.3985 19.5948 -10.0067 66.8036 NA - Indicates that this parameter has hit a bound Implied by some inequality constraint and thus has no standard error. Table of Data and Estimated Values of Interest Dose N Obs Mean Est Mean Obs Std Dev Est Std Dev Scaled Res. ------ --- -------- -------- ----------- ----------- ---------- 0 10 0.7 0.701 0.06 0.0683 -0.0673 32 10 0.8 0.792 0.06 0.0683 0.38 97 10 0.83 0.833 0.06 0.0683 -0.155 291 10 0.83 0.857 0.1 0.0683 -1.24 872 10 0.89 0.867 0.06 0.0683 1.08 Model Descriptions for likelihoods calculated Model A1: Yij = Mu(i) + e(ij) Var{e(ij)} = Sigma^2 Model A2: Yij = Mu(i) + e(ij) Var{e(ij)} = Sigma(i)^2 Model A3: Yij = Mu(i) + e(ij) Var{e(ij)} = Sigma^2 Model A3 uses any fixed variance parameters that were specified by the user Model R: Yi = Mu + e(i) Var{e(i)} = Sigma^2 Likelihoods of Interest Model Log(likelihood) # Param's AIC A1 110.699264 6 -209.398529 A2 113.196292 10 -206.392585 A3 110.699264 6 -209.398529 fitted 109.210632 4 -210.421264 R 94.871974 2 -185.743948 Explanation of Tests Test 1: Do responses and/or variances differ among Dose levels? (A2 vs. R) Test 2: Are Variances Homogeneous? (A1 vs A2) Test 3: Are variances adequately modeled? (A2 vs. A3) Test 4: Does the Model for the Mean Fit? (A3 vs. fitted) (Note: When rho=0 the results of Test 3 and Test 2 will be the same.) Tests of Interest Test -2*log(Likelihood Ratio) Test df p-value

B-10
Test 1 36.6486 8 <.0001 Test 2 4.99406 4 0.2879 Test 3 4.99406 4 0.2879 Test 4 2.97727 2 0.2257 The p-value for Test 1 is less than .05. There appears to be a difference between response and/or variances among the dose levels It seems appropriate to model the data The p-value for Test 2 is greater than .1. A homogeneous variance model appears to be appropriate here The p-value for Test 3 is greater than .1. The modeled variance appears to be appropriate here The p-value for Test 4 is greater than .1. The model chosen seems to adequately describe the data Benchmark Dose Computation Specified effect = 0.1 1 Risk Type = Relative risk Standard deviation Confidence level = 0.95 0.95 BMD = 19.8467 19.0 BMDL = 5.06583 5.1
0.65
0.7
0.75
0.8
0.85
0.9
0.95
0 100 200 300 400 500 600 700 800 900
Mea
n R
espo
nse
dose
Hill Model with 0.95 Confidence Level
10:23 03/05 2010
BMDBMDL
Hill
Figure displayed above is for a BMR = 10% change in mean relative kidney weight relative to the control mean.

B-11
Relative kidney weight, female rat (McCauley et al., 1995, 1990)
Table B-4. BMDS modeling summary of relative kidney weight in female rats exposed to cis-1,2-DCE by gavage for 90 days
Model Test 3
p-value Test 4
p-value AIC BMD10
(mg/kg-d) BMDL10
(mg/kg-d) Hill (constant variance) <0.0001 0.9839 -137.6262 55.2 10.4 Hill (nonconstant variance) 0.0157 0.0564 -162.2055 37.4 Failed Polynominal linear <0.0001 0.1020 -135.4199 499.3 278.6 Polynominal (degree >2) <0.0001 0.4426 -137.9966 105.1 46.4 Power <0.0001 0.1020 -135.4199 499.3 278.6 BMR = 10% change in mean relative kidney weight relative to the control mean Constant variance ==================================================================== Hill Model. (Version: 2.14; Date: 06/26/2008) Input Data File: C:\USEPA\BMDS21\Data\Cai\DCE\hil_DCEkidneyf_hil-10%.(d) Gnuplot Plotting File: C:\USEPA\BMDS21\Data\Cai\DCE\hil_DCEkidneyf_hil-10%.plt ==================================================================== BMDS Model Run ~~~~~~~~~~~~~~~~~~~~~~~~~~~~~~~~~~~~~~~~~~~~~~~~~~~~~~~~~~~~~~~~~~~~~ The form of the response function is: Y[dose] = intercept + v*dose^n/(k^n + dose^n) Dependent variable = Kidney_weight_mean Independent variable = Dose rho is set to 0 Power parameter restricted to be greater than 1 A constant variance model is fit Total number of dose groups = 5 Total number of records with missing values = 0 Maximum number of iterations = 250 Relative Function Convergence has been set to: 1e-008 Parameter Convergence has been set to: 1e-008 Default Initial Parameter Values alpha = 0.02134 rho = 0 Specified intercept = 0.69 v = 0.16 n = 0.707673 k = 126.545 Asymptotic Correlation Matrix of Parameter Estimates ( *** The model parameter(s) -rho have been estimated at a boundary point, or have been specified by the user, and do not appear in the correlation matrix ) alpha intercept v n k alpha 1 -9.5e-010 4e-009 -8.3e-009 -8.2e-009 intercept -9.5e-010 1 -0.81 0.5 0.56

B-12
v 4e-009 -0.81 1 -0.58 -0.24 n -8.3e-009 0.5 -0.58 1 0.3 k -8.2e-009 0.56 -0.24 0.3 1 Parameter Estimates 95.0% Wald Confidence Interval Variable Estimate Std. Err. Lower Conf. Limit Upper Conf. Limit alpha 0.0192062 0.00384123 0.0116775 0.0267348 intercept 0.690031 0.0438105 0.604164 0.775898 v 0.16061 0.0554723 0.051886 0.269333 n 3.06776 3.37011 -3.53754 9.67306 k 60.5135 39.1149 -16.1503 137.177 Table of Data and Estimated Values of Interest Dose N Obs Mean Est Mean Obs Std Dev Est Std Dev Scaled Res. ------ --- -------- -------- ----------- ----------- ---------- 0 10 0.69 0.69 0.06 0.139 -0.000717 32 10 0.71 0.71 0.05 0.139 0.001 97 10 0.82 0.82 0.23 0.139 -0.00144 291 10 0.85 0.849 0.21 0.139 0.0148 872 10 0.85 0.851 0.06 0.139 -0.0136 Model Descriptions for likelihoods calculated Model A1: Yij = Mu(i) + e(ij) Var{e(ij)} = Sigma^2 Model A2: Yij = Mu(i) + e(ij) Var{e(ij)} = Sigma(i)^2 Model A3: Yij = Mu(i) + e(ij) Var{e(ij)} = Sigma^2 Model A3 uses any fixed variance parameters that were specified by the user Model R: Yi = Mu + e(i) Var{e(i)} = Sigma^2 Likelihoods of Interest Model Log(likelihood) # Param's AIC A1 73.813314 6 -135.626627 A2 94.162787 10 -168.325574 A3 73.813314 6 -135.626627 fitted 73.813110 5 -137.626221 R 68.169726 2 -132.339451 Explanation of Tests Test 1: Do responses and/or variances differ among Dose levels? (A2 vs. R) Test 2: Are Variances Homogeneous? (A1 vs A2) Test 3: Are variances adequately modeled? (A2 vs. A3) Test 4: Does the Model for the Mean Fit? (A3 vs. fitted) (Note: When rho=0 the results of Test 3 and Test 2 will be the same.) Tests of Interest Test -2*log(Likelihood Ratio) Test df p-value Test 1 51.9861 8 <.0001 Test 2 40.6989 4 <.0001 Test 3 40.6989 4 <.0001

B-13
Test 4 0.000406677 1 0.9839 The p-value for Test 1 is less than .05. There appears to be a difference between response and/or variances among the dose levels It seems appropriate to model the data The p-value for Test 2 is less than .1. Consider running a non-homogeneous variance model The p-value for Test 3 is less than .1. You may want to consider a different variance model The p-value for Test 4 is greater than .1. The model chosen seems to adequately describe the data Benchmark Dose Computation Specified effect = 0.1 1 Risk Type = Relative risk Standard deviation Confidence level = 0.95 0.95 BMD = 55.1746 111.0 BMDL = 10.3761 failed
0.65
0.7
0.75
0.8
0.85
0.9
0.95
1
0 100 200 300 400 500 600 700 800 900
Mea
n R
espo
nse
dose
Hill Model with 0.95 Confidence Level
10:22 03/12 2010
BMDBMDL
Hill
Figure displayed above is for a BMR = 10% change in mean relative kidney weight relative to the control mean.

B-14
B.2. RfD for trans-1,2-DCE B.2.1. Decreased Antibody Directed Against sRBC (Shopp et al., 1985)
Table B-5. BMDS modeling summary of decreased antibody directed against sRBC in male mice exposed to trans-1,2-DCE in drinking water for 90 days
Model Test 3
p-value Test 4
p-value AIC BMD1SD
(mg/kg-d) BMDL1SD (mg/kg-d)
Polynomial, 2nd degree (unrestricted) 0.4558 0.7077 483.818 125.55 65.04 Polynomial, 1st degree (unrestricted) 0.4558 0.2596 484.375 309.20 195.01 Power (≥1) 0.4558 0.2596 484.375 309.20 195.01 Hill (>1) 0.4558 NA 485.678 45.98 13.32 BMR = change in the mean response equal to 1 SD from the control mean ==================================================================== Polynomial Model. (Version: 2.12; Date: 02/20/2007) Input Data File: M:\NCEA\IRIS\DCE\BMDS RUNS\MALE_MICE_AFC_SHOPP_AG.(d) Gnuplot Plotting File: M:\NCEA\IRIS\DCE\BMDS RUNS\MALE_MICE_AFC_SHOPP_AG.plt ==================================================================== BMDS MODEL RUN ~~~~~~~~~~~~~~~~~~~~~~~~~~~~~~~~~~~~~~~~~~~~~~~~~~~~~~~~~~~~~~~~~~~~~ The form of the response function is: Y[dose] = beta_0 + beta_1*dose + beta_2*dose^2 + ... Dependent variable = MEAN Independent variable = DOSE rho is set to 0 Signs of the polynomial coefficients are not restricted A constant variance model is fit Total number of dose groups = 4 Total number of records with missing values = 0 Maximum number of iterations = 250 Relative Function Convergence has been set to: 1e-008 Parameter Convergence has been set to: 1e-008 Default Initial Parameter Values alpha = 1 rho = 0 Specified beta_0 = 2164.22 beta_1 = -4.53587 beta_2 = 0.00808257 Asymptotic Correlation Matrix of Parameter Estimates ( *** The model parameter(s) -rho have been estimated at a boundary point, or have been specified by the user, and do not appear in the correlation matrix ) alpha beta_0 beta_1 beta_2 alpha 1 0.00028 -0.00047 0.00046 beta_0 0.00028 1 -0.53 0.4

B-15
beta_1 -0.00047 -0.53 1 -0.97 beta_2 0.00046 0.4 -0.97 1 Parameter Estimates 95.0% Wald Confidence Interval Variable Estimate Std. Err. Lower Conf. Limit Upper Conf. Limit alpha 202454 47770.9 108825 296084 beta_0 2172.39 106.683 1963.3 2381.49 beta_1 -4.61897 1.97169 -8.48342 -0.754516 beta_2 0.00824479 0.00506139 -0.00167535 0.0181649 Table of Data and Estimated Values of Interest Dose N Obs Mean Est Mean Obs Std Dev Est Std Dev Scaled Res. ------ --- -------- -------- ----------- ----------- ---------- 0 12 2.2e+003 2.17e+003 433 450 0.213 17 8 2.05e+003 2.1e+003 430 450 -0.303 175 8 1.63e+003 1.62e+003 385 450 0.053 387 8 1.62e+003 1.62e+003 639 450 -0.0105 Model Descriptions for likelihoods calculated Model A1: Yij = Mu(i) + e(ij) Var{e(ij)} = Sigma^2 Model A2: Yij = Mu(i) + e(ij) Var{e(ij)} = Sigma(i)^2 Model A3: Yij = Mu(i) + e(ij) Var{e(ij)} = Sigma^2 Model A3 uses any fixed variance parameters that were specified by the user Model R: Yi = Mu + e(i) Var{e(i)} = Sigma^2 Likelihoods of Interest Model Log(likelihood) # Param's AIC A1 -237.839020 5 485.678039 A2 -236.534278 8 489.068557 A3 -237.839020 5 485.678039 fitted -237.909292 4 483.818585 R -243.158365 2 490.316730 Explanation of Tests Test 1: Do responses and/or variances differ among Dose levels? (A2 vs. R) Test 2: Are Variances Homogeneous? (A1 vs A2) Test 3: Are variances adequately modeled? (A2 vs. A3) Test 4: Does the Model for the Mean Fit? (A3 vs. fitted) (Note: When rho=0 the results of Test 3 and Test 2 will be the same.) Tests of Interest Test -2*log(Likelihood Ratio) Test df p-value Test 1 13.2482 6 0.03926 Test 2 2.60948 3 0.4558 Test 3 2.60948 3 0.4558 Test 4 0.140546 1 0.7077
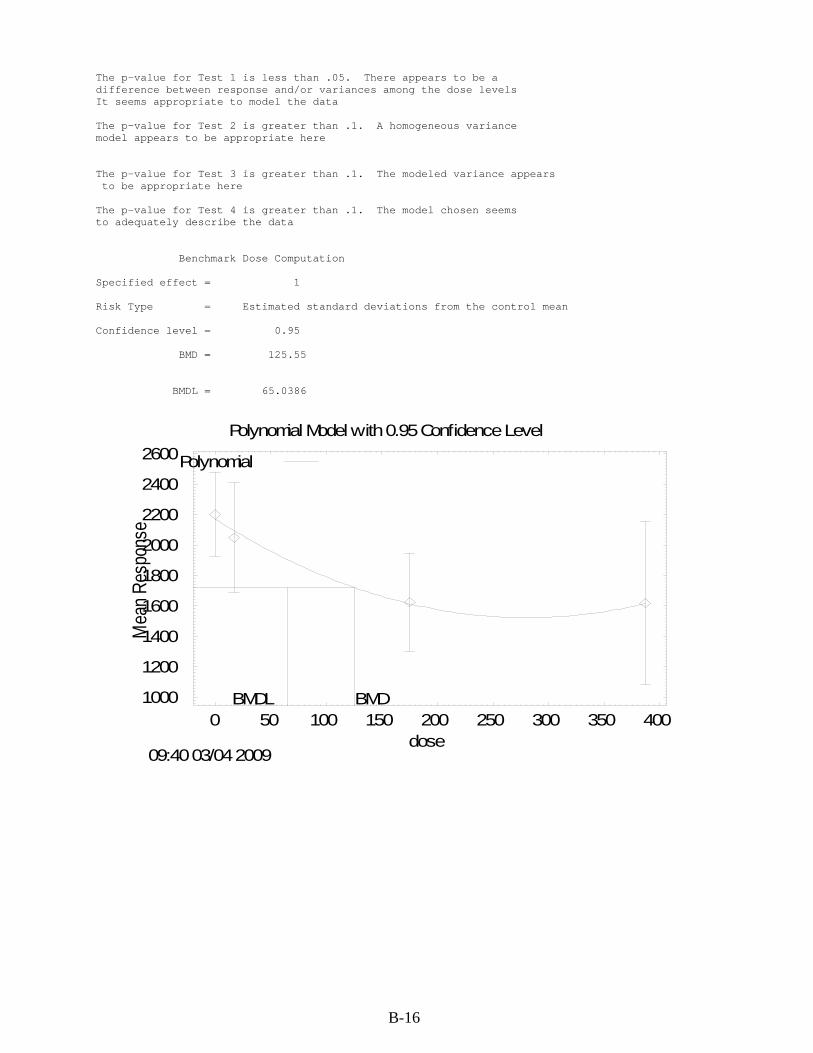
B-16
The p-value for Test 1 is less than .05. There appears to be a difference between response and/or variances among the dose levels It seems appropriate to model the data The p-value for Test 2 is greater than .1. A homogeneous variance model appears to be appropriate here The p-value for Test 3 is greater than .1. The modeled variance appears to be appropriate here The p-value for Test 4 is greater than .1. The model chosen seems to adequately describe the data Benchmark Dose Computation Specified effect = 1 Risk Type = Estimated standard deviations from the control mean Confidence level = 0.95 BMD = 125.55 BMDL = 65.0386
1000
1200
1400
1600
1800
2000
2200
2400
2600
0 50 100 150 200 250 300 350 400
Mea
n Res
pons
e
dose
Polynomial Model with 0.95 Confidence Level
09:40 03/04 2009
BMDBMDL
Polynomial
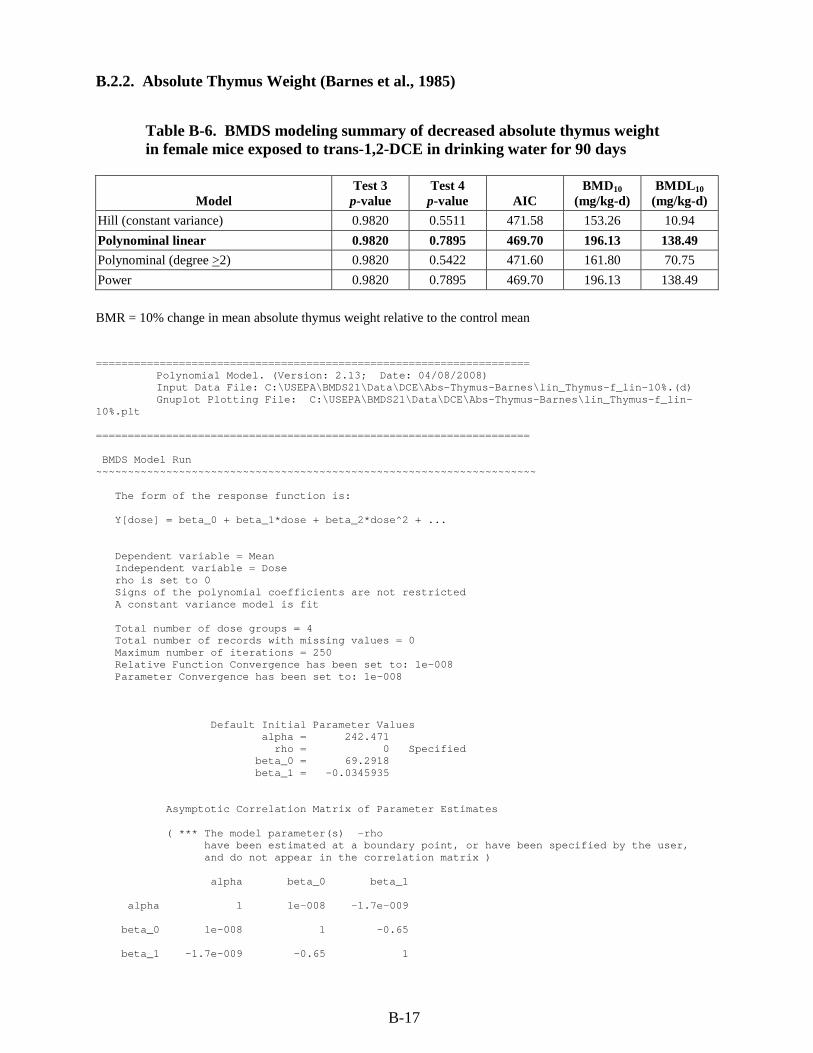
B-17
B.2.2. Absolute Thymus Weight (Barnes et al., 1985) Table B-6. BMDS modeling summary of decreased absolute thymus weight in female mice exposed to trans-1,2-DCE in drinking water for 90 days
Model Test 3
p-value Test 4
p-value AIC BMD10
(mg/kg-d) BMDL10
(mg/kg-d) Hill (constant variance) 0.9820 0.5511 471.58 153.26 10.94 Polynominal linear 0.9820 0.7895 469.70 196.13 138.49 Polynominal (degree >2) 0.9820 0.5422 471.60 161.80 70.75 Power 0.9820 0.7895 469.70 196.13 138.49 BMR = 10% change in mean absolute thymus weight relative to the control mean ==================================================================== Polynomial Model. (Version: 2.13; Date: 04/08/2008) Input Data File: C:\USEPA\BMDS21\Data\DCE\Abs-Thymus-Barnes\lin_Thymus-f_lin-10%.(d) Gnuplot Plotting File: C:\USEPA\BMDS21\Data\DCE\Abs-Thymus-Barnes\lin_Thymus-f_lin-10%.plt ==================================================================== BMDS Model Run ~~~~~~~~~~~~~~~~~~~~~~~~~~~~~~~~~~~~~~~~~~~~~~~~~~~~~~~~~~~~~~~~~~~~~ The form of the response function is: Y[dose] = beta_0 + beta_1*dose + beta_2*dose^2 + ... Dependent variable = Mean Independent variable = Dose rho is set to 0 Signs of the polynomial coefficients are not restricted A constant variance model is fit Total number of dose groups = 4 Total number of records with missing values = 0 Maximum number of iterations = 250 Relative Function Convergence has been set to: 1e-008 Parameter Convergence has been set to: 1e-008 Default Initial Parameter Values alpha = 242.471 rho = 0 Specified beta_0 = 69.2918 beta_1 = -0.0345935 Asymptotic Correlation Matrix of Parameter Estimates ( *** The model parameter(s) -rho have been estimated at a boundary point, or have been specified by the user, and do not appear in the correlation matrix ) alpha beta_0 beta_1 alpha 1 1e-008 -1.7e-009 beta_0 1e-008 1 -0.65 beta_1 -1.7e-009 -0.65 1

B-18
Parameter Estimates 95.0% Wald Confidence Interval Variable Estimate Std. Err. Lower Conf. Limit Upper Conf. Limit alpha 230.509 38.4181 155.21 305.807 beta_0 69.622 2.36029 64.9959 74.2481 beta_1 -0.0354984 0.00991539 -0.0549322 -0.0160645 Table of Data and Estimated Values of Interest Dose N Obs Mean Est Mean Obs Std Dev Est Std Dev Scaled Res. ------ --- -------- -------- ----------- ----------- ---------- 0 24 71 69.6 14.7 15.2 0.445 22.6 16 67 68.8 16 15.2 -0.479 224 16 61 61.7 16 15.2 -0.177 452 16 54 53.6 16 15.2 0.112 Model Descriptions for likelihoods calculated Model A1: Yij = Mu(i) + e(ij) Var{e(ij)} = Sigma^2 Model A2: Yij = Mu(i) + e(ij) Var{e(ij)} = Sigma(i)^2 Model A3: Yij = Mu(i) + e(ij) Var{e(ij)} = Sigma^2 Model A3 uses any fixed variance parameters that were specified by the user Model R: Yi = Mu + e(i) Var{e(i)} = Sigma^2 Likelihoods of Interest Model Log(likelihood) # Param's AIC A1 -231.613992 5 473.227984 A2 -231.527960 8 479.055919 A3 -231.613992 5 473.227984 fitted -231.850361 3 469.700721 R -237.748366 2 479.496732 Explanation of Tests Test 1: Do responses and/or variances differ among Dose levels? (A2 vs. R) Test 2: Are Variances Homogeneous? (A1 vs A2) Test 3: Are variances adequately modeled? (A2 vs. A3) Test 4: Does the Model for the Mean Fit? (A3 vs. fitted) (Note: When rho=0 the results of Test 3 and Test 2 will be the same.) Tests of Interest Test -2*log(Likelihood Ratio) Test df p-value Test 1 12.4408 6 0.05283 Test 2 0.172065 3 0.982 Test 3 0.172065 3 0.982 Test 4 0.472737 2 0.7895 The p-value for Test 1 is greater than .05. There may not be a diffence between responses and/or variances among the dose levels Modelling the data with a dose/response curve may not be appropriate The p-value for Test 2 is greater than .1. A homogeneous variance

B-19
model appears to be appropriate here The p-value for Test 3 is greater than .1. The modeled variance appears to be appropriate here The p-value for Test 4 is greater than .1. The model chosen seems to adequately describe the data Benchmark Dose Computation Specified effect = 0.1 1 Risk Type = Relative risk Standard deviation Confidence level = 0.95 0.95 BMD = 196.127 427.70 BMDL = 138.488 289.04
45
50
55
60
65
70
75
80
0 50 100 150 200 250 300 350 400 450
Mea
n R
espo
nse
dose
Linear Model with 0.95 Confidence Level
15:36 03/18 2010
BMDBMDL
LinearBMD Lower Bound
Figure displayed above is for a BMR = 10% change in mean absolute thymus weight relative to the control mean.

B-20
B.2.3. Relative Liver Weight (NTP, 2002a) Relative liver weight, male mouse (NTP, 2002a)
Table B-7. BMDS modeling summary of relative liver weight in male mice exposed to trans-1,2-DCE in the feed for 14 weeks
Model Test 3
p-value Test 4
p-value AIC BMD10
(mg/kg-d) BMDL10
(mg/kg-d) Linear, polynomial (restricted) 0.2228 0.2974 -79.0425 7,063.8 5,109.8 Power (≥1) 0.2228 0.2974 -79.0425 7,063.8 5,109.8 Hill (≥1) 0.2228 0.6152 -80.1465 3,241.9 867.3 BMR = 10% change in mean relative liver weight relative to the control mean Constant variance
All models used in the evaluation of relative liver weight in male mice produced outputs with χ2 p > 0.1. The Hill model, with the lowest AIC values, provided the best fit of the data. ==================================================================== Hill Model. (Version: 2.12; Date: 02/20/2007) Input Data File: G:\IRIS_CHEMICALS\DCE\BMD-- NTP\REL_LIVER_WT_MOUSEM.(d) Gnuplot Plotting File: G:\IRIS_CHEMICALS\DCE\BMD-- NTP\REL_LIVER_WT_MOUSEM.plt ==================================================================== BMDS MODEL RUN ~~~~~~~~~~~~~~~~~~~~~~~~~~~~~~~~~~~~~~~~~~~~~~~~~~~~~~~~~~~~~~~~~~~~~ The form of the response function is: Y[dose] = intercept + v*dose^n/(k^n + dose^n) Dependent variable = MEAN Independent variable = Dose(mg/kg-d) rho is set to 0 Power parameter restricted to be greater than 1 A constant variance model is fit Total number of dose groups = 6 Total number of records with missing values = 0 Maximum number of iterations = 250 Relative Function Convergence has been set to: 1e-008 Parameter Convergence has been set to: 1e-008 Default Initial Parameter Values alpha = 0.0912885 rho = 0 Specified intercept = 4.347 v = 0.632 n = 0.479874 k = 2442.97 Asymptotic Correlation Matrix of Parameter Estimates ( *** The model parameter(s) -rho -n have been estimated at a boundary point, or have been specified by the user,

B-21
and do not appear in the correlation matrix ) alpha intercept v k alpha 1 -2.5e-009 2e-008 9.8e-009 intercept -2.5e-009 1 -0.02 0.68 v 2e-008 -0.02 1 0.65 k 9.8e-009 0.68 0.65 1 Parameter Estimates 95.0% Wald Confidence Interval Variable Estimate Std. Err. Lower Conf. Limit Upper Conf. Limit alpha 0.0846603 0.0154568 0.0543656 0.114955 intercept 4.36928 0.09406 4.18493 4.55364 v 0.679896 0.178916 0.329227 1.03057 n 1 NA k 1802.79 1800.91 -1726.93 5332.51 NA - Indicates that this parameter has hit a bound implied by some inequality constraint and thus has no standard error. Table of Data and Estimated Values of Interest Dose N Obs Mean Est Mean Obs Std Dev Est Std Dev Scaled Res. ------ --- -------- -------- ----------- ----------- ---------- 0 10 4.35 4.37 0.177 0.291 -0.242 480 10 4.55 4.51 0.357 0.291 0.432 920 10 4.6 4.6 0.364 0.291 -0.0219 1900 10 4.75 4.72 0.266 0.291 0.292 3850 10 4.74 4.83 0.25 0.291 -1.05 8065 10 4.98 4.92 0.351 0.291 0.587 Model Descriptions for likelihoods calculated Model A1: Yij = Mu(i) + e(ij) Var{e(ij)} = Sigma^2 Model A2: Yij = Mu(i) + e(ij) Var{e(ij)} = Sigma(i)^2 Model A3: Yij = Mu(i) + e(ij) Var{e(ij)} = Sigma^2 Model A3 uses any fixed variance parameters that were specified by the user Model R: Yi = Mu + e(i) Var{e(i)} = Sigma^2 Likelihoods of Interest Model Log(likelihood) # Param's AIC A1 44.972729 7 -75.945458 A2 48.458304 12 -72.916608 A3 44.972729 7 -75.945458 fitted 44.073247 4 -80.146494 R 33.552988 2 -63.105977

B-22
Explanation of Tests Test 1: Do responses and/or variances differ among Dose levels? (A2 vs. R) Test 2: Are Variances Homogeneous? (A1 vs A2) Test 3: Are variances adequately modeled? (A2 vs. A3) Test 4: Does the Model for the Mean Fit? (A3 vs. fitted) (Note: When rho=0 the results of Test 3 and Test 2 will be the same.) Tests of Interest Test -2*log(Likelihood Ratio) Test df p-value Test 1 29.8106 10 0.0009199 Test 2 6.97115 5 0.2228 Test 3 6.97115 5 0.2228 Test 4 1.79896 3 0.6152 The p-value for Test 1 is less than .05. There appears to be a difference between response and/or variances among the dose levels. It seems appropriate to model the data. The p-value for Test 2 is greater than .1. A homogeneous variance model appears to be appropriate here. The p-value for Test 3 is greater than .1. The modeled variance appears to be appropriate here. The p-value for Test 4 is greater than .1. The model chosen seems to adequately describe the data. Benchmark Dose Computation Specified effect = 0.1 1 Risk Type = Relative risk Standard deviation Confidence level = 0.95 0.95 BMD = 3241.95 1348.69 BMDL = 867.264 395.878
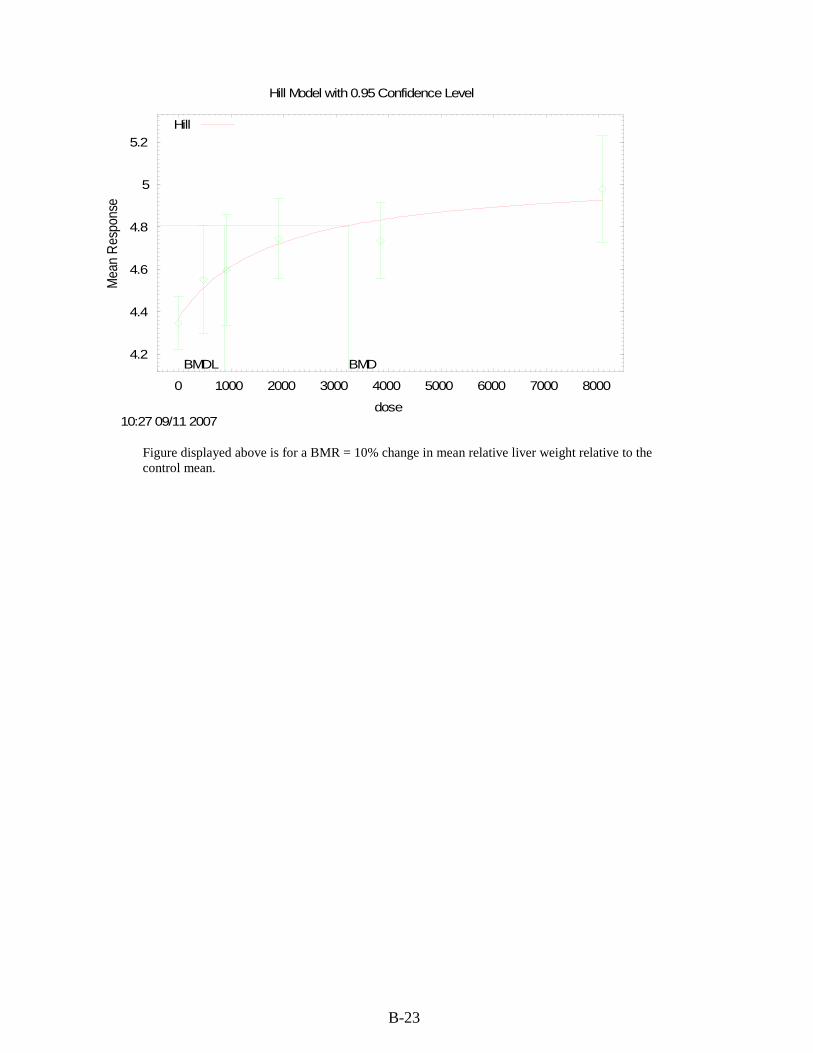
B-23
4.2
4.4
4.6
4.8
5
5.2
0 1000 2000 3000 4000 5000 6000 7000 8000
Mea
n Re
spon
se
dose
Hill Model with 0.95 Confidence Level
10:27 09/11 2007
BMDBMDL
Hill
Figure displayed above is for a BMR = 10% change in mean relative liver weight relative to the control mean.
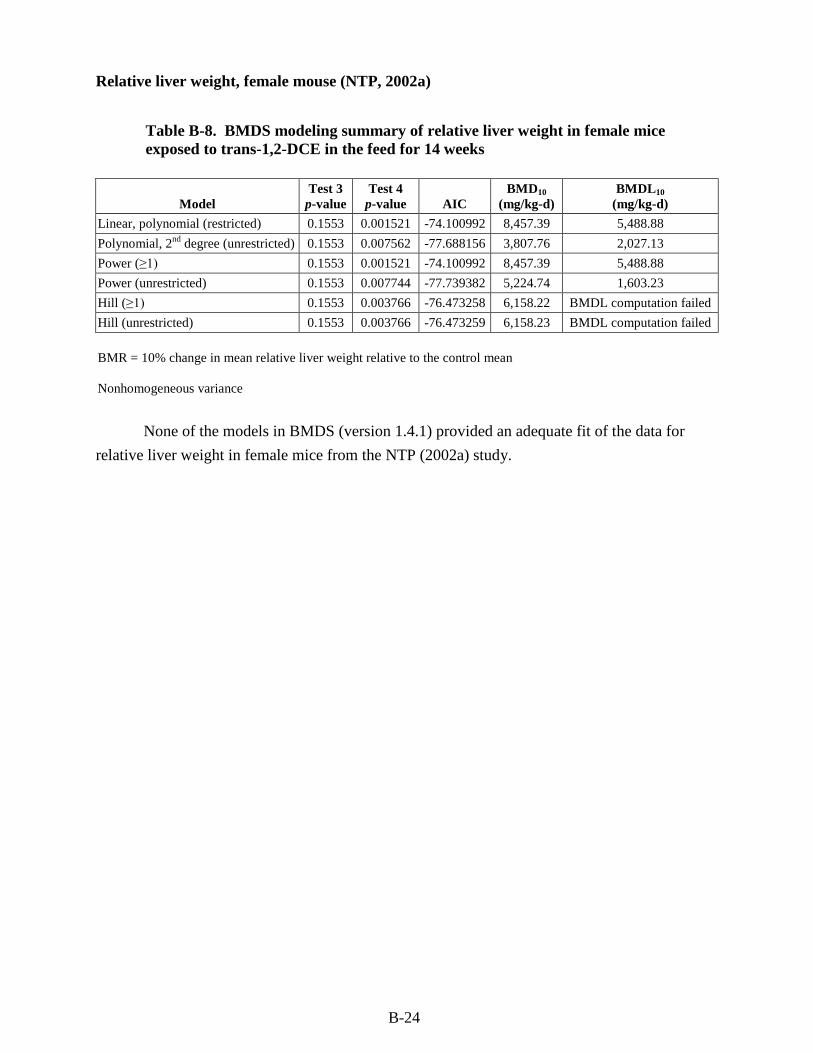
B-24
Relative liver weight, female mouse (NTP, 2002a)
Table B-8. BMDS modeling summary of relative liver weight in female mice exposed to trans-1,2-DCE in the feed for 14 weeks
Model Test 3
p-value Test 4
p-value AIC BMD10
(mg/kg-d) BMDL10
(mg/kg-d) Linear, polynomial (restricted) 0.1553 0.001521 -74.100992 8,457.39 5,488.88 Polynomial, 2nd degree (unrestricted) 0.1553 0.007562 -77.688156 3,807.76 2,027.13 Power (≥1) 0.1553 0.001521 -74.100992 8,457.39 5,488.88 Power (unrestricted) 0.1553 0.007744 -77.739382 5,224.74 1,603.23 Hill (≥1) 0.1553 0.003766 -76.473258 6,158.22 BMDL computation failed Hill (unrestricted) 0.1553 0.003766 -76.473259 6,158.23 BMDL computation failed BMR = 10% change in mean relative liver weight relative to the control mean Nonhomogeneous variance None of the models in BMDS (version 1.4.1) provided an adequate fit of the data for relative liver weight in female mice from the NTP (2002a) study.
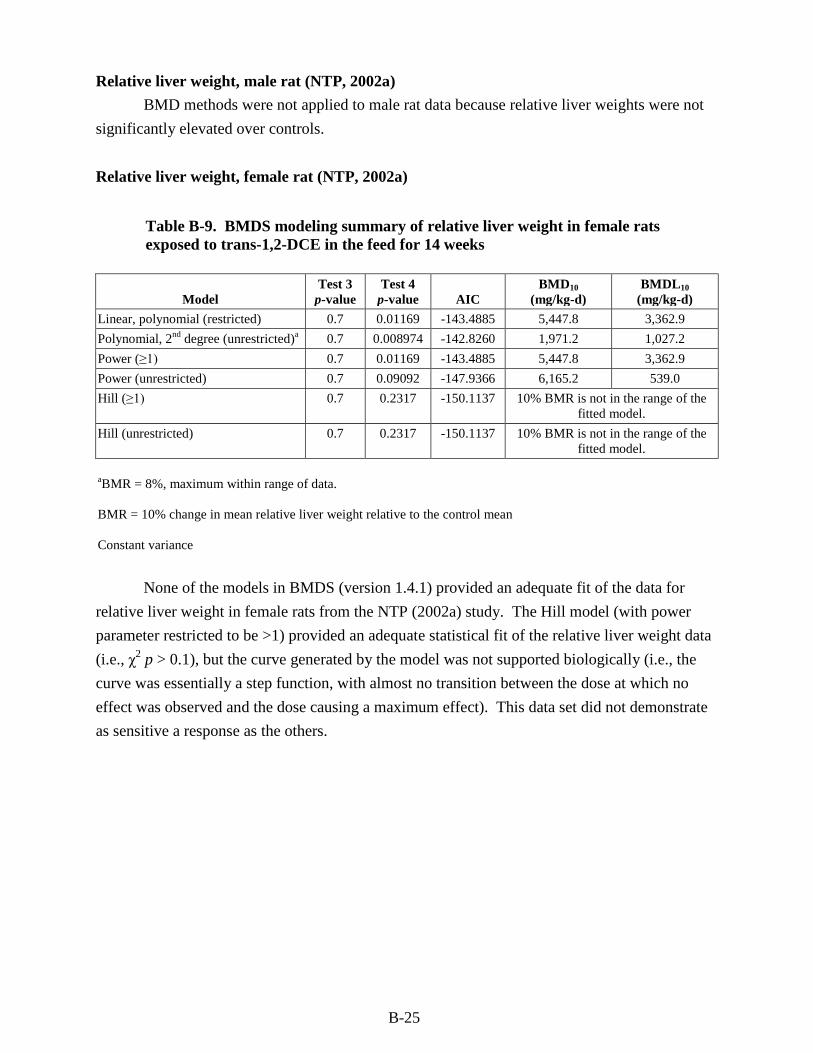
B-25
Relative liver weight, male rat (NTP, 2002a) BMD methods were not applied to male rat data because relative liver weights were not significantly elevated over controls. Relative liver weight, female rat (NTP, 2002a)
Table B-9. BMDS modeling summary of relative liver weight in female rats exposed to trans-1,2-DCE in the feed for 14 weeks
Model Test 3
p-value Test 4
p-value AIC BMD10
(mg/kg-d) BMDL10
(mg/kg-d) Linear, polynomial (restricted) 0.7 0.01169 -143.4885 5,447.8 3,362.9 Polynomial, 2nd degree (unrestricted)a 0.7 0.008974 -142.8260 1,971.2 1,027.2 Power (≥1) 0.7 0.01169 -143.4885 5,447.8 3,362.9 Power (unrestricted) 0.7 0.09092 -147.9366 6,165.2 539.0 Hill (≥1) 0.7 0.2317 -150.1137 10% BMR is not in the range of the
fitted model. Hill (unrestricted) 0.7 0.2317 -150.1137 10% BMR is not in the range of the
fitted model. aBMR = 8%, maximum within range of data. BMR = 10% change in mean relative liver weight relative to the control mean Constant variance None of the models in BMDS (version 1.4.1) provided an adequate fit of the data for relative liver weight in female rats from the NTP (2002a) study. The Hill model (with power parameter restricted to be >1) provided an adequate statistical fit of the relative liver weight data (i.e., χ2 p > 0.1), but the curve generated by the model was not supported biologically (i.e., the curve was essentially a step function, with almost no transition between the dose at which no effect was observed and the dose causing a maximum effect). This data set did not demonstrate as sensitive a response as the others.