Toxic Fume Comparison of a Few Explosives Used in Trench Blasting
18
Toxic Fume Comparison of a Few Explosives Used in Trench Blasting By Marcia L. Harris, Michael J. Sapko, and Richard J. Mainiero National Institute for Occupational Safety and Health Pittsburgh Research Laboratory ABSTRACT Since 1988, there have been 17 documented incidents in the United States and Canada in which carbon monoxide (CO) is suspected to have migrated through ground strata into occupied enclosed spaces as a result of proximate trench blasting or surface mine blasting. These incidents resulted in 39 suspected or medically verified carbon monoxide poisonings and one fatality. To better understand the factors contributing to this hazard, the National Institute for Occupational Safety and Health (NIOSH) carried out studies in a 12-foot diameter sphere to identify key factors that may enhance the levels of CO associated with the detonation of several commercial trenching explosives. The gaseous detonation products from emulsions, a watergel, and ANFO blasting agents as well as gelatin dynamite, TNT, and Pentolite boosters were measured in an argon atmosphere and compared with those for the same explosives detonated in air. Test variables included explosive formulation, wrapper, aluminum addition, oxygen balance, and density. Major contributing factors to CO production, under these laboratory test conditions, are presented. The main finding is the high CO production associated with the lack of afterburning in an oxygen poor atmosphere. Fumes measurements are compared with the manufacturer’s reported IME fume class and with the Federal Relative Toxicity Standard 30 CFR Part 15 in order to gain an understanding of the relative toxicity of some explosives used in trench blasting.
Transcript of Toxic Fume Comparison of a Few Explosives Used in Trench Blasting

Toxic Fume Comparison of a Few Explosives Used in Trench Blasting
By Marcia L. Harris, Michael J. Sapko, and Richard J. Mainiero
National Institute for Occupational Safety and Health Pittsburgh Research Laboratory
ABSTRACT
Since 1988, there have been 17 documented incidents in the United States and Canada in which carbon monoxide (CO) is suspected to have migrated through ground strata into occupied enclosed spaces as a result of proximate trench blasting or surface mine blasting. These incidents resulted in 39 suspected or medically verified carbon monoxide poisonings and one fatality. To better understand the factors contributing to this hazard, the National Institute for Occupational Safety and Health (NIOSH) carried out studies in a 12-foot diameter sphere to identify key factors that may enhance the levels of CO associated with the detonation of several commercial trenching explosives. The gaseous detonation products from emulsions, a watergel, and ANFO blasting agents as well as gelatin dynamite, TNT, and Pentolite boosters were measured in an argon atmosphere and compared with those for the same explosives detonated in air. Test variables included explosive formulation, wrapper, aluminum addition, oxygen balance, and density. Major contributing factors to CO production, under these laboratory test conditions, are presented. The main finding is the high CO production associated with the lack of afterburning in an oxygen poor atmosphere. Fumes measurements are compared with the manufacturer’s reported IME fume class and with the Federal Relative Toxicity Standard 30 CFR Part 15 in order to gain an understanding of the relative toxicity of some explosives used in trench blasting.

Copyright © 2003 International Society of Explosives Engineers2003G Volume 2 - Toxic Fume Comparison of a Few Explosives Used in Trench Blasting 2 of 18
INTRODUCTION
Toxic gases such as CO and NO are produced by the detonation of explosives. The implications and minimization of such products have been studied for decades. Early research addressed toxicity issues associated with blasting in confined spaces such as underground coal mines. Over the past decade there has been an increased interest in the toxic gases that are released during some large surface mine blasts. More recently, the mining and construction industry has been concerned with toxic detonation products that may travel laterally through the earth rather than be vented to the atmosphere. Since 1988, there have been 17 reported incidents where explosive-generated CO moved through the earth and accumulated in nearby underground enclosed spaces.1, 2 Investigators could usually identify a probable pathway from the blast to the problem structure. Likely pathways included old trenches filled with porous material intersecting the blast site, horizontal sedimentary bedding, unconsolidated material in a horizontal plane, and hillseams together with sumps, drains, the gap between a basement floor and wall, and direct openings in structure walls. These reported incidents involved about 39 suspected or medically verified CO poisonings and one fatality. Santis1 summarizes ten of the incidents that occurred in private residences and one that occurred in a manhole. In each case, overburden heavily confined the explosive in the blasts, restricting the venting of explosive gases to the atmosphere. All the blasts were in or near residential areas and none of the areas were excavated immediately. Five of the blasts were within 6 to 15 meters (m) (20 to 50 feet [ft]) of the enclosed underground spaces, three were 30 to 46 m (100 to 150 ft) away, and one was 120 to 150 m (400 to 500 ft) away. In open-pit blasting operations, wind rapidly dilutes the vented gases during the fragmentation process and continues to dilute the gases slowly emanating from the muck pile. Generally, trench blasting near occupied dwellings is done with heavy explosive confinement with a focus on preventing fly rock and minimizing air blast damage. Consequently, there is little to no surface heave or venting for most of the shots. Most investigations of these incidents identified CO from outdoor blasting operations which migrated through the earth into underground basements and enclosed manholes. Emergency responders reportedly detected CO at dangerous concentrations that were often initially attributed to malfunctioning furnaces or hot water tanks.
The NIOSH Pittsburgh Research Laboratory (PRL) has initiated a study designed to compare the relative toxic fumes produced from the unconfined detonation of a few explosive types that have been used in some trenching operations. It is impossible to “simulate” all aspects of trench blasting or any type of blasting under laboratory conditions, including explosive confinement that might be expected in the field. Confinement can differ significantly in blasting operations as a result of variations in the strength of material blasted to variations in explosive loading density and borehole coupling. The degree of confinement can differ from shot to shot and with location, all of which have the potential to influence the resulting fume spectrum. The degree of explosive confinement can significantly influence fumes production with blasting agents since most blasting agents, by their very nature, require heavy confinement or very large diameter blast holes to reach the designed or maximum VOD. On the other hand, cap sensitive or molecular explosives used in this study, have a small critical diameter, detonate at about the same velocity either unconfined or confined in schedule

Copyright © 2003 International Society of Explosives Engineers2003G Volume 2 - Toxic Fume Comparison of a Few Explosives Used in Trench Blasting 3 of 18
80 pipe. Therefore, the toxic fumes production should be less influenced by degree of confinement since the VOD is a good indication of reaction efficiency. The primary focus of this initial study is to compare the “relative level” of toxic fumes production of various explosives and initiators when detonated un-confined in an oxygen deficient atmosphere. Cap sensitive commercial explosives were compared on the same basis and these results may be considered as the “worst case” since any confinement should increase borehole pressure, temperature, and inter-molecular contact time leading to a conceptual reduction in toxic fumes. Also, depending on the explosive loading density, there may be some residual air in the borehole that may contribute to some limited secondary oxidation reactions of CO to CO2 and NO to NO2. In the reported incidents that occurred in the U.S., the types of explosives involved were TNT, ANFO, watergels, dynamites, emulsions, and some combinations of the same. Detonation studies were conducted in air and in argon (low oxygen) atmospheres to examine the relative differences in fumes production with and without the occurrence of post detonation oxidation reactions. The post detonation fumes measured in an argon atmosphere are assumed to more closely represent fumes produced from the detonation, while the resulting fumes from detonations in air include secondary oxidation reactions. This report presents the preliminary results of studies in NIOSH’s 12-foot diameter sphere to compare the toxic fumes production from the unconfined detonation of a few select trenching explosives and boosters in an oxygen deficient atmosphere.
EXPERIMENTAL APPROACH
Studies were conducted in NIOSH/PRL’s 3.7-m (12-ft) diameter 25.6-m3 (905-ft3) sphere shown in Figure 1. The sphere is made of 1.7 cm (0.68 in.) thick steel walls with a pressure rating of 21 bar (300 psig). For ANFO tests, the pulverized (-60 mesh, < 250 microns) ANFO mixture was placed in a glass tube with a 4.45-cm (1.75-in) inner diameter, 0.15-cm (0.06-in) wall thickness, and 61-cm (24-in) length. Glass was chosen because it is inert and would not contribute to the fumes production. A cast Pentolite (PETN/TNT) (50/50) booster 2.5 cm (1 in.) thick and 5.0 cm (2 in.) in diameter (about 70 grams) was taped with minimal masking tape to one end of the tube. Prior to loading the glass tube with explosive, a continuous velocity probe of the type described by Lon Santis3 was taped to the inner surface of the glass tube along its length. The glass tube filled with ANFO was suspended vertically in the geometric center of the sphere and initiated with a No. 8 copper blasting cap placed in the well of the booster. Cap-sensitive trenching explosive cartridges were evaluated as received from the manufacturer and were also initiated with a No. 8 blasting cap. To create an oxygen-poor atmosphere, argon was slowly introduced into the bottom of the sphere from a 230 L (8.12 cu. ft) dewar of cryogenic argon through a 0.95 cm (3/8-in.) copper tube. The air was slowly displaced through a 1.27 cm (½-in.) copper vent tube from the top of the sphere. Most tests were conducted when the average oxygen concentration was less than 1%.
* Reference to specific products is for informational purposes and does not imply endorsement byNIOSH.

Copyright © 2003 International Society of Explosives Engineers2003G Volume 2 - Toxic Fume Comparison of a Few Explosives Used in Trench Blasting 4 of 18
Following the detonation of explosives in the sphere chamber, one minute passed before the sample lines were opened. The fume samples were taken out of the chamber through 0.64 cm (1/4-in.) Teflon tubes for analysis. Teflon sample lines were used to minimize loss of nitrogen oxide constituents due to absorption on surfaces. Vacutainer* samples were taken at 10 minute intervals for 60 minutes following detonation. Samples were sent to the analytical laboratory for gas chromatographic (GC) analysis. This technique was appropriate for components that remained stable in the Vacutainer, namely hydrogen, carbon monoxide, and carbon dioxide. Nitrogen oxides are not amenable to analysis by the Vacutainer technique and were instead analyzed on-line by gas analyzer instrumentation. Two electrochemical cell based gas analyzers, an Enerac 3000E* and a Testo 350*,
* Reference to specific products is for informational purposes and does not imply endorsement byNIOSH.
were used to monitor the carbon monoxide (CO), nitric oxide (NO), nitrogen dioxide (NO2), and oxygen. All data comparison is at 10 minutes after detonation.

Copyright © 2003 International Society of Explosives Engineers2003G Volume 2 - Toxic Fume Comparison of a Few Explosives Used in Trench Blasting 5 of 18
Several different types of explosive formulations were evaluated in air and argon atmospheres: ANFO (94/6), ANFO (92/8) , ANFO (94/6) with 5% added aluminum powder, an emulsion, an emulsion with 5 and 10% aluminum, a water gel, a gelatin dynamite, a semi-gelatin dynamite, and an ammonia gelatin dynamite. Some of these explosives were used to determine the overall fumes contribution associated with various types of commercial packaging. Packaging included Valeron* (high density polyethylene film), rigid paper tubes, waxed paper, and glass for some ANFO and emulsion blasting agents.
RESULTS
The gaseous products of explosive detonation depend upon the formulation and the conditions surrounding their use, but carbon dioxide, water vapor, and nitrogen are always produced. In addition, CO, NO, NO2, methane (CH4), and hydrogen (H2) may form in large or small quantities. All explosives generate CO and NO, with the CO production in some cases in amounts larger than that of NO4,5. Formulated commercial explosives usually generate between 6 to 31 liters of CO per kilogram (l/kg) of explosive (0.1 to 0.5 ft3 per pound [lb]) in air.4,5 The oxygen balance of the explosive formulation (including the wrapper), generally controls CO and NO production. Excess fuel or negative oxygen balance generally results in increased CO production and decreased NO. On the other hand, less fuel or positive oxygen balance generally results in a decrease in CO and a significant increase in NO. When the NO contacts air, it oxidizes to NO2. NO2 is approximately 10 times more toxic than NO and about 17 times more toxic than CO (30 CFR Part 15).6 Also, NO, along with CO, can remain in the expanded rock for a long time and NO only gradually changes to NO2 with exposure to oxygen.7 NO2 will rapidly dissolve in water and adsorb strongly on most surfaces. Explosive formulations were detonated both in air and in argon, and the CO, NO, and NO2 were measured. Upon detonation, the generated turbulence rapidly mixes the combustion products within the sphere. This report only contains CO, NO, and NO2 data from the on-line instrumentation. At the time of writing, the GC results for H2, carbon dioxide (CO2), nitrous oxide (N2O), and hydrocarbons were not available, but will be reported later. Shown in Figure 2 is a typical concentration history of CO, NO, and NO2 products from the detonation of a 453.7-g (1-lb) charge of TNT flakes with a 74.0-g (0.163-lb) 50/50 PETN/TNT booster in air. About 10 minutes after the detonation, the CO concentration reaches a maximum and stays relatively constant over the subsequent 50-minute recording period. On the other hand, the NO2 concentration increases as the NO oxidizes to NO2. During this sampling period, the oxygen concentration remains relatively constant at 18.1%. Illustrated in Figure 3 is a typical concentration history of CO, NO, and NO2 products from a 457.7-g (1-lb) charge of TNT flakes with a 73.8-g (0.163-lb) 50/50 PETN/TNT booster in argon (< 0.35 % O2). During the first 10 minutes after detonation, the CO concentration slowly rises from an initial concentration of about 7000 ppm to 7800 ppm,

Copyright © 2003 International Society of Explosives Engineers2003G Volume 2 - Toxic Fume Comparison of a Few Explosives Used in Trench Blasting 6 of 18
where it remains nearly constant over the remaining 50-minute sampling period. Since there is little oxygen available to oxidize the NO to NO2, the NO concentration remains nearly constant over the sampling period. For this test in an argon-rich atmosphere, the NO2 concentration was negligible. This indicates that little NO2 was being produced in the detonation, but rather was produced during the post-detonation reaction in which NO was oxidized to NO2. Furthermore, the nearly 20-fold increase in CO concentrations in argon indicates that afterburning can play a large role in determining CO concentrations. Underground confinement will tend to minimize such afterburning and can lead to high CO concentrations (analogous to the argon results). A minimum of three trials was performed on each explosive formulation in each atmosphere with the average calculated on the samples taken 10 minutes after the detonation. The average and the +/- one standard deviation is shown as Y error bar on the graphs and tables. All comparisons were based on statistical analysis using a two way ANOVA with Bonferroni Multiple Comparison Test.
NO-NO 2 Oxidation
Elshout8 states that there are 3 reactions that result in the oxidation of NO to NO2. 2NO + O2 · 2 NO2 (1) NO + O3 · NO2 + O2 (2) NO + RO2 · NO2 + RO (3) Elshout goes on to suggest that reaction (3) is only of importance in atmosphere containing high concentrations of reactive hydrocarbons in the presence of high UV radiation and reaction (2) will be important at lower NO concentrations in the presence of ozone. Based on Elshout’s analysis, reaction (1) will predominate under the conditions of this study,. The oxidation rate of NO to NO2 for the tests in air is consistent with those referenced and published by Baulch.9 For reaction (1), the rate conversion of NO to NO2 is second order with respect to the NO concentration and first order with respect to the O2 concentration, [(½d (NO)/dt = K * (NO)2 * (O2)]. For NO concentrations less than 100 ppm, the data reported here is consistent with reaction (1), yielding a rate constant of 1.6E-38 cc/molecule-sec, in reasonable agreement with Baulch’s reported reaction rate constant of 2.01E-38 cc/molecule-sec. This analysis and agreement with Baulch’s work is based on the assumption that all NO converts to NO2 according to the above reaction, and little NO is lost to the wall of the sphere. The linear dependence of NO conversion with O2 explains why NO conversion is slow in an argon-rich atmosphere. Evaluation of explosive fumes production in an argon atmosphere may better represent the formation of fumes from explosive detonation in a low oxygen environment. Previous larger scale tests of fumes production involved detonation of explosives in air. Measuring fumes production in air, however, may not reliably characterize the actual toxic fumes production in field use, since it permits after-burning and oxidation of explosive products, which will not occur in a oxygen limited environment.
Boosters

Copyright © 2003 International Society of Explosives Engineers2003G Volume 2 - Toxic Fume Comparison of a Few Explosives Used in Trench Blasting 7 of 18
When using a blasting agent in trench blasting operations, a booster must be used for initiation. Even though the mass of booster may be a relatively small fraction of the mass of explosive, the contribution of the booster to the overall CO and NO toxic fume production may be significant and should be considered in blast design. Tests were conducted to measure the fumes production from commercial cast boosters (400-g, 0.9lb.). The commercial boosters were an average of 46% PETN and 42% TNT, with 12% aluminum, as identified by the manufacturer. The manufacturer lists a density range from 1.60 to 1.66 g/cc. Several commercial boosters were detonated in air and in argon, with and without wrapper, to quantify the production of CO and NO. Shown in Figure 4 is the comparison of CO and NO production from the detonation of the commercial boosters (with wrapper) in air and in argon. As shown, there is more than a 34.5 fold increase in CO production when detonated in argon. The average CO production was 8.6 (± 2.5) l/kg [0.14 (± 0.04) ft3/lb)] in air compared to 298 (± 30) l/kg [4.76 (± 0.47) ft3/lb)] when detonated in argon without the secondary oxidation of CO to CO2. Also shown is the average fumes production from a NIOSH/PRL cast 50/50 booster in air and in argon without a paper wrapper. When detonated in air the CO averaged 10.48 (± 0.92) L/kg [0.17 (± 0.01) ft3/lb)] and in argon about a factor of 23 higher at 241 (± 14) L/kg [3.85 (± 0.23) ft3/lb)]. TNT Pelletized TNT is one of the explosives associated with two CO poisoning incidents. To quantify the CO and NO produced from the detonation of TNT charges, both cast and flaked TNT charges were studied. A cast 5-cm (2-in.) diameter by 12.7 cm (5-in.) long charge, and flaked TNT loaded into a 5 cm (2-in) diameter by 70-cm (24-in) long glass tube, were both initiated with a 50/50 Pentolite cast booster. Figure 4 compares the CO and NO produced from the detonation of flaked TNT in air and in argon. In argon, an average of 393.2 (± 6.4) L/kg [6.29 (± 1.10) ft3/lb)] of CO and 5.57 (± 0.10) L/kg [0.09 (± 0.002) ft3/lb)] of NO were produced. When detonated in air, most of the 393 L/kg was oxidized to CO2, while the NO production was about the same in air as in argon. The CO produced from the TNT flake (bulk loading density 0.89 g/cm3) was about 1.79 times higher than that produced from cast TNT (density1.58 g/cm3). This CO production from the detonation of TNT is consistent with results reported by Schmidt10 who describes the decomposition of TNT for the density loadings of 1 and 1.59 g/cm3. Schmidt predicts that about 1.8 times more CO is produced at 1 g/cm3 than at 1.59 g/cm3 due to the less ideal detonation properties of the lower density material. ANFO Common ANFO blends were included in this study since they have been associated with CO migration and poisoning incidents in the past,. The pulverized (< 250 microns) ammonium nitrate was mixed with #2 diesel fuel oil and the mixture was packed into a 5cm (2-in.) OD glass tube closed at one end with the 70-gram booster. The mixtures used were 94/6 ANFO, 92/8 ANFO, and 94/6 ANFO with 5% added aluminum. The bulk non-tamped loading density of the pulverized ANFO (< 250 microns) averaged 0.82 g/cc. The average velocity of detonation (VOD) was 3,920 (± 670) m/s [12,860 (± 2,180) ft/s)].
Copyright © 2003 International Society of Explosives Engineers2003G Volume 2 - Toxic Fume Comparison of a Few Explosives Used in Trench Blasting 8 of 18
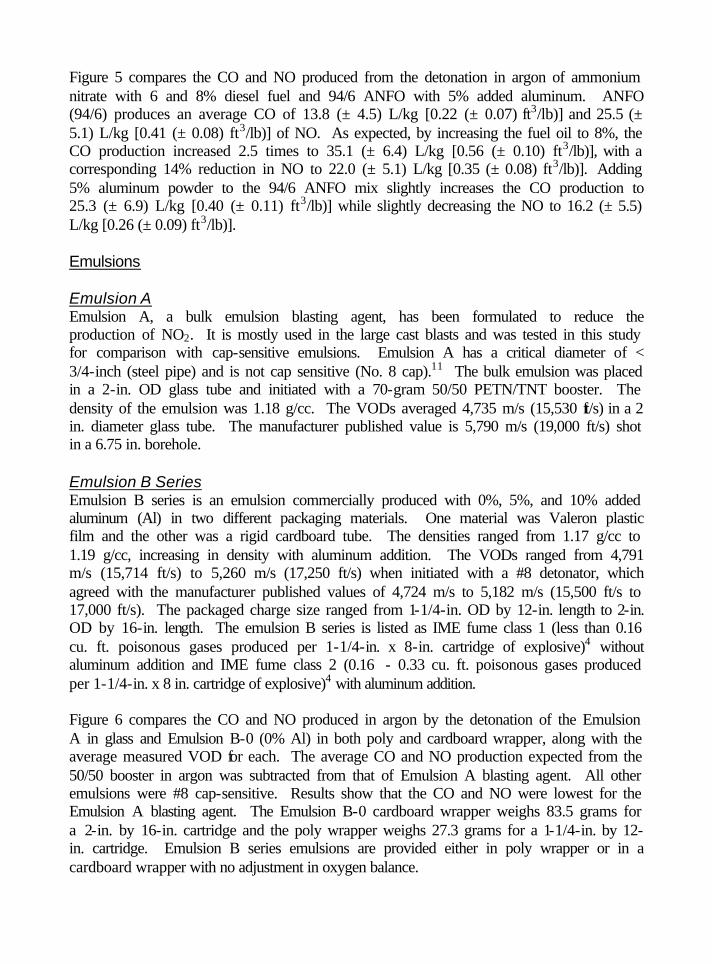
Figure 5 compares the CO and NO produced from the detonation in argon of ammonium nitrate with 6 and 8% diesel fuel and 94/6 ANFO with 5% added aluminum. ANFO (94/6) produces an average CO of 13.8 (± 4.5) L/kg [0.22 (± 0.07) ft3/lb)] and 25.5 (± 5.1) L/kg [0.41 (± 0.08) ft3/lb)] of NO. As expected, by increasing the fuel oil to 8%, the CO production increased 2.5 times to 35.1 (± 6.4) L/kg [0.56 (± 0.10) ft3/lb)], with a corresponding 14% reduction in NO to 22.0 (± 5.1) L/kg [0.35 (± 0.08) ft3/lb)]. Adding 5% aluminum powder to the 94/6 ANFO mix slightly increases the CO production to 25.3 (± 6.9) L/kg [0.40 (± 0.11) ft3/lb)] while slightly decreasing the NO to 16.2 (± 5.5) L/kg [0.26 (± 0.09) ft3/lb)]. Emulsions Emulsion A Emulsion A, a bulk emulsion blasting agent, has been formulated to reduce the production of NO2. It is mostly used in the large cast blasts and was tested in this study for comparison with cap-sensitive emulsions. Emulsion A has a critical diameter of < 3/4-inch (steel pipe) and is not cap sensitive (No. 8 cap).11 The bulk emulsion was placed in a 2-in. OD glass tube and initiated with a 70-gram 50/50 PETN/TNT booster. The density of the emulsion was 1.18 g/cc. The VODs averaged 4,735 m/s (15,530 ft/s) in a 2 in. diameter glass tube. The manufacturer published value is 5,790 m/s (19,000 ft/s) shot in a 6.75 in. borehole. Emulsion B Series Emulsion B series is an emulsion commercially produced with 0%, 5%, and 10% added aluminum (Al) in two different packaging materials. One material was Valeron plastic film and the other was a rigid cardboard tube. The densities ranged from 1.17 g/cc to 1.19 g/cc, increasing in density with aluminum addition. The VODs ranged from 4,791 m/s (15,714 ft/s) to 5,260 m/s (17,250 ft/s) when initiated with a #8 detonator, which agreed with the manufacturer published values of 4,724 m/s to 5,182 m/s (15,500 ft/s to 17,000 ft/s). The packaged charge size ranged from 1-1/4-in. OD by 12-in. length to 2-in. OD by 16-in. length. The emulsion B series is listed as IME fume class 1 (less than 0.16 cu. ft. poisonous gases produced per 1-1/4-in. x 8-in. cartridge of explosive)4 without aluminum addition and IME fume class 2 (0.16 - 0.33 cu. ft. poisonous gases produced per 1-1/4-in. x 8 in. cartridge of explosive)4 with aluminum addition. Figure 6 compares the CO and NO produced in argon by the detonation of the Emulsion A in glass and Emulsion B-0 (0% Al) in both poly and cardboard wrapper, along with the average measured VOD for each. The average CO and NO production expected from the 50/50 booster in argon was subtracted from that of Emulsion A blasting agent. All other emulsions were #8 cap-sensitive. Results show that the CO and NO were lowest for the Emulsion A blasting agent. The Emulsion B-0 cardboard wrapper weighs 83.5 grams for a 2-in. by 16-in. cartridge and the poly wrapper weighs 27.3 grams for a 1-1/4-in. by 12in. cartridge. Emulsion B series emulsions are provided either in poly wrapper or in a cardboard wrapper with no adjustment in oxygen balance.

Copyright © 2003 International Society of Explosives Engineers2003G Volume 2 - Toxic Fume Comparison of a Few Explosives Used in Trench Blasting 9 of 18
In Figure 7, the CO produced by the detonation of Emulsion B-0 and Emulsion B-10 (10% Al) in the cardboard wrapper is over twice that produced when shot in the poly wrapper. The NO shows a 40% reduction from 15.7 (± 0.3) l/kg [0.25 (± 0.004) ft3/lb)] to 9.3 (± 0.3) l/kg [0.15 (± 0.004) ft3/lb)] for Emulsion B-0, whereas Emulsion B-10 dropped 25% from 10.5 (± 0.2) l/kg [0.0.17 (± 0.002) ft3/lb)] to 7.9 (± 0.6) l/kg [0.13 (± 0.009) ft3/lb)]. Figure 7 shows the CO and NO produced from Emulsion B-0, Emulsion B-5 (5% Al), and Emulsion B-10 detonated in argon with their cardboard wrappers. Results do not indicate a significant difference in CO production with the 10% aluminum, but there is a reduction of 15% in NO from 9.29 (± 0.28) l/kg [0.15 (± 0.005) ft3/lb)] to 7.92 (± 0.58) l/kg [0.13 (± 0.009) ft3/lb)]. The CO production is about the same for Emulsion B-0-poly and Emulsion B-10-poly, while there is a corresponding 33% decrease in NO production with 10% added aluminum from 15.7 (± 0.3) l/kg [0.25 (± 0.004) ft3/lb)] to 10.5 (± 0.2) l/kg [0.17 (± 0.003) ft3/lb)]. Generally, with an increase in aluminum in Emulsion B, there is no significant difference in CO production but the NO decreases. The packaging of the explosives can play a key role in the production of CO and NO. The manufacturer should include the contributions of the final packaging to oxygen balance the explosive. Also, the blaster must understand the product is oxygen balanced and must be used only in the way recommended by the manufacturer. Blasters should not use additional borehole liners unless specified by the manufacturer or understand the consequences of doing otherwise. Watergel Watergel A Watergel A is an explosive designed for trenching operations and hole depths of less than 20 ft. Watergel A is packaged in a poly wrapper with a density of 1.18 g/cc. The cartridge dimension tested was 2 inches in diameter by 16 inches long and weighed 13.5 g. The VODs recorded during testing averaged 3,991 (± 221) [13,090 (± 725) ft/s)] unconfined, which is lower than the manufacturer’s reported VOD of 5,091 m/s (16,700 ft/s) confined. The CO and NO detonation products from Watergel A are shown in Figure 6. The average CO produced by Watergel A, 22.9 (± 1.8) l/kg [0.37 (± 0.03) ft3/lb)], is 1.8 times higher than the Emulsion B-0 emulsion in poly. The NO is 24% lower for the Watergel A, 11.9 (± 0.6) l/kg [0.19 (± 0.01) ft3/lb)], than for the Emulsion B-0 in poly. Dynamites A few of the CO poisoning incidents involved the use of dynamites, which were therefore considered as part of this study to quantify the relative production of CO and NO from selected dynamites used for trenching operations. Gelatin dynamite Generally, gelatin dynamites are cap sensitive and nitroglycerine based. Some use nitrocotton rather than absorbent dopes to hold the nitroglycerine and help maintain product consistency for use in water-resistant applications.12 Dynamite A was imported

Copyright © 2003 International Society of Explosives Engineers2003G Volume 2 - Toxic Fume Comparison of a Few Explosives Used in Trench Blasting 10 of 18
from Europe and distributed in North America and donated for this study. The density of Dynamite A was 1.48 g/cc and was received in 2-in. diameter by 16-in. long cartridges. Dynamite A was supplied in a heavy wax paper wrapper with a stiff outer cardboard tube. The manufacturer reports a VOD of 6,400 m/s (20,992 ft/s) unconfined. In NIOSH/PRL testing, the VOD averaged 2,312 (± 239) m/s [7,583 (± 2,378) ft/s)], unconfined. When a 50/50 pentolite booster initiated a charge, the VOD averaged 6,136 m/s (20,126 ft/s). This is expected and agrees with previous publications citing two characteristic VODs for gelatin dynamites.13, 14 Semi-Gelatin dynamite Cap-sensitive semi-gelatin dynamites are ammonia dynamites containing a small portion of nitrocotton as a gelling agent and deriving most of their energy from the reaction of ammonium nitrate and sodium nitrate with fuel.12 Dynamite B has a density of 1.30 g/cc and reported good water resistance. The 1-½ in. OD by 16-in. long charges arrived packaged in wax paper. Dynamite B is characterized by the manufacturer as an IME fume class 1 with a reported VOD of 4,300 m/s (14,104 ft/s). The average measured VOD was 4,253 m/s (13,950 ft/s). Ammonia gelatin dynamite Ammonia gelatin dynamites derive part of their strength from ammonium nitrate12. Dynamite C has a density of 1.43 g/cc and has a reported excellent water resistance. The 1-½-in. OD by 8-in. long cartridges are packaged in 12.6 grams of wax paper. Dynamite C is listed as IME fume class 1 and has a reported unconfined VOD of 6,000 m/s (19,680 ft/s). Experimental VOD averaged 2,644 m/s (± 288 m/s) [8,672 (± 946) ft/s)]. Although not specified by the manufacturer, initiation with a 70 g 50/50 pentolite booster in 2 in. diameter glass more than doubled the VOD with an average of 5530 m/s (18,133 ft/s). Carbon monoxide and nitric oxide production from the three dynamites, as received, are shown in Figure 8. Of the three dynamites evaluated, Dynamite A (without the cardboard tube) produced the largest quantity of CO, {52.1 (± 2.0) l/kg [0.83 (± 0.03) ft3/lb)]}, and NO, {60.7 (± 5.4) l/kg [0.97 (± 0.09) ft3/lb)]}. Dynamite C produced the least CO, {18.0 (± 1.3) l/kg [0.29 (± 0.02) ft3/lb)]}, and the least NO, {31.1 (± 3.2) l/kg [0.50 (± 0.05) ft3/lb)]}. Dynamite B, with the much higher VOD, fell between Dynamite C and Dynamite A with a CO production of 25.3 (± 2.7) l/kg [0.40 (± 0.04) ft3/lb)] L/kg and NO of 34.1 (± 2.5) l/kg [0.54 (± 0.04) ft3/lb)]. One might expect that with higher VODs, higher reaction temperatures, and more efficient combustion, less CO and NO would be formed. However, results show that Dynamite C produces about the same NO and about 29% less CO than Dynamite B. Toxic Fume Comparison IME Institute of Makers of Explosives (IME) Fume classification standard for Class 1, 2, and 3 requires that CO and hydrogen sulfide (H2S), produced by an explosive or blasting agent fall within one of the three ranges. IME Fumes Class 1 requires less than 0.16 ft3

Copyright © 2003 International Society of Explosives Engineers2003G Volume 2 - Toxic Fume Comparison of a Few Explosives Used in Trench Blasting 11 of 18
per 1-1/4-in. diameter by 8-in. cartridge, Fumes class 2 requires 0.16 to 0.33 ft3, and Fumes Class 3 requires 0.33 to 0.67 ft3. As of the writing of this paper, the IME Fume Classification, by definition, is based on tests conducted in the Bichel Gauge12. The IME Fumes Classification and the VODs as reported by the manufacturer are presented in Table 1. For comparison purposes only, the IME Fume Class based only on the measured CO in argon (no H2S) from this study is also presented. Results would indicate Dynamite C, Emulsion B-0 poly, Emulsion B-5 cardboard, and the Emulsion B10 in cardboard agreed in IME fume classification between the manufacturer and those based on current sphere tests. Dynamite B and Emulsion B-0 cardboard under these test conditions produced more CO than expected and thus would be classified as Class 2 instead of the reported Fumes Class 1. Dynamite A, on the other hand, shows the largest difference between the manufacturer’s reported IME class 1 and the current sphere test as a Class 3. Also, the measured VOD (without booster initiation) from Dynamite C and Dynamite A were both significantly lower than the manufacturer’s reported values. However, the fumes production from Dynamite C was much lower than those from Dynamite A and many other explosives. Federal Relative Toxicity Standard (30 CFR part 15) Federal regulatory standard 30 CFR part 156 provides the approval requirement for toxic gas production from permissible explosives for use in underground coal and other gassy mines. The 30 CFR standard requires that the total poisonous gases do not exceed 155 cm3/g ( 2.5 ft3/lb) at standard conditions. The total toxic gas weighting factors are based on TLVs, Threshold Limit Values, published in the 1988-89 ACGIH (American Conference of Governmental Industrial Hygienists) T.L.V.s. Using CO as a reference gas with unit relative toxicity, CO2 is rated as 0.01, NO is 2, NO2 is 17, ammonia (NH3) is 2, H2S is 5, and sulfur dioxide (SO2) is 25. Carbon dioxide is regarded as a toxic gas because it is produced in high concentrations and is more dense than air. It can displace oxygen and cause suffocation, particularly in lower mine areas and poorly ventilated spaces. In this paper, the primary toxic gases considered are CO, NO, and NO2. Once the NO mixes with oxygen, the NO oxidizes to NO2, which is about 8.5 times more toxic. Even though the explosives tested in this study are not permissible explosives for use in underground coal or other gassy mines, the relative toxicity scale defined in 30 CFR Part 15 was used to compare them. Shown in Table 2 is the summary of the average fumes along with the calculated relative toxicity based only on CO, NO, and NO2 production for detonations in argon. Using explosives that produce less toxic gases should help reduce the amount of entrapped toxic gases that can migrate into confined spaces, and less toxic gases that require post-shot mitigation. The use of explosives that produce less CO and NO does not ensure that these gases will not enter nearby dwellings. But by reducing their overall concentration in the stable detonation products, conceptually, the concentration of the gases that might enter a nearby dwelling should be reduced. Of the explosives tested, Emulsion A blasting agent produced the lowest relative toxicity while flaked TNT was the highest. Also noteworthy is the change in distribution of CO to NO with the change in wrapper material. Even though the relative toxicity remains

Copyright © 2003 International Society of Explosives Engineers2003G Volume 2 - Toxic Fume Comparison of a Few Explosives Used in Trench Blasting 12 of 18
about the same for both, the cardboard wrapper produces more CO than NO, while the trend is reversed for the poly wrapper. The ranking shown in Table 2 serves to illustrate that from a fumes standpoint only, some explosives used in trenching operations may be a better choice than others when blasting under heavy containment and close to occupied dwellings. Generally, results of this study show that the CO production from the detonation of explosives depends on the type of wrapper. Poly or Valeron wrappers generally produce less CO and more NO than cardboard since they provide less of a fuel contribution. Adding aluminum to Emulsion B in a poly wrapper or cardboard wrapper did not significantly change the CO production but the NO decreased. TNT stood out as the most significant producer of CO at 393 L/Kg. Explosives and wrappers should be considered as part of the overall blast design especially when blasting near occupied dwellings and where immediate shot mucking is not possible. Also, fuel-rich boosters containing mixtures of PETN/TNT (Pentolite) used for initiating blasting agents may be a significant contributor to the total CO trapped in the expanded ground. Under these test conditions, the results in Table 2 would indicate that detonation products produced from 1 kg of the commercial booster (298 L/kg) with wrapper would produce about the same CO as 32 kg (298 L/9.3 L/kg) of Emulsion A (9.3 L/kg). Some of the fume classifications and VODs reported in this study differed from those reported by the manufacturer. Dynamite A and Dynamite C VODs differed significantly when initiated with a #8 cap and with a 70 g booster. Although the explosive is reported #8 cap sensitive, the VOD greatly differs with the mode of initiation. Under these test conditions, some explosives would be classified differently than they are in the IME classification scheme. Several manufacturers report an IME classification based on a thermodynamic chemical equilibrium calculations rather than on Bichel Gauge test results. Additional studies are underway at PRL to compare Bichel Gauge tests with reported values and those based on this new methodology. SUMMARY Preliminary results indicate that this test method for comparing the relative toxic fumes production from commercial explosives shows promise for providing a performance based methodology that may help in the overall blast design when blasting near occupied dwellings. Blasters’ awareness is important in preventing future CO poisonings. Among the many factors considered for trench blasting near occupied dwellings, toxic fumes production should also be accounted when selecting explosives and primers. Whenever possible, the shot material should be carefully excavated as soon as possible after detonation. Alternately, surface material could be excavated before detonation and blast mats used during blasting where appropriate. Although not readily apparent, blasters should be vigilant about looking for possible pathways from the blast site to

Copyright © 2003 International Society of Explosives Engineers2003G Volume 2 - Toxic Fume Comparison of a Few Explosives Used in Trench Blasting 13 of 18
nearby underground enclosed spaces. Finally, nearby enclosed spaces should be monitored for toxic gases before and after blasting.
ACKNOWLEDGMENTS
The work of Cindy Hollerich and Paul Kolarosky, Physical Science Technicians, who instrumented and conducted the 12-ft (3.7-m) sphere fume studies at NIOSH/PRL, is gratefully acknowledged. Without their help, this lengthy study could not have been completed in a timely manner.

Copyright © 2003 International Society of Explosives Engineers2003G Volume 2 - Toxic Fume Comparison of a Few Explosives Used in Trench Blasting 14 of 18
Table 1 - IME Fume Classification Comparison.
Explosive IME Classa
Reported VODa Densitya IME Classb Measured VODc
Dynamite A 1 6,400 m/s (20,992 ft/s) 1.48 g/cc 3 2,343 m/s (7,685 ft/s) Dynamite C 1 6,000 m/s (19,680 ft/s) 1.43 g/cc 1 2,601 m/s (8,531 ft/s) Dynamite B 1 4,300 m/s (14,104 ft/s) 1.30 g/cc 2 4,253 m/s (13,950 ft/s)
Emulsion B-0 poly 1 5,183 m/s (17,000 ft/s) 1.17 g/cc 1 5,152 m/s (16,899 ft/s) Emulsion B-0 cdbd 1 5,183 m/s (17,000 ft/s) 1.17 g/cc 2 5,111 m/s (16,764 ft/s) Emulsion B-5 cdbd 2 5,030 m/s (16,500 ft/s) 1.17 g/cc 2 4,766 m/s (15,632 ft/s)
Emulsion B-10 poly 2 4,726 m/s (15,500 ft/s) 1.19 g/cc 1 4,773 m/s (15,655 ft/s) Emulsion B-10 cdbd 2 4,726 m/s (15,500 ft/s) 1.19 g/cc 2 4,937 m/s (16,193 ft/s)
a Data reported by manufacturer. b IMEClassificationbased on this study using CO only.
c VOD measured in this study.
Table 2 - Toxic Fumes Production and Relative Toxicity per 30 CFR part 15. Explosive COa, e, f NOb, e, f c, e, f NO2 Toxic Fumesd, e
Emulsion A 9.3 (3.5) 7.4 (0.9) 0 (0) 24.0
Emulsion B-10 poly 13.6 (0.5) 10.5 (0.2) 0 (0) 35.0
Emulsion B-0 poly 12.9 (1.3) 15.7 (0.3) 0.1 (0.1) 45.9
Emulsion B-5 cdbd 27.6 (1.8) 9.4 (0.3) 0 (0) 46.4 Emulsion B-10 cdbd 31.9 (1.3) 7.9 (0.6) 0 (0) 47.9 Emulsion B-0 cdbd 29.4 (3.8) 9.3 (0.3) 0 (0) 48.0
Watergel A 22.9 (1.8) 11.9 (0.6) 0.1 (0.1) 48.9
94/6 ANFO 5% Al 25.3 (6.9) 16.2 (5.5) 0.6 (0.8) 68.0
94/6 ANFO 13.8 (4.5) 25.5 (5.1) 0.4 (0.5) 72.3
92/8 ANFO 35.1 (6.4) 22.0 (5.1) 0.1 (0.1) 80.5 Dynamite C 18.0 (1.3) 31.1 (3.2) 2.0 (0.4) 114.0 Dynamite B 25.3 (2.7) 34.1 (2.5) 3.9 (0.8) 159.9
Dynamite A w/ tube 51.8 (2.9) 50.6 (1.9) 3.3 (0.9) 208.5
TNT cast 219.2 (11.5) 2.4 (0.9) 0 (0) 224.0
Dynamite A w/o tube 52.1 (2.0) 60.7 (5.4) 3.3 (1.7) 230.2
50/50 PETN/TNT 240.6 (14.2) 2.2 (0.4) 0 (0) 245.0 Commercial booster w/o wrapper 250.8 (22.4) 1.3 (1.3) 0 (0) 253.3 Commercial booster w/ wrapper 297.8 (29.6) 0.8 (0.1) 0 (0) 299.3
TNT flakes 393.2 (6.4) 5.6 (0.1) 0 (0) 404.3 a, b, c CO, NO, and NO2 measured in an argon atmosphere, l/kg (ft3/lb).

Copyright © 2003 International Society of Explosives Engineers2003G Volume 2 - Toxic Fume Comparison of a Few Explosives Used in Trench Blasting 15 of 18
d Toxic fumes, l/kg (ft3/lb), calculated per 30 CFR Part 15.20 (g)(1) and (2). Only includes the CO, NO, and NO2 that were measured. All other gases are excluded. e ft3/lb = (0.016) x l/kg f One standard deviation.

Figure 1 - NIOSH/PRL 12-ft. diameter sphere.
Figure 2 - On-line results of flake TNT (453.7 g)with 50/50 PETN/TNT booster (74.0 g) shot in an air atmosphere.
Figure 3 - On-line results of flake TNT (457.7 g) with 50/50 PETN/TNT booster (73.8 g) shot in an argon-rich, oxygen-deficient atmosphere.
Figure 4 - Fumes results for commercial booster (with and without paper wrappers), flake TNT, and cast TNT shot in an argon-rich, oxygen-deficient atmosphere.
Figure 5 - Fumes results for 94/6 ANFO, 92/8 ANFO, and 94/6 ANFO with 5% aluminum addition shot in an argon-rich, oxygen deficient atmosphere.
Figure 6 - Fumes results for Emulsion B-0 (with poly and cardboard wrappers), Watergel A, and Emulsion A shot in an argon-rich, oxygen-deficient atmosphere.

Copyright © 2003 International Society of Explosives Engineers2003G Volume 2 - Toxic Fume Comparison of a Few Explosives Used in Trench Blasting 17 of 18
Figure 7 - Fumes results for Emulsion B-0 (in poly and cardboard wrappers), Emulsion B-5 (in cardboard wrappers), and Emulsion B-10 (in poly and cardboard wrappers) shot in an argon-rich, oxygen-deficient atmosphere.
Figure 8 - Fumes results for Dynamite C (ammonia gelatin dynamite), Dynamite B (semigelatin dynamite), and Dynamite A (gelatin dynamite, with and without cardboard tubes) shot in an argon-rich, oxygen-deficient atmosphere.
REFERENCES
(1) Santis, Lon D., A Summary of Subsurface Carbon Monoxide Migration Incidents. Proceedings of the Twenty-Seventh Annual Conference on Explosives and Blasting Technique. International Society of Explosives Engineers, 2001 volume 2-AS, pp. 143-154, 2001.
(2) Mantel, R., L. Trépanier, L. Boutin, M. Lavigne, B. Lévesque, G. Sanfaçon, P. Auger, L. Galarneau, and P. Brousseau. Carbon Monoxide Poisoning From Blasting Operations in Construction Works, An Earth Odyssey, 2001.
(3) Santis, L. C. and R. A. Cortese, A Method of Measuring Continuous Detonation Rates Using Off-the-Shelf Items. Proceedings of the Twenty-Second Annual Conference on Explosives and Blasting Technique. Orlando, FL, February 4-8, 1996.
(4) Santis, L., J. Rowland, D. Viscusi, and M. Weslowski, “The Large Chamber Test for Toxic Fumes Analysis of Permissible Explosives.” Paper in the Proc. of the 21st Annual Conf. on Explosives and Blasting Technique, Vol. I, Feb. 5-9, 1995, Nashville, TN, pp 341-355.
(5) Persson, P., R. Holmberg, and J. Lee. Rock Blasting and Explosives Engineering, CRC Press, New York, NY, 1994.
(6) Federal Regulatory Standard, 30 CFR Part 15–Requirements for Approval of Explosives and Sheathed Explosive Units, July 1, 2002.
(7) Krivtsov, N. V., and N. S. Miroshnichenko. “Assessment and Expedient Monitoring of Nitrogen Dioxide Emissions During Industrial Blasting Operations.” Metall. Gornorudn. Prom-st, pp. 67 - 69, 1999.
(8) Elshout, A.J., and S. Beilke. “Oxidation of Nitric Oxide to Nitrogen Dioxide in Flue Gas Plumes of Power Stations.” Comm. Eur. Communities, (Rep.) Eur, Issue Eur. 9436, Phys. -Chem. Behav. Atmos. Pollut., pp. 535-43, 1984.

Copyright © 2003 International Society of Explosives Engineers2003G Volume 2 - Toxic Fume Comparison of a Few Explosives Used in Trench Blasting 18 of 18
(9) Baulch, D.L.; D.D. Drysdale; and D.G. Horne. Evaluated Kinetic Data for high Temperature reactions Vol. 2 Homogeneous gas phase reactions of the H2-N2system, Butterworth, London (1973).
(10) Urbanski, T. “Chemistry and Technology of Explosives,” Volume 1, pp. 318, 1964. (11) Sapko, M., J. Rowland, R. Mainiero, and I. Zlochower. “Chemical and Physical
Factors That Influence Nox Production During Blasting - Exploratory Study.” Paper in the Proc. of the 28th Annual Conf. on Explosives and Blasting Technique, Las Vegas, NV, February 10-13, 2002.
(12) Blasters’ Handbook, 17th Edition, ed. Robert B. Hopler, International Society of Explosives Engineers, 1998, pp. 65 - 67, 722.
(13) Mason, C. M. and E. G. Aiken. “Methods for Evaluating Explosives and Hazardous Materials.” Bureau of Mines Information Circular IC 8541, pg. 29, 1972.
(14) Dick, R. A., “Factors in Selecting and Applying Commercial Explosives and Blasting Agents.” International Society of Explosives Engineers, IC8405, pp. 14, 2000.