Townsville Residential Energy Demand Program (TRED Program)
80
Townsville Residential Energy Demand Program (TRED Program) Monitoring and Evaluation ‘Cool Roofs’ Community Pilot Program Findings Report Version: Final CitySolar Community Capacity Building Program
Transcript of Townsville Residential Energy Demand Program (TRED Program)

Townsville Residential Energy
Demand Program (TRED Program)
Monitoring and Evaluation ‘Cool Roofs’ Community Pilot Program
Findings Report
Version:
Final
CitySolar Community Capacity Building Program

Townsville CitySolar Community Capacity Building Program
Monitoring and Evaluation of ‘Cool Roofs’ Community Pilot Program
Page 2 of 80
Acknowledgements
This document has been developed through funding from the Australian Government Solar
Cities Program and the Townsville City Council (Townsville Queensland Solar City). The
document has been developed by researchers from The Natural Edge Project (TNEP)
(administatively hosted by Griffith University). TNEP is a non-profit sustainable
development research and education think-tank, co-hosted by Griffith University, QUT,
University of Adelaide, and Curtin University. The TNEP research team included Charlie
Hargroves, Cheryl Desha, Angie Reeve, David Sparks, Fiona McKeague, Kimberley
Wilson, Ocean Wilson, and Tim Davies. Research was carried out under the direction of,
and in collaboration with, Greg Bruce and the team from Townsville City Council Integrated
Sustainability Services, including Mark Robinson and Dylan Furnell, and was advised by
Ian Cruikshank, Manager Solar City, Energy Sustainability and Market Development,
Ergon Energy.
Disclaimer
While reasonable efforts have been made to ensure that the contents of this publication
are factually correct, the parties involved in the development of this document do not
accept responsibility for the accuracy or completeness of the contents. Information,
recommendations and opinions expressed herein are not intended to address the specific
circumstances of any particular individual or entity and should not be relied upon for
personal, legal, financial or other decisions. The user must make its own assessment of
the suitability of the information or material contained herein for its use. To the extent
permitted by law, the parties involved in the development of this document exclude all
liability to any other party for expenses, losses, damages and costs (whether losses were
foreseen, foreseeable, known or otherwise) arising directly or indirectly from using this
document. This document is produced for general information only and does not represent
a statement of the policy of the Commonwealth of Australia, Ergon Energy, or the
Townsville City Council. The Commonwealth of Australia, Townsville City Council, Ergon
Energy and all persons acting to prepare this report accept no liability for the accuracy of
or inferences from the material contained in this publication, or for any action as a result of
any person’s or group’s interpretations, deductions, conclusions or actions in relying on
this material.
Citation
Townsville City Council (2013) ‘Monitoring and Evaluation of ‘Cool Roofs’ Community Pilot
Program: Findings Report’, Townsville City Council and The Natural Edge Project, as part
of the Australian Government Solar Cities Program.
Any enquiries about this document should be directed to:
Mr Mark Robinson Carbon Cycle Team Leader Integrated Sustainability Services Townsville City Council [email protected] www.townsville.qld.gov.au

Townsville CitySolar Community Capacity Building Program
Monitoring and Evaluation of ‘Cool Roofs’ Community Pilot Program
Page 3 of 80
Table of Contents
1. Introduction ........................................................................................................................ 6
Townsville Solar City ............................................................................................................ 7
2. The Cool Roof Pilot Program ............................................................................................ 8
Aims of the Cool Roof Pilot Program .................................................................................... 8
3. Monitoring and Evaluation Methods ................................................................................. 9
Monitoring temperature reductions from a ‘Cool Roof’ .......................................................... 9 Overview ........................................................................................................................................................... 9 Benefits of Cool Roofs .................................................................................................................................... 10 Capturing house and roof characteristics ....................................................................................................... 10 Household Temperature Readings ................................................................................................................. 11 Climatic and Weather Conditions ................................................................................................................... 11
Considering household electricity consumption reductions from ‘Cool Roof’ ...................... 11
Community perceptions of cool roof performance (participant survey) ............................... 12 Assumptions in evaluating temperature reductions ........................................................................................ 13 General Assumptions and Considerations of Pilot Program ........................................................................... 13
4. Findings of Cool Roof Pilot Program in Townsville ...................................................... 15
Dwelling A (a single story brick house in Mundingburra) .................................................... 15 Background Information .................................................................................................................................. 15 Temperature Performance Outcome .............................................................................................................. 15 Electricity Consumption .................................................................................................................................. 17 Occupant Experience of the Cool Roof........................................................................................................... 18 Participant Testimonial ................................................................................................................................... 19
Dwelling B (two level 1950s Queenslander in North Ward) ................................................ 20 Background Information .................................................................................................................................. 20 Temperature Performance Outcome .............................................................................................................. 20 Electricity Consumption .................................................................................................................................. 22 Occupant Experience of the Cool Roof........................................................................................................... 23 Participant Testimonial ................................................................................................................................... 24
Dwelling C (a single story masonry block house in Annandale) .......................................... 25 Background Information .................................................................................................................................. 25 Temperature Performance Outcome .............................................................................................................. 25 Electricity Consumption .................................................................................................................................. 27 Occupant Experience of the Cool Roof........................................................................................................... 27 Testimonial ..................................................................................................................................................... 28
Dwelling D (a single story 1980s era low-set bessa-block house in Condon) ..................... 29 Background Information .................................................................................................................................. 29 Temperature Performance Outcome .............................................................................................................. 29 Energy Consumption ...................................................................................................................................... 31 Occupant Experience of the Cool Roof........................................................................................................... 31 Participant Testimonial ................................................................................................................................... 32
Dwelling E (a 1950s era raised timber house in West End) ................................................ 33 Background Information .................................................................................................................................. 33 Temperature Performance Outcome .............................................................................................................. 33 Energy Consumption ...................................................................................................................................... 35

Townsville CitySolar Community Capacity Building Program
Monitoring and Evaluation of ‘Cool Roofs’ Community Pilot Program
Page 4 of 80
Occupant Experience of the Cool Roof........................................................................................................... 36 Participant Testimonial ................................................................................................................................... 37
Dwelling F (a single storey concrete block house in Alice River) ........................................ 38 Background Information .................................................................................................................................. 38 Temperature Performance Outcome .............................................................................................................. 38 Energy Consumption ...................................................................................................................................... 40 Occupant Experience of the Cool Roof........................................................................................................... 41 Participant Testimonial ................................................................................................................................... 42
Dwelling G (a raised timber house in Rasmussen) ............................................................. 43 Background Information .................................................................................................................................. 43 Temperature Performance Outcome .............................................................................................................. 43 Energy Consumption ...................................................................................................................................... 45 Occupant Experience of the Cool Roof........................................................................................................... 46 Participant Testimonial ................................................................................................................................... 47
Dwelling H (a low-set brick house in Kelso) ........................................................................ 48 Background Information .................................................................................................................................. 48 Temperature Performance Outcome .............................................................................................................. 48 Energy Consumption ...................................................................................................................................... 48 Occupant Experience of the Cool Roof........................................................................................................... 49 Participant Testimonial ................................................................................................................................... 50
Dwelling I (a concrete block house in Kirwan) .................................................................... 51 Background Information .................................................................................................................................. 51 Temperature Performance Outcome .............................................................................................................. 51 Energy Consumption ...................................................................................................................................... 51 Occupant Experience of the Cool Roof........................................................................................................... 52 Participant Testimonial ................................................................................................................................... 53
Dwelling J (a timber house in North Ward) ......................................................................... 54 Background Information .................................................................................................................................. 54 Temperature Performance Outcome .............................................................................................................. 54 Energy Consumption ...................................................................................................................................... 56 Occupant Experience of the Cool Roof........................................................................................................... 57 Participant Testimonial ................................................................................................................................... 58
Dwelling K (a single storey brick house in Deeragun) ......................................................... 59 Background Information .................................................................................................................................. 59 Temperature Performance Outcome .............................................................................................................. 59 Energy Consumption ...................................................................................................................................... 59 Occupant Experience of the Cool Roof........................................................................................................... 60
Dwelling L (a single storey masonry block house in Kirwan) .............................................. 61 Background Information .................................................................................................................................. 61 Temperature Performance Outcome .............................................................................................................. 61 Electricity Consumption .................................................................................................................................. 63 Occupant Experience of the Cool Roof........................................................................................................... 64 Participant Testimonial – still needs confirmation ........................................................................................... 65
Dwelling M (a high-set timber house in Kelso) .................................................................... 66 Background Information .................................................................................................................................. 66 Temperature Performance Outcome .............................................................................................................. 66 Electricity Consumption .................................................................................................................................. 66 Occupant Experience of the Cool Roof........................................................................................................... 67 Participant Testimonial ................................................................................................................................... 68
Dwelling N (a low-set brick house in Annandale) ................................................................ 69

Townsville CitySolar Community Capacity Building Program
Monitoring and Evaluation of ‘Cool Roofs’ Community Pilot Program
Page 5 of 80
Background Information .................................................................................................................................. 69 Temperature Performance Outcome .............................................................................................................. 69 Electricity Consumption .................................................................................................................................. 69 Occupant Experience of the Cool Roof........................................................................................................... 70 Participant Testimonial ................................................................................................................................... 70
Reductions in Temperature from a ‘Cool Roof’ in Townsville .............................................. 71
Reductions in Electricity Consumption from a ‘Cool Roof’ in Townsville ............................. 72
Collecting roof characteristics and participant demographics ............................................. 75
Understanding participant experience (Post program survey) ............................................ 75
Understanding Painters experience (Post program survey) ................................................ 76
Appendix A: Painters Checklist ............................................................................................. 78
Appendix B: Participant survey ............................................................................................. 79

Townsville CitySolar Community Capacity Building Program
Monitoring and Evaluation of ‘Cool Roofs’ Community Pilot Program
Page 6 of 80
Introduction
This report provides a summary of the findings of the ‘Cool Roof’ community pilot program
undertaken during the period between 2011-2013 in Townsville, Australia. The pilot program
worked with industry and the community to investigate if cool roofs would reduce house
temperatures and the associated electricity demand. The findings of the pilot showed that a ‘cool
roof’ was effective in reducing internal temperatures in all of the participating dwellings, as
shown in Table 1. These results are in line with other national and international studies on cool
roofs.
Table 1: Summary of summer temperature reductions across participating pilot program houses
Comparison of two similar days (average of houses; n=11) Temperature change (oC)
Maximum roof cavity temperature reduction; ˚C -9.5 to -17
Average daytime roof cavity temperature reduction; ˚C (9am-9pm) -6.4 to -15.3
Maximum internal temperature reduction; ˚C -1.2 to -2.5
Average daytime internal temperature reduction; ˚C, (9am-9pm) -0.6 to -1.5
The monitoring and evaluation for the pilot has focused on four sets of results, namely: actual
temperature data before and after the roof painting (via a temperature recorded located in the
home as part of the research, provided by TCC), quarterly electricity consumption data (provided
by Ergon Energy with residents’ written approval), a check list of roofing conditions that may
affect the study (undertaken by the painter), and a post program participant survey undertaken
by the research team through telephone conversations with Pilot participants. As part of the Pilot
residents were offered between a 15 and 25% discount on the cost of the roof painting,
depending on participating painters.
“We had the roof painted in November when the weather was starting to warm up.
We could not believe how much cooler the house was the day after it was
painted. The house is normally all locked up during the day and use to be quite
hot when we got home in the afternoon. After the painting the house was cool to
walk into at the end of the day. Our carport and patio are just the bare metal
colorbond roof. You can put your hand on the underside of the colorbond in the
middle of a hot day and the metal is not hot at all, where before it would have
burnt you. We found that when home we did not put the fans on until later in the
day and there was reduced use of air-conditioning during the day, as it was only
needed on the really hot, humid days. I have certainly passed the word onto
friends and know of a couple that have had their roofs painted.”
Pilot Program Participant with a single story 1980s era low-set bessa-block house in Condon
The analysis and evaluation of the pilot included both quantitative and qualitative aspects. As
such, feedback from surveys and interviews with participants (such as that above) have been
used in conjunction with the measurements of temperature and energy demand in order to
provide an insight into the performance of cool roofs in Townsville.

Townsville CitySolar Community Capacity Building Program
Monitoring and Evaluation of ‘Cool Roofs’ Community Pilot Program
Page 7 of 80
Townsville Solar City
In 2006, Townsville was announced as Queensland's only ‘Solar City’. The Australian
Government’s Solar Cities program is a partnership between all levels of government, industry,
business and local communities to trial sustainable energy solutions. In seven key locations,
Solar Cities partnerships are helping to save energy, increase up-take of Australia’s leading-
edge solar technologies, reward energy efficiency and solar power generation, and showcase
the economic and environmental benefits of wiser energy choices. Solar Cities initiatives are
changing the way we view and use energy. Information collected will show how different
approaches influence energy use and will inform future energy policies. Solar Cities is creating a
new energy future for Australia.
Commencing in mid-2007 Townsville’s Solar City initiative consists of several synergistic
projects including: Magnetic Island (Solar Suburb), two Greenfield sites, and a sustainable CBD
building, in addition to city-wide education and community capacity building. As part of the
‘Townsville Queensland Solar City’ project, the Townsville City Council, working closely with the
solar city consortium partners including Ergon Energy, initiated a program focused on
community capacity building, named the ‘CitySolar Community Capacity Building Program’. This
program includes a project to investigate methods of fostering sustainable behaviour related to
residential energy demand. This project, the ‘Townsville Residential Energy Demand Program’,
seeks to identify and investigate a number of options to encourage residents (specifically home
owners) to reduce household energy demand that are suitable for application in Townsville.
The program is intended to provide valuable information and guidance to the Council regarding
effective methods to encourage and assist residents to reduce energy demand in the home.
Reducing energy demand in the home has two main benefits to the home owner, firstly the
reduction of direct energy costs, and secondly a reduction in the consumption of fossil based
electricity and hence a reduced contribution to the generation of greenhouse gas emissions.
Furthermore, such reductions can also provide a range of in-direct economic benefits such as
reducing costs to energy utilities to provide energy during peak times, reducing costs related to
maintenance of the electricity grid, creating new industries for low energy consuming products,
and reducing future liability against costs related to carbon pollution abatement. Hence with
strong benefits to both residents and businesses in Townsville the reduction of residential
energy demand is an important consideration for the future of Townsville.

Townsville CitySolar Community Capacity Building Program
Monitoring and Evaluation of ‘Cool Roofs’ Community Pilot Program
Page 8 of 80
The Cool Roof Pilot Program
Aims of the Cool Roof Pilot Program
The ‘Cool Roof Pilot Program’ was developed following extensive research conducted as part of
the Solar City program (TRED project), which was based on world leading behaviour change
methodologies, namely Community Based Social Marketing (CBSM), developed by Dr. Doug
McKenzie-Mohr; Thematic Communication, developed by Prof. Sam Ham; and Collective Social
Learning (CSL), developed by Prof. Valerie Brown. It was determined in the early phases of the
project that a hybrid of these models had the potential to foster sustainable behaviour in the
home in Townsville, and that the project could contribute to sustainable behaviour change by
piloting and demonstrating this hybrid. Hence, the processes and outcomes have been well
documented throughout the project to enable others to take advantage of the learning’s
developed.
There were several key aims of the ‘Cool Roof’ Pilot Program:
To develop, trial and evaluate the role of communication material in raising awareness,
educating and encouraging Townsville residents to choose cool roofs;
To initiate communications and collaboration with cool roof related industry stakeholders,
including encouraging cool roof pilot installation projects;
To collect data from several pilot cool roof installations to inform further development of
the program's communication materials; and
To identify effective tools and strategies for encouraging the installation of cool roofs in
Townsville, based on a review of the pilot installations and experiences of those involved.
Expanding some of these items the research team considered:
Evaluation of the effectiveness of cool roofs in reducing internal temperatures in residential
buildings in Townsville (This has been made possible by participating residents agreeing to
allow the painters to install temporary temperature sensors to collect temperature data in
their home before and after the application of the cool roof coating).
Investigating the impact of cool roofs on energy demand in residential buildings in Townsville
(This has been made possible by participants agreeing to allow the research team to
confidentially access energy consumption data from the electricity utility for up to 5 years
prior and 2 years after the roof painting).
Inform thematic communications to be used by the program as part of a community wide
program to provoke Townsville residents to think about cool roofs and re-evaluate beliefs
that were identified as limiting the likelihood of having a cool roof;
Townsville CitySolar Community Capacity Building Program
Monitoring and Evaluation of ‘Cool Roofs’ Community Pilot Program
Page 9 of 80
Monitoring and Evaluation Methods
Monitoring temperature reductions from a ‘Cool Roof’
Overview
The performance of ‘cool roofs’ in reducing heat entering buildings has been demonstrated in
various cases around the world, and locally through a trial on a single household in Townsville
several years ago by JCU. However in order to provide confidence in promoting the benefits of
cool roofs in Townsville a community pilot program was undertaken to monitor the performance
before and after the application of a ‘cool roof’. A secondary aim was to evaluate methods of
data collection to determine whether these would be effective in the community-wide program (if
necessary). This pilot was also called for by community members providing feedback on
thematic communications as part of the 2011 Eco-Fiesta as they wanted to see Townsville
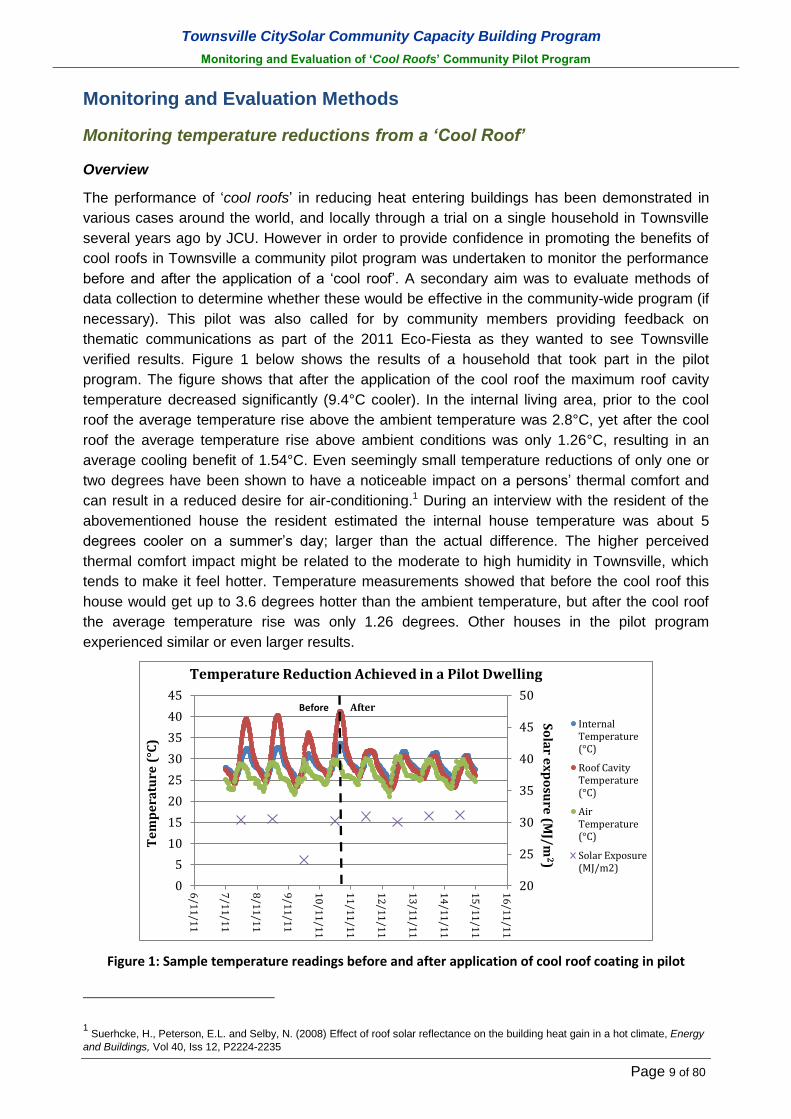
verified results. Figure 1 below shows the results of a household that took part in the pilot
program. The figure shows that after the application of the cool roof the maximum roof cavity
temperature decreased significantly (9.4°C cooler). In the internal living area, prior to the cool
roof the average temperature rise above the ambient temperature was 2.8°C, yet after the cool
roof the average temperature rise above ambient conditions was only 1.26°C, resulting in an
average cooling benefit of 1.54°C. Even seemingly small temperature reductions of only one or
two degrees have been shown to have a noticeable impact on a persons’ thermal comfort and
can result in a reduced desire for air-conditioning.1 During an interview with the resident of the
abovementioned house the resident estimated the internal house temperature was about 5
degrees cooler on a summer’s day; larger than the actual difference. The higher perceived
thermal comfort impact might be related to the moderate to high humidity in Townsville, which
tends to make it feel hotter. Temperature measurements showed that before the cool roof this
house would get up to 3.6 degrees hotter than the ambient temperature, but after the cool roof
the average temperature rise was only 1.26 degrees. Other houses in the pilot program
experienced similar or even larger results.
Figure 1: Sample temperature readings before and after application of cool roof coating in pilot
1 Suerhcke, H., Peterson, E.L. and Selby, N. (2008) Effect of roof solar reflectance on the building heat gain in a hot climate, Energy
and Buildings, Vol 40, Iss 12, P2224-2235
20
25
30
35
40
45
50
0
5
10
15
20
25
30
35
40
45
6/1
1/1
1
7/1
1/1
1
8/1
1/1
1
9/1
1/1
1
10
/11
/11
11
/11
/11
12
/11
/11
13
/11
/11
14
/11
/11
15
/11
/11
16
/11
/11
So
lar e
xp
osu
re (M
J/m
2)
Te
mp
era
ture
(°C
)
Temperature Reduction Achieved in a Pilot Dwelling
InternalTemperature(°C)
Roof CavityTemperature(°C)
AirTemperature(°C)
Solar Exposure(MJ/m2)
After Before
Townsville CitySolar Community Capacity Building Program
Monitoring and Evaluation of ‘Cool Roofs’ Community Pilot Program
Page 10 of 80
Benefits of Cool Roofs
Reducing the temperature of the roof cavity has multiple additional benefits including:
Typically ducted air-conditioning is installed in roof cavities and the ducting has poor thermal
performance meaning that a hotter roof cavity will heat the air-conditioned air in summer
adding load to the air-conditioner.
Reducing the roof cavity temperature will make the roof space a much more comfortable
temperature (typically in the order of 40-45°C during summer) for tradespersons or for
residents wishing to store items in the roof,
Cool roofs are subject to less diurnal thermal expansion and contraction, due to their lower
surface temperatures, and may consequently have a longer service life.2
Reducing the temperature of the roof space will also reduce the drying of timber structural
members in the roof that may result in reduced strength. Reduced strength of timber in the
roof may make the roof more susceptible to cyclone damage.
Typically the roof cavity contains the electrical wiring for the home and a hotter roof cavity
will cause the wiring to be hotter and this will increase the resistance of the metal and
increase the energy demand of the home. For a temperature rise of 1°C the electrical
resistance of copper will increase around 0.4%, meaning that for an increased roof cavity
temperature of 25°C the electrical resistance will increase by as much as 10%.
Photovoltaic panels operate more efficiently at lower temperatures. A dark roof can reach
temperatures approximately 50°C above ambient temperatures. Photovoltaic panels
mounted on a roof will therefore become considerably hotter when mounted on a dark roof –
decreasing their efficiency. A Cool Roof can help reduce roof temperatures and this may
help improve photovoltaic panel efficiencies.
Capturing house and roof characteristics
The impact on heat transfer through the roof by switching to a ‘cool roof’ will differ depending on
the characteristics of the roof and the house. Roof characteristic data was collected by the
painter contracted to apply the cool roof coating to provide context for the analysis of the
performance of the cool roof. Additional data was collected from the householder during the
follow-up interview. To collect the data, painters were given a checklist, which can be found in
Appendix A.
Data collected included:
Location of the house (address), and contact information for the household;
Roof characteristics, inducing material, pitch, orientation, shading, and insulation;
Original roof coating type and colour, and
Cool roof product, colour, solar reflectance value, and thermal emittance values.
2 Akbari, H., Berhe, A., Levinson, R., Graveline, S., Foley, K., Delgado, A. and Paroli, R. (2006) ‘Aging and Weathering of Cool
Roofing Membranes’, Department of Energy’s Information Bridge, Oak Ridge, USA [www.osti.gov/bridge/servlets/purl/860745-BAdlvk/860745.PDF, accessed 04/01/2010.]

Townsville CitySolar Community Capacity Building Program
Monitoring and Evaluation of ‘Cool Roofs’ Community Pilot Program
Page 11 of 80
Table 2: Example building and roof profile from pilot program
Dwelling A
House and roof characteristics
Type House
Suburb Mundingburra
Roof materials Tile
Original roof colour Dark brown
Roof pitch Steep
Insulation None
Extent of shade Negligible
Levels One
Air-conditioned Yes
Household Temperature Readings
Temperature data was collected for the pilot program period from each of the households,
before and after application of the cool roof coating. The program was designed with each
participating households having two temperature sensors installed; one in the roof cavity, and
one in an internal non air-conditioned space. Where an internal non air-conditioned space was
not available, both sensors were installed in the roof cavity with the second close to the ceiling.
Where a dwelling had no roof cavity, both sensors were installed in an internal non air-
conditioned area. The temperature sensors logged temperature data in 15-minute intervals.
Temperature sensors were installed as far in advance of the coating application as possible and
left in place for a minimum of two weeks following the application, after which they were
removed and the data downloaded.
Climatic and Weather Conditions
To be able to compare the temperature readings from each of the houses, before and after
installation of the cool roof, climatic information was obtained from the Bureau of Meteorology
(BOM). Climate data for the Townsville region was accessed from the Townsville Aero weather
station (station number 032040, Lat: -19.25 Lon: 146.77). A data set containing 30-minute
climate data for the period 01/07/2011 to 30/06/2012 was used for comparison. Measured
parameters included:
Date/Time (Eastern Standard Time),
Temperature (°C),
Relative Humidity (%),
Wind (m/s),
Precipitation (mm), and
Total daily solar radiation (MJ/m2).
Considering household electricity consumption reductions from ‘Cool Roof’
The pilot program aimed to investigate the impact a ‘cool roof’ coating could have on household
electricity consumption. A cool roof will predominately reduce energy consumption in the home
by the amount that the household reduces their use of air conditioners, or other mechanical
cooling devices. It is noted that having lower temperatures inside the home will also reduce the
cooling load, so that even if the household runs the air conditioner for the same amount of time,
the air conditioner will have to work less to maintain the desired temperature. However, it is

Townsville CitySolar Community Capacity Building Program
Monitoring and Evaluation of ‘Cool Roofs’ Community Pilot Program
Page 12 of 80
assumed that the greatest benefit would occur if the household also changed their air
conditioner usage patterns due to their house being cooler as a result of the cool roof.
The pilot program sought to evaluate a cost-effective method for measuring changes in
household electricity consumption in collaboration with the energy utility to see whether this
would be a viable component of a community-wide program. Household electricity consumption
data for each location was accessed through the local utility, Ergon Energy, to determine
whether there was a decrease in household electricity consumption after the cool roof was
installed. Participants provided permission for the research team to access this information for
each participating address, which provided a history of electricity use for up to 2-3 years prior to
the cool roof application, up to and including the most recent data available. Electricity data was
only available in 3-monthly (quarterly) intervals. On average the participants in the cool roof pilot
program used 32.3 per cent less electricity in the summer period following the cool roof
application. It should be noted that energy use would likely have been impacted by a variety of
factors, therefore this reduction cannot be attributed solely to the cool roof, hence this is a
secondary finding.
Community perceptions of cool roof performance (participant survey)
The temperature inside the home is affected by several factors, including: downward heat flow
through the roof; Heat flow through the walls, windows, doors and other building surfaces and
cavities; and use of air conditioners and other cooling mechanisms in the home. Hence, it is not
possible to accurately predict what cooling effect a cool roof will have on an individual home. It is
only possible to demonstrate that cool roofs reduce the heat transfer process into a dwelling,
and will thus reduce internal temperatures.
In terms of measuring human comfort, it can be more useful to consider the apparent
temperature, rather than the actual temperature. Human comfort is influenced by multiple
climatic factors, including airflow (wind), air temperature, air humidity, and radiation from the sun
and nearby hot surfaces. Personal comfort is also generally affected by the type of clothing a
person is wearing, how well adapted they are to the climate, and how physically active they are.
The impact of these factors on personal comfort is evident when considering the human body’s
mechanisms for maintaining a desirable internal temperature, which is primarily by releasing
heat through evaporation of sweat from the skin. How easily the body can do this depends on
the air temperature, humidity, and wind speed, as well as whether clothing is impeding this
action.
In addition, air temperatures, radiation and physical activity will increase the body’s temperature.
Wind and radiation tend to vary significantly by location, even over short distances. Hence, these
are often discounted, and humidity and air temperature are often used to compare the apparent
temperature between locations. Further, air temperature is often used as a proxy measurement
to determine the effect of the environment on personal comfort, and in the tropics this is a
reasonably appropriate assumption, as humidity levels tend to be relatively constant. For the
purposes of this report, this has been the case. However, it is important to note that the
relationship between air temperature, and apparent temperature (for a constant humidity) is not
linear. Indeed, reducing internal temperatures inside the home can reduce apparent
temperatures by a larger amount. Hence, even for relatively small temperature decreases,
personal comfort in the home is likely to be impacted.
To complement the investigation into temperature reductions inside the home from the cool roof,
the research team conducted a series of interviews with program participants to see what impact
Townsville CitySolar Community Capacity Building Program
Monitoring and Evaluation of ‘Cool Roofs’ Community Pilot Program
Page 13 of 80
this had on their comfort and experience in the home. As noted above, it has been found that
there is a non-linear relationship between actual air temperature and apparent temperature,
such that people often feel much more comfortable in a room that has a marginally lower air
temperature. It is hence important to not only have an idea of how many degrees cooler a house
could be with a cool roof, but also what a difference that would make to the comfort of people in
the house.
To provide insight into these areas, a post program participant survey was conducted with pilot
program participants. The survey is designed to provide insights into several key questions,
including:
Has the household noticed a difference in comfort levels in their home from having their roof
painted with cool roof coating? (With one participant saying ‘It has exceeded my
expectations. Estimate it has dropped the temperature of the house by 5°C. Difference is
phenomenal’.)
Does the household feel that they are using their air conditioner less since the cool roof?
(With one participating saying to the interviewer that that ‘they don’t use it as much, for two
reasons, the first being that they don’t need it as much, and since they’ve noticed how much
of an impact it makes on their electricity bill, they have further reduced the use’).
Would they recommend a cool roof to others, and would they do this again if they moved to
another house? (With one participant saying ‘Yes, Already told several work colleagues –
main interest is from the lower power bill’.)
The survey was designed to be able to be conducted by phone or in person, and a copy can be
found in Appendix B.
Assumptions in evaluating temperature reductions
In evaluating the data from the community pilot, from before and after the roof was painted with
cool roof coating, several key assumptions have been made. This study considers only the heat
flow through the roof, and how the addition of a cool roof coating impacts on this heat flow into
the home through the roof. It is acknowledged that the heat flow through other building surfaces
and cavities will also impact on the temperature readings obtained from participating
households, and the following assumptions have been made:
The heat flow through other building surfaces and cavities is constant for a given ambient air
temperature;
Air conditioner usage in the house hasn’t affected temperature readings, due to sensors
being located either in roof cavities or in a room inside the house which isn’t air conditioned;
The temperature readings given by the internal sensors are a good proxy measurement to
determine how the cool roof will impact on occupant experience in the home; and
There are other factors which will influence the transfer of heat through the roof into the
home, including whether the ceiling cavity is ventilated, and the amount of insulation.
General Assumptions and Considerations of Pilot Program
In considering the analysis of the data, the following points are important to note:
The turnaround time between providing a quote and the application of the cool roof coating
was often only one or two days. In such cases the cool roof painters installed the
temperature sensors as soon as was practice and in some cases temperature data was
recorded for one or two days prior to the roof being painted. Further, in some cases, these

Townsville CitySolar Community Capacity Building Program
Monitoring and Evaluation of ‘Cool Roofs’ Community Pilot Program
Page 14 of 80
were overcast days with lower solar insolation and may not have given a suitable baseline
prior to the application of the cool roof.
One of the painters asked some of his customers that had contracted him to apply a cool
roof coating on their roof whether they would be interested in participating in the program.
Hence, contact details are available for these households, and the research team can
conduct a participant survey with them. However, as the painters invited the households to
participate after having applied the cool roof, it is not possible to obtain temperature from
these households, this data has been noted in the assessment. To provide an adequate
comparison, a ‘like-day’ comparison has been used; comparing before and after data for
dates with similar climatic conditions (temperature, solar radiation, precipitation). These ‘like-
days’ were taken as close together as possible.
Townsville CitySolar Community Capacity Building Program
Monitoring and Evaluation of ‘Cool Roofs’ Community Pilot Program
Page 15 of 80
Findings of Cool Roof Pilot Program in Townsville
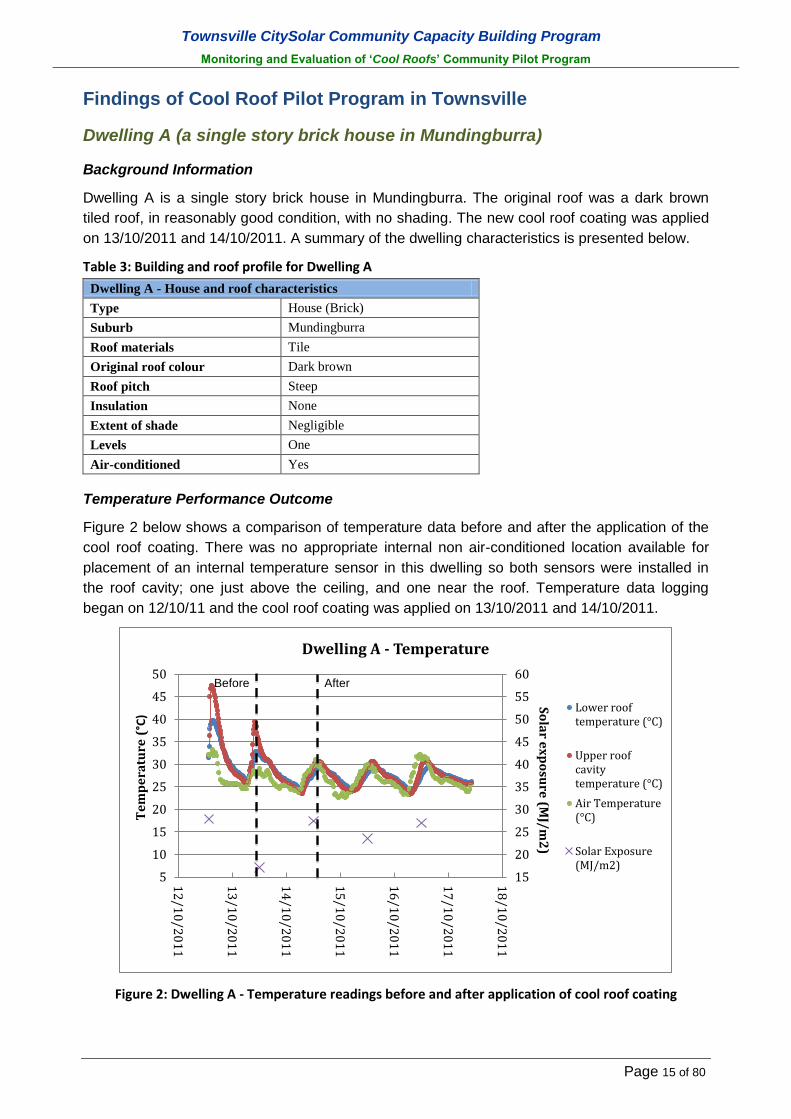
Dwelling A (a single story brick house in Mundingburra)
Background Information
Dwelling A is a single story brick house in Mundingburra. The original roof was a dark brown
tiled roof, in reasonably good condition, with no shading. The new cool roof coating was applied
on 13/10/2011 and 14/10/2011. A summary of the dwelling characteristics is presented below.
Table 3: Building and roof profile for Dwelling A
Dwelling A - House and roof characteristics
Type House (Brick)
Suburb Mundingburra
Roof materials Tile
Original roof colour Dark brown
Roof pitch Steep
Insulation None
Extent of shade Negligible
Levels One
Air-conditioned Yes
Temperature Performance Outcome
Figure 2 below shows a comparison of temperature data before and after the application of the
cool roof coating. There was no appropriate internal non air-conditioned location available for
placement of an internal temperature sensor in this dwelling so both sensors were installed in
the roof cavity; one just above the ceiling, and one near the roof. Temperature data logging
began on 12/10/11 and the cool roof coating was applied on 13/10/2011 and 14/10/2011.
Figure 2: Dwelling A - Temperature readings before and after application of cool roof coating
15
20
25
30
35
40
45
50
55
60
5
10
15
20
25
30
35
40
45
50
12
/10
/20
11
13
/10
/20
11
14
/10
/20
11
15
/10
/20
11
16
/10
/20
11
17
/10
/20
11
18
/10
/20
11
So
lar e
xp
osu
re (M
J/m
2)
Te
mp
era
ture
(°C
)
Dwelling A - Temperature
Lower rooftemperature (°C)
Upper roofcavitytemperature (°C)
Air Temperature(°C)
Solar Exposure(MJ/m2)
Before After

Townsville CitySolar Community Capacity Building Program
Monitoring and Evaluation of ‘Cool Roofs’ Community Pilot Program
Page 16 of 80
Data for the ‘Before’ period consists of only one day due to the short turn-around time between
the resident deciding to get a cool roof (12/10/2011) and the roof being painted (13/10/2011).
Comparing the data for the ‘Before’ period to a similar day with comparable climatic conditions
(ambient temperature, solar insolation, and precipitation) after application of the cool roof
coating, maximum roof cavity temperatures have been reduced by between 10.3°C (sensor near
the ceiling) to 17.0°C (sensor near the roof). Average daytime roof cavity temperatures were
reduced by 9.4 - 15.3°C, for the sensor located near the roof and the sensor located just above
the ceiling respectively (see Table 4 below). Note that the date used for comparison after
application of cool roof (16/10/11) had a maximum temperature 1.1°C cooler than the baseline
date (12/10/11), and this may have contributed to the temperature reductions recorded.
Table 4: Dwelling A - summary of cool roof performance, comparing two similar days
Comparison of two similar days
Before After Difference
12/10/2011 16/10/2011
Maximum roof cavity temperature; ˚C 47.5 30.5 -17.0
Average roof cavity temperature; ˚C, (12pm-9pm)* 39.9 24.7 -15.3
Maximum roof near ceiling temperature; ˚C 39.7 29.4 -10.3
Average roof near ceiling temperature; ˚C, (12pm-9pm)* 34.7 25.5 -9.4
Daily solar exposure; MJ/m2 27.9 27.0 -0.9
Maximum ambient temperature; ˚C 33.2 32.1 -1.1
Precipitation (mm) 0.0 0.0 0.0
Average wind speed (km/h) 12.7 12.4 -0.4
*Note: data from 6am-11:59am is not available for this trial on 12/10/2011
The cool roof has significantly reduced roof cavity temperatures. Comparing temperature data in
the dwelling with ambient temperature data before and after application of the cool roof coating it
can be seen that upper roof cavity temperatures were previously on average 5.2 - 12.4˚C hotter
than ambient conditions (see Figure 3 and Figure 4). Roof cavity temperatures after the cool roof
was installed were reduced significantly, averaging 0.1 – 0.7˚C cooler than ambient
temperatures. This has resulted in average maximum temperature reductions of 5.9 – 12.5˚C
relative to ambient temperatures.
Figure 3: Dwelling A - Upper roof temperature rise above ambient temperatures
-4
-2
0
2
4
6
8
10
12
14
16
12
/10
/11
13
/10
/11
14
/10
/11
15
/10
/11
16
/10
/11
17
/10
/11
Te
mp
era
ture
ris
e (
°C)
Dwelling A - Upper roof temperature rise above ambient
Before After

Townsville CitySolar Community Capacity Building Program
Monitoring and Evaluation of ‘Cool Roofs’ Community Pilot Program
Page 17 of 80
Figure 4: Dwelling A - Lower roof temperature rise above ambient conditions
Electricity Consumption
The cool roof coating was applied during Q4 2011. In order to compare electricity consumption
before and after the application of the cool roof product, Q1 and Q2 were chosen for comparison
as these two quarters are most representative of the summer cooling-demand period for this
dwelling. For this dwelling, Q1 covers the period late-October to early-February; Q2 covers the
period early-February to early-May. For the purposes of this analysis, the 2010-11 summer
period has been used as the baseline period for comparison as this is the only data available.
An average kWh/day figure was determined by averaging the total energy consumption over the
total number of days in these two quarters. At the time of writing, Q2 2013 data was not
available and therefore only Q1 2013 data was used for this summer period.
Average daily electricity demand prior to application of the cool roof product was 57.2 kWh/day
in the 2010/2011 summer period. Following the application of the cool roof product, average
daily electricity consumption has fallen to 45.4 kWh/day in the 2011/2012 summer period, and
42.9 kWh/day in Q1 2013 (see Figure 5). Comparing electricity consumption data after
application of the cool roof product with the 2011-12 baseline, this dwelling has achieved a
reduction in average daily energy consumption of approximately 21 per cent.
Comparing the 2012/13 summer period against the 2011/12 summer period, it appears that
following the application of the cool roof product, energy reductions have been maintained and
further reduced. Analysing Q1 2012 against Q1 2013, it can be seen that average daily
electricity use has fallen from 49.0 kWh/day in 2012 down to 42.9 kWh/day in 2013, equivalent
to a further reduction on approximately 12 per cent.
-4
-2
0
2
4
6
8
12
/10
/20
11
13
/10
/20
11
14
/10
/20
11
15
/10
/20
11
16
/10
/20
11
17
/10
/20
11
Te
mp
era
ture
ris
e (
°C)
Dwelling A - Lower roof temperature rise above ambient
After Before

Townsville CitySolar Community Capacity Building Program
Monitoring and Evaluation of ‘Cool Roofs’ Community Pilot Program
Page 18 of 80
Figure 5: Dwelling A – Average daily T11 electricity consumption
Occupant Experience of the Cool Roof
An interview was conducted with the resident to obtain feedback about the pilot program and
about their experience with their new cool roof. The resident reported that the cool roof was
performing as expected and has helped reduce the temperature inside the house. The occupant
self-initiated roof painting after witnessing media coverage and advertising of the benefits of cool
roofs. At the time they were completely unaware of the pilot program, and later reported that
they were somewhat hesitant to proceed due to the limited choice of colours (white being the
only colour available in Australia at present). The tiled roof was originally dark brown which
matched the exterior red brick walls, and the occupant was concerned that a white roof would
cause the house to stand out in comparison to the surroundings. This issue was eventually
outweighed by the functionality of the new roofing, and the occupant came to the conclusion that
the roof’s effectiveness was the priority. Their decision to have a cool roof installed was
motivated by the desire to have a more comfortable living space and hopefully to reduce their
energy bills as well.
The occupants are very pleased with their choice to have the roof painted, stating that “it
certainly has made a difference to the temperature inside the house”. The change is particularly
noticeable when they return home after the house has been closed up, and it now “feels very
different in comparison to how hot and sweaty it used to be”. Not only has the roof made the
house more comfortable but they also believe it has helped improved the efficiency of some
appliances. The resident noted that previously they have six air conditioners throughout the
house, which they previously had to set at around 22°C in order to reach a reasonable
temperature. Following the application of the cool roof product they report that they now only
have to set the air-conditioner at 25°C to maintain comfort; providing the same amount of cooling
benefit but with reduced energy use. Despite the reduced need for air-conditioning the primary
participant reflected that very often other family members operate the air conditioning out of
66.6
52.5 49.0
41.0 42.9
0
10
20
30
40
50
60
70
1st Q
tr 20
11
2n
d Q
tr 20
11
3rd
Qtr 2
01
1
4th
Qtr 2
01
1
1st Q
tr 20
12
2n
d Q
tr 20
12
3rd
Qtr 2
01
2
4th
Qtr 2
01
2
1st Q
tr 20
13
Ene
rgy
con
sum
pti
on
(kW
h)
Dwelling A - T11 Electricity Consumption (average kWh/day)
After Before

Townsville CitySolar Community Capacity Building Program
Monitoring and Evaluation of ‘Cool Roofs’ Community Pilot Program
Page 19 of 80
habit rather than out of necessity even if it requires sleeping with extra bedding to stay warm.
They have encouraged their family to adopt new behaviours, thus far with limited effectiveness.
The occupant feels that there has only been a marginal decrease in their energy bills, however
the data indicates that there has actually been a significant reduction in their energy use since
the roof was painted. It is also possible that the cooling effect may have been enhanced with the
installation of their new solar system, which has added partial shading to the roof.
Although the occupant feels that the roof treatment has made the roof itself look neat and new,
they still felt that the high contrast between the dark walls and white roof is ‘a bit distracting’.
They are considering having the external walls rendered in a lighter colour, which would make
the roof appear less obvious and may also assist in reducing internal temperatures. The
resident could not recall if any friends or neighbours had commented on the visual appearance
of the roof, but several have commented about the reduction in temperature. They would
recommend cool roofs to others, advocating that not only has it improved comfort but it has also
extended the life of the current surface, and is significantly cheaper than replacing the entire
roof. They would consider getting a cool roof if they moved to a new address that didn’t have
one, particularly if the roof required maintenance.
Participant Testimonial
"The main thing is that it has certainly decreased the temperature inside the house. The
coating has made the roof look new and it has likely extended the life of the roof as well".

Townsville CitySolar Community Capacity Building Program
Monitoring and Evaluation of ‘Cool Roofs’ Community Pilot Program
Page 20 of 80
Dwelling B (two level 1950s Queenslander in North Ward)
Background Information
Dwelling B is a two level 1950s Queenslander style house located in North Ward. The original
roof was unpainted corrugated iron with negligible shading. The house has a flat-pitched roof
with no roof cavity and no insulation. Temperature data logging began on 22/11/2011 and the
cool roof coating was applied on 29/11/2011 and 30/11/2011. A summary of the dwelling
characteristics is presented in the Table 5 below.
Table 5: Building and roof profile for Dwelling B
Dwelling B - House and roof characteristics
Type House (Queenslander)
Suburb North Ward
Roof materials Corrugated iron
Original roof colour Unpainted corrugated iron
Roof pitch Close to flat (no attic)
Insulation No insulation
Extent of shade
Morning – partially shaded,
Midday - no shade,
Afternoon – partially shaded.
Levels Two
Air-conditioned Yes
Temperature Performance Outcome
Figure 6 shows a comparison of temperature data before and after the application of the cool
roof coating. Dwelling B has a flat-pitched roof with no roof cavity, and as such, both sensors
were installed in separate internal non air-conditioned spaces. One was in a bathroom alcove,
and the other in a separate, internal non air-conditioned room.
Figure 6: Dwelling B – Temperature readings before and after application of cool roof coating
20
25
30
35
40
45
50
55
60
65
70
20
22
24
26
28
30
32
34
24
/11
/11
25
/11
/11
26
/11
/11
27
/11
/11
28
/11
/11
29
/11
/11
30
/11
/11
1/1
2/1
1
2/1
2/1
1
3/1
2/1
1
4/1
2/1
1
5/1
2/1
1
6/1
2/1
1
Solar Exp
osu
re (M
J/m2
)
Tem
pe
ratu
re (
°C)
Dwelling B - Temperature
InternalTemperature °C
AlcoveTemperature °C
Air Temperature°C
SolarExposure(MJ/m2)
Before After

Townsville CitySolar Community Capacity Building Program
Monitoring and Evaluation of ‘Cool Roofs’ Community Pilot Program
Page 21 of 80
Comparing two similar days with similar ambient temperature, solar insolation, wind speed and
precipitation, the cool roof coating has reduced maximum internal temperatures by 1.2 - 2.0°C
and average daytime internal temperatures by 0.2 - 1.3°C (see Table 6 below). Note that the
date used for comparison after application of cool roof (02/12/2011) had a maximum
temperature 0.4°C warmer than the baseline date (27/11/11), and this may have reduced the
measured cooling effect. However, despite the ‘after’ date being 0.4°C warmer, internal
temperatures were still significantly cooler than previously.
Table 6: Dwelling B summary of cool roof performance, comparing two similar days
Comparison of two similar days
Before After
Difference
27/11/2011 02/12/2011
Maximum internal temperature; ˚C 32.4 30.4 -2.0
Average internal temperature; ˚C, (9am-9pm) 31.1 29.8 -1.3
Maximum alcove temperature; ˚C 32.9 31.7 -1.2
Average alcove temperature; ˚C (9am-9pm) 30.7 30.5 -0.2
Daily solar exposure; MJ/m2 29.8 30.8 1.0
Maximum ambient temperature; ˚C 31.0 31.4 0.4
Precipitation (mm) 0.0 0.0 0.0
Average wind speed (km/h) 40.6 21.1 -19.5
The cool roof has significantly reduced internal temperatures. Comparing temperature data in
the dwelling with ambient temperature data before and after application of the cool roof coating it
can be seen that maximum internal temperatures were previously on average 1.5˚C hotter than
ambient conditions (see Figure 7). Maximum internal temperatures after the cool roof were
reduced to an average 0.3˚C cooler than ambient temperatures. This has resulted in average
maximum temperature reductions of 1.8˚C relative to ambient temperatures. The anomaly on
04/12/11 appears to be due to a large amount of rain in Townsville and low solar exposure
values on that day.
Figure 7: Dwelling B - Internal temperature rise above ambient conditions
-2
-1.5
-1
-0.5
0
0.5
1
1.5
2
2.5
3
25
/11
/11
26
/11
/11
27
/11
/11
28
/11
/11
29
/11
/11
30
/11
/11
1/1
2/1
1
2/1
2/1
1
3/1
2/1
1
4/1
2/1
1
5/1
2/1
1
6/1
2/1
1
Tem
pe
ratu
re r
ise
(°C
)
Dwelling B - Internal temperature rise above ambient
After Before

Townsville CitySolar Community Capacity Building Program
Monitoring and Evaluation of ‘Cool Roofs’ Community Pilot Program
Page 22 of 80
Electricity Consumption
The cool roof coating was applied during Q1 2012. In order to compare electricity consumption
before and after the application of the cool roof product, Q1 and Q2 were chosen for analysis as
these two quarters are most representative of the summer cooling-demand period for this
dwelling. Q1 covers the period mid-October to mid-January; Q2 covers the period mid-January
to mid-April. An average kWh/day figure was determined by averaging the total energy
consumption over the total number of days in these two quarters. At the time of writing, Q2 2013
data was not available and therefore only Q1 2013 data was used for this summer period.
Average daily electricity demand prior to application of the cool roof product was 23.2 kWh/day
in 2009/2010 summer period, and 23.7 kWh/day in the 2010/2011 summer period. Following the
application of the cool roof product, average daily electricity consumption has fallen to 10
kWh/day in Q1 2013 (see Figure 8). The 2011/2012 summer period data, which averaged 12.7
kWh/day has not been considered as the cool roof was applied during this period.
For the purposes of this analysis, the 2010-11 summer period has been chosen as the baseline
period for comparison. Comparing electricity consumption data after application of the cool roof
product with the 2010-11 baseline, this dwelling has achieved a reduction in average daily
energy consumption of approximately 57 per cent.
Figure 8: Dwelling B - Average daily T11 electricity consumption
Comparing the 2012/13 summer period against the 2011/12 summer period, it appears that
since application of the cool roof product, energy use reductions have been maintained and
reduced further. Note that the cool roof was applied approximately one-third of the way through
Q1 2012. Analysing Q1 2012 against Q1 2013, it can be seen that average daily electricity use
has fallen from 12 kWh/day in 2012 down to 10 kWh/day in 2013, equivalent to a further
reduction on approximately 16 per cent.
23 24 22
25
12 14
10
0
5
10
15
20
25
30
1st Q
tr 20
10
2n
d Q
tr 20
10
3rd
Qtr 2
01
0
4th
Qtr 2
01
0
1st Q
tr 20
11
2n
d Q
tr 20
11
3rd
Qtr 2
01
1
4th
Qtr 2
01
1
1st Q
tr 20
12
2n
d Q
tr 20
12
3rd
Qtr 2
01
2
4th
Qtr 2
01
2
1st Q
tr 20
13
Ene
rgy
con
sum
pti
on
(kW
h)
Dwelling B - T11 Electricity consumption (average kWh/day)
After Before

Townsville CitySolar Community Capacity Building Program
Monitoring and Evaluation of ‘Cool Roofs’ Community Pilot Program
Page 23 of 80
Note: Since Q3 2011, the residents of this dwelling have been undertaking extensive energy
efficiency upgrades, such as the installation of a more efficient pool pump and more efficient
kitchen appliances. It should therefore be noted that a wide range of factors in addition to the
cool roof have influenced energy consumption in this dwelling.
Occupant Experience of the Cool Roof
An interview was conducted with the resident to obtain feedback about the pilot program and
about their experience with their new cool roof. The resident is very pleased with the new cool
roof and stated that it had exceeded their expectations. The resident reported that it had
effectively cooled the house, estimating that the internal temperature felt approximately 5°C
cooler over summer.
The resident also stated that she felt like the cool roof had reduced her use of air conditioning.
Previously the resident used a total of 5 air-conditioners throughout the house to maintain a
comfortable temperature, and this had resulted in quarterly energy bills typically exceeding $700
during the summer period. The resident stated that since the cool roof the house has been much
more comfortable and it has drastically reduced her reliance on air-conditioning, reducing her
energy bill to approximately $285 over the most recent summer period (including other energy
saving activities).
For this dwelling, installing a cool roof has been part of a series of actions taken by the residents
to reduce their power bills. They had received a home audit under the previous State
Government sponsored service, which had drawn attention to their use of stand-by power and
recommended that they upgrade some of their appliances. Initially, the resident noticed a
reduction in their bill simply by turning devices off at the wall. They had a new kitchen installed
prior to the cool roof, and new efficient appliances made a significant impact on their next bill.
Since the cool roof was completed they not only use their air conditioners less often, but they
also felt that the both the air conditioner and the fridge were operating more efficiently given the
cooler ambient temperature inside the house.
A substantial decrease in electricity use has resulted from having their pool upgraded. The
previous pool pump was not only inefficient but also attached to a high-cost tariff. The pool was
still under construction at the time of the most recent interview, and the resident expects that
their bills may increase slightly when the new pump is online. Overall, their electricity bills have
dropped from approximately $700 to $285 per quarter. They have shared this information with
others, which has sparked interest in cool roofs from their friends and colleagues.
Another member of the household expressed concern about the cost of installing a cool-roof,
stating that they felt it was an expensive undertaking. Despite this the primary participant (who
initiated the installation process) remarked that they were very pleased with the result, which had
exceeded their expectations. The primary participant commented that the difference it has made
is significant, for both their own comfort and for the efficiency of their appliances.
Cost had been an initial barrier for the resident, who later stated that they had heard enough
evidence and that the roof needed repainting and repair anyway. The main motivators for having
the treatment done were the desire to reduce both the internal temperature and overall power
use, especially the use of air-conditioning, and to improve the state of the roof.
The resident decided to get a cool roof after her daughter had a cool roof installed. The main
reasons for deciding to get a cool roof were to reduce internal temperatures and reduce air-
conditioning energy use. The resident has been actively telling friends and family about the

Townsville CitySolar Community Capacity Building Program
Monitoring and Evaluation of ‘Cool Roofs’ Community Pilot Program
Page 24 of 80
benefits of cool roofs and stated that she believes they are essential from a sustainability
perspective in Townsville. The participant stated that they would have one installed if they were
to move to a new house.
Participant Testimonial
"I'm very happy with the new roof - it did what I wanted it to do. It’s cooled the house down by
about five degrees, which makes a difference for the appliances and for me. Combined with my
new appliances my electricity bills have come down substantially. It was a good investment;
when you see what it puts back in your pocket it is definitely worth the upfront cost".

Townsville CitySolar Community Capacity Building Program
Monitoring and Evaluation of ‘Cool Roofs’ Community Pilot Program
Page 25 of 80
Dwelling C (a single story masonry block house in Annandale)
Background Information
Dwelling C is a single story masonry block house located in Annandale. The original roof was a
dark red terracotta tiled roof with negligible shading. The cool roof coating was applied on
25/02/2012. A summary of the dwelling characteristics is presented in Table 7.
Table 7: Building and roof profile for Dwelling C
Dwelling C - House and roof characteristics
Type House (Masonry block)
Suburb Annandale
Roof materials Terracotta tiled
Original roof colour Unpainted, red tile
Roof pitch Cathedral ceiling
Insulation n/a
Extent of shade Not shaded
Levels One
Air-conditioned Yes
Temperature Performance Outcome
Figure 9 below shows a comparison of temperature data before and after the application of the
cool roof coating. Dwelling C was being renovated during the pilot program, and the sensor was
accidently removed during the renovation process and was not returned. Hence, no internal data
is currently available for Dwelling C. Temperature data logging began on 19/02/2012 and the
cool roof coating was applied on 25/02/2012.
Figure 9: Dwelling C: Temperature readings before and after application of cool roof coating
0
5
10
15
20
25
30
35
40
45
50
0
5
10
15
20
25
30
35
40
45
20
/02
/20
12
21
/02
/20
12
22
/02
/20
12
23
/02
/20
12
24
/02
/20
12
25
/02
/20
12
26
/02
/20
12
27
/02
/20
12
28
/02
/20
12
29
/02
/20
12
1/0
3/2
01
2
2/0
3/2
01
2
3/0
3/2
01
2
Solar In
solatio
n (M
J/m2
)
Tem
pe
ratu
re (
°C)
Dwelling C - Temperature
InternalTemperature[NO DATA]
RoofTemperature(°C)
AirTemperature(°C)
Solar Exposure(MJ/m2)
After Before

Townsville CitySolar Community Capacity Building Program
Monitoring and Evaluation of ‘Cool Roofs’ Community Pilot Program
Page 26 of 80
There was an extended period of rain and overcast conditions in Townsville between 21/02/12
and 03/03/12, making comparison more difficult. However, comparing two similar days with
similar ambient temperature, solar insolation, and precipitation, the cool roof coating has
reduced maximum roof cavity temperatures by approximately 11.1°C (see Table 8 below).
Average daytime roof cavity temperatures were reduced by 7.8°C. No internal temperature data
was recorded for this property. Note that the ambient temperature on the date used for
comparison after application of cool roof (29/02/2012) had a maximum temperature 1.4°C cooler
than the baseline date (22/02/2012), and this may have contributed to the measured cooling
effect.
Table 8: Dwelling C summary of cool roof performance, comparing two similar days
Comparison of two similar days
Before After
Difference
22/02/2012 29/02/2012
Maximum roof cavity temperature; ˚C 41.8 30.7 -11.1
Average roof cavity temperature; ˚C (9am -
9pm) 37.0 29.2 -7.8
Maximum internal temperature; ˚C n/a n/a n/a
Average internal temperature; ˚C, (9am - 9pm) n/a n/a n/a
Daily solar exposure; MJ/m2 25.7 23.7 -2.0
Maximum ambient temperature; ˚C 32.1 30.7 -1.4
Precipitation (mm) 0.0 0.2 0.2
Average wind speed (km/h) 18.1 26.2 8.2
The cool roof has significantly reduced roof cavity temperatures. Comparing temperature data in
the dwelling with ambient temperature data before and after application of the cool roof coating it
can be seen that maximum roof cavity temperatures were previously on average 7.95˚C hotter
than ambient conditions (see Figure 10). Maximum roof cavity temperatures after the cool roof
were reduced to an average of only 0.35˚C hotter than ambient temperatures. This has resulted
in average maximum temperature reductions of 7.6˚C relative to ambient temperatures.
Figure 10: Dwelling C - Roof cavity temperature rise above ambient conditions
-2
0
2
4
6
8
10
12
21
/02
/20
12
22
/02
/20
12
23
/02
/20
12
24
/02
/20
12
25
/02
/20
12
26
/02
/20
12
27
/02
/20
12
28
/02
/20
12
29
/02
/20
12
1/0
3/2
01
2
2/0
3/2
01
2
3/0
3/2
01
2Te
mp
era
ture
ris
e (
°C)
Dwelling C - Roof cavity temperature rise above ambient
After Before
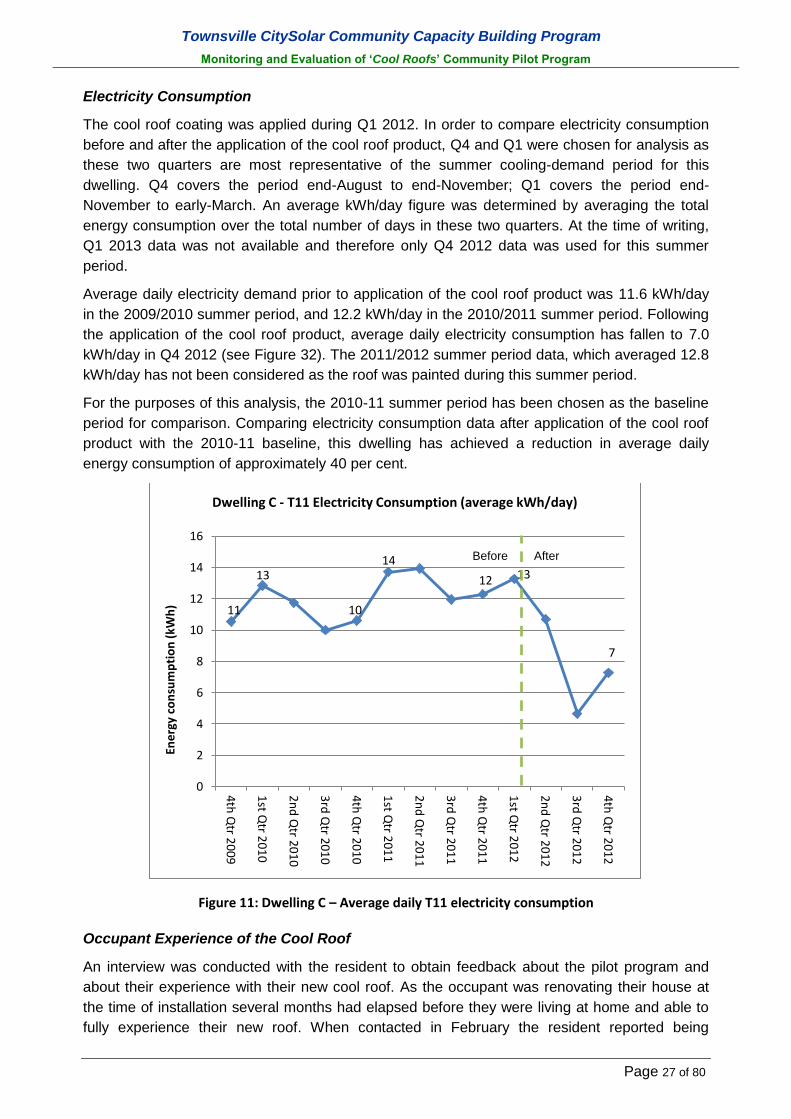
Townsville CitySolar Community Capacity Building Program
Monitoring and Evaluation of ‘Cool Roofs’ Community Pilot Program
Page 27 of 80
Electricity Consumption
The cool roof coating was applied during Q1 2012. In order to compare electricity consumption
before and after the application of the cool roof product, Q4 and Q1 were chosen for analysis as
these two quarters are most representative of the summer cooling-demand period for this
dwelling. Q4 covers the period end-August to end-November; Q1 covers the period end-
November to early-March. An average kWh/day figure was determined by averaging the total
energy consumption over the total number of days in these two quarters. At the time of writing,
Q1 2013 data was not available and therefore only Q4 2012 data was used for this summer
period.
Average daily electricity demand prior to application of the cool roof product was 11.6 kWh/day
in the 2009/2010 summer period, and 12.2 kWh/day in the 2010/2011 summer period. Following
the application of the cool roof product, average daily electricity consumption has fallen to 7.0
kWh/day in Q4 2012 (see Figure 32). The 2011/2012 summer period data, which averaged 12.8
kWh/day has not been considered as the roof was painted during this summer period.
For the purposes of this analysis, the 2010-11 summer period has been chosen as the baseline
period for comparison. Comparing electricity consumption data after application of the cool roof
product with the 2010-11 baseline, this dwelling has achieved a reduction in average daily
energy consumption of approximately 40 per cent.
Figure 11: Dwelling C – Average daily T11 electricity consumption
Occupant Experience of the Cool Roof
An interview was conducted with the resident to obtain feedback about the pilot program and
about their experience with their new cool roof. As the occupant was renovating their house at
the time of installation several months had elapsed before they were living at home and able to
fully experience their new roof. When contacted in February the resident reported being
11
13
10
14
12 13
7
0
2
4
6
8
10
12
14
16
4th
Qtr 2
00
9
1st Q
tr 20
10
2n
d Q
tr 20
10
3rd
Qtr 2
01
0
4th
Qtr 2
01
0
1st Q
tr 20
11
2n
d Q
tr 20
11
3rd
Qtr 2
01
1
4th
Qtr 2
01
1
1st Q
tr 20
12
2n
d Q
tr 20
12
3rd
Qtr 2
01
2
4th
Qtr 2
01
2En
erg
y co
nsu
mp
tio
n (
kWh
)
Dwelling C - T11 Electricity Consumption (average kWh/day)
After Before

Townsville CitySolar Community Capacity Building Program
Monitoring and Evaluation of ‘Cool Roofs’ Community Pilot Program
Page 28 of 80
surprised by how effective the cool roof has been, stating that it has surpassed all expectations.
The resident feels that the roof is ‘amazing’ and that ‘the house used to be absolutely stifling, but
there is a definite difference and the family can really feel it’.
The resident has two single split system air conditioners, which they reported using less than in
previous summers. Despite this they were unsure if their energy usage has reduced owing to
other confounding factors and difficulties with a pool pump. Although they were initially wary of
the colour (which was originally a dark red), they have gotten used to it now and don’t mind the
look. They would definitely recommend it to others, and would certainly have a cool roof installed
if they move into a new house in the future. They strongly recommended a cool roof to a family
member who is planning their own renovation in the near future.
The resident is a strong and positive supporter of the pilot program, describing it as ‘excellent’
and hoping that it will be further expanded to more areas and to involve educational material on
the difference between a cool roof product and regular white paint. The resident believes that
cool roofs are a sensible choice for the climate, and that similar products should be promoted
and encouraged in the Northern regions.
Testimonial
"Prior to my cool roof the temperature in my house was unbearable but there has been an
amazing difference. I would like cool roofs to be promoted so that other people can benefit."

Townsville CitySolar Community Capacity Building Program
Monitoring and Evaluation of ‘Cool Roofs’ Community Pilot Program
Page 29 of 80
Dwelling D (a single story 1980s era low-set bessa-block house in Condon)
Background Information
Dwelling D is a single story 1980s era low-set bessa block house in Condon. The original roof
was an olive/light green corrugated iron roof in poor condition. The cool roof coating was applied
on 07/11/2011 and 08/11/2011. A summary of the dwelling characteristics will be presented in
Table 9.
Table 9: Building and roof profile for Dwelling D
Dwelling D - House and roof characteristics
Type House (Low-set bessa block)
Suburb Condon
Roof materials Corrugated iron
Original roof colour Light green/olive
Roof pitch Steep
Insulation Yes
Extent of shade None
Levels One
Air-conditioned Yes
Temperature Performance Outcome
Figure 12 below shows a comparison of temperature data before and after the application of the
cool roof coating. No internal non air-conditioned space was available for a sensor so no data is
available. The graph below displays data recorded from two locations within the roof.
Temperature data logging began on 04/10/11 and the cool roof coating was applied on
07/11/2012 and 08/11/2012. The sensors were removed by the painter on 09/11/12 and
10/11/12.
Figure 12: Dwelling D: Change in Temperature Before and After Roof Painting
20
25
30
35
40
45
50
55
60
0
10
20
30
40
50
60
4/1
1/1
1
5/1
1/1
1
6/1
1/1
1
7/1
1/1
1
8/1
1/1
1
9/1
1/1
1
10
/11
/11
11
/11
/11
12
/11
/11
So
lar E
xp
osu
re (M
J/m
2)
Te
mp
era
ture
(°C
)
Dwelling D - Temperature
Lower RoofCavityTemperature (°C)
Upper RoofCavityTemperature (°C)
External AirTemperature (°C)
Solar Exposure(MJ/m2)
After Before

Townsville CitySolar Community Capacity Building Program
Monitoring and Evaluation of ‘Cool Roofs’ Community Pilot Program
Page 30 of 80
Comparing two similar days with similar ambient temperature, solar insolation, and precipitation,
the cool roof coating has reduced maximum roof cavity temperatures by 12.7 - 15.9°C and
average daytime roof cavity temperatures by 7.1 – 8.8°C (see Table 10 below). Note that the
ambient temperature on the date used for comparison after application of cool roof (09/11/2011)
had a maximum temperature 0.5°C warmer than the baseline date (06/01/2011), and this may
have reduced the measured cooling effect. However, despite the ‘after’ date being 0.5°C
warmer, internal house temperatures were still significantly cooler than previously.
Table 10: Dwelling D summary of cool roof performance, comparing two similar days
Comparison of two similar days
Before After
Difference
06/01/2011 09/11/2011
Maximum roof cavity temperature; ˚C 42.3 29.6 -12.7
Average daytime roof cavity temperature; ˚C (6am-9pm) 33.1 26.0 -7.1
Maximum upper roof cavity temperature; ˚C 46.3 30.4 -15.9
Average daytime upper roof cavity temperature; ˚C, (6am-9pm) 34.8 26.0 -8.8
Daily solar exposure; MJ/m2 25 24.1 -0.9
Maximum ambient temperature; ˚C 29.4 29.9 +0.5
Precipitation (mm) 0 0.4 +0.4
Average wind speed (km/h) 21.9 18.4 -3.5
The cool roof has significantly reduced roof cavity temperatures. Comparing temperature data in
the dwelling with ambient temperature data before and after application of the cool roof coating it
can be seen that maximum roof cavity temperatures were previously on average 21.8˚C hotter
than ambient conditions (see Figure 13). Maximum roof cavity temperatures after the cool roof
were reduced to an average of only 1.9˚C hotter than ambient temperatures. This has resulted in
average maximum roof cavity temperature reductions of 19.9˚C relative to ambient
temperatures.
Figure 13: Dwelling D - Upper roof cavity temperature rise above ambient conditions
0
5
10
15
20
25
3/1
1/2
01
1
4/1
1/2
01
1
5/1
1/2
01
1
6/1
1/2
01
1
7/1
1/2
01
1
8/1
1/2
01
1
9/1
1/2
01
1
Tem
pe
ratu
re r
ise
(°C
)
Dwelling D - Upper roof cavity temperature rise above ambient
After Before

Townsville CitySolar Community Capacity Building Program
Monitoring and Evaluation of ‘Cool Roofs’ Community Pilot Program
Page 31 of 80
Energy Consumption
The cool roof coating was applied during Q4 2011. In order to compare electricity consumption
before and after the application of the cool roof product, Q4 and Q1 were chosen for analysis
and comparison year on year as these two quarters are most representative of the summer
cooling-demand period for this dwelling. Q4 covers the period mid-October to mid-January (with
the exception of Q4 2012 where the data period is mid-September to mid-December as result of
an adjustment in dates in the Q3 period prior); Q1 covers the period mid-January to mid-April.
An average kWh/day figure was determined by averaging the total energy consumption over the
total number of days in these two quarters. At the time of writing, Q1 2013 data was not
available and therefore only Q4 2012 data was used for this summer period.
Average daily electricity demand prior to application of the cool roof product was 21.7 kWh/day
in the 2009/2010 summer period, and 17.1 kWh/day in the 2010/2011 summer period. Following
the application of the cool roof product, average daily electricity consumption has fallen to 11.3
kWh/day in Q4 2012 (see Figure 5). The 2011/2012 summer period data, which averaged 16.2
kWh/day has not been considered as the cool roof was applied during this period.
For the purposes of this analysis, the 2010-11 summer period has been chosen as the baseline
period for comparison. Comparing electricity consumption data after application of the cool roof
product with the 2010-11 baseline, this dwelling has achieved a reduction in average daily
energy consumption of approximately 34 per cent.
Figure 14: Dwelling D – Average daily T11 electricity consumption
Occupant Experience of the Cool Roof
An interview was conducted with the resident to obtain feedback about the pilot program and
about their experience with their new cool roof. House D is a typical Townsville Bessa Brick
house with a corrugated iron roof, which originally had a light green or olive-coloured roof. The
23.2
20.2
16.1
18.3
15.0
17.8
11.3
0
5
10
15
20
252
nd
Qtr 2
00
9
3rd
Qtr 2
00
9
4th
Qtr 2
00
9
1st Q
tr 20
10
2n
d Q
tr 20
10
3rd
Qtr 2
01
0
4th
Qtr 2
01
0
1st Q
tr 20
11
2n
d Q
tr 20
11
3rd
Qtr 2
01
1
4th
Qtr 2
01
1
1st Q
tr 20
12
2n
d Q
tr 20
12
3rd
Qtr 2
01
2
4th
Qtr 2
01
2En
erg
y co
nsu
mp
tio
n (
kWh
)
Dwelling D - T11 Electricity Consumption (average kWh/day)
After Before
Townsville CitySolar Community Capacity Building Program
Monitoring and Evaluation of ‘Cool Roofs’ Community Pilot Program
Page 32 of 80
owner was motivated to have a cool roof installed largely because the original paintwork was
deteriorating, but later reported being pleasantly surprised by how effective the new roof was at
reducing the internal temperature of the house. Booth the roof and the garage door were painted
with a cool roof product by the contractors.
The owner had previously taken steps to cool the house by installing insulation, which the
resident felt had made less of an impact than expected. In contrast, the performance of the cool
roof has exceeded their expectations. The owner reported that “the house is normally all locked
up during the day and use to be quite hot when we got home in the afternoon. After the [cool
roof] painting, the house was cool to walk into at the end of the day.” They were particularly
pleased with the difference it made over the Christmas and New Year period, stating that they
‘can’t believe the change it’s made’. The participant felt certain that they had reduced their use of
the air conditioner, and stated that they felt it was now “only needed on the really hot, humid
days” rather than on a regular basis.
The participant decided to get a cool roof in order to make the house more comfortable, and
because the original roof paint was deteriorating and needed repainting anyway. The resident
reported that they would recommend to friends and family that they get a cool roof and reports
that several have since had their roofs painted. The participant also reported that one of their
neighbours had their roof re-painted in a dark colour. The participant expressed concern that
perhaps darker colours should not be allowed in Townsville as they are unsuitable for the
climate.
Participant Testimonial
“We had the roof painted in November when the weather was starting to warm up. We could not
believe how much cooler the house was the day after it was painted. The house is normally all
locked up during the day and used to be quite hot when we got home in the afternoon. After the
painting, the house was cool to walk into at the end of the day. Our carport and patio are just the
bare metal colorbond roof. You can put your hand on the underside of the colorbond in the
middle of a hot day and the metal is not hot at all, where before it would have burnt you. We
found that when home we did not put the fans on until later in the day and there was reduced
use of airconditioning during the day, as it was only needed on the really hot, humid days. I have
certainly passed the word onto friends and know of a couple that have had their roofs painted.”

Townsville CitySolar Community Capacity Building Program
Monitoring and Evaluation of ‘Cool Roofs’ Community Pilot Program
Page 33 of 80
Dwelling E (a 1950s era raised timber house in West End)
Background Information
Dwelling E is a 1950s era single-level timer house located in West End. The original roof was a
silver corrugated iron roof approximately 30 years old. The cool roof coating was applied on
9/11/2011 and 10/11/2011. A summary of the dwelling characteristics is presented in Table 11.
Table 11: Building and roof profile for Dwelling E
Dwelling E - House and roof characteristics
Type House (1950s Timber house)
Suburb West End
Roof materials Corrugated iron
Original roof colour Silver (painted)
Roof pitch Steep
Insulation Yes
Extent of shade None
Levels One
Air-conditioned Yes, 2 in total
Temperature Performance Outcome
Figure 15 below shows a comparison of temperature data before and after the application of the
cool roof coating. No internal non air-conditioned space was available for a sensor so no data is
available. The graph below displays data recorded from two locations within the roof.
Temperature data logging began on 04/11/11 and the cool roof coating was applied on
09/11/2012 and 10/11/2012.
Figure 15: Dwelling E -Change in Temperature Before and After Roof Painting
20
25
30
35
40
45
50
0
5
10
15
20
25
30
35
40
45
6/1
1/1
1
7/1
1/1
1
8/1
1/1
1
9/1
1/1
1
10
/11
/11
11
/11
/11
12
/11
/11
13
/11
/11
14
/11
/11
15
/11
/11
16
/11
/11
So
lar e
xp
osu
re (M
J/m
2)
Te
mp
era
ture
(°C
)
Dwelling E - Temperature
InternalTemperature (°C)
Roof CavityTemperature (°C)
Air Temperature(°C)
Solar Exposure(MJ/m2)
After Before

Townsville CitySolar Community Capacity Building Program
Monitoring and Evaluation of ‘Cool Roofs’ Community Pilot Program
Page 34 of 80
Comparing two similar days with similar ambient temperature, solar insolation, and precipitation,
the cool roof coating has reduced maximum roof cavity temperatures by 9.4˚C and maximum
internal daytime temperatures by approximately 1.2°C (see Table 12 below). Average daytime
roof cavity temperatures were reduced by 6.4°C and average internal daytime temperatures
were reduced by 0.6°C. Note that the ambient temperature on the date used for comparison
after application of cool roof (13/11/2011) had a maximum temperature 0.6°C warmer than the
baseline date (08/11/2011), and this may have reduced the measured cooling effect. However,
despite the ‘after’ date being 0.6°C warmer, internal temperatures were still significantly cooler
than previously.
Table 12: Dwelling E: Summary of cool roof performance, comparing two similar days
Comparison of two similar days
Before After
Difference
08/11/2011 13/11/2011
Maximum roof cavity temperature; ˚C 40.2 30.8 -9.4
Average daytime roof cavity temperature; ˚C (9am-9pm) 35.4 29.0 -6.4
Maximum internal temperature; ˚C 32.7 31.5 -1.2
Average daytime internal temperature; ˚C, (9am-9pm) 30.5 29.9 -0.6
Daily solar exposure; MJ/m2 30.5 31.0 0.5
Maximum ambient temperature; ˚C 29.1 29.7 0.6
Precipitation (mm) 0.0 0.0 0.0
Average wind speed (km/h) 21.9 22.4 0.6
The cool roof has significantly reduced roof cavity temperatures. Comparing temperature data in
the dwelling with ambient temperature data before and after application of the cool roof coating it
can be seen that maximum roof cavity temperatures were previously on average 8.7˚C hotter
than ambient conditions (see Figure 16). Maximum roof cavity temperatures after the cool roof
were reduced to an average of only 0.8˚C hotter than ambient temperatures. This has resulted in
average maximum temperature reductions of 7.9˚C relative to ambient temperatures.
Figure 16: Dwelling E - Roof cavity temperature rise above ambient conditions
0
2
4
6
8
10
12
14
4/1
1/1
1
5/1
1/1
1
6/1
1/1
1
7/1
1/1
1
8/1
1/1
1
9/1
1/1
1
10
/11
/11
11
/11
/11
12
/11
/11
13
/11
/11
14
/11
/11
15
/11
/11
Te
mp
era
ture
ris
e (
°C)
Dwelling E - Roof cavity temperature rise above ambient
After Before

Townsville CitySolar Community Capacity Building Program
Monitoring and Evaluation of ‘Cool Roofs’ Community Pilot Program
Page 35 of 80
Similarly, internal maximum internal temperatures rises have been reduced from 2.8˚C hotter
than ambient temperatures down to 1.3˚C hotter than ambient temperatures (see Figure 17).
This has resulted in average maximum temperature reductions of 1.5˚C.
Figure 17: Dwelling E - Internal temperature rise above ambient conditions
Energy Consumption
The cool roof coating was applied during Q1 2012. Q1 and Q2 were chosen for analysis as
these two quarters are most representative of the summer cooling-demand period for this
dwelling. Q1 covers the period mid-October to mid-January; Q2 covers the period mid-January
to mid-April. An average kWh/day figure was determined by averaging the total energy
consumption over the total number of days in these two quarters. At the time of writing, however,
Q2 2013 data was not available and therefore only Q1 2013 data was used for this summer
period.
Average daily electricity demand prior to application of the cool roof product was 8.8 kWh/day in
the 2009/2010 summer period, and 4.9 kWh/day in the 2010/2011 summer period. Following the
application of the cool roof product, average daily electricity consumption has fallen to 4.7
kWh/day in the in Q1 2013 (see Figure 18). The 2011/2012 summer period data, which
averaged 4.6 kWh/day has not been considered as the cool roof was applied within these
months.
For the purposes of this analysis, the 2010-11 summer period has been chosen as the baseline
period for comparison. Comparing electricity consumption data after application of the cool roof
product with the 2010-11 baseline, this dwelling has achieved a reduction in average daily
energy consumption of approximately 3.8 per cent. It should be noted that this household is
already extremely efficient, using on average only around 5 kWh/day.
0
0.5
1
1.5
2
2.5
3
3.5
4
4/1
1/1
1
5/1
1/1
1
6/1
1/1
1
7/1
1/1
1
8/1
1/1
1
9/1
1/1
1
10
/11
/11
11
/11
/11
12
/11
/11
13
/11
/11
14
/11
/11
15
/11
/11
Te
mp
era
ture
ris
e (
°C)
Dwelling E - Internal temperature rise above ambient
After Before

Townsville CitySolar Community Capacity Building Program
Monitoring and Evaluation of ‘Cool Roofs’ Community Pilot Program
Page 36 of 80
Figure 18: Dwelling E – Average daily T11 electricity consumption
Occupant Experience of the Cool Roof
An interview was conducted with the resident to obtain feedback about the pilot program and
about their experience with their new cool roof. The resident reported being very happy with the
cool roof and they estimate that the internal house temperature is about 5 degrees cooler on a
summer’s day.
The residents reported that they were somewhat skeptical about that cool roofing prior to
installation but are now pleasantly surprised by the result. The new roof is performing as
expected, and has reduced the internal temperature by 5-6 degrees. Although this difference
was noticeable in winter as well as summer the resident did not feel that this made the house
uncomfortably cold, remarking that Townsville winters were pleasantly mild anyhow. In summer
they noticed the difference particularly when they return to the house after being out – it is no
longer as terribly hot as it used to be when closed up for a period of time. The residents rely on a
combination of ceiling fans and a single air-conditioning unit to cool the house on hot days, and
even though the house is noticeably more comfortable than before they still feel that the system
struggles to keep up and mostly ‘work overtime’, seldom managing to get the temperature down
to 25 degrees. Because of this they are doubtful that there will be much change to their energy
use. The resident attributes this as the result of a particularly hot summer, and is interested to
see how the roof will perform over the long term.
The residents decided to get a cool roof partly because they hoped it would cool the house, and
partly in order to prepare it for the installation of their new solar panels. The original roof was
silver corrugated iron and hadn’t been updated for about 30 years, so the residents felt that it
needed maintenance and repair. They believe that the cool roof has improved the look of their
house, although they hardly notice the colour anymore which they feel blends in well with the
11.6
6.0
5.0 4.9 4.4 4.7 4.7
0
2
4
6
8
10
12
14
3rd
Qtr 2
00
9
4th
Qtr 2
00
9
1st Q
tr 20
10
2n
d Q
tr 20
10
3rd
Qtr 2
01
0
4th
Qtr 2
01
0
1st Q
tr 20
11
2n
d Q
tr 20
11
3rd
Qtr 2
01
1
4th
Qtr 2
01
1
1st Q
tr 20
12
2n
d Q
tr 20
12
3rd
Qtr 2
01
2
4th
Qtr 2
01
2
1st Q
tr 20
13
Ene
rgy
con
sum
pti
on
(kW
h)
Dwelling E - T11 Electricity Consumption (average kWh/day)
After Before

Townsville CitySolar Community Capacity Building Program
Monitoring and Evaluation of ‘Cool Roofs’ Community Pilot Program
Page 37 of 80
streetscape of their suburb. The resident has recommended cool roofs to friends/family and
stated that they would install a cool roof if they moved to a new address.
Participant Testimonial
“I’d thoroughly recommend it if people can afford it – it’s surprising what it can do. So as long as
it’s properly installed by a trustworthy contractor it’s very effective. It’s more effective than
insulation. It’s well worth having.” [Verbal confirmation received. Awaiting written confirmation]

Townsville CitySolar Community Capacity Building Program
Monitoring and Evaluation of ‘Cool Roofs’ Community Pilot Program
Page 38 of 80
Dwelling F (a single storey concrete block house in Alice River)
Background Information
Dwelling F is a single storey house originally with a white Colorbond roof in Alice River. The cool
roof coating was applied on 28/05/2012 and 29/05/2012. A summary of the dwelling
characteristics is presented in Table 13.
Table 13: Building and roof profile for Dwelling F
Dwelling F - House and roof characteristics
Type House (Concrete block)
Suburb Alice River
Roof materials Colorbond
Original roof colour White
Roof pitch Mixed (cathedral ceilings and
moderate pitch)
Insulation Partial
Extent of shade None
Levels One
Air-conditioned Yes, 4 in total
Temperature Performance Outcome
Error! Reference source not found.below shows a comparison of temperature data before and
fter the application of the cool roof coating. During the period 30/06/2012 to 03/06/2012
Townsville experienced several days of rain (the impact of which can be seen on the
temperature and insolation graph below), and as such, the two days selected for comparison are
27/05/12 and 04/06/12.
Figure 19: Dwelling F - Temperature readings before and after cool roof painting
0
5
10
15
20
25
30
35
40
45
50
0
5
10
15
20
25
30
24
/05
/20
12
25
/05
/20
12
26
/05
/20
12
27
/05
/20
12
28
/05
/20
12
29
/05
/20
12
30
/05
/20
12
31
/05
/20
12
01
/06
/20
12
02
/06
/20
12
03
/06
/20
12
04
/06
/20
12
05
/06
/20
12
06
/06
/20
12
Solar e
xpo
sure
(MJ/m
2) Te
mp
era
ture
(°C
)
Dwelling F - Temperature
InternalTemperature °C
RoofTemperature °C
AirTemperature °C
Solar Insolation(MJ/m2)
After Before

Townsville CitySolar Community Capacity Building Program
Monitoring and Evaluation of ‘Cool Roofs’ Community Pilot Program
Page 39 of 80
Comparing two similar days with similar ambient temperature, solar insolation, and precipitation,
the cool roof coating has reduced maximum roof cavity temperatures by 4.9°C and maximum
internal temperatures by 0.8°C (see Table 14 below). Average daytime roof cavity temperatures
were reduced by 3.2°C and average daytime internal temperatures were reduced by 0.9°C.
Since the dwelling originally had a white roof coating, and also considering the study was
conducted during winter, the effect is not as drastic compared to other dwellings analysed in the
study. Additionally, it should be noted that that the ambient temperature on the date used for
comparison after application of cool roof (04/06/2012) had a maximum temperature 2.5°C
warmer than the baseline date (27/05/2012), and this may have reduced the measured cooling
effect. However, despite the ‘after’ date being 2.5°C warmer, internal temperatures were still
significantly cooler than previously.
Table 14: Dwelling F - Summary of cool roof performance, comparing two similar days
Comparison of two similar days
Before After
Difference
27/05/12 4/06/12
Maximum roof cavity temperature; ˚C 26.3 21.4 -4.9
Average daytime roof cavity temperature; ˚C (9am-9pm) 22.8 19.6 -3.2
Maximum internal temperature; ˚C 22.8 22.0 -0.8
Average daytime internal temperature; ˚C, (9am-9pm) 21.8 20.9 -0.9
Daily solar exposure; MJ/m2 15.2 17.0 1.8
Maximum ambient temperature; ˚C 23.2 25.7 2.5
Precipitation (mm) 0.0 0.0 0.0
Average wind speed (km/h) 20.0 16.4 -3.6
The cool roof has significantly reduced roof cavity temperatures. It can be seen that prior to the
cool roof application both internal and roof cavity maximum temperatures were typically higher
than ambient temperatures, however after the cool roof application, both internal and roof cavity
maximum temperatures are typically lower than ambient temperatures.
Comparing temperature data in the dwelling with ambient temperature data before and after
application of the cool roof coating it can be seen that maximum roof cavity temperatures were
previously on average 2,7˚C hotter than ambient conditions (see Figure 20). Maximum roof
cavity temperatures after the cool roof were reduced to an average of 2.4˚C cooler than ambient
temperatures. This has resulted in average maximum temperature reductions of 5.1˚C relative to
ambient temperatures.

Townsville CitySolar Community Capacity Building Program
Monitoring and Evaluation of ‘Cool Roofs’ Community Pilot Program
Page 40 of 80
Figure 20: Dwelling F - Roof cavity temperature rise above ambient conditions
The cool roof has also significantly reduced maximum internal temperatures from an average of
1.1˚C warmer than ambient down to 1.9˚C cooler than ambient after the cool roof application
(see Figure 21) for an average relative difference of 3˚C.
Figure 21: Dwelling F - Internal temperature rise above ambient conditions
Energy Consumption
The cool roof coating was applied during Q3 2012. Q1 and Q2 were chosen for analysis as
these two quarters are most representative of the summer cooling-demand period for this
dwelling. Q1 covers the period late-October to late-January; Q2 covers the period late-January
to late-April. An average kWh/day figure was determined by averaging the total energy
consumption over the total number of days in these two quarters. At the time of writing, however,
Q2 2013 data was not available and therefore only Q1 2013 data was used for this summer
period.
-5
-4
-3
-2
-1
0
1
2
3
4
25
/05
/12
26
/05
/12
27
/05
/12
28
/05
/12
29
/05
/12
30
/05
/12
31
/05
/12
1/0
6/1
2
2/0
6/1
2
3/0
6/1
2
4/0
6/1
2
Te
mp
era
ture
ris
e (
°C)
Dwelling F - Roof cavity temperature rise above ambient
-4
-3
-2
-1
0
1
2
3
25
/05
/12
26
/05
/12
27
/05
/12
28
/05
/12
29
/05
/12
30
/05
/12
31
/05
/12
1/0
6/1
2
2/0
6/1
2
3/0
6/1
2
4/0
6/1
2
Te
mp
era
ture
ris
e (
°C)
Dwelling F - Internal temperature rise above ambient
After Before
After Before

Townsville CitySolar Community Capacity Building Program
Monitoring and Evaluation of ‘Cool Roofs’ Community Pilot Program
Page 41 of 80
Average daily electricity demand prior to application of the cool roof product was 16.6 kWh/day
in the 2009/2010 summer period, 15.2 kWh/day in the 2010/2011 summer period, and 15.2
kWh/day in the 2011/2012 summer period. Following the application of the cool roof product,
average daily electricity consumption rose slightly to 15.8 kWh/day in Q1 2013 (see Figure 22).
For the purposes of this analysis, the 2011-12 summer period has been chosen as the baseline
period for comparison. Comparing electricity consumption data after application of the cool roof
product with the 2010/11 baseline, this dwelling has increased energy consumption by 3.8 per
cent.
Figure 22: Dwelling F – Average daily T11 electricity consumption
Occupant Experience of the Cool Roof
An interview was conducted with the resident to obtain feedback about the pilot program and
about their experience with their new cool roof. The resident stated that they had noticed a
difference in the comfort of their house since last summer. They observed that the house was
much slower to heat up during the day provided the windows were closed to prevent the hot
breeze from blowing in. If they left the house in the morning and returned at lunchtime it was
much cooler than it was prior to roof installation. The resident reported that their most recent
energy bill was on average $4 a day less than what it had been during the same period last year.
The resident also decided to get his shed painted at the same time as the house roof was
painted. The resident reported that the temperature difference was particularly apparent in the
shed. The resident uses the shed to house a model railway set and spends many hours there
during the day, despite the fact that the shed was very hot and un-airconditioned. They were
certain that it was now much cooler and more comfortable thanks to the cool roof, and many of
the resident’s friends had commented on the difference.
17.8
15.5 16.8
13.4 14.9
15.7 15.8
0
2
4
6
8
10
12
14
16
18
20
3rd
Qtr 2
00
9
4th
Qtr 2
00
9
1st Q
tr 20
10
2n
d Q
tr 20
10
3rd
Qtr 2
01
0
4th
Qtr 2
01
0
1st Q
tr 20
11
2n
d Q
tr 20
11
3rd
Qtr 2
01
1
4th
Qtr 2
01
1
1st Q
tr 20
12
2n
d Q
tr 20
12
3rd
Qtr 2
01
2
4th
Qtr 2
01
2
1st Q
tr 20
13
Ene
rgy
con
sum
pti
on
(kW
h)
Dwelling F - T11 Electricity Consumption (average kWh/day)
After Before

Townsville CitySolar Community Capacity Building Program
Monitoring and Evaluation of ‘Cool Roofs’ Community Pilot Program
Page 42 of 80
The resident decided to get a cool roof because the original (white) roof was deteriorating and
the resident reported that that they felt the internal temperature of the house was increasing over
time as the surface gradually deteriorated. They had previously considered getting a cool roof
prior to hearing about the pilot program but found the initial quotes unaffordable. The discounted
price was therefore a major factor that influenced their decision to participate in the program.
The resident stated that the new roof has definitely improved the look of their house. They were
happy with the professionalism of the contractor and would recommend cool roofs to their family
and friends.
Participant Testimonial
The participant declined to provide a testimonial

Townsville CitySolar Community Capacity Building Program
Monitoring and Evaluation of ‘Cool Roofs’ Community Pilot Program
Page 43 of 80
Dwelling G (a raised timber house in Rasmussen)
Background Information
Dwelling G is a raised timber Queenslander originally with white Colorbond roof in Rasmussen.
The cool roof coating was applied on 20/02/2012 and 21/02/2012. A summary of the dwelling
characteristics is presented in Table 15 below.
Table 15: Building and roof profile for Dwelling G
Dwelling G - House and roof characteristics
Type House (Queenslander)
Suburb Rasmussen
Roof materials Colorbond
Original roof colour White, poor condition
Roof pitch n/a
Insulation n/a
Extent of shade n/a
Levels One
Air-conditioned Yes, 4 in total
Temperature Performance Outcome
Figure 23 below shows a comparison of temperature data before and after the application of the
cool roof coating. Two sensors were installed in the dwelling; one in the roof cavity and one in an
internal un-conditioned space. Temperature data logging began on 10/02/2012 and the cool roof
coating was applied on 20/02/2012 and 21/02/2012.
Figure 23: Dwelling G - Temperature readings before and after cool roof painting
10
15
20
25
30
35
40
45
50
55
10
15
20
25
30
35
40
451
3/2
/20
12
14
/2/2
01
2
15
/2/2
01
2
16
/2/2
01
2
17
/2/2
01
2
18
/2/2
01
2
19
/2/2
01
2
20
/2/2
01
2
21
/2/2
01
2
22
/2/2
01
2
23
/2/2
01
2
24
/2/2
01
2
25
/2/2
01
2
26
/2/2
01
2
27
/2/2
01
2
28
/2/2
01
2
So
lar E
xp
osu
re (M
J/m
2)
Te
mp
era
ture
(°C
)
Dwelling G - Temperature
InternalTemperature(°C)
RoofTemperature(°C)
AmbientTemperature(°C)
SolarExposure(MJ/m2)
After Before

Townsville CitySolar Community Capacity Building Program
Monitoring and Evaluation of ‘Cool Roofs’ Community Pilot Program
Page 44 of 80
Comparing two similar days with similar ambient temperature, solar insolation, and precipitation,
the cool roof coating has reduced maximum roof cavity temperatures by 9.5°C and maximum
internal temperatures by 2.5°C (see Table 16 below). Average daytime roof cavity temperatures
were reduced by 6.8°C and average daytime internal temperatures by 1.5°C. Note that the
ambient temperature on the date used for comparison after application of cool roof (23/02/2012)
had a maximum temperature 0.3°C warmer than the baseline date (18/02/2012), and this may
have reduced the measured cooling effect. However, despite the ‘after’ date being 0.3°C
warmer, internal temperatures were still significantly cooler than previously.
Table 16: Dwelling G – Summary of cool roof performance, comparing two similar days
Comparison of two similar days
Before After
Difference
18/02/12 23/02/12
Maximum roof cavity temperature; ˚C 40.1 30.6 -9.5
Average daytime roof cavity temperature; ˚C (9am-9pm) 35.3 28.5 -6.8
Maximum internal temperature; ˚C 33.6 31.1 -2.5
Average daytime internal temperature; ˚C, (9am-9pm) 31.3 29.8 -1.5
Daily solar exposure; MJ/m2 24.5 18.1 -6.4
Maximum ambient temperature; ˚C 31.6 31.9 0.3
Precipitation (mm) 0.0 0.0 0
Average wind speed (km/h) 23.5 14.8 -8.68
The cool roof has significantly reduced roof cavity and internal house temperatures. Comparing
temperature data in the dwelling with ambient temperature data before and after application of
the cool roof coating it can be seen that roof cavity temperatures were previously on average 8.8
˚C hotter than ambient conditions. Roof cavity temperatures after the cool roof were reduced
significantly, averaging 1.1˚C cooler than ambient temperatures (see Figure 24), resulting in an
average temperature reduction of approximately 9.9˚C.
Figure 24: Dwelling G - Roof cavity temperature rise above ambient conditions
Similarly, the cool roof has had a significant impact on maximum internal temperatures. Internal
house temperatures previously averaged 1.84˚C hotter than ambient conditions prior to the cool
roof, but were reduced to an average of 0.28˚C cooler than ambient conditions (see Figure 25),
-4
-2
0
2
4
6
8
10
12
16
/02
/12
17
/02
/12
18
/02
/12
19
/02
/12
20
/02
/12
21
/02
/12
22
/02
/12
23
/02
/12
24
/02
/12
25
/02
/12
26
/02
/12
Te
mp
era
ture
ris
e (
°C)
Dwelling G - Roof cavity temperature rise above ambient
After Before

Townsville CitySolar Community Capacity Building Program
Monitoring and Evaluation of ‘Cool Roofs’ Community Pilot Program
Page 45 of 80
resulting in an average maximum temperature reduction of approximately 2.1˚C relative to
ambient temperatures.
Figure 25: Dwelling G - Internal temperature rise above ambient conditions
Energy Consumption
The cool roof coating was applied during Q2 2012. Q1 and Q2 were chosen for analysis as
these two quarters are most representative of the summer cooling-demand period for this
dwelling. Q1 covers the period mid-October to mid-January (with the exception of Q1 2013
where the billing period was mid-September to mid-December); Q2 covers the period mid-
January to mid-April. An average kWh/day figure was determined by averaging the total energy
consumption over the total number of days in these two quarters. At the time of writing Q2 2013
data was not available and therefore only Q1 2013 data was used for this summer period.
Average daily electricity demand prior to application of the cool roof product was 31.2 kWh/day
in the 2009/2010 summer period, and 30.6 kWh/day in the 2010/2011 summer period. Following
the application of the cool roof product, average daily electricity consumption has fallen to 12.5
kWh/day in Q1 2013 (see Figure 26). The 2011/2012 summer period data, which averaged 33.8
kWh/day has not been considered as the cool roof was applied within these months.
For the purposes of this analysis, the 2010-11 summer period has been chosen as the baseline
period for comparison. Comparing electricity consumption data after application of the cool roof
product with the 2010-11 baseline, this dwelling has achieved a reduction in average daily
energy consumption of approximately 59 per cent.
-1.5
-1
-0.5
0
0.5
1
1.5
2
2.5
16
/02
/12
17
/02
/12
18
/02
/12
19
/02
/12
20
/02
/12
21
/02
/12
22
/02
/12
23
/02
/12
24
/02
/12
25
/02
/12
26
/02
/12
Te
mp
era
ture
ris
e (
°C)
Dwelling G - Internal temperature rise above ambient
Before After
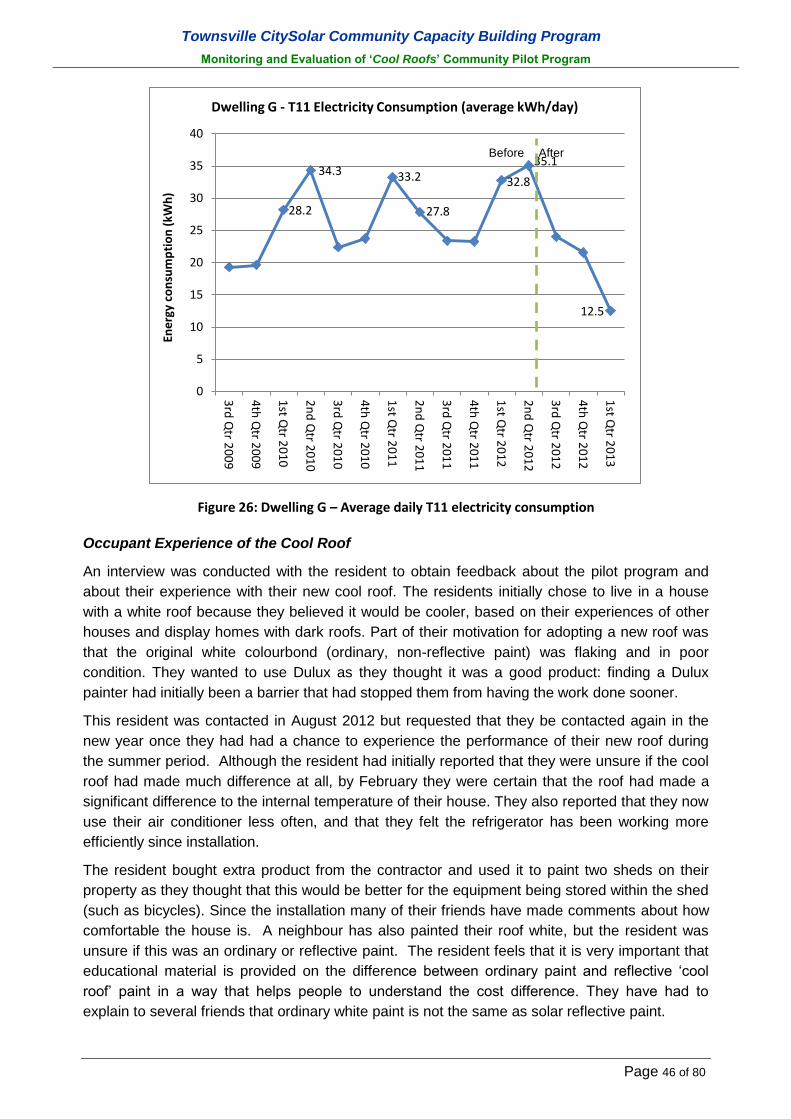
Townsville CitySolar Community Capacity Building Program
Monitoring and Evaluation of ‘Cool Roofs’ Community Pilot Program
Page 46 of 80
Figure 26: Dwelling G – Average daily T11 electricity consumption
Occupant Experience of the Cool Roof
An interview was conducted with the resident to obtain feedback about the pilot program and
about their experience with their new cool roof. The residents initially chose to live in a house
with a white roof because they believed it would be cooler, based on their experiences of other
houses and display homes with dark roofs. Part of their motivation for adopting a new roof was
that the original white colourbond (ordinary, non-reflective paint) was flaking and in poor
condition. They wanted to use Dulux as they thought it was a good product: finding a Dulux
painter had initially been a barrier that had stopped them from having the work done sooner.
This resident was contacted in August 2012 but requested that they be contacted again in the
new year once they had had a chance to experience the performance of their new roof during
the summer period. Although the resident had initially reported that they were unsure if the cool
roof had made much difference at all, by February they were certain that the roof had made a
significant difference to the internal temperature of their house. They also reported that they now
use their air conditioner less often, and that they felt the refrigerator has been working more
efficiently since installation.
The resident bought extra product from the contractor and used it to paint two sheds on their
property as they thought that this would be better for the equipment being stored within the shed
(such as bicycles). Since the installation many of their friends have made comments about how
comfortable the house is. A neighbour has also painted their roof white, but the resident was
unsure if this was an ordinary or reflective paint. The resident feels that it is very important that
educational material is provided on the difference between ordinary paint and reflective ‘cool
roof’ paint in a way that helps people to understand the cost difference. They have had to
explain to several friends that ordinary white paint is not the same as solar reflective paint.
28.2
34.3 33.2
27.8
32.8
35.1
12.5
0
5
10
15
20
25
30
35
40
3rd
Qtr 2
00
9
4th
Qtr 2
00
9
1st Q
tr 20
10
2n
d Q
tr 20
10
3rd
Qtr 2
01
0
4th
Qtr 2
01
0
1st Q
tr 20
11
2n
d Q
tr 20
11
3rd
Qtr 2
01
1
4th
Qtr 2
01
1
1st Q
tr 20
12
2n
d Q
tr 20
12
3rd
Qtr 2
01
2
4th
Qtr 2
01
2
1st Q
tr 20
13
Ene
rgy
con
sum
pti
on
(kW
h)
Dwelling G - T11 Electricity Consumption (average kWh/day)
After Before

Townsville CitySolar Community Capacity Building Program
Monitoring and Evaluation of ‘Cool Roofs’ Community Pilot Program
Page 47 of 80
The resident would recommend cool roofs to friends/family and stated they would consider
installing a cool roof if they moved to a new house. The resident believes that cool roofs make a
lot of sense in Townsville, and were hopeful that council might encourage the uptake of cool
roofs in the future and to make it a mandatory requirement for new houses to have a cool roof.
Participant Testimonial
“It definitely works! When you walk in the door when you get home it no longer feels like walking
into an oven – the wall of hot air has gone. It was worth the money. I hope more people get a
cool roof!” [Verbal confirmation received. Awaiting written confirmation]
Townsville CitySolar Community Capacity Building Program
Monitoring and Evaluation of ‘Cool Roofs’ Community Pilot Program
Page 48 of 80
Dwelling H (a low-set brick house in Kelso)
Background Information
Dwelling H is a low-set brick house with a brown tin roof in Kelso. The cool roof coating was
applied on 09/11/2011 and 10/11/2011. A summary of the dwelling characteristics is presented
in Table 17 below.
Table 17: Building and roof profile for Dwelling H
Dwelling H - House and roof characteristics
Type House (Low-set brick)
Suburb Kelso
Roof materials Tin
Original roof colour Brown
Roof pitch n/a
Insulation Yes
Extent of shade None
Levels One
Air-conditioned Yes
Temperature Performance Outcome
Temperature data for Dwelling H is not available. The resident was a private customer of one of
the painters who was approached several months after their roof was painted to ask if they
would be willing to contribute to the pilot program by granting access to energy consumption
data and providing feedback on their experience with their new cool roof.
Energy Consumption
The cool roof coating was applied during Q1 2012. Q1 and Q2 were chosen for analysis as
these two quarters are most representative of the summer cooling-demand period for this
dwelling. Q1 covers the period mid-October to mid-January; Q2 covers the period mid-January
to mid-April. An average kWh/day figure was determined by averaging the total energy
consumption over the total number of days in these two quarters. At the time of writing, however,
Q2 2013 data was not available and therefore only Q1 2013 data was used for this summer
period.
Average daily electricity demand prior to application of the cool roof product was 18.1 kWh/day
in the 2009/2010 summer period, and 16.6 kWh/day in the 2010/2011 summer period. Following
the application of the cool roof product, average daily electricity consumption has fallen to 13.3
kWh/day in Q1 2013 (see Figure 27). The 2011/2012 summer period data, which averaged 16.2
kWh/day has not been considered as the cool roof was applied within these months.
For the purposes of this analysis, the 2010-11 summer period has been chosen as the baseline
period for comparison. Comparing electricity consumption data after application of the cool roof
product with the 2010-11 baseline, this dwelling has achieved a reduction in average daily
energy consumption of approximately 19 per cent.
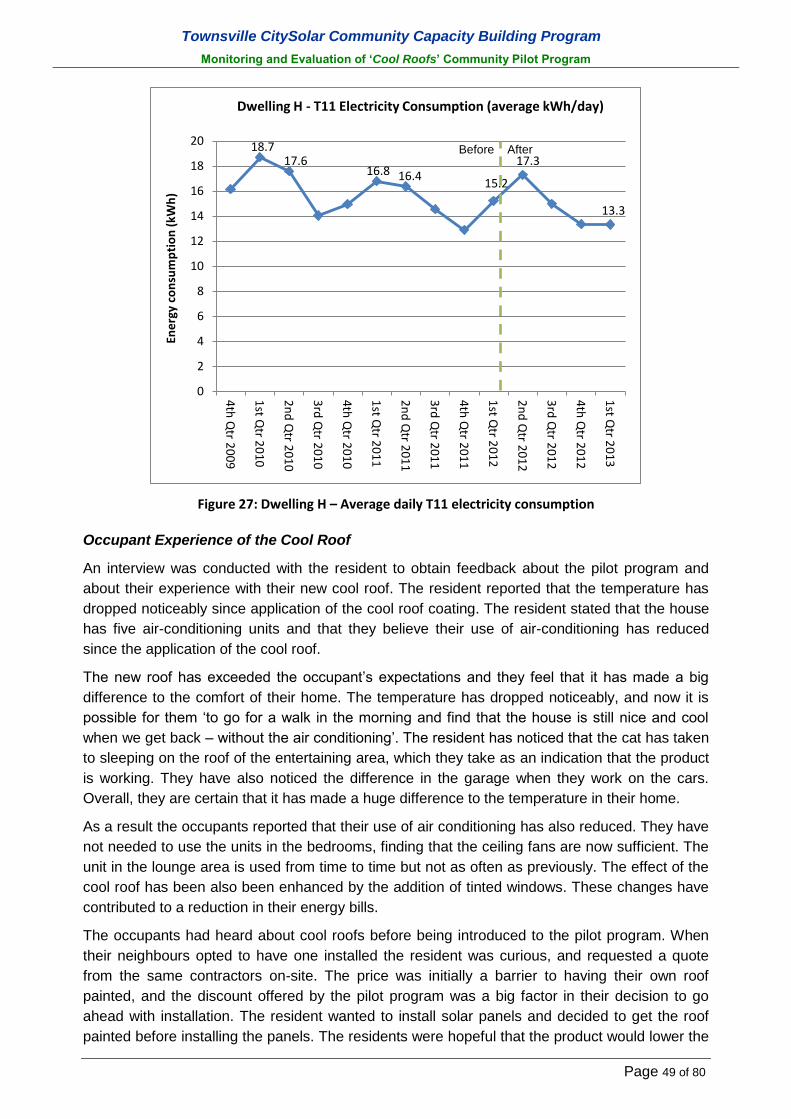
Townsville CitySolar Community Capacity Building Program
Monitoring and Evaluation of ‘Cool Roofs’ Community Pilot Program
Page 49 of 80
Figure 27: Dwelling H – Average daily T11 electricity consumption
Occupant Experience of the Cool Roof
An interview was conducted with the resident to obtain feedback about the pilot program and
about their experience with their new cool roof. The resident reported that the temperature has
dropped noticeably since application of the cool roof coating. The resident stated that the house
has five air-conditioning units and that they believe their use of air-conditioning has reduced
since the application of the cool roof.
The new roof has exceeded the occupant’s expectations and they feel that it has made a big
difference to the comfort of their home. The temperature has dropped noticeably, and now it is
possible for them ‘to go for a walk in the morning and find that the house is still nice and cool
when we get back – without the air conditioning’. The resident has noticed that the cat has taken
to sleeping on the roof of the entertaining area, which they take as an indication that the product
is working. They have also noticed the difference in the garage when they work on the cars.
Overall, they are certain that it has made a huge difference to the temperature in their home.
As a result the occupants reported that their use of air conditioning has also reduced. They have
not needed to use the units in the bedrooms, finding that the ceiling fans are now sufficient. The
unit in the lounge area is used from time to time but not as often as previously. The effect of the
cool roof has been also been enhanced by the addition of tinted windows. These changes have
contributed to a reduction in their energy bills.
The occupants had heard about cool roofs before being introduced to the pilot program. When
their neighbours opted to have one installed the resident was curious, and requested a quote
from the same contractors on-site. The price was initially a barrier to having their own roof
painted, and the discount offered by the pilot program was a big factor in their decision to go
ahead with installation. The resident wanted to install solar panels and decided to get the roof
painted before installing the panels. The residents were hopeful that the product would lower the
18.7 17.6
16.8 16.4 15.2
17.3
13.3
0
2
4
6
8
10
12
14
16
18
20
4th
Qtr 2
00
9
1st Q
tr 20
10
2n
d Q
tr 20
10
3rd
Qtr 2
01
0
4th
Qtr 2
01
0
1st Q
tr 20
11
2n
d Q
tr 20
11
3rd
Qtr 2
01
1
4th
Qtr 2
01
1
1st Q
tr 20
12
2n
d Q
tr 20
12
3rd
Qtr 2
01
2
4th
Qtr 2
01
2
1st Q
tr 20
13
Ene
rgy
con
sum
pti
on
(kW
h)
Dwelling H - T11 Electricity Consumption (average kWh/day)
After Before

Townsville CitySolar Community Capacity Building Program
Monitoring and Evaluation of ‘Cool Roofs’ Community Pilot Program
Page 50 of 80
temperatures inside their home but they were also mindful about roof repairs: it was important to
them that the roof was properly maintained and inspected prior to cyclone season for insurance
purposes. They also wanted to install solar panels and thought that this should be done after the
roof was painted. The occupants are satisfied with this decision as they have since heard that
the cool roof may contribute to making their solar system more efficient. They eventually opted
to have three surfaces painted: the main roof of the house, the garage roof, and the outdoor
entertaining area.
The occupants feel that the new roof has improved the look of their house. They were initially
concerned that it might cause a glare problem for their neighbour, who’s two storey dwelling
looks out over the roof. The neighbours did comment on the roof, although this may have been
prompted by the visual change from brown to white rather than because of a specific issue with
glare. The occupants no longer believe that this is an issue of concern, stating that they ‘Feel
like the roof is less reflective now than when it was first treated, but perhaps that is just everyone
getting used to it’. They have also commented that ‘white is probably a more acceptable colour
choice these days’.
The residents have stated that they ‘would definitely recommend it to anyone, if they could afford
it’. They feel that it has increased the life of their roofing and been a worthwhile investment. They
would also consider having one installed if they moved to a new address, particularly if the roof
needed repairs. The residents were positive about the pilot program however they did have
some concerns with the work done by the contractors arising from overspray. They raised their
concerns with the tradespeople who re-visited the house to remedy the problem.
Participant Testimonial
“We would recommend it to everyone. If you can afford to have the work done then it’s well
worth the investment – it cuts down on electricity costs, makes a difference to cooling, and it’s
also a good chance for people to have their roof checked out and make sure it’s properly
maintained”.

Townsville CitySolar Community Capacity Building Program
Monitoring and Evaluation of ‘Cool Roofs’ Community Pilot Program
Page 51 of 80
Dwelling I (a concrete block house in Kirwan)
Background Information
Dwelling I is a single level concrete block house with a brown/red corrugated iron roof in Kirwan.
The cool roof coating was applied on 26/10/2011. A summary of the dwelling characteristics is
presented in Table 18 below.
Table 18: Building and roof profile for Dwelling I
Dwelling I - House and roof characteristics
Type House (Concrete block)
Suburb Kirwan
Roof materials Corrugated iron
Original roof colour Brown/red
Roof pitch n/a
Insulation n/a
Extent of shade None
Levels One
Air-conditioned Yes
Temperature Performance Outcome
Temperature data for Dwelling I is not available. The resident was a private customer of one of
the painters who was approached several months after their roof was painted to ask if they
would be willing to contribute to the pilot program by granting access to energy consumption
data and providing feedback on their experience with their new cool roof.
Energy Consumption
The cool roof coating was applied during Q4 2011. Q1 was chosen for analysis as this quarter is
most representative of the summer cooling-demand period for this dwelling. Q1 covers the
period late-November to early-March. An average kWh/day figure was determined by averaging
the total energy consumption over the total number of days in this quarter. At the time of writing,
Q1 2013 data was not available.
Average daily electricity demand prior to application of the cool roof product was 56.5 kWh/day
in the 2009/2010 summer period, and 47.9 kWh/day in the 2010/2011 summer period. Following
the application of the cool roof product, average daily electricity consumption has fallen to 35.0
kWh/day (see Figure 28).
For the purposes of this analysis, the 2010-11 summer period has been chosen as the baseline
period for comparison. Comparing electricity consumption data after application of the cool roof
product with the 2010-11 baseline, this dwelling has achieved a reduction in average daily
energy consumption of approximately 27 per cent.

Townsville CitySolar Community Capacity Building Program
Monitoring and Evaluation of ‘Cool Roofs’ Community Pilot Program
Page 52 of 80
Figure 28: Dwelling I – Average daily T11 electricity consumption
Note: The residents of this dwelling reported making a conscious decision to reduce their use of
air-conditioning after noticing the large impact it was having on their energy bill. The resident
also reported replacing their electric storage hot water system with an instantaneous system at
approximately the same time as the cool roof application, however as hot water systems are
typically on an off-peak tariff (such as Tariff 33) this would not be reflected in the above energy
consumption figures, which consider only Tariff 11 electricity consumption.
Occupant Experience of the Cool Roof
An interview was conducted with the resident to obtain feedback about the pilot program and
about their experience with their new cool roof. The resident reported that the cool roof is
performing better than expected and has substantially reduced internal temperatures, making
the house much more comfortable to live in. The house has four air conditioning units, which the
residents now report using on fewer days throughout the week however this is partly because
they made a conscious decision to reduce air-conditioning use after noting the large impact it
was having on their energy bill. Improvements were made to the hot water system roughly
around the time that the roof was treated which also contributed to a reduction in their energy
use (however the electricity data analysis above accounts for this by considering only Tariff 11
consumption).
The resident decided to get a cool roof to reduce the temperature inside the house. A cyclone
knocked down a shade tree that previously provided shade and cooling to the house, and the
resident reported noticing that the house had become much hotter since the tree was gone.
Furthermore the original roof colour was a dark mission brown; a poorly performing colour in
Townsville. The house has no ceiling insulation, owing to lack of space in the roof cavity. The
combination of these factors meant that a cool roof had the potential to make a substantial
improvement for this dwelling.
56.5
47.9
35.0
0
10
20
30
40
50
60
4th
Qtr 2
00
9
1st Q
tr 20
10
2n
d Q
tr 20
10
3rd
Qtr 2
01
0
4th
Qtr 2
01
0
1st Q
tr 20
11
2n
d Q
tr 20
11
3rd
Qtr 2
01
1
4th
Qtr 2
01
1
1st Q
tr 20
12
2n
d Q
tr 20
12
3rd
Qtr 2
01
2
4th
Qtr 2
01
2En
erg
y co
nsu
mp
tio
n (
kWh
)
Dwelling I - T11 Electricity Consumption (average kWh/day)
After Before

Townsville CitySolar Community Capacity Building Program
Monitoring and Evaluation of ‘Cool Roofs’ Community Pilot Program
Page 53 of 80
The resident feels that the new roof has improved the look of the house now that they have
become accustomed to the colour. They would recommend a cool roof to friends and family, and
some have since gone on to get a cool roof themselves. One of their neighbors asked about the
roof after installation. They reported that they would consider getting a cool roof if they moved to
a new address, and were ‘very happy’ both with the effectiveness of the roofing and with the
service provided by the contractors.
Participant Testimonial
The participant declined to provide a testimonial

Townsville CitySolar Community Capacity Building Program
Monitoring and Evaluation of ‘Cool Roofs’ Community Pilot Program
Page 54 of 80
Dwelling J (a timber house in North Ward)
Background Information
Dwelling J is a single storey timber Queenslander style house located in North Ward. It is low set
at the back and high set at the front. The original roof was unpainted corrugated iron with partial
shading at different times of day, and also was shaded by photovoltaic panels and a solar hot
water system. The house has a roof with many angles, and minimal, patchy insulation. The cool
roof coating was applied on 02/07/2012 and 3/07/2012. A summary of the dwelling
characteristics is presented in Table 19 below.
Table 19: Building and roof profile for Dwelling J
Dwelling J - House and roof characteristics
Type House (Queenslander)
Suburb Kirwan
Roof materials Corrugated iron
Original roof colour Unpainted
Roof pitch Steep
Insulation Partial (poor quality)
Extent of shade Partial
Levels One
Air-conditioned Yes
Temperature Performance Outcome
Figure 29 below shows a comparison of temperature data before and after the application of the
cool roof coating. Two sensors were installed in the dwelling; one in the roof cavity and one in an
internal un-conditioned space. Temperature data logging began on 05/06/2012 and the cool roof
coating was applied on 03/07/2012. The full series of ambient temperature data was not
available so maximum and minimum temperature data from the Bureau of Meteorology website
has been used for the period.
Figure 29: Dwelling J - Temperate readings before and after cool roof painting
0
10
20
30
40
50
60
0
5
10
15
20
25
30
28
/06
/12
29
/06
/12
30
/06
/12
1/0
7/1
2
2/0
7/1
2
3/0
7/1
2
4/0
7/1
2
5/0
7/1
2
6/0
7/1
2
7/0
7/1
2
8/0
7/1
2
9/0
7/1
2
10
/07
/12
Solar e
xpo
sure
(MJ/m
2)
Tem
pe
ratu
re (
C)
Dwelling J - Temperature
InternalTemperature(°C)
RoofTemperature(°C)
AmbientTemperature(°C)
After Before

Townsville CitySolar Community Capacity Building Program
Monitoring and Evaluation of ‘Cool Roofs’ Community Pilot Program
Page 55 of 80
Comparing two similar days with similar ambient temperature, solar insolation, and precipitation,
the cool roof coating has reduced maximum roof cavity temperatures by 0.6˚C and maximum
internal daytime temperatures by approximately 0.9°C (see Table 20 below). Average daytime
roof cavity temperatures were reduced by 0.7°C and average internal daytime temperatures
were reduced by 0.9°C. Note that the ambient temperature on the date used for comparison
after application of cool roof (07/07/2012) had a maximum temperature 0.5°C cooler than the
baseline date (30/06/2012), and this may have contributed to the measured cooling effect.
Table 20: Dwelling J - Summary of cool roof performance, comparing two similar days
Comparison of two similar days
Before After
Difference
30/06/2012 7/07/2012
Maximum roof cavity temperature; ˚C 23.3 22.7 -0.6
Average daytime roof cavity temperature; ˚C (9am-9pm) 22.4 21.8 -0.7
Maximum internal temperature; ˚C 23.8 22.9 -0.9
Average daytime internal temperature; ˚C, (9am-9pm) 22.8 21.8 -0.9
Daily solar exposure; MJ/m2 12.2 9.6 -2.6
Maximum ambient temperature; ˚C 24.6 24.1 -0.5
Precipitation (mm) 0.0 0.0 0.0
Average wind speed (km/h) n/a n/a n/a
As the roof was painted in winter, the temperature data is unlikely to show the full temperature
reduction benefit that could potentially be achieved during the summer cooling-demand period.
However, this data provides an indication of the performance of cool roofs in winter months.
Comparing temperature data in the dwelling with ambient temperature data before and after
application of the cool roof coating it can be seen that roof cavity temperatures were previously
on average 0.3˚C cooler than ambient conditions. Roof cavity temperatures after the cool roof
were reduced, averaging 1.5˚C cooler than ambient temperatures (see Figure 30), resulting in
an average temperature reduction of approximately 1.2˚C.
Figure 30: Dwelling J - Roof cavity temperature rise above ambient conditions
-3
-2
-1
0
1
2
3
29
/06
/12
30
/06
/12
1/0
7/1
2
2/0
7/1
2
3/0
7/1
2
4/0
7/1
2
5/0
7/1
2
6/0
7/1
2
7/0
7/1
2
Tem
pe
ratu
re r
ise
(°C
)
Dwelling J - Roof cavity temperature rise above ambient
After Before

Townsville CitySolar Community Capacity Building Program
Monitoring and Evaluation of ‘Cool Roofs’ Community Pilot Program
Page 56 of 80
Similarly, the cool roof has had an impact on maximum internal temperatures. Maximum internal
house temperatures previously averaged 0.1˚C warmer than ambient conditions prior to the cool
roof, but were reduced to an average of 2.1˚C cooler than ambient conditions (see Figure 31),
resulting in an average maximum temperature reduction of approximately 2.2˚C.
Figure 31: Dwelling J - Internal temperature rise above ambient conditions
Energy Consumption
The cool roof coating was applied during Q3 2012. Q1 and Q2 were chosen for analysis as
these two quarters are most representative of the summer cooling-demand period for this
dwelling. Q1 covers the period mid-October to mid-January; Q2 covers the period mid-January
to mid-April. An average kWh/day figure was determined by averaging the total energy
consumption over the total number of days in these two quarters. At the time of writing, however,
Q1 2010 and Q2 2013 data was not available and therefore only Q2 2010 and Q1 2013 data
was used for these respective summer periods.
Average daily electricity demand prior to application of the cool roof product was 7.1 kWh/day in
the 2009/2010 summer period, 7.8 kWh/day in the 2010/2011 summer period, and 6.9 kWh/day
in the 2011/2012 summer period. Following the application of the cool roof product, average
daily electricity consumption has fallen to 4.8 kWh/day in Q1 2013 (see Figure 32).
For the purposes of this analysis, the 2011-12 summer period has been chosen as the baseline
period for comparison. Comparing electricity consumption data after application of the cool roof
product with the 2011-12 baseline, this dwelling has achieved a reduction in average daily
energy consumption of approximately 31 per cent.
-4
-3
-2
-1
0
1
2
3
29
/06
/12
30
/06
/12
1/0
7/1
2
2/0
7/1
2
3/0
7/1
2
4/0
7/1
2
5/0
7/1
2
6/0
7/1
2
7/0
7/1
2
Tem
pe
ratu
re r
ise
(°C
)
Dwelling J - Internal temperature rise above ambient
After Before

Townsville CitySolar Community Capacity Building Program
Monitoring and Evaluation of ‘Cool Roofs’ Community Pilot Program
Page 57 of 80
Figure 32: Dwelling J – Average daily T11 electricity consumption
Occupant Experience of the Cool Roof
An interview was conducted with the resident to obtain feedback about the pilot program and
about their experience with their new cool roof. The occupant reported that the effectiveness of
their cool roof has been hard to judge. They are frequently away from the house, and when at
home they tend to spend a large portion of time on their recently renovated deck rather than
inside where the effect of the roof might be more apparent. Both the house and portions of the
roof are shaded by a leafy garden, which further cools the building. They were not large users of
energy to begin with and were conservative with their use of air-conditioning, hence they have
not noticed a significant difference with their energy bills. Nevertheless, the fact that the
occupant reported that their house has been just as comfortable as usual during a particularly
hot summer may be due to the moderating effects of the cool roof.
The roof of this dwelling had some rust and according to the resident was due for repair. They
had heard about cool roofs through personal contacts at council and had also visited a display
home that featured a cool roof product, however they needed time to think about the expense
involved before opting for treatment. They stated that the information they received at the
EcoFiesta was a factor in their eventual decision to have their own roof painted. For this
participant, the main motivations were both the maintenance of the roof and the heat. They had
noticed the temperatures increasing over a few years and preferred to leave the windows open
for fresh air rather than relying on air conditioning for cooling.
The occupant had some reservations about the choice of colour, stating that ‘white doesn’t really
match our colour scheme’. They felt they would have been more hesitant to proceed if their roof
was more visible to the street, however they have not found it particularly noticeable in the
months since installation. Despite their reservations about aesthetics, they stated that they
would certainly consider having a cool roof installed if they were to move to a new address. They
7.1
8.1
7.4 6.5
7.4
4.8
0
1
2
3
4
5
6
7
8
9
2n
d Q
tr 20
10
3rd
Qtr 2
01
0
4th
Qtr 2
01
0
1st Q
tr 20
11
2n
d Q
tr 20
11
3rd
Qtr 2
01
1
4th
Qtr 2
01
1
1st Q
tr 20
12
2n
d Q
tr 20
12
3rd
Qtr 2
01
2
4th
Qtr 2
01
2
1st Q
tr 20
13
Ene
rgy
con
sum
pti
on
(kW
h)
Dwelling J - T11 Electricity Consumption (average kWh/day)
After Before

Townsville CitySolar Community Capacity Building Program
Monitoring and Evaluation of ‘Cool Roofs’ Community Pilot Program
Page 58 of 80
felt that this would be an excellent option if the roof needed repairs, and that they would be likely
to incorporate a cool roof into a new building if they were starting from scratch. Overall, they
would consider a cool roof as one option amongst a suite of sustainability and energy efficiency
measures. They would also recommend it to their family and friends particularly if their roof
needed maintenance, and they “admire that it gives an opportunity for retrofitting which is more
affordable than installing an entirely new roof”. They were also very positive about the pilot
program, stating that they think it is ‘a great initiative’, and that receiving additional information
and a discount was a powerful motivator for Townsville residents to install a cool roof.
Participant Testimonial
"We were considering the options for insulation and maintenance on our roof when we were
attracted to the Townsville Solar City Cool Roof Program display at the annual Ecofiesta.
We decided that it was a good, cost-effective option, enabling us to 'retrofit' rather than replace
the roof entirely. We believe that the pre-treatment of the roofing iron plus the
protective/reflective coating has extended the life of our roof and will give us additional benefits
of cooling.
Our house is slightly elevated, well ventilated and surrounded by a shady garden, so it has
always been reasonably comfortable in hot weather. We extended and roofed the deck just prior
to painting the roof, enabling us to enjoy the benefits of outdoor living, more shade to the interior
and heat reflection from the roof.
Since painting the roof we haven't noticed a significant difference in the temperature on a daily
basis, but we have observed that the house does not heat up so much when locked up during
our absence, particularly in the hot summer. When opened up, it appears to cool down relatively
quickly.
We are very happy with the decision we made to sign on to the Townsville Solar City Cool Roof
Program, as one more step towards sustainable living. We commend the council for its
leadership with the Solar Cities program and the opportunities, education and encouragement if
provides to residents to promote sustainability."

Townsville CitySolar Community Capacity Building Program
Monitoring and Evaluation of ‘Cool Roofs’ Community Pilot Program
Page 59 of 80
Dwelling K (a single storey brick house in Deeragun)
Background Information
Dwelling K is a single storey brick house in Deeragun. The original roof was unpainted
corrugated iron. The cool roof coating was applied on 14/10/2011. A summary of the dwelling
characteristics is presented in Table 21 below.
Table 21: Building and roof profile for Dwelling K
Dwelling K - House and roof characteristics
Type House (Single storey brick)
Suburb Deeragun
Roof materials Corrugated iron
Original roof colour Unpainted
Roof pitch Steep
Insulation n/a
Extent of shade Negligible
Levels n/a
Air-conditioned n/a
Temperature Performance Outcome
Temperature data for Dwelling K is not available. The resident was a private customer of one of
the painters who was approached several months after their roof was painted to ask if they
would be willing to contribute to the pilot program by granting access to energy consumption
data and providing feedback on their experience with their new cool roof.
Energy Consumption
The cool roof coating was applied during Q4 2011. Q1 and Q2 were chosen for analysis as
these two quarters are most representative of the summer cooling-demand period for this
dwelling. Q1 covers the period mid-October to mid-January; Q2 covers the period mid-January
to mid-April. An average kWh/day figure was determined by averaging the total energy
consumption over the total number of days in these two quarters. At the time of writing, Q2 2013
data was not available and therefore only Q1 2013 data was used for this summer period.
Average daily electricity demand prior to application of the cool roof product was 10.4 kWh/day
in the 2009/2010 summer period, and 6.3 kWh/day in the 2010/2011 summer period. Following
the application of the cool roof product, average daily electricity consumption has fallen to 5.8
kWh/day in the 2011/2012 summer period, and 5.8 kWh/day in Q1 2013 (see Figure 33).
For the purposes of this analysis, the 2010-11 summer period has been chosen as the baseline
period for comparison. Comparing electricity consumption data after application of the cool roof
product with the 2010-11 baseline, this dwelling has achieved a reduction in average daily
energy consumption of approximately 7.9 per cent.
Analysing the 2012/13 summer period, it appears that the energy consumption reductions have
been approximately maintained. Comparing only Q1 figures after application of the cool roof,
average daily electricity consumption has increased very slightly from 5.6 kWh/day in Q1 2012 to
5.8 kWh/day in Q1 2013, representing an increase of 3.6 per cent. As this is a small increase of
only 0.2 kWh/day, energy use could be considered to have been approximately maintained.

Townsville CitySolar Community Capacity Building Program
Monitoring and Evaluation of ‘Cool Roofs’ Community Pilot Program
Page 60 of 80
Figure 33: Dwelling K – Average daily T11 electricity consumption
Occupant Experience of the Cool Roof
The resident of dwelling K requested not to be contacted for an interview.
9.8
11.0
6.1 6.4
5.6 6.1 5.8
0
2
4
6
8
10
12
3rd
Qtr 2
00
9
4th
Qtr 2
00
9
1st Q
tr 20
10
2n
d Q
tr 20
10
3rd
Qtr 2
01
0
4th
Qtr 2
01
0
1st Q
tr 20
11
2n
d Q
tr 20
11
3rd
Qtr 2
01
1
4th
Qtr 2
01
1
1st Q
tr 20
12
2n
d Q
tr 20
12
3rd
Qtr 2
01
2
4th
Qtr 2
01
2
1st Q
tr 20
13
Ene
rgy
con
sum
pti
on
(kW
h)
Dwelling K - T11 Electricty Consumption (average kWh/day)
After Before
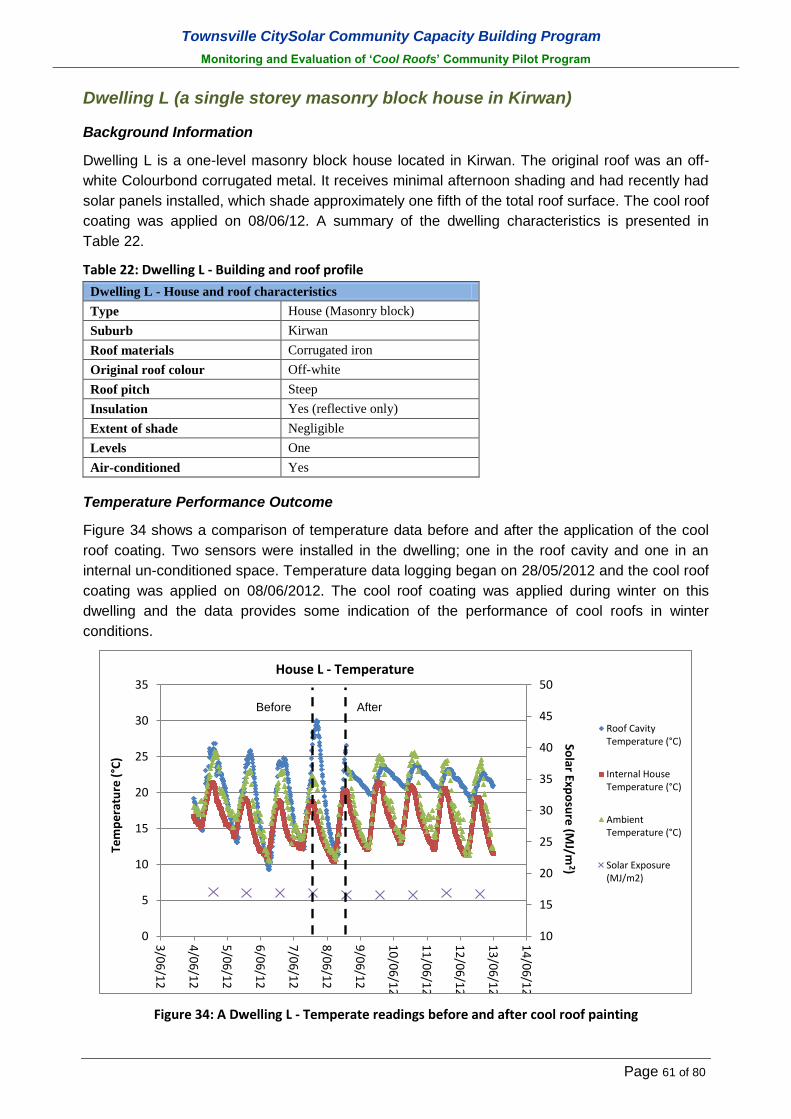
Townsville CitySolar Community Capacity Building Program
Monitoring and Evaluation of ‘Cool Roofs’ Community Pilot Program
Page 61 of 80
Dwelling L (a single storey masonry block house in Kirwan)
Background Information
Dwelling L is a one-level masonry block house located in Kirwan. The original roof was an off-
white Colourbond corrugated metal. It receives minimal afternoon shading and had recently had
solar panels installed, which shade approximately one fifth of the total roof surface. The cool roof
coating was applied on 08/06/12. A summary of the dwelling characteristics is presented in
Table 22.
Table 22: Dwelling L - Building and roof profile
Dwelling L - House and roof characteristics
Type House (Masonry block)
Suburb Kirwan
Roof materials Corrugated iron
Original roof colour Off-white
Roof pitch Steep
Insulation Yes (reflective only)
Extent of shade Negligible
Levels One
Air-conditioned Yes
Temperature Performance Outcome
Figure 34 shows a comparison of temperature data before and after the application of the cool
roof coating. Two sensors were installed in the dwelling; one in the roof cavity and one in an
internal un-conditioned space. Temperature data logging began on 28/05/2012 and the cool roof
coating was applied on 08/06/2012. The cool roof coating was applied during winter on this
dwelling and the data provides some indication of the performance of cool roofs in winter
conditions.
Figure 34: A Dwelling L - Temperate readings before and after cool roof painting
10
15
20
25
30
35
40
45
50
0
5
10
15
20
25
30
35
3/0
6/1
2
4/0
6/1
2
5/0
6/1
2
6/0
6/1
2
7/0
6/1
2
8/0
6/1
2
9/0
6/1
2
10
/06
/12
11
/06
/12
12
/06
/12
13
/06
/12
14
/06
/12
Solar Exp
osu
re (M
J/m2)
Tem
pe
ratu
re (
°C)
House L - Temperature
Roof CavityTemperature (°C)
Internal HouseTemperature (°C)
AmbientTemperature (°C)
Solar Exposure(MJ/m2)
After Before

Townsville CitySolar Community Capacity Building Program
Monitoring and Evaluation of ‘Cool Roofs’ Community Pilot Program
Page 62 of 80
Comparing two similar days with similar ambient temperature, solar insolation, and precipitation,
the cool roof coating has reduced maximum roof cavity temperatures by 2.6°C, however
maximum internal temperatures actually increased by 1.5°C (see Table 23 below). Average
daytime roof cavity temperatures decreased by 0.1°C and average daytime internal
temperatures increased by 1.3°C. Note that the date used for comparison after application of
cool roof (11/06/2012) had a maximum temperature 1.3°C warmer than the baseline date
(05/06/2012) which may partially account for the internal temperatures being 1.5°C after the cool
roof was applied.
Table 23: Dwelling L – Summary of cool roof performance, comparing two similar days
Comparison of two similar days
Before After Difference
05/06/12 11/06/12
Maximum roof cavity temperature; ˚C 25.8 23.2 -2.6
Average roof cavity temperature; ˚C, (9am-9pm) 22.4 22.3 -0.1
Maximum internal temperature; ˚C 19.1 20.6 1.5
Average internal temperature; ˚C, (9am-9pm) 17.0 18.3 1.3
Daily solar exposure; MJ/m2 16.9 16.8 -0.1
Maximum ambient temperature; ˚C 23.1 24.4 1.3
Precipitation (mm) 0.0 0.0 0.0
Average wind speed (km/h) 19.2 9.6 -9.5
The cool roof has reduced roof cavity temperatures. Comparing temperature data in the dwelling
with ambient temperature data before and after application of the cool roof coating it can be
seen that roof cavity temperatures were previously on average 1.87˚C warmer than ambient
conditions. Roof cavity temperatures after the cool roof were reduced, averaging 1.65˚C cooler
than ambient temperatures (see Figure 35), resulting in an average temperature reduction of
approximately 3.5˚C.
Figure 35: Dwelling L - Roof cavity temperature rise above ambient conditions
The cool roof has had a minimal impact on maximum internal temperatures. Maximum internal
house temperatures previously averaged 4.13˚C cooler than ambient conditions prior to the cool
-4
-2
0
2
4
6
8
10
4/0
6/1
2
5/0
6/1
2
6/0
6/1
2
7/0
6/1
2
8/0
6/1
2
9/0
6/1
2
10
/06
/12
11
/06
/12
12
/06
/12
Tem
pe
ratu
re r
ise
(°C
)
Dwelling L - Roof cavity temperature rise above ambient
After Before

Townsville CitySolar Community Capacity Building Program
Monitoring and Evaluation of ‘Cool Roofs’ Community Pilot Program
Page 63 of 80
roof, and were reduced slightly to an average of 4.4˚C cooler than ambient conditions (see
Figure 36), resulting in an average maximum temperature reduction of approximately 0.3˚C.
Figure 36: Dwelling L - Internal temperature rise above ambient conditions
Electricity Consumption
The cool roof coating was applied during Q3 2012. Q4 and Q1 were chosen for analysis as
these two quarters are most representative of the summer cooling-demand period for this
dwelling. Q4 covers the period mid-August to mid-November; Q1 covers the period mid-
November to mid-February. An average kWh/day figure was determined by averaging the total
energy consumption over the total number of days in these two quarters.
Average daily electricity demand prior to application of the cool roof product was 22.3 kWh/day
in the 2010/2011 summer period, and 18.3 kWh/day in the 2011/2012 summer period. Following
the application of the cool roof product, average daily electricity consumption has fallen to 8.5
kWh/day in the 2012/2013 summer period (see Figure 37).
For the purposes of this analysis, the 2011-12 summer period has been chosen as the baseline
period for comparison. Comparing electricity consumption data after application of the cool roof
product with the 2011-12 baseline, this dwelling has achieved a reduction in average daily
energy consumption of approximately 53 per cent.
Note: This dwelling had solar panels installed during Q4 2012, however the energy produced by
the solar panels has been removed from the analysis to ensure only T11 electricity consumption
is considered. The addition of solar panels has not therefore contributed to the electricity
reduction figures presented here.
-6
-5
-4
-3
-2
-1
0
1
2
3
4/0
6/1
2
5/0
6/1
2
6/0
6/1
2
7/0
6/1
2
8/0
6/1
2
9/0
6/1
2
10
/06
/12
11
/06
/12
12
/06
/12
Tem
pe
ratu
re R
ise
(°C
) Dwelling L - Internal temperature rise above ambient
After Before

Townsville CitySolar Community Capacity Building Program
Monitoring and Evaluation of ‘Cool Roofs’ Community Pilot Program
Page 64 of 80
Figure 37: Dwelling L – Average daily T11 electricity consumption
Occupant Experience of the Cool Roof
An interview was conducted with the resident to obtain feedback about the pilot program and
about their experience with their new cool roof. After summer, the occupant reported a
noticeable difference in internal temperatures. The house was generally cooler, and much
slower to heat up particularly when it has been closed during the day. On one 36 degree day the
resident reported that it was only 28 degrees inside - without the air conditioning. They feel that
the effectiveness of the cool roof may have been enhanced by the new solar panels, which
provide partial shading. The occupant reported that the interior temperature felt cooler in winter
than in previous years.
For this occupant the catalyst for having the roof treated was the decision to have solar panels
installed, thus necessitating having the existing, worn coating repaired before the panels arrived.
They also said that the previously prohibitive cost had been lowered, making it a more affordable
option.
The neighbors, whose houses are in need of similar renovations, appreciated that the new paint
did not reflect glare as the previous coating had. The resident said that they would definitely
recommend cool roofs to them, and would definitely consider having one installed if they were to
move in the future. The occupant was keen to note that there is an excellent opportunity for
manufacturers to provide this kind of coating as an option for all new roofs. Furthermore, they
felt that it should be mandated in building legislation and that all new buildings should be
required to have this sort of coating on their roofs. They feel that cool roofs are particularly
appropriate for Townsville, stating that “it’s a smart move for everybody to have (these systems)
in place.”
22.3 22.2 20.9
15.9
5.8
11.1
0
5
10
15
20
25
2n
d Q
tr 20
10
3rd
Qtr 2
01
0
4th
Qtr 2
01
0
1st Q
tr 20
11
2n
d Q
tr 20
11
3rd
Qtr 2
01
1
4th
Qtr 2
01
1
1st Q
tr 20
12
2n
d Q
tr 20
12
3rd
Qtr 2
01
2
4th
Qtr 2
01
2
1st Q
tr 20
13
Ene
rgy
con
sum
pti
on
(kW
h)
Dwelling L - T11 Energy Consumption (average kWh/day)
After Before

Townsville CitySolar Community Capacity Building Program
Monitoring and Evaluation of ‘Cool Roofs’ Community Pilot Program
Page 65 of 80
Participant Testimonial – still needs confirmation
“I do think that it is a good thing; it all adds to the reduction of power use, as does solar; I
honestly believe that there are marketing opportunities available for the future, especially in
building new houses, and these could be included in regulation, such as making it mandatory for
new houses to have this kind of paint used on the roof...” “...It’s a smart move for everybody to
have (these systems) in place.” [Verbal confirmation received. Awaiting written confirmation]

Townsville CitySolar Community Capacity Building Program
Monitoring and Evaluation of ‘Cool Roofs’ Community Pilot Program
Page 66 of 80
Dwelling M (a high-set timber house in Kelso)
Background Information
Dwelling M is a high set timber house located in Kelso. The original roof was an unpainted,
corrugated iron roof receiving no shade during the day. The cool roof coating was on
13/10/2011. A summary of the dwelling characteristics is presented in Table 24.
Table 24: Dwelling M - Building and roof profile
Dwelling M - House and roof characteristics
Type House (High set timber)
Suburb Kelso
Roof materials Corrugated iron
Original roof colour Unpainted
Roof pitch Moderate
Insulation n/a
Extent of shade None
Levels One
Air-conditioned Yes
Temperature Performance Outcome
Temperature data for Dwelling M is not available. The resident was a private customer of one of
the painters who was approached several months after their roof was painted to ask if they
would be willing to contribute to the pilot program by granting access to energy consumption
data and providing feedback on their experience with their new cool roof.
Electricity Consumption
The cool roof coating was applied during Q4 2011. Q1 and Q2 were chosen for analysis as
these two quarters are most representative of the summer cooling-demand period for this
dwelling. Q1 covers the period mid-October to mid-January; Q2 covers the period mid-January
to mid-April. An average kWh/day figure was determined by averaging the total energy
consumption over the total number of days in these two quarters. At the time of writing, Q2 2013
data was not available and therefore only Q1 2013 data was used for this summer period.
Average daily electricity demand prior to application of the cool roof product was 68.7 kWh/day
in the 2009/2010 summer period, and 55.0 kWh/day in the 2010/2011 summer period. Following
the application of the cool roof product, average daily electricity consumption has fallen to 32.5
kWh/day in the 2011/2012 summer period, and 33.0 kWh/day in Q1 2013 (see Figure 38).
For the purposes of this analysis, the 2010-11 summer period has been chosen as the baseline
period for comparison. Comparing electricity consumption data after application of the cool roof
product with the 2010-11 baseline, this dwelling has achieved a reduction in average daily
energy consumption of approximately 41 per cent (for the 2011/12 summer period).
Analysing the 2012/13 summer period, it appears that the energy consumption reductions have
been maintained, and have potentially reduced further. Comparing only Q1 figures after
application of the cool roof, average daily electricity consumption has fallen from 44.8 kWh/day
in Q1 2012 to 33.0 kWh/day in Q1 2013, representing a reduction of a further 26 per cent.

Townsville CitySolar Community Capacity Building Program
Monitoring and Evaluation of ‘Cool Roofs’ Community Pilot Program
Page 67 of 80
Figure 38: Dwelling M – Average daily T11 electricity consumption
Occupant Experience of the Cool Roof
An interview was conducted with the resident to obtain feedback about the pilot program and
about their experience with their new cool roof. The occupant reported that the roofing has made
a noticeable difference to the internal temperature. Since treatment the occupant has been
impressed with the effectiveness of the new roof, remarking that ‘it really works’ and that ‘it used
to be a lot hotter’. During the initial interview the occupant estimated that the cool roof had
cooled the house by around two or three degrees. The occupant reported that not only has it
made a noticeable difference to the internal temperature – thereby making the house more
comfortable – but they have also noted a reduction in their energy use. This is not an
insignificant result, given that the occupant does not feel that their habits have changed or that
they are being more mindful of their energy use.
The decision to install a cool roof was partly motivated by the fact that the roof already required
maintenance. His aim was to not only improve the look of the roof and protect it, but also to help
cool the house, which becomes very important during the hotter summer months.They found out
about the program through personal contacts who said that it was well worth the cost, and the
occupant felt that it sounded like ‘a good idea’. They also wanted to make their house cooler for
summer. They are also very pleased with the visual effect, stating that it has definitely improved
the look of the house. No neighbours have commented on the change, possibly because the
roof of the home is not particularly visible from street level. The resident has stated that they
would definitely recommend a cool roof to their friends, and that they would definitely consider
having another one installed if they were to move into a new address.
68.7
55.6 54.3
44.8
24.1
33.0
0
10
20
30
40
50
60
70
80
2n
d Q
tr 20
10
3rd
Qtr 2
01
0
4th
Qtr 2
01
0
1st Q
tr 20
11
2n
d Q
tr 20
11
3rd
Qtr 2
01
1
4th
Qtr 2
01
1
1st Q
tr 20
12
2n
d Q
tr 20
12
3rd
Qtr 2
01
2
4th
Qtr 2
01
2
1st Q
tr 20
13
Ene
rgy
con
sum
pti
on
(kW
h)
Dwelling M - T11 Electricity Consumption (average kWh/day)
After Before

Townsville CitySolar Community Capacity Building Program
Monitoring and Evaluation of ‘Cool Roofs’ Community Pilot Program
Page 68 of 80
Participant Testimonial
“It works and it’s made the roof and the house look good. I’d recommend it.” [Verbal confirmation
received. Awaiting written confirmation]
Townsville CitySolar Community Capacity Building Program
Monitoring and Evaluation of ‘Cool Roofs’ Community Pilot Program
Page 69 of 80
Dwelling N (a low-set brick house in Annandale)
Background Information
Dwelling N is a single level brick house in Annandale. The original roof was a brown decramastic
tile roof in need of repainting. The cool roof coating was applied on 24/10/2011 and 25/10/11. A
summary of the dwelling characteristics is presented in Table 25.
Table 25: Dwelling N - Building and roof profile
Dwelling N - House and roof characteristics
Type House (Low-set brick)
Suburb Annandale
Roof materials Decramastic tile
Original roof colour Brown
Roof pitch Moderate
Insulation n/a
Extent of shade None
Levels One
Air-conditioned Yes
Temperature Performance Outcome
Temperature data for Dwelling N is not available. The resident was a private customer one of the
painters who was approached several months after their roof was painted to ask if they would be
willing to contribute to the pilot program by granting access to energy consumption data and
providing feedback on their experience with their new cool roof.
Electricity Consumption
The cool roof coating was applied during Q4 2011. Q1 was chosen for analysis as this quarter is
most representative of the summer cooling-demand period for this dwelling. Q1 covers the
period late-November to early-March. An average kWh/day figure was determined by averaging
the total energy consumption over the total number of days in this quarter.
Average daily electricity demand prior to application of the cool roof product was 71.7 kWh/day
in the 2009/2010 summer period, and 68.8 kWh/day in the 2010/2011 summer period. Following
the application of the cool roof product, average daily electricity consumption has fallen to 29.2
kWh/day in Q1 2012 (see Figure 39).
For the purposes of this analysis, the 2010-11 summer period has been chosen as the baseline
period for comparison. Comparing electricity consumption data after application of the cool roof
product with the 2010-11 baseline, this dwelling has achieved a reduction in average daily
energy consumption of approximately 57 per cent.

Townsville CitySolar Community Capacity Building Program
Monitoring and Evaluation of ‘Cool Roofs’ Community Pilot Program
Page 70 of 80
Figure 39: Dwelling N – Average daily T11 electricity consumption
Occupant Experience of the Cool Roof
An interview was conducted with the resident to obtain feedback about the pilot program and
about their experience with their new cool roof. The resident reports being very happy with the
result, stating that since the application of the cool roof paint “the house is noticeably cooler and
the air-conditioners don’t work as hard”. The occupant had heard about the energy saving
benefits of cool roof and decided to get one. The resident reported that cost was initially a
barrier, but that the discount offer made it a more affordable option. The consideration of the
energy saving and thermal comfort benefits also helped them overcome the cost barrier. The
roof was also in poor condition and needed painting anyway, so this was also a consideration.
The resident reports noticing a reduction in their energy bill since getting the cool roof. They
stated that they would recommend cool roofs to friends and family and that they would install a
cool roof again if they moved to another address. The occupant reported that that they felt the
new roof looks good, but also felt it didn’t match the house, which is a dark colour with green
gutters. Despite this, the resident reported being very pleased with the overall result, stating that
the house is now ‘much cooler’. The house has six split-system air conditioners that the
residents do not need to use as often as they did prior to roof treatment, and when they do the
units operate more efficiently. Previously these had to be set at 21°C in order for the house to
stay comfortable, but are now set at 25°C. As a result their energy bills have also decreased. A
neighbour commented on the roof and asked if it had really made a difference, and the occupant
was happy to report that they would recommend it to others. This resident would get another
cool roof if they were to move into a new house and is strongly supportive of their use, stating
that cool roof products ‘should be mandatory in Townsville’.
Participant Testimonial
The participant declined to provide a testimonial.
71.7 68.8
29.2
0
10
20
30
40
50
60
70
80
3rd
Qtr 2
00
9
4th
Qtr 2
00
9
1st Q
tr 20
10
2n
d Q
tr 20
10
3rd
Qtr 2
01
0
4th
Qtr 2
01
0
1st Q
tr 20
11
2n
d Q
tr 20
11
3rd
Qtr 2
01
1
4th
Qtr 2
01
1
1st Q
tr 20
12
2n
d Q
tr 20
12
3rd
Qtr 2
01
2
4th
Qtr 2
01
2En
erg
y co
nsu
mp
tio
n (
kWh
)
Dwelling N - T11 Electricity consumption (average kWh/day)
After Before

Townsville CitySolar Community Capacity Building Program
Monitoring and Evaluation of ‘Cool Roofs’ Community Pilot Program
Page 71 of 80
Key recommendations and considerations for the community wide
program
Reductions in Temperature from a ‘Cool Roof’ in Townsville
The cool roof coatings were found to be effective in reducing internal temperatures in all of the
participating dwellings, with significant temperature reductions achieved during the summer
period, as shown in Table 26. Maximum roof cavity temperatures were reduced by up to 17oC,
while maximum internal living area temperatures were reduced by up to 2.5oC. The average
maximum temperature reduction in internal living areas was 1.83oC. These figures are in line
with other national and international studies on cool roofs.
Table 26: Summary of summer temperature reductions across participating pilot program houses
Comparison of two similar days (average of houses; n=11) Temperature change (oC)
Maximum roof cavity temperature reduction; ˚C -9.5 to -17
Average daytime roof cavity temperature reduction; ˚C (9am-9pm) -6.4 to -15.3
Maximum internal temperature reduction; ˚C -1.2 to -2.5
Average daytime internal temperature reduction; ˚C, (9am-9pm) -0.6 to -1.5
Three dwellings had cool roof products applied during winter, which provided an indication of the
performance of the cool roof in cool conditions, as shown in Table 27. A sample size of three is
too small to draw any firm conclusions from, however two houses experienced a reduction in
roof cavity and internal temperature, while the other house unexpectedly experienced increased
temperatures. The house that experienced increased temperatures during winter originally had a
white roof prior to application of the new cool roof paint, and this may have influenced the
results.
Table 27: Summary of winter temperature reductions across participating pilot program houses
Comparison of two similar days (average of houses; n=3) Temperature change (oC)
Maximum roof cavity temperature reduction; ˚C -0.6 to -4.9
Average daytime roof cavity temperature reduction; ˚C (9am-9pm) -0.1 to -3.2
Maximum internal temperature reduction; ˚C 1.5 to -0.9
Average daytime internal temperature reduction; ˚C, (9am-9pm) 1.3 to -0.9
Key findings for future programs include:
The temperature sensors used in the pilot program were found to be acceptable for the
purpose of logging temperature data. The temperature sensors were readily available,
reliable, un-obtrusive, easily installed, and cost-effective. These temperature sensors would
be appropriate for use in a community-wide program. The painters suggested that
consideration be given to having participants visited by TCC staff at the time of registration in
the program to fill in paperwork and install the sensors ahead of time. This would provide a
longer data set prior to the roof being painted as often the painters have only a day or two
notice of the location of jobs.
The use of two temperature sensors; one in the roof cavity and one in an internal
unconditioned space, was found to be acceptable for the pilot program. The most relevant

Townsville CitySolar Community Capacity Building Program
Monitoring and Evaluation of ‘Cool Roofs’ Community Pilot Program
Page 72 of 80
and important dataset was from the sensors located in the living area, and thus a single
temperature sensor in an appropriate internal non air-conditioned space would provide
adequate data to evaluate the effectiveness of the cool roof coating. However, given the
ease of installation and affordable price, two sensors would be still be considered to be
appropriate for a community-wide program to allow temperatures in the roof cavity to be
recorded.
The use of Bureau of Meteorology climate data was found to be acceptable for the purpose
of comparing temperature data from the pilot program. BOM data was readily available,
reliable, and cost-effective. It provided an adequate and simple means of comparing similar
days to help determine temperature reductions in the pilot program houses.
Reductions in Electricity Consumption from a ‘Cool Roof’ in Townsville
The pilot program sought to evaluate a cost-effective method for measuring changes in
household electricity consumption in collaboration with the energy utility to see whether this
would be a viable component of a community-wide program. Household electricity consumption
data was provided by Ergon Energy in the form of aggregated quarterly data, with written
permission received from residents and under Griffith University Ethics Clearance. The main
benefits of the use of this data were ease of access to data and the low-cost involved in sourcing
data directly from the utility without the need to fund and install additional energy monitoring
technology. The data provided by the utility was for 3 month periods and it would be beneficial to
have greater granulation in future programs to be able to investigate the period before and after
the roof coating. In discussions with Ergon Energy, no other data is available that would provide
a higher resolution. However, where dwellings have already installed a smart meter or other
similar equipment that may provide high resolution energy data, this should be capitalized upon
in any subsequent community-wide program.
For each participating dwelling Ergon Energy provided up to 2-3 years of electricity use data up
to and including the most recent data available. This allowed a comparison of electricity use
before and after application of the cool roof. For the purposes of this analysis, only tariff 11
electricity consumption has been considered. Tariff 11 is the tariff used for general residential
electricity use 24 hours per day for all light and power used in dwellings. All other electricity
consumption from other tariffs has been removed from the analysis, including tariff 31, tariff 33,
and the solar feed-in tariff (SS). This has been done to remove the impact of off-peak equipment
(such as hot water systems) and solar energy from the calculations.
The primary energy-related benefit expected to result from a cool roof is a reduction in energy
used to cool a dwelling through the use of mechanical cooling equipment such as an air-
conditioner. The predominant impact of this is assumed to be in the warmer summer months,
when cooling demand is highest. Unfortunately, the period that comprises each dwelling’s 3-
month energy billing quarter has no relation to local climatic conditions or seasons. As such the
‘summer period’ was taken to be the one or two quarters that most aligned with the hottest
months in Townsville. Baseline electricity consumption data was taken to be the summer period
immediately prior to application of the cool roof. In most cases this baseline was during the
2010/2011 summer period. Where a cool roof was applied during a summer period, the previous
year was used as the baseline. Summer electricity consumption data following application of the
cool roof was comparing against the baseline to determine the change in electricity
consumption.

Townsville CitySolar Community Capacity Building Program
Monitoring and Evaluation of ‘Cool Roofs’ Community Pilot Program
Page 73 of 80
Analyzing electricity consumption in the participating dwellings, it can be seen that the average
reduction in summer tariff 11 electricity consumption was 32.3 per cent (see Table 28). The
majority of dwellings experienced a significant reduction in electricity consumption of
approximately 20-60 per cent. Two dwellings (Dwelling E and Dwelling K) experienced only a
slight reduction in electricity use (4.1 per cent and 7.9 per cent respectively), however it should
be noted that both of these dwellings were already extremely energy efficient to begin with,
using only 5-6 kWh/day each prior to application of the cool roof. One dwelling (Dwelling F)
experienced a slight increase in energy consumption (4.0 per cent).
As tariff 11 is the general tariff for household electricity consumption, it should be noted that
other factors may also have contributed to the reduction in electricity use, including efficiency
upgrades of other equipment and appliances (e.g. kitchen appliances, fridges, televisions) and
more energy-efficient occupant behaviour (as noted in the sections above). During the interviews
with participating households, residents were asked if they could think of any other factors that
may have influenced their energy use, and these factors have been noted in the occupant
experience sections.
Table 28: Tariff 11 Electricity Reduction in Pilot Program Houses
Dwelling T11 Electricity Use
Reduction (%)
Dwelling A -20.6%
Dwelling B -57.8%
Dwelling C -42.6%
Dwelling D -33.9%
Dwelling E -4.1%
Dwelling F +4.0%
Dwelling G -59.2%
Dwelling H -19.9%
Dwelling I -26.9%
Dwelling J -30.4%
Dwelling K -7.9%
Dwelling L -53.6%
Dwelling M -40.9%
Dwelling N -57.6%
Average -32.3%
In order to compare the electricity use data with the local average, residential T11 electricity
consumption for the entire Townsville and Lower-Burdekin region is provided in Figure 40 for
comparison with the pilot program houses. For the purposes of this analysis, the period from the
start of September to the end of December has been used to provide an indication of the
summer cooling-demand period during 2010, 2011 and 2012. At the time of writing, no data was
available beyond December 2012.

Townsville CitySolar Community Capacity Building Program
Monitoring and Evaluation of ‘Cool Roofs’ Community Pilot Program
Page 74 of 80
Figure 40: Townsville and Lower-Burdekin Region T11 Electricity Consumption
Analysing the change in electricity demand during the period Sept-Dec in 2010, 2011 and 2012,
it can be seen that average daily T11 electricity consumption was approximately 52 kWh/day in
2010 and 46 kWh/day in 2011, falling to 39 kWh/day in 2012. Comparing 2012 against 2010, this
represents a reduction in average electricity use of approximately 23.9 per cent. Comparing
2012 against 2011 this represents a reduction in average electricity use of 13.6 per cent. By
comparison, the average T11 electricity reduction in the pilot program houses was 32.3 per cent.
Key findings for future programs include:
Energy data for the dwellings that participated in the pilot program appear to show a
decrease in energy consumption. However, the low resolution of available data has not
allowed a thorough analysis of the impact of the cool roofs on energy consumption.
The average reduction in energy use of 32.3 per cent is larger than the average reduction in
residential electricity use seen across the Townsville and Lower-Burdekin region, however
the small sample size of pilot program participants is too small to determine conclusively if
this is a statistically significant result, especially given the low-resolution of the data.
Dwellings that have already installed a ‘smart meter’ represent an opportunity to capture high
resolution energy data that may allow a more precise analysis of the energy demand
reduction potential of cool roofs. Any opportunity to collect data from such houses should be
capitalised upon.
If consent forms are needed for any aspect of a future program, it will be essential to ensure
that these are given to, and collected from, the household at an opportune time, such as
when any of the cool roof program team are physically with the household. This may include
when the household is signing up to be part of the program, when they are having their roof
painted, or during other program aspects.
Discussions with Ergon Energy revealed that the process of extracting electricity data and
generating reports for the research team was somewhat time consuming. The main reason
for this was that data requests were initially made intermittently as pilot program participants
0
10
20
30
40
50
60
70
80
90
T11
Ele
ctri
city
Co
nsu
mp
tio
n (
kWh
/day
) Townsville T11 Electricity Consumption (kWh/day)

Townsville CitySolar Community Capacity Building Program
Monitoring and Evaluation of ‘Cool Roofs’ Community Pilot Program
Page 75 of 80
returned their ethics forms. In future, the research team should accumulate a large number
of ethics forms and request all participant data at one time, preferably shortly after the end of
the summer period. This will also ensure the most recent summer electricity data is included
in the data.
Electricity data supplied to the research team was often incomplete, requiring additional
follow up. This may be due to the database software available. In order to further streamline
the data collection and analysis process a template should be supplied to Ergon Energy for
any future program.
Collecting roof characteristics and participant demographics
The painters participating in the pilot program were provided with checklists to complete for each
participating house to gather information about the dwelling, including the original roof
characteristics and details of the new cool roof coating.
Key findings for future programs include:
The painters’ checklists weren’t completed for all dwellings as anticipated in the pilot
program design, meaning information needed for comparing the impact of dwelling
characteristics on temperature reduction had to be obtained from the householder in many
cases. Reasons for painters not having completed the checklists are hypothesised to
include:
Lack of appreciation of the purpose of the checklists;
Poor communication of the process for filling in the checklists to third-party contractors;
Lack of time, and lack of prompts to fill these in.
It will be important to include a monitoring element for future programs that ensures relevant
forms and paperwork is filled in for each dwelling.
Understanding participant experience (Post program survey)
To investigate potential benefits of the cool roof experienced by participating households, as well
as to gain further insights into the barriers and benefits to having a cool roof, a post program
participant survey was conducted with pilot program participants. Participants were asked a
series of questions regarding their experience with the ‘Cool Roof’ Pilot Program and their new
cool roof (see Appendix B). Responses were overwhelmingly positive and the general
consensus is that residents feel that the cool roof has reduced temperatures in their homes.
“We had the roof painted in November when the weather was starting to warm up.
We could not believe how much cooler the house was the day after it was
painted. The house is normally all locked up during the day and use to be quite
hot when we got home in the afternoon. After the painting the house was cool to
walk into at the end of the day. Our carport and patio are just the bare metal
colorbond roof. You can put your hand on the underside of the colorbond in the
middle of a hot day and the metal is not hot at all, where before it would have
burnt you. We found that when home we did not put the fans on until later in the
day and there was reduced use of air-conditioning during the day, as it was only
needed on the really hot, humid days. I have certainly passed the word onto
friends and know of a couple that have had their roofs painted.”
Pilot Program Participant with a single story
1980s era low-set bessa block house in Condon

Townsville CitySolar Community Capacity Building Program
Monitoring and Evaluation of ‘Cool Roofs’ Community Pilot Program
Page 76 of 80
Key findings for future programs include:
Participants had a positive experience with the Pilot Program.
Participants were pleased with the performance of their cool roofs. All participants responded
that they felt the cool roof performed as expected and had noticeably cooled their house.
On several occasions participants estimated that the internal temperature reductions
achieved by their cool roof are larger than that shown by the data, estimating temperature
reductions of five or more degrees. This may be due to the larger reduction in the perceived
or apparent temperature, which takes into account factors such as humidity. Additionally, this
suggests that that even small temperature reductions of a few degrees noticeably improve
thermal comfort.
The most common reasons for having their roof painted with a cool roof coating were for
internal thermal comfort benefits, energy saving potential, and because the roof needed to
be renovated anyway.
Many program participants have recommended cool roofs to friends and family, commonly
citing the thermal comfort and energy saving benefits of their cool roof.
A telephone interview with the householder was an appropriate method of collecting
feedback about the cool roofs. In some cases, particularly when participants had the cool
roof product installed during winter, the participant was not initially able to provide feedback.
In these cases, participants were advised that the research team would call back after the
following summer period. This initial contact and follow up approach should be continued.
Understanding Painters experience (Post program survey)
Participating painters were interviewed to gain feedback on the pilot program and suggestions
for improvement to consider for the community-wide program. Participating painters were two
local licensed painters offering two different cool roof products.
Roof Seal: Roof Seal is a local business specialising in roof restoration and painting. Roof
Seal use a proprietary cool roof coating called Ellemex Reflect and all applicators are trained
in the correct application of the coating. Ellemex Reflect is a durable acrylic coating sprayed
directly onto a roof and can be used on a variety of surfaces including iron sheet and
concrete tile.
Roofguard: Roofguard is a locally owned business specialising in roof painting. Roofguard
use Dulux Acra-Tex 962 Cool Roof White and Dulux Acra-Tex 962 Commercial White cool
roof coatings and all applicators are licensed and registered Dulux Acra-Tex applicators.
Dulux Acra-Tex is a durable high build acrylic coating that can be applied to a variety of
surfaces including concrete and metal roofs.
Key findings for future programs include:
The painters support the idea of the community program and are interested in supporting the
Council to help increase the uptake of cool roofs in Townsville.
There is a high level of interest from participants to see the results of the pilot program.
Both painters emphasised the need to have a faster turn-around time between a participant
registering their interest and the contact details being released. The painters stated that
additional participants may have been achieved if this timeframe was shortened.
Painters reflected that the timings of the program are very important to match seasons. The
lead up to summer was felt to be the ideal time to roll out the program as houses are
beginning to heat up and people are starting to think about summer. Painters suggested that

Townsville CitySolar Community Capacity Building Program
Monitoring and Evaluation of ‘Cool Roofs’ Community Pilot Program
Page 77 of 80
October to December was the ideal time to paint houses in Townsville. Additionally, many
people are thinking of getting their roofs fixed before the cyclone season arrives and the
ideal time to paint a roof is in conjunction with roof restoration.
The painters felt that offering a discount based on the volume of customers in the pilot did
not provide significant benefit due to the number of houses participating. Noting that the
discount was offered as a form of promotion for the product and not based on this intended
outcome. Noting also that one of the painters was offering 25% discount at the time of the
pilot registration and the program asked for a commitment of 15%. Painters suggested that
they already buy in large quantities so received little additional discount from the
manufacturer.
However, when asked if a more clustered program could offer greater savings to painters
that could be passed onto residents (e.g. ‘Cool Streets’ - where a large number of houses in
the one street all have the same product applied at the same time), they expressed that this
could be an option. If potential participants are clustered closer together this would save on
travel and set-up time and could potentially reduce costs, which may be able to be passed
onto the participants.
Due to often having a short turnaround time between providing a quote and painting the roof,
the sensors were often not installed far enough in advance to provide pre-roof coating
temperature records. An alternative option could be that temperature sensors are installed
(preferably by a council representative) shortly after expression of interest to participate in
the program. Where a resident does not go through with the cool roof painting, the sensor
could be removed.

Townsville CitySolar Community Capacity Building Program
Monitoring and Evaluation of ‘Cool Roofs’ Community Pilot Program
Page 78 of 80
Appendix A: Painters Checklist

Townsville CitySolar Community Capacity Building Program
Monitoring and Evaluation of ‘Cool Roofs’ Community Pilot Program
Page 79 of 80
Appendix B: Participant survey
PHONE CALL RUN SHEET: PILOT PROGRAM PARTICIPANTS [15 MINS]
1. Introduction (2 mins)
Good morning/afternoon, my name is ___________. I’m a researcher from Griffith University working with the Townsville City Council to investigate opportunities for reducing energy use as part of a program within the Townsville Solar Cities initiative.
You recently participated in the Cool Your Roof Pilot Program. We are interested in your feedback about the program and your experience with your cool roof. Any information you provide will be kept confidential amongst the research team, with any information given to Council being anonymous.
With this in mind, would you be prepared to talk for 10 minutes about your experiences? (If YES, but not now, then ask when would be a good time. If NO, then thank them for considering)
2. Property Details (2 min)
The purpose of the following questions is to gather basic data about your house, to cross-check
with information provided by the painters.
[CHOOSE] What is your house type (Queenslander, Brick, Unit/Townhouse, Other)?
[CHOOSE] How many levels are there in your house? (1, 2, 3, more than 3)
[CHOOSE] Do you have an air-conditioner? (YES/ NO; if YES, central system/ individual units - how many?)
[CHOOSE] What is the roof material (metal – corrugated iron; metal – tin; tile; other; don't know)
[CHOOSE] What was the original roof colour? (silver, white, cream, terracotta, grey, brown, black, unpainted metal, other)
[CHOOSE] What is the new cool roof colour? (silver, white, cream, terracotta, grey, brown, black, other)
3. Discussion Items – Cool Your Roof Pilot Project Review (8 mins)
The following questions will help us to focus on getting feedback on the pilot program and your
opinions on the new cool roof.
Had you considered getting a cool roof prior to hearing about the Cool Your Roof pilot program? (YES/ NO)
Is there anything that initially stopped you getting a cool roof? (YES/ NO; If YES, ask for brief details)
[OPEN] What helped you to overcome these barriers?
[OPEN] What are the two or three main reasons you decided to get a cool roof for your property?
Is your cool roof performing as you expected? (YES/ NO; Ask for brief details)
Do you think the cool roof has affected the temperature in your house? (YES/ NO)
(If YES to air-conditioner in Section 2) Has your use of the air-conditioner/s changed since getting the cool roof? (YES/NO; Ask for brief details)

Townsville CitySolar Community Capacity Building Program
Monitoring and Evaluation of ‘Cool Roofs’ Community Pilot Program
Page 80 of 80
Has there been a change in your energy bill since getting the cool roof? (YES/NO/UNSURE) Are there any other factors that might have influenced your energy use, other than the cool roof? (e.g., more efficient appliances, downsizing to a single fridge instead of two…)
Do you think the cool roof has improved the look of your house? (YES/NO/UNSURE)
Would you recommend to friends/family that they get a cool roof? (YES/NO/UNSURE; as Why/why not?)
Have your neighbours or friends commented on your cool roof? (YES/NO – if YES, details?)
Would you install a cool roof again if you moved to a new address? (YES/NO/UNSURE)
[OPEN] Do you have any comments about cool roofs that you would like to share?
[OPEN] Do you have any comments about the Cool Your Roof pilot program that you would like to share?
[OPEN] Do you have any comments about the painter/s that you would like to share?
4. Request for testimonial (1 min)
As part of the pilot program we are looking for testimonials from Townsville residents who have a
cool roof for use in communication material to encourage the uptake of cool roofs. This
testimonial would be used on the Townsville City Council website and in cool roof education
material, such as posters and information brochures. Participation would be voluntary with no
financial or other reward. Would you like to provide a testimonial?
(If YES, take quote verbally and follow up with emailed version for written confirmation. If NO,
thank them for considering)
5. Request for photo (1 min)
As part of the pilot program we are looking for images of Townsville residents with their cool roof
for use in communication material to encourage the uptake of cool roofs. These images would
be used on the Townsville City Council website and in cool roof education material, such as
posters and information brochures. Participation would be voluntary with no financial or other
reward. Would you like to participate?
(If YES, record interest for future follow-up. If NO, thank them for considering)
6. Complete Phone Call (1 min)
Thank you for your time – if you have any questions or further queries please contact the project
leader on (mobile +61 407 071 729).