TOWNSHIP ECONOMIC DEVELOPMENT PROJECT THEMBISA
236
1 CITIES SUPPORT PROGRAM TOWNSHIP ECONOMIC DEVELOPMENT PROJECT THEMBISA CITY OF EKURHULENI SITUATIONAL ANALYSIS REPORT DRAFT VERSION 2.5. APRIL 2021 Prepared by the Sustainable Livelihoods Foundation TED Project Team
Transcript of TOWNSHIP ECONOMIC DEVELOPMENT PROJECT THEMBISA

1
CITIES SUPPORT PROGRAM TOWNSHIP ECONOMIC DEVELOPMENT PROJECT
THEMBISA CITY OF EKURHULENI
SITUATIONAL ANALYSIS REPORT DRAFT VERSION 2.5.
APRIL 2021
Prepared by the Sustainable Livelihoods Foundation TED Project Team

2
Cities Support Programme
Township Economy Development Project
Situation Analysis Report
Project Site: Thembisa, City of Ekurhuleni
Prepared by the Sustainable Livelihoods Foundation TED Project
team
Version 2.5.
April 2021

3
I. Executive Summary
The Cities Support Programme (CSP) of National Treasury (NT) has entered into an agreement with
Ekurhuleni Metropolitan Municipality (City of Ekurhuleni - CoE) to provide technical support for a
township economy development (TED) strategy. This three-year project will strengthen the capacity of
the City of Ekurhuleni to strategize, plan, fund, implement and monitor TED projects within the township
of Thembisa.
The CSP appointed the Sustainable Livelihoods Foundation NPC (SLF) with a professional technical
assistance team (TAT) comprising a team leader; small-business development, social scientist, spatial
planning, public transport, housing, infrastructure development, environmental advisors and
community liaison persons. The TAT partner will collaborate with CoE to align the strategy to existing
and emerging development frameworks, strategies and projects and advance implementation of a
township economy development strategy through specific projects derived from the unique socio-
economic challenges and opportunities within the site.
In formulating projects and implementation plans, the TAT will facilitate processes of participatory
engagement and transversal planning to advance projects with spatial impact, whilst synergising
resources and ensuring alignment with sector plans. These strategies will provide the CoE with a
replicable area-based development approach. The project will leverage institutional impacts through
knowledge sharing, strengthening City strategies and policies, and through facilitating transversal
planning processes. It will benefit the City through the building of new partnerships and arrangements
for the implementation of economic development projects, the sourcing of funding, and gaining access
to specialist knowledge and expertise. This Situation Analysis identifies aspects and components of the
Thembisa township economy that could benefit from project interventions within an overarching
strategic alignment.
Theory of Change (ToC)
Building on prior CSP work, the ToC recognises townships as requiring a spatially and systems-oriented
development approach, influenced by 1) provision (and quality) of public goods and services, 2) the
regulatory environment, 3) the organisation of society, and 4) the character and orientation of economic
and business activities. Furthermore, there is a requirement for a context specific understanding of the

4
physical, social and psychological needs of township communities; to understand the range of shocks
that exacerbate economic vulnerability; and actions to strengthen accountability and governance.
Partners
The CSP has entered partnerships with the European Union supported Ecosystem Development for
Small Enterprise (EDSE) programme, the World Bank Group (South Africa) (WBG), and the Aspen
Network of Development Entrepreneurs (ANDE) to amplify the TED project. The EDSE partnership will
support the TED project to facilitate alignment with the Department of Small Business Development
(DSBD), Small Enterprise Development Agency (SEDA) and the Small Enterprise Finance Agency (SEFA).
In addition, the CSP TED project will work synergistically with the Neighbourhood Development
Partnership Programme (NDPP) of National Treasury.
Methods
The TAT undertook a series of seven simultaneous steps in preparing the situation analysis:
1. Establishing a transversal team of sector specialists.
2. Desk-top identification of all relevant municipal planning documents, and feasibility studies for
economic projects. In all, 117 official publications, academic publications and unpublished
reports were accessed.
3. Participatory engagement – because of COVID-19, the engage was primarily undertaken
through on-line engagements via the Thembisa Virtual Imbizo page on Facebook.
4. Spatial information - obtained data from open sources and the CoE including land use (zoning
schemes), cadastral boundaries, social and community infrastructure, water and sewerage
systems, electricity networks, telecommunications, natural features and roads and transport
infrastructure. In addition, the TAT undertook a spatial analysis of identified high streets,
business nodes and development precincts.
5. Ecosystem survey – a team of field researchers used a survey instrument to collect data within
the field, focussing on economic high streets, business precincts, retail hub and identified nodes
/ precincts. Field research was undertaken in October 2020. In Thembisa, the researchers
completed 586 interviews, which included surveys of 447 township micro-enterprise businesses.
6. Site field research and engagement to qualitatively understand the socio-economic
characteristics of business and urban dynamics.
7. Sector specific investigations into essential aspects of the township economy.

5
To mitigate the challenge of the relative scarcity of area-based data, the TAT team accessed unusual
data sources, including private sector datasets and qualitative data.
Institutional ecosystem
The TAT assessed government strategies at national, provincial and metro levels to support businesses
within the township economy. National government programmes such as those driven by the DSBD
and its associated agencies of SEDA and SEFA include:
• New incentives (with the Medium-Term Expenditure Framework (MTEF) period),
• The Small Business and Innovation Fund (R3,2b),
• Black Business Supplier Development Programme (R906m),
• National Informal Business Upliftment Scheme (R248m),
• Enterprise Incubation Programme (R186m),
• Craft Sector Programme (R36m),
• SheTrades,
• Township Entrepreneurship Fund,
• Township and Rural Entrepreneurship Fund (TREP)
Gauteng Province Programmes
The Gauteng Provincial Government (GPG) has prioritised the Township Revitalisation Strategy (TRS) to
create strategic accessibility and connectivity to markets to transform township economies. Growing
Gauteng Together (GGT) 2030 aims for ‘building sustainable development for all’, creating jobs and
opportunities, with a focus on the Gauteng City Region (GCR) and ten high-growth sectors. Furthermore,
the GGT has a strong emphasis on water and energy security and a focus on promoting renewable
energy. Within the GGT the Township Revitalisation Action Plan seeks to change how townships are
regulated and governed; allow township firms to be formally recognised; revise state procurement rules
and programmatic support; de-risk lending to township firms of all sizes by financial service providers;
turn taxi ranks into micro-CBDs and support the taxi economy to use its scale to grow supporting value
chains and industries, and convert areas with high commercial densities into township high streets.
These interventions underpin the proposed Township Economic Development Bill which aims to direct
government procurement spend, enhance access to finance, assists registering SMES, enable high street
development and redress municipal by-law barriers to enterprise formalisation. Lastly, the Gauteng City
Region (GCR) Economic Development Plan (2015- 2020) intends to drive economic growth through
strategic targeting of priority sectors. Based on the current economic structure of Gauteng Province, the

6
GCR EDP is biased towards the service sectors, especially community services, finance and transport
although purports that the manufacturing sector should be at the centre of economic growth and
development. The EDP recognises a need to invest skills in various sub-sectors of the economy and
address the high barriers of entry in many of these industries – in particular those with high growth
potential such as agro-processing and steel. Within the context of these overarching provincial
strategies, the CoE has developed its own series of guiding policies and programmes.
Ekurhuleni Programmes
The Ekurhuleni Growth and Development Strategy 2025 forms the basis of medium and short-term
planning and guides the policy budget as the City seeks to implement its mandate, to make CoE ‘a
better place in which to live, work and play’ and recognises Thembisa as one of the four major
concentrations of historically disadvantaged communities. The Ekurhuleni Integrated Development Plan
(IDP) is mainly focused on the overall development challenges facing CoE, with township revitalisation
is one of nine Flagship Projects for the City. The Economic Development Department which lead,
facilitates and promote economic transformation, inclusive growth and socio-economic development
in the City.
Enterprise activity - The Micro-Enterprise Ecosystem
Ecosystem surveys were conducted in Thembisa in October 2020 to record a ‘snapshot’ of: i) business
activities, ii) institutional facilities and iii) business hotspots and spatial opportunities. The research team
surveyed 517 businesses (micro-enterprises, SMEs and corporates), recorded 27 business hotspots and
30 institutional services. Of these businesses, 4% (23) were Corporates, 9% (47) were SMEs, and 86%
(447) micro-enterprises. All corporates and 94% (44) of SMEs were formal whilst 86% (385) of micro-
enterprises were reported as informal businesses. Of these 447 micro-enterprises, 83% (369) of
businesses were open and full interviews were recorded. The research identified clusters of trading sites,
the prominence of street traders and a wide diversity of economic activities, including SME. The most
numerous informal business activity surveyed was that of (second-hand) clothes retailing (44 / 10%) –
mostly conducted as a street trading activity. Food businesses were commonplace, including retailing
of fruit and vegetables (44 / 10%), cooked food (40 / 9%) and snacks & cigarettes (39 / 9%). The service-
related business of hair salons (35 / 8%) were commonplace. Appliance repair businesses operated from
a variety of outlets - from street trading to private homes to dedicated shopfront premises (including
shipping containers) – focusing on television, kitchen appliance and cell phone repairs.

7
Of the 369 micro-enterprises interviewed, 41% (152) are run by South Africans. Of the 58% of non-South
Africans in the survey, the majority are immigrants from Mozambique (27% of total sample) and
Zimbabwe (14% of total sample); many of whom were street traders. These informal businesses were
reasonable providers of work opportunities with 34% (124 people) reporting as employees. This
economy is predominated by men (64% - 237) most commonly in the age group of 30-40 years, with
more than half of all women (132) in their 30s (45) and 40s (32). The average age of local businesses is
relatively short with 39% (147) who have been operating 1-4 years. Some 24% (36) have been operating
for one year; 31% (46) for two years; and 28% (41) for three years.
The majority of micro-enterprises operated (60% - 222) from a trading stand / street table / vacant
ground, with 20% (73) from a private residential house, and 7% (27) from repurposed shipping
containers. Few traders paid rent. Similarly, among those operating from dedicated premises, few
business operators owned the property from which they operated – only 14 individuals were owners.
The balance of 31% of respondents paid rent for the premises on which they operated ranging from
R50 (access to a street pavement adjacent to a private dwelling) to R8,000 (for a dedicated building
structure on the high street) per month. A quarter of businesses had formal access to water and
electricity, and 36% (131) had informal access (commonly accessed on a commercial basis from adjacent
private dwellings). Some 40% (147) had no access to these services at all and commonly operated from
a trading stand or table.
Micro-enterprises face numerous challenges. For those that did, the most common is crime (74)
followed by trading location (55), lack of storage for goods [especially for street traders] (52), and
competition (45). Interestingly, 26 respondents noted that weather conditions as a key challenge in
trading. Finances were also considered an important busines constraint reflecting both the desire for
operational capital and the need for enhancing financial inclusion for microenterprise. We note that
around one third of the respondents (116) reported on challenge to operating their business in
Thembisa.
SMES and Corporates
Corporate businesses are mainly situated in shopping malls, of which there were two major malls within
the study site. Of the 23 corporates, clothes and grocery retail were the most prominent. The big brands
operating in Thembisa are dominated by essential services (food, fuel, and clothes) and include BP
service stations, Pick n Pay Express, Chicken Licken, Roman’s Pizza, Debonairs and Pep.

8
A considerable variety of SMEs operate in Thembisa. In our survey, 23% (11) of them were health
services, followed by 14% (9) liquor sales. A variety of other SMEs were found spread throughout the
site, including funeral services, bakeries, car repairs, legal services – all of which require specialised skills
and / or equipment to operate. These businesses provide a qualitatively different level of BDS to street
based micro-enterprises.
Business Hotspots
The survey recorded 27 business hotspots: these were localised sites with much business activity and
clusters of microenterprises. In these sites of strategic importance, 81% (21) had no access to WiFi, and
62% (16) had no access to waste disposal. The types of hotspots varied, made up of 27% retail nodes,
19% marketplaces and 15% high street sites. These hotspots have proven themselves to be incubators
and organic attractors of micro-enterprises. The survey revealed that some 435 businesses operated
from these hotspots with 174 from marketplaces, 88 in retail nodes, and 51 on high streets. An important
form of hotspot were open trading spaces. Fear of crime appeared to be the largest disincentive for
new businesses to occupy the available spaces within hotspots, with 46% of total hotspot business
sample considering it to be the main barrier to undertaking business.
Institutional services
There were 30 institutional services sites recorded in the survey, 50% (15) of which are financial services
including 12 (80%) ATMS from all major banks and 1 (7%) micro-finance organisation. The micro-finance
organisation was Mukhuru, a money transfer business. Those institutional services recorded as ‘Other’
were a health service, private consultant and an art centre. Apart from financial services, most of the
institutional services were open during the fieldwork process. These services were predominantly
operated by the CoE (10) and included the FabLab and business incubators.
Important Sectors
Whilst the microenterprise form and function in Thembisa is fairly consistent with South African
township economies, there are some important local sectors that stand out as having potential for
investment. These sectors have particular area advantages such as the clustering of relevant skills types
or markets,, being geographically close to important South African business sectors, or due to other
socio-economic circumstances that align to create competitive advantages.

9
• 4IR opportunities, such as Kandua which links technical specialists to customers.
• The township automotive sector – especially subsectors of mechanics, tyre fitment and car
detailing / washing are important contributors to economic opportunities and job creation.
• Local intra-township transport.
• Financial inclusion for township SMMEs that can more effectively give them access to capital,
insurance and other financial products.
• The formal status of local houses presents a valuable opportunity for homeowners to reinvest
in their houses – such as upgrading gates, fences, doors and windows. These activities could
bolster demands for a local micro-manufacturing economy and repair, maintenance and
installation services.
• Thembisa has a growing number of residential dwellings being built for the rental market. An
opportunity lies in this context to reformulate the policy and investment environment that can
respond and guide urban residential densification.
• Creative economy and activities, including photography, musing making, performing arts,
design and production. Linkages to various government programmes and BDS could unlock
opportunities for persons in this sector.
Land use
The TAT reviewed key planning documents to gain an understanding of the statutory and policy
environment for Thembisa including the Municipal Spatial Development Framework (MSDF), the
Regional Spatial Development Framework (RSDF), Built Environment Performance Plan (BEPP), and the
Municipal Planning By-Law and Town Planning Scheme. Thembisa civic nodel is categorised as a
developing node. Priority is given to the mobility route between Kempton Park and Thembisa for
minibus taxis and the Bus Rapid Transit (BRT) System. Infill development to promote greater density
within the civic node and transport infrastructure is encouraged. Economic development priorities
indicated in the MSDF include prioritising retail development. The Olifantsfontein and Clayville industrial
areas to the North of Thembisa are sites of heavy industrial activity.
The RSDF details plans for secondary nodal areas in Tembisa. Key secondary nodes are: Winnie Mandela
Node, Thembisa Plaza (aligned to the Leralla station node indicated in this report), Swazi inn, and the
Thembisa station. The Thembisa civic node, situated at the Corner of Andrew Mapheto Street and
George Nyanga Street (civic node), is characterised as a hub. In these secondary nodes, the RSDF
indicates a range of supported land uses that include medium density residential; high density

10
residential; retail; office; entertainment; hospitality uses; service industry; taverns; and municipal and
government facilities. Leralla station, Limindlela station and Thembisa station have been identified as
Transit-Oriented Development (TOD) Nodes.
The BEPP categorizes Thembisa as a ‘marginalised peripheral township’. The township is classified as
being at moderate risk. The BEPP identifies dangerous electricity connections and air pollution as
possible sources of vulnerability (2020).
The land-use system in Thembisa follows a rather typical township arrangement of predominant
residential zoning with social/public zoning scattered throughout and limited land parcels designated
for commercial / business uses. Commercial land is evident in the civic node, but otherwise does not
noticeably feature in other more obvious situations: like transport interchanges, along high streets or at
train stations. Most of the area is zoned Single Residential 2. Business zoning is evident along Andrew
Mapheto Drive. The study site includes areas zoned Open Space, which are in varying degrees of
maintenance and use.
Various precinct development plans have been formulated, such as the Tembisa Hub Plan (2016)
developed as part of National Treasury’s NDPP to provide a mixed-use environment that is better
connected to the surrounding neighbourhoods. The hub is made up of seven sub-precincts, which are
envisioned to change over time. The aims for the short-term are as follows: the Tembisa and Limindlela
Station Precincts are to support a mix of business and medium to high density residential uses. The
Thembisa Makhulong Community Precinct (2019) involves upgrades to the site incorporating the
Makhulong Stadium, Zion Church of Christ, Moses Molelekwa Arts and Computer Centre, YES4Youth
and hydroponics facility, informal businesses, and a soccer field. The plan is to formalize the soccer field
and motor repairs, expand the YES4Youth Hub and provide more intensive housing opportunities and
public interface opportunities.
Prioritised and high potential nodes
To inform any TED opportunities, the TAT developed a cohesive spatial overview using data from the
City, including reports and plans. Reviewing the microenterprise landscape and land use plans the team
was able to consider a range of priority nodes. These nodes are located on existing transport corridors
with a reasonable level of internodal synergy, where there is formal and operational basic infrastructure
and signs of increased residential private densification, especially around areas that have high amenity
or connectivity.

11
• Thembisa Civic Node - vibrant and active street life off a main transport corridor,
• Makhulong Community Precinct - social, sports and recreational node,
• Limindlela Station Precinct - close proximity to railway, civic node and north-south mobility
corridor,
• Leralla Station Node – with significant existing assets for leveraging for growth and
diversification, especially the street traders market.
• Thembisa Station Precinct - defined by the (vulnerable) Thembisa Station.
Housing
There is growing demand for low-cost and affordable housing in Thembisa. The township is a long-
established, vibrant and sought-after place in the East Rand, relatively well-located in good proximity
to employment opportunities and public transport routes. The areas of Endayini, Emkatini and Ibazelo
have the highest average property values in the township. There is a noticeable class of middle-income
households with higher purchasing power and a growing class of young professionals, who are seeking
higher quality housing, including rental accommodation. Homeowners in middle income strata have
made considerable investment into their properties, renovating, expanding the original building and
investing in place-making. Thembisa has a mix of formal and informal housing stock, whereas the
number of informal dwellings appear to be growing faster than formally delivered houses.
Few housing developments have taken place in recent years. A human settlements project is currently
being implemented in Extension 25 to cater for shack dwellers living in Winnie Mandela informal
settlement. However, in light of the latest announcements by the Department of Human Settlements,
indicating that free BNG housing delivery will be drastically reduced and replaced by sites and services
schemes, government investments in formal housing might be reduced. In this context it is especially
important to explore opportunities within innovative public-private partnerships to deliver higher-
density affordable housing.
Informal housing has largely absorbed the growing population in Thembisa. More specifically, informal
dwellings in the backyard of RDP/BNG houses have mushroomed across the settlement. In addition to
the low-cost shacks and ‘wendy’ houses, there has been a noticeable rise in solid single or double-storey
micro-flats. The diversification of backyard rental accommodation illustrates the existence of different
rental sub-markets catering for different income groups. Both the private and public sector have
recognised the growth and potential of the backyard real estate market.

12
High level discussions are taking place between the GPG, CoE and CSP of the National Treasury about
how to promote a precinct-based approach to backyarding in Thembisa. As financing is one of the main
challenges for homeowners to transform their low-cost structures into higher-quality, mixed used
backyard real estate, a precinct-based approach that ensures necessary scale could unlock large-scale
private sector funding from banks that is channelled via intermediaries to individual homeowners for
investment in these improvements. Linked with the right regulatory and administrative support, this
approach could contribute to the development of successful high streets. In addition, existing and future
informal settlements on well-located sites could be incrementally upgraded and vertically densified to
free up public spaces, install basic services and connect them to the rest of the township.
The low percentage of properties utilised for businesses along high streets and business hotspots
signals an opportunity for redevelopments in these sites, promoting more mixed-use buildings. The
ecosystem survey indicated a demand for commercial space in properties in those areas, as more than
80% of businesses rented the space compared to 8% who owned and 10% who did not declare their
tenure status.
Transport
Thembisa, for the most part, has the infrastructure that is required to transform and ignite the public
transport systems, however the infrastructure is either poorly connected, unused, neglected or
damaged. Notable challenges are the Thembisa, Limindlela and Leralla train stations which are not
operational and heavily vandalized. Sidewalks are available to support non-motorised transport,
however there is theft of the paving blocks taking place. Sidewalks and road furniture such as lighting
are also commonly damaged and stolen within the site.
There is potential to achieve good connectivity between different modes of transport, though currently
the integration and connectivity is poor. Thembisa Station and Limindlela Station are spatially
disconnected from areas of high economic activity (retail nodes; malls), with some walking required
when commuters switch between transport modes. It should be noted that the terrain does allow for
relatively easy walking. In addition to the taxi rank available within the site, taxis pick up and drop off
passengers at several points along key main roads. The mini-bus taxi system operates in isolation from
the emerging BRT system. The Leralla station precinct has the potential of being an intermodal
interchange point as there are taxis that stop at that point, the Leralla station is nearby and there is the
construction of the BRT nearby with a pedestrian foot bridge to assist with accessibility across Andrew
Mapheto Drive.

13
There are 3 train stations and one major mini-bus rank within the study site. The train stations are only
partially operational. Despite the challenges facing rail passenger transport, the CoE has identified rail
as the backbone of its transport plan with the BRT system to be the main mode of public transport in
the north-south directions. Furthermore, the City recognises the need for Non-Motorised Transport
(NMT) infrastructure. Despite NMT gaining popularity in South Africa and worldwide it is important to
‘normalise’ its use to encourage adoption. NMT needs to be more visible, culturally acceptable and
safe.
Infrastructure
Public infrastructure has an important role in TED as there are various ways that infrastructure facilitates
the movement of resources between the wider economy to townships, and how it distributes resources
to households and individuals. An important aspect of these resource flows is access to the internet and
therefore the digital economy. The WiFi Connectivity National Grant has established 6 local WiFi
hotspots in public service facilities and there are numerous private suppliers including thinkwifi,
Screamer Telecoms, and ekeja.
Access to electricity is a major challenge, with many illegal power connections. Stormwater management
systems in Thembisa require upgrading as various challenges have surfaced due to the poor and
deteriorating quality of the infrastructure; the City is struggling to maintain and replace aging
infrastructure. The natural water systems in Ekurhuleni are heavily polluted by sewerage run-off. In
addition, as urbanisation has intensified, surface water run-off has increased exponentially. Wastewater
is a particular challenge in informal settlements where sanitation systems include pit latrines and
chemical toilets. There is no spare reservoir capacity available meaning that the water supply in this
area is under pressure. The sewers in Thembisa experience regular blockages and spillages. There is
evidence of sewer overflow at manholes, with flow loggings confirming that overflows are due to
insufficient capacity of the sewer, aging infrastructure, high sedimentation rates, and vandalism of
existing outfalls. Despite refuse removal services being available, informal and illegal refuse dumping
occurs throughout the site.
Environment
Cities are now mainstreaming ‘green economy’ considerations to enhance sustainability. The view that
an inclusive green economy should explicitly recognise and integrate the informal economy is gaining

14
traction. There are various green economy opportunities in Thembisa, that include urban, green
infrastructure including open space and parks, and recycling which has attracted BDS.
Urban conditions and management
Thembisa has an extensive legacy of social and community infrastructure, including recreational parks,
sport fields, government service centres, educational facilities, and public transport infrastructure. The
Thembisa civic node comprises a clustering of government services, including City regional offices, a
public library, high school and police station. Yet the urban environment is under-considerable strain
with challenges that include; dumping of domestic waste and building rubble on public sites,
inappropriately designed and incomplete walk-ways / thoroughfares without lighting and security
monitoring, removal of street paving, vandalism, decaying infrastructure, incomplete road and public
transport systems.
Unusually for a township, Thembisa has a five-hole municipal golf course (Ebuhleni Golf Course). The
course is in poor condition and portions of the area along the adjacent green belt (possibly once part
of the course) has been lost for recreational use through the encroachment of informal settlements. The
sports stadium is a key variable in the development of the Makhulong precinct but has no home club
since the sale and relocation of Highlands Park (as of September 2020).
Potential Project Opportunities
Based on the extensive fieldwork evidence as contained in this report and consultation with City
specialists, the TAT have identified a range of potential project interventions / or opportunities. These
have been considered in view of the socio-economic, institutional and spatial situation. In highlighted
the below opportunities, the TAT have been guided by the following variables:
I. Alignment with City / Metro programmes and development priorities,
II. The availability of funding within City / Metro budgets,
III. The identification of project implementing lead departments and units within the City / Metro,
IV. The potential for accessing external funding and partnerships,
V. The role of the TAT in providing technical assistance and adding value to project
implementation,
VI. The potential for projects to have strong economic multipliers and result in a catalytic impact
on development,

15
VII. The potential for projects to leverage productivity enhancement,
VIII. The potential for projects to strengthen social cohesion and enhance community well-being,
including considerations of safety and security,
IX. The potential of project to contribute towards environmental sustainability and reduce the risks
from climate change,
X. The reach of projects and targeting of specific beneficiaries, including women, youth, informal
micro-enterprises and established SMEs,
XI. The timeframe for project implementation, recognising the need for immediate, short-term and
medium-term projects with varying levels of complexity,
XII. And the potential for projects to be replicable in other township localities.
The scope of potential projects is wide; the proposed opportunities allow for discussion of the merits or
otherwise of each interventiony before final selection.
The identified opportunities have been categorised within 7 headings: A) Policy and Strategy; B)
Enterprise Development; C) Nodal Development; D) Spatial Integration; E) Housing and Property; F)
Social and Community Infrastructure and G) Urban Management. The range of identified opportunities
within these categories are:
Table 1: Project Opportunities in Thembisa
A. Policy and Strategy
Opportunity Notes
Home based businesses formalised, enabling
growth and reducing business externalities.
The City to revise and develop policies on enterprise
formalisation (in respect to food retailing businesses and
home-based businesses), with reference to Gauteng
Prov. Gov. and National policies, supporting business
owners to meet compliance.
Revenue collection from rates improved. The City to develop a strategy and plan to generate rates
revenue from commercial businesses, including home-
based enterprises and businesses operating in retail
nodes.
Commercial high streets activated in strategic
sites / roads.
The City to identify sites with high potential for
commercial development and implement measures to

16
stimulate investment, including land-use, parking and
infrastructure.
Shopping malls foster and enable opportunities
for micro-enterprises.
The City to engage shopping mall owners to agree on
strategies to integrate micro-enterprises into the mall
precinct, through adherence to development planning
agreements and proactive measures to support micro-
enterprises.
TED evidence utilised in area-base strategic plans. The City to incorporate the evidence from the TED
situation analysis into strategic plans, including the IDP,
SDF, and BEPP.
Regulated business sectors are formalised and
able to access state-subsidies / industry
programmes.
The City to facilitate transversal engagement and co-
operation with the Gauteng Prov. Govt and National
Government to address constrains on ECDC, taverns /
restaurants, undertakers and other regulated sectors
from attaining compliance with business licencing.
B. Enterprise Development
Opportunity Notes
Opportunities in the creative and leisure
economies provide youth a pathway to transition
into jobs and livelihoods.
The City to conceptualise a strategy to promote creative
activities focusing on youth interests, including hobbies,
via social enterprises and community-based
programmes, use of City facilities, the staging of events,
and linkages to BDS services.
Micro-enterprises have improved access to
business development support services.
The City to promote the DSBD district information
management system as part of its enterprise
development support services, facilitating partnerships
between the City and BDS providers (including SEDA
/SEFA) to benefit Thembisa businesses.
Street signage / advertising extensively utilised to
promote local businesses.
The City to develop and implement, via partnerships, a
project to provide street signage / advertising boards to
promote local enterprises.
Mechanics / panel beaters and associated
businesses in the after-sales automotive sector
have access to business development support
services to grow and professionalise.
The City to facilitate partnership with private sector
companies, the Gauteng Prov. Gov. and the DSBD to
provide equipment / skills training / supply agreements /
finance to township entrepreneurs.
Micro-enterprises have improved access to digital
services to participate in the digital economy &
4IR technologies.
The City to facilitate partnerships, including SEDA and
Gauteng Prov. Gov., to improve digital access in
Thembisa, through (inter alia) digital hubs, free wi-fi,
broadband roll-out and the promotion of marketing
Apps.

17
An annual trade marketing event to be held in
Thembisa to link the community producers and
marketeers to business opportunities.
The City to conceptualise and facilitate a trade
promotion event in Thembisa to stimulate opportunities
for direct marketing, supplier agreements and digital
services. The event will aim to connect home-based
traders & producers to companies / markets.
The income and productivity of township recyclers
improved.
The City to facilitating partnerships and strengthen
cooperates to enable township waste recyclers to more
effectively obtain and package waste material and
improve access to markets.
Urban agriculture productivity enhanced. The City to broaden extension services for urban
producers and foster partnership with marketing
platforms (including digital platforms such as Khula -
https://khula.co.za/) and outlets.
Businesses have greater financial literacy and have
access to services and technologies, including
digital platforms.
The City to facilitate partnerships, including Gauteng
Prov. Gov. & Finmark Trust, to provide businesses with
financial literacy training and improve access to services
and technologies.
C. Nodal Development
Opportunity Notes
A precinct management plan instituted, and
upgrades completed for Leralla trader market.
The City to conceptualise and implement a plan with
projects for the revitalisation of the Leralla trader market
and institutionalisation of a precinct management.
Thembisa civic hub transformed into a business
and service hub.
The City, in partnership with the NDPP and private
investors, to advance projects and mobilise investment
into the Thembisa hub precinct.
A street trader plan implemented within the
Thembisa civic node.
The City to plan and implementing a street trader plan
within the civic hub, identifying and implementing
projects to improve the trading environment.
A financially sustainable business model
formulated to develop and operationalise taxi
ranks as business hubs.
The City, in partnership with the Gauteng Prov. Gov. and
taxi associations, to conceptualise a PPP business model
to develop the Esangweni Taxi Rank.
A precinct management and development plan
for Swazi Inn approved.
In partnership with the City of Johannesburg, the City to
undertake a study to propose a precinct management
approach and projects for Swazi Inn to enhance
opportunities for business, reduce urban management
challenges and improve safety and security.

18
D. Spatial Integration
Opportunity Notes
Train station nodes revitalised for mixed-use. The City to identify opportunities for revitalising the
station nodes (Tembisa, Limindlela, and Leralla) and
conceptualise a development strategy.
A network of NMT and pedestrian lanes
developed.
The City to conceptualise and implement projects to
build a network of NMT lanes / routes, prioritising
linkages to the civic hub.
An integrated public transport system achieved. The City to develop a strategy and partnerships,
including the Gauteng Prov. Gov., to improve integration
between minibus taxis, train, BRT and bus systems,
including the introduction of a single payment system.
Public transport networks and facilities are
operational.
The City to execute planned projects, including BRT
stations (including civic hub) and road upgrades. The City
to engage National Government and PRASA to fast-track
repairs to the railway line.
Motor cycle usage is expanded to provide
township residents with more affordable transport
and self-employment opportunities.
The City partners with private sector to increase access to
motorcycle transport, through training schemes,
marketing campaigns and working with local champions.
Infrastructure developed to provide and enable
universal access to public transport.
The City to embrace and implement designs for universal
access to ensure that people living with disabilities /
mobility requirements have access to public transport
infrastructure.
Purposeful cart & trolley designs utilised by
traders and waste collectors.
The City to facilitate a design studio, with participation of
technical training colleagues, traders and artisans, to
design, develop and manufacture protypes of
appropriate trollies to enhance access to markets.
E. Housing and Property
Opportunity Notes
Encourage private/household investment in
backyard rental housing units, and support a
gradual process of upgrading and formalisation.
The City will develop an enabling framework, simplified
regulations and active support mechanisms to upgrade
and formalize backyard rental housing units, advancing a
precinct-based approach.
Strengthen the capabilities of the local
construction industry and improve the functioning
of the housing market.
The City will establish a local housing support centre to
encourage more investment in the housing stock,
provide advice on title deeds and property transfers, and
19
facilitate the growth of local builders, property
developers, real estate agents and other housing-related
enterprises.
Encourage housing investments by the public and
private sectors in strategic sites to raise
population densities, encourage mixed land uses
and stimulate additional economic activity.
The City will introduce procedures to fast track higher
density housing investments, including PPPs, in strategic
sites, including within the civic hub.
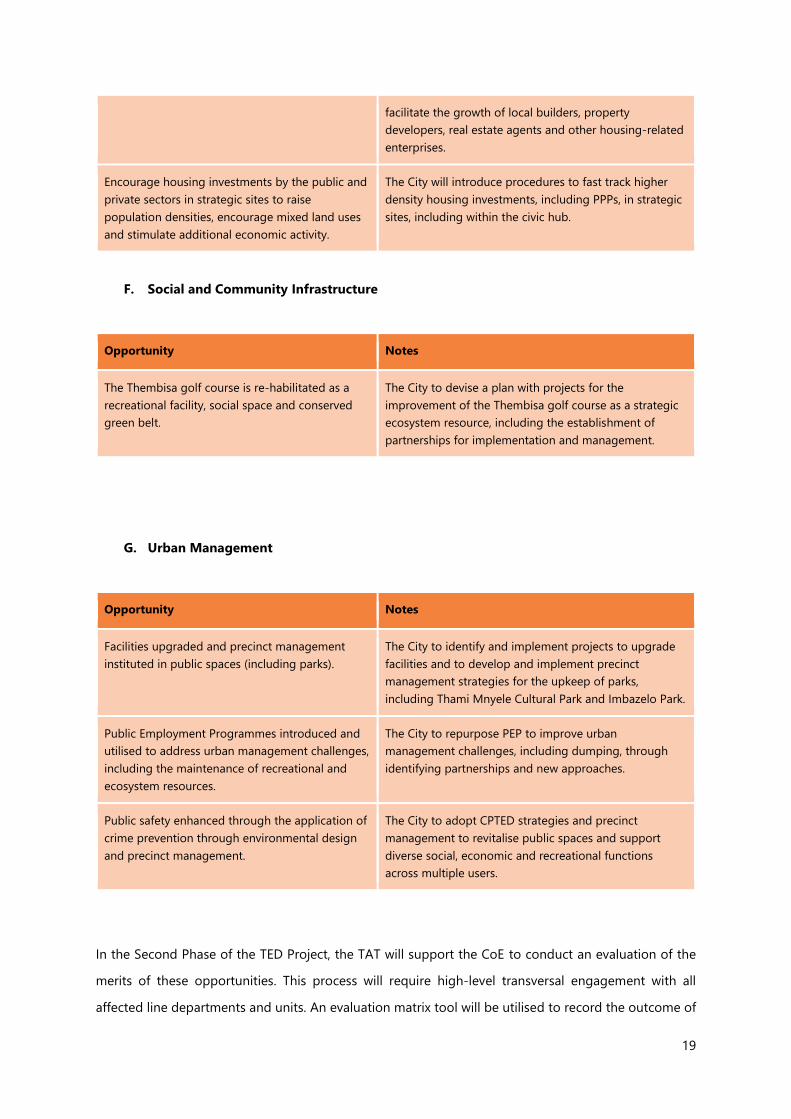
F. Social and Community Infrastructure
Opportunity Notes
The Thembisa golf course is re-habilitated as a
recreational facility, social space and conserved
green belt.
The City to devise a plan with projects for the
improvement of the Thembisa golf course as a strategic
ecosystem resource, including the establishment of
partnerships for implementation and management.
G. Urban Management
Opportunity Notes
Facilities upgraded and precinct management
instituted in public spaces (including parks).
The City to identify and implement projects to upgrade
facilities and to develop and implement precinct
management strategies for the upkeep of parks,
including Thami Mnyele Cultural Park and Imbazelo Park.
Public Employment Programmes introduced and
utilised to address urban management challenges,
including the maintenance of recreational and
ecosystem resources.
The City to repurpose PEP to improve urban
management challenges, including dumping, through
identifying partnerships and new approaches.
Public safety enhanced through the application of
crime prevention through environmental design
and precinct management.
The City to adopt CPTED strategies and precinct
management to revitalise public spaces and support
diverse social, economic and recreational functions
across multiple users.
In the Second Phase of the TED Project, the TAT will support the CoE to conduct an evaluation of the
merits of these opportunities. This process will require high-level transversal engagement with all
affected line departments and units. An evaluation matrix tool will be utilised to record the outcome of

20
this engagement process. The results of the evaluation will guide the project steering team to re-assess
the identified opportunities to be incorporated in the TAT supported township economy development
strategy for Thembisa.
The section of the 8 projects will be determined in consideration of the following criteria AND weighting
(minimum number of projects) to ensure that the range of project interventions address economic,
socio-spatial and institutional change. The TAT will provide a high-level indication of the ‘value-add’
from technical assistance in respect to the selected projects to address the necessity for a range of
project interventions.
Criteria
Min
imu
m
# o
f P
roje
cts
aligns with identified City programme and project priorities. 4
can be funded by the City. 4
has an identified lead department / unit for implementation. 4
can unlock new partnerships via the CSP and non-state actors. 2
will benefit from CSP technical assistance. 4
can enhance productivity and stimulate economic multipliers. 4
will benefit emerging entrepreneurs and marginalised groups. 4
will enhance social cohesion, improve safety, and contribute to environmental sustainability. 1
will strengthen spatial integration. 1
will enhance the availability of decent housing and accommodation. 2
will enable immediate wins (within a 24-month timeframe). 4
will improve the township business environment and ecosystem services. 2
is replicable in other townships. 4
The TAT support may include:
• Partnership facilitation,
• Strategic and policy advice,

21
• Project conceptualisation and design,
• Business case development,
• Research support and knowledge sharing,
• Project monitoring & evaluation and impact assessment,
• Project submission within City and NT budgeting process,
• Project spatial and architectural design.
• Quick-win implementation.
• Support in the preparation of calls for proposals or tenders.
At the conclusion of the assessment process, and agreement on the ranking and weighting of the
identified opportunities, the TAT will then support the CoE advance 8 projects within the framework of
an overarching township development strategy.

22
II. Abbreviations and Acronyms
ANDE Aspen Network of Development Entrepreneurs
BBBEE Broad-Based Black Economic Empowerment
BBSDP Black Business Development Programme
BDS Business Development Support
BEPP Built Environment Performance Plan
BRT Bus Rapid Transit
CAHF Centre for Affordable Housing Finance
CIS Co-operatives Incentives Scheme
COGTA Cooperative Governance and Traditional Affairs
CSP Cities Support Programme
DALRRD Department of Agriculture, Land Report and Rural Development
DSBD Department of Small Business Development
DIMS District Information Management System
ED Economic Development
EDP Guateng City Regional Economic Development Plan
EDSE Ecosystem Development for Small Enterprise programme
CoE City of Ekurhuleni
GCR Gauteng City Region
GGT Gauteng Growing Together
GIS Geographic Information System
GPG Gauteng Provincial Government
IMEDP Informal Micro-Enterprise Development Programme
IRPTN Integrated Rapid Public Transport Network
IZ1 Integration Zone 1
LAP Local Area Plan
MPV Multi-Purpose Vehicles
MSDF Municipal Spatial Development Framework
MTEF Medium-Term Expenditure Framework
NMT Non-Motorised Transport
NT National Treasury
NYDA National Youth Development Agency

23
PPE Personal Protection Equipment
PSL Premier Soccer League
RMDSF Regional Municipal Spatial Development Framework
SEDA Small Enterprise Development Agency
SEFA Small Enterprise Finance Agency
SLF Sustainable Livelihoods Foundation
SME Small and medium enterprises
SMME Small, Medium and Micro-Enterprises
SPLUMA Spatial Development and Land Use Planning Act, 2013
StatsSA Statistics South Africa
TAT Technical Assistance Team
TED Township Economic Development Project
TEDB Township Economic Development Bill
ToC Theory of Change
ToD Transit-oriented development
TPS Town Planning Scheme
TREP Township and Rural Entrepreneurship Programme
TRS Township Revitalisation Strategy
WGB World Bank Group (South Africa)

24
III. Table of Contents
I. Executive Summary ................................................................................................................................3
II. Abbreviations and Acronyms .......................................................................................................... 22
III. Table of Contents ................................................................................................................................. 24
IV. List of Figures ........................................................................................................................................ 29
1. Situational Analysis Aims .................................................................................................................. 34
2. Cities Support Programme Overview ........................................................................................... 35
3. Township Economy Development Project Overview .............................................................. 36
3.1. Project Aims ................................................................................................................................................... 36
3.2. CSP TED Theory of Change ...................................................................................................................... 37
3.3. Project Partners ............................................................................................................................................. 38
4. Approach and Methods ..................................................................................................................... 40
4.1. Establishment of transversal team......................................................................................................... 40
4.2. Desk-top analysis ......................................................................................................................................... 40
4.3. Participatory engagement ........................................................................................................................ 41
4.4. Spatial information ...................................................................................................................................... 43
4.5. Ecosystem survey ......................................................................................................................................... 44
4.6. Site field research and engagement ..................................................................................................... 48
4.7. Sector specific investigations .................................................................................................................. 49
5. Limitations .............................................................................................................................................. 50
6. Project Site.............................................................................................................................................. 52
7. Institutional ecosystem ...................................................................................................................... 54
7.1. National government programmes ...................................................................................................... 54
7.1.1. Small Enterprise Development Agency .......................................................................................................................... 55
7.1.2. Small Enterprise Finance Agency ...................................................................................................................................... 56
7.1.3. Black Business Supplier Development Programme .................................................................................................. 56
7.1.4. Co-operative Incentive Scheme ........................................................................................................................................ 56
7.1.5. Shared Economic Infrastructure Facility ........................................................................................................................ 57
7.1.6. Informal and Micro Enterprises Development Programme .................................................................................. 57

25
7.1.7. The Small Business Innovation Fund............................................................................................................................... 57
7.1.8. Township and Rural Entrepreneurship Programme ................................................................................................. 58
7.1.9. SheTrade ..................................................................................................................................................................................... 59
7.1.10. District Information Management System .............................................................................................................. 59
7.1.11. The Integrated Township Economic Development Programme ................................................................... 59
7.1.12. Small Business Economic Development Portal ..................................................................................................... 60
7.1.13. NYDA – Grant Programme ............................................................................................................................................ 60
7.2. Gauteng Province Programmes.............................................................................................................. 60
7.2.1. Growing Gauteng Together 2030 .................................................................................................................................... 60
7.2.2. The Township Economic Revitalisation Action Plan ................................................................................................. 61
7.2.3. The Township Economic Development Bill .................................................................................................................. 62
7.3. Other Enterprise Development Support ............................................................................................. 63
7.3.1. Gauteng City Region Development Plan (2015-2020) ............................................................................................ 64
7.4. Ekurhuleni Programmes ............................................................................................................................ 64
7.4.1. Ekurhuleni Growth and Development Strategy 2025 .............................................................................................. 64
7.4.2. Ekurhuleni Ten (10) Point Economic Plan ..................................................................................................................... 65
7.4.3. Integrated Development Plan (IDP) 2018/19 .............................................................................................................. 66
7.4.4. Economic Development Department ............................................................................................................................. 66
7.4.5. Business Development Services in Thembisa .............................................................................................................. 66
8. Enterprise activity ................................................................................................................................. 68
8.1. The Micro-Enterprise Ecosystem ............................................................................................................ 68
8.1.1. Approach .................................................................................................................................................................................... 68
8.1.2. Scale and Categorisation ..................................................................................................................................................... 70
8.1.3. Operating challenges ............................................................................................................................................................ 86
8.2. SMEs and Corporates ................................................................................................................................. 89
8.2.1. Corporates .................................................................................................................................................................................. 89
8.2.2. SMEs ............................................................................................................................................................................................. 89
8.3. Business Hotspots ........................................................................................................................................ 93
8.3.1. Available Services .................................................................................................................................................................... 93
8.3.2. Hotspot Place categories ..................................................................................................................................................... 95
8.3.3. Barriers to operating .............................................................................................................................................................. 96
8.4. Institutional services.................................................................................................................................... 97
8.5. Township-Wide Ecosystem ................................................................................................................... 100
9. Important Sectors .............................................................................................................................. 102
9.1. Fourth Industrial Revolution - 4IR ...................................................................................................... 102
9.2. Automotive Sector .................................................................................................................................... 102

26
9.2.1. Stakeholders within the township automotive industry ...................................................................................... 102
9.2.2. Ekurhuleni Incubators ......................................................................................................................................................... 105
9.3. Transport nodes......................................................................................................................................... 105
9.4. Building Trade ............................................................................................................................................ 107
9.5. Financial Inclusion ..................................................................................................................................... 107
9.6. Creative economy ..................................................................................................................................... 107
10. Land use ................................................................................................................................................ 109
10.1. Land Administrative Policies ................................................................................................................. 109
10.2. Development Plans .................................................................................................................................. 110
10.2.1. Metropolitan Spatial Development Framework, 2015 .................................................................................... 110
10.2.2. Regional Spatial Development Framework, Region B, 2015 ........................................................................ 111
10.2.3. Transit Oriented Development Nodes................................................................................................................... 111
10.2.4. City of Ekurhuleni Built Environment Performance Plan, 2020 – 2021 .................................................... 111
10.3. Land Use Dynamics .................................................................................................................................. 112
10.4. Precinct Plans .............................................................................................................................................. 115
10.4.1. Tembisa Hub Plan, 2016 .............................................................................................................................................. 115
10.4.2. Thembisa Makhulong Community Precinct, 2019 ............................................................................................ 116
10.4.3. Leralla Node, Transit-Oriented Development Analysis and Strategy, 2016 (World Bank Group) 116
11. Prioritised and high potential nodes .......................................................................................... 118
11.1. Overview ....................................................................................................................................................... 118
11.2. Infrastructure and Natural Systems ................................................................................................... 121
11.3. Thembisa Civic Hub .................................................................................................................................. 123
11.4. Makhulong Community Precinct ........................................................................................................ 135
11.5. Limindlela Station Node ......................................................................................................................... 146
11.6. Leralla Station Node ................................................................................................................................ 152
11.7. Thembisa Station Node .......................................................................................................................... 161
12. Housing ................................................................................................................................................. 168
12.1. Overview ....................................................................................................................................................... 168
12.2. Conceptual Framework: Housing as social, economic and financial asset ......................... 168
12.3. Housing as social asset ........................................................................................................................... 171
12.4. Formal housing delivery ......................................................................................................................... 172
12.5. Informal housing delivery ...................................................................................................................... 174
12.6. Housing as economic asset ................................................................................................................... 178
12.6.1. Backyard rental ................................................................................................................................................................ 178

27
12.6.2. Home-based enterprises ............................................................................................................................................. 179
12.7. Housing as financial asset...................................................................................................................... 181
13. The Transport System ....................................................................................................................... 184
13.1. Transport Infrastructure .......................................................................................................................... 184
13.2. Development Challenges ....................................................................................................................... 185
13.3. Connectivity Between Different Modes ............................................................................................ 186
13.4. Transport Options and Services .......................................................................................................... 186
13.5. Integrated Public Transport Network ................................................................................................ 188
13.6. Non-Motorised Transport ..................................................................................................................... 191
13.6.1. NMT Precedents ............................................................................................................................................................. 192
13.6.2. NMT Plans ......................................................................................................................................................................... 194
13.6.3. Universal Access .............................................................................................................................................................. 195
14. Infrastructure ....................................................................................................................................... 200
14.1. Overview ....................................................................................................................................................... 200
14.2. Digital Infrastructure ................................................................................................................................ 200
14.3. Stormwater Infrastructure ...................................................................................................................... 201
14.4. Water and Sanitation ............................................................................................................................... 203
14.5. Sewerage Infrastructure ......................................................................................................................... 203
14.6. Solid Waste .................................................................................................................................................. 203
14.7. Energy Provision ........................................................................................................................................ 204
15. Environment ......................................................................................................................................... 204
15.1. Overview ....................................................................................................................................................... 204
15.2. Urban Agriculture...................................................................................................................................... 204
15.3. Green Infrastructure ................................................................................................................................. 206
15.4. Waste Collection and Recycling .......................................................................................................... 209
16. Urban conditions and management ........................................................................................... 211
17. Social and Cultural Considerations.............................................................................................. 216
17.1. Urban Everyday .......................................................................................................................................... 216
18. Potential Project Opportunities .................................................................................................... 218
18.1. Policy and Strategy ................................................................................................................................... 220
18.2. Enterprise Development ......................................................................................................................... 221
18.3. Nodal Development ................................................................................................................................. 222

28
18.4. Spatial Integration .................................................................................................................................... 223
18.5. Housing and Property ............................................................................................................................. 223
18.6. Social and Community Infrastructure ............................................................................................... 224
18.7. Urban Management ................................................................................................................................. 224
19. Next Steps............................................................................................................................................. 225
20. Annexures ............................................................................................................................................. 227
20.1. References.................................................................................................................................................... 227
20.2. Persons Consulted .................................................................................................................................... 229
20.3. Business Development Services .......................................................................................................... 231

29
IV. List of Figures
Figure 1: Examples of content shared through the Thembisa Virtual Imbizo .................................................... 42
Figure 2: Interactive GIS Tool ................................................................................................................................................. 44
Figure 3: Ecosystem Survey Instrument in the CommCare App .............................................................................. 46
Figure 4: Field work team in Thembisa .............................................................................................................................. 47
Figure 5: Overview of business size and legal status ................................................................................................... 70
Figure 6: Street trade predominates in much of Thembisa ....................................................................................... 71
Figure 7: Micro-enterprise businesses by enterprise classification ........................................................................ 71
Figure 8: Building and renovation of houses is an important local economic activity ................................... 72
Figure 9: Nationality of respondents .................................................................................................................................... 75
Figure 10: Respondent business roles and nationality ................................................................................................... 76
Figure 11: Respondent age and gender .............................................................................................................................. 76
Figure 12: Business infrastructure ........................................................................................................................................ 78
Figure 13: Occupation model and rent paid in ZAR ..................................................................................................... 80
Figure 14: Available utilities .................................................................................................................................................... 82
Figure 15: Time in business .................................................................................................................................................... 85
Figure 16: Comparison of respondent age and time in business ........................................................................... 86
Figure 17: Main operating challenges ................................................................................................................................ 87
Figure 18: Support deemed beneficial by respondents .............................................................................................. 88
Figure 19 Corporate businesses by enterprise classification ................................................................................... 89
Figure 20 SME businesses by enterprise classification ................................................................................................ 90
Figure 21: Access to services .................................................................................................................................................. 93
Figure 22: Hotspot place categories ................................................................................................................................... 95
Figure 23: Number of businesses per site type .............................................................................................................. 96
Figure 24: Operating barriers ................................................................................................................................................. 97
Figure 25: Institutional services ............................................................................................................................................. 98
Figure 26: Linking township micro-enterprises to larger markets through the use of 4IR technology
and cost-effective transport has potential to enhance business practice and market access ................. 100
Figure 27: Linking township micro-enterprises to larger markets through the use of 4IR technology
and cost-effective transport has potential to enhance business practice and market access ................. 101
Figure 28: Building on the taxi/public transport economy ..................................................................................... 106
Figure 29: The retail anchor allows for significant economic activity to be generated through the
adjacent streets - allowing for more diverse participants. The street allows for parking, loading and
pedestrian activity to occur - albeit rather congested. ............................................................................................ 124
30
Figure 30: The recently upgrade park provides a key pedestrian railway underpass in the
neighbourhood. The amenities require augmenting and programming to ensure better use of the park
across more diverse user groups to better use the space. ..................................................................................... 125
Figure 31: Signage is critical to micro street businesses and are well located to attract potential clients
and showcase services. These signs, their business, location and coordination presents a valuable
opportunity to strategise a coordinated response to signage and space making. ...................................... 136
Figure 32: The taxi rank comprises key uses - the train station, shopping centre and market, bring
great vitality to the rank. The links between the various spaces and the poor definition of the public
space renders the space performing sub-optimally. ................................................................................................. 153
Figure 33: This busy market caters to a diversity of users activists within the area. The trading spaces
could be enhanced to better provide for amenities and services for both trades and consumers, such
as seating spaces, storage, dedicated cooking spaces and shade. ..................................................................... 153
Figure 34: The irregular train service compromises coordinated economic growth at the station nodes.
The traders along walkways currently respond to consumers using the railway bridge to cross the
railway line. The existing infrastructure here can be appropriated for new uses. ......................................... 162
Figure 35: Housing Asset Values and their contribution to TED .......................................................................... 169
Figure 36: Residents of Thembisa make investments into the security and beautification of homes .. 172
Figure 37: Mixed Use Development proposed for Makhulong Community Precinct .................................. 173
Figure 38: Double Storey Rental Flats ............................................................................................................................. 175
Figure 39: Double Storey Rental Flats ............................................................................................................................. 175
Figure 40: Indlu Double Storey Rental Flats.................................................................................................................. 177
Figure 41: Private residential plots are optimised for additional rental housing - sometimes
demolishing the original house to make better spatial and economic use of the property. ................... 179
Figure 42: Micro-enterprises' use of fixed or mobile structures for trading .................................................... 180
Figure 43: Tenure status of micro-enterprises ............................................................................................................. 181
Figure 44: Typical cross-section of a complete street with a walkway/cycle track ....................................... 196
Figure 45: Examples of non-motorised and universal access infrastructure interventions........................ 198
Figure 46: Typical intersection layout with universal access design ................................................................... 199
Figure 47: The mobile trading structures allow traders to move to opportunity thereby optimising
sales. The design and functionality of these mobile micro business requires review to ensure economic
sustainability as they are currently existing shopping trolleys. ............................................................................. 199
Figure 48: This leisure facility is park of a larger natural system in Thembisa and a well-used public
asset that is well-suited to be optimised for increased usage and investment. ............................................ 206
Figure 49: Poorly defined spaces, open tracts of land, poor community literacy and urban
management allows for the exploitation of public space through littering/dumping and criminality. No

31
enforcement of by-laws (building control and dumping) results in a harsh environment for public
good. ............................................................................................................................................................................................ 212
Figure 50: The intensity of street trading puts extreme pressure on the existing sidewalks, often
creating hazardous pedestrian situations due to limited safe access. These spaces require
management and better design to harness the contribution of street traders. ............................................ 212
Figure 51: Urban Management Issues ............................................................................................................................ 213
Figure 52: Potential Development Opportunities ....................................................................................................... 219
Table 1: Project Opportunities in Thembisa..................................................................................................................... 15
Table 2: ATMs in Thembisa ..................................................................................................................................................... 98
Table 3: Uses Permitted under Land Use Zone Residential 2 ................................................................................ 114
Table 4: Residential 2 Building Lines ................................................................................................................................ 115
Table 5: Residential 2 Height, Coverage and Density ............................................................................................... 115
Table 6: Status Quo of Thembisa Civic Hub.................................................................................................................. 126
Table 7: Status Quo of the Makhulong Node .............................................................................................................. 137
Table 8: Status Quo of Leralla Station Node ................................................................................................................ 154
Table 9: Thembisa Transport Infrastructure (based on GIS Map) ........................................................................ 184
Table 10: Thembisa transport options and services .................................................................................................. 186
Map 1: Stormwater Infrastructure, Limindlela Station ......................................................................................................
Map 2: Thembisa in the context of the City of Ekhurhuleni ...................................................................................... 53
Map 3: Businesses, Business Hotspots and Institutions in Thembisa ................................................................... 69
Map 4: Micro-Enterprises by Classification ...................................................................................................................... 73
Map 5: Survey and Open Source Data on Micro-Enterprise Classification ......................................................... 74
Map 6: Micro-Enterprise Respondent Gender ................................................................................................................ 77
Map 7: Micro-Enterprise Structure Classification .......................................................................................................... 79
Map 8: Micro-Enterprise Site Rental ................................................................................................................................... 81
Map 9: Micro-Enterprise Water Access.............................................................................................................................. 83
Map 10: Micro-Enterprises Electricity Access .................................................................................................................. 84
Map 11: Corporates and SMEs .............................................................................................................................................. 91
Map 12: Corporates and SMEs Open-Source Data ....................................................................................................... 92
Map 13: Business Hotspots .................................................................................................................................................... 94
Map 14: Institutional Environment ...................................................................................................................................... 99
Map 15: Zoning ................................................................................................................................................................................
Map 16: Zoning in Thembisa .............................................................................................................................................. 113

32
Map 17: Nodes in Thembisa ............................................................................................................................................... 120
Map 18: Land Ownership ..................................................................................................................................................... 122
Map 19: Thembisa Civic Hub .............................................................................................................................................. 127
Map 20: Land Use, Thembisa Civic Hub ......................................................................................................................... 128
Map 21: Land Ownership, Thembisa Civic Hub ........................................................................................................... 129
Map 22: Zoning, Thembisa Civic Hub ............................................................................................................................. 130
Map 23: Sanitation, Thembisa Civic Hub ....................................................................................................................... 131
Map 24: Transport, Thembisa Civic Hub ................................................................................................................................
Map 25: Housing, Thembisa Civic Hub ........................................................................................................................... 133
Map 26: Development Proposals, Thembisa Civic Hub ........................................................................................... 134
Map 27: The Makhulong Node ..................................................................................................................................................
Map 28: Land Use, Makhulong Node .............................................................................................................................. 139
Map 29: Land Ownership, Makhulong Node ............................................................................................................... 140
Map 30: Zoning, Makhulong Node .................................................................................................................................. 141
Map 31: Transport, Makhulong ......................................................................................................................................... 142
Map 32: Stormwater Infrastructure, Makhulong Node ............................................................................................ 143
Map 33: Housing Dynamics, Makhulong Node .......................................................................................................... 144
Map 34: Development Proposals, Makhulong Node: ............................................................................................... 145
Map 35: Limindlela Station Node ..................................................................................................................................... 147
Map 36: Land Ownership, Limindlela Station Node .................................................................................................. 148
Map 37: Zoning, Limindlela Station Node ..................................................................................................................... 149
Map 38: Transport, Limindlela Station Node........................................................................................................................
Map 39: Stormwater Infrastructure, Limindlela Station ........................................................................................... 151
Map 40: Leralla Station Node ......................................................................................................................... 153
Map 41: Leralla Station Node .....................................................................................................................................................
Map 42: Land Ownership, Leralla Station Node .......................................................................................................... 156
Map 43: Zoning, Leralla Station Node ............................................................................................................................ 157
Map 44: Transport, Leralla Station Node ....................................................................................................................... 158
Map 45: Housing Dynamics, Leralla Station Node ..................................................................................................... 159
Map 46: Stormwater Infrastructure, Leralla Station ................................................................................................... 160
Map 47: Thembisa Station Node....................................................................................................................................... 163
Map 48: Land Ownership, Thembisa Station Node ................................................................................................... 164
Map 49: Zoning, Thembisa Station Node ...................................................................................................................... 165
Map 50: Transport Facilities and Routes, Thembisa Station Node ...................................................................... 166
Map 51: Stormwater Infrastructure, Thembisa Station Node ................................................................................ 167

33
Map 52: Housing Dynamics ........................................................................................................................................................
Map 53: Housing, Thembisa .......................................................................................................................................................
Map 54: Property Growth Rate, Thembisa ............................................................................................................................
Map 56: Transport Routes and Facilities ........................................................................................................................ 190
Map 57: Stormwater Infrastructure .................................................................................................................................. 202
Map 58: Environmental Features ....................................................................................................................................... 208

34
1. Situational Analysis Aims
The Cities Support Programme (CSP) of National Treasury (NT) has entered into an agreement with the
City of Ekurhuleni (CoE) to provide the City with technical support for formulating and resourcing a
township economy development (TED) strategy. The TED project of the CSP is a three-year intervention
to strengthen the capacities of the beneficiary metros to strategize, plan, fund, implement and monitor
TED projects within specific townships to achieve a meaningful economic development impact. In the
City of Ekurhuleni the selected site is Thembisa.
The Situation Analysis of Thembisa is an important output towards the process of developing a TED
development strategy. The aim of the situation analysis is to identify aspects and components of the
township economy that could benefit from project interventions within an overarching strategic
alignment. The purpose of the analysis is not to delineate or define projects, but to indicate
opportunities where projects could meaningfully contribute towards a TED outcome. The opportunities
we have identified in this report will, in subsequent steps in the project cycle, be further investigated
and refined into 8 implementable projects. The development process will include participatory
engagement with members from the community of potential beneficiaries and consultations with city
and other specialists. In addition, the opportunities will be further assessed to understand the project
risks and identify measures that could enhance sustainability and align to support structures within the
metro and wider business development service ecosystem.
The Situation Analysis provides a status report on crucial aspects of the township economy in Thembisa.
The analysis focuses on: i) the business ecosystem, ii) township micro-enterprises, iii) the land use
systems and characteristics that influences the spaces and places in which businesses are undertaken ,
iv) strategic spatial nodes, including precincts, v) housing, vi) public transport, vii) physical infrastructure,
and viii) the environment.
The draft report has been circulated to stakeholders in the relevant line departments, as identified
through a transversal planning process. The TED technical assistance team has engaged with
representatives from these departments with the purpose to stress test the data contained in the report,
obtain additional information and data, and consider alternative perspectives on the findings. These
inputs have been incorporated into a second draft. The current draft, version 2, provides an evidence
platform to inform the identification of projects and development of the TED strategy. Furthermore, the
35
situational analysis provides metrics to evaluate the proposed opportunities against capacity and
funding criteria, including alignment to City programmes, the identification of project leads, project
prioritisation, availability of funding within City budgets, access to external partnerships and
consideration of the value-add from CSP technical support and the TAT.
2. Cities Support Programme Overview
The Cities Support Programme is a multi-year demand-driven umbrella programme within the National
Treasury that aims to support the development of productive, well-governed, inclusive and sustainable
cities (http://csp.treasury.gov.za). The CSP operates within South Africa’s eight metros focused on the
following thematic components: Governance and Fiscal Sustainability, Climate Resilience, Economic
Development, Human Settlements and Public Transport. The CSP focuses on strengthening metro
capabilities through three core focus areas: one, city leadership and governance, two, integrated
planning and delivery within city spaces, and three, building an enabling environment for cities through
appropriate financial, fiscal frameworks and instruments and the refinement of sectoral policies,
regulations and support capabilities.
The economic development (ED) component of the CSP programme supports projects across all three
focus areas. Projects to support city partnerships for inclusive growth and regional economic
development collaboration are focused on building city economic development leadership and
governance capabilities. The Industrial Park Revitalisation, Sub-National Doing Business (a project that
enables cities to become more competitive in business processes related to small firms registering
property, receiving construction permits and getting electricity), and Township Economic Development
projects aim to strengthen integrated planning and delivery within metros. Finally, there are three
projects that intend to strengthen the enabling environment for metros, namely: Spatialised City
Economic Data; Economic Development Data Strategy; and City Incentives Review and Policy.

36
3. Township Economy Development Project Overview
3.1. Project Aims
The Township Economic Development Project is a 3-year project with technical support in the form of
a multi-disciplinary professional team. The project commenced in February 2020 and will conclude in
February 2023. The CSP has entered a memorandum of understanding with the City of Ekurhuleni (CoH)
to implement the project in one township community.
The CSP appointed the Sustainable Livelihoods Foundation (SLF) NPC (www.livelihoods.org.za) to
provide technical assistance.. The professional technical assistance team (TAT) of consultants comprises
a team leader; a small-business development advisor, a social scientist, a spatial planner, a public
transport expert, a housing specialist, an infrastructure development advisor, an environmental expert
and community liaison persons.
The SLF TAT partner is mandated to work with CoE to conceptualise an overarching TED strategy for the
selected township. The strategy will comprise a development vision, the delineation of specific project
(up to 8 projects), and a programme for implementation. The TAT partner will collaborate with CoE to
align the strategy to existing and emerging development frameworks, strategies and projects. The TAT
will advance the implementation of the strategy through specific projects. These projects will derive
from the unique development challenges and opportunities within each the site and hence respond to,
inter-alia, city enterprise policy and strategy requirements; the building of partnerships for project
implementation; the need for business infrastructure in high potential precincts or nodes; the
improvement in the delivery of enterprise development support services; transversal alignment within
the city and strengthened linkages across government; market development; and investment in
infrastructure.
In formulating projects and implementation plans, the TAT will facilitate a process of participatory
engagement at the township level to ensure that projects are responsive to the needs, capabilities, and
priorities of the beneficiaries. Within the City, the TAT will facilitate a transversal planning process with
the aim to advance projects with spatial impact, whilst synergising resources and ensuring alignment
with sector plans. The intention is to support a range of projects that impact directly through business
support services and indirectly through measures that improve the business environment and urban
condition.

37
It is anticipated that the TED strategies will provide the City with a replicable area-based development
approach. As a technical assistance support intervention, the project plans to leverage institutional
impacts through knowledge sharing, strengthening city strategies and policies, and through facilitating
transversal planning processes. The TED project, furthermore, aims to benefit the city through the
building of new partnerships and arrangements for the implementation of economic development
projects, the sourcing of funding, and gaining access to specialist knowledge and expertise.
The TED project will be undertaken in 7 Steps. The first step (step 1) requires a detailed situation analysis
of the socio-spatial, infrastructural and economic characteristics of the target township. The current
document contributes towards this output.
3.2. CSP TED Theory of Change
The TED project adopts an area-based approach to concentrate development within a specific
geographic site to address the pressing needs for local economic development and to reduce the
apartheid spatial and social legacies. The CSP has proposed a project Theory of Change (ToC) that
situates people and their communities at the heart of the development process. The foundation analysis
to this ToC is contained in the Township Economies Series #5: A framework for the development of
metro-strategies produced during the first phase of the CSP. In accordance with this ToC, townships are
recognised as spatially distinct areas that are structurally disconnected from the wider economy and
therefore require a spatially and systems-oriented development approach. The CSP framework
identified four central influences on TED development:
• the provision (and quality) of public goods and services,
• the regulatory environment that enables and constrains opportunities for business
development (and social enterprises),
• the organisation of society through informal institutions (rules, customs, constraining
behaviours etc.) and organizational forms (groups, associations, stokvels, neighbourhood
watches etc.),
• and the character and orientation of economic activities in general and businesses in particular.
As a foundational principal, the CSP ToC holds that spatial factors have a strong influence on both social
organisation and economic activities within townships. Hence TED must address spatial obstacles,

38
including land-use systems, and enhance spatial opportunities for inclusion in local economic activities
as well as the wider economy. At the project commencement, the TAT team have highlighted a further
set of components within the development processes. These include:
• The requirement for a context specific understanding of the physical, social and psychological
needs of township communities,
• The need to understand the range of shocks that enhance economic vulnerability and, at same
time, the human responses, including coping mechanisms, that enhance social resilience.
• The importance of actions to strengthen accountability and governance, within the metro and
down to benefiting communities.
In supporting CoE to develop TED strategies, the TAT support will clarify the methodological approaches
to identifying and prioritizing TED interventions. The strategies will detail the logical relationships
between actors, resources, activities and outcomes in the development, specifying indications against
which the TED strategies can be evaluated and assessed. The TED strategy for the CoE will provide a
crucial opportunity for learning and knowledge sharing, as well as reflection on the validity of an area-
based and spatialized approach to township economic development.
3.3. Project Partners
The CSP has entered partnerships to amplify the TED project. These include partnerships with the
European Union supported Ecosystem Development for Small Enterprise programme (EDSE), the World
Bank Group (South Africa) (WBG), and the Aspen Network of Development Entrepreneurs (ANDE).
The EDSE programme is an innovative, five-year programme designed to effect change across South
Africa’s SMME ecosystem. The programme aims to improve:
• The competitiveness of SMMEs and their ability to meet procurement requirements of large
multinational / local corporations and state-owned enterprises,
• Access to finance for SMMEs wo have limited, or no, access to finance,
• The regulatory and administrative environment for SMMEs.
The EDSE partnership aligns the TED project with an extensive range of technical and financial support
to the Department of Small Business Development (DSBD) and the Department of Agriculture, Land
Reform and Rural Development (DALRRD). This partnership will enable the TED project to facilitate city
and project access to development support opportunities within a broader ecosystem centred on the

39
DSBD, which includes the Small Enterprise Development Agency (SEDA) and the Small Enterprise
Finance Agency (SEFA). The EDSE programme provides opportunities and leverage to advance the
institutionalisation of SEDA’s new approach to servicing SMMES via the District Ecosystem Facilitation
model.
The World Bank Group offers technical and financial leverage to support the TED project development
process in accordance with a partnership agreement that is in place with National Treasury. This support
includes providing opportunities to metros to utilise the CSP’s Economic Strategies Support Facility
within the World Bank to access global expertise for advice on complex challenges. Furthermore,
through the WBG’s support to metros and local organisations focused on strengthening and improving
efficiencies within the township housing market, the WBG provides an opportunity for alignment of
technical expertise, as well as funding to pilot an intervention to develop the township accommodation
rental market segment. The WBG has highlighted its’ capabilities to assist metros address urban
management challenges, including safety and security in public sites including trading places and
recreational parks. The ANDE partnership offers further opportunities for technical co-operation and
knowledge sharing.
The CSP TED project will work synergistically with the Neighbourhood Development Partnership
Programme (NDPP) of National Treasury. The NDPP provides financial and technical investment towards
the development of nodes and precincts that strengthen the township economy in accordance with
strategic plans to densify cities in key integration zones and nodes. The TED project has drawn on and
sought to advance the situational report and design proposals for identified NDPP sites of strategic
importance in the benefiting township. The TED project will aim to enhance these investments through,
inter alia, strategizing an enterprise-led approach to strengthening precinct management and
identifying projects to support business opportunities.

40
4. Approach and Methods
The TAT undertook a series of steps in preparing the situation analysis. The seven steps that we
highlight below were undertaken simultaneously.
4.1. Establishment of transversal team
The project was institutionally landed in an initial series of high-level engagements, which commended
in 2019. In this project introductory phase, the TAT team was introduced to the metro departments of
economic development and CSP metro co-ordinator. The metro leadership team appointed a dedicated
project lead whose roles included the establishment of a transversal planning team and support to the
TAT in accessing data and conducting sector engagements.
4.2. Desk-top analysis
The TAT team identified all relevant municipal planning documents. These included the Built
Environment Performance Plans (BEPP); spatial development frameworks (SDF); district development
plans (DDP), local area plans (LAP) and plans for specific nodes; and integrated public transport network
(IPTN) plans. In addition, the TAT accessed feasibility studies for economic projects. Through examining
these documents, we were able to comprehend CoE spatial and economic development priorities in
Thembisa. The subsequence ecosystem survey and field research investigation focused on the identified
nodes, precincts and high streets. The consulted plans and literature are listed in Annexure A. We
identified a total of 117 sources, comprising official publications, academic publications and
unpublished reports.
To understand the history, structural nature of the benefiting township economies and sociological
characteristics of Thembisa, the TAT undertook a survey of professional (grey) and academic literature
on the subject of economic development, spatial planning and township enterprise. In addition, we
investigated the ‘urban everyday’ through scanning newspaper articles and social media postings. The
academic and social media information would shape our approach to participant engagement via the
virtual imbizo platform.
41
The desk-top analysis enabled the TAT to identify aspects of Thembisa township economy that has
undergone transition or recently emerged in response to changing business opportunities and market
conditions. Finally, the literature review gave the TAT an insight into the social relationships that
underpin business practices and shape the environment in which micro-enterprises operate, including
the role of informality.
4.3. Participatory engagement
In the context of Covid-19, the TAT instituted on-line engagements. This was achieved through the
establishment of a Thembisa Virtual Imbizo page on Facebook. To initiate support for the page, the
TAT ran a series of advertisements and promotional campaigns which offered air-time vouchers as prizes
for the ‘best’ contribution posted on the page via images or text. As a support base was established,
the TAT utilised the Virtual Imibizo to investigate socio-economic conditions and business
developments in Thembisa. These interventions included campaigns to understand innovative forms of
non-motorised transport; to investigate the scope of activities within the creative sector; and understand
peoples’ leisure time activities. Through the virtual imbizo page, the TAT was able to recruit local field
research to support the TAT undertake the ecosystem surveys late in 2020.
The Virtual Imbizo has also been used to advertise local businesses identified through field work and
action research interventions. This platform has also been used to post relevant business and job
opportunities. Engagement has also been fostered by disseminating the ecosystem survey results,
through a series of infographics and polls about which interventions people believe are priorities in key
locations in the study area.
As of April 2021, the Thembisa Virtual Imbizo had achieved the following level of support:
• Likes: 954
• Follows: 972
The Virtual Imbizo page recognises the multi-stakeholder composition of the TED development process,
including the City, project partners and the CSP. The TAT team will manage the page for the duration
of the project (until 2023).

42
Figure 1: Examples of content shared through the Thembisa Virtual Imbizo

43
4.4. Spatial information
To analyse the spatial dynamic of the site, the TAT obtained geospatial data from open sources and the
City. The goal was to obtain data on land use (zoning schemes), cadastral boundaries, social and
community infrastructure, water and sewerage systems, electricity networks, telecommunications,
natural features and roads and transport infrastructure. In some instances, the information we sought
to obtain was unavailable; these knowledge gaps are indicated in subsequent sections that address
land-use, physical infrastructure, transport systems and the environment.
From open sources (including Google Maps), the TAT identified businesses operating within the project
site and immediate surrounds.
All geospatial data has been compiled into a data portal. The portal has been utilised to examine the
development opportunities / limitations within Thembisa, from the area-wide perspective to the micro-
context of streets, nodes and precincts. Further, the data portal permits an analysis of the relationship
between the identified business activities (from open sources and the survey) across the scope of the
site and the physical relationship between businesses and the built and natural environments and public
infrastructure. The data portal comprises an important output of the situational analysis process. The
datasets have been compiled within a single PDF file, within which the document contains a series of
spatial layers that include the aerial imagery, site boundaries, land use, public infrastructure and
economic data. The PDF tool permits users to enable or disenable the GIS layers and hence focus on
specific issues and data relationships.

44
Figure 2: Interactive GIS Tool
The TAT undertook a spatial analysis of high streets, business nodes and development precincts, as
identified in planning documents. The precise area of these spaces are illustrated in our analysis of their
economic potential. The site layout, cadastral units and land-use zones have been extracted from the
geospatial portal and represented within accompanying diagrams. Within each of these micro-context
analyses, we have sought to indicate the proposed building footprint of developments. Furthermore,
we have utilised annotated photographs and field research notes / observations to comment on the
economic potential of these spaces.
4.5. Ecosystem survey
The TAT developed an ecosystem survey instrument to collect data within the field. The research
approach was to obtain information on the total ecosystem of businesses and institutional services
within the site. The research focussed on economic high streets, business precincts, retail hubs and
identified nodes / precincts. Using a multi-component questionnaire, the research instrument
comprised: i) a business survey; ii) a survey of places at which business is conducted (‘hot spot’ analysis);
iii) a survey of institutions (including financial institutions); and iv) a stakeholder survey.

45
The data gathering process was undertaken by a team of field researchers. The TAT team recruited, via
the Virtual Imbizo platforms, and trained local researchers for this purpose. In the field, information was
recorded on hand-held tablets, with the questionnaire built within the CommCare app. The tablets
permitted the researchers to capture photographic and geospatial data, whilst the app enabled the data
to be safely stored in the cloud.
Field research was undertaken from August to November 2020. The local field researchers were
supported by experienced SLF researchers as well as collaborators from the EDSE programme. The 7
local field researchers were selected from 200 applications. Measures were instituted to ensure that the
field research team adhered to recommended guidelines to minimise exposure to COVID-19.
In Thembisa the researchers undertook 586 interviews, which included surveys of 447 township micro-
enterprise businesses. We recorded 47 small and medium enterprises (SME) (including large, non-
corporate businesses), 23 corporates, 27 business ‘hotspots’ and 30 institutional services (including
financial services). During the field research, the team undertook interviews with 12 local stakeholders,
who included representatives of trader organisations and business forums. Further interviews will be
undertaken in Project Step 2.

46
Figure 3: Ecosystem Survey Instrument in the CommCare App
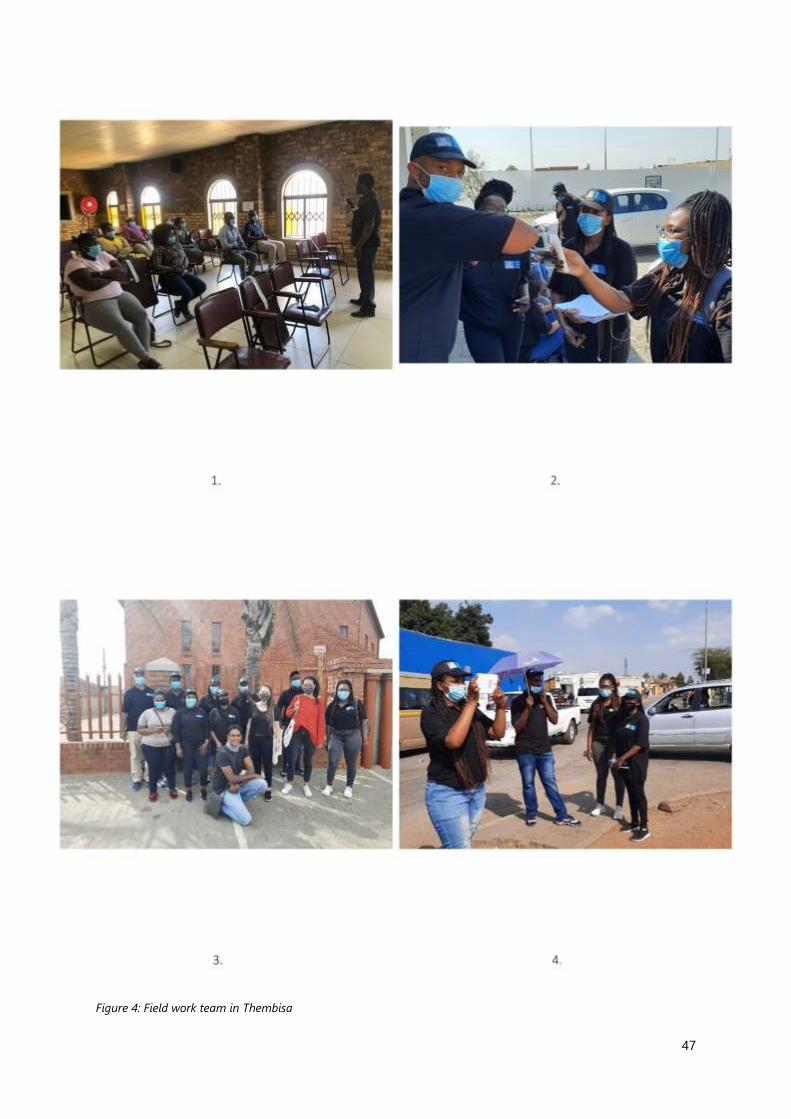
47
Figure 4: Field work team in Thembisa

48
Description of figures 1 -4:
Fieldworker team training in Thembisa.
Daily health screenings were conducted as part of Covid-19 infection control.
The field work team in Thembisa.
Interviews were conducted in-situ.
4.6. Site field research and engagement
The TA Tundertook an immersed field research process to understand the socio-economic
characteristics of business and urban dynamics. The research methods were largely qualitative. These
included: ethnographic observations and note taking; capturing photographs of sites and aspects of the
township economy including the use of space; conducting interviews with key persons, business
operators and representatives of trader / business associations. To obtain data, the TAT walked across
transects within the site. We specifically inspected sites that contribute towards ‘place making’ and social
cohesion. These included:
• The Thembisa civic hub,
• The Makhulong precinct,
• Reverend R.T. Namande Drive,
• George Nyanga Drive,
• Benjamin Ntlhane Drive,
• Thembisa station,
• Limindlela station,
• Leralla station,
• Leralla traders market,
• Ebuhleni Golf Course,
• Imbazelo Park,
• Thami Mnyele Cultural Park.
The enterprise surveys were largely undertaken within the civic hub; along George Nyanga Drive to the
intersection with Reverend R.T. Namande and southwards along Reverend R.T. Namande Drive to
Andrew Mapheto Drive. The researchers undertook extensive surveys within the Leralla station precinct,
including the informal traders market. A series of meetings was undertaken with representatives of the
traders to secure authorisation to conduct research in the market. The spatial specialists and transport

49
specialists inspected the three train stations and the Esangweni taxi rank. The EDSE team undertook
stakeholder interviews with the Yes4Youth Hub, the Ekurhuleni Industrial Hive and Computer Centre,
the Ekurhuleni Fab-Lab and the Gauteng Enterprise Propellor.
4.7. Sector specific investigations
In accordance with the CSP theory of change, the TAT undertook a series of sector specific studies into
essential aspects of the township economy. This research sought to characterise the state of knowledge
and identify both opportunities and constraints for leveraging economic growth and business
development. An important component of this research was our engagement with city specialists. In
some instances, the TAT has struggled to obtain internal reports / information and to secure meetings
with counterparts outside the Department of Economic Development. In revising the draft and
formulating the second draft, the TA will endeavour to schedule further meetings to address knowledge
gaps and obtain missing data. These gaps have been highlighted within the relevant sector status
reports.
A notable challenge in undertaking the sector specific studies was the relatively scarcity of area-based
data. To mitigate this challenge, the TAT sought to access unusual data sources, including private sector
datasets and qualitative data. Through the CSP partners and collaborators, the TAT has sought to obtain
insights and data on specific aspects of the township economy. In this respect, the CSP’s spatialised city
economic data project has provided anonymised tax-return information on a limited range of data
variables, derived from the tax returns of the businesses operating within the geographic area of the
site. From the Centre for Affordable Housing Finance Africa (CAHF), the TAT have obtained data on
formal market property transactions. Since the TAT has considerable experience in township research,
the team has obtained SLF datasets and qualitative evidence to address knowledge gaps. We report on
the analysis of these datasets in the relevant sections.

50
5. Limitations
The Situation Analysis is a rapid research output, developed through consulting existing reports, utilising
available dataset, engaging with stakeholders and conducting brief field research, including primary
data collection. The TED development approach has an action-research orientation, rather than purely
research orientation, an approach that does not permit the TAT to undertake extensive surveys and
consultation.
The area-based focus on a single township is a novel approach to TED planning. Yet it should be noted
that the project site does not neatly fit into the geographical area / units used in statistical enumeration,
in particular the Sub-Place and Main Place boundaries as defined by Statistics South Africa (StatsSA).
Nor does the sites align with ward boundaries (which are re-assessed and realigned after local
government elections), but instead the site includes multiple wards.
The complexities in characterising the site is reflected in the general shortage of site specific data.
Metros do not, as a matter of routine, collect and update geospatial data on township business activities,
whilst informal businesses or micro-enterprises operate in spatially fluid patterns and tend to resist
statistical enumeration. Open-source data, whilst providing an additional data source, also does not
reflect the frequent changes in the micro-enterprise environment. The data we obtained from these
open sources potentially includes businesses that are no longer in operation.
Shortly after the commencement of the project, the Covid-19 pandemic necessitated strict control
measures (lockdown) which then limited opportunities for in-person engagements and field-based
activities. Online engagements were instituted and proved to be a partially effective substitution for in-
person meetings and consultations. Whilst these engagements would permit organisational efficiency,
they did not enhance the process of building repour with the project steering team and nor were more
thorough day-long workshop possible. The TAT was only able to commence field research after the
introduction of level 3 restrictions, from August 2020. Despite our efforts to facilitate transversal
planning processes, the TAT was not able to consult with all relevant City stakeholders, nor were we able
to to access all the necessary GIS information..
The ecosystem enterprise survey method was intended to provide a broad-brush insight of business
activities within Thembisa. The approach was to conduct the survey on the high street and within specific
nodes. It was not possible to survey all contexts and situations, and thus we intentionally excluded
residential sites and transport operators. Since participation in the survey was voluntary, several business

51
operators did not participate for various reasons including their desire to avoid enumeration and fear
of state interference in their business practice (in other words, enabling formalisation).
52
6. Project Site
Thembisa is a large township (in both spatial and population terms) situated in Region B. It covers an
area of 32 km2. Region B comprises the north-western portion of CoE. The township is approximately
15 kilometres from Kempton Park. It is bordered by the R21 on the eastern side of the site. Thembisa
lies adjacent to Ivory Park which falls under the City of Johannesburg.
The project site comprises a core area within the broader township. The core area was identified in
relationship to the main mobility spine (Andrew Mapheto Drive) and the railway line that bisects the
township. The prioritisation of neighbourhoods within the spatial corridor (and core area) of these two
transportation systems aligns with the CoE priorities to support transit-oriented development (ToD).
The core sub-places (StatsSA) are: Ibazelo, Emkatini, Lifateng, Tamong, Teanong, Seotloana, Kopanong,
Mashimong, Tembisa Ext 26, Isithame, Unfuyaneni, Moteong, Entshonalanga, Umnonjaneni,
Khatamping, Motsu, Leboeng, Umthambeka, Endulweni, Igqagqa, Umfuyaneni, Esangweni, Thiteng,
Lekaneng, Mpho, Emkatini, Moedi, Tsenolong, Maokeng, Tlamatlama, Tsepo, Makulong, Welomlambo,
Isivana, Ethafeni, Jiyana, Inixeni and Esiziba.
The area is shown in Map 1.

53
Map 2: Thembisa in the context of the City of Ekhurhuleni

54
7. Institutional ecosystem
Townships are spatially distinct areas, structurally disconnected (in large extent) from the wider city
economy. The nature of society within these geographically marginalized spaces is in turn, shaped by
four framework influences:
• the provision (and quality) of public goods and services,
• the regulatory environment which enables and constrains opportunities for business
development (and social enterprises),
• the organisation of society through informal institutions (rules, customs, constraining
behaviors etc.) and organizational forms (groups, associations, stokvels, neighbourhood
watches etc.) and,
• the character and orientation of economic activities and businesses.
Government strategies and programmes at national, provincial and metro levels have been evolved to
support the reshaping of the above influences and enhancement of economic opportunities within
township economies.
7.1. National government programmes
The Department for Small Business Development (DSBD) is the national government agency
responsible, with its associated agencies, for enabling enterprise support. DSBD is mandated to operate
the Small Enterprise Development Agency (SEDA) and the Small Enterprise Finance Agency (SEFA).
Government programmes at a national level of relevance to township economic development include
the following:
• New incentives (with the Medium-Term Expenditure Framework (MTEF) period),
• The Small Business and Innovation Fund (R3,2b),
• Black Business Supplier Development Programme (R906m),
• National Informal Business Upliftment Scheme (R248m),
• Enterprise Incubation Programme (R186m),
• Craft Sector Programme (R36m),
• SheTrades,
• Township Entrepreneurship Fund,
• Township and Rural Entrepreneurship Fund (TREP).

55
Outside of the DSBD, other national government initiatives include those by Cooperative Governance
and Traditional Affairs (COGTA), and the National Youth Development Agency (NYDA), in particular:
• The Integrated Township Economic Development Programme (COGTA),
• The NYDA Grant Programme.
The DSBD also directly manages the Black Business Development Programme (BBSDP), Co-operatives
Incentive Scheme (CIS), Shared Economic Infrastructure Facility (SEIF) and the Informal Micro Enterprise
Development Programme (IMEDP). Some of the key partners and programmes under the DSBD
mandate are discussed below.
7.1.1. Small Enterprise Development Agency
SEDA is an agency of the DSBD with a mission to develop, support and promote small enterprises
throughout the country through non-financial business support. By 2019, SEDA had a network of 53
branches, 17 information kiosks, 74 outreach offices where SEDA shared with other ecosystem partners
and 76 incubation centres. In 2019, SEDA reported that 6,957 new jobs were created and 19,064 jobs
sustained by supported clients.
An ecosystem appraisal undertaken as part of the inception of the EDSE Small-Medium and Micro-
Enterprise (SMME) support programme observed that although Seda was designed to be the premier
hub for the delivery of Business Development Services (BDS), it is only one player among a large number
of institutions that fund and support SMMEs, without a key role in coordinating the market for BDS.
Though SEDA has attempted to act as a coordinator, notably in the incubator space, these efforts have
not been reaching SMMEs in large numbers.
The EU Inception Report noted that whilst South Africa has a highly developed BDS market, it is
insufficiently accessible for different types of SMMEs with inconsistencies in the quality of the services..
SEDA, however, has not had sufficient capacity to resolve these issues. SMMEs face challenges in
accessing supply chains and would benefit from support to identify opportunities and facilitate
programmes (BDS, financial services) that could enable access to these markets.
More recently, SEDA has shifted strategy to focus on becoming an effective facilitator of the BDS market
in South Africa rather than a direct provider, focused on strengthening the SMME support ecosystem.
As part of this role as an ecosystem facilitator, SEDA is developing minimum standards and a registration

56
platform for BDS providers, as well as mapping and coordinating public and private incubators. It is also
actively transitioning to delivery based on the government’s new District Model initiated for
development implementation in 2019.
7.1.2. Small Enterprise Finance Agency
Since 2017, SEFA has facilitated funding to 2,946 township-based/owned enterprises amounting to R199
million. The focus on supporting township-based/owned businesses was in line with the call from
government to develop rural and township economies into more economically and socially sustainable
communities. SEFA’s disbursement to township-owned enterprises makes up just 1% of the total SEFA
investment into the South African economy of R6.8 billion. This funding was disbursed through SEFA’s
different loan programmes as follows: direct lending (R108 million), wholesale lending to SMEs (R52
million); Khula Credit Guarantee (R13 million), microfinance (R22 million) and co-operative lending (R3
million). A Township Entrepreneur Fund has recently been announced.
7.1.3. Black Business Supplier Development Programme
The BBSDP was introduced in 2002 to address the limitations associated with the participation of black
owned small enterprises in the mainstream economy. The BBSDP is a cost-sharing grant offered to
black-owned small enterprises to assist them to enhance their competitiveness and sustainability to
facilitate their integration into the mainstream economy. It provides grants to a maximum of R800 000
for tools, machinery and equipment and R200 000 for business development and training interventions
per eligible enterprise to improve corporate governance, management, marketing, productivity and use
of modern technology.
The BBSDP provides funds to black owned township enterprises. The support to township enterprises
has decreased from 123 (R56.2 million) to 77 (R37.9 million) from 2016-2019. The budget for the current
medium term expenditure framework (MTEF) is R906m.
7.1.4. Co-operative Incentive Scheme
The CIS is a 100% grant for registered primary co-operatives. The objective of the CIS is to improve the
viability and competitiveness of co-operative enterprises by lowering their cost of doing business
through an incentive that supports Broad-Based Black Economic Empowerment (B-BBEE). The number
of co-operatives supported through CIS has decreased from 58 to15 from 2015-2019. The amount

57
disbursed has decreased from R11.6 million to R2.7 million from 2015-2019. Of this, 6.7% was to co-
operatives based in townships.
7.1.5. Shared Economic Infrastructure Facility
SEIF intends to leverage public sector investment that would provide necessary shared infrastructure by
creating an enabling environment for businesses to crowd in investment, mostly in townships, rural
areas and the inner city where there is clear business activity taking place. This instrument is designed
to cover the funding of common infrastructure that is either new, upgraded or maintained and is shared
by a certain number of informal businesses, SMMEs and co-operatives. It is a 50/50 contribution with
the municipality, province and any other partners that seeks to contribute towards this partnership. The
DSBD contribution to the facility is up to R5 million per project. R55.4 million has been disbursed from
November 2017 up to August 2019 covering 15 shared infrastructure facilities in the Eastern Cape,
Limpopo, Western Cape, North West and Kwa-Zulu Natal from which 454 enterprises benefitted..
7.1.6. Informal and Micro Enterprises Development Programme
IMEDP is a 100% grant offered to informal and micro-enterprises from the minimum grant amount of
R500 up to the maximum of R10000 to assist them in improving their competitiveness and sustainability.
IMEDP distributed R 25.5 million to 2007 beneficiaries from November 2018 - March 2019.
The objectives of the IMEDP are:
• To provide developmental support to informal and micro-businesses that are operating in
urban centres (preferably townships) and rural areas and owned by historically disadvantaged
individuals.
• To strengthen the capacity of credible informal and micro-enterprises to be sustainable through
the provision of access to information, business development support services and business
infrastructure (machinery, tools, equipment).
7.1.7. The Small Business Innovation Fund
The SBIF was announced in 2019 and provides a mixture of grants and loans through a new blended
finance model fund that aims to finance 100 000 young entrepreneurs. The grant portion will be up to
a maximum of R2.5-million per enterprise. The fund is run jointly by the DSBD and the Department of

58
Science and Technology; the grant is administered by SEFA. It is targets black-owned businesses in
townships and rural areas.
According to Minister Ntshavheni (Parliamentary Briefing, 10 July 2019), applicants must have the
potential to create at least 10 jobs to be eligible for funding. The National Treasury’s 2019 Budget
Review notes that R3.2-billion has been set aside over the next three years for the fund, which it will
lend to small business intermediaries, including fund managers and incubators. It is these intermediaries
will fund and support ideation and start-up companies, and small businesses focusing on innovation.
7.1.8. Township and Rural Entrepreneurship Programme
The DSBD, as part of its response to COVID19, initiated TREP to channel support to the township and
rural enterprises in the listed sectors, with the allocated budget support:
• Auto body repairers & mechanics: R225 million
• Bakeries & confectioneries: R100 million
• Clothing, textile and leather: R105 million
• Tshisanyama (braai restaurants): R 50 million
• Spaza shops support programme: R138.5 million
• Personal care services: R90 million
Current priorities within the programme include:
• Small-scale bakeries – the assistance comes in the form of a financial package, through SEFA,
structured to cover the cost for equipment and working capital. It also proposes an off-take
agreement with Spaza’s for distribution of goods.
• Informal and small-scale clothing/textile producers – this support is aimed at the funding
of small clothing or textile makers, including PPE (Personal Protection Equipment)
manufacturing. The improvement in quality manufacturing of garments is also taken into
consideration that will enhance competitiveness.
• Automotive Aftermarkets Support – is aimed at independent automotive aftermarkets
businesses or enterprises located in townships and villages. The programme also prioritizes
informal fitment centres, qualified motor mechanics to operate an authorized repair centres,
qualified auto motor body repairers, and distributors of aftermarket auto parts.

59
7.1.9. SheTrade
The SheTrade digital platform is a programme for female entrepreneurs, jointly supported by DSBD and
SEDA. SheTrade aims to enhance support to women by connecting beneficiaries to potential investors,
business support organisations, and potential buyers. Through SheTrade platform, female
entrepreneurs will be exposed to a global market by connecting nationally, and regionally with other
female entrepreneurs and networks. The goal is to have 250 000 women-owned or led businesses
connect to markets by 2023.
7.1.10. District Information Management System
An ongoing challenge faced by the different levels of government, department agencies and
programmes is the poor coordination of BDS services. As a result, the SMME development landscape
is fragmented, whilst consolidated data cannot be produced as data is being held across multiple
platforms. The newly initiated DIMS will more effectively track BDS interventions and the impact of these
interventions, offer quality assurance and improved enterprise supplier development, and enable shared
information on the BDS ecosystem. A key benefit of the DIMS is alignment with the existing datasets of
the DSBD and agencies in a “single version of the truth”. The DIMS is to be managed by SEDA, but will
be accessable to the BDS ecosystem as a whole.
7.1.11. The Integrated Township Economic Development Programme
The Integrated Township Economic Development Programme is designed to respond to the need to
position townships as the foremost intervention of government, in developing thriving local economies.
Specific programmes will be designed to complement the needs of townships and these packaged
interventions. The programme is anchored in the following strategic pillars:
• Mapping and profiling of townships
• Ecosystems for township economies
• Economic Infrastructure and technology development
• Exemption incentives for township economies
• Investment strategies of township economies
• Spatial Transformation of township economies
• Image enhancement of township economies

60
7.1.12. Small Business Economic Development Portal
The Small Business Economic Development Portal – an initiative by the Department of Small Business
Development, SEFA and SEDA, has been established to draw in and register SMMEs for support from
the Department – in particular linked to the economic downturn caused by the COFID-19 pandemic.
The portal is coordinated through the website www.smmesa.gov.za and a hotline. The portal and
initiative includes:
• SMME finance relief scheme soft loan facility for COVID-19 relief,
• Business growth and resilience facility – linked to health care product suppliers in the fight
against COVID-19,
• Restructuring of SEFA funded loans – payment holidays for SEFA loan beneficiaries to reduce
burden of obligations during the COVID-19 pandemic,
• Informal sector – programmes for business owners, spaza shops and the self employed.
7.1.13. NYDA – Grant Programme
The NYDA Grant Programme is designed to provide young entrepreneurs with an opportunity to access
both financial and non-financial BDS to establish or grow their businesses. The target audience is youth
beneficiaries. The BDS includes cooperative development programme, business management training,
mentorship, and business consultancy services. The programme will provide funding for individuals or
enterprises, with certain sectors eligible for up to R250 000 in partial, co-funding or towards loan
deposits. Young entrepreneurs can access a voucher programme that allows for them to get business
support from a NYDA approved BDS service provider. The vouchers range from R6 600 – R19 800.
7.2. Gauteng Province Programmes
The Gauteng Provincial Government (GPG) has prioritised township economic development, with the
first phase of its Township Revitalisation Strategy (TRS) covering the period 2014 – 2019, and a second
phase currently being finalised. Within the TRS framework it has been recognised that strategic
accessibility and connectivity to markets is required to transform township economies – rather than a
model in which every facility and support institution is replicated in every township.
7.2.1. Growing Gauteng Together 2030

61
Growing Gauteng Together (GGT) 2030 was launched at the 2020 State of the Province Address (SOPA)
by the Premier, David Makhura. GGT aims for ‘building sustainable development for all’, creating jobs
and opportunities, with a focus on the Gauteng City Region (GCR). In its economic policy, GGT aims to
develop social compacts with the private sector, labour and communities in relation to the following
ten high-growth sectors:
• Energy, with a focus on new technologies and a diverse energy mix,
• Transportation and Logistics,
• ICT, Media and Digital Services – the digital economy,
• Tourism and Hospitality,
• Agri-food and Agribusiness, focusing on value chains,
• Construction and Infrastructure,
• Automotive, Aerospace and Defence,
• Financial Services,
• Cultural and Creative Industries,
• Industrialisation of Cannabis.
The GPG aims to establish innovation systems linked to each high growth sector. According to the
Premier, by 2025, the GCR will have three fully operating Special Economic Zones, in Ekurhuleni,
Tshwane and Sedibeng. In addition, there will be fifteen revitalised industrial parks, twelve agri-parks
and five agro-processing facilities across the five corridors. This will be a single industrial ecosystem that
supports the 10 high-growth sectors and township SMMEs.
In terms of public services, the GGT has a strong emphasis on water and energy security and a focus on
promoting renewable energy. The GPG is engaging with the private sector on how to collaborate and
share resources in the rollout of affordable broadband connectivity and free Wi-Fi to poor households.
7.2.2. The Township Economic Revitalisation Action Plan
While part of the wider GGT strategy , the GPG has also paid particular attention to township economic
development.
The policy approach being taken by GPG has been developed and incorporates the following elements:

62
• Change how townships are regulated and governed so that the assumption is that any business
which can be legal, is legal, subject to certain conditions so that businesses can be recognised
and funded.
• Change how businesses in townships are legally recognised to allow firms to be formally
recognised by the government and BDS programmes designed to help them.
• Revise state procurement rules and programmatic support which allow government and its
main contractors to buy from large groups of township-based firms, with systems linking them
so they can supply if they were one large firm. This will build the capacity to supply the private
sector and open private sector markets to township firms by enabling discovery of suppliers,
de-risking the supply relationship and targeting programmatic support so that it enables
delivery. The same will be done with NGO funding to drive the care economy.
• Use the data from government procurement systems and other digital systems run by partners
to de-risk lending to township firms of all sizes by financial service providers.
• Turn taxi ranks into micro-CBD’s and support the taxi economy to use its scale to grow
supporting value chains and industries.
• Use a backyard real estate development model to convert areas with high commercial densities
into township high streets.
This analysis underpins the proposed Township Economic Development Bill.
7.2.3. The Township Economic Development Bill
The GPG Legislature introduced the Township Economic Development Bill (TEDB) in the June 2020. Its
finalisation requires further refinement and delegation of tasks with respect to the functional areas of
Provincial and Municipal legislative competence as well as executive authority and administrative
control. The intention of the TEDBl is to designate areas as townships and to ‘greenline’ these for certain
forms of regulatory reform. The Bill introduces the notion of a Standard By-Law for Developmental
Township Governance that reflects the regulatory principles of the Bill, with municipalities within
Gauteng expected either to adopt the recommended Standard By-Law or demonstrate how their
regulations comply with the regulatory principles in the Bill .
The TEDB outlines the following additional BDS measure:
• Procurement spend:
GPG aims to spend R4 billion per annum in buying goods and services from 2,000 township
enterprises. The aim is also to ensure increased value for money, with a recognition that in some
63
instances, procurement from township enterprises simply meant government was paying an
added mark-up on goods sourced from suppliers outside the township.
• Access to finance:
The GPG is partnering with selected banks to provide guarantees linked to purchase orders for
provincial procurement contracts. This strategy will unlock access to finance for entrepreneurs
who might not otherwise have the cashflow to service larger-scale contracts, enabling business
growth.
• The SME Clearing House:
GPG has set up a platform for the registration of SMEs, that includes geo-location, with the
intention of using this platform as the basis for state procurement from SMEs. The SME Clearing
House currently has over 20,000 SMEs registered on it, with these mapped on an on-line map
at https://www.gpgsmmes.co.za/.
• A focus on High Streets:
GPG proposes to work with the taxi Industry and municipalities to rezone and develop taxi ranks
into retail and commercial hubs that will create markets for local mechanics, panel-beaters,
retailers, food sellers and manufacturers.
7.3. Other Enterprise Development Support
A comprehensive enterprise eco-system appraisal of Gauteng was undertaken by Aspen Network of
Development Entrepreneurs in 2018. The ANDE report highlights that Gauteng is the most developed
province in South Africa but suffers from disparities of support between wealthier and poorer suburbs,
with a gap in the market for ecosystem players that are interested in investing in infrastructure
improvements in underserved areas, such as shared workspaces, internet access, and incubation hubs.
The ANDE report argues that more early-stage risk capital should be made available to aspiring
entrepreneurs in the ideation phase to develop their business ideas into commercially viable products.
This will encourage more innovative and opportunity driven entrepreneurship. It would also ensure a
more inclusive environment for entrepreneurs from more vulnerable populations, including women and
youth.

64
7.3.1. Gauteng City Region Development Plan (2015-2020)
The GCR Economic Development Plan (EDP) (2015- 2020) intends to drive economic growth through
strategic targeting of priority sectors. Based on the current economic structure of Gauteng Province, the
GCR EDP is biased towards the service sectors, especially community services, finance and transport.
These sectors tend to employ less people than those such as manufacturing, transport and construction
(although these more productive sectors are experiencing a decline as a process of de-industrialisation
unfolds in the province). The GCR EDP purports that the manufacturing sector should be at the centre
of economic growth and development, and there is a need to invest skills in various sub-sectors of the
economy whilst simultaneously addressing the high barriers of entry characterised by many of these
industries – in particular those with high growth potential such as agro-processing and steel. Such an
approach would have high multiplier effects in terms of inclusion. The township economy could
potentially benefit from investments in the following sectors:
• Food and beverages
• Furniture and timber
• Clothing footwear textile and leather
• Pharmaceuticals, plastics and chemicals
• Machinery and equipment
• Construction, building material and real estate
• Automotive and components
• Mining and mineral beneficiation
• Finance and retail
• ICT
• Tourism and creative industry.
7.4. Ekurhuleni Programmes
7.4.1. Ekurhuleni Growth and Development Strategy 2025
The Growth and Development Strategy (GDS) 2025 of the City forms the basis of medium and short-
term planning, and guides the policy budget as the Cityo seeks to implement its mandate, to make
Ekurhuleni ‘a better place in which to live, work and play’. The GDS 2025 sets out the City’s overall vision,
noting the need to integrate townships into the mainstream by means of various programmes including

65
the promotion of local job opportunities by linking local labour to labour centres, the upgrading or
formalisation of informal settlements including the eradication of basic services backlog.
The GDS recognises Thembisa as one of the four major concentrations of historically disadvantaged
communities. The GDS further states that that all these communities are situated on the outskirts of the
main urban area and are in the areas furthest removed from where the bulk of job opportunities are
situated.
7.4.2. Ekurhuleni Ten (10) Point Economic Plan
The CoE launched the Ten (10) Point Economic Plan in 2018 to provide strategic prioritisation to
accelerate the development of industry and manufacturing. The plan aims promote economic
development in accordance with the principles of environmentally sustainable approaches, expanding
value chains and nurturing the place of small enterprises within these chains, and improving the labour-
absorption capacity of industry through targeted skills development. The plan focuses on 10 priority
areas:
• Revitalization of the manufacturing sector,
• Acceleration of Industrial Development Zones / Special Economic Zones programme,
• SMME support through public procurement,
• An enabling public transport system,
• Promoting localisation and production,
• Implementing the aerotropolis master-plan,
• Unlocking land for strategic development, including unused erven in the townships,
• Implementing the Township Economic Strategy,
• Undertaking infrastructure investment,
• Skill, capacity development and institutional stabilisation.
The 10 Point Plan builds-upon the GDS and IDP. It supports the densification of real estate development
along transport corridors and around economic nodes, which in turn, will enhance employment
opportunities for residents via improved public transport and locally availability opportunities for
SMMEs.
66
7.4.3. Integrated Development Plan (IDP) 2018/19
The Ekurhuleni IDP is mainly focused on the overall socio-economic development challenges facing
Ekurhuleni with elements of the plan having an indirect bearing on township economic development
The IDP reports:
“Township economy revitalisation refers to the support of all township trading activities
undertaken by community-based enterprises aimed at meeting the needs of the township
residents. Business activities in the Ekurhuleni townships are robust, diverse and range from
retail, industrial activity to construction. The City has successfully implemented innovative
programmes to create economic renewal in the townships. These initiatives include business
incubation and industrial skills programme targeting entrepreneurs in the townships. In this
regard, 262 enterprises participated in the business incubation programme and 2137 youth
benefited from the industrial skills programme in 2016/2017.”
Infrastructure development in townships is also flagged within the flagship project on Urban Renewal.
7.4.4. Economic Development Department
The mandate of the Community Enterprise and Economic Development Department is to lead, facilitate
and promote economic transformation, inclusive growth and socio-economic development within the
metro. The sub-directorate contributes towards this goal through the implementation of the Ekurhuleni
Community Enterprise Fund (ECEF). Thehe R300 million ECEF is intended to support the development
of community enterprises in the form of individual entrepreneurs, small, micro and medium enterprises,
cooperatives, informal traders and formal business. The Enterprise Fund provides financial (R50,000 to
R1.5 million) and non- financial (business plan, post investment support) assistance to promote
township economy development, industrialisation and human development..
7.4.5. Business Development Services in Thembisa
• SEDA
The Seda branch in Ekurhuleni closed in 2016/2017. It re-opened on a much smaller scale in
late 2018 and business advisors were appointed in January & February 2020 to increase capacity
and a wider reach. These capacity constraints resulted in limited services in many of the
townships in Ekurhuleni including Thembisa. Just five businesses received support from SEDS
in the last 11 months.

67
• GPG Programmes
As part of their procurement spend on township economies, GPG spent a total of just under R3
million in Thembisa on 33 contracts in Quarter 4 of 2019. Most of the expenditure on
educational services was for school nutrition programmes.
The Thembisa eKasiLab is based at the Thembisa Business Park, and is an initiative of the
Innovation Hub, under the umbrella of thee Gauteng Enterprise Development Propellor. The
eKasiLab offers a year’s incubation to youth entrepreneurs at the ideation stage of their
business, prioritising SMMEs in ICT, agro-processing, and bio-economy sectors.
• Metro Business Hubs
The Community Enterprise Department has established a series of township enterprise hubs to
support small businesses. Support is varied and can include providing space, incubation
facilities, shared industry production facilities, light manufacturing workshops, business
networks platforms and mentorship or handholding sessions. The City established the 36-unit
Thembisa Business Park in Mncatsa Section. A Chemical Incubation Hub is to be established
to support manufacturing SMMEs producing chemical detergents, cosmetics, hair care products
and perfumes.
• Youth Employment Service (YES)
The Youth Employment Service (YES) is a national initiative that aims to enable companies and
communities to create one million opportunities over time. Yes4Youth entails a partnerships
with government, civil society and labour to tackle South Africa’s youth unemployment.
The first of 100 planned Community Hubs was opened in June 2018 in Thembisa to absorb
unemployed youth, ignite local economies and promote local markets. This hub assists small
businesses to absorb youth labour. The Yes4Youth programme provides training that positions
young township residents to the modern-day economy and for work in small business. The
Yes4Youth Community Hub provides much needed business infrastructure in rural and
townships as well as seed new nodes of economic activity and growth in disadvantaged
Communities.
• Township Entrepreneur Alliance (TEA)
The Township Entrepreneur Alliance (TEA) began in Thembisa and brings workshops into
Thembisa that focus on business development and mentorship sessions.

68
8. Enterprise activity
8.1. The Micro-Enterprise Ecosystem
8.1.1. Approach
The ecosystem surveys were conducted in Thembisa in late October 2020. The aim of the ecosystem
survey was to record evidence of: i) business activities, ii) institutional facilities and iii) business hotspots
and spatial opportunities. It is important to note that the ecosystem survey is designed to provide a
snapshot of business activities. A full census would require extensive field research, which is not possible
within the scope and aims of the TED project.
The research team surveyed 517 businesses (micro-enterprises, SMEs and corporates), recorded 27
business hotspots and 30 institutional services.
The image below provides an overview of economic activity in Thembisa. Points in green are businesses,
points in yellow are institutional services, and points in white are the business hotspots on which the
research focused.

69
Map 3: Businesses, Business Hotspots and Institutions in Thembisa

70
Of the 517 businesses identified in the survey process, 4% (23) were Corporates, 9% (47) were SMEs,
and 86% (447) micro-enterprises. All corporates and 94% (44) of SMEs were formal whilst 86% (385) of
micro-enterprises were reported as informal businesses.
Figure 5: Overview of business size and legal status
8.1.2. Scale and Categorisation
Micro-enterprises make up 86% of businesses identified. Of the 447 micro-enterprises, 83% (369) of
businesses were open and full interviews were recorded. The range of categories is shown in the figure
below. Thembisa site has various clusters of trading sites, comparatively a large number of street traders
and diverse economic activities. The most numerous business activity in the site was that of (second-
hand) clothes retailing (44 / 10%) – mostly conducted as a street trading activity. Food businesses were
also commonplace, including retailing of fruit and vegetables (44 / 10%), cooked food (40 / 9%) and
snacks & cigarettes (39 / 9%). In terms of service-related businesses hair salon micro-enterprises (35 /
8%) were again commonplace. One prominent business venture that was quite widely spread
throughout Thembisa was that of appliance repairs. These businesses operated from a variety of outlets
– from street trading to private homes to dedicated shopfront premises (including shipping containers)
and specialised in television, kitchen appliance and cell phone repairs.
2344 62
3
385
0
50
100
150
200
250
300
350
400
450
corporate sme Micro-enterprise
Bu
sin
ess
lega
l sta
tus
Business size vs legal status
Formal (n=129) Informal (n=388)

71
Figure 7: Micro-enterprise businesses by enterprise classification
29
14 3 1
916
10
2 2
4440
4 2 2 2 1 17
44
3035
3
13
4 62
94
34
104 2
5
39
39 7
1 2 105
101520253035404550
No
. bu
sin
esse
s
Business types
Enterprise classification: Micro-enterprises
Figure 6: Street trade predominates in much of Thembisa
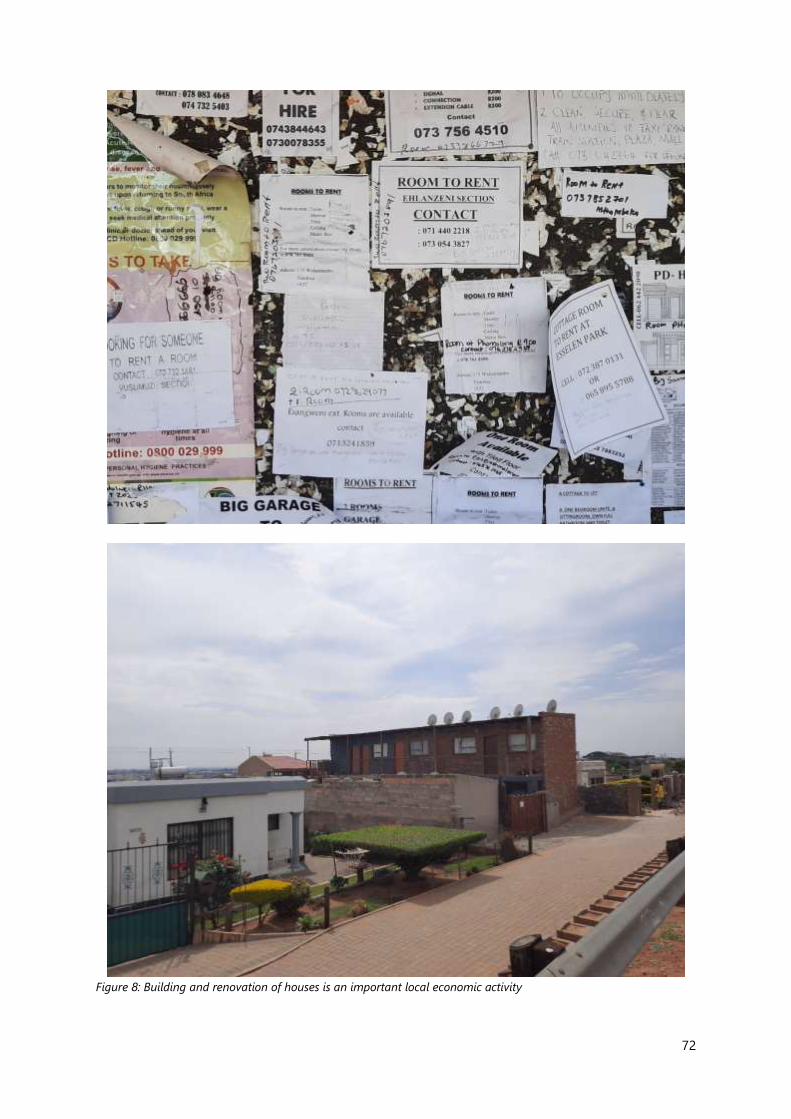
72
Figure 8: Building and renovation of houses is an important local economic activity

73
Map 4: Micro-Enterprises by Classification

74
Map 5: Survey and Open Source Data on Micro-Enterprise Classification
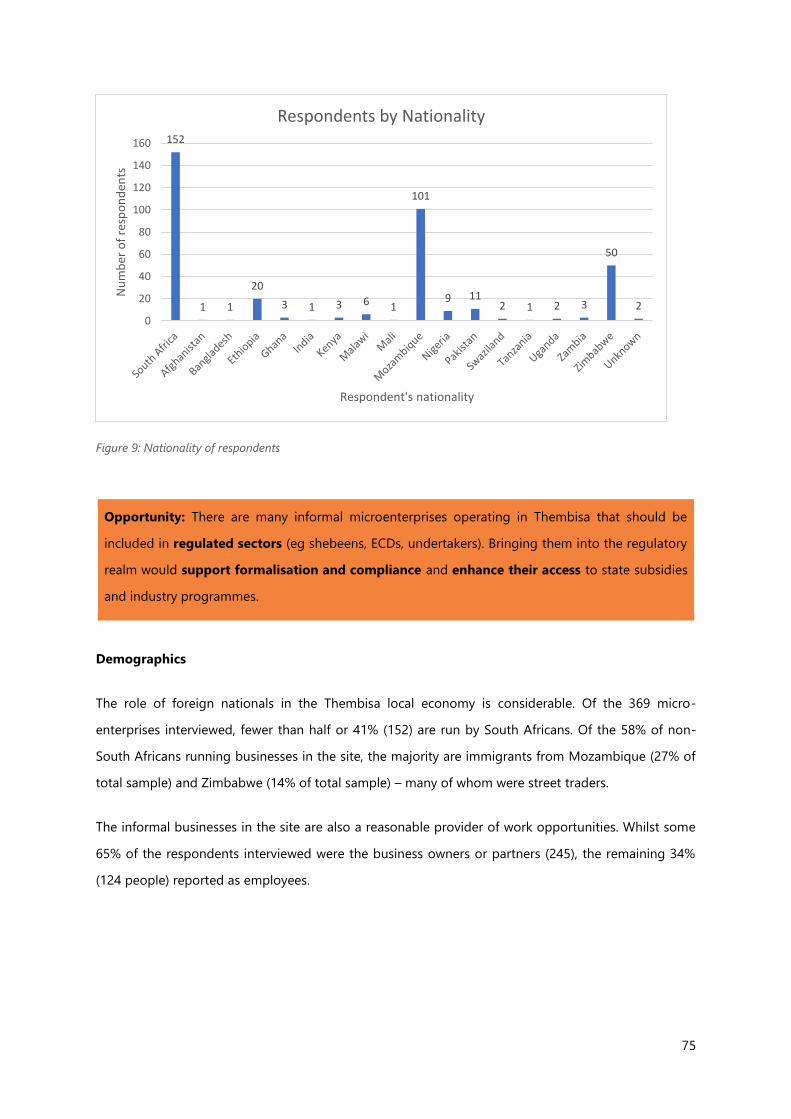
75
Figure 9: Nationality of respondents
Opportunity: There are many informal microenterprises operating in Thembisa that should be
included in regulated sectors (eg shebeens, ECDs, undertakers). Bringing them into the regulatory
realm would support formalisation and compliance and enhance their access to state subsidies
and industry programmes.
Demographics
The role of foreign nationals in the Thembisa local economy is considerable. Of the 369 micro-
enterprises interviewed, fewer than half or 41% (152) are run by South Africans. Of the 58% of non-
South Africans running businesses in the site, the majority are immigrants from Mozambique (27% of
total sample) and Zimbabwe (14% of total sample) – many of whom were street traders.
The informal businesses in the site are also a reasonable provider of work opportunities. Whilst some
65% of the respondents interviewed were the business owners or partners (245), the remaining 34%
(124 people) reported as employees.
152
1 1
20
3 1 3 6 1
101
9 112 1 2 3
50
20
20
40
60
80
100
120
140
160
Nu
mb
er o
f re
spo
nd
ents
Respondent's nationality
Respondents by Nationality

76
Figure 10: Respondent business roles and nationality
The local informal economy is predominated by men, who comprise 64% (237) of the respondents.
Across the sample, business operators were most commonly in the age group of 30-40 years. Some
44% (105) of male informants were in their 30s, whilst more than half of all women (132) were in their
30s (45) and 40s (32). This trend for females may also reflect their balance of economic objectives with
child-care commitments whereby many women tend to work from, or in close proximity to home in
businesses such as informal foodservice or street trading.
Figure 11: Respondent age and gender
55
105
47
188 4
24
45
32
21
7 3
0
20
40
60
80
100
120
20s or younger 30s 40s 50s 60s 70s
Respondent's Age and Gender
Male (n = 237) Female (n =132)
41
109
2
83
128
42
0
20
40
60
80
100
120
140
Employee Owner Partner
Nu
mb
er o
f re
spo
nd
ents
Comparison of business roles and nationality
South African (n=152) Non-South African (n=215) Unknown (n=2)

77
Map 6: Micro-Enterprise Respondent Gender

78
Business dynamics
The majority of micro-enterprises operated from informal or unregistered trading spaces. These
included 60% (222) businesses operating from a trading stand or table in the street or on vacant ground,
20% (73) from a private residential house, and 7% (27) from a repurposed shipping container. Street
trading is a particularly prominent modality for operating in Thembisa and represents an important
economic livelihood for its business operators.
Figure 12: Business infrastructure
27
7
222
6
73
23
11
0 50 100 150 200 250
Container
Shack/shed
Street trading table/stand
Mobile
Private house
Business premises
Other
Number of businesses
Infr
astr
uct
ure
typ
e
Structure and position for trading
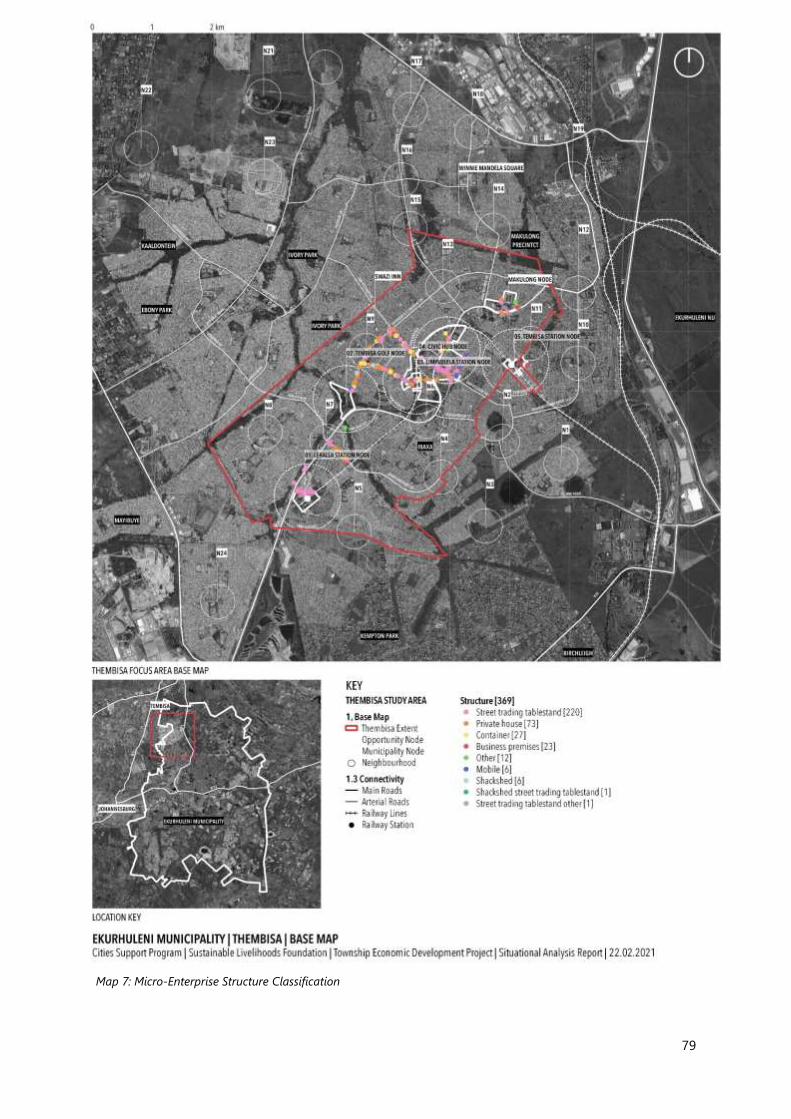
79
Map 7: Micro-Enterprise Structure Classification

80
Rent
The majority of micro-enterprises operating in Thembisa reported not paying rent. As most enterprises
operated as street traders many have clearly taken advantage of the lack of municipal governance in
the site in order to set up business. Very few business operators claimed to own the property from which
they operated – only 14 individuals were owners. Collectively 31% of respondents reported the
businesses paid rent for the premises on which they operated. A quarter (36) of South Africans paid rent
whilst a third (77) of non-South Africans paid rent. Where rents were paid the monthly rental amounts
varied, ranging from R50 (access to a street pavement adjacent to a private dwelling) to R8,000 (for a
dedicated building structure on the high street). Most common monthly rental amounts were between
R1,000 and R2,500 with 15 paying R1,500, 12 paying R2,000, and five paying R2,500.
Figure 13: Occupation model and rent paid in ZAR
113
1421
221
Rented or owned premises
Rent Own Don't know NA
1315
26 2522
12
0
5
10
15
20
25
30
≦ R500 ≦ R1000 ≦ R1500 ≦ R2500 ≧R8000 Unknown
Nu
mb
er o
f b
usi
nes
ses
Rent paid
Monthly rent paid (in ZAR)

81
Map 8: Micro-Enterprise Site Rental

82
Access to utilities
Whilst a quarter of businesses had formal access to water and electricity (24% and 25%, respectively),
on average 36% (131) had informal access (commonly accessed on a commercial basis from adjacent
private dwellings), and 40% (147) had no access to these services at all. Those with no water (36% of
total sample) or electricity access (44%) were predominantly operating their business from a trading
stand or table (107 and 138, respectively).
Figure 14: Available utilities
150
87
132
113
93
163
0
20
40
60
80
100
120
140
160
180
Informal Formal None
Access to Utilities: Water and Electricity
Water Electricity

83
Map 9: Micro-Enterprise Water Access
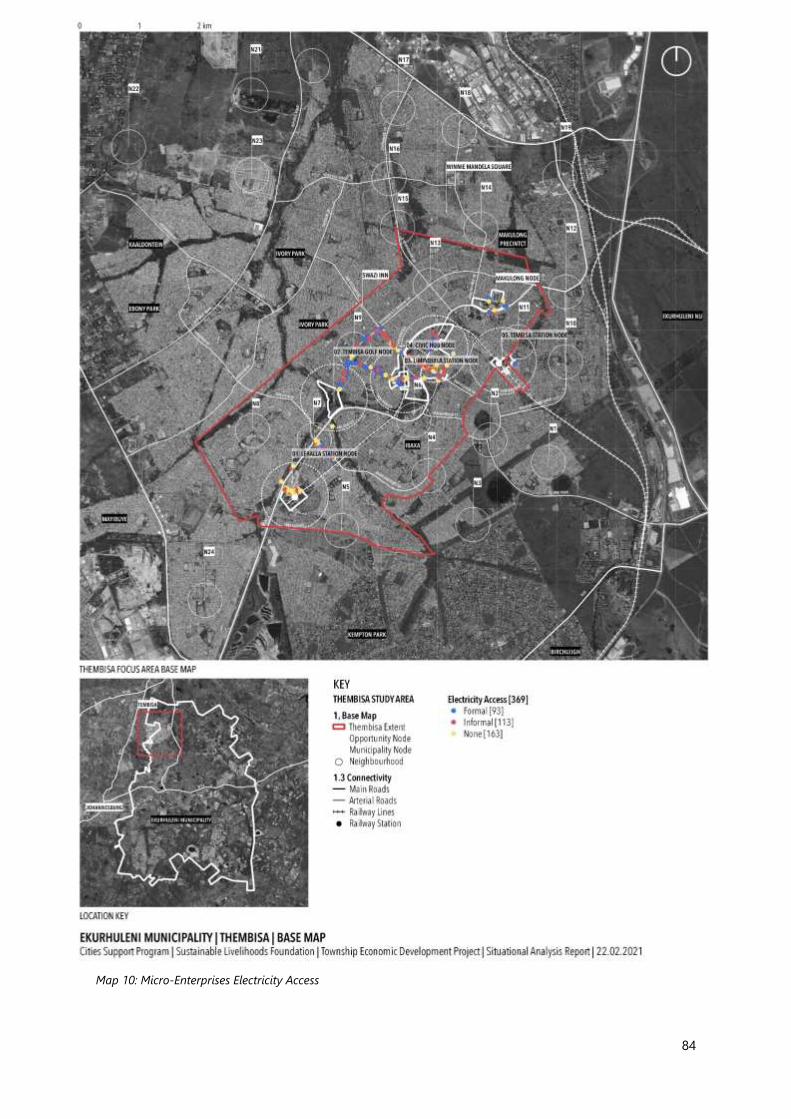
84
Map 10: Micro-Enterprises Electricity Access

85
Opportunity: There is a need for basic services and utilities to service businesses in Thembisa. Service
delivery for these aspects should include consideration of strategies to gain important revenues
from beneficiaries of Metro services.
Time in business
The average age of local businesses is relatively short in Thembisa. Many micro-enterprises have been
established in the past few years. Of the 39% (147) who have been operating between one and four
years, certain periods stand out: 24% (36) have been operating for one year; 31% (46) for two years; and
28% (41) for three years. For the 170 businesses operating for five years or more, 13% (22) have been
operating for five years and 16% (27) for ten years.
Figure 15: Time in business
Overall, 74% (272) of businesses have been operating for less than ten years. This pattern of young
businesses emerging correlates with the relatively young age profile of the business owners as 25% (67)
report being in their 20s or younger, and 46% (125) are in their 30s.
52
147
73
68
23
6
0 20 40 60 80 100 120 140 160
less than 1 year
1 - 4 years
5 - 9 years
10 - 19 years
20+ years
Don't know
Number of traders
Tim
e in
yea
rs
Time in business

86
Figure 16: Comparison of respondent age and time in business
8.1.3. Operating challenges
Although micro-enterprises face numerous challenges in running a business in Thembisa, many
respondents (116) noted they face no challenges. For those that did speak of constraints, the most
common is crime (74) followed by trading location (55), lack of storage for goods [especially for street
traders] (52), and competition (45). Interestingly, 26 respondents noted that weather conditions (rain
and heat) as a key challenge in trading.
18 20
10
4
40
67
28
13
3 1
9
38
17
47
2319
14
411
58
4 5
0
10
20
30
40
50
60
70
80
20s or younger 30s 40s 50s 60s 70s
Nu
mb
er o
f re
spo
nd
ents
Comparison of age and time in business
less than 1 year 1 - 4 years 5 - 9 years 10 - 19 years 20+ years

87
Figure 17: Main operating challenges
Some respondents commented that their challenges were interlinked with weather, crime, by-laws and
competition:
• Weather: For township business in general, and street traders in particular where informal
shelter provides limited or no protection from the elements, the weather is an important factor
in conducting business. One respondent highlighted: “When it rains the business loses customers
dues to lack of infrastructure (shelter) because they have to close to protect their products”. The
importance of having access to a suitable site is significant as traders thrive when “looking for
shelter because when is hot and raining I can't run my business.”
• Crime: ‘Nyaope Boys’ (purportedly drug addicts) stealing goods and the issue of crime in
general was an important concern, as is illustrated by the following respondent quotes: “There
are also more criminals at the place and find it very hard to work until late because of the
darkness.” And “Too much robbery around this place and money fraud”.
• Competition: Localised challenges of overtrading where many businesses sell the same goods
in close proximity to one another. The nature of competition extends from other informal
traders but also formal sector businesses extant in shopping malls and on high streets. Some
noted: “The place has many businesses selling cooked food because the business is next to a
shopping complex. It then makes one not to have many customers and without having customers
she will have to throw her food if it is spoiled” and “The competition is one of the challenges she's
facing and after all the competition sometimes they end up fighting a physical fight.”
74
36
45
16
55
52
11
26
21
9
7
19
116
0 20 40 60 80 100 120 140
Crime
Infrastructure
Competition
Registration / Licensing
Location
Storage
Access to suppliers
Weather
No Customers
Difficult customers
No electricity
Other
No challenge
Number of businesses
Ch
alle
nge
sChallenges faced by business

88
• State harassment: The police and / or municipality chasing local businesses (especially street
traders) away for non-compliance with land use and trading regulations. As reported by the
businesses: “The location is the problem because the metro police always chasing them away”
and “The major problem here is the trading space as the space belong to the municipality. During
the lockdown the metro police used to come in to confiscate stocks as the business is not licensed
to trade here.”
• Finance is also an important microenterprise consideration: Interestingly very few participants
reported lack of financing as a business challenge although financial stresses are clearly
significant for some, with notable comments from field researchers including: “The business
started late last year in December. The employee stressed about not having a generator to fill in
the tyres with air. So, he said he would love if he can assistance with funds to get the generator.
However, he did mention that there is one man who do donate old tyres to them and they sell
those tyres as second hand tyres to their clients” and “Needs financial services support to expand
her products in terms of packaging and branding her products the way she would like her products
to be branded. Her products are really for the yuppie market with flavours such as hibiscus jam
and wild melon chutney.”
• The great majority (92% / 339) of these businesses reported not receiving any support to
operate but said that if they had a choice in what would benefit them, 12% (42) reported
financing and 8% (28) reported the need for enhanced trading spaces and adequate shelter. A
further 8% (29) enterprises claimed that they required no external support to bolster their
business activities.
Figure 18: Support deemed beneficial by respondents
42
3
28
1
11
29
5
0 5 10 15 20 25 30 35 40 45
Financing
Infrastructure
Space
Registration
Owner not here
Nothing
Don't know
Support deemed beneficial

89
8.2. SMEs and Corporates
8.2.1. Corporates
Most corporate businesses operate within shopping malls. Of the 23 corporates we surveyed, clothes
and grocery retail were the most prominent. The big brands operating in Thembisa are dominated by
essential services (food, fuel, and clothes) and include BP service stations, Pick n Pay Express, Chicken
Licken, Roman’s Pizza, Debonairs and Pep.
Figure 19 Corporate businesses by enterprise classification
8.2.2. SMEs
A considerable variety of SMEs were identified in the survey, 23% (11) of them were health services,
followed by 14% (9) liquor sales. A variety of other SMEs were found spread throughout the site,
including funeral services, bakeries, car repairs, legal services – all of which require specialised skills and
/ or equipment to operate.
3
5
3
1
2
1
4
1 1
2
0
1
2
3
4
5
6
Enterprise classification: Corporates

90
Figure 20 SME businesses by enterprise classification
3 32
1 1 1 1
5
21 1
11
2
6
1
3
1 1 1
0
2
4
6
8
10
12
Enterprise classification: SMEs

91
Map 11: Corporates and SMEs
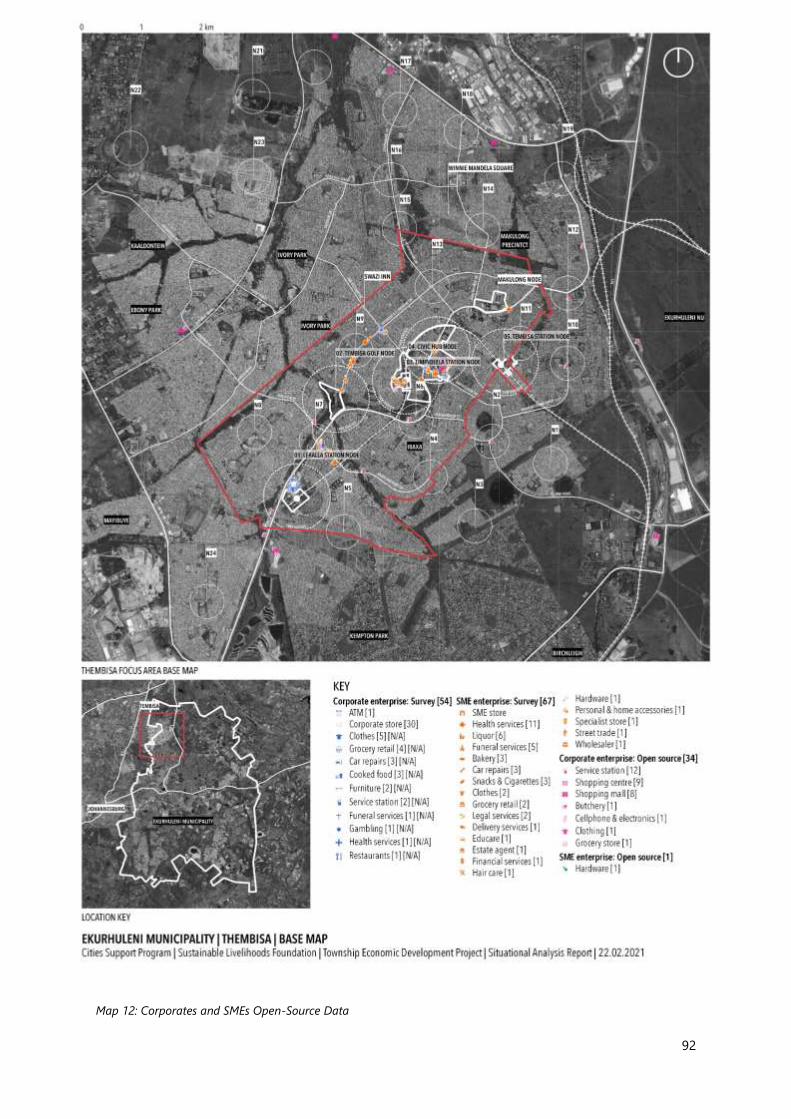
92
Map 12: Corporates and SMEs Open-Source Data

93
8.3. Business Hotspots
There were 27 potential business hotspots identified and surveyed during the fieldwork process in
Thembisa. These sites comprised intensive business activity and clusters of micro-enterprises.
8.3.1. Available Services
Overall, access to utilities and services found in the surveyed business hotspots was uneven. Of the 26
hotspot sites where business activity was undertaken, 81% (21) had no access to WiFi, and 62% (16) had
no access to waste disposal. Interestingly where WiFi access was present, none of the intended recipients
could access it. Other basic services, whilst far from universally supplied, were better accessed with 42%
(11) of hotspot operators having access to both water and electricity.
Figure 21: Access to services
7
11
8
6
11
910
16
5
21
0
5
10
15
20
25
Yes Some No
Hotspot: Business access to services
Water Electricity Waste disposal Wifi

94
Map 13: Business Hotspots
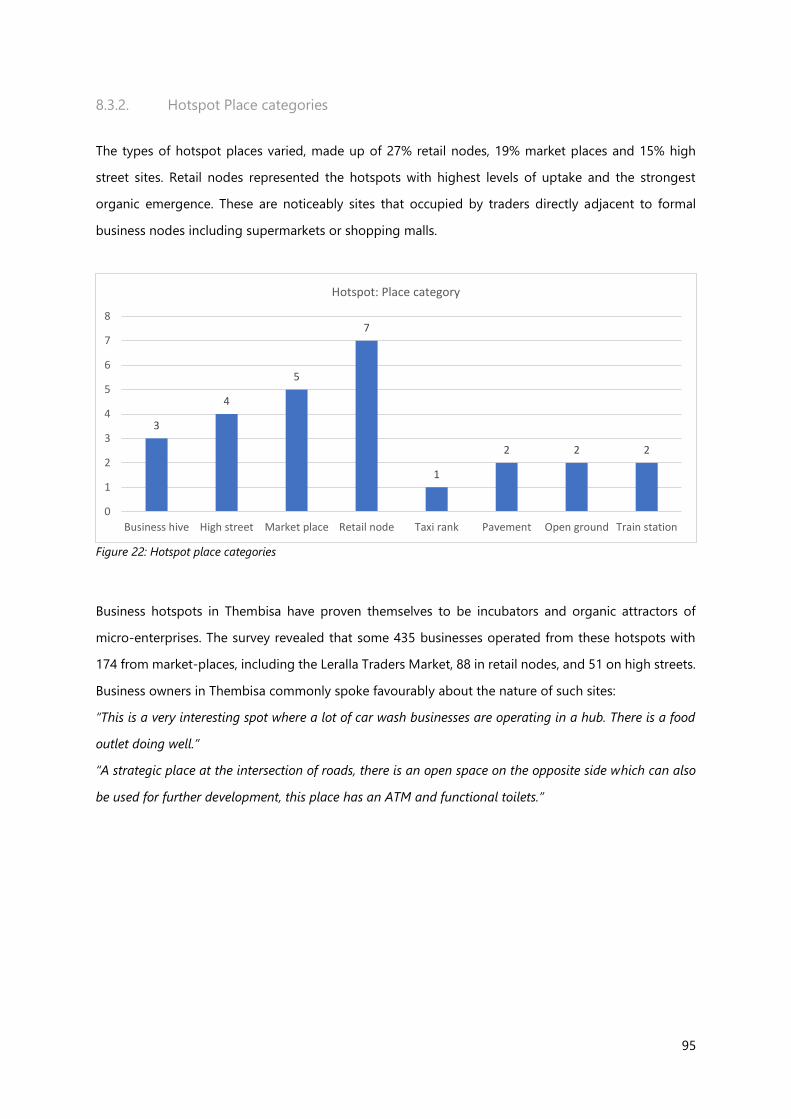
95
8.3.2. Hotspot Place categories
The types of hotspot places varied, made up of 27% retail nodes, 19% market places and 15% high
street sites. Retail nodes represented the hotspots with highest levels of uptake and the strongest
organic emergence. These are noticeably sites that occupied by traders directly adjacent to formal
business nodes including supermarkets or shopping malls.
Figure 22: Hotspot place categories
Business hotspots in Thembisa have proven themselves to be incubators and organic attractors of
micro-enterprises. The survey revealed that some 435 businesses operated from these hotspots with
174 from market-places, including the Leralla Traders Market, 88 in retail nodes, and 51 on high streets.
Business owners in Thembisa commonly spoke favourably about the nature of such sites:
“This is a very interesting spot where a lot of car wash businesses are operating in a hub. There is a food
outlet doing well.”
“A strategic place at the intersection of roads, there is an open space on the opposite side which can also
be used for further development, this place has an ATM and functional toilets.”
3
4
5
7
1
2 2 2
0
1
2
3
4
5
6
7
8
Business hive High street Market place Retail node Taxi rank Pavement Open ground Train station
Hotspot: Place category

96
Figure 23: Number of businesses per site type
Opportunity: The high concentration of businesses within marketplaces and retail nodes presents
an important opportunity for marketing these ‘hubs’ and the businesses within them. The Metro
could, via partnerships work to provide street signage and advertising boards for this purpose.
8.3.3. Barriers to operating
Of the 26 active hotspot sites, 69% (18) had formal site infrastructure, 94% (17) of which was considered
by the occupants as functional. However, half (13) of respondents were unsure of whom the site
managers were. Within open trading spaces, 58% (15) of respondents reported there was no additional
space available to accommodate other businesses in these sites. The fieldworkers observed that there
was space within 81% of sites for other / new micro-enterprises to operate / occupy. Fear of crime
appeared to be the largest disincentive for new businesses to occupy the available spaces, with 46% of
total hotspot businesses said that crime was the main barrier to undertaking business in these settings.
24
51
174
88
39
19 1525
0
20
40
60
80
100
120
140
160
180
200
Business hive High street Market place Retail node Taxi rank Pavement Open ground Train station
Number of businesses operating in these sites

97
Figure 24: Operating barriers
Examples of issues considered ‘other’ in the graph above all pertained to municipal service delivery and
included no water access (38%/10), inadequate shelter (35%/9), a lack of paving (27%/7), a lack of proper
lighting (19%/5) and no refuse removal (19%/5). Some insightful comments on municipal service
delivery included;
• “The mama would like to be supported in terms of shelter and would like the municipality to stop
harassing them and constantly moving them around.”
• “Most of the businesses are formal and are service businesses. The informal ones have no structure
and do not have access to water or electricity.”
• “There's no infrastructure built for the traders. It's an informal trading space but no access to water
or electricity or any ablutions facilities. No proper seating, dusty and dirty space, no waste
management. no proper parking spaces or shade for both humans and vehicles.”
8.4. Institutional services
The research identified 30 institutional services, 50% (15) of which are financial services. Of the available
financial services, 80% (12) are ATMS and 7% (1) was a micro-finance organisation. The micro-finance
organisation was Mukhuru, a money transfer business. Those institutional services recorded as ‘Other’
were a health service, private consultant and an art centre. Apart from financial services, most of the
institutional services were open during the fieldwork process. These services were predominantly
operated by the CoE (10).
12
1
7
8
0 2 4 6 8 10 12 14
Crime
Police harrassment
Not applicable
Other
Hotspot: Barriers to conducting business
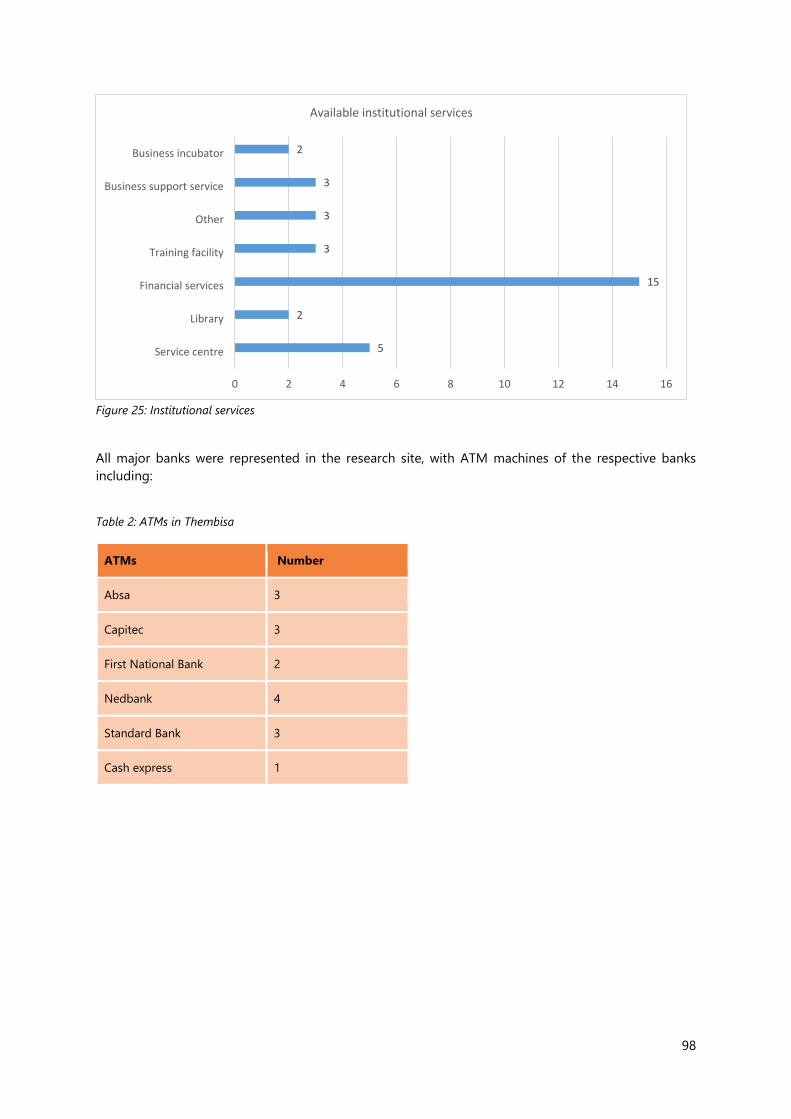
98
Figure 25: Institutional services
All major banks were represented in the research site, with ATM machines of the respective banks
including:
Table 2: ATMs in Thembisa
ATMs Number
Absa 3
Capitec 3
First National Bank 2
Nedbank 4
Standard Bank 3
Cash express 1
5
2
15
3
3
3
2
0 2 4 6 8 10 12 14 16
Service centre
Library
Financial services
Training facility
Other
Business support service
Business incubator
Available institutional services
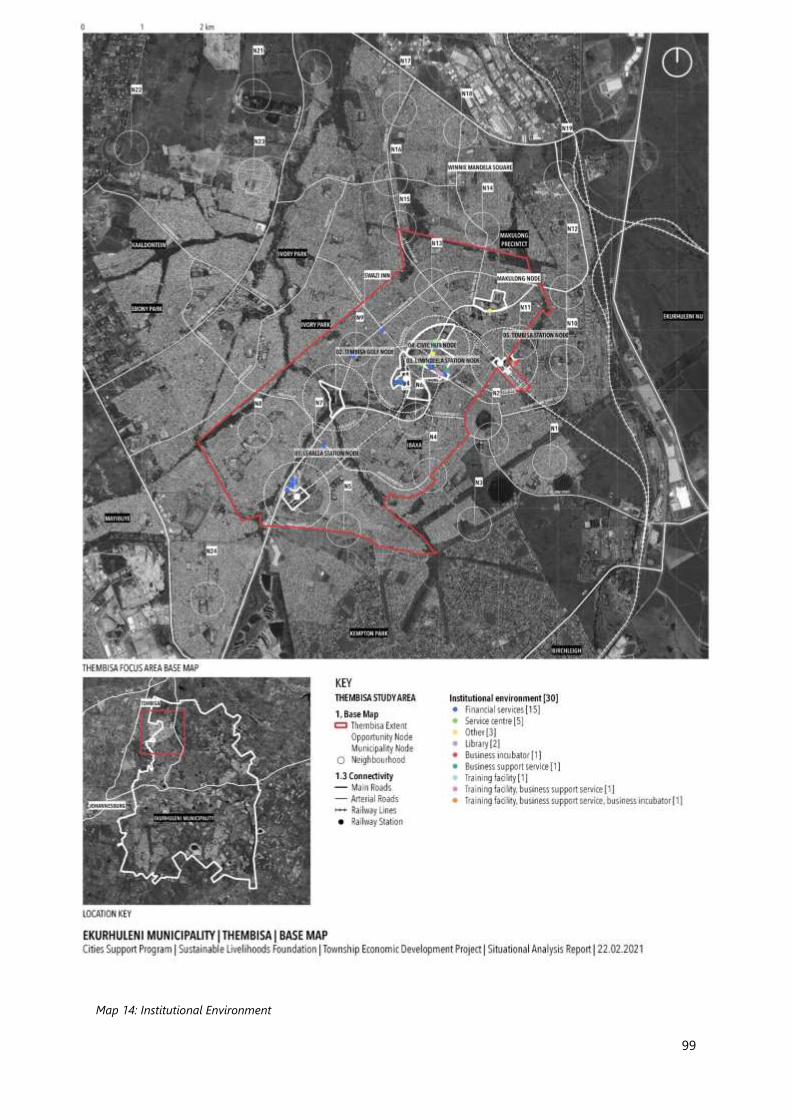
99
Map 14: Institutional Environment

100
8.5. Township-Wide Ecosystem
Tembisa is strategically well placed to serve much of the CoE industrial hubs and aerotropolis economy.
Street trading is a common micro-enterprise activity. Linking the uptake of such sites by street traders
and 4IR technologies such as cellphone issued permits provides important scope for innovation in
support of this important sector.
Figure 26: Linking township micro-enterprises to larger markets through the use of 4IR technology and cost-effective
transport has potential to enhance business practice and market access

101
Land that is owned by the CoE should be increasingly made available for business purposes, to create
further hotspots. or business hubs as recommended in the 10 Point Plan. Some of the businesses that
require access to land include micro-manufacturing, car repairs / panel beating, making of furniture and
welding.
Opportunity: Building on the 10 point plan, various localities (such as the Thembisa civic hub, train
station nodes, high streets) could be further activated for business activities through local
strategic area and management plans and investment in revitalisation of the local environment in
ways suited to an enhanced business environment.
Figure 27: Linking township micro-enterprises to larger markets through the use of 4IR technology and cost-effective
transport has potential to enhance business practice and market access
102
9. Important Sectors
9.1. Fourth Industrial Revolution - 4IR
4IR projects such as Kandua which links technical specialists with customers, and digital platforms such
as Khula which market produce grown in an urban agriculture context have important potential for
application in Thembisa and should be further explored and encouraged. An important initiative that
could be driven by the Metro is enhancing access to digital services in general, and links to 4IR driven
businesses / platforms in particular.
Opportunity: Improving enterprise access to digital economy. This should include links to SEDA
and Gauteng Provincial Government who actively promote digital hubs, Wi-Fi access for
increasing 4IR access for SMMEs in the township economy. Such a programme could also support
enhanced participation in the digital formal financial sector.
9.2. Automotive Sector
The township automotive sector – especially subsectors of mechanics, tyre fitment and car detailing /
washing are important contributors to economic opportunities and job creation. It is therefore
important to promote investment activities and private sector BDS to support these SMME
opportunities.
This section of the report will be confined to opportunities that are currently accessible in the
aftermarket which includes post-sales maintenance, repairs, refitment, spares, disposal of vehicles and
recycling.
9.2.1. Stakeholders within the township automotive industry
The main stakeholders within the township automotive industry can be categorised into four main areas:
i) micro-enterprises and the associations that represent them; government and SOE; private sector

103
Original Equipment Manufacturers (OEMs) with B-BBEE targets; and customers (motorists including
those who own taxis and buses).
Micro-enterprises and the Associations
The micro-enterprise surveys revealed that the majority of automotive entrepreneurs operate in the
‘aftermarket’ offering repairs for vehicles that are out of warranty. These commonly include mechanics,
panel beaters, spray painters, tyre fitters / wheel specialists, welders and upholsterers.
The business activity is relatively commonplace and has, in some cases attracted important external
investment. For example, within the study sites some tyre fitting micro-enterprises have created links to
tyre manufacturers such as Dunlop and Tiger Wheel and Tyre and have secured professional and
branded premises. The majority however are unlinked to formal sector business and work from home
or premises along prominent township roads or near taxi ranks.
With respect to land use, most of these micro-enterprises (particularly home-based, and street-based
entities) operate in areas either outside of the regulatory frameworks, or illegally. Most work with basic
equipment and poor infrastructure, limited waste disposal, no access to ablution facilities, and poor, if
any shelter (which brings about susceptibility to changing weather). There is also a lack of storage and
the general hazard posed by them working without the necessary accreditations. Often businesses are
positioned close to their customers (near taxi ranks and busy areas where they are visible and
accessible). It is to be noted that city and state land that is available for developing hubs and providing
the much-needed infrastructure is not necessarily close to where the greatest business opportunities
lie.
A persistent challenge for township automotive micro-enterprises is access to markets. Financial and
non-financial support is important in ensuring that the enterprises are well operated and governed but,
without access to markets the enterprise have little chance of success. Market access in the township
economy is hindered through the geographic and economic isolation of the township economy away
from mainstream sectors, and also the limited market within the township economy for cars.
Furthermore, it is uncommon for reasons such as crime and logistics for vehicle owners residing outside
of the township to bring their vehicles into these locations. Finally, there are customer perception on
the quality of the service. (See opportunity listed below).
104
Several associations represent the entrepreneurs and their needs. The Retail Motor Industry (RMI)
represents retail and associated motor industry within South Africa’s automotive aftermarket. There are
eight associations represented by RMI with over 8,000 members. The RMI is the major employer
representative of the Motor Industry Bargaining Council. It is not clear at this stage how many township
entrepreneurs are represented by RMI. An important sectoral newcomer is the African Panelbeaters and
Motor Mechanics Association (APMMA), through its chairperson Sisa Mbangxa, has been heavily
involved and instrumental in the shaping of the Draft Guidelines for Competition in the Automotive
Aftermarket Industry (by the Competition Commission). APMMA’s members are largely within the
township.
State Entities
The Automotive Industry Development Centre (AIDC) and the Seda Automotive Technology Centre
(SATeC) aim to support the automotive industry, especially SMMEs. The AIDC operates the Winterveldt
Enterprise Hub and Automotive Hubs (City of Tshwane) in partnership with OEMs, providing training,
business development and financial support. SATec focuses mainly on micro-businesses in the
townships and provides general business support in the form of business training, formalising of
businesses and accreditations.
G-Fleet Management, is a Trading Entity of the Gauteng Department of Roads and Transport, that
provides vehicle leasing and fleet management services for the public sector. Their services include
short-term rentals, replacement, total fleet management services-finance, maintenance, repairs, tyres,
accident damage and other motor-related services to all government departments. The entity operates
a fleet of over 7000 vehicles. G-Fleet presents an opportunity to provide access to markets for micro
enterprises, particularly in the fleet maintenance as it relates to the aftermarket. At this stage it is unclear
whether G-Fleet has any initiatives that promote micro enterprises. G-Fleet does not have any visible
agreements with SMMEs.
Opportunity: There is scope for the after-market automotive sector in Thembisa to benefit from
City-facilitated partnerships with various stakeholders such as Provincial Government, DSBD to
provide equipment / skills training / supply agreements / finance.

105
9.2.2. Ekurhuleni Incubators
The Ekurhuleni has developed and designed the Automotive City Projects, essentially incubators for
SMMEs within the automotive sector. There are three automotive hubs and the fourth is a manufacturing
hub. The City plans to locate an automotive hub in Thembisa; a manufacturing and automotive (service)
hub in Katlehong and an automotive hub in Labore (Geluksdal). All four hubs are still in construction
phase and are anticipated to be operational in the latter part of 2021. The programme is not linked to
industry. . The development of these incubators should be coupled with the DSBD district information
management system and its associated enterprise development support services.
Opportunity: Linking Ekurhuleni incubators to business development support services – DBSD,
SEDA and SEFA which would bolster sustainability of these incubators and further support Thembisa
businesses. Furthermore, there is scope to link these incubators to markets through an annual trade
and marketing event that would link these local businesses to economic opportunities.
9.3. Transport nodes
Thembisa has a large and vibrant local public transport economy, yet unlike many other transport nodes
it generally underperforms as an incubator for business. An important opportunity lies in promoting
business alongside transport hubs / nodes that serve commuters and intra-township travellers. The
Esangweni Taxi Rank represents an important opportunity for a Public Private Partnership that would
reimagine this important transport node into an increasingly functional business node.
Opportunity: In a partnership with Gauteng Provincial Government and local taxi associations,
reimagine the Esangweni Taxi Rank as a node suited to development of business activities to
serve local commuters

106
Figure 28: Building on the taxi/public transport economy

107
9.4. Building Trade
The formal status of local houses presents a valuable opportunity for homeowners to reinvest in their
houses – such as upgrading gates, fences, doors and windows. Further, Thembisa has a growing number
of residential dwellings being built for the rental market, many of which are in the back yards of formal
dwellings. An opportunity lies in this context to facilitate the formalisation of these developments,
through addressing land-use and property-use constraints (such as zoning and by-laws). Aside from
supporting the local building trade, these activities could bolster demands for a local micro-
manufacturing economy.
Opportunity: The metro to develop policy that will enable home-owners to invest in backyard and
rental accommodation. Such a policy would encourage legitimisation of dwellings, which would, in
turn stimulate the local economy of house builders and renovators.
9.5. Financial Inclusion
SMMEs in Thembisa revealed challenges of being unable to access formal sector financial services
products such as business capital and insurance.
Most businesses are entirely reliant on cash transactions which brings about added security and
operational risks. Enhancing access to formal sector services can bolster business stability and insulate
them from economic shocks. Any programme that can enhance access to these products will be of
benefit for the local township economy.
Opportunity: There is important scope to use existing BDS services to link to provincial government
and (for example) the Finmark Trust for accessing financial literacy training and increased access
to formal sector financial services.
9.6. Creative economy
The Thembisa creative economy has potential to be more effectively linked to both government-
initiated arts and creatives funding, but also the tourism sector. The GEP, and the Metro have
programmes to support SMMEs and microenterprises through workshops, networking, registration and

108
directing them to financing. Fostering these links would be an effective tool for supporting local SMMEs.
The DSBD TREP programme specifically supports clothing, textile and leather enterprises that are
located in townships and villages in terms of business support as well as access to funding, whilst SEDA
focuses on skills development in the jewellery sector through the Ekurhuleni Jewellery Project incubator.
Opportunity: Support to Thembisa creative economy through existing BDS services and
mechanisms of enterprise formalisation in order for creatives of various sectors to gain enhanced
access to formal sector funding opportunities, such as that from the National Arts Council or the
National Lottery Commission Trust.

109
10. Land use
10.1. Land Administrative Policies
The TAT reviewed the following planning documents to gain an understanding of the statutory and
policy environment for Thembisa:
Municipal Spatial Development Framework
The Municipal Spatial Development Framework (MSDF) is a long-term spatial planning tool, which
provides metro-wide planning guidance for the spatial growth of the CoE. This tool is required in terms
of the Spatial Planning and Land Use Planning Act, 2013 (SPLUMA) and forms part of the Integrated
Development Planning (IDP) process, to the extent that it assists with providing a spatial context for
investments. In terms of the legal requirements, it is subject to review every five years.
Regional Municipal Spatial Development Framework
The Regional SDF (RSDF) provides detailed planning directives that align with the MSDF for each region
in the City. This planning tool identifies issues and directives for specific areas within each district and
provides a shorter-term directive than the MSDF.
Built Environment Performance Plan
The Built Environment Performance Plan (BEPP) is intended as mechanism to align the IDP and budget
with spatial priorities each year, to promote the effective functioning of the metropolitan built
environment, in line with the guidelines set out by National Treasury.
Municipal Planning By-Law and Town Planning Scheme
The Municipal Planning By-Law provides the legal framework that spatial policies such as the SDF play
out in at the metropolitan level. The Development Management Scheme provides the detailed zoning
110
guidelines and permissions. A wall-to-wall zoning scheme for each municipality is required in terms of
the SPLUMA, 2013.
10.2. Development Plans
The TED Situational Analysis incorporates City land use and spatial development plans as well as new
sources of information / data, including the micro-enterprises surveys. This information can enhance
future development planning process.
Opportunity: TED evidence utilised in area-base strategic plans.
10.2.1. Metropolitan Spatial Development Framework, 2015
According to the MSDF Thembisa Central is categorised as a developing node (MSDF, Section B, 2015:
55). Transport is a significant consideration in the Thembisa area – priority is given to the mobility route
between Kempton Park and Thembisa. This route is an important minibus taxi route and one of the focal
routes for the Bus Rapid Transit (BRT) System. The infrastructure for this bus system is mostly in place,
though the system is not yet operational. The Thembisa-Kempton Park mobility corridor is categorised
as Integration Zone 1. There is a lack of Non-Motorised Transport (NMT) Infrastructure in Thembisa,
which needs to be addressed (MSDF, 2015: 55). Infill development to promote greater residential density
around CBDs and transport infrastructure is encouraged. This is important for ensuring the sustainability
of the transport routes.
Economic development priorities indicated in the MSDF include prioritising retail development in
Thembisa. (MSDF, section C, 2015: 12). The Olifantsfontein and Clayville industrial areas to the North of
Thembisa are sites of heavy industrial activity and acknowledged in the plan as economically significant
areas (MSDF, Section B, 2015: 26).
The Thembisa-Kathorus Corridor is intended as a North-South development axis, which will help
stimulate integration in the City by means of higher density development paired with more intense
economic function. These objectives have been prioritised in this corridor in order to promote market-
driven development to the benefit of businesses and residents in this area (MSDF, Section C: 92).

111
10.2.2. Regional Spatial Development Framework, Region B, 2015
The RSDF identifies many of the issues and plans identified in the MSDF, 2015. It also details plans for
secondary nodal areas in Tembisa. The identified secondary nodes are: Winnie Mandela Node,
Thembisa Plaza (aligned to the Leralla station node indicated in this report), Swazi inn, and the Thembisa
station. The Thembisa CBD, situated at the Corner of Andrew Mapheto Street and George Nyanga Street
(civic node), is characterised as a hub. In these secondary nodes, the RSDF indicates a range of supported
land uses that include medium density residential; high density residential; retail; office; entertainment;
hospitality uses; service industry; taverns; and municipal and government facilities.
Opportunity: A precinct management and development plan for Swazi Inn approved.
10.2.3. Transit Oriented Development Nodes
Leralla station, Limindlela station and Thembisa station have been identified as Transit-Oriented
Development (TOD) Nodes. The general guidelines for land-use in these nodes is:
• Ensure transit supportive land uses,
• Increase density around transit stations,
• Create pedestrian-oriented design,
• Make each station a ‘place’,
• Manage parking, bus and vehicular traffic,
• Plan with the community.
For further analysis on these nodes, see chapter 11 below.
10.2.4. City of Ekurhuleni Built Environment Performance Plan, 2020 – 2021
The BEPP categorizes Thembisa as a ‘marginalised peripheral township’, which is a secondary node in
the CoE. The township is classified as being at moderate risk. The BEPP identifies dangerous electricity
connections and air pollution as possible sources of vulnerability (2020). Of relevance to the core site,
the BEPP identifies infill housing development at Isekelo.

112
10.3. Land Use Dynamics
The CoE promulgated a Municipal By-Law that is in keeping with the SPLUMA regulations in 2019.
However, the Town Planning Scheme precedes it and was set out in 2014, with revisions added in 2015.
Land use in Thembisa was previously administered in terms of the Thembisa Town Planning Scheme,
2000, with the scheme incorporated into the Town Planning Scheme, 2014 (rev 2015).
The land-use system in Thembisa follows a rather typical township arrangement of predominant
residential zoning with social/public zoning scattered throughout and limited large land parcels of
commercial uses. The commercial uses are clustered around one of the nodes, the Civic Precinct, but do
not noticeably feature in other more obvious situations: like transport interchanges, along high streets
or at train stations. The nodes are well located along the railway infrastructure, which currently is sub-
operational, but was historically important and supported adjacent commercial activities.. The poor
performance of the railway system will result in these nodes losing their economic advantages. Reliable,
consistent and responsive transport systems will arrange at market opportunities and these may not be
aligned with the designated zoning patterns, leading to increased tension between actual use and
prescribed use and further creating a situation of enforced informality.
As indicated in the map below, most of the area is zoned Single Residential 2. There are a significant
number of community facilities (including schools), along with social facilities, frequently found in close
vicinity to one another. There is little business zoning, some along Andrew Mapheto Drive and a few
areas zoned Open Space, which are in varying degrees of maintenance and use. The field research
identified many profitable SMEs, especially wholesalers and larger retailers, operating from sites zoned
for residential use. These enterprises ought to be operating from appropriate zoned sites with
correspondingly higher rates.
Opportunity: Revenue collection from rates improved.
Opportunity: Home based businesses formalised, enabling growth and reducing business
externalities.

113
Map 16: Zoning in Thembisa

114
The permitted uses indicated in the table below are subject to the definitions set out in the Ekurhuleni
Town Planning Scheme, 2014 (revised 2015).
Table 3: Uses Permitted under Land Use Zone Residential 2
Zoning
Category
Primary Rights:
Purposes for
which land
and/or buildings
may be used.
Special Consent of
Municipality Land Use
Application
Land and/or Buildings
which may be
erected and purposes
for which they
may be used only with
the Special
Consent of the
Municipality
Written Consent A
and B of the
Municipality
Land and/or
Buildings which may
be erected and
purposes for which
they may be used
only with the
Written
Consent of the
Municipality
Provisos: Ancillary
Uses applicable to
Columns 3 & 4
(see Clause 13.2)
Residential
2
Dwelling House
Private Roads
Places of Public Worship
Places of
Instruction
Social Halls
Child Care
Facilities
Taverns
Guest Houses
Home
Care Facilities
Catteries
Special Uses
Written Consent A
Spaza Shops
Home Enterprises
Day Care Facilities
Living
Accommodation for
Domestic Workers
limited to a maximum
size (incl. a kitchen
and bathroom) of
29m2 or 10% of the
Dwelling House,
whichever is the
greater (provided that
it is developed as a
single functional unit).
Written Consent B
Second Dwelling
Unit
Maximum of three
Boarding Rooms
Any development on an erf zoned Single Residential 2 is also subject to the following development
restrictions, along with any restrictions set out in the individual title deed, where applicable. These
restrictions impact on the scope for formalising backyard developments, especially in respect to multi-
story flats.

115
Table 4: Residential 2 Building Lines
Residential 2
Height Street Boundary Other Boundaries
Single Storey (Erf <500m2) 3m 1m on 2 sides
Single Storey (Erf > 500m2) 5m 2m on 2 sides
Double Storeys 5m 4m on all sides
Triple Storeys 5m 6m on all sides
Table 5: Residential 2 Height, Coverage and Density
Residential 2
Primary Rights May be increased with written consent C
Density Height in Storeys Coverage % Max height in
Storeys
Max Coverage %
One dwelling per
erf
2 0 –
300m2
60 % 3 0 –
300m2
70%
301 –
500m2
55% 301 –
500m2
60%
501 –
1000m2
50% 501 –
1000m2
55%
1001m2
above
50% 1001m2
above
50%
10.4. Precinct Plans
10.4.1. Tembisa Hub Plan, 2016
The Tembisa Hub Plan has been developed as part of National Treasury’s Neighbourhood Development
Partnership Programme. The plan was finalized in 2016. The intention for this area is to provide a mixed-
use environment that is better connected to the surrounding neighbourhoods. The plan also aims to
enhance the neighbourhood character with appropriate public-private thresholds, where the historical

116
and cultural setting for this area is reflected and celebrated, and pedestrians are the priority (2016: 14 –
15).
The hub is made up of seven sub-precincts, which are envisioned to change over time. The aims for the
short-term are as follows: the Tembisa and Limindlela Station Precincts support a mix of business and
medium to high density residential uses. The Civic Precinct is currently the site of several social facilities,
which the plan seeks to enhance, along with land use provisions for intensive business use. The interface
with George Nyanga Drive has been earmarked for low impact business use, supported by medium to
high impact residential opportunities. Detailed planning has been done for Makhulong Precinct, which
will be discussed in the section below. The remaining precincts are intended for more intensive
residential typologies (2016: 43).
10.4.2. Thembisa Makhulong Community Precinct, 2019
This precinct plan was developed in 2019. The precinct is on Andrew Mapheto Drive. It is centred around
the Makhulong Stadium, which has been upgraded in accordance with the Makhulong Stadium Master
Plan, 2011. The site currently accommodates the Makhulong Stadium, Zion Church of Christ, Moses
Molelekwa Arts and Computer Centre, YES4Youth and hydroponics hub, informal car repairs and an
informal soccer field. This site is surrounded by single residential dwellings. The design seeks to
formalize the soccer field and motor repairs, expand the YES4Youth Hub and provide more intensive
housing opportunities and public interface opportunities.
10.4.3. Leralla Node, Transit-Oriented Development Analysis and Strategy, 2016 (World
Bank Group)
The Leralla Node is located around the Leralla Train Station, which is adjacent to Andrew Maphero Drive
in the south-west of the Thembisa study area. This strategy sets up a framework for a mixed-income,
transit-oriented node. A significant proportion of the land around this train station is owned by PRASA
(16.6 Ha) and the City of Ekurhuleni (14 Ha). Tembisa Plaza, a well-established, actively used strip mall,
the Leralla Trader’s Market, the train station, the BRT station and taxi rank are all key features in this
busy node.
The primary uses considered for this node are residential and retail. This study found that there is a high
demand for housing in this area, but that the market’s ability to absorb new stock is limited. As such,
the study recommends that the CoE provide housing using the Financial Linked Individual Subsidy,

117
which would provide housing that is appropriately matched to a significant number of residents in the
area who qualify for this subsidy. The node includes old hostel stock, which could be upgraded with
assistance from the Community Residential Units (CRU) programme, which provides rental
accommodation for low-income households and is aimed at refurbishing old hostel stock and inner city
buildings. The proposal to increase the retail space in this site is based off the active role that Tembisa
Plaza plays in attracting activity into this node. It is proposed that improving the retail offering in this
node will play an important role in the intensity of this node.

118
11. Prioritised and high potential nodes
11.1. Overview
To inform any TED opportunities, we have produced a series of spatial maps upon which an analysis
could be undertaken. The maps are produced at two distinct scales (i) that of the study area – showing
the larger context of the township and the respective nodes under investigation and (ii) the nodal or
precinct area – showing a more detailed analysis of the land and infrastructure dynamics at a smaller
scale.
The maps intend to build a cohesive spatial overview. The data was largely obtained from the City,
including reports and plans. There is still data that is missing or pending. As a result, some maps have
been produced by manually through allocating data (such as land use or zoning) to the drawings from
relevant planning documents.
In order to effectively bring about impact within the township, it is critical that the geographic extents
be appropriately identified. These are often described in spatial terms as nodes – a concentration of a
variety or similarity of activity. Typically, these exist along a route or at the confluence of two or more
such routes. In defining a node, we aim to show the relative size, distribution and relationship of focus
areas with the larger study area. In conjunction with the identification of geographic extents, the urban
typologies are simultaneously identified in relation to these spaces. They may include streets, private
land parcels, industry, natural features, informal settlements that make up the physical elements of the
node. Each urban typology warrants a unique understanding and corresponding developmental
response. The size and proximity of these nodes assist in developing a strategy of how to optimize the
developmental impact, taking into consideration the spatial dynamics of these nodes as operating in
isolation or relative to each other.
The identification of nodes has been based upon the institutional knowledge and documentation.
Following our assessment of the nodes and field investigations, these nodes were either adopted,
reprioritized or removed within the projects scope and node identification. In addition to the identified
nodes, the TAT team proposed additional nodes where the data and technical evidence suggested. A
basis for the identification of new nodes included,
(i) the capacity to bring catalytic spatial and economic transformation.
119
(ii) ability to be realized within the time, budgetary and technical constraints of the project.
(iii) A response to emergent social and economic activity.
(iv) The capacity to integrate stubborn and difficult development challenges.
The prioritised nodes for Thembisa include:
(i) Tembisa Civic Hub
(ii) Makhulong Node
(iii) Limindlella Station Node
(iv) Thembisa Station Node
(v) Leralla Station Node
Opportunity: The development of nodes will foster important economic growth for Thembisa
through important strategic planning that can cater for, promote and regulate business activity.
This could include precinct management that could in turn foster partnerships such as the the NDPP
to advance projects and mobilise investment.
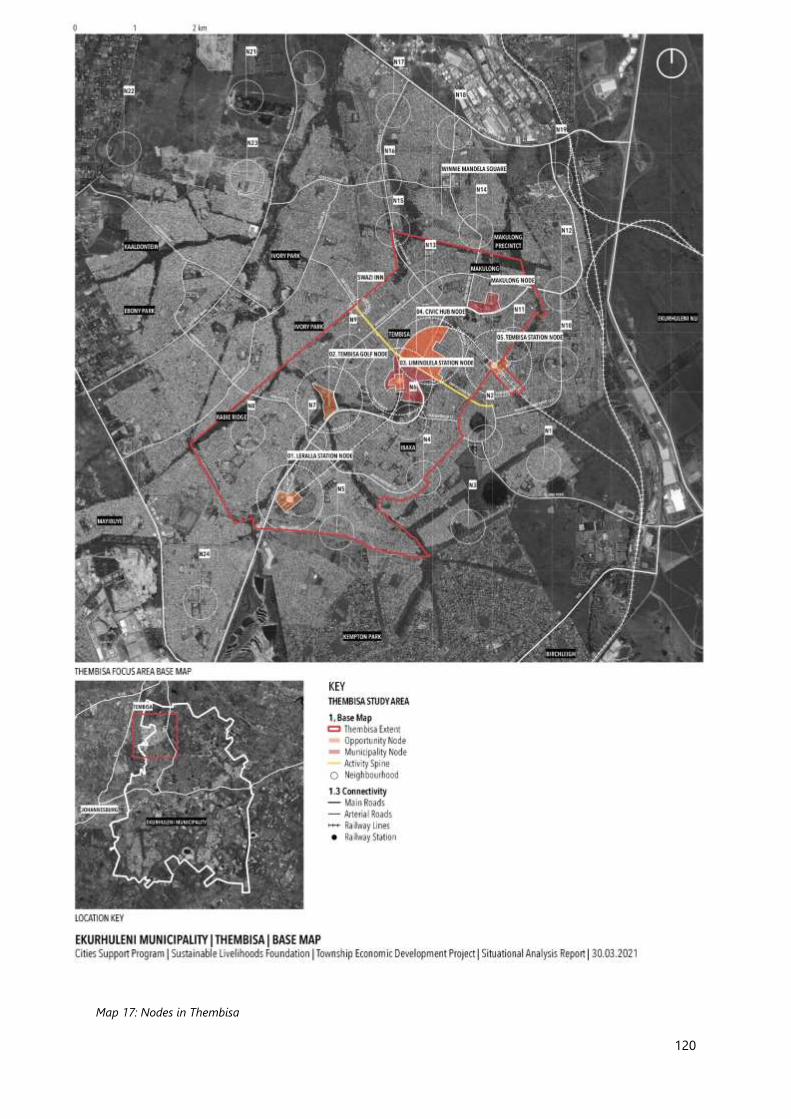
120
Map 17: Nodes in Thembisa

121
11.2. Infrastructure and Natural Systems
The nodes that have been identified are located on existing transport corridors, which reveal a
reasonable level of internodal synergy. The vulnerable railway system will have an impact on the
performance of these nodal systems. There is a realistic amount of formal and operational basic
infrastructure in these sites. There are encouraging signs of increased residential private densification,
especially around areas that have high amenity or connectivity. Land parcels adjacent to key transport
systems and economic hubs are not fully optimised and would benefit from an intensification and
diversification of real estate at these conditions.
The proximity of nodes to each other, their connectivity, and roles, allow for a few valuable opportunities
to invest in high street activation at a significant scale – especially as there is ample existing evidence
to support this trajectory.
Opportunity: Commercial high streets activated in strategic sites / roads.

122
Map 18: Land Ownership
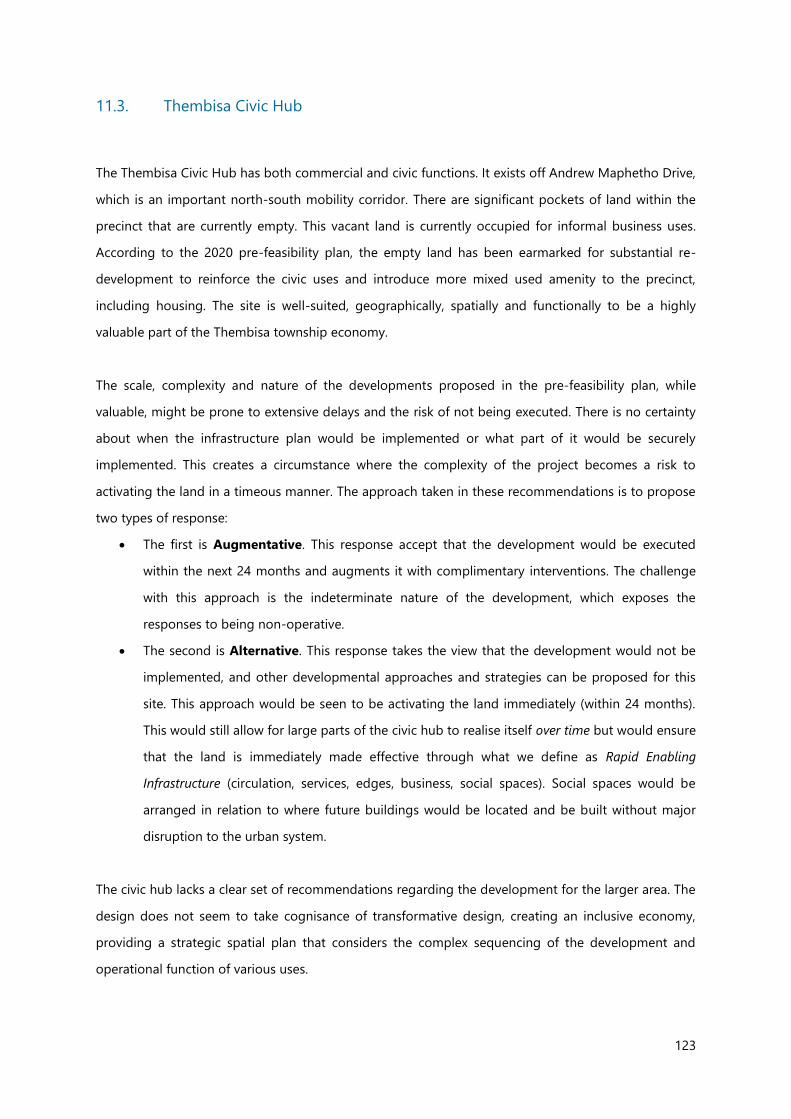
123
11.3. Thembisa Civic Hub
The Thembisa Civic Hub has both commercial and civic functions. It exists off Andrew Maphetho Drive,
which is an important north-south mobility corridor. There are significant pockets of land within the
precinct that are currently empty. This vacant land is currently occupied for informal business uses.
According to the 2020 pre-feasibility plan, the empty land has been earmarked for substantial re-
development to reinforce the civic uses and introduce more mixed used amenity to the precinct,
including housing. The site is well-suited, geographically, spatially and functionally to be a highly
valuable part of the Thembisa township economy.
The scale, complexity and nature of the developments proposed in the pre-feasibility plan, while
valuable, might be prone to extensive delays and the risk of not being executed. There is no certainty
about when the infrastructure plan would be implemented or what part of it would be securely
implemented. This creates a circumstance where the complexity of the project becomes a risk to
activating the land in a timeous manner. The approach taken in these recommendations is to propose
two types of response:
• The first is Augmentative. This response accept that the development would be executed
within the next 24 months and augments it with complimentary interventions. The challenge
with this approach is the indeterminate nature of the development, which exposes the
responses to being non-operative.
• The second is Alternative. This response takes the view that the development would not be
implemented, and other developmental approaches and strategies can be proposed for this
site. This approach would be seen to be activating the land immediately (within 24 months).
This would still allow for large parts of the civic hub to realise itself over time but would ensure
that the land is immediately made effective through what we define as Rapid Enabling
Infrastructure (circulation, services, edges, business, social spaces). Social spaces would be
arranged in relation to where future buildings would be located and be built without major
disruption to the urban system.
The civic hub lacks a clear set of recommendations regarding the development for the larger area. The
design does not seem to take cognisance of transformative design, creating an inclusive economy,
providing a strategic spatial plan that considers the complex sequencing of the development and
operational function of various uses.
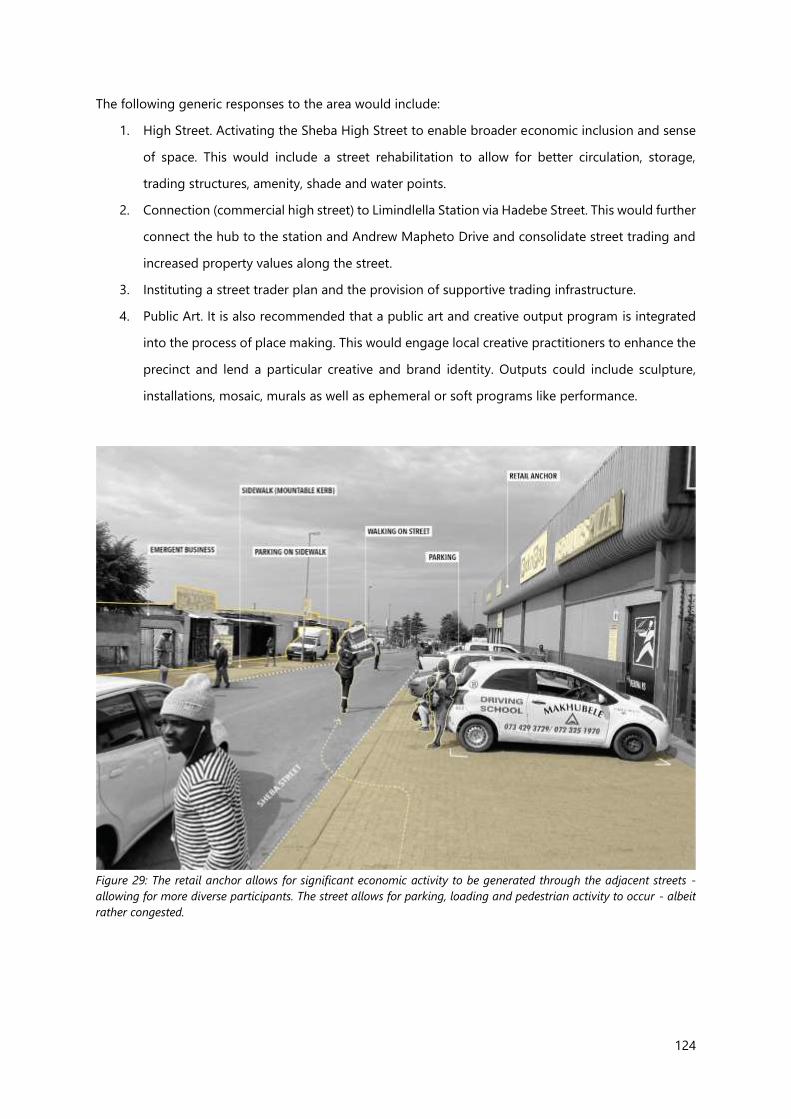
124
The following generic responses to the area would include:
1. High Street. Activating the Sheba High Street to enable broader economic inclusion and sense
of space. This would include a street rehabilitation to allow for better circulation, storage,
trading structures, amenity, shade and water points.
2. Connection (commercial high street) to Limindlella Station via Hadebe Street. This would further
connect the hub to the station and Andrew Mapheto Drive and consolidate street trading and
increased property values along the street.
3. Instituting a street trader plan and the provision of supportive trading infrastructure.
4. Public Art. It is also recommended that a public art and creative output program is integrated
into the process of place making. This would engage local creative practitioners to enhance the
precinct and lend a particular creative and brand identity. Outputs could include sculpture,
installations, mosaic, murals as well as ephemeral or soft programs like performance.
Figure 29: The retail anchor allows for significant economic activity to be generated through the adjacent streets -
allowing for more diverse participants. The street allows for parking, loading and pedestrian activity to occur - albeit
rather congested.

125
Opportunity: Thembisa civic hub transformed into a business and service hub.
Opportunity: A street trader plan implemented within the Thembisa civic node.
Opportunity: Facilities upgraded, and precinct management instituted in public spaces (including
parks).
Opportunity: Shopping malls foster and enable opportunities for micro-enterprises.
Opportunity: Public safety enhanced through the application of crime prevention through
environmental design and precinct management.
Figure 30: The recently upgrade park provides a key pedestrian railway underpass in the neighbourhood. The amenities
require augmenting and programming to ensure better use of the park across more diverse user groups to better use
the space.

126
The following section includes a series of maps relating to this node. The table below provides a summary of the status quo and trends for the Thembisa Civic
Hub, as indicated in the maps. In instances where the GIS data is not available or has not been provided, the table specifies the gaps.
Table 6: Status Quo of Thembisa Civic Hub
Connectivity/Transport Socio-economic Function Current Zoning Digital Stormwater,
Water and
Sanitation
Energy Human
Settlements
Trader Access
to
Infrastructure
The hub includes two train
stations. Informal
pedestrian routes connect
the surrounding residential
areas and stations to the
commercial & service
centre. Andrew Mapheto
intersects this hub, BRT
route 2 and stops in site.
Andrew Mapheto also
serves as a taxi route.
An important civic and
commercial hub. State services
include the Metro service
centre, library, post office and
SAPS. SME retailers and
corporate retailers operate
from the Thembi Mall,
independent shopping centres
and high streets (Sheba Street
/ George Nyanga Drive). Street
traders operate informally,
without infrastructure. Public
space includes Ibazelo Park.
The wider hub includes two
areas of informal settlement:
Igqagqa and Isekelo. Rapid
densification of residential
properties within the hub.
Primarily residential 2,
with some parcels of
land used for
residential 3. Business
zoning around
Limindlela station and
in the centre of the
site, adjacent to
Andrew Mapheto
Drive. Mixture of
transportation,
institutional and
agricultural zoning
around rail and
Andrew Mapheto
Drive.
No Data
Available
Stormwater
pipes and
manholes are
unevenly
available across
the site. The bulk
and sewerage
system connects
well across this
node.
No data
available.
Proposed high
density
residential in
Endulweni,
Isithame and
Kopanong.
Some formal
water and
electricity
access.
Predominantly
informal or no
water access.
Predominantly
no electricity
access, with
some informal
connections.

127
Map 19: Thembisa Civic Hub

128
Map 20: Land Use, Thembisa Civic Hub

129
Map 21: Land Ownership, Thembisa Civic Hub

130
Map 22: Zoning, Thembisa Civic Hub

131
Map 23: Sanitation, Thembisa Civic Hub
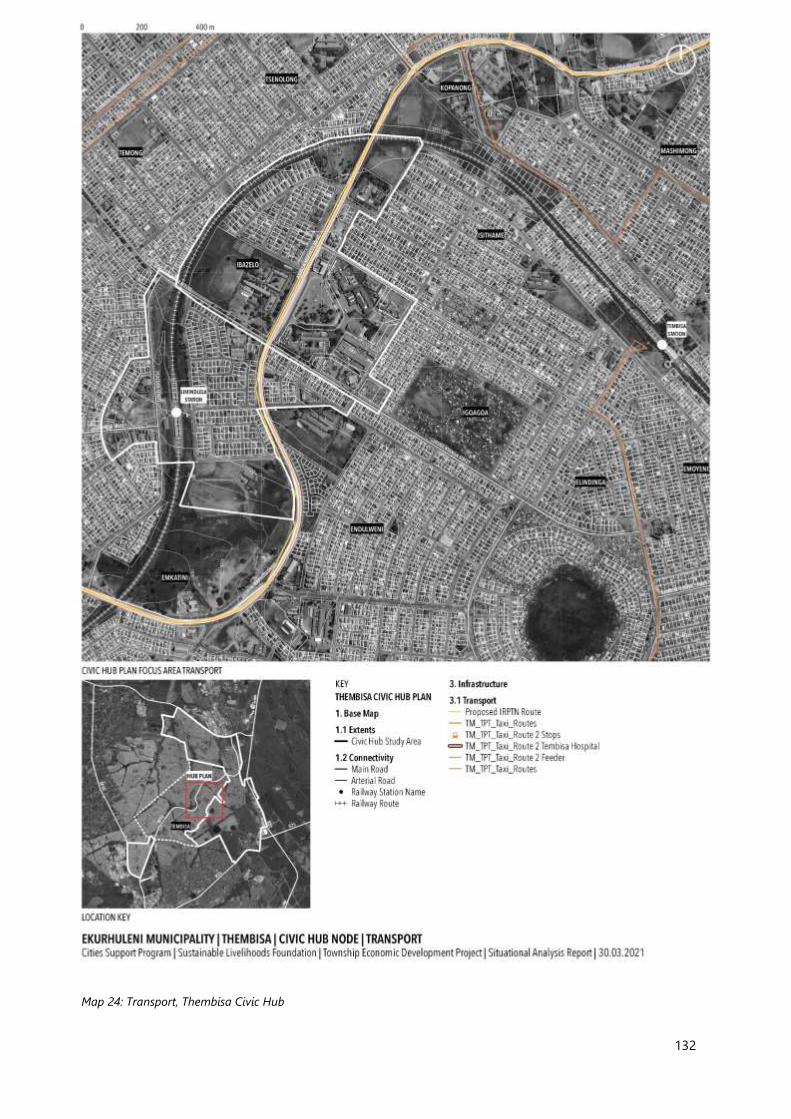
132
Map 24: Transport, Thembisa Civic Hub

133
Map 25: Housing, Thembisa Civic Hub
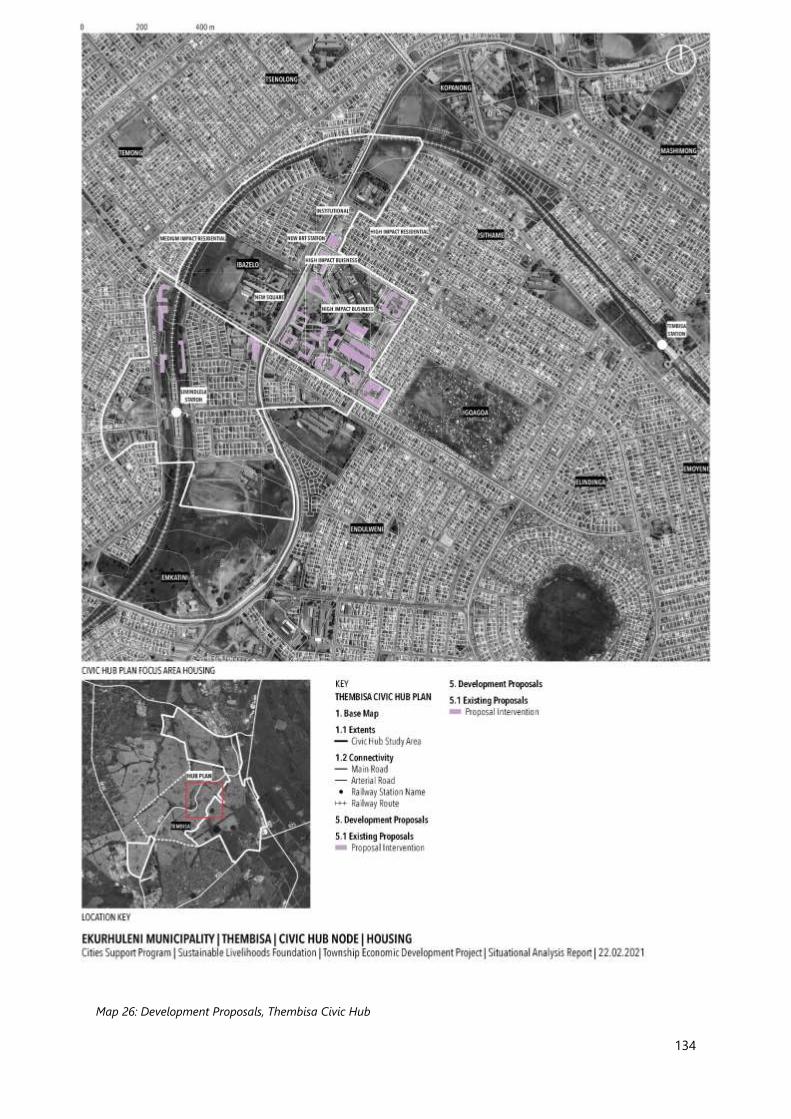
134
Map 26: Development Proposals, Thembisa Civic Hub
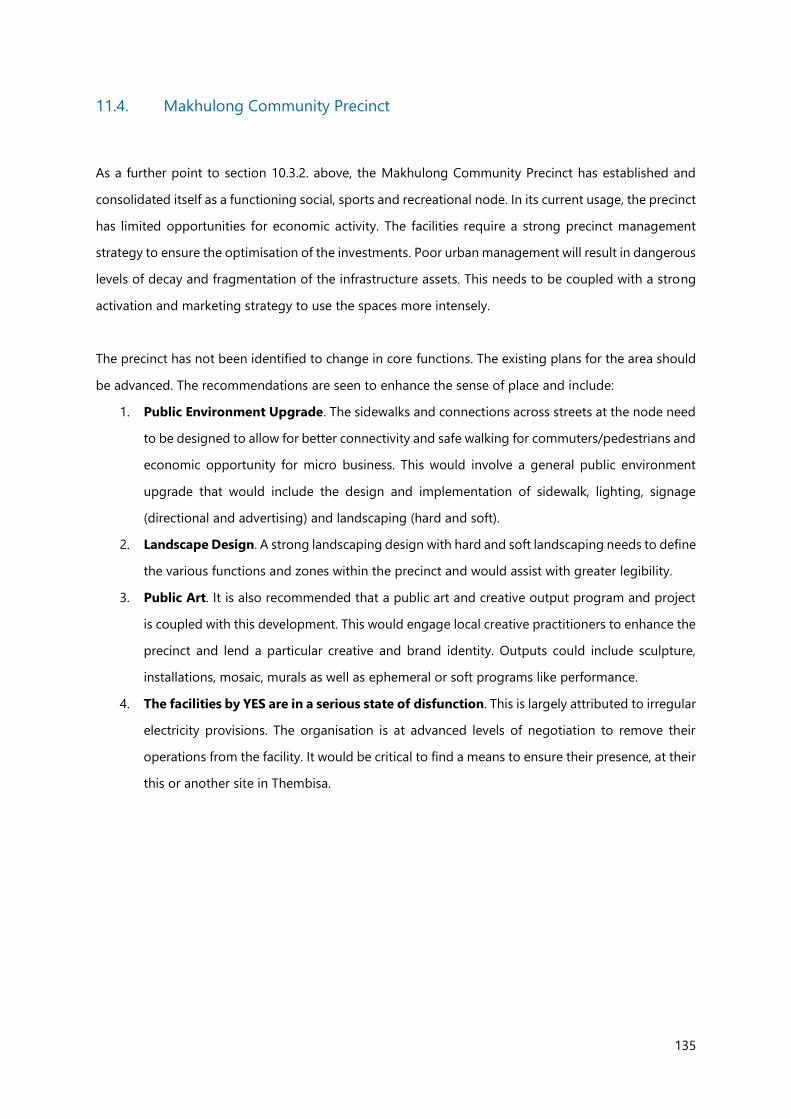
135
11.4. Makhulong Community Precinct
As a further point to section 10.3.2. above, the Makhulong Community Precinct has established and
consolidated itself as a functioning social, sports and recreational node. In its current usage, the precinct
has limited opportunities for economic activity. The facilities require a strong precinct management
strategy to ensure the optimisation of the investments. Poor urban management will result in dangerous
levels of decay and fragmentation of the infrastructure assets. This needs to be coupled with a strong
activation and marketing strategy to use the spaces more intensely.
The precinct has not been identified to change in core functions. The existing plans for the area should
be advanced. The recommendations are seen to enhance the sense of place and include:
1. Public Environment Upgrade. The sidewalks and connections across streets at the node need
to be designed to allow for better connectivity and safe walking for commuters/pedestrians and
economic opportunity for micro business. This would involve a general public environment
upgrade that would include the design and implementation of sidewalk, lighting, signage
(directional and advertising) and landscaping (hard and soft).
2. Landscape Design. A strong landscaping design with hard and soft landscaping needs to define
the various functions and zones within the precinct and would assist with greater legibility.
3. Public Art. It is also recommended that a public art and creative output program and project
is coupled with this development. This would engage local creative practitioners to enhance the
precinct and lend a particular creative and brand identity. Outputs could include sculpture,
installations, mosaic, murals as well as ephemeral or soft programs like performance.
4. The facilities by YES are in a serious state of disfunction. This is largely attributed to irregular
electricity provisions. The organisation is at advanced levels of negotiation to remove their
operations from the facility. It would be critical to find a means to ensure their presence, at their
this or another site in Thembisa.

136
Figure 31: Signage is critical to micro street businesses and are well located to attract potential clients and showcase
services. These signs, their business, location and coordination presents a valuable opportunity to strategise a
coordinated response to signage and space making.
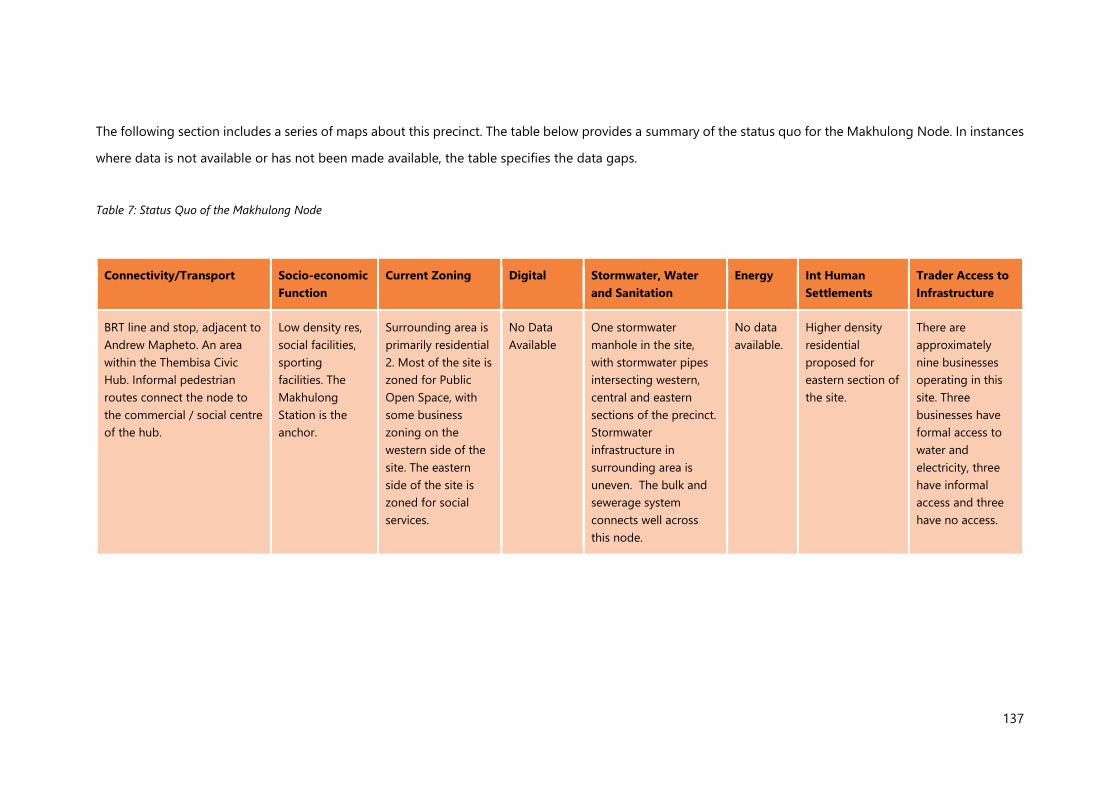
137
The following section includes a series of maps about this precinct. The table below provides a summary of the status quo for the Makhulong Node. In instances
where data is not available or has not been made available, the table specifies the data gaps.
Table 7: Status Quo of the Makhulong Node
Connectivity/Transport Socio-economic
Function
Current Zoning Digital Stormwater, Water
and Sanitation
Energy Int Human
Settlements
Trader Access to
Infrastructure
BRT line and stop, adjacent to
Andrew Mapheto. An area
within the Thembisa Civic
Hub. Informal pedestrian
routes connect the node to
the commercial / social centre
of the hub.
Low density res,
social facilities,
sporting
facilities. The
Makhulong
Station is the
anchor.
Surrounding area is
primarily residential
2. Most of the site is
zoned for Public
Open Space, with
some business
zoning on the
western side of the
site. The eastern
side of the site is
zoned for social
services.
No Data
Available
One stormwater
manhole in the site,
with stormwater pipes
intersecting western,
central and eastern
sections of the precinct.
Stormwater
infrastructure in
surrounding area is
uneven. The bulk and
sewerage system
connects well across
this node.
No data
available.
Higher density
residential
proposed for
eastern section of
the site.
There are
approximately
nine businesses
operating in this
site. Three
businesses have
formal access to
water and
electricity, three
have informal
access and three
have no access.

138
Map 27: The Makhulong Node

139
Map 28: Land Use, Makhulong Node

140
Map 29: Land Ownership, Makhulong Node

141
Map 30: Zoning, Makhulong Node

142
Map 31: Transport, Makhulong

143
Map 32: Stormwater Infrastructure, Makhulong Node

144
Map 33: Housing Dynamics, Makhulong Node

145
Map 34: Development Proposals, Makhulong Node:

146
11.5. Limindlela Station Node
The Limindlela Station Precinct is situated in close proximity to the civic node and north-south mobility
corridor, making it highly accessible and (informally) connected. Despite the sub-optimal performance
of the railway system at present, the site attracts some degree of economic activity, but does struggle
operationally with the railway’s systemic vulnerability. This poses a great threat to businesses that
requires a predictable throughput of commuter volumes. The node also contains significant open land
or properties that can attract developmental intensification
The following recommendations are contemplated for the node:
1. Develop an urban management plan and the clearly demarcate the scope of the node. The
stakeholders would need to be clearly defined and engaged in the process of the
transformation of the node.
2. Business infrastructure support. The existing business adjacent station need to be
acknowledged as critical agents in the well-being of the precinct and their needs to be
adequately integrated into the development of the precinct.
3. Station entrance re-design. The eastern side of the station requires rehabilitation;it needs to
carefully integrate commuter flow, economic infrastructure and social spaces.
4. Public environment upgrade. The sidewalks and connections across streets at the node need to
be designed to allow for better connectivity and safe walking for commuters/pedestrians and
economic opportunity for micro-business. This would involve a general public environment
upgrade that would include the design and implementation of sidewalk, lighting, signage
(directional and advertising) and landscaping (hard and soft).
5. Park Rehabilitation. The park to the west of the station to be upgraded to introduce a sports
and recreational facility, or pocket-park. The park to form part of the urban management plan
and activated accordingly.
Opportunity: Train station nodes revitalised for mixed-use.
Opportunity: A network of NMT and pedestrian lanes developed.
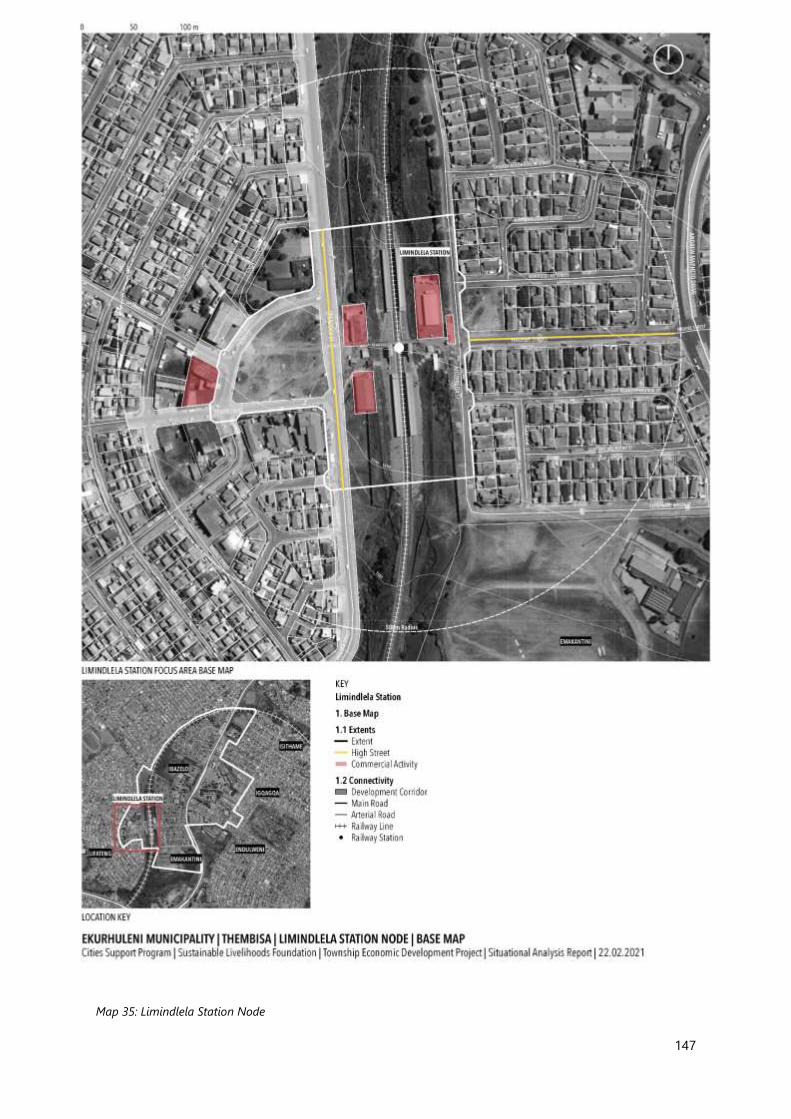
147
Map 35: Limindlela Station Node

148
Map 36: Land Ownership, Limindlela Station Node

149
Map 37: Zoning, Limindlela Station Node

150
Map 38: Transport, Limindlela Station Node

151
Map 39: Stormwater Infrastructure, Limindlela Station
152
11.6. Leralla Station Node
Further to section 10.4.3. above, Leralla Station Precinct demonstrates significant existing assets,
including CoE infrastructure, that should be leveraged to consolidate more intense growth and
diversification (asset ‘sweating’). It comprises a valuable set of built infrastructure resources and
connectivity to warrant investment. The broad range of economic actors, land arrangements and
development potential make this node ideal for intense investment and coherent precinct management.
In addition to the 2016 plans, the following recommendations are contemplated for the node:
1. Urban management plan and the clear demarcation of a precinct within this node. The
stakeholders would need to be clearly defined and engaged in the process of the
transformation of the node.
2. Taxi terminus. Design of a taxi terminus that includes clear traffic management, signage, shelter,
offices, trading spaces, ablutions, waiting areas, WiFi, lighting and landscaping. This design
clarity would allow for a better operation and consolidation of economic investment at the rank.
It is important to link taxi transport to the BRT routes / station.
3. Traders market. This municipal market includes shelter ablutions (though not functioning),
trading infrastructure and social spaces. The market has the potential to be a connecter between
the taxi rank, BRT station and shopping centre. It allows for smaller scale economic actors to
participate in the opportunities generated by the adjacent transport infrastructure and mall-
based businesses.
4. Street Trader Plan. A street trader plan would need to be identified and established to ensure
there is a degree of cohesion, opportunity and legibility in how street trade is conducted. The
street trading infrastructure would relate to the Municipal Market and the transport facilities in
the node.
Opportunity: A precinct management plan instituted, and upgrades completed for Leralla trader
market.
Opportunity: Public safety enhanced through the application of crime prevention through environmental design
and precinct management.
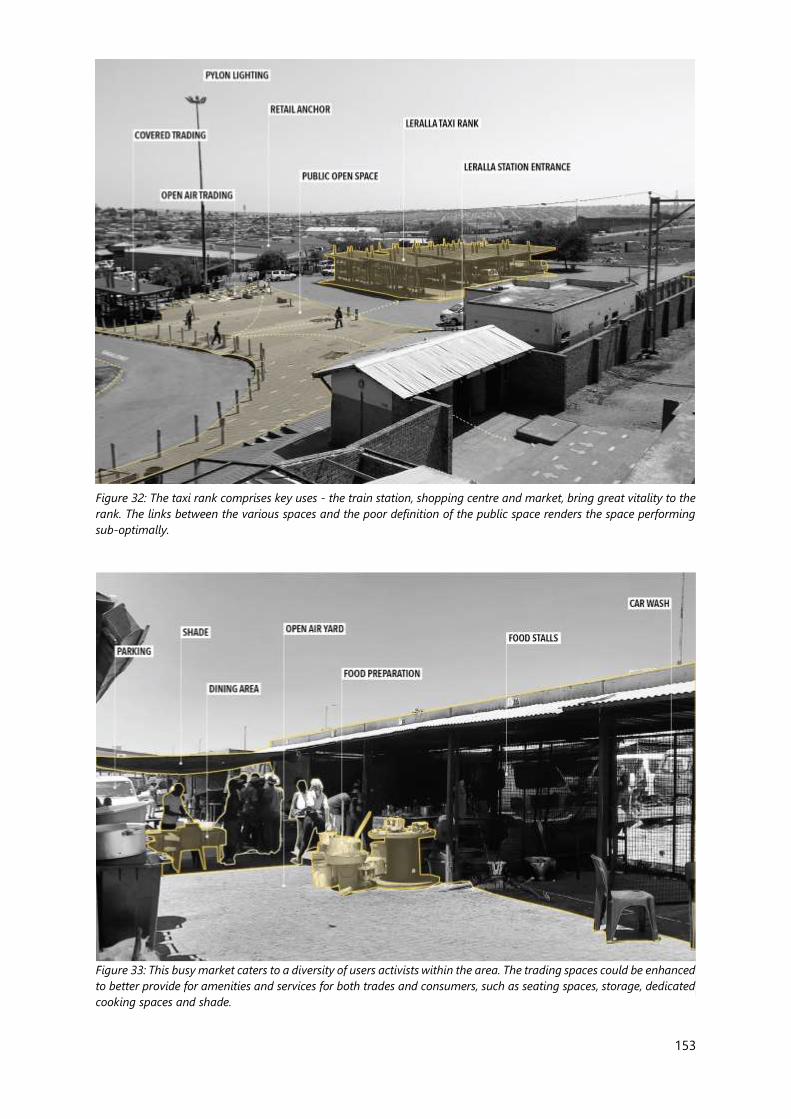
153
Figure 32: The taxi rank comprises key uses - the train station, shopping centre and market, bring great vitality to the
rank. The links between the various spaces and the poor definition of the public space renders the space performing
sub-optimally.
Figure 33: This busy market caters to a diversity of users activists within the area. The trading spaces could be enhanced
to better provide for amenities and services for both trades and consumers, such as seating spaces, storage, dedicated
cooking spaces and shade.

154
The following section includes a series of maps relating to this node. The table below provides a summary of the status quo for the Leralla Station Node. In
instances where the GIS data is not available or has not been provided, the table indicates the gaps.
Table 8: Status Quo of Leralla Station Node
Connectivity/Transport Socio-economic
Function
Current Zoning Digital Stormwater,
Water and
Sanitation
Energy Int Human
Settlements
Trader Access to
Infrastructure
Leralla Train Station, BRT
station, mini-bus taxi rank
and informal sedan taxi
services. The node is
situated adjacent to
Andrew Mapheto.
Informal pedestrian routes
connect Ehlazeni Hostel
residents to the Plaza and
Traders. A bridge to serve
the BRT straddles Andrew
Mapheto Drive.
The node
comprises 3
precincts: the
Thembisa Plaza,
the Leralla
Trader market,
and the Leralla
Station precinct.
The node
includes a public
park and
community hall.
The area around
Leralla Station is
zoned for
transportation.
Thembisa Plaza
and the trader
site are zoned
Business 2, with
the site south of
the trader stalls
zoned for public
services.
No Data
Available
Some stormwater
facilities on
Andrew Mapheto
Drive.
Stormwater
infrastructure in
surrounding area
is uneven. The
bulk and
sewerage system
connects well
across this node.
No data
available.
No Data
Available
There are no
formal water or
electricity access
points in this
node. Most
businesses do not
have water or
electricity access,
while some have
informal access.
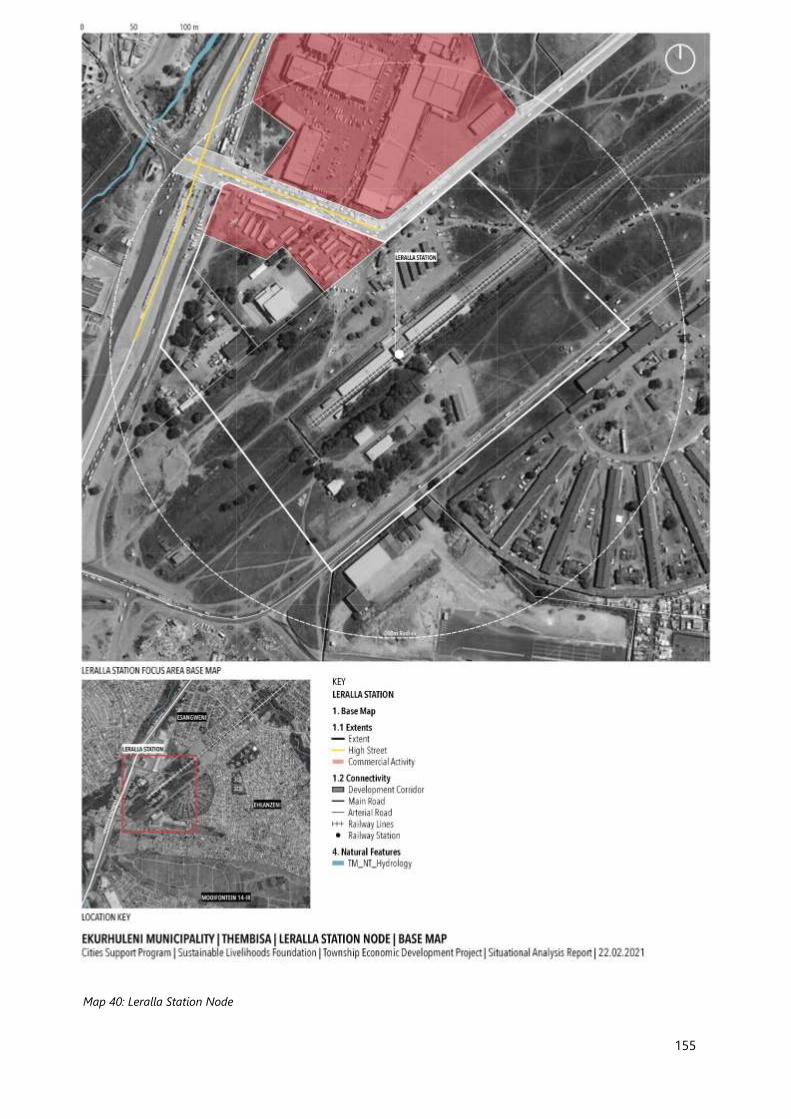
155
Map 40: Leralla Station Node

156
Map 41: Land Ownership, Leralla Station Node

157
Map 42: Zoning, Leralla Station Node

158
Map 43: Transport, Leralla Station Node

159
Map 44: Housing Dynamics, Leralla Station Node

160
Map 45: Stormwater Infrastructure, Leralla Station

161
11.7. Thembisa Station Node
This node is entirely defined by the Thembisa Station, which forms a sub-precinct in the Thembisa Civic
Hub Plan. The sub-precinct is highly reliant on a functional railway system – which at present is very
vulnerable. This vulnerability threatens a predictable economic climate in the node upon which a
development can be rendered feasible. While the station is present, it would be more valuable to explore
the land around the station without factoring the station as a developmental force. The proposed
Kopanong and Isithame housing developments to the west of this node will increase the density of
housing in adjacent areas.. The station building and related infrastructure are in an advanced state of
disrepair and needing urgent maintenance or upgrade.
The following recommendations are contemplated for the node:
1. Develop an urban management plan.. The stakeholders would need to be clearly defined and
engaged in the process of the transformation of the node. A stakeholder and management plan
will create a secure institutional space for increased private investment – especially through
underperforming land parcels within the node.
2. Public environment upgrade. The sidewalks and connections across streets at the node need to
be designed to allow for better connectivity and safe walking for commuters/pedestrians and
economic opportunity for micro-business. This would involve an environment upgrade that
would include the design and implementation of sidewalk, lighting, signage (directional and
advertising) and landscaping (hard and soft).
3. Trading Infrastructure. The introduction of well-designed trading infrastructure should define
the approach and entrance to the station. This would simultaneously get the traders and
commuters to be in better proximity. The traders would be dependent on the performance of
the railway system and its ability to generate significant traffic volumes.
4. Housing. Adjacent land is sub-optimally used. This land should be identified for high-density
housing.
5. Backyarding. The current proliferation of backyarding in the area needs to be formalised in
support of spatial development plans. Increased density of existing private land in a 200m radius
from the station should be encouraged.
6. Park Rehabilitation. The park outside the north entrance of the station to be upgraded as a
pocket-park. The park to form part of the urban management plan and activated accordingly.
7.
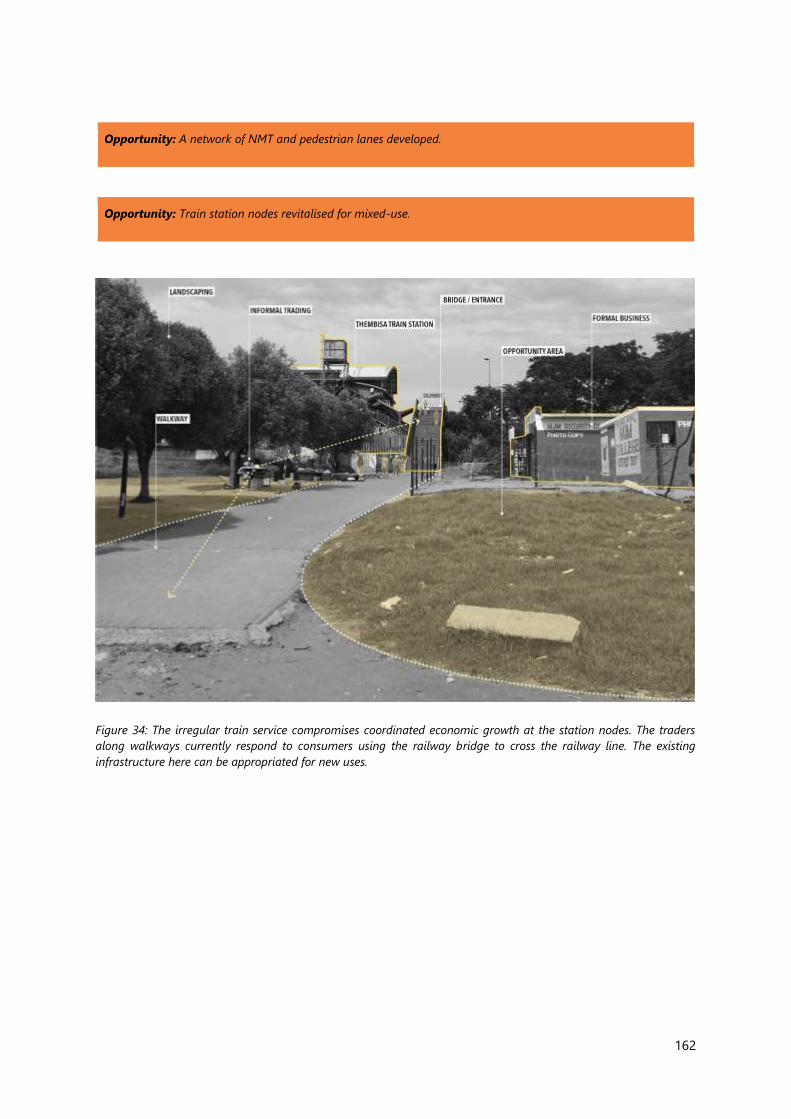
162
Opportunity: A network of NMT and pedestrian lanes developed.
Opportunity: Train station nodes revitalised for mixed-use.
Figure 34: The irregular train service compromises coordinated economic growth at the station nodes. The traders
along walkways currently respond to consumers using the railway bridge to cross the railway line. The existing
infrastructure here can be appropriated for new uses.

163
Map 46: Thembisa Station Node

164
Map 47: Land Ownership, Thembisa Station Node
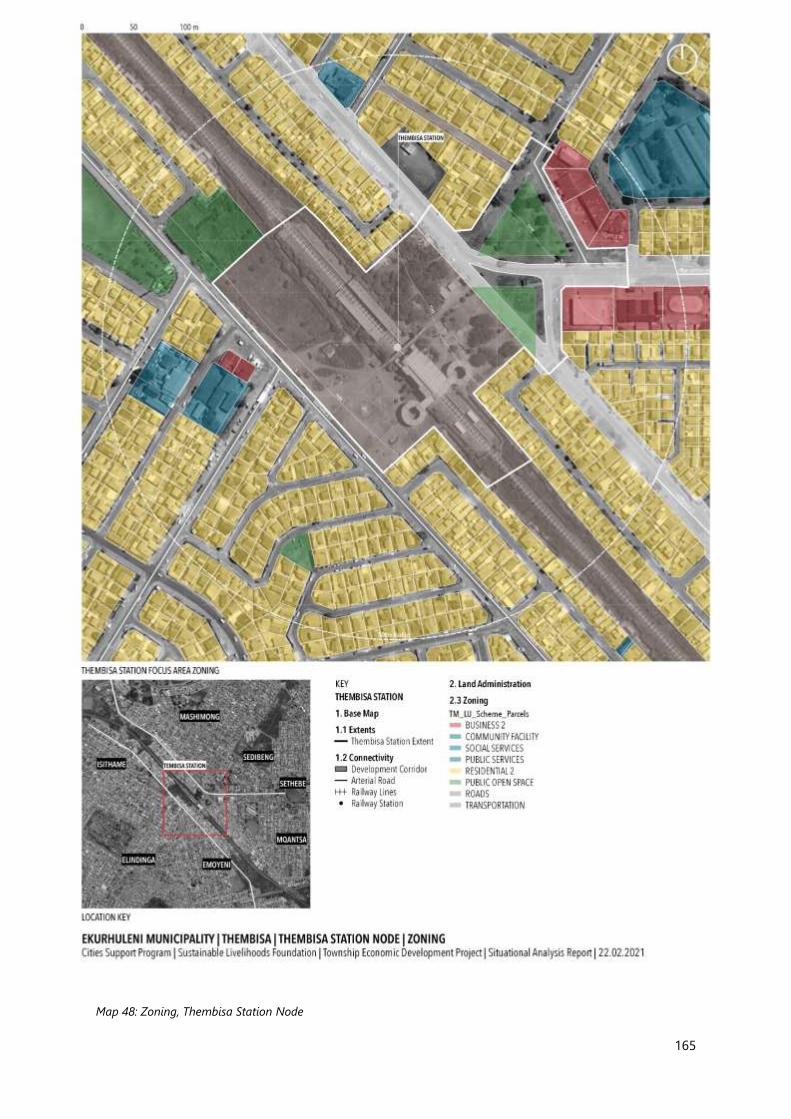
165
Map 48: Zoning, Thembisa Station Node

166
Map 49: Transport Facilities and Routes, Thembisa Station Node
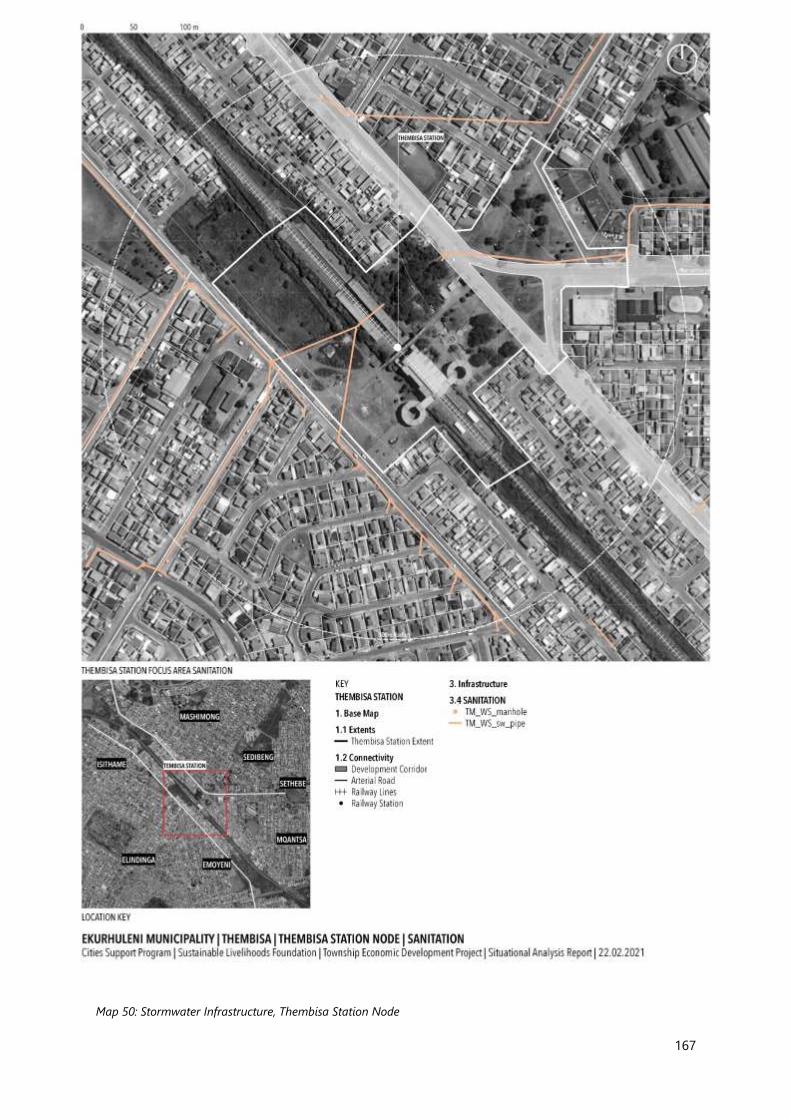
167
Map 50: Stormwater Infrastructure, Thembisa Station Node
168
12. Housing
12.1. Overview
This section analyses the role of housing in township economic development in Thembisa. It uses the
housing asset framework to analyse the social, economic and financial functions of housing and their
contributions to township development. It also draws attention to the roles of place-making and
institutions in increasing the all-round value of housing and stimulating economic density, i.e., higher
investment in buildings and other physical structures.
The study uses available quantitative and qualitative data to analyse the existing housing situation and
the main trends, upon which future opportunities are identified and discussed. Information gaps
presented a significant challenge to understanding the housing dynamics in Thembisa. Limited
information on basic issues including population growth, housing demand, density, informal dwellings
and local property markets render the analysis incomplete.
12.2. Conceptual Framework: Housing as social, economic and financial asset
The housing asset framework (Rust 2020) 1 offers a useful conceptual lens to understand the social,
economic and financial importance of housing and how they can contribute to township economic
development. As a social asset, housing provides township residents with a safe and secure place to
live, socialise, study and sleep. As an economic asset, housing generates income and livelihood
opportunities for homeowners. The social and economic functions of housing influence its value as a
financial asset. As a financial asset, the house can be traded for money, used as collateral to access
finance or as an investment to accumulate wealth, which can be passed on to others. The figure below
depicts the social, economic and financial asset values of housing and their contribution to township
economic development.
1 Rust, K. (2020). Framing concept: Understanding the housing asset. Centre for Affordable Housing
Finance. http://housingfinanceafrica.org/documents/framing-concept-understanding-the-housing-
asset/

169
Figure 35: Housing Asset Values and their contribution to TED

170
Map 52: Housing, Thembisa

171
12.3. Housing as social asset
There is growing demand for low-cost and affordable housing in Thembisa. The township is a long-
established, vibrant and sought-after place in the East Rand, relatively well-located in good proximity
to employment opportunities and public transport routes.
The population of Thembisa was more than 460,000 in 2011. Since then it seems to have grown
significantly, judging from the many additional informal dwellings situated on public and private land.
Unfortunately, no recent count of the actual population in the township is available. Thembisa has a mix
of poor and middle-income population, which is also reflected in the different property values. The areas
of Endayini, Emkatini and Ibazelo have the highest average property values in the township. There is a
noticeable class of middle-income households with higher purchasing power and a growing class of
young professionals, who are seeking higher quality housing, including rental accommodation.
Homeowners in middle income strata have made considerable investment into their properties,
renovating, expanding the original building and investing in place-making. This presents important
opportunities for local construction industry and enterprise operating along the value chain.
Opportunity: The housing and commercial property market strengthened.

172
12.4. Formal housing delivery
Thembisa has a mix of formal and informal housing stock, whereas the number of informal dwellings
appear to be growing much stronger than formally delivered houses. The formal housing stock is
dominated by state housing delivered during apartheid and through RDP/BNG programmes post-1994.
The free-standing four-room house on individual plot is the common house found all around the
settlement. These were houses built mostly during the apartheid era (1950 to 1975) for workers
employed in industrial centres of the East Rand / Ekurhuleni. Similar housing architecture has been used
for RDP housing post-apartheid. The dominant size of property is 250 m2. In various parts of Thembisa
hotels can be found (Ehlanzeni, Pink, Sethokga, Transnet, Blue and NCP hostels). Private sector led
developments for the middle to higher income groups are situated in areas along R21 motorway
including Esselen Park/ Area 9 (e.g. Esselen Park, Norkem Park, Green Acres, Birchleigh, Birchleigh North
and Hospital View in Thembisa).
Figure 36: Residents of Thembisa make investments into the security and beautification of homes

173
As of 2019, Thembisa had a registered housing stock of 20,296. This is considerably less than all formal
housing recorded in the 2011 census, indicating a significant backlog in the transfer of title deeds. Hardly
any new housing developments have taken place in recent years. Between 2015 and 2019, the stock
grew by merely 38 new registered properties, which is less than 0% of the total stock. A human
settlements project is currently being implemented in Extension 25 to cater for shack dwellers living in
Winnie Mandela informal settlement in Thembisa. Over R140 million had been set aside in 2018 to build
over 3500 units in Thembisa Extension 25 over the next three years. The multi-year project aims to
deliver 3159 RDP walk-ups and 351 social housing as four-storey walk ups. Bulk infrastructure including
sewage system, streetlights, electricity transformers and roads have been constructed and installed. The
project offers important opportunities for township enterprises and local construction industry. The plan
is to construct 500 units every year until project end in 2024.
Given the latest announcements by the Department of Human Settlements, indicating that free BNG
housing delivery will be drastically reduced and replaced by sites and services schemes, it is unlikely that
government investments in formal housing will play a significant role in future. However, there are
opportunities for innovative public-private partnerships in delivering higher-density affordable housing.
Through unlocking strategic sites and enable in-fill developments, the city can promote urban
consolidation and renewal. The current initiatives under the Thembisa Urban Hub, which are being rolled
out by National Treasury as part of the Urban Network Programme, could bring catalytic effects to the
neighbourhood. Detailed sub-precinct plans have been completed for the Thembisa Civic Hub and
Makhulong Community precinct. The proposed development would include a range of mixed uses
including higher density residential developments. Multi-storey apartments, three to 4 storeys high, are
proposed to promote economic density.
Figure 37: Mixed Use Development proposed for Makhulong Community Precinct
174
Additional infill opportunities exist on smaller sites that can be found across the settlement. Preliminary
studies indicate the potential for medium to higher density developments in Endulweni and Kopanong
/ Isithame, which would create 400 and 3000 housing units respectively. More detailed feasibility studies
are required to assess the opportunities and challenges of these proposed developments. Public
facilities like schools and parks could be targeted for infill development to contribute to urban
consolidation. Past planning practices have allocated large sites for some of these institutions. As a
consequence, parcels of land remain vacant and in some cases are used for informal activities. This
situation perpetuates spatial fragmentation. The underused portions of the land could be redeveloped
into higher density residential blocks.
Opportunity: Formal housing established in strategic sites.
12.5. Informal housing delivery
Informal housing has largely absorbed the growing population in Thembisa. More specifically, informal
dwellings in the backyard of RDP/BNG houses have mushroomed across the settlement. In addition to
the low-cost shacks and ‘wendy’ houses, there has been a noticeable rise in solid single or double-storey
micro flats. As elsewhere in the country, individual homeowners and enterprising developers are
investing in their backyard property to meet the growing demand in affordable, higher quality rental
accommodation (Scheba and Turok 2020)2.
2 Scheba, A. & Turok, I. (2020) Informal rental housing in the South: dynamic but neglected. Environment
and Urbanization. Vol 32(1):109-132

175
Figure 38: Double Storey Rental Flats
Figure 39: Double Storey Rental Flats
The diversification of backyard rental accommodation illustrates the existence of different rental sub-
markets catering for different income groups. At the lower end, zozo rooms and wendy houses are
rented for over R400 per month, excluding electricity. Rooms in semi-detached extensions and micro-

176
flats cost approximately R1000 to R1500 on average, excluding electricity. The higher end rooms with
better finishing and en-suite bathroom can cost up to R3000 per month.
The backyard real estate market offers important opportunities for the local construction and property
industry as well as for businesses in up- and downstream industries. A number of brickmakers can be
found along Andrew Mapheto Drive, where the manufacture bricks for R5 each. Some brickmakers also
sell sand and cement to customers. They are situated on land next to a river for easy water access, but
the site is not zoned for business and none of the enterprises are formal. Architect / drafts persons are
engaged to design investments (space efficiency) and ensure that buildings comply with informal (rather
than municipal) norms and standards. He explains that formally you allowed to build double storey
blocks with 7 rooms on each floor. He develops and sells building plans with this kind of set up. The
average building costs are R8000 m2 for double storey flats. However, most backyard rental dwellings
are not formally approved because of land use regulations, building plan issues or lack of title deeds.
An interviewed warehouse owner sees growing potential in the home improvements and maintenance
segments. His bestselling items are plumbing, electrical and painting material.
Both the private and public sector have recognised the growth and potential of the backyard real estate
market. Companies like Indlu have begun to work with individual homeowners to build higher quality
rental stock in Thembisa. Indlu enables homeowners with no or very little capital to build and benefit
from rental accommodation by financing the development and entering into a benefit sharing
agreement. The picture below is an example of an Indlu financed rental property.
Opportunity: Property investment in backyard rental accommodation units enabled and formalised.

177
Figure 40: Indlu Double Storey Rental Flats
High level discussions are taking place between the Gauteng provincial government, the City of
Ekurhuleni and Cities Support Programme of the National Treasury about how to promote a precinct-
based approach to backyarding in Thembisa. As financing is one of the main challenges for homeowners
to transform their low-cost structures into higher-quality, mixed used backyard real estate, a precinct-
based approach that ensures necessary scale could unlock large-scale private sector funding from banks
that is channelled via intermediaries to individual homeowners. Linked with the right regulatory and
administrative support, this approach could contribute to the development of successful high streets in
the township. For instance, the City of Ekurhuleni has created of a special land use zone with relaxed
building lines increased densities and relaxed building norms and standards to support the
formalisation of backyard rental accommodation. The Gauteng provincial government is working on
additional support with regard to credit guarantees, community facilitation, landlord-tenant conflict
resolution mechanisms, training for landlords and tenants, and enhancing local industry capacities.
In parallel, the Cities Support Programme Township Economic Development programme is working with
the World Bank to study the market potential and pilot projects aimed at creating higher quality
backyard rental accommodation. These government efforts could potentially unlock large scale

178
transformation of the backyard rental sector with significant positive impacts on the township
construction and property development economy. These pilot and research activities can help to clarify
important legal, institutional, infrastructural and financial issues that arise when intervening in the
backyard rental sector. It is important to learn from their experiences and create knowledge sharing
platforms to feed lessons into the policy development process at the city, provincial and national level.
In addition to backyard dwellings, the number of free-standing shacks also seems to be growing. Several
pieces of vacant land are vulnerable to unauthorised land occupations. Informal settlements have grown
around the civic centre and other areas in the township. People are desperate enough to live in
hazardous sites like the Isekelo Settlement that endangers their health and well-being. The situation
reflects the enormous housing demand and backlog in the township and the country at large. The lack
of formal housing delivery has resulted in numerous protests, some of them violent. As some of the
informal occupations take place on land earmarked for infrastructure and housing projects, they
threaten the longer-term development plans for the township. Addressing the challenge will require
tackling the underlying problem of the lack of available land for settlement. There is an opportunity to
redirect occupations via sites and services schemes on suitable sites within and outside of Thembisa. In
addition, existing and future informal settlements on well-located sites could be incrementally upgraded
and vertically densified to free up public spaces, install basic services and connect them to the rest of
the township.
12.6. Housing as economic asset
12.6.1. Backyard rental
As already described above, most homeowners in Thembisa have rented out their space or purpose-
built accommodation in the back- or front-yard. While some of them are rented for free to family or
friends, a growing number is aimed at generating income. According to an architect we met in Thembisa:
“People are investing in properties because of the opportunity to make money. Years back it was the
taxi industry, now it is real estate. Businessmen are shifting their focus into rental accommodation.” A
property developer closed down his liquor business to start property development, focusing on the
higher end market of R3000 rent per month. Today he owns 9 properties and rents 6 properties
including cottages, which he manages for the landlord. He recently spent R 3 million on developing a
double-storey guest house with 11 cottages. Another landlord used all his pension fund money to build
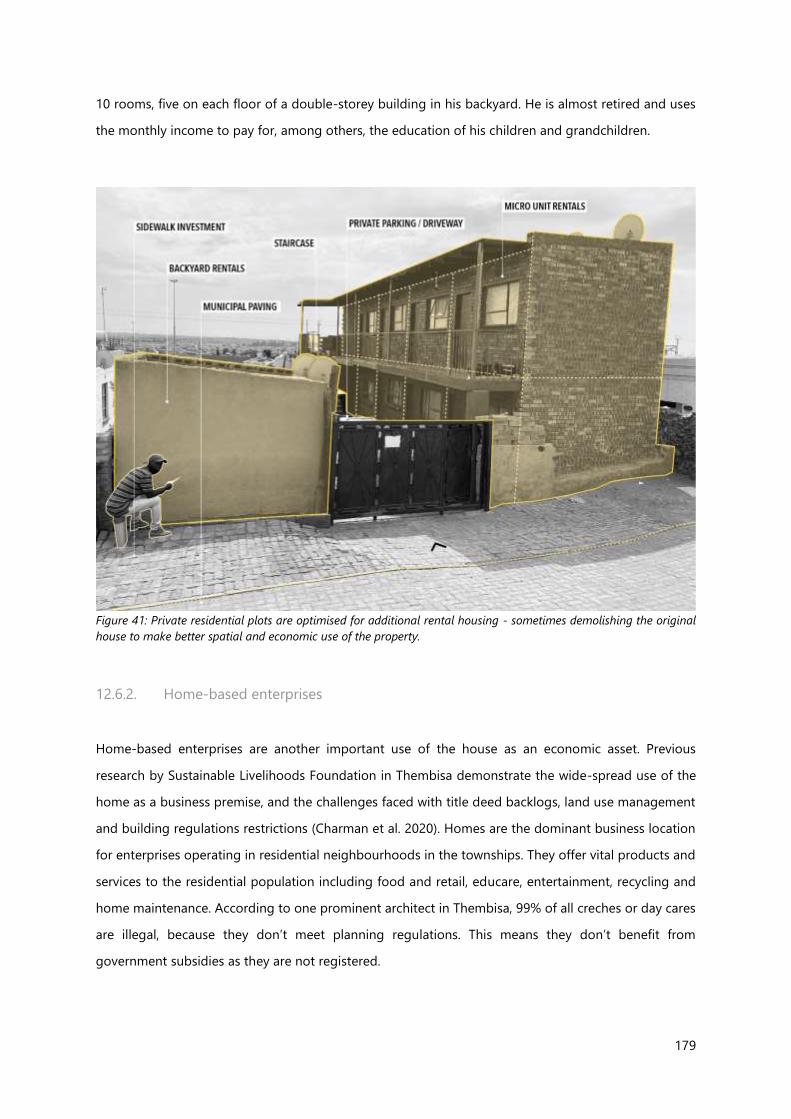
179
10 rooms, five on each floor of a double-storey building in his backyard. He is almost retired and uses
the monthly income to pay for, among others, the education of his children and grandchildren.
Figure 41: Private residential plots are optimised for additional rental housing - sometimes demolishing the original
house to make better spatial and economic use of the property.
12.6.2. Home-based enterprises
Home-based enterprises are another important use of the house as an economic asset. Previous
research by Sustainable Livelihoods Foundation in Thembisa demonstrate the wide-spread use of the
home as a business premise, and the challenges faced with title deed backlogs, land use management
and building regulations restrictions (Charman et al. 2020). Homes are the dominant business location
for enterprises operating in residential neighbourhoods in the townships. They offer vital products and
services to the residential population including food and retail, educare, entertainment, recycling and
home maintenance. According to one prominent architect in Thembisa, 99% of all creches or day cares
are illegal, because they don’t meet planning regulations. This means they don’t benefit from
government subsidies as they are not registered.
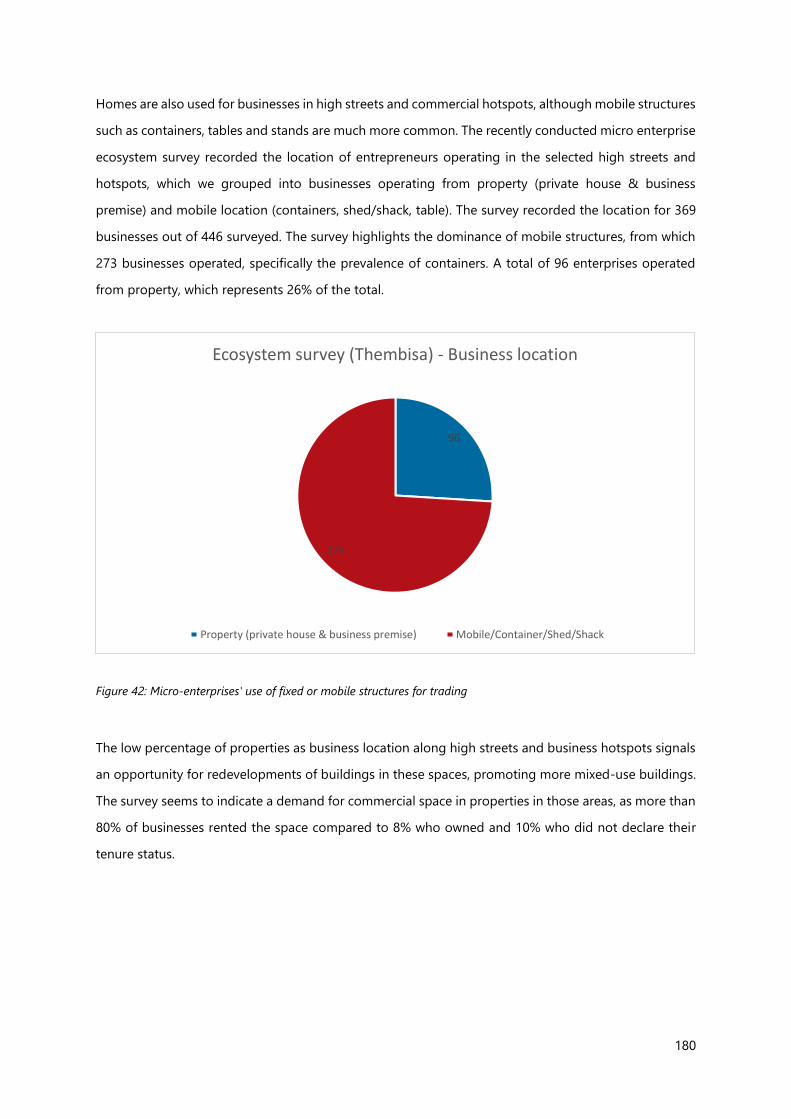
180
Homes are also used for businesses in high streets and commercial hotspots, although mobile structures
such as containers, tables and stands are much more common. The recently conducted micro enterprise
ecosystem survey recorded the location of entrepreneurs operating in the selected high streets and
hotspots, which we grouped into businesses operating from property (private house & business
premise) and mobile location (containers, shed/shack, table). The survey recorded the location for 369
businesses out of 446 surveyed. The survey highlights the dominance of mobile structures, from which
273 businesses operated, specifically the prevalence of containers. A total of 96 enterprises operated
from property, which represents 26% of the total.
Figure 42: Micro-enterprises' use of fixed or mobile structures for trading
The low percentage of properties as business location along high streets and business hotspots signals
an opportunity for redevelopments of buildings in these spaces, promoting more mixed-use buildings.
The survey seems to indicate a demand for commercial space in properties in those areas, as more than
80% of businesses rented the space compared to 8% who owned and 10% who did not declare their
tenure status.
96
273
Ecosystem survey (Thembisa) - Business location
Property (private house & business premise) Mobile/Container/Shed/Shack

181
Figure 43: Tenure status of micro-enterprises
12.7. Housing as financial asset
Thembisa stands out from other township property markets for the relative strength of its property
portfolio. To be sure, Thembisa still represents a lower segment of the housing market in Ekurhuleni but
prices were significantly higher than in other townships and there were clearly wealthier streets and
neighbourhoods within Thembisa. The stronger financial position of the market however did not seem
to translate through to buying and selling of properties – not at least through the deeds register. Access
to formal tenure appears to be a bigger problem in Thembisa than in other townships but it would seem
that most people are reluctant to sell in any case whilst there is a vibrant market for rentals. Our analysis
suggests that many property owners still prefer to trade houses informally, which is difficult to quantify
as many transactions take place under the radar.
78
8
10
Micro enterprises operating from property - Tenure
rent own n/a

182
Map 53: Property Growth Rate, Thembisa

183
Map 54: Average Property Value, Thembisa

184
13. The Transport System
13.1. Transport Infrastructure
The transport infrastructure available in and around the site is discussed in Table 9.
Table 9: Thembisa Transport Infrastructure (based on GIS Map)
Infrastructure Comments
Road network
planning
There is a well-designed road network in Thembisa. The road hierarchy is
clearly demonstrated as well as the formalized nature of the local routes is
evident.
Taxi ranks There are seven taxi ranks available in Tembisa with the one of the most
prominent ranks being Esangweni Taxi Rank.
This taxi rank caters for both local and long distance destinations.
Railway Railway is available but not operational due to vandalism and cable theft. This
affects a large portion of the community that would typically make passenger
trains their preferred mode of transport.
There are planned railways linking to the existing infrastructure. If the current
rail system is reinstated and the future system implemented, rail could result
in being the backbone of the public transport system in Tembisa.
There are three train stations in the study area however they are not
operational due to vandalism and cable theft. The infrastructure at the
stations is in a state of disrepair.
Station infrastructure is available but in state of disrepair.
Bus rapid
transport
It is known that construction of BRT is underway but appears to be on hold.
There is a BRT station that is planned to be situated within the Civic Hub
node.
There are stations and overhead pedestrian bridges that have been built and
the City has indicated that there are sections that are in practical completion.
The buses are operational but are not making use of the dedicated bus lanes
and stations as they are not yet complete.
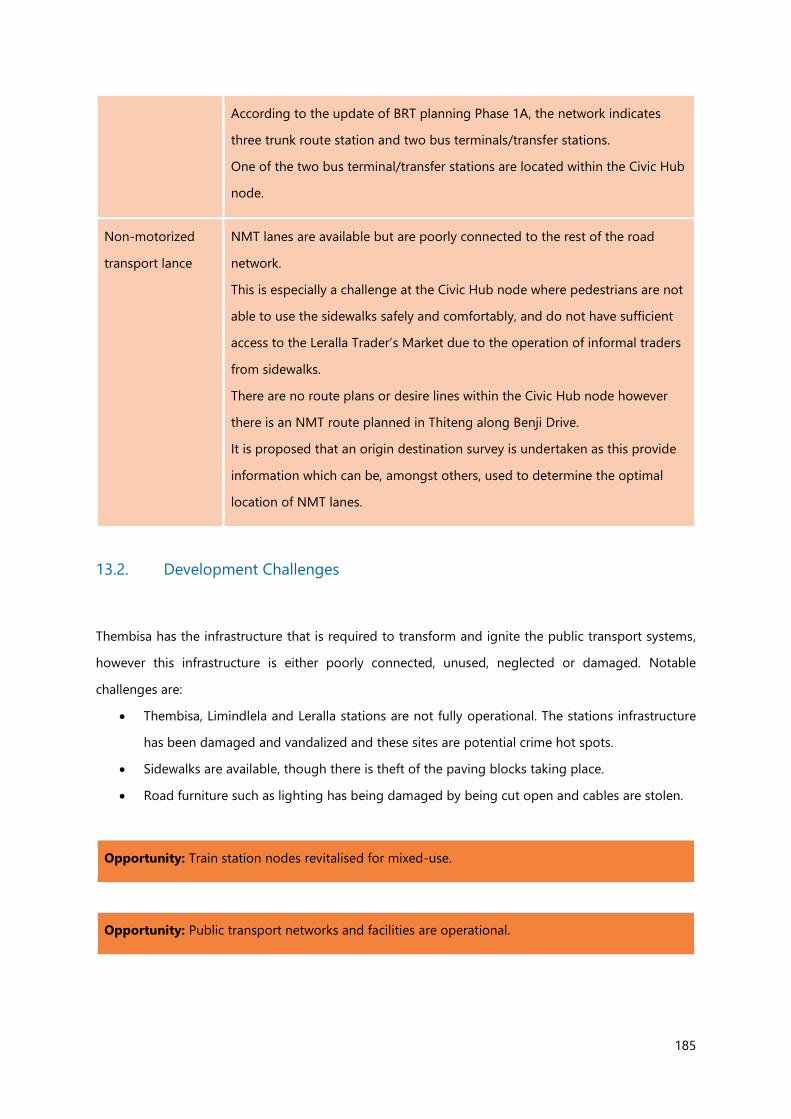
185
According to the update of BRT planning Phase 1A, the network indicates
three trunk route station and two bus terminals/transfer stations.
One of the two bus terminal/transfer stations are located within the Civic Hub
node.
Non-motorized
transport lance
NMT lanes are available but are poorly connected to the rest of the road
network.
This is especially a challenge at the Civic Hub node where pedestrians are not
able to use the sidewalks safely and comfortably, and do not have sufficient
access to the Leralla Trader’s Market due to the operation of informal traders
from sidewalks.
There are no route plans or desire lines within the Civic Hub node however
there is an NMT route planned in Thiteng along Benji Drive.
It is proposed that an origin destination survey is undertaken as this provide
information which can be, amongst others, used to determine the optimal
location of NMT lanes.
13.2. Development Challenges
Thembisa has the infrastructure that is required to transform and ignite the public transport systems,
however this infrastructure is either poorly connected, unused, neglected or damaged. Notable
challenges are:
• Thembisa, Limindlela and Leralla stations are not fully operational. The stations infrastructure
has been damaged and vandalized and these sites are potential crime hot spots.
• Sidewalks are available, though there is theft of the paving blocks taking place.
• Road furniture such as lighting has being damaged by being cut open and cables are stolen.
Opportunity: Train station nodes revitalised for mixed-use.
Opportunity: Public transport networks and facilities are operational.

186
Opportunity: A financially sustainable business model formulated to develop and operationalise taxi
ranks as business hubs.
13.3. Connectivity Between Different Modes
There is potential to achieve good connectivity between different modes of transport, though currently
the integration and connectivity is poor. Thembisa Station and Limindlela Station are spatially
disconnected from areas of high economic activity (retail nodes; malls), with some walking required
when commuters switch between transport modes. It should be noted that the terrain does allow for
relatively easy walking. In addition to the taxi rank available within the site, taxis pick up and drop off
passengers at several points along key main roads. The mini-bus taxi system operates in isolation and
a strategic link between it and the BRT system was not observed. The Leralla station precinct has the
potential of being an intermodal interchange point as there are taxis that stop at that point, the Leralla
station is nearby and there is the construction of the BRT nearby with a pedestrian foot bridge to assist
with accessibility across Andrew Mapheto Drive.
13.4. Transport Options and Services
The table below describes the transport options and services available within the site.
Table 10: Thembisa transport options and services
Transport options and services Comments
Private vehicles A good portion of the community living in Thembisa is of middle income
and many of these residents opt to make use of their private vehicles.
The use of private vehicles results in traffic congestion on the main roads
of Tembisa, particularly Andrew Mapheto road.
NMT Internal movements are high but there is poor NMT infrastructure
available.
Where NMT is available it is poorly integrated with the rest of the road
network plan.
Motorcycles Motorcycles are available as a public transport option but are being used
by businesses to deliver goods to customers.
The use of motorcycles as private transport was not widely observed.

187
E-hailing and e-delivery There are businesses that make use of e-delivery services.
Uber is available in Thembisa although the services are not a popular form
of transport due to the cost of a single trip. Trips are calculated according
to trip distance and time spent in traffic, and the site is densely populated
and often affected by traffic.
Informal taxis Compact Multi-Purpose Vehicles (MPV), such as the Toyota Avanza and
other informal taxi are available in Thembisa. MPV’s are popular and
widely used.
Mini-bus taxis Mini-bus taxis are widely used in Thembisa with options of both local and
long-distance travel available.
There are several taxi routes and feeder roads in Thembisa that enable
commuters to get to their desired destinations.
There is a specific taxi route that goes to Thembisa Hospital with several
stops along it for passengers to be picked up or dropped off.
City buses Although the BRT is still under construction, the Harambe buses are in use
however the routes are limited, lying between Isando and Tembisa
Hospital.
The limited routes potentially do not serve all the people that would opt
for the bus as their preferred mode of transport.
In a 2013 survey conducted by the CoE and presented to the Cities
Support Programme titled “Proposed Public Transport Priority”,
commuters were asked the reason behind the unpopular use of buses as
an alternative, and almost 50% of the responses were regarding the
unavailability of the bus.
Other popular answers were with regards to the preference of mini-bus
taxis because of their flexibility regarding pick-up and drop-off points and
schedules.
Long distance buses Unclear, but long distance mini-bus taxis are available within Thembisa at
the Esangweni taxi rank.
Walkability The topography allows commuters to walk to taxi pick up points easily
within the township.
Tembisa and Limindlela station are both within walking distance of each
other and from taxi routes.
Walkability is negatively impacted by the lack of adequate sidewalks for
pedestrians.
One of the major gaps in the transport system relates to last/first mile connection. Commuters using
public transport are currently reliant on MPV or informal taxis to transport them from their homes to
the taxi ranks / bus stations / train stations. There is an opportunity to foster the expansion of motorcycle
usage, either for last/first mile connections or as an alternative to public transport and private motor
vehicle usage.
188
Opportunity: Motorcycle usage is expanded to provide township residents with more affordable
transport and self-employment opportunities.
13.5. Integrated Public Transport Network
The City has rail as the backbone of its transport plan particularly in the east-west direction. In addition,
the City has identified that the BRT system is to be the main mode of public transport in the north-south
directions. The need for NMT infrastructure is recognised. The IPTNP foresees that 85% of the
population in the City is to be within 1km of a rail or BRT feeder station or stop, all to be implemented
in a phased approach. The proposed intervention highlights the extension of municipal bus services in
areas not planned for BRT and rail intervention. The BEPP notes that the BRT was meant to be fully
operational by 2020, but procurement and conflict with the taxi industry have stalled the complete
opening of this system (2020: 9).
Commuters have the option to access mini-bus taxi services at taxi ranks or along taxi routes where they
pick up and drop of passengers as requested. Mini-bus taxis and the BRT follow the same route and
therefore the possibility of the two modes of transport to share facilities such as shelters could be
investigated to create informal interchange nodes. There are bus stations that are planned for
implementation and some of these stations are located within walking distance to taxi ranks. These
locations are opportunities for the development of intermodal facilities between bus and mini-bus taxi
services. There are overhead foot bridges that can be linked with mini-bus taxi facilities. The linking of
the different modes of public transport with the use of a foot bridge promotes the safety of the
pedestrian and simplifies the change of transport modes. The BRT planning information received from
the City indicates four intermodal facilities and seven train stations planned for implementation along
the BRT route on Andrew Mapheto road.
Although mini-bus taxis are accessible near Tembisa Station and Limindlela Station, the two stations are
spatially disconnected from the community and areas of high economic activity. The mini-bus taxi
system operates in isolation and a strategic link between it and the BRT system was not observed during
the site visit. The City confirmed that there are plans to link Limindlela and Tembisa station to bus stops
that are located approximately 500m from the stations.

189
The node at the Leralla trader’s market has the potential of being developed into a successful intermodal
facility as there are mini-bus taxis that makes stops at the market, the Leralla train station is in close
proximity and the BRT station can potentially connect to the market using a foot bridge.
Opportunity: An integrated public transport system achieved.

190
Map 55: Transport Routes and Facilities

191
13.6. Non-Motorised Transport
Non-motorised transport is gaining popularity in South Africa and worldwide, with a number of factors
contributing, such as increased awareness of environmental issues, recognition that motorised transport
is reducing urban efficiency with increased low-density sprawl, health benefits of active lifestyles, the
ability to bypass traffic congestion, and the lower cost of cycling as transport.
Cyclists are extremely vulnerable to risks, including, the danger of cycling in traffic, risks of mugging
(particularly after dark), inability to cycle, lack of knowledge about bicycle maintenance, cultural norms
that discourage women or other groups from cycling, social norms that present cycling as a “rich
person’s sport” rather than a useful mode of transport, and so on. Therefore, rather than focusing on
trying to change behaviour, it would be best to focus on creating the conditions that give people
reasons to cycle.
It is important to recognise that the benefits of NMT extend well beyond providing a means for low-
cost travel and the other considerations mentioned above. There are other systemic benefits particularly
related to township economies:
• Local deliveries can be more cost-effective using cargo bikes or bicycles with trailers; in many cases
these are more suitable than bakkies or trucks, particularly for small quantities.
• NMT can improve access to public transport for those not close to existing routes.
• Creating new job opportunities in transport sector with low barriers to entry: with the right support
mechanisms (financial, regulatory, legal), entrepreneurs can work independently or collaboratively
in developing and providing new forms of service for the transport of goods and persons, including
the use of improved carts and trolleys.
• Participating in the “sharing economy”: new forms of access to transport such as bike share or cargo
bike share can reduce the costs of transport by eliminating the need for vehicle ownership, which
can be one way to overcome the purchase cost barrier.
• The components of the transport system can be more diverse, distributed and small-scale, creating
greater resilience and adaptability.
• Infrastructure such as roads and other corridors can be built more cheaply where they
accommodate only lightweight NMT vehicles rather than heavier cars and trucks; such corridors are
also more efficient use of space, since a lane for bicycles can carry more people per hour than the
equivalent lane for motor vehicles.

192
These benefits should be considered in creating projects that incorporate NMT, and they can be
maximised by aiming to restructure townships around NMT as a medium- to long-term goal.
Opportunity: Purposeful cart & trolley designs utilised by traders and waste collectors.
13.6.1. NMT Precedents
These precedents focus on initiatives around South Africa that might have the potential to be replicated
in some of the TED sites. However, it must be emphasised that there may be local factors that either
support or undermine similar efforts elsewhere:
• Bicycle couriers - Soweto-based ibhoni delivery and Cloudy Deliveries in Langa (Cape Town) are
township bicycle courier companies.
• Bicycle tours - There are bicycle-based tours run in Soweto (by Book ibhoni, linked to ibhoni
Delivery), Hammanskraal, and in Masphumelele and Langa (Cape Town)
• Langa Bicycle Hub - Emerged from Langa community kitchen support, now provides a bicycle
rental service and is planning to establish a physical bike hub in Langa; also provides escorted
bike buses for commuters, for a fee. Relies on partnerships, donations and other forms of
support.
• Township bicycle sales - Khaltsha Cycles emerged as a business run by someone who previously
ran learn to cycle classes and helped organise bike buses with Open Streets Cape Town; now
sells bikes from a container in Khayelitsha, and promotes cycling with others to raise funds for
bikes for essential workers (Heroes on Bikes)
• Mobile advertising - Ads in Motion provide advertising on a trailer pulled by a bicycle.
• Restaurant food deliveries - Khaltsha Cycles works with Spinach King restaurant in Khayelitsha,
providing bicycle deliveries using bikes pulling trailers, similarly Spinach King has created a
supply chain in partnership with schools – schools grow food, and provide to Spinach King in
exchange for cooked food products.
• Cargo bikes - A company called Anywhere Berlin is establishing ‘micro factories’ in Gauteng
townships where electric cargo bikes are manufactured; designed for rugged township
conditions
• Pedicab services - A company called Mellowcabs has been manufacturing a three-wheeled
‘tricycle’ that originally was a pedal-powered pedicab, and later iterations are electrically
powered, with both passenger and cargo configurations. They have offered passenger services

193
in Stellenbosch and the V&A Waterfront, and they have partnered with DHL who provide
deliveries in central Cape Town using the cargo Mellowvans.
• Mobile bike repair and maintenance - Nomadic Mechanic is run by Khaltsha Cycles in
Khayelitsha. The Langa Bicycle Hub operates “Bike Brigades” that also provide on-call mobile
maintenance services, and who are teaching themselves. There is also a mobile mechanic in
Delft.
In addition to entrepreneurs, civil society has also been involved in support initiatives such as the
following:
• Bike buses - Open Streets Cape Town has been involved in establishing group bike rides for
commuting to the Cape Town CBD, and other loose groupings have established their own bike
buses.
• Delivery of food from community kitchens - During the pandemic lockdown in 2020, Langa CAN
(Community Action Network) organised bicycles to provide deliveries to people who were not
able to get to the community kitchens
• Walking buses - Around 2010 the Western Cape Provincial Government started walking buses
(escorted groups walking on predefined routes on an advertised schedule) in the Cape Town
CBD to make walking safer to and from Cape Town railway station. Some schools have walking
buses managed by parents.
• Cycling clubs - There is a BMX track and club (Velokhaya Life Cycling Academy) in Khayelitsha.
There is also a cycling club with a track in New Brighton.
• Bike distribution and support - Several NGOs have been working in partnership to distribute
bicycles and provide support. Bicycling Empowerment Network (BEN), Pedal Power Association
(PPA) and Qhubeka have worked together on this as well as on independent initiatives to
promote cycling. BEN has been involved in setting up township hubs for bike mechanics. PPA
does safety training.
It is important to ‘normalise NMT’ to encourage adoption. NMT needs to be more visible, culturally
acceptable and safe, with synergies created between projects. This should also convey the message that
NMT can be “mainstream” and worthy of consideration. Design choices reflect a value system, and when
a mode is ignored or deliberately ‘designed out’ of a space, this communicates lack of respect towards
that mode.
Bicycle deliveries are becoming the pioneer users in a number of areas, and while these would work
best with cargo bikes, they typically start with bikes with trailers because of cost, availability and

194
infrastructure. Deliveries also have a revenue stream, with relatively low barrier to entry. It therefore
makes sense to work with delivery services to raise visibility.
In transport sphere, it needs to be acknowledged that “culture” is not static. How we behave on public
streets is always evolving, influenced by the values embedded in the infrastructure design, by the vehicle
technologies that are present, and by the behaviour of others. This affects the travel modes we choose,
as well as our attitudes towards others who use this space. It therefore affects safety and whether users
feel they have a right to be on the streets and needs to be considered in the choice and design of
projects and strategies to create more functional streets.
A number of potential initiatives can help to concentrate activity on specific routes to improve the levels
of ‘safety in numbers’ and also to increase visibility to encourage more cycling. This can also make it
easier for Metros to justify budgeting for NMT infrastructure on those routes, but efforts to boost
numbers should not be seen as an alternative to infrastructure.
13.6.2. NMT Plans
The City has highlighted that there is universal access and other NMT related infrastructure in planning
and construction in Tembisa. It was indicated that there are NMT routes that have been identified as
priority routes to be upgraded along Andrew Mapheto Drive and Reverend R. T. J, Namane Drive. There
are shared bicycle and pedestrian lanes that were completed in 2014 within Tembisa however there are
sections where these lanes terminate and pedestrians and/or cyclists are required to share space with
motor vehicles which is unsafe.
From observations it was noted that there are sidewalks that could enable non-motorised transport
however the theft of paving blocks limits the use of sidewalks. This poses a safety risk to pedestrians
and cyclists as they share space with motorists. The improvement of universal access is required
particularly at intermodal facilities to ensure that all public transport users have access to the services
with reasonable ease and safety.
The NMT infrastructure provided is required to be complete and coherent, safe and easy to use, speed
appropriate, attractive and barrier free. The National Department of Transport’s NMT Facility Guidelines
provides guidance on design considerations to achieve this objective and there is an opportunity to
achieve this goal in Thembisa.

195
Opportunity: A network of NMT and pedestrian lanes developed.
13.6.3. Universal Access
In transportation, the concept of the complete street is a design approach that requires streets to be
planned, designed and operated in a way that ensures the safety, convenience and comfort of users of
all ages and abilities regardless of their mode of transportation. A complete street is consideration of
motorists, pedestrians, cyclists and persons living with disabilities. Figure 44 below, extracted from the
National Department of Transport NMT Facility Guidelines of 2014, displays a typical example of a road
cross section that accommodates all road users, and it is recommended that it be considered in the
non-motorised transport and universal access improvements.
The objective of universal access design is to provide infrastructure and services that cater to the widest
range of users possible3. Streets that are not designed for universal access result in the limitation of
access to opportunities and services, imposing reliance on others to assist with movement and reduced
safety4.
A need to improve NMT and universal access design in Pinetown South has been identified. The
following are some of the advantages of the implementation of NMT infrastructure:
3 National Department of Transport Non-Motorised Transport Facility Guidelines, 2014. 4 Universal Access Policy for the City of Cape Town.

196
• Improved accessibility to opportunities and services,
• Increased safety of road users,
• Reduced road fatalities,
• Increased multi-modal travel,
• Promotion of more energy-efficient and less pollutant modes of transport,
• Greater integration of road users.
Typical infrastructure interventions that could be put in place to improve NMT and universal access in
the township include:
• Formal walkways (sidewalks, off-road paths, safe crossings),
• Dedicated bicycle lanes,
• Traffic calming measures (street humps/bumps/tables),
• Relevant traffic signalling and signage,
• Tactile paving,
• Audio traffic lights,
• Dropped kerbs.
Figure 44: Typical cross-section of a complete street with a walkway/cycle track

197
Figure 45 provides examples of UA interventions, whilst Figure 46 provides details of a complete street
typical road cross section.

198
Figure 45: Examples of non-motorised and universal access infrastructure interventions

199
Figure 46: Typical intersection layout with universal access design
Figure 47: The mobile trading structures allow traders to move to opportunity thereby optimising sales. The design
and functionality of these mobile micro business requires review to ensure economic sustainability as they are currently
existing shopping trolleys.

200
14. Infrastructure
14.1. Overview
Public infrastructure has an important role in Township Economic Development (TED), but each
township has specific (and hence different) infrastructure needs. It is therefore important to examine
the ways that infrastructure facilitates the transport of resources between the wider economy to
townships, and how it distributes resources to households and individuals in specific township sites.
The assessment of current ‘grey’ infrastructure requires three substantive considerations. The first
assesses current gaps or shortfalls at a community and sector level. The second identifies future
supply/demand influences that may hinder the efficient/affordable/sustainable flow of these resources.
The third proposes ways in which traditional infrastructure systems can be enhanced or adapted to build
local resilience, through for example, including more sustainable, innovative, or decentralised systems
(on-site biodigesters, rainfall harvesting, solar PVs etc.).
14.2. Digital Infrastructure
The growth of the digital economy has important business development and operational opportunities
for assisting SMMES to maintain customer relationships, internal operations, competitive edge, and
investment. While there is a current estimation of 410 000 SMEs possessing an online presence
(Department of Telecommunications & Postal Services, 2013) digital activities in townships are
hampered by connectivity challenges and Information Communication and System (ICT) barriers to
entry. Though this accessibility gap may have decreased towards more recent years, there are still many
individuals that are excluded from the utilisation of digital platforms and the digital economy.
Nationally, the Department of Telecommunications and Postal Services has had plans and ideas to boost
the digital economy including 1) Working to removing the fragmentations in the ICT sector, 2)
Improving the Department of Communications, 3) The roll-out of e-skills, 4) Finalising the ICT policy
review (finalised later in 2015). The National Development Plan’s (NDP) Medium-Term Strategic
Framework (MTSF) followed a draft digital readiness or ‘course corrections” initiative to understand the
pathways required for the digital future and 4IR (NPC, 2020). The SADA initiative is also encouraging
and sets out specific imperatives going beyond specific technologies to realising the pathways for digital
job creation.
201
• The WiFi Connectivity National Grant has established 6 WiFi hotspots in Thembisa, namely:
• CCC Rates Hall;
• Thembisa EMPD;
• Thembisa Energy Department;
• Thembisa Fire Station;
• Thembisa Health Care Centre; and
• Thembisa Main Hall
• These WiFi hotspots are based in public service facilities in Thembisa, and are not available in
areas where students and entrepreneurs can access and work (World Bank , n.d.). There are
numerous private suppliers of wi-fi in Thembisa, including thinkwifi, Screamer Telecoms, and
ekeja.
Opportunity: Provision of digital infrastructure to enhance local microenterprise access to
internet, digital services and 4IR opportunities
14.3. Stormwater Infrastructure
Stormwater management infrastructure in Thembisa is in need of upgrades as various challenges have
surfaced due to the poor and deteriorating quality of the infrastructure; the City is struggling to maintain
and replace aging infrastructure. Open stormwater drains have caused damage from eroding
unsurfaced roads in rainy instances to polluting of stormwater. Stormwater pollution in Thembisa also
happens through the onsite storage of solid waste, where E-Coli bacteria levels have been measured at
43 000, while accepted levels are 1000.
The natural water systems in Ekurhuleni are heavily polluted by sewerage run-off and mining. In
addition, as urbanisation has intensified in this area, surface water run-off has increased exponentially.
This makes housing developments, especially those that are informal, in flood zones vulnerable to flood
risks (MSDF, Section B, 2015: 42).

202
Map 56: Stormwater Infrastructure

203
14.4. Water and Sanitation
Residents’ sanitation systems are largely in the form of pit latrines and chemical toilets, although the
chemical toilets are not regularly maintained (they are meant to be serviced twice a week, but this is not
happening). At present, over 5000 families have to use 530 toilets, which suggests a toilet shortage in
the area too.
It has been requested by the communities, that new proposed plastic toilets are not ideal as they pose
health hazards in summer (Ngwenyama, 2019). The area tends to have greywater due to the following
reasons that lead to water pollution: 1) Poor housekeeping and 2) Open stormwater drainage pipes
(Ngwenyama, 2015).
14.5. Sewerage Infrastructure
The area has a waterborne sewerage system, that needs upgrades. The sewers in Thembisa experience
regular blockages and sewerage spills due to being used to dispose of solid waste. At the same time,
raw sewerage also runs into the tributary, running through the site, that feeds into the Kaalspruit River.
The EKH is aware of these issues, which prompted the establishment of the Draft Basic Assessment
Report for the Proposed Update of the Thembisa Extension 25 Bulk Outfall Sewer (Tangoes Consultants,
2020). There is evidence of sewer overflow at manholes, with flow loggings confirming that overflows
are due to insufficient capacity of the sewer, along with aging infrastructure, high sedimentation of sand
and solids, as well as vandalism of existing outfalls (ibid).
14.6. Solid Waste
The refuse removal routes are organised according to municipal wards. Despite refuse removal services
being available, there are also a number of informal and illegal refuse dump sites around Thembisa
(World Bank, n.d.). This situation is the cause of sewerage blockages and sewerage spill episodes as the
sewers are used as one of these informal refuse dump sites. Most of the illegal dumps are found near
schools, creches, churches, clinic, and business complexes. The EKH issued big wheely rubbish bins,
which has assisted in slightly reducing the problem of illegal dumps as families are able to store their
rubbish until collection by the refuse truck.

204
14.7. Energy Provision
Access to electricity is a major challenge, with many illegal power connections, and reduces the
probability of establishing new developments, including in the Makhulong precinct. YES has been
affected by poor energy provision and has become inoperative due to the issue, as they rely on
computers and digital means to upskill and teach youth. There are two existing substations in Thembisa:
1) Kaalfontein at Blue Circle and 2) Rietfontein at the southern corner of Esselen Park. While there is
electricity provision, the informal settlements in Thembisa tend to be illegally connected to the
electricity grid.
15. Environment
15.1. Overview
Where many cities are now mainstreaming ‘green economy’ considerations to address sustainability
challenges, the view that an inclusive green economy should explicitly recognise and integrate the
informal economy is gaining traction. Some provinces are starting to mainstream green economy
strategies, (Götz and Schäffler, 2015), circular economy thinking, and engage in informal economy
upliftment planning (Rogerson, 2016), there has been little crossover or integration of these into
economic development discourses.
The assessment defines those involved, either as direct good/service providers or contributors along
the value chains, as ‘green entrepreneurs’, despite varying levels of activity. It is important to note that
the business intention for the activities identified may not be defined by explicit motivations related to
the green economy. However, the green economy ‘co-benefit’ (sustainability/ecologically enhancing
outcomes) of these activities should be leveraged for additional support from institutions and
programmes where the green economy is a priority.
15.2. Urban Agriculture
There is much scope in Thembisa for urban agriculture, as there are already numerous hydroponic and
aquaponic farming sites, funded and supported by investment companies. Nedbank has been
supporting a local horticulture learnership under the Youth Employment Service (YES) programme in
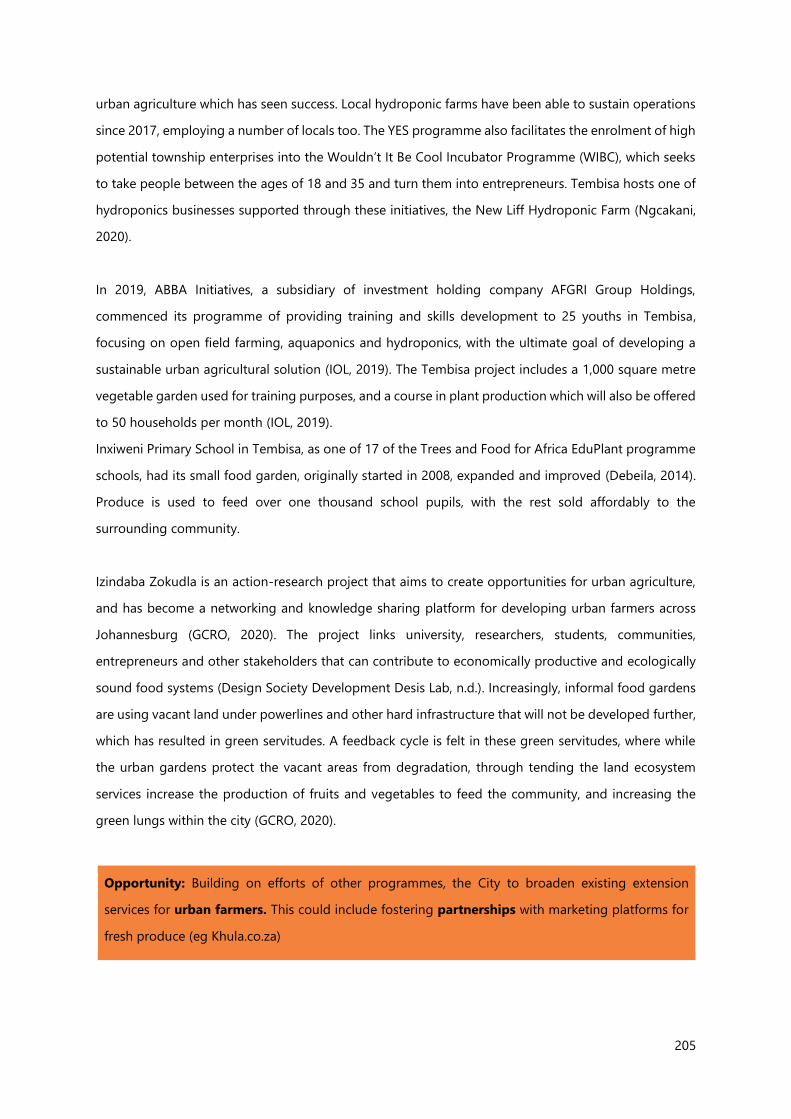
205
urban agriculture which has seen success. Local hydroponic farms have been able to sustain operations
since 2017, employing a number of locals too. The YES programme also facilitates the enrolment of high
potential township enterprises into the Wouldn’t It Be Cool Incubator Programme (WIBC), which seeks
to take people between the ages of 18 and 35 and turn them into entrepreneurs. Tembisa hosts one of
hydroponics businesses supported through these initiatives, the New Liff Hydroponic Farm (Ngcakani,
2020).
In 2019, ABBA Initiatives, a subsidiary of investment holding company AFGRI Group Holdings,
commenced its programme of providing training and skills development to 25 youths in Tembisa,
focusing on open field farming, aquaponics and hydroponics, with the ultimate goal of developing a
sustainable urban agricultural solution (IOL, 2019). The Tembisa project includes a 1,000 square metre
vegetable garden used for training purposes, and a course in plant production which will also be offered
to 50 households per month (IOL, 2019).
Inxiweni Primary School in Tembisa, as one of 17 of the Trees and Food for Africa EduPlant programme
schools, had its small food garden, originally started in 2008, expanded and improved (Debeila, 2014).
Produce is used to feed over one thousand school pupils, with the rest sold affordably to the
surrounding community.
Izindaba Zokudla is an action-research project that aims to create opportunities for urban agriculture,
and has become a networking and knowledge sharing platform for developing urban farmers across
Johannesburg (GCRO, 2020). The project links university, researchers, students, communities,
entrepreneurs and other stakeholders that can contribute to economically productive and ecologically
sound food systems (Design Society Development Desis Lab, n.d.). Increasingly, informal food gardens
are using vacant land under powerlines and other hard infrastructure that will not be developed further,
which has resulted in green servitudes. A feedback cycle is felt in these green servitudes, where while
the urban gardens protect the vacant areas from degradation, through tending the land ecosystem
services increase the production of fruits and vegetables to feed the community, and increasing the
green lungs within the city (GCRO, 2020).
Opportunity: Building on efforts of other programmes, the City to broaden existing extension
services for urban farmers. This could include fostering partnerships with marketing platforms for
fresh produce (eg Khula.co.za)

206
15.3. Green Infrastructure
The City has been investing in open space, namely the Winnie Mandela Square in Tswelopele and the
Ibazelo Park and bridge underpass in Isithame near the civic node (World Bank, 2020). However,
equipment and infrastructure are under-used and vandalism is common. There is also a 5-hole golf
course (Ebuhleni Golf Course) which has an established management and membership structure
(Ngwenyama, 2018). Enterprise development and facility improvement support could be impactful for
this local recreational site.
The green belt along the Hennops River system needs to be preserved to conserve the natural resources
and environments alongside. Due to increased urbanisation in the area, the river has become one of the
most polluted areas in Gauteng (Pillay, 2018). The role of parks, sensitive urban agriculture and
recreation helps to preserve these areas. The Fountain River Environment Sanctuary Hennops (FRESH),
a local NPO, works to promote the creation of river sanctuaries and expanding bigger green-belts along
the river areas to encourage plants and wildlife to thrive along the river banks (ibid).
Figure 48: This leisure facility is park of a larger natural system in Thembisa and a well-used public asset that is well-
suited to be optimised for increased usage and investment.

207
Opportunity: The Thembisa golf course is re-habilitated as a recreational facility, social space and
conserved green belt.
Opportunity: Facilities upgraded and precinct management instituted in public spaces (including
parks).

208
Map 57: Environmental Features

209
15.4. Waste Collection and Recycling
Individuals and various businesses (with the example of Destination Green Recycling) have already
acknowledged the opportunity for employment through the collection and trading of recyclables,
making use of the recycling facility built in 2016 in Tembisa. Recycling is a prominent activity in Tembisa.
Respondents the Youth Development Competition cited and interest in making models out of recycled
material. The private sector is also involved in supporting recycling initiatives (Food Review, 2019).
The IDP states that garden waste, which constitutes more than 60% of the waste collected by the
municipality, presents a window of opportunity for composting, so there is scope for waste diversion
from landfills. SAB has developed a waste recovery programme in Tembisa, east of Johannesburg,
supporting 54 previously unemployed young men and women organised into registered co-operatives
and managing their own waste recycling businesses. Waste collectors participating in the programme
are provided with training on health and safety, business and financial literacy, upcycling and waste
repurposing. In addition, SAB also supports them with assets, such as vehicles and waste processing
equipment, to improve recovery and collection efficiencies.
‘Participants in the Tembisa recycling project have been able to put the infrastructure and training
provided to good use and to help improve their lives. Equally, there is a culture of recycling being
nurtured within the community which has an additional positive impact on everyone,’ says Sifiso
Ngobese of Unconventional Waste, who managed implementation of the project. City of Ekurhuleni
and European Union have also supported the development of the Sethokga Waste Minimisation Facility
operated by three cooperatives with a capital injection of R17-million.
Opportunity: Building on prior and ongoing efforts, the City should facilitate partnerships and
strengthen local cooperatives to enable township recyclers to more effectively obtain and
package waste materials, and to enhance their access to markets.

210
Map 58: Waste and Recycling, Thembisa

211
16. Urban conditions and management
Thembisa was established in 1957, with the intention that it would be a regional township to
accommodate people who had been forcibly removed from Alexandra, Edenvale, Kempton Park,
Midrand and Germiston (Kadozo, 2009: 2).
The site contains a comparatively extensive legacy of social and community infrastructure, including
recreational parks, sport fields, government services, educational facilities, and public transport
infrastructure. As such, Thembisa is a sought-after destination for business and property investors and
new residents.
The urban environment is under-considerable strain. In the course of the field research, the TAT
identified the following urban-management challenges:
• The dumping of domestic and building rubble on public sites, including open land and river
systems. The dumping of babies nappies is a particularly worrying environmental and public
health challenge.
• Inappropriately designed and incomplete walk-ways / thoroughfares without lighting and
security monitoring. The facilities are important in providing spatial connection between
neighbourhoods separated by the two transport systems.
• Removal of street paving.
• Vandalism (or sabotage) of public and transport infrastructure, including street-lights and train
cables.
• Imbazelo Park trader infrastructure has been damaged / vandalised; the park toilets are
vandalised and non-operational, poor management of litter.
• The park equipment in Thami Mnyele Cultural Park has been vandalism / stollen. The
development of the Park is incomplete (pathways and spring protection).
• Throughout the site, cables stollen from street-lights.
• In the main trading precincts, businesses and street traders have encroached onto public spaces,
including the sidewalk.
• Informal business market infrastructure decay. The decay in infrastructure is especially
noticeable at Swazi Inn. The trader infrastructure at Leralla market is in poor condition as well;
the toilets are non-functional, there is merely one tap to serve all the traders; traders have no
storage; and waste including ash is dumped within the site.

212
Figure 49: Poorly defined spaces, open tracts of land, poor community literacy and urban management allows for the
exploitation of public space through littering/dumping and criminality. No enforcement of by-laws (building control
and dumping) results in a harsh environment for public good.
Figure 50: The intensity of street trading puts extreme pressure on the existing sidewalks, often creating hazardous
pedestrian situations due to limited safe access. These spaces require management and better design to harness the
contribution of street traders.
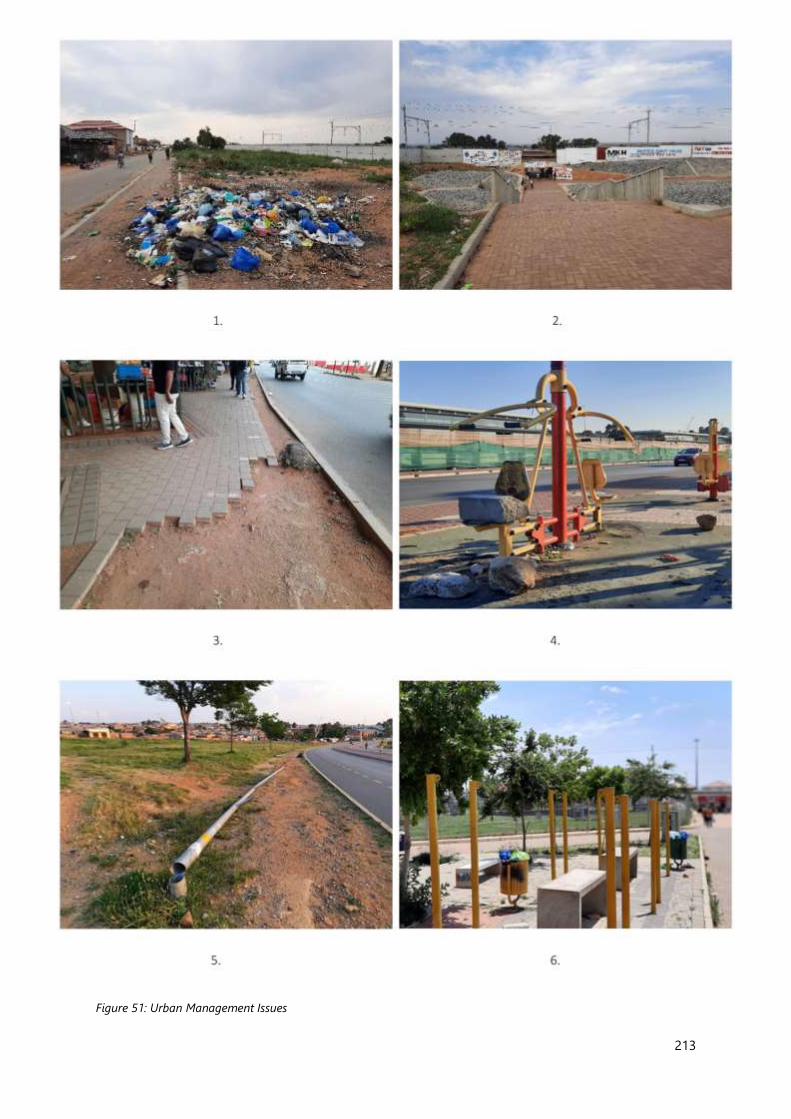
213
Figure 51: Urban Management Issues
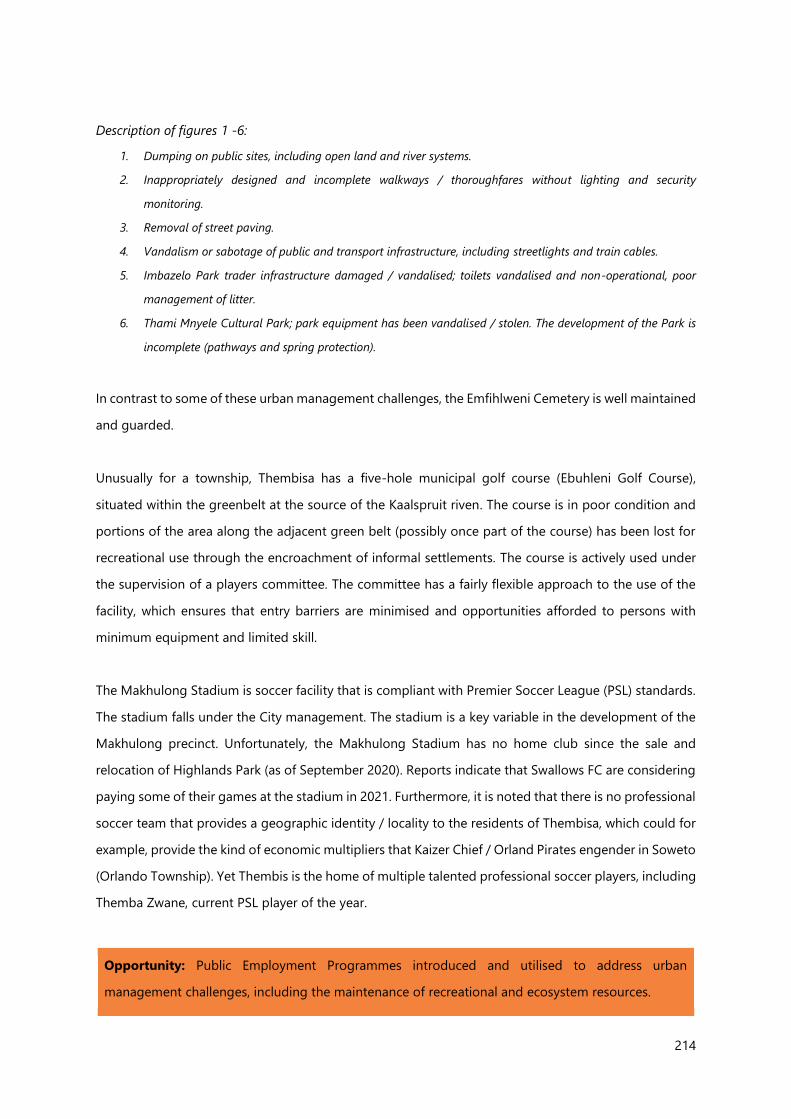
214
Description of figures 1 -6:
1. Dumping on public sites, including open land and river systems.
2. Inappropriately designed and incomplete walkways / thoroughfares without lighting and security
monitoring.
3. Removal of street paving.
4. Vandalism or sabotage of public and transport infrastructure, including streetlights and train cables.
5. Imbazelo Park trader infrastructure damaged / vandalised; toilets vandalised and non-operational, poor
management of litter.
6. Thami Mnyele Cultural Park; park equipment has been vandalised / stolen. The development of the Park is
incomplete (pathways and spring protection).
In contrast to some of these urban management challenges, the Emfihlweni Cemetery is well maintained
and guarded.
Unusually for a township, Thembisa has a five-hole municipal golf course (Ebuhleni Golf Course),
situated within the greenbelt at the source of the Kaalspruit riven. The course is in poor condition and
portions of the area along the adjacent green belt (possibly once part of the course) has been lost for
recreational use through the encroachment of informal settlements. The course is actively used under
the supervision of a players committee. The committee has a fairly flexible approach to the use of the
facility, which ensures that entry barriers are minimised and opportunities afforded to persons with
minimum equipment and limited skill.
The Makhulong Stadium is soccer facility that is compliant with Premier Soccer League (PSL) standards.
The stadium falls under the City management. The stadium is a key variable in the development of the
Makhulong precinct. Unfortunately, the Makhulong Stadium has no home club since the sale and
relocation of Highlands Park (as of September 2020). Reports indicate that Swallows FC are considering
paying some of their games at the stadium in 2021. Furthermore, it is noted that there is no professional
soccer team that provides a geographic identity / locality to the residents of Thembisa, which could for
example, provide the kind of economic multipliers that Kaizer Chief / Orland Pirates engender in Soweto
(Orlando Township). Yet Thembis is the home of multiple talented professional soccer players, including
Themba Zwane, current PSL player of the year.
Opportunity: Public Employment Programmes introduced and utilised to address urban
management challenges, including the maintenance of recreational and ecosystem resources.

215
Opportunity: A precinct management and development plan for Swazi Inn approved.
Opportunity: Facilities upgraded and precinct management instituted in public spaces (including
parks).

216
17. Social and Cultural Considerations
Thembisa is a large-scale, long established township (1957), with predominately formal housing. There
are pockets of informal settlement and hostels. The project core area has largely been formally
developed, apart from sizable informal settlements in Igqagqa and Isekelo neighbourhoods. Both these
areas are closely situated to the civic node and therefore occupy areas with high property development
potential.
The social tensions are reflected in the electoral results of the 2016 elections. Whilst the ANC was the
majority party in all wards, the ANC share of the vote had declined since 2011. The main opposition was
the EFF which acquired between 20-40% of the vote; in contrast, the DA attracted between 5-9%. In
nearly all wards, only about 50% of the voters turn-out to cast their ballot. This would indicate a high
level of voter dissatisfaction with electoral politics.
17.1. Urban Everyday
In our scan of newspaper articles and social media, the following stories and trends received attention.
The review was conducted between May and July, but some of the newspaper articles accessed are from
years preceding 2020.
Several news articles covered the topic of lockdown and changes it has wrought in peoples’ behaviour.
There were significant numbers of Covid-19 cases in Thembisa during the first wave. At an economic
level, local businesses, such as entertainment venues and informal retailers have suffered financial
losses. In the instance of informal retailers, this has been because people have favoured formal retailers
over informal ones over the hard lockdown. Entertainment venues have suffered because people were
unable to gather for socialisation. A number of police crackdowns have been undertaken, with a
particular focus on micro-enterprises selling liquor.
Food prices have also risen significantly during the lockdown period, making food unaffordable to many
households. This price increase, paired with loss of employment, has meant that there has been a drive
to provide people with food parcels. These were distributed by various bodies, such as the Harambee
bus service, actors from the movie Tsosti and various church organisations, among others. Relief grant
recipients were able to access SASSA but ensuring social distancing among people accessing grants has
been challenging. This has led the SASSA office to urge people to apply for grants via the online portal.

217
Various schools across Gauteng were targeted by vandals during the lockdown, some of which were in
Thembisa.
The City initiated a programme to drain and clean chemical toilets more regularly in informal
settlements. Additional water has also been supplied during lockdown, by means of additional water
tanks and water trucks intended to distribute water to different informal settlements.
Thembisa has a rich cultural economy, we have found out about some artists, such as JasperHQ, who is
a local DJ. Thembisa has also hosted various big events such as the “Phomolong Comes Alive” Festival
in 2019. A magazine called RapType also covers the music scene in this area.

218
18. Potential Project Opportunities
Based on the extensive fieldwork evidence and consultation with City specialists, the TAT have identified
a range of potential project interventions. These have been considered in view of the socio-economic,
institutional and spatial situation. In highlighting the below opportunities, the TAT has been guided by
the following variables:
I. Alignment with City / Metro programmes and development priorities,
II. The availability of funding within City / Metro budgets,
III. The identification of project implementing lead departments and units within the City / Metro,
IV. The potential for accessing external funding and partnerships,
V. The role of the TAT in providing technical assistance and adding value to project
implementation,
VI. The potential for projects to have strong economic multipliers and result in a catalytic impact
on development,
VII. The potential for projects to leverage productivity enhancement,
VIII. The potential for projects to strengthen social cohesion and enhance community well-being,
including considerations of safety and security,
IX. The potential of project to contribute towards environmental sustainability and reduce the risks
from climate change,
X. The reach of projects and targeting of specific beneficiaries, including women, youth, informal
micro-enterprises and established SMEs,
XI. The timeframe for project implementation, recognising the need for immediate, short-term and
medium-term projects with varying levels of complexity,
XII. And the potential for projects to be replicable in other township localities.
The scope of potential projects is wide; the proposed opportunities allow for discussion of the merits or
otherwise of each intervention before final selection.
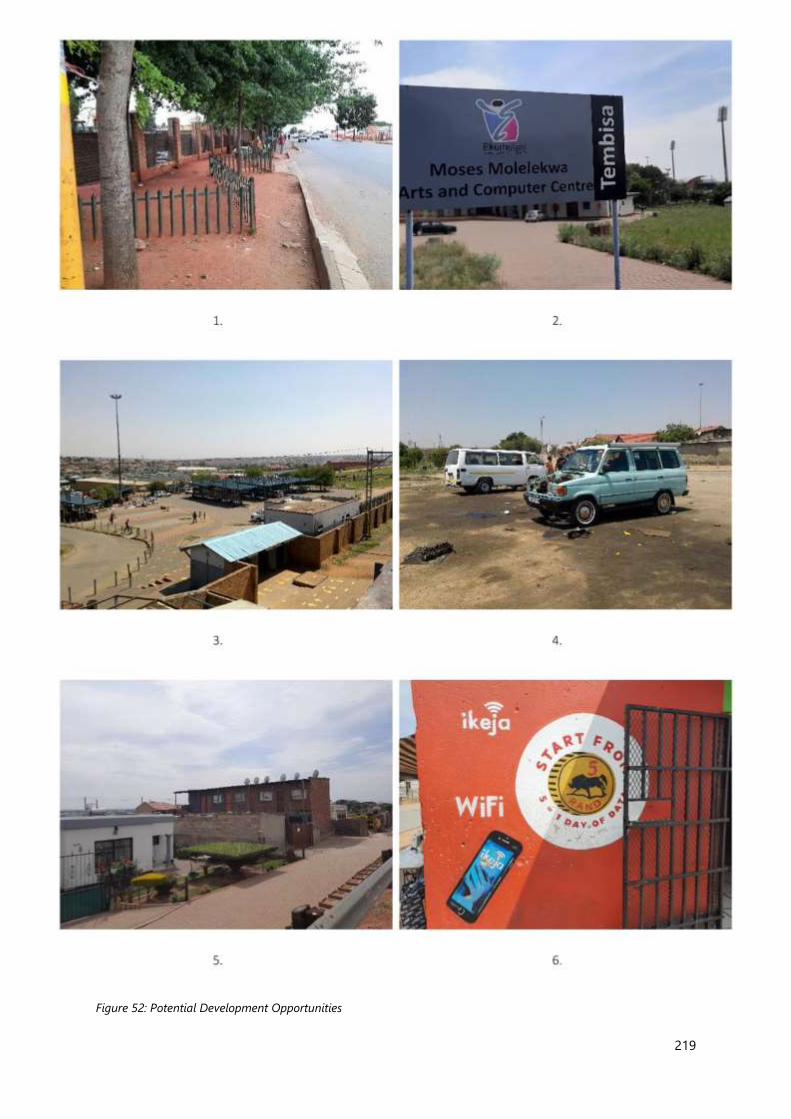
219
Figure 52: Potential Development Opportunities

220
Description of figures 1 – 6:
The Thembisa Civic Hub Precinct is an important social and economic hub at the heart of the site.
The Makhulong Precinct is a sub-precinct in the Thembisa Civic Hub that contains some noteworthy social
and recreational facilities, which can be built upon.
The Leralla precinct is a busy hub in Thembisa, a number of traders operate their businesses from this
space, which is also a secondary node in this area.
An informal car mechanic operated on open ground.
Backyard rental accommodation represents a growing and important sector in Thembisa.
Digital connectivity (Wi-Fi) is provided by means of Ikeja and ThinkZones, which are linked to spaza shops.
The identified opportunities have been categorised within 7 headings: A) Policy and Strategy; B)
Enterprise Development; C) Nodal Development; D) Spatial Integration; E) Housing and Property; F)
Social and Community Infrastructure and G) Urban Management. The range of identified opportunities
within these categories are:
Table 11: Opportunities identified for Thembisa
18.1. Policy and Strategy
Opportunity Notes
Home based businesses formalised, enabling
growth and reducing business externalities.
The City to revise and develop policies on enterprise
formalisation (in respect to food retailing businesses and
home-based businesses), with reference to Gauteng
Prov. Gov. and National policies, supporting business
owners to meet compliance.
Revenue collection from rates improved. The City to develop a strategy and plan to generate rates
revenue from commercial businesses, including home-
based enterprises and businesses operating in retail
nodes.
Commercial high streets activated in strategic
sites / roads.
The City to identify sites with high potential for
commercial development and implement measures to
stimulate investment, including land-use, parking and
infrastructure.
Shopping malls foster and enable opportunities
for micro-enterprises.
The City to engage shopping mall owners to agree on
strategies to integrate micro-enterprises into the mall
precinct, through adherence to development planning
agreements and proactive measures to support micro-
enterprises.

221
TED evidence utilised in area-base strategic plans. The City to incorporate the evidence from the TED
situation analysis into strategic plans, including the IDP,
SDF, and BEPP.
Regulated business sectors are formalised and
able to access state-subsidies / industry
programmes.
The City to facilitate transversal engagement and co-
operation with the Gauteng Prov. Govt and National
Government to address constrains on ECDC, taverns /
restaurants, undertakers and other regulated sectors
from attaining compliance with business licencing.
18.2. Enterprise Development
Opportunity Notes
Opportunities in the creative and leisure
economies provide youth a pathway to transition
into jobs and livelihoods.
The City to conceptualise a strategy to promote creative
activities focusing on youth interests, including hobbies,
via social enterprises and community based
programmes, use of City facilities, the staging of events,
and linkages to BDS services.
Micro-enterprises have improved access to
business development support services.
The City to promote the DSBD district information
management system as part of its enterprise
development support services, facilitating partnerships
between the City and BDS providers (including SEDA
/SEFA) to benefit Thembisa businesses.
Street signage / advertising extensively utilised to
promote local businesses.
The City to develop and implement, via partnerships, a
project to provide street signage / advertising boards to
promote local enterprises.
Mechanics / panel beaters and associated
businesses in the after-sales automotive sector
have access to business development support
services to grow and professionalise.
The City to facilitate partnership with private sector
companies, the Gauteng Prov. Gov. and the DSBD to
provide equipment / skills training / supply agreements /
finance to township entrepreneurs.
Micro-enterprises have improved access to digital
services to participate in the digital economy &
4IR technologies.
The City to facilitate partnerships, including SEDA and
Gauteng Prov. Gov., to improve digital access in
Thembisa, through (inter alia) digital hubs, free wi-fi,
broadband roll-out and the promotion of marketing
Apps.
An annual trade marketing event to be held in
Thembisa to link the community producers and
marketeers to business opportunities.
The City to conceptualise and facilitate a trade
promotion event in Thembisa to stimulate opportunities
for direct marketing, supplier agreements and digital
services. The event will aim to connect home based
traders & producers to companies / markets.

222
The income and productivity of township recyclers
improved.
The City to facilitating partnerships and strengthen
cooperates to enable township waste recyclers to more
effectively obtain and package waste material and
improve access to markets.
Urban agriculture productivity enhanced. The City to broaden extension services for urban
producers and foster partnership with marketing
platforms (including digital platforms such as Khula -
https://khula.co.za/) and outlets.
Businesses have greater financial literacy and have
access to services and technologies, including
digital platforms.
The City to facilitate partnerships, including Gauteng
Prov. Gov. & Finmark Trust, to provide businesses with
financial literacy training and improve access to services
and technologies.
18.3. Nodal Development
Opportunity Notes
A precinct management plan instituted and
upgrades completed for Leralla trader market.
The City to conceptualise and implement a plan with
projects for the revitalisation of the Leralla trader market
and institutionalisation of a precinct management.
Thembisa civic hub transformed into a business
and service hub.
The City, in partnership with the NDPP and private
investors, to advance projects and mobilise investment
into the Thembisa hub precinct.
A street trader plan implemented within the
Thembisa civic node.
The City to plan and implementing a street trader plan
within the civic hub, identifying and implementing
projects to improve the trading environment.
A financially sustainable business model
formulated to develop and operationalise taxi
ranks as business hubs.
The City, in partnership with the Gauteng Prov. Gov. and
taxi associations, to conceptualise a PPP business model
to develop the Esangweni Taxi Rank.
A precinct management and development plan
for Swazi Inn approved.
In partnership with the City of Johannesburg, the City to
undertake a study to propose a precinct management
approach and projects for Swazi Inn to enhance
opportunities for business, reduce urban management
challenges and improve safety and security.

223
18.4. Spatial Integration
Opportunity Notes
Train station nodes revitalised for mixed-use. The City to identify opportunities for revitalising the
station nodes (Tembisa, Limindlela, and Leralla) and
conceptualise a development strategy.
A network of NMT and pedestrian lanes
developed.
The City to conceptualise and implement projects to
build a network of NMT lanes / routes, prioritising
linkages to the civic hub.
An integrated public transport system achieved. The City to develop a strategy and partnerships,
including the Gauteng Prov. Gov., to improve integration
between minibus taxis, train, BRT and bus systems,
including the introduction of a single payment system.
Public transport networks and facilities are
operational.
The City to execute planned projects, including BRT
stations (including civic hub) and road upgrades. The City
to engage National Government and PRASA to fast-track
repairs to the railway line.
Motorcycle usage is expanded to provide
township residents with more affordable transport
and self-employment opportunities.
The City partners with private sector to increase access to
motorcycle transport, through training schemes,
marketing campaigns and working with local champions.
Infrastructure developed to provide and enable
universal access to public transport.
The City to embrace and implement designs for universal
access to ensure that people living with disabilities /
mobility requirements have access to public transport
infrastructure.
Purposeful cart & trolley designs utilised by
traders and waste collectors.
The City to facilitate a design studio, with participation of
technical training colleagues, traders and artisans, to
design, develop and manufacture protypes of
appropriate trollies to enhance access to markets.
18.5. Housing and Property
Opportunity Notes
Encourage private/household investment in
backyard rental housing units and support a
gradual process of upgrading and formalisation.
The City will develop an enabling framework, simplified
regulations and active support mechanisms to upgrade
and formalize backyard rental housing units, advancing a
precinct-based approach.
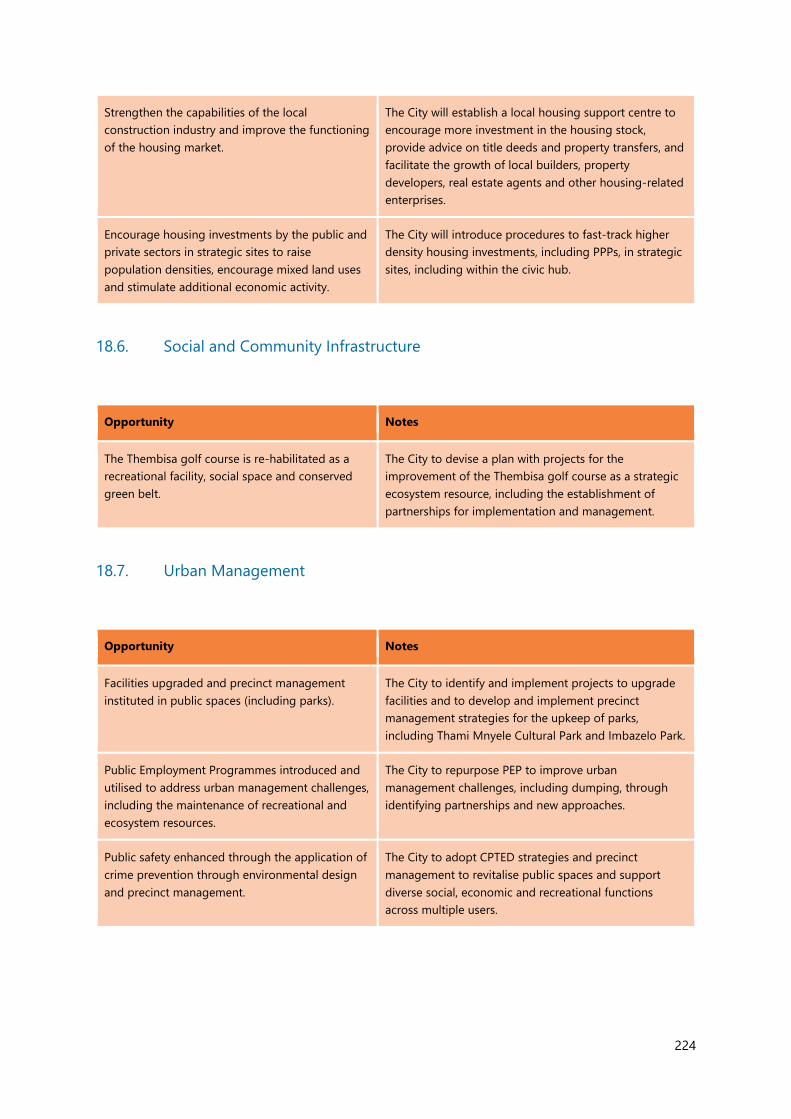
224
Strengthen the capabilities of the local
construction industry and improve the functioning
of the housing market.
The City will establish a local housing support centre to
encourage more investment in the housing stock,
provide advice on title deeds and property transfers, and
facilitate the growth of local builders, property
developers, real estate agents and other housing-related
enterprises.
Encourage housing investments by the public and
private sectors in strategic sites to raise
population densities, encourage mixed land uses
and stimulate additional economic activity.
The City will introduce procedures to fast-track higher
density housing investments, including PPPs, in strategic
sites, including within the civic hub.
18.6. Social and Community Infrastructure
Opportunity Notes
The Thembisa golf course is re-habilitated as a
recreational facility, social space and conserved
green belt.
The City to devise a plan with projects for the
improvement of the Thembisa golf course as a strategic
ecosystem resource, including the establishment of
partnerships for implementation and management.
18.7. Urban Management
Opportunity Notes
Facilities upgraded and precinct management
instituted in public spaces (including parks).
The City to identify and implement projects to upgrade
facilities and to develop and implement precinct
management strategies for the upkeep of parks,
including Thami Mnyele Cultural Park and Imbazelo Park.
Public Employment Programmes introduced and
utilised to address urban management challenges,
including the maintenance of recreational and
ecosystem resources.
The City to repurpose PEP to improve urban
management challenges, including dumping, through
identifying partnerships and new approaches.
Public safety enhanced through the application of
crime prevention through environmental design
and precinct management.
The City to adopt CPTED strategies and precinct
management to revitalise public spaces and support
diverse social, economic and recreational functions
across multiple users.

225
19. Next Steps
In the Second Phase of the TED Project, the TAT will support the CoE to conduct an evaluation of the
merits of the identified opportunities. This process will require high-level transversal engagement with
all affected line departments and units. An evaluation matrix tool will be utilised to record the outcome
of this engagement process. The results of the evaluation will guide the project steering team to re-
assess the identified opportunities to be incorporated in the TAT supported township economy
development strategy for Thembisa.
The section of the 8 projects will be determined in consideration of the following criteria AND weighting
(minimum number of projects) to ensure that the range of project interventions address economic,
socio-spatial and institutional change. The TAT will provide a high-level indication of the ‘value-add’
from technical assistance in respect to the selection of projects to address the over-riding basket of
project interventions.
Table 12: Criteria for selecting the eight projects
Criteria
Min
imu
m
# o
f P
roje
cts
aligns with identified City programme and project priorities. 4
can be funded by the City. 4
has an identified lead department / unit for implementation. 4
can unlock new partnerships via the CSP and non-state actors. 2
will benefit from CSP technical assistance. 4
can enhance productivity and stimulate economic multipliers. 4
will benefit emerging entrepreneurs and marginalised groups. 4
will enhance social cohesion, improve safety, and contribute to environmental sustainability. 1

226
will strengthen spatial integration. 1
will enhance the availability of decent housing and accommodation. 2
will enable immediate wins (within a 24-month timeframe). 4
will improve the township business environment and ecosystem services. 2
is replicable in other townships. 4
The TAT support may include:
• Partnership facilitation,
• Strategic and policy advice,
• Project conceptualisation and design,
• Business case development,
• Research support and knowledge sharing,
• Project monitoring & evaluation and impact assessment,
• Project submission within City and NT budgeting process,
• Project spatial and architectural design.
• Quick-win implementation.
• Support in the preparation of calls for proposals or tenders.
At the conclusion of the assessment process, and agreement on the ranking and weighting of the
identified opportunities, the TAT will then support the CoE advance 8 projects within the framework of
an overarching township development strategy.
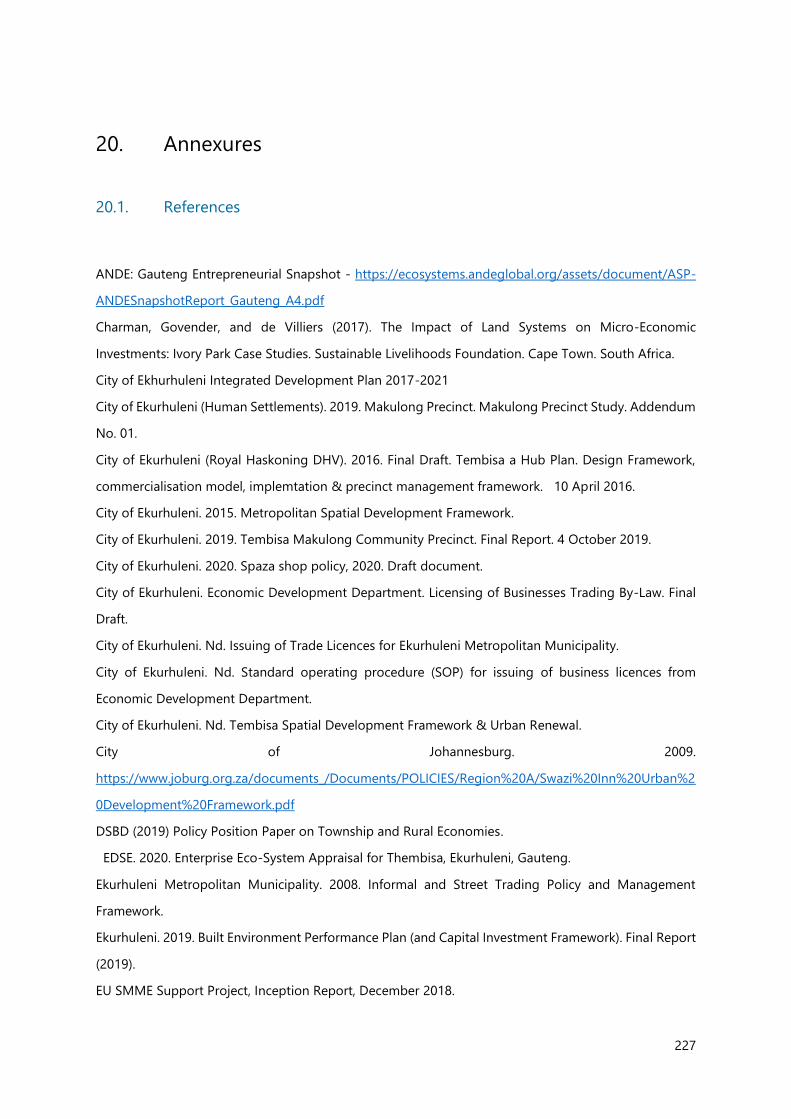
227
20. Annexures
20.1. References
ANDE: Gauteng Entrepreneurial Snapshot - https://ecosystems.andeglobal.org/assets/document/ASP-
ANDESnapshotReport_Gauteng_A4.pdf
Charman, Govender, and de Villiers (2017). The Impact of Land Systems on Micro-Economic
Investments: Ivory Park Case Studies. Sustainable Livelihoods Foundation. Cape Town. South Africa.
City of Ekhurhuleni Integrated Development Plan 2017-2021
City of Ekurhuleni (Human Settlements). 2019. Makulong Precinct. Makulong Precinct Study. Addendum
No. 01.
City of Ekurhuleni (Royal Haskoning DHV). 2016. Final Draft. Tembisa a Hub Plan. Design Framework,
commercialisation model, implemtation & precinct management framework. 10 April 2016.
City of Ekurhuleni. 2015. Metropolitan Spatial Development Framework.
City of Ekurhuleni. 2019. Tembisa Makulong Community Precinct. Final Report. 4 October 2019.
City of Ekurhuleni. 2020. Spaza shop policy, 2020. Draft document.
City of Ekurhuleni. Economic Development Department. Licensing of Businesses Trading By-Law. Final
Draft.
City of Ekurhuleni. Nd. Issuing of Trade Licences for Ekurhuleni Metropolitan Municipality.
City of Ekurhuleni. Nd. Standard operating procedure (SOP) for issuing of business licences from
Economic Development Department.
City of Ekurhuleni. Nd. Tembisa Spatial Development Framework & Urban Renewal.
City of Johannesburg. 2009.
https://www.joburg.org.za/documents_/Documents/POLICIES/Region%20A/Swazi%20Inn%20Urban%2
0Development%20Framework.pdf
DSBD (2019) Policy Position Paper on Township and Rural Economies.
EDSE. 2020. Enterprise Eco-System Appraisal for Thembisa, Ekurhuleni, Gauteng.
Ekurhuleni Metropolitan Municipality. 2008. Informal and Street Trading Policy and Management
Framework.
Ekurhuleni. 2019. Built Environment Performance Plan (and Capital Investment Framework). Final Report
(2019).
EU SMME Support Project, Inception Report, December 2018.
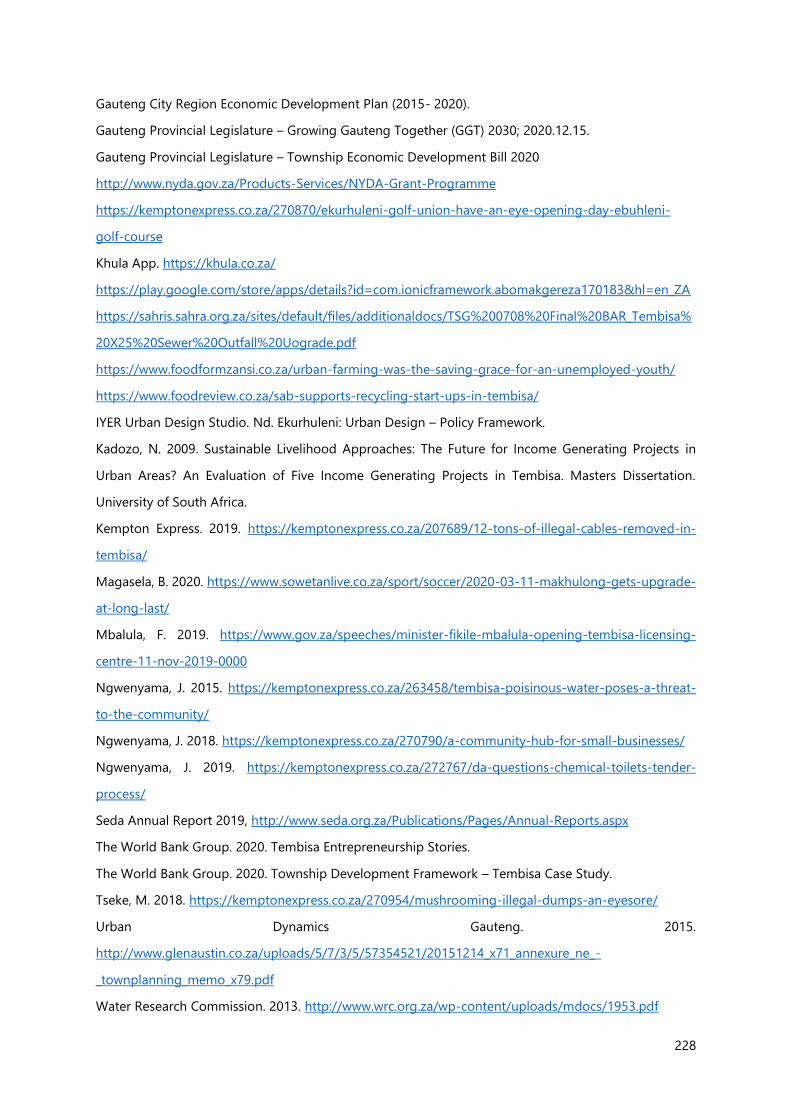
228
Gauteng City Region Economic Development Plan (2015- 2020).
Gauteng Provincial Legislature – Growing Gauteng Together (GGT) 2030; 2020.12.15.
Gauteng Provincial Legislature – Township Economic Development Bill 2020
http://www.nyda.gov.za/Products-Services/NYDA-Grant-Programme
https://kemptonexpress.co.za/270870/ekurhuleni-golf-union-have-an-eye-opening-day-ebuhleni-
golf-course
Khula App. https://khula.co.za/
https://play.google.com/store/apps/details?id=com.ionicframework.abomakgereza170183&hl=en_ZA
https://sahris.sahra.org.za/sites/default/files/additionaldocs/TSG%200708%20Final%20BAR_Tembisa%
20X25%20Sewer%20Outfall%20Uograde.pdf
https://www.foodformzansi.co.za/urban-farming-was-the-saving-grace-for-an-unemployed-youth/
https://www.foodreview.co.za/sab-supports-recycling-start-ups-in-tembisa/
IYER Urban Design Studio. Nd. Ekurhuleni: Urban Design – Policy Framework.
Kadozo, N. 2009. Sustainable Livelihood Approaches: The Future for Income Generating Projects in
Urban Areas? An Evaluation of Five Income Generating Projects in Tembisa. Masters Dissertation.
University of South Africa.
Kempton Express. 2019. https://kemptonexpress.co.za/207689/12-tons-of-illegal-cables-removed-in-
tembisa/
Magasela, B. 2020. https://www.sowetanlive.co.za/sport/soccer/2020-03-11-makhulong-gets-upgrade-
at-long-last/
Mbalula, F. 2019. https://www.gov.za/speeches/minister-fikile-mbalula-opening-tembisa-licensing-
centre-11-nov-2019-0000
Ngwenyama, J. 2015. https://kemptonexpress.co.za/263458/tembisa-poisinous-water-poses-a-threat-
to-the-community/
Ngwenyama, J. 2018. https://kemptonexpress.co.za/270790/a-community-hub-for-small-businesses/
Ngwenyama, J. 2019. https://kemptonexpress.co.za/272767/da-questions-chemical-toilets-tender-
process/
Seda Annual Report 2019, http://www.seda.org.za/Publications/Pages/Annual-Reports.aspx
The World Bank Group. 2020. Tembisa Entrepreneurship Stories.
The World Bank Group. 2020. Township Development Framework – Tembisa Case Study.
Tseke, M. 2018. https://kemptonexpress.co.za/270954/mushrooming-illegal-dumps-an-eyesore/
Urban Dynamics Gauteng. 2015.
http://www.glenaustin.co.za/uploads/5/7/3/5/57354521/20151214_x71_annexure_ne_-
_townplanning_memo_x79.pdf
Water Research Commission. 2013. http://www.wrc.org.za/wp-content/uploads/mdocs/1953.pdf

229
20.2. Persons Consulted
Surname Name Unit / Department
Appel Craig DSBD
Bekker Martin CoE, Metropolitan Spatial Planning Division, City
Planning Department
Chauke Caiphus CoE, HOD, Economic Development Department
De Beer Madelein CoE, Roads and Stormwater Department
Garane Sthembiso CoE, Community Enterprise Development
Govender Neville CoE, Economic Development
Hadebe Maggy CoE, Metropolitan Spatial Planning Division, City
Planning Department
Hiliza Godfrey CoE, Housing Department
Hlatshwayo Simphiwe CoE, Economic Infrastructure, Job Creation and Skills
Development
Ismail-Saville Tashmia Youth Employment Service, CEO
Jamile Ndimphiwe NT, NDPP
Koseff Jak SA Presidency Unit and GPG
Kruger Werner Indlu Housing
Leponesa Mphepelo Mabesa Waste Management Department, CoE
Lesole Isaac Buddibox CEO
MacCarron Gerard CoE, Metropolitan Spatial Planning Division, City
Planning Department
Makhanya Pamela Sports, Recreation, Arts & Culture
Maharaj Kosheek AIDC
Mashela Thabo Youth Employment Service, Hub Manager
Maqetuka Seth CSP Housing Advisor
Mokhethi Charlotta CoE, Housing Department

230
Mbangxa Sisa African Panel beaters and Motor Mechanics
Association
Mnguni Moses Tembisa Chamber of Commerce and Industry
Mokemane Palesa CoE, Energy Department
Mtshali Thabi DSBD
Mokoena Baleseng Human Settlements Department, CoE
Nche Mpho CoE, Divisional Head Community Enterprise
Development
Ndaba Musa CoE, Housing Department
Ninham Eugenie NT, NDPP
Prinsloo Henry CoE, Economic Development Department
Sekele Collins CoE, NDPP
Simelane Busi CoE, Sports, Recreation, Arts & Culture
Sitshaluza Andile CoE, Metropolitan Spatial Planning Division, City
Planning Department
Swart Hannelie CoE, Sports, Recreation, Arts and Culture
Tjia Dinao CoE, Human Settlements Department
Tsoka Kgaugelo The Innovation Hub, Area Innovation Manager
Umlaw Stephen DSBD
Viljoen Philip CoE, Geo Informatic Systems Services
Zulu Wiseman CoE, Water and Sanitation Department
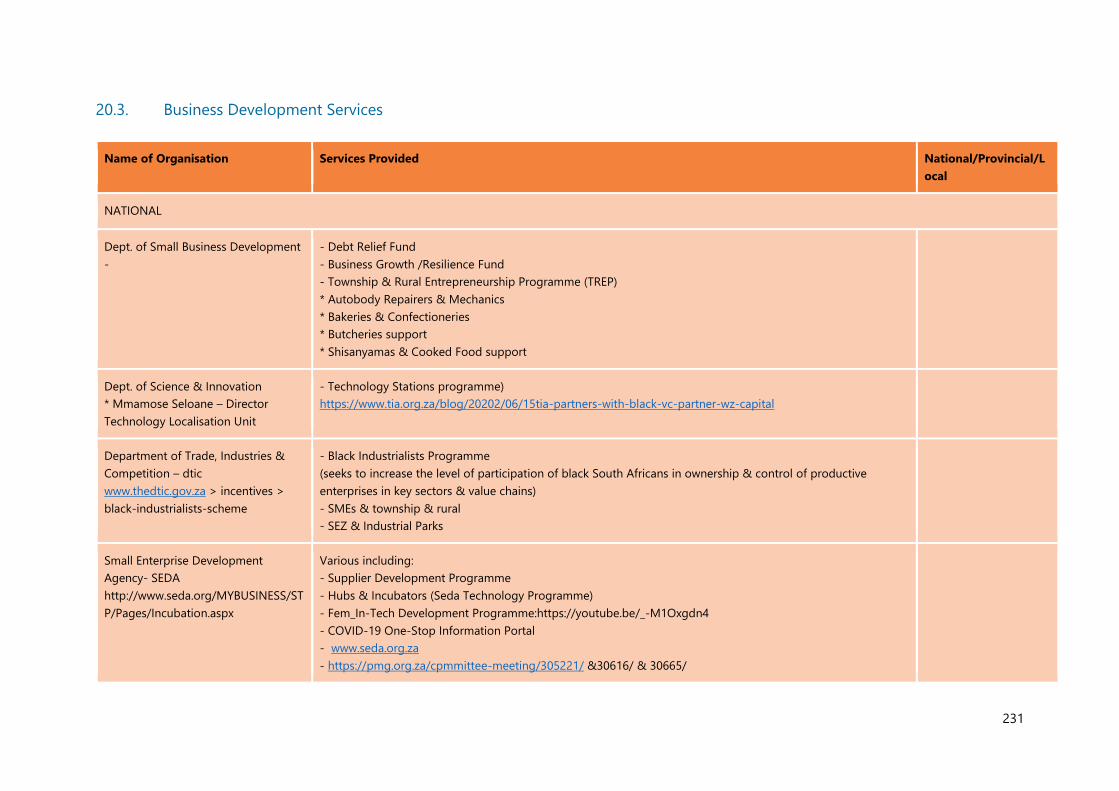
231
20.3. Business Development Services
Name of Organisation Services Provided National/Provincial/L
ocal
NATIONAL
Dept. of Small Business Development
-
- Debt Relief Fund
- Business Growth /Resilience Fund
- Township & Rural Entrepreneurship Programme (TREP)
* Autobody Repairers & Mechanics
* Bakeries & Confectioneries
* Butcheries support
* Shisanyamas & Cooked Food support
Dept. of Science & Innovation
* Mmamose Seloane – Director
Technology Localisation Unit
- Technology Stations programme)
https://www.tia.org.za/blog/20202/06/15tia-partners-with-black-vc-partner-wz-capital
Department of Trade, Industries &
Competition – dtic
www.thedtic.gov.za > incentives >
black-industrialists-scheme
- Black Industrialists Programme
(seeks to increase the level of participation of black South Africans in ownership & control of productive
enterprises in key sectors & value chains)
- SMEs & township & rural
- SEZ & Industrial Parks
Small Enterprise Development
Agency- SEDA
http://www.seda.org/MYBUSINESS/ST
P/Pages/Incubation.aspx
Various including:
- Supplier Development Programme
- Hubs & Incubators (Seda Technology Programme)
- Fem_In-Tech Development Programme:https://youtube.be/_-M1Oxgdn4
- COVID-19 One-Stop Information Portal
- www.seda.org.za
- https://pmg.org.za/cpmmittee-meeting/305221/ &30616/ & 30665/

232
- South African Furniture Industry – SAFI
- District Development Model – https://www.cogta.gov.za/ddm/
SEDA Automotive Technology Centre
http://www.satec.co.za/
National Youth Development Agency
– NYDA
http://www.nyda.gov.za/
Youth Development Agency
- Various youth-focused services both financial and non-financial
- Youth Micro Enterprise Relief Fund (YMERF)
National and Provincial

233
Little Fish – www.itweb
https://www.itweb.co.za/content/Rg
eVDqPYGegvKJN3
Platform for 600 SMMEs two-way communication consumes & businesses, geo-location services
connecting consumers to SMMEs in their vicinity & in-app stock orders. Also provides access to
finance through its alternative credit scoring
PILLAR 5 GROUP
Address: Baruch Regent House (3rd
Floor), Cnr Voortrekker &, Durban Rd,
Bellville, 7530
Phone: 074 932 4911
Business development service
The PILLAR 5 GROUP is a leading Business Development Group with a strong focus on entrepreneurial
support. Our aim is to deliver superior strategic content and provide brand support to aspiring entrepreneurs
and young innovators seeking to expand into international markets and rise to the top echelons of their
respective industries.
Fetola
www.fetola.co.za
https://fetola.co.za/mentor-hotline/
Tailor-made enterprise & supplier development programmes
- Mentorship
- Business Incubation
- Reputation & brand building
- Youth, Women & People with disabilities enterprises
- Green/Sustainable sector, food security, & farming, local manufacturing & technology
- National
- Cape Town
The Awethu Project
www.awethuprojects.co.za
The Awethu Project Launch Pad Incubator aims to grow businesses focusing on micro businesses throughout
South Africa
National
Red Bull Amaphiko Academy
www.redbull.com
- A launch pad for start-up social entrepreneurs
- 10 day of connection & collaboration with leading innovators, entrepreneurs & storytellers
- One-on-one mentor who will assist you to develop business, personal & strategic development plans that
will take 18 months
BizQube
www.abbc.co.za/index.php/incubator
- Offers accredited business training
- Customised mentoring
- Enterprise supplier development opportunities in food, beverage, cosmetic & pharmaceutical
manufacturing
Smorgasbord
https://smorgasbord.co.za/
An organisation dedicated to supporting & incubating food start-ups
(food & beverage related)
Focus on building & sustaining food & beverage sector in South Africa

234
- Invest in & create market opportunities for early stage food od business
Raizcorp
htttps://raizcorp.com
Works with entrepreneurs at stages of their life cycle
- Incubation services
Business acceleration for entrepreneurs
- Execute enterprise & Supplier development on behalf of corporates
The Thomson Reuters Labs
https://innovation.thomsonreuters.com/
labs/labs/incubator.html
The incubator is a 6 - 12 month programme
Diverse group of mentors
Free office space
Access to data & tools
Customers Networks Investor circle
Focussing on:
RegTech
LegalTech
Taxtech
Newstech amongst other things provides affordable business opportunities & workshop to empower
entrepreneurs
Practical workshops including manufacturing
Cape Town
The Furniture Technology Centre Trust –
Furntech
furntech.org.za
Support to existing & start-up businesses providing incubation to entrepreneurs with skills in the furniture
manufacturing industry
Cape Town
Johannesburg
French Tech
capetown.lafrenchtech.com
A global incubator that aims to connect entrepreneurs from France & South Africa & also find funding for
these start-ups in Africa
The Cape Innovation & Technology
Initiative
www.citi.org.za
The incubator offers several enterprise development programmes:
Private Sector

235
SAB Foundation Tholoane Enterprise
Programme –
www.sabfoundation.co.za/tholoana-
enterprise-programme
Kick-Start
SABInbev
R157 million invested in supporting 473 entrepreneurs
Youth Enterprise Programme
Women Owned Taverns Programme
SAB Tholoana First
Floor, Block C Plum
Park 25 Gabriel Road
Plumstead, Cape Town
Kuba Online ecosystem for small business development. Job Booster programme aimed at accelerating job
creation through supporting & empowering micro-enterprises (https://www.iol.co.za/business-
report/careers/50-entrepreneurs-set-to-benefit-from-job-booster-programme-8e4e6fc9-0e32-4b9e-9f3e-
2e08b01abc63
Cape Town based with
a national footprint
Kandua An online market place which focuses on providing home services with 10 000 vetted SMME and
independent individuals in 100 service categories. https://ventureburn.com/2020/09/sa-tech-startup-
partners-with-french=development-agency
Johannesburg base
with a national
footprint
Transnet Hub
http://www.transnet.net/BusinessWith/P
ages/Enterprise Development-HUB.aspx
- This is an enterprise development hub
- Aimed at expanding business opportunities for smaller enterprises & new business entrants
National
SA Business Hub
http://www.sabusinesshub.co.za/
- A website based hub that offers affordable & on demand business training, knowledge and information,
coaching, an online marketplace for goods & services
Pick “n Pay Small Business – Enterprise
Foundation
http://www.picknpay.co.za/foundation-
our-projects/small-business-incubation
- Financial & non-financial support for enterprises
_ Committed to enterprises currently receiving their support
- Opportunities for new BEE suppliers
National
Shanduka Black Umbrellas
www.shandukablackumbrellas.org./
Emerging businesses support
infrastructure
mentorship and collaboration to assist their transition from incubation to viable independent businesses
office space & facilities
business software & database of business tools
National

236
bookkeeping
drivers and vehicles