Technical Feasibility Analysis of Wind Energy Potentials ...

TOWN OF SCITUATE COMMUNITY WIND PROJECT
FEASIBILITY STUDY
March 2008
Prepared by:
KEMA, Inc. & Ecology and Environment, Inc.
Contact:
Andrew Brydges
[email protected] P - 781-418-5715
KEMA, Inc. 67 S. Bedford Street, Suite 201E
Burlington, MA 01803
Peter McPhee [email protected]
P – 781-418-5751 KEMA, Inc.
67 S. Bedford Street, Suite 201E Burlington, MA 01803
Funded by the Community Wind Collaborative of the Renewable Energy Trust

SCITUATE COMMUNITY WIND PROJECT FEASIBILITY STUDY
KEMA Inc. March 2008
ii

SCITUATE COMMUNITY WIND PROJECT FEASIBILITY STUDY
KEMA Inc. March 2008
i
Table of Contents
1. NOTICE AND ACKNOWLEDGEMENTS .....................................................................................................1 2. OTHER ACKNOWLEDGEMENTS ................................................................................................................2 3. EXECUTIVE SUMMARY ................................................................................................................................3 4. INTRODUCTION ..............................................................................................................................................6
4.1 BACKGROUND...............................................................................................................................................6 4.2 PURPOSE AND SCOPE ....................................................................................................................................6
5. SITE PHYSICAL CHARACTERISTICS ........................................................................................................8 5.1 PROJECT PROPERTY OVERVIEW....................................................................................................................8 5.2 PROJECT AREA HISTORY.............................................................................................................................10 5.3 SITE DEVELOPMENT....................................................................................................................................11 5.4 RECOMMENDED TURBINE LOCATIONS........................................................................................................11 5.5 SITE CONDITIONS........................................................................................................................................14 5.6 CONSTRUCTION ISSUES...............................................................................................................................16 5.7 OPERATIONAL AND SAFETY ISSUES ............................................................................................................19 5.8 WIND RESOURCE LOSS AND SPACING FROM PHYSICAL STRUCTURES.........................................................21 5.9 SUMMARY...................................................................................................................................................21
6. WIND RESOURCE..........................................................................................................................................23 6.1 WIND MONITORING ....................................................................................................................................23 6.2 WIND DATA SUMMARY ..............................................................................................................................24 6.3 WIND SHEAR ..............................................................................................................................................28 6.4 TURBULENCE ..............................................................................................................................................28 6.5 LONG-TERM DATA CORRELATION..............................................................................................................30 6.6 TERRAIN MODELING....................................................................................................................................35 6.7 PROJECTED ENERGY PRODUCTION ..............................................................................................................35
6.7.1 Wind Turbines Used for Modeling.........................................................................................................36 6.7.2 Calculation of Net Energy Production ..................................................................................................36 6.7.3 Effect of Height on Energy Production..................................................................................................38
6.8 UNCERTAINTY ESTIMATES..........................................................................................................................38 6.9 SUMMARY...................................................................................................................................................40
7. SITE ELECTRICAL INFRASTRUCTURE AND INTERCONNECTION ...............................................41 7.1 TECHNICAL DETAILS ..................................................................................................................................41
7.1.1 Technical Details of Wastewater Treatment Plant Interconnection ......................................................41 7.1.2 Proposed Interconnection Feasibility....................................................................................................41
7.2 INTERCONNECTION STANDARDS .................................................................................................................41 7.2.1 FERC Wind Interconnection Reliability Requirements .........................................................................42 7.2.2 Wind Interconnection in Massachusetts ................................................................................................42 7.2.3 National Grid Standards for Interconnecting Distributed Generation..................................................43
7.3 SUMMARY...................................................................................................................................................45 8. CHARACTERISTICS OF THE SITE VICINITY........................................................................................46
8.1 VISUAL AND NOISE RECEPTORS AND POTENTIAL LEVEL OF IMPACT ..........................................................46 8.1.1 Visual Impact .........................................................................................................................................48

SCITUATE COMMUNITY WIND PROJECT FEASIBILITY STUDY
KEMA Inc. March 2008
ii
8.1.2 Noise Impact ..........................................................................................................................................51 8.2 AIRSPACE RESTRICTIONS............................................................................................................................51 8.3 CULTURAL SIGNIFICANCE...........................................................................................................................52 8.4 IMPACT ON COMMUNICATIONS TOWERS.....................................................................................................53 8.5 SUMMARY...................................................................................................................................................56
9. ENVIRONMENTAL AND PERMITTING ISSUES.....................................................................................57 9.1 ENVIRONMENTAL IMPACTS.........................................................................................................................57
9.1.1 Threatened and Endangered Species.....................................................................................................57 9.1.2 Avian Issues ...........................................................................................................................................59 9.1.3 Wetlands ................................................................................................................................................61
9.2 CONSISTENCY WITH LOCAL PLANS AND PERMITTING.................................................................................62 9.2.1 Current Town Zoning Bylaw..................................................................................................................62 9.2.2 Current State Model Bylaw....................................................................................................................62 9.2.3 Recommendations for Scituate Zoning Bylaw Modification ..................................................................63 9.2.4 Local, State, and Federal Permits .........................................................................................................63
9.3 SUMMARY...................................................................................................................................................63 10. FINANCIAL ANALYSIS ............................................................................................................................64
10.1 ECONOMIC ISSUES ......................................................................................................................................64 10.1.1 Electricity Costs and Rate Structure .................................................................................................65 10.1.2 Power Purchase Rates.......................................................................................................................66
10.2 NET-METERING ..........................................................................................................................................66 10.2.1 Virtual Net-Metering .........................................................................................................................66
10.3 PROJECT OWNERSHIP..................................................................................................................................67 10.4 TAX MATTERS AND COST OF FINANCING....................................................................................................67 10.5 OPTIMAL PROJECT SIZE ..............................................................................................................................68 10.6 FINANCIAL MODELING METHOD ................................................................................................................69
10.6.1 Financial Model Scenarios................................................................................................................69 10.6.2 Coincident Energy Production ..........................................................................................................71 10.6.3 Financial Model Assumptions – P50.................................................................................................71 10.6.4 Financial Model Assumptions – P90.................................................................................................72 10.6.5 Turbine Costs ....................................................................................................................................72 10.6.6 MTC Standard Financial Offer .........................................................................................................73
10.7 FINANCIAL MODEL RESULTS ......................................................................................................................74 10.7.1 Municipal Ownership ........................................................................................................................74 10.7.2 Private Ownership.............................................................................................................................74
10.8 CONCLUSIONS.............................................................................................................................................75 11. RECOMMENDATIONS AND NEXT STEPS...........................................................................................77
11.1 SITING RECOMMENDATIONS .......................................................................................................................77 11.2 TURBINE SIZING..........................................................................................................................................77 11.3 NEXT STEPS ................................................................................................................................................78

SCITUATE COMMUNITY WIND PROJECT FEASIBILITY STUDY
KEMA Inc. March 2008
iii
List of Tables
Table 1: Descriptions of Possible Turbine Locations ................................................................................. 13 Table 2: Monthly Average Wind Speed ..................................................................................................... 25 Table 3: RERL Monitored Wind Resource................................................................................................. 26 Table 4: Thompson Island Wind Speeds and Normalization...................................................................... 32 Table 5: Predicted Wind Frequency Data ................................................................................................... 33 Table 6. Predicted Wind Speed Data .......................................................................................................... 35 Table 7: Turbine Specifications and Availability ....................................................................................... 37 Table 8: Example Energy Production Comparison..................................................................................... 38 Table 9: Sources of Uncertainty.................................................................................................................. 39 Table 10: Estimated Net Energy Production............................................................................................... 40 Table 11: Local Communication Tower Descriptions ................................................................................ 55 Table 12: Scituate Rare Species.................................................................................................................. 58 Table 13: WWTP Electricity Usage and Cost ............................................................................................ 65 Table 14: Turbine Costs.............................................................................................................................. 72 Table 15: NPV for Municipal Ownership - P50 ......................................................................................... 73 Table 16: IRR for Private Ownership – P50 ............................................................................................... 75 Table 17: Turbine Ownership Scenarios, Ranked by Net Present Value.................................................... 76
List of Figures
Figure 1: Topographical Map of WWTP...................................................................................................... 9 Figure 2: Satellite Photo of Site .................................................................................................................. 10 Figure 3: Possible Turbine Sites ................................................................................................................. 12 Figure 4: Photosimulation from the WWTP ............................................................................................... 14 Figure 5: Project Area Outline .................................................................................................................... 15 Figure 6: Monthly Average Wind Speed .................................................................................................... 25 Figure 7: Diurnal Average Wind Speed...................................................................................................... 26 Figure 8: Scituate Wind Rose, 39 m ........................................................................................................... 27 Figure 9: Turbulence Intensity, 39 m.......................................................................................................... 29 Figure 10: Sample Historic Wind Correlation ............................................................................................ 31 Figure 11: Thompson Island Average Annual Wind Speed ....................................................................... 32 Figure 12: Scituate Average Wind Speed Histogram ................................................................................. 33 Figure 13: Scituate Wind Rose ................................................................................................................... 34 Figure 14: Average Predicted Wind Profile................................................................................................ 34 Figure 15. WWTP Property Map................................................................................................................ 47 Figure 16: Surrounding Areas and Neighborhoods .................................................................................... 48 Figure 17: Zone of Visual Influence Map................................................................................................... 50 Figure 18: Local Communication Towers .................................................................................................. 54 Figure 19: Coincident Energy Use Forecast ............................................................................................... 71

SCITUATE COMMUNITY WIND PROJECT FEASIBILITY STUDY
KEMA Inc. March 2008
iv
List of Appendices
Appendix A: Photosimulations…………………………………………………………………………… 1 Appendix B: Scituate Zoning Bylaws for Wind Energy Conversion Systems…………………………... 14 Appendix C: Local, State, and Federal Permitting Matrix………………………………………………. 17 Appendix D: National Grid Rate Structure…………………………………………………………...….. 22 Appendix E: Financial Model Details……………………………………………………………………. 28
Appendix E-1: P90 Scenario Summary Tables…………..…………………………………………. 29 Appendix E-2: Financial Model Assumptions……………………………………………………… 30 Appendix E-3: Financial Model Output Summary Tables…………………………………………. 31

SCITUATE COMMUNITY WIND PROJECT FEASIBILITY STUDY
KEMA Inc. March 2008
1
1. Notice and Acknowledgements This report was prepared by KEMA, Inc. in the course of performing work sponsored by the Renewable Energy Trust (RET), as administered by the Massachusetts Technology Collaborative (MTC). The opinions expressed in this report do not necessarily reflect those of MTC or the Commonwealth of Massachusetts, and reference to any specific product, service, process, or method does not constitute an implied or expressed recommendation or endorsement of it.

SCITUATE COMMUNITY WIND PROJECT FEASIBILITY STUDY
KEMA Inc. March 2008
2
2. Other Acknowledgements KEMA would like to acknowledge the Massachusetts Technology Collaborative, in particular Martha Broad and Chris Clark for their leadership of this project. In addition, we acknowledge the Town of Scituate, specifically the Renewable Energy Resource Committee members Paul Reidy, Peter Toppan, Jay Silva, Myron Boluch, and Bill Limbacher. We are also grateful to Bob Rowland and Rick Agnew for their assistance during the preparation of this report.

SCITUATE COMMUNITY WIND PROJECT FEASIBILITY STUDY
KEMA Inc. March 2008
3
3. Executive Summary This feasibility study was conducted at the request of the Town of Scituate, with funding from the Massachusetts Technology Collaborative, in order to: 1) assess the feasibility of a wind energy project at two municipally-owned sites within the Town of Scituate; 2) provide the Town of Scituate with the technical, environmental, and financial information it needs to decide whether or not to proceed with a wind energy project at either of these sites; and 3) identify the next steps that the Town should take if it wishes to move forward with the development of such a project. Information from the report will be used as the basis for presentation materials for community education workshops and related activities. The study’s conclusions are summarized below:
• Site Physical Characteristics. KEMA assessed the feasibility of siting a wind turbine at either of two possible locations: (site 1) the northwestern lot of the Scituate Wastewater Treatment Plant (WWTP) property (WWTP site), and (site 2) the eastern section of the town-owned “sand pit lot” located adjacent to the WWTP property (sand pit site). Soil conditions in both locations appear adequate for construction, and no issues with existing underground utility infrastructure have been identified. Based on the physical characteristics of these two sites and surrounding areas (e.g. existing cleared and accessible space, distance from buildings and property lines), we conclude that either of the two sites could accommodate the construction and operation of a 600 kW to 2.0 MW turbine with a hub height of up to 80 meters. We reach these conclusions with some reservations, as follows:
o There are potential noise related issues at site 1 arising from the proximity of residences directly to the northeast of the site. MTC authorized a noise impact study to be performed by a separate consultant, the results of which will be provided to the Town.
o The proximity of the turbine to WWTP buildings at the WWTP site may also raise concerns related to ice throw.
o Site 2 lies on town-owned land managed by the Scituate Conservation Commission. It is unclear at this time whether this parcel is available for development; however, we have evaluated site 2 in this report because it may provide an alternative to site 1.
• Wind Resource. Approximately one year of wind resource data has been collected at a meteorological tower located near the WWTP. An analysis of these data indicate that both
SCITUATE COMMUNITY WIND PROJECT FEASIBILITY STUDY
KEMA Inc. March 2008
4
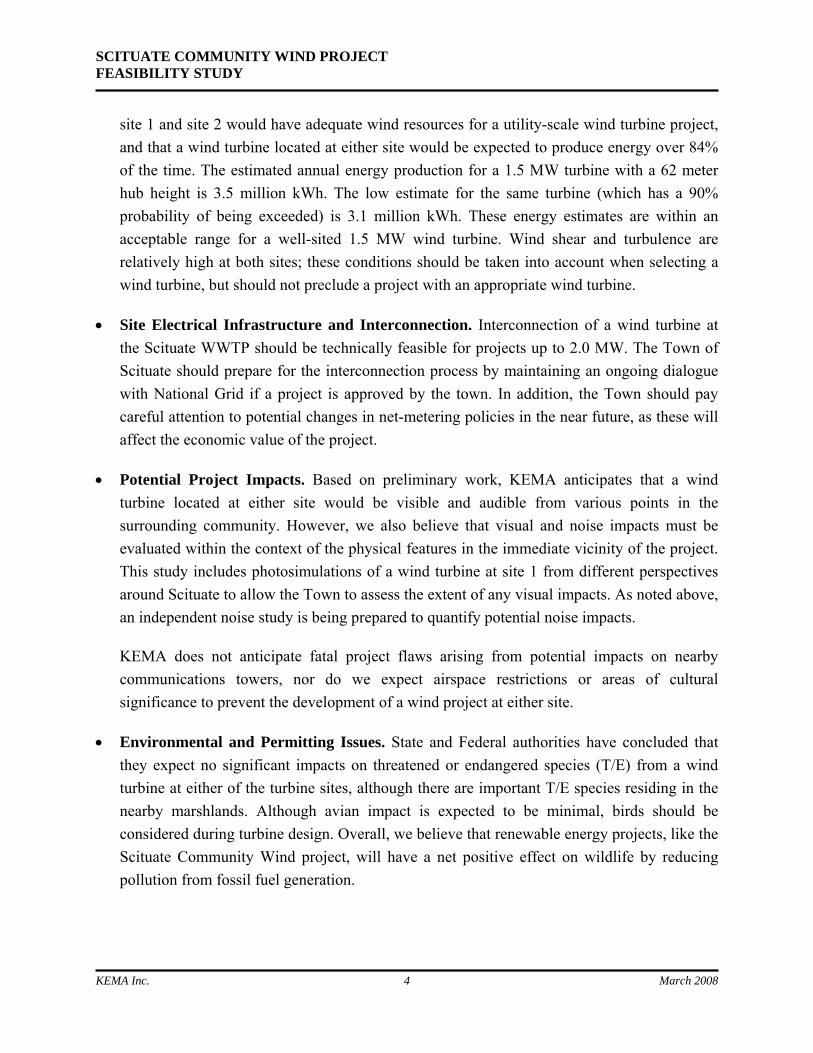
site 1 and site 2 would have adequate wind resources for a utility-scale wind turbine project, and that a wind turbine located at either site would be expected to produce energy over 84% of the time. The estimated annual energy production for a 1.5 MW turbine with a 62 meter hub height is 3.5 million kWh. The low estimate for the same turbine (which has a 90% probability of being exceeded) is 3.1 million kWh. These energy estimates are within an acceptable range for a well-sited 1.5 MW wind turbine. Wind shear and turbulence are relatively high at both sites; these conditions should be taken into account when selecting a wind turbine, but should not preclude a project with an appropriate wind turbine.
• Site Electrical Infrastructure and Interconnection. Interconnection of a wind turbine at the Scituate WWTP should be technically feasible for projects up to 2.0 MW. The Town of Scituate should prepare for the interconnection process by maintaining an ongoing dialogue with National Grid if a project is approved by the town. In addition, the Town should pay careful attention to potential changes in net-metering policies in the near future, as these will affect the economic value of the project.
• Potential Project Impacts. Based on preliminary work, KEMA anticipates that a wind turbine located at either site would be visible and audible from various points in the surrounding community. However, we also believe that visual and noise impacts must be evaluated within the context of the physical features in the immediate vicinity of the project. This study includes photosimulations of a wind turbine at site 1 from different perspectives around Scituate to allow the Town to assess the extent of any visual impacts. As noted above, an independent noise study is being prepared to quantify potential noise impacts.
KEMA does not anticipate fatal project flaws arising from potential impacts on nearby communications towers, nor do we expect airspace restrictions or areas of cultural significance to prevent the development of a wind project at either site.
• Environmental and Permitting Issues. State and Federal authorities have concluded that they expect no significant impacts on threatened or endangered species (T/E) from a wind turbine at either of the turbine sites, although there are important T/E species residing in the nearby marshlands. Although avian impact is expected to be minimal, birds should be considered during turbine design. Overall, we believe that renewable energy projects, like the Scituate Community Wind project, will have a net positive effect on wildlife by reducing pollution from fossil fuel generation.

SCITUATE COMMUNITY WIND PROJECT FEASIBILITY STUDY
KEMA Inc. March 2008
5
• Zoning Issues. This study presents a preferred turbine location within the WWTP site that is inconsistent with some provisions of the Town of Scituate’s current wind energy project zoning bylaws. Specific amendments to these may be necessary to construct a wind project at the WWTP site. KEMA has met with the Town of Scituate Planning Board to discuss updating or modifying the Town’s existing bylaws to reflect the design needs of modern wind turbines while safeguarding the public interest. We will continue to provide technical advice on this subject to the town as such advice is requested.
• Financial Analysis. KEMA conducted an initial analysis of the economics of a single-turbine wind project using a 600 kW, a 1.5 MW, and a 2.0 MW turbine, taking into account near to mid-term forecasted electricity usage for the WWTP. Multiple ownership and design scenarios were modeled to determine which had the best overall benefits for the town. These scenarios investigated turbine size, confidence of energy production, ownership options, and the potential for new net-metering laws. Projects using either of the two larger turbines generally provided net financial benefits to the town of Scituate, with the 2.0 MW turbine generally providing greater benefits. The Town should carefully monitor pending virtual net-metering legislation, which could result in increased economic benefits for the project.
• Next Steps. Based on our review to date, KEMA recommends that the Town focus its near-term efforts on site 1, which is clearly available as a site for a wind energy project. Near term steps could include:
o Providing a briefing by the Scituate Energy Committee to the Zoning Board, and/or the Board of Selectman based on the information contained in this report;
o Reviewing the noise study;
o Considering changes to the Town’s wind project zoning bylaws related to noise; and
o Making preliminary decisions regarding preferred turbine location and sizing and project ownership.
The Town should also review the legal status of the sand pit parcel, since a project at that location could reduce noise impacts while providing similar economic benefits for the town.

SCITUATE COMMUNITY WIND PROJECT FEASIBILITY STUDY
KEMA Inc. March 2008
6
4. Introduction
4.1 Background
The Town of Scituate (Town) is seeking to develop a wind project that will help lower the Town’s cost of energy while taking advantage of the area’s wind resources. The Town’s Renewable Energy Resource Committee (Energy Committee) began exploring options for developing a wind project in 2005. Based on a preliminary site screening analysis performed by the Renewable Energy Research Laboratory (RERL) at the University of Massachusetts, the Energy Committee selected the Wastewater Treatment Plant property as a site for further study. RERL erected a meteorological (met) tower at the construction debris staging area of the WWTP and monitored the wind resource at that location for approximately twelve months, beginning in August 2006.
4.2 Purpose and Scope
KEMA has been funded by the Massachusetts Technology Collaborative (MTC) to assist the Town of Scituate by evaluating the feasibility of developing a wind turbine project on one or both of two municipally-owned sites in the vicinity of the WWTP. The objective of this feasibility study is to provide the Town of Scituate with the information it needs to: 1) understand the technical, permitting, and economic issues that would be involved in constructing and operating a wind energy project at or near the Scituate WWTP; and 2) identify the project configuration (number and size of turbines, and specific locations) that would best fit the site and meet the Town’s needs.
This report addresses the following key topics:
• Site Physical Characteristics • Wind Resource Adequacy • Electrical Infrastructure and Interconnection • Characteristics Of The Site Vicinity • Environmental and Permitting Issues • Financial Analysis of Project Options • Recommendations And Next Steps It assesses the technical, environmental, and regulatory issues associated with developing a wind energy project near the WWTP, and outlines next steps for addressing these issues. To help the

SCITUATE COMMUNITY WIND PROJECT FEASIBILITY STUDY
KEMA Inc. March 2008
7
Town assess visual impacts, the report includes photosimulations of a single-turbine project and a map of potential visual impacts. Finally, the report presents pro forma financial analyses of a single-turbine wind project using three different turbine sizes (600 kW, 1.5 MW, and 2.0 MW), two ownership options (town and investor ownership), and two metering scenarios, to help the Town understand the range of economic benefits that a wind project could provide.

SCITUATE COMMUNITY WIND PROJECT FEASIBILITY STUDY
KEMA Inc. March 2008
8
5. Site Physical Characteristics This section examines the suitability of the wastewater treatment plant site for a wind turbine project. Answers are provided to the following questions:
• What are the general characteristics of the site? • What are the future plans for developing the site? • What location(s) are suitable for a wind turbine? • Does the site provide adequate spacing from buildings, roads, or related structures for the
wind project? • Will existing road access and site conditions support construction of a wind turbine? • Are there any safety issues associated with operation of the wind turbine at the site?
5.1 Project Property Overview
The Town of Scituate owns the WWTP and its surrounding property, which consists of cleared land to the immediate northwest of the WWTP buildings. The entire property covers 7.7 acres. The Town also owns land to the west and adjacent to WWTP property, which includes a former sand/gravel pit and wooded areas to the west of the cleared land; this property is managed by the Scituate Conservation Commission. The cleared area contains a staging area for town-generated tree debris and was recently used as a processing and rock-sorting center for construction waste from a local sewer expansion project. The former sand/gravel pit on the abutting conservation land consists of several unpaved trails and paths. The project property is bordered to the north by the Driftway, a local road, to the west and southwest by wooded conservation land, to the south and southeast by the marshlands, and to the east and northeast by residential properties. South and southwest of the WWTP lie the Herring River and several of its tributaries, which empty into the North River. Both rivers flow into the New Inlet and eventually channel to the Atlantic Ocean to create an open marshland that extends south to Marshfield Hills and Humarock. Directly to the east of the WWTP is the Scituate Country Club, which includes a large clubhouse and golf course. Beyond the Driftway to the north is the municipally-owned Widow’s Walk Golf Course, which sits behind densely wooded grounds beyond the small hills of the Driftway. Road access to the project property is afforded by the Driftway, which runs between Route 3A and the Scituate harbor.
The WWTP footprint consists of a collection of buildings, treatment equipment, and emergency storage areas and is separated from adjacent properties by a chain link fence. The WWTP itself is

SCITUATE COMMUNITY WIND PROJECT FEASIBILITY STUDY
KEMA Inc. March 2008
9
bordered to the south and southeast by the marshlands, to the northwest by the cleared staging area, to the west by woodland, to the northeast by a wooded residential lot, and to the east by the Scituate Country Club. The terrain to the north of the site rises abruptly beyond the Driftway, gaining about 10 m above the WWTP, which is situated at an elevation of 9 m. Areas to the northwest, north, and northeast consist of dense foliage, with mixed coniferous and deciduous trees with heights of up to 20 m. A topographical map and satellite photo of the project property and surrounding area are shown in Figure 1 and 2.
Figure 1: Topographical Map of WWTP The star represents the WWTP location on the topographical map.

SCITUATE COMMUNITY WIND PROJECT FEASIBILITY STUDY
KEMA Inc. March 2008
10
Figure 2: Satellite Photo of Site The satellite photo shows the WWTP, the met tower location, and the previous location of the rock sorter.
C.L. Guild Construction Co., Inc performed soil sampling and geologic analysis at the WWTP in 1964. General Borings, Inc. and Camp Dresser & McKee (CDM) performed similar samplings in 1979 and 1997, respectively. As part of the analysis, the companies drilled test borings and installed monitoring wells at various locations on the WWTP footprint. Results from these analyses consistently indicated a soil base comprised mainly of sand to depths of up to 9 m. The content ranged from wet to dry-moist and was colored light brown to brown. There were traces of gravel and small cobble stones in some of the borings, though excavation effort was generally easy. All borings were conducted in the premises of the WWTP and not on the northwestern property or at the sand pit, but these borings are expected to resemble the soil conditions of these nearby sites. Subsurface conditions such as those on the WWTP footprint should be suitable to support the foundation of a wind turbine and a crane that would be used to construct or service the turbine.
5.2 Project Area History
Land within the vicinity of the Project Area was once referred to as Coleman Hills. In the late 1800’s a hotel occupied the ridgeline of Coleman Hills. From the turn of the century until the
Wastewater Treatment
Plant Present Staging Area, Location of
MET Tower
Site of Rock SorterPresent Sand
Pit Area
100 m

SCITUATE COMMUNITY WIND PROJECT FEASIBILITY STUDY
KEMA Inc. March 2008
11
1960’s, Boston Sand and Gravel Company ran a large scale gravel and sand mining operation and removed the majority of the ridge in the course of their operations (McGregor & Associates, P.C., et.al. 2004). The Town purchased this land from Boston Sand and Gravel in the 1960’s and have since designated it for various uses: the WWTP, Widow’s Walk Golf Course, Scituate Sanitary Landfill (west of Widow’s Walk), and conservation land.
5.3 Site Development
The possible sites for the wind turbine selected by the Town include the wastewater treatment plant and surrounding municipal-owned land. As part of the site screening process, KEMA considered possible future development and usage initiatives at the WWTP and on the surrounding land. As of the publication of this report, there are no plans to upgrade or expand the WWTP, as it was significantly upgraded in 2000, or to utilize the cleared grounds for activities other than as a staging area for construction related materials or as a staging area for town-generated yard debris.
5.4 Recommended Turbine Locations
Although the Scituate WWTP and associated property cover a relatively small footprint in terms of a wind turbine site, KEMA has identified two possible locations that we believe will satisfy construction requirements, maximize distance from roadways and/or buildings, and should provide sufficient wind resources. Should these sites ultimately be ruled out, two alternative locations have also been considered. These locations will require renewed investigation into zoning laws and possibly construction site modifications.
In our view, the two most suitable locations are 1) beyond the met tower site near the center of the northwestern section of the WWTP property and 2) in the eastern section of the sand pit (see Figure 3). The first location in the northwestern lot is about 160 meters from the Driftway at the closest point. The nearest residential property line is about 220 meters from the proposed turbine location and the nearest residence is 255 meters to the northeast. However, this site requires additional evaluation by the Town regarding zoning requirements for noise and project setbacks. Noise impacts are further discussed in Section 8.1.2. We recommend this location, though modifications to the Scituate wind zoning bylaw to enable zoning of a turbine at the WWTP site would be required. The site limitations noted above will also have bearing on the size and type of wind turbine that may ultimately prove suitable for a project at the Scituate WWTP.

SCITUATE COMMUNITY WIND PROJECT FEASIBILITY STUDY
KEMA Inc. March 2008
12
Figure 3: Possible Turbine Sites The recommended turbine locations are marked with green. The second location, which lies on the sand pit lot, offers some advantages over the first location because the site provides a greater setback from the WWTP buildings as well as from the nearest residences. There is, however, a significant disadvantage to this site as it lies within land managed by the Scituate Conservation Commission. This land cannot currently be assumed to be open to development. Otherwise, the layout of the site is good. The WWTP buildings are approximately 275 m to the east and the nearest residence lies approximately 380 m to the northeast. The location is slightly closer to the Driftway (140 m) and only 170 m from the town park to the west. Construction at this site would require some clearing of the land as well as the construction of an access road. Because of the increased distance from the WWTP buildings, there would also be moderate additional costs associated with longer transmission lines for interconnection.
The satellite image, Figure 3, shows the possible turbine locations in green (1 and 2) at the Scituate wastewater treatment plant. The cleared area where site 1 is located is referred to as the northwestern section of the WWTP property. The area where point 2 is located is referred to as the sand pit. Table 1 provides additional details about each location, including the potential complications of the location and any specific concerns.
100 m
12

SCITUATE COMMUNITY WIND PROJECT FEASIBILITY STUDY
KEMA Inc. March 2008
13
Location Description
1 Possible Turbine Location. Proximity to WWTP buildings raises ice throw concerns. Noise levels at nearest residence must be measured to ensure impact is sufficiently limited.
2 Possible Sand Pit Turbine Location. Conservation land is not currently designated for development. Site is likely to require additional expenditures for clearing and development, road modifications and interconnection.
Table 1: Descriptions of Possible Turbine Locations The four turbine locations considered are presented along with their potential drawbacks.
Considerations that went into selecting these locations include the following:
• Suitability from a construction perspective, including adequate room for a crane and laydown during construction
• Ease of interconnection
• Wind resource consistent with other potential options
• Does not interfere with WWTP or staging area operations
• Maximal distance from WWTP buildings, residences, and roads/driveways
• Minimal additional land clearing required
• Sufficient elevation to avoid flooding and marshland conditions
Figure 4 provides a visualization of a GE 1.5 MW turbine with a hub height of 65 m situated at location 1 as viewed from the eastern corner of the WWTP driveway at a distance of 220 meters.

SCITUATE COMMUNITY WIND PROJECT FEASIBILITY STUDY
KEMA Inc. March 2008
14
Figure 4: Photosimulation from the WWTP A visual simulation of a 1.5 MW wind turbine at site 1 is shown from the perspective of the eastern driveway of the WWTP. The turbine is approximately 220 meters away.
5.5 Site Conditions
The project area encompasses all land that could potentially be disturbed during construction and operation of a wind turbine at any of the sites. The project area is outlined in Figure 5 along with potential access roads.
Discussion with the Scituate Conservation Commission on December 6, 2007 indicated that the staging area in the vicinity of turbine Site 1 was recently used as a processing area for Town sewer construction. As a result, this area consists of ‘night soil’ fill (solid waste residual).

SCITUATE COMMUNITY WIND PROJECT FEASIBILITY STUDY
KEMA Inc. March 2008
15
12 12
Figure 5: Project Area Outline The project area under consideration is shown along with potential access roads and turbine sites. In 2004, the Town of Scituate Master Plan (Plan) was adopted. This Plan was prepared by several companies (McGregor & Associates, P.C., et.al. 2004) for the Town planning board. According to the Plan, public groundwater supply well #18B is located approximately one-half mile north of the Project Area. The area surrounding and extending south from well #18B is designated as Zone II, which is considered the associated aquifer’s primary recharge area. In addition, an unidentified underground storage tank is located near the Project Area1.
1 Further information on Scituate’s infrastructure can be found in the Complete Master Plan for the Town of Scituate, which can be downloaded at http://www.town.scituate.ma.us/planning/index.html.

SCITUATE COMMUNITY WIND PROJECT FEASIBILITY STUDY
KEMA Inc. March 2008
16
A review of the MassGIS MA Department of Environmental Protection Wetlands Database and the MA Natural Heritage and Endangered Species Program (NHESP) 2006 Priority Habitat and Estimated Habitat mapping system indicated that there are no mapped wetlands within the Project Area and the Project Area is not located within MA Estimated Habitats of Rare Wildlife or MA Priority Habitats of Rare Species.
A review of available soil survey data indicated the presence of three non-hydric soils within the Project Area; Deerfield sandy loam, Merrimac sandy loam, and Hinckley gravelly loamy sand. Surficial geologic maps indicate the Project Area is composed of artificial fill in the western portion and glacial stratified Kame deposits in the eastern portion of the site (OMSG 2007). Bedrock within the Project area consists primarily of granite. The Massachusetts Executive Office of Public Safety and Security categorizes Massachusetts as located in a moderate earthquake zone that experiences several small tremors every year. According to the United States Geological Society (USGS), four historic earthquakes have occurred in Massachusetts: northern Cape Ann 1727, southern Cape Ann 1744, Cape Ann 1755, and near the coast of northern Massachusetts 2003 (USGS 2007a). Cape Ann is approximately 70 miles north of Scituate. The 2003 earthquake had a magnitude of 3.6. Seismic hazard maps indicate a 12%g to 14%g (peak acceleration) with a 2% exceedance probability within 50 years for the area including the Project site (USGS 2007b).
5.6 Construction Issues
The turbine sites appear to be generally suitable for construction. Site 1 would not require significant clearing of land or much modification of grade. Site 2 would require some clearing and grading of the sand pit, slight clearing of forested land, and the construction of an access road. The construction of the turbine at either site would require preparation of a foundation, delivery of equipment, installation, and interconnection. Slight modifications of existing WWTP driveways may be required.
The paved public roadway, the Driftway, provides direct access to the WWTP. The WWTP lies directly off the Driftway and is accessed by a paved driveway. The northwestern portion of the town facility, where the transfer station and recommended turbine site are, is presently accessed by a dirt driveway stemming off of the paved WWTP driveway. The WWTP lies approximately eight miles from MA-3, which is a major highway. Turbine sections delivered to Boston by port could be transported on MA-3. The roads leading to the entrance of the WWTP from MA-3 appear, in our estimation, to be sufficient for the delivery of turbine components. Recently, however, construction of a rotary was begun at the intersection of the Driftway and 3A. This

SCITUATE COMMUNITY WIND PROJECT FEASIBILITY STUDY
KEMA Inc. March 2008
17
could pose a potential hindrance if the completed rotary does not provide a sufficient turning radius for the delivery trucks. This rotary should be specifically investigated by the turbine installer during the turbine acquisition phase of this project.
The driveway leading to the WWTP might also pose a problem, as it is a right turn of approximately 120º with a turning radius of about 20 meters. The delivery requirements for a 1.5 MW GE turbine, for example, designate a turning radius of 35 meters for the largest components. The problem can likely be solved by backing the larger turbine components into the driveway or through modifications of the dirt area of the driveway and possibly felling some small trees. The present driveway also has a short downward slope of about 15º over 12 meters. This steep drop in the driveway will likely need to be modified for the delivery trailers, which can measure up to 35 meters in length. These modifications could be made by grading the driveway over a longer distance. Such modifications of the driveway would likely be sufficient for delivery of components to site 1. A more complete analysis of the delivery route should be completed by a delivery company or manufacturer once a specific turbine is selected. Such an analysis would consider sources of component origination, wide- and extended road designations, overpasses, nearby roads, and the driveway within the WWTP property.
Alternatively, the method of turbine delivery could take advantage of the WWTP’s proximity to a navigable channel by utilizing barge delivery. In decades past, barges routinely accessed the gravel pit area to transport materials out of Scituate. Given the proper transfer equipment, the turbine components could be delivered to the town landing on the western edge of the town park, which lies approximately 300 m west of turbine site 2. From the town landing, the components would likely need to be transported by truck to the desired turbine location. If the town landing is deemed insufficient for delivery, alternate locations in and around Scituate could be investigated.
To provide access to turbine site 2, an access road would need to be constructed from either the northwestern lot of the WWTP or directly from the Driftway. If access is desired from the northwestern lot, all modifications to the existing driveway would still be required. An additional road would have to be cleared from the corner of the lot to the sand pit area, which would be approximately 40 meters long. This access road would link to the cleared path, which is nearly wide enough to provide access by large trucks. Alternatively, an access road could be cleared directly from the Driftway to the northern point of the sand pit. Such a road would be approximately 100 m long and would require clearing of wooded land and slight grading. The land to the north of the sand pit lot is presently wooded and relatively flat, although it drops off south of the Driftway and slopes upward as it approaches the sand pit.

SCITUATE COMMUNITY WIND PROJECT FEASIBILITY STUDY
KEMA Inc. March 2008
18
The sites also provide adequate space for turbine component laydown area and crane pad area to facilitate construction. The laydown area is required to place the components, including the nacelle (which houses the electric generator), blade hub, and three blade assembly and tower sections, near the foundation. The crane pad is a compact area upon which the crane would be supported while lifting turbine tower sections, the nacelle, blades, and other equipment needed to assemble the wind turbine. The laydown and crane pad areas would be located around the site of the turbine location. Turbine site 1 is presently cleared and graded over a large area with an available minimum construction area radius of about 37 meters. Site 2 would likely require some additional clearing and grading, although only slight tree clearing would be required. Further investigation of the area should be performed if Scituate intends to utilize site 2. With some alterations of the surroundings, a construction radius of 40 meters could be created, satisfying the construction requirements for a typical 1.5 MW GE turbine, for example. Upon completion of construction, the laydown and crane pad areas could be restored to their current condition. The exact dimensions required for turbine construction will, of course, depend on many factors, including: 1) the specific turbine selected; 2) the type of cranes to be used; and 3) the construction sequence used by the project’s contractor. For example, some contractors install the blades to the hub and lift the entire assembly on to the tower base (which requires a larger laydown area); others install the hub to the nacelle and then lift each blade individually. For the 1.5 MW turbine, GE utilizes a method in which the entire rotor is constructed before being attached to the tower. The selected site should be properly suited for this type of construction, even though it is space intensive.
Site 1 is presently located directly in the center of the cleared northwestern lot of the WWTP property. This location was suggested as it would provide sufficient space to assemble the turbine rotor on the ground before installation. The exact location of turbine site 1 could, however, be modified slightly during the construction planning period. This could potentially push the site further to the southwest corner of the cleared lot, thereby increasing the distance of the wind turbine to both the WWTP and the nearest residence. To move the location further to the southwest, additional construction resources might be required. During typical turbine construction, as was considered for the current site 1 location, the rotor would be assembled on the ground with the rotor hub near the center of the construction area. Because of the length of the rotor blades, a significant distance must be kept between the rotor hub and the nearest obstruction. The tower base would then be created next to the rotor hub. Next, the crane is erected directly adjacent to the turbine tower base. By keeping the rotor hub, tower, and crane as close as possible, a lower duty crane can be used. This construction practice therefore necessitates that the tower be located at the center of the construction circle. To instead erect the

SCITUATE COMMUNITY WIND PROJECT FEASIBILITY STUDY
KEMA Inc. March 2008
19
turbine towards the southwest corner of the cleared lot, either the turbine will need to be assembled blade-by-blade or a larger crane will likely be required, which could carry a sufficient load to transport the turbine components over the larger distance between the rotor assembly and the tower.
The construction of a wind turbine poses safety issues similar to the construction of large towers (e.g., construction traffic, use of large construction equipment, etc.). Related issues and concerns should be expressed in the procurement process and addressed by a qualified vendor.
Although a 1.5 MW GE turbine has been used as an example for site and delivery requirements, it will not necessarily be the appropriate model for the Scituate WWTP. Three different turbine models are considered in section 10, the financial analysis. Machine availability, among other factors, will determine the final turbine selected.
5.7 Operational and Safety Issues
Wind turbines in general are very safe machines and impose little physical impact upon their surrounding environments. However, on very rare occasions, wind turbine failures have occurred. In addition, after winter storms ice can build up on wind turbine blades, posing a hazard to people below when it falls off. Wind turbines are large structures with rotating blades and are susceptible to some of the same icing issues as tall buildings, bridges, or support structures. While turbine failures and ice shedding should be considered during the siting process and safety measures should be implemented, the tens of thousands of installed wind turbines worldwide have proven to have very good safety records overall. The recommended turbine locations warrant further consideration with regard to both turbine failure and ice shedding.
Site 1 is situated on a functioning wastewater treatment plant property and lies in proximity to the plant’s buildings as well as the construction debris staging area. Because the facility and property are frequented by both plant employees and town residents, we conclude that icing may potentially pose a slight risk to vehicles and pedestrians. Initial investigation of the site suggests that turbine site 1 is near the threshold of suggested distance from the WWTP buildings and the transfer station. Other Massachusetts wind turbines, such as those in Hull, have been built in the proximity of schools, roads, and pedestrian ways without any reports of dangerous ice throws. If Scituate chooses to go ahead with erecting a wind turbine, KEMA recommends that the turbine be designed to automatically shut down when serious icing conditions occur. Operational and safety issues should also be addressed through the procurement process, selection of a qualified vendor, and implementation of a sound operations and maintenance plan. If there is continued

SCITUATE COMMUNITY WIND PROJECT FEASIBILITY STUDY
KEMA Inc. March 2008
20
concern about the potential and danger of ice throws, an additional risk assessment could be carried out.
Icing of turbine blades occurs at temperatures below 0o C (32o F) when there is significant humidity in the air or during an ice storm. Ice forms on a wind turbine's blades in relatively thin sheets, just as it does on trees, utility poles, power lines, and communication towers during an ice storm. If a wind turbine operates in icing conditions, two potential scenarios can occur: 1) ice fragments from the rotor may be thrown off from the operating turbine due to aerodynamic and centrifugal forces; or more commonly, 2) ice fragments may fall down from the turbine blades when the machine is shut down or idling without power production. The level and type of risk depends on the weather (especially the wind conditions), the instrumentation of the wind turbine’s control system, and the strategy the control system utilizes during icing conditions. Many modern wind turbines incorporate ice sensors that will keep the turbine from functioning when ice has developed on the turbine. Some turbines automatically monitor the correlation of wind speed and power production to the machine’s power curve. Significant variation from this power curve suggests that the aerodynamics of the blade’s airfoils have been compromised due to icing. In these cases, the turbine is programmed to shut down.
The National Renewable Energy Laboratory (NREL), most commercial turbine manufacturers, and many academic laboratories use as a general guideline a paper produced by Bengt Tammelin et al.2 They suggested that, in a cold climate, the furthest distance that poses an ice risk is
( ) 5.1⋅+= HDd (1)
where D is the rotor diameter and H is the hub height. This rule-of-thumb estimate is generally much larger than that suggested by Seifert et al. at the German Wind Energy Institute,3 which calculates an ice risk diameter of
152 HD
vd+
= (2)
where D is the rotor diameter in meters, H is the hub height in meters, and v is the wind speed in m/s. Seifert et al. attempt to put the risk of ice in perspective of other societal risks by noting that, for a typical turbine in an icing climate, “If 15,000 persons pass the road close to the wind
2 Bengt Tammelin et al. Wind Energy in Cold Climate, Final Report WECO (JOR3-CT95-0014), ISBN 951-679-518-6, Finnish Meteorological Institute, Helsinki, Finland, February 2000. 3 Henry Seifert et al. Risk Analysis of Ice Throw from Wind Turbines. BOREAS 6. April 2003.

SCITUATE COMMUNITY WIND PROJECT FEASIBILITY STUDY
KEMA Inc. March 2008
21
turbine per year there might be one accident in 300 years.” A common misconception of ice throw is the size of actual ice fragments. Although large ice fragments of up to 2 m can fall from an unmoving turbine (as with all other towers or large structures), ice fragments thrown from a moving turbine are generally in the range of 100 - 1000 grams, with the largest fragments having the approximate size and shape of a paperback book.
Although ice throws could potentially pose a problem for turbine site 1, there are mitigation options available that could be implemented to minimize these risks. Ice sensors, balance monitoring, and preventative shut down are among options that could be incorporated in a wind turbine in Scituate. To account for the extremely rare occurrence of turbine failure or collapse, sufficient setback from nearby buildings will have to be determined by state or local bylaws. Turbine site 2 would likely be distanced far enough away from buildings, traffic, and people to eliminate concerns about either turbine failure or ice shedding.
5.8 Wind Resource Loss and Spacing from Physical Structures
The possible turbine locations are far enough from physical structures that wake effects will not result in wind resource loss. To minimize the potential for wake effects, a wind turbine should not be located downwind from any physical structures that could negatively affect wind speeds. Turbine site 1 is approximately 105 meters away from the main WWTP building. This is more than the preferred distance of 10 times the height of the facility, which is 10 meters. Turbine site 2 is even further from the WWTP buildings. Furthermore, there are no structures in any other direction that appear to pose an interference to wind resources at either turbine site.
5.9 Summary
The two most suitable locations for a wind turbine are 1) near the center of the northwest lot of the WWTP (site 1), and 2) at the eastern section of the sand pit lot (site 2), as was shown in Figure 3. We recommend location 1 with some concern: Scituate zoning law will likely have to be modified in order to provide sufficient noise allowances in line with today’s turbine technology. The present zoning laws of Scituate for wind energy conversion systems are restrictive, especially concerning noise levels. Although ice throws do not appear to be a significant concern, the turbine manufacturer should be consulted regarding options to minimize risks related to icing. We do not foresee significant construction issues associated with this location. Turbine site 2 is sufficiently distanced from the WWTP to meet the state model zoning bylaws and is sufficiently spaced from the buildings that ice throw is not expected to be a problem. This site, however, may not be available for construction of a wind turbine due to its

SCITUATE COMMUNITY WIND PROJECT FEASIBILITY STUDY
KEMA Inc. March 2008
22
status as conservation land. Furthermore, site 2 would require the construction of an access road as well as more significant clearing and grading of land.

SCITUATE COMMUNITY WIND PROJECT FEASIBILITY STUDY
KEMA Inc. March 2008
23
6. Wind Resource This section provides an assessment of the wind resource at the WWTP site based on data collected at the wind monitoring towers in Scituate and at nearby Thompson Island. The wind monitoring data is important to confirm the existence of a good wind resource and to predict future energy output. The following section examines wind monitoring, estimated wind resource, wind shear, and turbulence.
In summary, the wind resource data and modeling indicate an adequate wind resource at the WWTP recommended location. The estimated average annual energy production for a GE 1.5 sle (1.5 MW) turbine with a 62 meter hub height would be approximately 3.5 million kWh. The low estimate for the same turbine (which has a 90% probability of being exceeded each year) is 3.1 million kWh. These estimates of energy production are within generally acceptable ranges for a well-sited wind project.4 The wind turbine is expected to be producing energy 84% of the time. The site presents relatively high wind shear and turbulence conditions, though they should not pose a problem for appropriately chosen wind turbines. The average wind speed at the WWTP is predicted to be 6.61 m/s at 65 meters above ground level.
6.1 Wind Monitoring
The University of Massachusetts Renewable Energy Research Laboratory was responsible for collecting, analyzing, and reporting the wind data recorded by the wind monitoring tower (meteorological or “met” tower) at the WWTP site. The monitoring site was located on the WWTP on a level area at a slightly higher elevation than the rest of the facility. The location of the tower base was at 42.17581° North, 70.72806° West. The tower collected wind speed and directional data for a period of one year at heights of 10, 30, and 39 meters. RERL was also responsible for installation of the meteorological tower and associated instrumentation. The standard NRG Systems 40 meter high guyed tower was implemented with 5 anemometers. A pair of anemometers was located at both 39 meters and 30 meters and a single anemometer was located at 10 meters. At each height, there was also a single wind directional vane. The tower was also equipped with a lightning rod and NRG 110S temperature sensor at 2 m. The data were collected and logged with the use of a NRG model Symphonie Data Logger. Based on our review of the measuring equipment, the mast type and height appear to be in accordance with standard practices, including: adequate spacing between sensors and the supporting mast and
4 Further discussion on the acceptability of a project setup can be found in Section 10, the Financial Analysis.

SCITUATE COMMUNITY WIND PROJECT FEASIBILITY STUDY
KEMA Inc. March 2008
24
boom structures, appropriate orientation of booms relative to prevailing wind direction, and data collection standards.
The data from the Symphonie logger were sent to the University of Massachusetts, Amherst on a regular basis. The logger sampled wind speed and direction once every two seconds. These data points were then combined into 10-minute averages and, along with the standard deviation for those 10-minute periods, assembled into a binary file. The binary files were converted to ASCII text files using the NRG software BaseStation®. The text files were then imported into a database software program where they were subjected to quality assurance (QA) tests prior to using the data.
The QA tests were performed by RERL. Based on the data logged, certain points were flagged and omitted during the analysis. Points are flagged if the data recorded was outside the limit of the instrument, icing occurred on the instrument, or if redundant measurements significantly differed. According to RERL, data collected at the site was good since measurement began on July 27, 2006 and ended August 1, 2007, with data recovery surpassing 99.5%. No problems with instrumentation were reported. RERL released final results from the yearlong measurement period in late September 2007. Icing affected sensors for approximately 20 to 30 hours throughout the year. During the year, only 144 measurements (about 0.2% of total measurements) were reported as not recovered. Of all 18 sensors, a total of 20.8 hours of data were out of range and 8.5 hours were found to be faulty. KEMA reviewed validated data and found it to be consistent with industry data collection standards.
6.2 Wind Data Summary
Table 2 provides a summary of the validated data collected by the tower from July 27, 2006 to August 1, 2007. The sensor located at 39 meters indicates an average wind speed of about 5.50 meters per second over the data collection period. The data for the 39 m height is plotted in Figure 6.

SCITUATE COMMUNITY WIND PROJECT FEASIBILITY STUDY
KEMA Inc. March 2008
25
Measured Monthly Average Wind Speeds (m/s) Height 10m 30m 39m
August 2006 2.52 4.53 5.01 September 3.03 4.46 5.01 October 3.02 5.31 5.95 November 2.59 4.62 5.10 December 2.70 5.13 5.64 January 2007 3.07 5.48 6.03 February 3.08 5.75 6.25 March 3.72 6.35 6.93 April 3.65 5.81 6.31 May 2.83 4.95 5.44 May 2.35 4.50 4.99 June 2.06 3.94 4.38 July 2.52 4.53 5.01 Average 2.82 4.99 5.50
Table 2: Monthly Average Wind Speed The monthly average wind speeds at three different heights of the met tower are shown for the year during which the data was collected.
Figure 6: Monthly Average Wind Speed The monthly average wind speeds are plotted for the met tower data. (Courtesy of UMASS RERL)

SCITUATE COMMUNITY WIND PROJECT FEASIBILITY STUDY
KEMA Inc. March 2008
26
Figure 7: Diurnal Average Wind Speed The average wind speed for each hour of the day is shown. The data are taken from the met tower at 39 m height. (Courtesy of UMASS RERL)
The Diurnal Plot of the wind data is shown in Figure 7 and presented in tabular form in Table 3. The data are taken from the sensors at the 39-meter location. Such a diurnal fluctuation is typically for regions on the eastern seaboard. During windier times of the year (fall, winter, and early spring), the diurnal variation will follow a similar pattern but have a larger magnitude than that of late spring and summer. An estimate of the wind speed at 65 m is also provided. The estimate is based on a power law extrapolation of the measured wind profile from 30 m to 39 m. The power law wind speed profile used by the UMASS RERL is
α
⎟⎟⎠
⎞⎜⎜⎝
⎛=
rr zz
zUzU
)()( (3)
where U(z) is the wind speed at height z, U(zr) is the wind speed at reference height zr, and α is the power coefficient that relates to the wind shear.
Aug-06
Sep-06
Oct-06
Nov-06
Dec-06
Jan-07
Feb-07
Mar-07
Apr-07
May-07
Jun-07
Jul-07
Measured 39 m
5.01 5.01 5.95 5.10 5.64 6.03 6.25 6.93 6.31 5.44 4.99 4.38
Calculated 65 m
6.06 6.06 7.19 6.16 6.82 7.29 7.55 8.38 7.63 6.57 6.03 5.29
Table 3: RERL Monitored Wind Resource Monthly measured wind speeds at 39 m are shown along with estimated wind speeds at 65 m.

SCITUATE COMMUNITY WIND PROJECT FEASIBILITY STUDY
KEMA Inc. March 2008
27
KEMA’s review of wind conditions at other met tower sites on the south shore found that similar seasonal fluctuations exist at these sites. Overall, these findings suggest that data collected by the met tower are representative of a “typical” year in terms of seasonality. The overall character of the wind is depicted in the wind rose (Figure 8) which shows the average speed and direction of the wind for the 39 m met tower sensor. Using the one year of data collected, KEMA projected the wind speeds to be 6.75 m/s at 65 m.
Figure 8: Scituate Wind Rose, 39 m The wind rose is shown for the Scituate met tower data at 39 m. The plot shows both wind speed and frequency for a given direction. (Courtesy of UMASS RERL)

SCITUATE COMMUNITY WIND PROJECT FEASIBILITY STUDY
KEMA Inc. March 2008
28
6.3 Wind Shear
Wind shear is the variation of wind speed with height. Under neutral atmospheric conditions, the wind profile follows a logarithmic curve. The wind shear at the WWTP site is largely a function of the roughness of the surrounding terrain. Instead of using a logarithmic profile, a power law can be used to extrapolate the wind to other heights to model real world conditions.
According to RERL, wind shear measures relatively high at the WWTP site, with a power law exponent of α = 0.37 when calculated between the 30 m and the 39 m anemometers. This is consistent with a roughness length, z0 = 2.30 m, which can be described as rough terrain. This level of wind shear is generally what would be expected in a suburban or semi-urban area. This roughness length is somewhat inconsistent with the surrounding terrain, which is generally flat marshland or slightly sloping wooded areas. This unexpected wind shear level might be a result of the transitional landscape of the area, in which well-developed wind off of the marsh meets the beginnings of hills and forest. This meteorological wind data, which was derived from the anemometer of the tower, is located in a different region of the property and may be susceptible to local fluctuations of wind. The consequences of this high roughness are twofold. On one hand, the wind resource increases rapidly as the turbine tower height increases. However, higher shear levels impose higher levels of mechanical strain on a wind turbine’s blades and drive train. This effect will be taken into account when assessing the suitability of different wind turbines for the WWTP site. Before final turbine purchase, the manufacturer should be consulted regarding suitability of a chosen wind turbine for these types of wind shear.
6.4 Turbulence
Turbulence intensity, the ratio of wind speed fluctuations and wind speed, has been measured at the proposed wind turbine site ranging from a level of 22% at 10 m to 18% at 39 m for a wind speed of 15 m/s. These are relatively high values, which are in accordance with the roughness of the terrain. The turbulence intensity decreases with height. The turbulence intensity at 39 m for the Scituate met tower is given in Figure 9. The turbulence intensity is one of the parameters used in the selection of wind turbines. Turbulence is the main cause for fatigue loads on wind turbines.
Turbine manufacturers offer wind turbines according to the International Energy Commission (IEC) classification. The IEC classification is based on wind speeds as well as turbulence intensity. Wind speeds must be taken into account in two ways: the IEC classification designates both an expected average wind speed and an “extreme wind speed”. The average wind speed

SCITUATE COMMUNITY WIND PROJECT FEASIBILITY STUDY
KEMA Inc. March 2008
29
Figure 9: Turbulence Intensity, 39 m The turbulence intensity measured at 39 m by the Scituate met tower is shown. The intensity averages 18% at 39 m. (Courtesy of UMASS RERL) does not specify a design requirement, rather a suggested average operating wind speed. The extreme wind speed, however, designates a design requirement that the wind speed cannot be expected to exceed, with a 50% probability, every 50 years. Lower class numbers correspond to designs using smaller rotor diameters, which are intended for higher winds. Higher numbers correspond to larger rotor diameters for low wind areas. A class I turbine, for example, is designated for an extreme wind speed of 50 m/s and an average wind speed of 10 m/s. A class II, for extreme wind speed of 42.5 m/s and average wind speed of 8.5 m/s. For each class of turbine (designated by wind speed characteristics), an associated sub-class categorization is assigned based on the turbulence characteristics. For a turbulence intensity of 18% at hub height, Sub-class A turbines are generally used. Sub-class B turbines, on the other hand, are designed for 16% turbulence intensity or less.
Although a Class III turbine would be generally more appropriate for Scituate’s average wind speeds, only Class I and II turbines could be considered given the frequency of hurricanes that reach the eastern shore of Massachusetts. As Class II turbines are designed for slower wind areas than Class I turbines, Class II designs will almost certainly produce better economic results in Scituate. Because of the measured turbulence level of 18% at 39 m for a 15 m/s wind, KEMA suggests that only Sub-class A turbines be considered. Scituate should therefore concentrate on Class II.A wind turbines for the WWTP site. During the procurement process, the issues of turbine class should be readdressed with the manufacturer to take into account the site’s

SCITUATE COMMUNITY WIND PROJECT FEASIBILITY STUDY
KEMA Inc. March 2008
30
turbulence, potential extreme wind speeds, and the overall economics of an increased rotor diameter.
We do not expect that the turbulence intensity will cause mechanical problems for the wind turbine, but in combination with the high wind shear, the wind turbine should be appropriately chosen to take these factors into account. During the turbine procurement process, the manufacturer should be made aware of the high turbulence and wind shear conditions.
6.5 Long-Term Data Correlation
The RERL wind speed measurements spanned a full year. In general, a measuring period of one year is too short to make a reliable estimate of the long-term average wind speed. From year to year the average wind speed varies by approximately 4% (one standard deviation), which means that the 95% confidence interval for the long-term wind speed is ±8%. This estimate can be improved by correlating the wind speed measurements at the site with a reference meteorological station. In this way the short-term measurements can be correlated and adjusted based on a longer range of wind speed measurement.
For this correlation, wind recordings from the RERL tower at Thompson Island in Boston Harbor were used. RERL has been collecting wind data at Thompson Island since 1998 and at the present measuring location there since 2001. Thompson Island is located 14.4 miles (23.2 km) northwest of the WWTP. Several wind monitoring stations closer to the WWTP were considered for the data correlation, but Thompson Island offered the most complete data set and most similar site geography relative to the WWTP. Figure 10 shows the correlation between the daily average wind speeds at Thompson Island and the WWTP met tower for wind directions between 225º and 255º. The coefficient of regression, R2, was determined to be 0.858 for wind speeds in this direction. A similar analysis was performed on data for all wind directions and coefficients of regression ranged from 0.744 to 0.894, indicating that the wind speeds at Thompson Island were found to correlate well to those at the Scituate met tower.
With the help of the software WindFarm, the wind speeds of Thompson Island were linearly correlated to the Scituate met tower for each direction over the period of July 1, 2006 through June 30, 2007. The correlation coefficients were used to develop a relation between the wind behavior at Scituate and that at Thompson Island.

SCITUATE COMMUNITY WIND PROJECT FEASIBILITY STUDY
KEMA Inc. March 2008
31
Figure 10: Sample Historic Wind Correlation The correlation between average wind speed at the Scituate WWTP and Thompson Island is given for winds from the southwest.
The island’s historic wind data from July 2002 through June 2006 was compared to the data for the last period of July 2006 through June 2007 and correlation parameters were created. Figure 11 presents average wind speeds at 40 m for the Thompson Island monitoring tower. Table 4 shows that the wind speed during the measuring period has been slightly higher than the 4-year average value. For the purpose of estimating the annual wind energy production, the measured wind speeds were decreased by approximately 0.7% using the WindFarm software to reflect the fact that the year in which the wind was measured was a slightly “above average” year.
R2 = 0.8579

SCITUATE COMMUNITY WIND PROJECT FEASIBILITY STUDY
KEMA Inc. March 2008
32
Thompson Island: Average Wind Speed at 40 m
4.0
4.5
5.0
5.5
6.0
6.5
2003 2004 2005 2006 2007 2003 - 2006
Year
Win
d Sp
eed
[m/s
]
Figure 11: Thompson Island Average Annual Wind Speed The Thompson Island average wind speed is given for the years during which data was collected. The year concurrent with the Scituate wind monitoring tower is given in green while the average for previous years is given in red.5
Year Average wind speed Windex 2003 6.096 101.2 2004 5.824 96.6 2005 6.156 102.2 2006 6.039 100.2 2007 6.069 100.7
Four-Year Average 2003-2006 6.026 100.0
Table 4: Thompson Island Wind Speeds and Normalization The Wind Speed Index is given for years 2003 to 2007.
5 It is important to note that the WWTP met tower wind data spanned a 12-month period from July 2006 through June 2007. The wind speed data that KEMA analyzed from Thompson Island were defined in similar 12-month intervals. For example, the year 2003 annual period for Thompson Island is actually inclusive of the period from July 2002 through June 2003.
SCITUATE COMMUNITY WIND PROJECT FEASIBILITY STUDY
KEMA Inc. March 2008
33
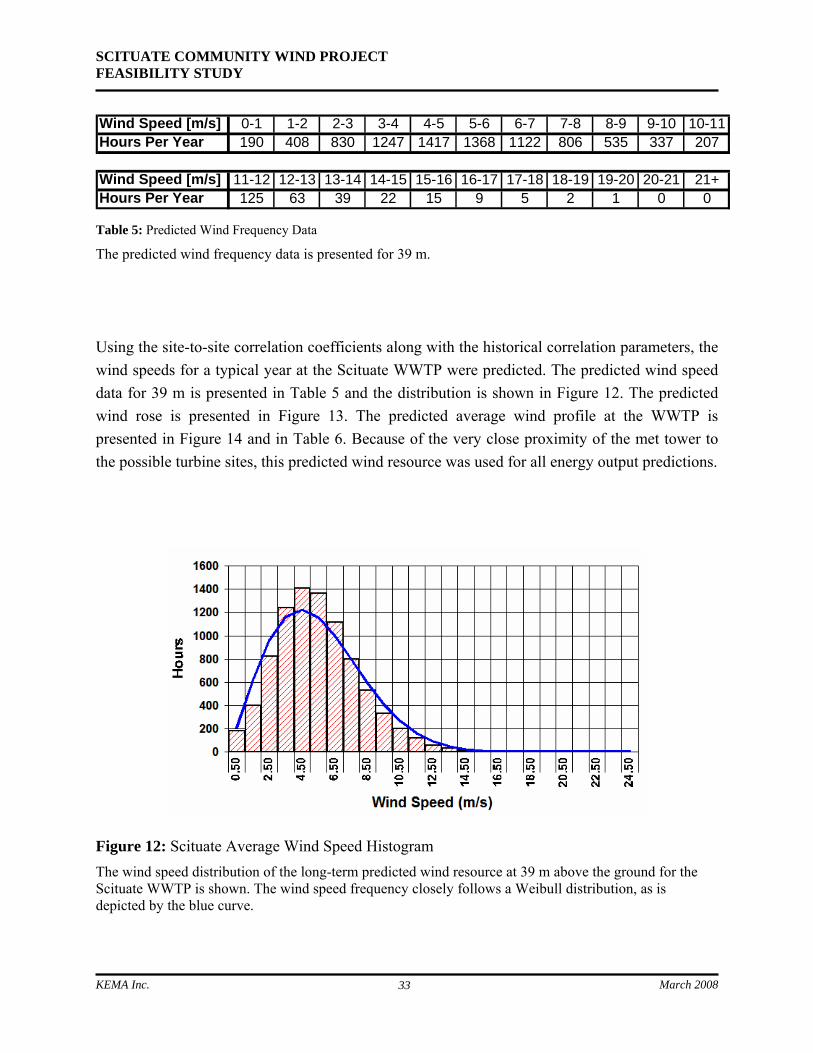
Wind Speed [m/s] 0-1 1-2 2-3 3-4 4-5 5-6 6-7 7-8 8-9 9-10 10-11Hours Per Year 190 408 830 1247 1417 1368 1122 806 535 337 207
Wind Speed [m/s] 11-12 12-13 13-14 14-15 15-16 16-17 17-18 18-19 19-20 20-21 21+Hours Per Year 125 63 39 22 15 9 5 2 1 0 0
Table 5: Predicted Wind Frequency Data
The predicted wind frequency data is presented for 39 m.
Using the site-to-site correlation coefficients along with the historical correlation parameters, the wind speeds for a typical year at the Scituate WWTP were predicted. The predicted wind speed data for 39 m is presented in Table 5 and the distribution is shown in Figure 12. The predicted wind rose is presented in Figure 13. The predicted average wind profile at the WWTP is presented in Figure 14 and in Table 6. Because of the very close proximity of the met tower to the possible turbine sites, this predicted wind resource was used for all energy output predictions.
Figure 12: Scituate Average Wind Speed Histogram The wind speed distribution of the long-term predicted wind resource at 39 m above the ground for the Scituate WWTP is shown. The wind speed frequency closely follows a Weibull distribution, as is depicted by the blue curve.

SCITUATE COMMUNITY WIND PROJECT FEASIBILITY STUDY
KEMA Inc. March 2008
34
Figure 13: Scituate Wind Rose The 39 m wind rose for the predicted wind resources at the WWTP is shown. The wind is predominantly from the SW and W.
Average Wind Speed Profile: Predicted Long-Term Winds at Scituate WWTP
0102030405060708090
100
0 1 2 3 4 5 6 7 8Wind Speed [m/s]
Hei
ght [
m]
Figure 14: Average Predicted Wind Profile The long-term predicted wind profile for the Scituate WWTP is shown.

SCITUATE COMMUNITY WIND PROJECT FEASIBILITY STUDY
KEMA Inc. March 2008
35
Height [m] 0 10 20 30 40 50 60 70 80 90 100Wind Speed [m/s] 0 3.30 4.27 4.96 5.52 6.00 6.42 6.79 7.14 7.46 7.76
Table 6. Predicted Wind Speed Data
The predicted wind speeds for the Scituate WWTP are presented for heights of 0 to 100 m above ground level. 6.6 Terrain modeling
The vertical wind profile at the measuring location and the regional distribution of the wind resource depends mainly on the terrain relief and the terrain roughness. The WWTP has an elevation of approximately nine meters above sea level and is located in flat or gently rolling terrain. The slope of the terrain surrounding the measuring location is minimal and it is therefore not expected that flow separation will occur.
The terrain roughness is the most important influence on the local wind climate. In areas with high roughness, the wind profile is steeper, causing the wind speeds to be lower near the ground. In wind resource models this is taken into account by the so-called roughness length, which varies from very flat and smooth terrain to built-up areas or areas covered by forests. Most of the land in Scituate is populated by dense trees approximately 10 - 20 meters in height. The areas to the south of the WWTP are primarily marshlands, which have a much lower roughness.
From previous studies it is known that wind flow modeling over forests needs special attention.6 In order to model the flow over the forest correctly, it is sometimes necessary to take into account the vertical displacement of the wind profile. This is done because the reference plane of the wind profile is not at the surface but at approximately 2/3 the tree height. In this study, however, the measured wind resources indicated that the profile displacement height was minimal and could be modeled well with a power law wind profile.
6.7 Projected energy production
Based on the measurement at the WWTP met tower and the wind resource modeling, the wind speed and direction distribution were derived at selected wind turbine heights. The wind speed distribution gives the number of hours that a particular wind speed blows per year. Using WindFarm, this wind speed distribution was then combined with the power curve of the selected wind turbine to obtain the gross annual wind energy production and corrected for availability and electrical grid efficiency to obtain an estimate for the net annual wind energy production. 6 ‘Proceedings workshop on the influence of trees on wind farm energy yields’, BWEA, 17 March 2004, Glasgow, (http://www.bwea.com/planning/trees.html).

SCITUATE COMMUNITY WIND PROJECT FEASIBILITY STUDY
KEMA Inc. March 2008
36
6.7.1 Wind Turbines Used for Modeling
Based on the wind resource in Scituate, three wind turbines have been considered for the wind energy production: the Fuhrlander 600 (FL 600), which has a power capacity of 600 kW and a rotor diameter of 50m; the GE 1.5 sle, which is a 1.5 MW wind turbine with a rotor diameter of 77 m; and the Vestas V90 2.0, which has a rotor diameter of 90 m and a nominal power of 2.0 MW.
Measured power curves for the GE and Vestas machines have been obtained from independent sources under a non-disclosure agreement, which is the reason why they have not been reproduced. The certified power curve for the Fuhrlander turbine was not available, so the published power curve was used. The power curves used here are for the specified versions of the wind turbines. It should be noted that some manufacturers offer special low-noise turbines, which as a consequence have a lower power output.
6.7.2 Calculation of Net Energy Production
Based on the calculated wind resource, the energy production of a wind turbine at the Scituate WWTP was estimated. The two potential locations of the wind turbine are assumed to be subject to the same wind conditions, due to their close proximity and the overall consistency of elevation and surrounding terrain characteristics. Table 7 shows the energy production of three selected wind turbines. The predicted capacity factors for the three generators range from 24.8% to 29.8%, within the range expected for well-sited wind turbines.
The total percent of time that a wind turbine is capable of producing power is known as the total availability. The following factors influence the total availability:
• Grid connection efficiency. The efficiency of the grid connection is estimated to be 97%. This includes the losses in the transformer and the transmission line. This should be confirmed by an electric loss calculation once the grid connection has been defined.
• Turbine availability. The technical availability of the turbine is assumed to be 97%. This figure is based on data from modern operational wind farms. Technical availability may be a part of the contract terms between the project owner and the wind turbine supplier. It is worth noting that manufacturers may not guarantee technical availability at the 97% level for small, one or two turbine projects. It is advisable to review this figure when the terms of the warranty are established.

SCITUATE COMMUNITY WIND PROJECT FEASIBILITY STUDY
KEMA Inc. March 2008
37
Turbine Fuhrlander 600 GE Wind Energy 1.5sle Vestas V90 2.07 Nominal power 0.6 MW 1.5 MW 2.0 MW Rotor diameter 50 m 77 m 90 m Hub height 50 m 62 m 80 m Turbine class IIA IIA IIIA Wind speed 6.00 m/s 6.50 m/s 7.14 m/s Ideal energy production 1394 MWh 3748 MWh 5585 MWh Net production 1303 MWh 3504 MWh 5222 MWh Capacity factor 24.8% 26.7% 29.8% Grid connection efficiency 97% 97% 97% Turbine availability 97% 97% 97% Turbine icing and blade fouling 99.7% 99.7% 99.7% Substation maintenance 99.8% 99.8% 99.8% Utility downtime 99.9% 99.9% 99.9% High wind speed hysteresis 100% 100% 100% Total Availability 93.5% 93.5% 93.5%
Table 7: Turbine Specifications and Availability The energy production of the three wind turbines is given along with site and turbine specifications. • Turbine icing and blade fouling. As serious icing conditions can prevent a wind turbine
from operating, it has been assumed that the machine will be shut down for approximately 24 hours per year. Blade fouling is not expected to occur, as this is primarily a problem in very hot climates where severe insect fouling can affect the aerodynamics of the turbine blades.
• Substation maintenance. The connection to the grid may have to be temporarily shut down for maintenance. KEMA has assumed that this might occur for a total of 16 hours per year.
• Utility downtime. Most wind turbines will fail to efficiently produce energy during lower wind conditions when the grid does not actively supply electricity for the machine’s control systems due to a grid power outage. This will occur, on average, approximately 8 hours per year.
• High wind speed hysteresis. During very high wind conditions, a wind turbine will shut down to protect its electrical and mechanical components. The machine will only restart when wind conditions fall significantly below the cut-off wind speed. This factor is used to compensate for power loss during this restarting delay. Because Scituate rarely experiences
7 The Vestas 2.0 MW turbine might not be available for a community wind project in the United States. This model is shown as a reference for a 2.0 MW wind turbine although it might not be appropriate for Scituate’s wind class.

SCITUATE COMMUNITY WIND PROJECT FEASIBILITY STUDY
KEMA Inc. March 2008
38
Hub height Wind speed Wind Energy Production 62 m 6.53 m/s 3504 MWh 80 m 7.18 m/s 4260 MWh
Increase 9.1% 17.7%
Table 8: Example Energy Production Comparison Relative Increase In wind Energy Production as a Function of Hub Height
winds above the 25 m/s cut-out speed, high wind speed hysteresis is not expected to have any significant effect on power output.
6.7.3 Effect of Height on Energy Production
As evidenced in the wind profile calculations, there is a considerable wind shear at the WWTP location. Therefore, increasing the hub height will result in a considerable increase in wind speed and corresponding energy production. Table 8 provides an example of wind energy output as a function of the hub height for the GE 1.5 sle turbine, which can be installed at 62 or 80 m hub heights.
6.8 Uncertainty Estimates
The wind energy production figure presented in Section 6.7.2 is the expected average production of the wind turbine at the WWTP during its (economic) lifetime. However, it must be emphasized that this value is an estimate. In this section we present some of the sources of this uncertainty and their magnitude. Based on the total level of uncertainty, we then present confidence intervals for energy production.
Table 9 shows the wind speed uncertainties that impact the energy production calculation. The associated uncertainty in energy production is calculated given the wind deviation. The accuracy levels, which are given for one standard deviation, are based upon:
• Anemometer accuracy. This value is based on the RERL data report for the Scituate Waste Water Treatment Plant.
• Correlation accuracy. A linear regression analysis resulted in R2 correlation factors ranging from 0.744 to 0.894, depending on prevailing wind direction. The resulting correlation accuracy is estimated at 3.0%.
• Variability of 5-year period. The Thompson Island wind reference that was used for the historic wind correlation has a span of five years. This results in an estimated accuracy of 2.7% for the long term average wind speed.

SCITUATE COMMUNITY WIND PROJECT FEASIBILITY STUDY
KEMA Inc. March 2008
39
FL 600 (0.6 MW) GE 1.5sle (1.5 MW) Vestas V90 (2.0 MW) Uncertainty factor Uncertainty
in wind speed
Uncertainty in energy production
Uncertainty in wind speed
Uncertainty in energy production
Uncertainty in wind speed
Uncertainty in energy production
Anemometer accuracy
4.0% - 4.0% - 4.0% -
Correlation accuracy with Thompson Island reference data
3.0% - 3.0% - 3.0% -
Variability of 5 year period
2.7% - 2.7% - 2.7% -
Wind profile modeling
1.2% - 3.0% - 5.6% -
Uncertainty over turbine lifetime
0.9% - 0.9% - 0.9% -
Uncertainty in long term average
1.0% - 1.0% - 1.0% -
Total Uncertainty
6.0% 13.3% 6.6% 12.6% 8.1% 11.7%
Table 9: Sources of Uncertainty The sources of uncertainty in wind speed are presented along with total uncertainty in energy production. • Wind profile modeling. Uncertainty in wind speed at 50 to 80 meters is mainly due to the
unknown stability conditions at the site. The resulting uncertainty has been estimated at 3.0%. This uncertainty represents the deviation toward less wind speed than predicted. The uncertainty for wind speeds being higher than predicted is significantly larger.
• Uncertainty over turbine lifetime. This represents the uncertainty that the average wind speed differs from the long-term average due to yearly fluctuations. It is estimated at 0.9% over the lifetime of the wind turbine.
• Uncertainty in long-term average. It is possible that there is a long-term trend in the average wind speed due to a changing climate. To take this into account, a 1% uncertainty in the long-term wind speed was adopted.

SCITUATE COMMUNITY WIND PROJECT FEASIBILITY STUDY
KEMA Inc. March 2008
40
Estimated net energy production (MWh/year)
Probability FL 600 (0.6 MW)
Capacity Factor (%)
GE 1.5 sle (1.5 MW)
Capacity Factor (%)
Vestas V90 (2.0 MW)
Capacity Factor (%)
P90 1130 21.5 3061 23.3 4609 26.3P50 1303 24.8 3504 26.7 5222 29.8
Table 10: Estimated Net Energy Production The estimated energy production for each turbine is calculated given a 50% and 90% probability of being exceeded. The uncertainty in the energy production is approximately 2.0 times the uncertainty in the wind speed. This is due to the non-linear power curve of wind turbines.
Assuming a normal distribution for the wind energy production around the average value, confidence levels for the energy production can be estimated. Table 10 gives the probability that an estimated level of annual energy production would be exceeded. P50 gives the energy production with a 50% probability of being exceeded; P90 denotes the energy production having a 90% probability of being exceeded. Whereas P50 is the most likely to reflect true energy production, the P90 scenario provides a conservative estimate of energy production with very little risk of not being exceeded. This can be useful, for example, in constructing conservative financial projections where understanding annual cash flow is important.
6.9 Summary
The RERL meteorological tower indicated that there were significant amounts of wind shear and turbulence which should be considered during turbine selection and procurement in regard to operations, maintenance, and influence on component lifespan. KEMA developed estimates of long term annual average wind conditions for the WWTP site by normalizing met tower data to trends on nearby Thompson Island occurring over the previous five years. Overall, the wind resources at the WWTP site are predicted to be adequate, with an average wind speed of 6.61 m/s at 65 meters above ground level. Energy production calculations were performed, with expected average net energy yields ranging from 1.3 to 5.2 million kWh annually for the three different turbine models. The uncertainties in energy production were analyzed and net output was predicted to vary by 13% or less with a confidence of 90%.

SCITUATE COMMUNITY WIND PROJECT FEASIBILITY STUDY
KEMA Inc. March 2008
41
7. Site Electrical Infrastructure and Interconnection This section discusses key interconnection and other issues associated with developing a wind project at the Scituate WWTP. Overall, our findings suggest that the interconnection should be technically feasible for projects up to approximately 2.0 MW.
7.1 Technical Details
7.1.1 Technical Details of Wastewater Treatment Plant Interconnection
Based on preliminary review of the site, the WWTP is fed by a 13.8 kV, 3 phase, 3 wire pole type distribution feeder owned by National Grid. This feeder connects to a 13.8 kV /480 V transformer, also owned by National Grid. The transformer feeds a 13.8 kV, 3 phase, 480 V switchgear owned by WWTP and located in the Blower Building. In the Blower building, there are two main buses which are 480V, 2000A, 3 phase, 3 wire, 65kA RMS SYM. 60Hz.
One existing 750 kW / 938 kVA back-up generator at 480 V is connected in parallel with the load to supply power to the plant during power interruptions. It is assumed that the back-up generators operate as stand by; this is, before energizing this back-up generator, the main breaker at the Blower Building switchgear should be opened.
Based on 15-minute average measurements, the typical loading is in the 150 to 200 kW power range and maximum loading ranges up to 320 kW.
7.1.2 Proposed Interconnection Feasibility
Based on the National Grid Standard for Interconnecting Distributed Generation, tariff MDTE No. 1116, and details from the WWTP, we find that a wind turbine with a capacity of up to 2.0 MW could be interconnected with some facility and distribution upgrades. Wind projects having a larger capacity have not been investigated in this study. A medium voltage cable or overhead line will need to be constructed from the premise boundary to the wind turbine site (less than 300 meters) and a new 1.5 to 2.0 Megavolt-ampere (MVA) step-down transformer (13.8 kV to 480 V) will need to be installed at the turbine site. These issues would be further examined as part of an interconnection study.
7.2 Interconnection Standards
At the federal level, new distributed generation (DG) interconnection requirements impacting large wind power facilities were adopted by the Federal Energy Regulatory Commission (FERC)

SCITUATE COMMUNITY WIND PROJECT FEASIBILITY STUDY
KEMA Inc. March 2008
42
in spring 2006. The broad objective of these requirements is to treat DG units in such a way as to “support the distribution system.”
Within Massachusetts, interconnection requirements for a proposed wind turbine would be subject to the Massachusetts Department of Telecommunications and Energy (MDTE) order 02-38-D, which corresponds to the National Grid Standard for Interconnecting Distributed Generation, tariff MDTE 1116.
7.2.1 FERC Wind Interconnection Reliability Requirements
FERC proposed new interconnection requirements for wind and alternative energy generators in docket RM05-4-0000 NOPR (Notice of Proposed Rulemaking). This requirement is recommended to apply to conventional generators as well as wind and other renewable energy facilities. A primary objective of this regulation, as it would apply to a wind turbine at the Scituate WWTP, is to ensure that such a facility would have ride through fault clearing capability. This is documented in the so-called Low-Voltage Ride Through (LVRT) requirement. Per this requirement, wind turbines should stay connected to the grid during low voltage events caused by system disturbances. In the event of a disturbance up to a certain magnitude, wind turbines should have the capability to “ride through” grid disturbances, remaining on-line and continuing to support the system.
The LVRT requirement would typically be addressed during the wind turbine procurement process. Most wind turbine manufacturers in the United States have already developed the technical capability to meet this requirement.
7.2.2 Wind Interconnection in Massachusetts
The Department of Telecommunications and Energy (DTE) opened its investigation into distributed generation a few years ago. The investigation focused on the development of interconnection standards, the calculation of standby rates, and the role of DG in distribution company resource planning.
Developed through a collaborative process with industry stakeholders established by the Massachusetts DTE (the Distributed Generation Interconnection Collaborative), the first model DG rules were approved in February 2004. The DTE requires all of Massachusetts' regulated utilities to file tariffs in compliance with these rules. Note that these guidelines apply to the Commonwealth’s regulated investor-owned utilities: NSTAR Electric, National Grid, Western Massachusetts Electric Company, and Fitchburg Gas and Electric.

SCITUATE COMMUNITY WIND PROJECT FEASIBILITY STUDY
KEMA Inc. March 2008
43
The standard interconnection tariff developed by the Distributed Generation Interconnection Collaborative serves as the basis for each utility's tariff. The tariff generally follows the structure set forth in consensus interconnection documents filed by stakeholders in the federal docket pertaining to FERC's Advance Notice of Proposed Rulemaking (ANOPR) on standard generator interconnection. However, the Massachusetts tariff has simplified some of the complexities found in the FERC consensus documents, and the Collaborative reached compromises on areas of non-consensus in the FERC process.8
7.2.3 National Grid Standards for Interconnecting Distributed Generation
National Grid (the local electricity distribution company for Scituate) has Standards for Interconnecting Distributed Generation (DG), set forth by the Massachusetts Department of Telecommunications and Energy (MA DTE)9 No. 1116, which describes the interconnection process for connecting distributed generation to the National Grid distribution network. This standard refers often to the “Standards for Interconnecting Distributed Resources with Electric Power Systems” of the Institute of Electrical and Electronics Engineers (IEEE P1547). The IEEE-P1547 forms the basis for the technical considerations at the connection location, including anti-islanding, power quality, and ride-through capability of the wind turbine. The current Standards were set forth in March of 2007. In April of 2007, the DTE was divided into two separate agencies: the Department of Telecommunications & Cable (DTC) and the Department of Public Utilities (DPU). The Standard is still referred to as that of the DTE as the DPU has not since modified or updated the Standard.
National Grid participates in the DG Collaborative process that outlines interconnection procedures, costs, and associated timelines according to four tracks. Based on the size of the proposed wind turbine at the WWTP, Scituate would use a Standard Application to apply for interconnection service and to begin the interconnection study process with National Grid. The interconnection application process requires an electrical one-line drawing for the project and can commence after the final project design has been approved. After submitting the required
8 The most recent standard can be found at: http://www.masstech.org/cleanenergy/howto/interconnection/tariffs.htm 9 The MA DTE was responsible for the structure and control of monopoly Telecommunications and Energy in the Commonwealth; developing alternatives to traditional regulation and traditional monopoly arrangements; controlling prices and profits; monitoring service quality; regulating safety in the transportation and gas pipeline areas; and for the siting of energy facilities. The mission of the Department was to ensure that utility consumers are provided with the most reliable service at the lowest possible cost as determined by its orders; to protect the public safety from transportation and gas pipeline related accidents; to oversee the energy facilities siting process; and to ensure that residential ratepayers' rights are protected under regulations. On April 11, 2007, the DTE was divided into two separate agencies: the Department of Telecommunications & Cable (DTC) and the Department of Public Utilities (DPU). The Standard is still referred to as that of the DTE as the DPU has not updated the Standard.

SCITUATE COMMUNITY WIND PROJECT FEASIBILITY STUDY
KEMA Inc. March 2008
44
application and application fee and opting for the Standard Process Initial Review, National Grid will provide a cost estimate and schedule for the required interconnection studies. This review can take up to 33 days. Once the customer accepts the time and cost estimates for the interconnection, National Grid will conduct an Impact Study and, if required, perform a Detailed Impact Study. The Impact Study and Detailed Impact Study can require 55 and 30 days, respectively. The entire Standard Application for interconnecting DG can take up to 125 days.
Interconnection costs for equipment, updates, and labor will be borne by the owner of the DG facility. The DG facility will also be responsible for the application fee (approximately $2,500) and the cost of the Impact and Detailed Impact Study, if required.
The different interconnection considerations, including transient voltage considerations, noise, voltage and current harmonics, frequency, interference, and voltage level should be specified for the wind generator according to the MDTE 1116. Based on this standard and for a projected turbine size of greater than 1 MW, interconnection of the WWTP project will be required to include reactive power capabilities to regulate and maintain voltage levels at the Point of Common Connection (PCC) according to NEPOOL requirements. Turbines smaller than 1 MW will not be required to provide reactive capability, unless if designated specifically in the retail rate schedule and the Terms and Conditions for Distribution Services.
Protection requirements for the interconnecting DG system must meet the minimum specifications as set forth in IEEE Standard 1547-2003, UL Standard 1741, and IEEE Standard 929-2000. These standards are designed to minimize the possibility of damage to the electric grid, to prevent harm from occurring to utility personnel, and to prevent damage to other of National Grid’s interconnecting customers. Further discussion of the extensive technical requirements for protection can be found in MDTE 1116, section 4.2.
National Grid requires that the interconnecting customer maintain the DG facility to the manufacturer’s standards. If National Grid expects that the DG facility is responsible for any interference in the power system or if the facility is producing power outside the requirements of quality agreed to, National Grid has the authority to investigate and potentially disconnect the DG facility. For emergency maintenance, National Grid must have access to the disconnect switch on the facility at all times.
The DG facility will be required to use a bi-directional meter if rated capacity is between 60 kW and 1 MW. The meter will have remote access capability and may be an interval meter. If the DG rated capacity is between 1 MW and 5 MW, the system will be required to have a bi-

SCITUATE COMMUNITY WIND PROJECT FEASIBILITY STUDY
KEMA Inc. March 2008
45
directional, interval meter with remote access. Only DG systems of 60 kW or less are presently allowed by state policy to be eligible for net-metering. Pending legislation on virtual net-metering in the state of Massachusetts would, however, result in significant changes to metering requirements. Virtual net-metering will be discussed further in section 10.
Further details on interconnection are laid out in the National Grid Standard, MDTE 1116.10
7.3 Summary
Interconnection of a wind turbine at the Scituate WWTP should be technically feasible for projects up to 2.0 MW. The interconnection application requires specifications about project generation capacity as well as site electrical drawings. The process can commence after the final project design has been approved. Pending metering legislation should be closely watched to ensure that future metering practices are taken into account for the WWTP project.
10 The National Grid Standard, MDTE 1116, can be accessed at http://www.masstech.org/cleanenergy/howto/interconnection/tariffs.htm

SCITUATE COMMUNITY WIND PROJECT FEASIBILITY STUDY
KEMA Inc. March 2008
46
8. Characteristics of the Site Vicinity This section reviews the characteristics of the vicinity around the proposed WWTP site and issues impacting the potential for general community acceptance. Topics covered include potential project impacts related to: visual and noise effects; airspace issues; areas of cultural significance; communications infrastructure; and general community acceptance.
8.1 Visual and Noise Receptors and Potential Level of Impact
The WWTP property map is shown in Figure 15, with adjacent property lines shown. The potential visual and noise impacts of the proposed wind turbine are best considered in the context of existing dwellings and other activities in relation to the turbine site. Five residential properties are found to the northeast of the turbine site while two golf course properties lie to the east and north. The closest residence is approximately 220 meters to the northeast of turbine site 1. All residential dwellings and golf course buildings lie nearer the WWTP than to the turbine sites and one of the golf course buildings is located across the Driftway. The WWTP creates a pre-existing property barrier between the buildings and the turbine sites which will help to create a slight noise and visual interruption. The residences and the golf course building to the north of the WWTP are all surrounded by dense foliage which will also help to buffer visual and noise impacts. All of the referenced residences are located off of the Driftway.
Numerous dwellings are also found directly to the east of the possible turbine sites, although the closest property is approximately 700 meters from turbine site 1. One set of properties is located on the Scituate Country Club property and the rest are in Scituate’s Rivermoor area. A large condominium complex lies directly to the west of the proposed turbine site at a distance of 800 meters from site 2. This complex is separated from the WWTP site by marshland and a wooded area.
The features of the landscape surrounding the proposed turbine sites also need to be considered when assessing potential visual and noise impacts of the turbine. The landscape to the north and west can be characterized as wooded, with dense foliage and rolling topography to the north. The landscape immediately to the south is wooded with smaller trees and then it opens up to marshland which extends a mile or more before reaching Marshfield and Humarock, a section of Scituate. The landscape immediately to the east of the turbine site is comprised of the WWTP and, further east, the Scituate Country Club. The Country Club follows rolling terrain but does not have a significant amount of wooded coverage. The surrounding landscape is flat and slightly rolling terrain, with a small hill rising directly north of the WWTP property. The Rivermoor area

SCITUATE COMMUNITY WIND PROJECT FEASIBILITY STUDY
KEMA Inc. March 2008
47
50 m50 m
Figure 15. WWTP Property Map
The WWTP property is mapped out to scale with adjacent property lines shown.
sits atop a small bluff of land at 6 – 9 meters above sea level. To the south, the Marshfield hills emerge beyond the marshlands with elevations of over 60 meters. The ocean extends beyond the Rivermoor area and the coastal bluffs that make up the Scituate shoreline, ¾ of a mile east of the WWTP. At approximately six meters above sea level, the proposed turbine sites are located at an area of relatively low elevation. The large marshland to the south, however, provides an open expanse with no visual barriers. To the west, north, and northeast, the rolling topography and dense foliage form significant visual and noise barriers between surrounding dwellings and the possible turbine sites. Figure 16 shows a satellite image of the WWTP and surrounding residential areas.

SCITUATE COMMUNITY WIND PROJECT FEASIBILITY STUDY
KEMA Inc. March 2008
48
Figure 16: Surrounding Areas and Neighborhoods Residential properties, golf course buildings, and the Rivermoor neighborhood are shown in relation to the turbine sites.
8.1.1 Visual Impact
An example of a typical community sized wind turbine is a GE 1.5 MW machine with a 65 meter tower. Such a turbine would attain a top height of 105 meters at the tip of the rotor blade. Given the relatively flat terrain surrounding the WWTP, a wind turbine at the possible locations would be visible from many vantage points in and around Scituate. However, such visual impacts are best considered in the context of the immediate vicinity.
The proposed locations leave the turbine visible from several areas in the immediate vicinity. The nearby residences to the east of the WWTP will likely have a largely obscured view of the turbine given the tall trees in the heavily wooded area. This will also be true for many houses in Scituate, as most inland lots are wooded or surrounded by wooded terrain. The area near the condominium complex will have a view of the turbine, although, because it lies in line with a landmass, it will not obscure their view of the marsh or ocean beyond. A part of the neighborhood of Rivermoor will have a view of the turbine while looking west or northwest.
+
Nearest Residence
Scituate C.C. Club House
Rivermoor Neighborhood
Widow’s Walk Golf Course Building
Condominium Complex
Recommended Turbine Sites
+

SCITUATE COMMUNITY WIND PROJECT FEASIBILITY STUDY
KEMA Inc. March 2008
49
There is presently, however, a communications tower in the line of site of the WWTP from Rivermoor that already provides some visual impact to the neighborhood.
8.1.1.1 Zone of Visual Influence
Figure 17 depicts the estimated zone of visual influence (ZVI) for a wind turbine with a 65 meter hub height, 77 meter rotor diameter, and 105 meter total height at the WWTP when viewed from 2 meters above the ground from every point on the map. Though the simulation was run only for site 1, the map should be very similar to what would be expected for a turbine at site 2. This ZVI is intended to provide only an approximation of the visual impact based on elevation contours and an approximation of existing vegetative cover. It does not account for structures and buildings. The ZVI should only be viewed in color. The eye on the map represents the wind turbine. It is important to note that the visual impact of the turbine diminishes with distance. The colors represent the following:
• Light green, white, light blue (background topographical map) - no view of turbine
• Green (1) - one turbine part in view (most likely a blade)
• Yellow (2) - two turbine parts in view (most likely a blade and the nacelle)
• Red (3) – at least three turbine parts in view (blade, nacelle, and a portion of the tower)
The ZVI map provides a preliminary estimation of areas of the town that could have a view of the turbine. It does not provide any information on the apparent size of the turbine from a specific viewpoint.
According to the ZVI map, the vast majority of Scituate will have no view of the turbine. The residential and commercial areas that will have a view of the turbine include: sections of Humarock, short stretches of Rt-3A that pass by the New Inlet marsh, parts of Scituate to the north of the WWTP, some areas surrounding Scituate Harbor, regions of First and Second Cliff, and sections of Rivermoor. The turbine will appear larger in the areas closer to the site.

SCITUATE COMMUNITY WIND PROJECT FEASIBILITY STUDY
KEMA Inc. March 2008
50
Figure 17: Zone of Visual Influence Map The Zone of Visual Influence map shows regions of Scituate and Marshfield that have a potential view of the wind turbine.
8.1.1.2 Photosimulations
Photosimulations of a GE 1.5 sl (1.5 MW) wind turbine with a 65 meter hub height located at site 1 were prepared for multiple viewpoints in and around Scituate. The GE 1.5 sl has a hub height three meters taller than the GE 1.5 sle machine that is considered in the analyses of

SCITUATE COMMUNITY WIND PROJECT FEASIBILITY STUDY
KEMA Inc. March 2008
51
sections 6 and 10 of this report. This turbine represents the middle range of sizes that were considered and provides an example of a standard mid-megawatt machine. The locations for simulation were chosen based on ZVI results and consultation with Energy Committee members. The simulations represent locations with maximum visibility of the wind turbine rather than minimal visibility; the majority of Scituate will have no direct view. These digital simulations represent specific lighting and wind conditions and will vary from actual appearance. The photosimulations are attached in Appendix A along with a map of the viewpoints.
8.1.2 Noise Impact
Noise levels from the proposed turbine should also be considered in the context of the existing features of the landscape and WWTP vicinity. While noise levels from wind turbines can be quantified, the public’s perception of the noise impacts can be quite subjective. This subjectivity stems largely from the wide variations of individual tolerances for noise and the inability to precisely predict corresponding reactions of annoyance and/or dissatisfaction. However, with continued advances in wind energy technology, noise produced from modern wind turbines has significantly decreased and is often masked by ambient or background noise of the wind itself. For reference, a 1 MW Fuhrlander wind turbine can be heard at 42 decibels (dBa) at a point 300 feet away and ten feet from the ground.
The Massachusetts Department of Environmental Protection (DEP) created a suggested noise level standard, which is reflected in the Massachusetts Division of Energy Resources’ Model Bylaw. See “Consistency with Local Plans and Permitting” for further details. To address noise impact, MTC commissioned Tech Environmental to measure the ambient noise at the nearest property boundaries and at the nearest residences and to model expected noise impacts from the turbines analyzed in this report. The results of that study can be used to assess noise impacts from the proposed turbine project. This study will be provided directly to the Town of Scituate.
8.2 Airspace Restrictions
National Geospatial Intelligence Agency data was reviewed to evaluate airspace within the vicinity of the Project Area. Data included air and nautical maps, controlled airspace, special use airspace, and obstacles.
Airspace restrictions were not expected to pose a concern as the Scituate site is likely located below Class B airspace and in Class E or G airspace. The nearest airport is Marshfield Municipal Airport, approximately 5.4 nautical miles southeast of the Scituate WWTP. The South Weymouth Naval Air Station, which lies 7.0 nautical miles to the west, has been closed since

SCITUATE COMMUNITY WIND PROJECT FEASIBILITY STUDY
KEMA Inc. March 2008
52
1997. However, with many airports and heliports located around Boston and along the eastern shore, aircraft traffic around the site may be significant but will likely not impact project development.
Aeronautical maps indicate two commercial flight paths in close proximity to the Project Area. Flight path V141 runs northwest and southeast, approximately 1.25 miles to the southwest of the Project Area. Flight path V139-268 runs northeast and southwest, approximately 2.5 miles to the northwest of the Project Area. These two flight paths cross each other approximately 2 miles west of the Project Area. The Boston Logan International airport is located approximately 20 miles northwest of the Project Area.
Special use airspace, as defined by the FAA, is airspace wherein activities must be confined because of their nature and/or wherein limitations may be imposed upon aircraft operations that are not a part of those activities. Special use airspace includes alert areas, military operations areas, prohibited areas, restricted areas, and warning areas as defined below. The Project Area is approximately 30 miles northwest of the nearest special use airspace, which is classified as a restricted area. There are therefore no expected constraints on the project due to special use airspace.
Because the turbine sites likely reside below Class B or in Class E or G airspace and are located over five nautical miles from the nearest airport, no fatal flaws existed for FAA permitting of a tower up to 400 feet (121 m) tall. A full review by the Federal Aviation Administration (FAA) was performed to determine whether or not the structure will 1) penetrate imaginary surfaces of U.S. airspace; 2) create an operational impact on nearby airports; and 3) create any electromagnetic interference with radar systems or microwave transmission systems. A Notice of Proposed Construction or Alteration, FAA form 7460-1, was filed to the FAA under project name “KEMA-000077832-07”. The FAA ruled that this project would receive a Determination of No Hazard (DNH), confirming that there are no aircraft related barriers for the project. The FAA further requires the FAA Form 7460-2, Notice of Actual Construction or Alteration, to be filed within five days of construction reaching the structure’s greatest height or when the project is abandoned. The current DNH expires May 21, 2009.
8.3 Cultural Significance
In KEMA’s preliminary investigation, cultural resources do not pose a fatal flaw to this project. A review of the available Massachusetts state historical databases have revealed that the proposed turbine sites are located in an area of the State that has a rich history; however, the

SCITUATE COMMUNITY WIND PROJECT FEASIBILITY STUDY
KEMA Inc. March 2008
53
proposed general area surrounding the proposed turbine sites has been previously disturbed during the construction of the WWTP and in previous industrial operations. A review of the National Register of Historic Properties identified three properties that are located within Scituate. The first is Lawson Tower located off of First Parish Road in Scituate Center. The Tower is located one mile north of the turbine sites with a large wooded area lying in between. Because of the structure’s height, the turbine might be visible from the top of the tower. Given current concerns about the structural integrity of the tower, people might not be allowed to climb the tower in the future. The second property is the Captain Benjamin James House, located at 301 Driftway. This house lies ½ mile to the west of the turbine sites. The house might also have a partial view of the turbine. The locale around the house has already been developed into a condominium complex and the wind turbine sites are not expected to detract significantly from the property’s historical value. Lastly, the First Trinitarian Congregational Church, which is located at 381 Country Way, lies about two miles northwest of the turbine sites. According to our computations, this property might have a partial view of the wind turbine blades and nacelle if there is not significant local tree cover in the area. Scituate does not have a historical district. Given the locations and surroundings of Scituate’s three historic properties, it does not appear that there will be significant impacts to their historical value.
8.4 Impact on Communications Towers
Wind turbines have the potential to distort incident electromagnetic waves, which may be reflected, scattered, or diffracted by turbine blades and other turbine components. For example, when a wind turbine is placed between a radio, cellular, or microwave transmitter and receiver, it can sometimes reflect portions of the electromagnetic radiation in a way that the reflected wave interferes with the original signal arriving at the receiver. In cases where interference is encountered, the problem can sometimes be resolved by filtering or shielding the turbine generator and alternator. Line of sight microwave transmission is of particular concern to wind turbines. A point-to-point microwave beam passing through a rotating turbine blade would likely be subject to significant distortion. Wind turbines have also been known to affect television signals on nearby TV sets. However, TV interference has become less of a concern as cable and satellite television have become the prevalent means of signal transmission.

SCITUATE COMMUNITY WIND PROJECT FEASIBILITY STUDY
KEMA Inc. March 2008
54
Figure 18: Local Communication Towers The satellite photograph shows the eight communications towers that are within five miles of the project sites. To evaluate the potential impact of a wind turbine at the WWTP on Scituate’s nearby communication infrastructure, KEMA identified all such infrastructure within a five mile radius of the proposed project sites. Using data provided by the Federal Communications Commission (FCC), we found eight active communications structures that were located within five miles of the sites. The locations of these structures are shown in the Figure 18.
Table 11 provides additional information about each of the eight communications structures, including distance from proposed project site 1, which is not significantly different from the distance from project site 2. Of the towers identified, only one structure lies within one mile of the possible project sites.
1017973
1242746
1002114
1004124
1041638
106002 1061979
1232628
Proposed Turbine Site

SCITUATE COMMUNITY WIND PROJECT FEASIBILITY STUDY
KEMA Inc. March 2008
55
FCC Regis.
#
Miles from Site
Structure Type
Latitude N
(NAD 83)
LongitudeW
(NAD 83)
Street City Owner
1002114 5.06 Free standing/guyed 42º 06’ 18.0” 70º 45’ 37.0” Lone St. Marshfield Industrial Communications 1004124 4.51 Free standing/guyed 42º 06’ 39.0” 70º 42’ 16.0” 117 Grove St. Marshfield Marshfield Broadcasting Co. Inc. 1017973 2.87 Free standing/guyed 42º 08’ 01.1" 70º 43' 57.5" Off Eames Way Marshfield SBA Properties, Inc. 1041638 4.88 Pole 42º 07’ 47.0” 70º 48’ 13.0” North Marshfield Marshfield Omnipoint Communications MB 1060028 6.47 Pole 42º 06’ 48.0” 70º 49’ 27.0” Route 53 Hanover Nextel Communications M-A 1061979 4.51 Free standing/guyed 42º 06’ 39.0” 70º 42’ 15.0” 117 Grove St. Marshfield Marshfield Broadcasting Co. Inc. 1232628 3.97 Free standing/guyed 42º 09’ 25.6” 70º 48’ 13.7” 156 Forest St. Norwell Bay Communications, LLC 1242746 0.79 Free standing/guyed 42º 10’ 47.0” 70º 44’ 32.2” 280 Driftway Scituate Industrial Communications
Table 11: Local Communication Tower Descriptions The detailed communication tower information is given for the eight towers within five miles. KEMA spoke with the owners of the two communication arrays closest to the WWTP: FCC tower #1242746 and #1017973. Our intention was to gain a better understanding of potential impacts of a wind turbine on these nearby facilities and to identify any potential red flags.
Industrial Communications & Electronics, Inc. of Marshfield owns tower #1242746, which is the closest tower to the turbine sites at 0.79 miles. KEMA spoke with Tom Lennon, the tower owner. According to Mr. Lennon, the tower is used solely by cellular phone carriers. At present, there are no microwave installations on the tower although he is willing to consider microwave installations in the future.
SBA Properties, Inc. of Boca Raton, Florida owns tower #1017973, which lies due south of the WWTP at a distance of 2.87 miles. KEMA contacted Edward Roach at SBA who noted that the tower services multiple cellular phone providers as well as a gas company. SBA referred KEMA to the local tower manager, Russ Putnam, for further details about their microwave transmissions. Mr. Putnam stated that there were point-to-point microwave transmission installations on the tower, but he was unsure if the proposed wind turbine would interfere.
Given the potential microwave installations on the nearby tower and that other towers in Marshfield do indeed transmit microwaves, KEMA performed a Fresnel Zone analysis of interference volumes for the point-to-point transmissions that might pass near the turbine. This analysis consisted of calculating maximum Fresnel Zone radii, which determine the maximum cross-sectional area of a transmission zone for point-to-point electromagnetic signal communication. The first Fresnel Zone, which carries the strongest signals, had a maximum radius of 35 meters. The second and third Fresnel Zones had radii of 49 meters or less. The most direct line of sight comes only within 500 meters of the proposed turbine sites. Unless additional microwave carrying communications towers are erected within the line of sight of the turbine,

SCITUATE COMMUNITY WIND PROJECT FEASIBILITY STUDY
KEMA Inc. March 2008
56
there should not be any significant impact on point-to-point microwave communications. Construction of additional towers in and around Scituate will not, however, have a likely transmission path through the turbine area, as the WWTP lies within a mile of the coastline.
As a result of their greater distance from the proposed project site, the remaining communications towers identified above are not expected to pose a problem for existing communications infrastructure within the vicinity of the project.
8.5 Summary
Based on preliminary work, KEMA anticipates that the wind project may have perceptible noise impacts. These impacts will be evaluated in more detail in the noise study, which will be provided directly to the town. Visual impacts can be estimated from various locations around Scituate through the attached photosimulations, which are provided in Appendix A. However, we believe that both types of the possible noise and visual impacts will be reduced to some extent when considered within the context of the physical features of the immediate project vicinity. KEMA does not anticipate fatal project flaws arising from the project’s impact on nearby communications towers. Nor do we expect airspace restrictions or areas of cultural significance to prevent a potential wind project at the Scituate WWTP from moving forward.

SCITUATE COMMUNITY WIND PROJECT FEASIBILITY STUDY
KEMA Inc. March 2008
57
9. Environmental and Permitting Issues
9.1 Environmental Impacts
Potential environmental consequences associated with wind turbines include impacts on threatened and endangered species and migratory birds as described below. For the proposed wind project at the Scituate WWTP, these impacts are considered minor. No fatal flaws prohibiting the development of the proposed project have been discovered.
9.1.1 Threatened and Endangered Species
The WWTP site and the adjacent lands have been extensively disturbed and altered for the construction of roadways, a solid waste facility, and the WWTP. The disturbed nature of the site restricts the likelihood that federal or state listed threatened and endangered species or state listed species of special concern inhabit the Project Area. According to the MA Natural Heritage and Endangered Species Program (NHESP) 2006 Priority Habitat and Estimated Habitat mapping system (located at http://maps.massgis.state.ma.us) the proposed project area is not located within MA Estimated Habitats of Rare Wildlife or MA Priority Habitats of Rare Species. However, there is one federal threatened species, Piping Plover (Charadrius melodus), four state threatened, and eight state species of concern reported to occur in the Town of Scituate (DFG 2007). See Table 12 for a list of these species and the year of their last known occurrence in Scituate.
The Piping Plover and Least Tern are recorded as potentially existing in the vicinity of the Scituate WWTP location.
Piping Plover
Piping Plover nest primarily above the high tide line on coastal beaches, sand flats, and among dunes. Wintering plovers on the Atlantic Coast are generally found at accreting ends of barrier islands, along sandy peninsulas, and near coastal inlets (Vinelli 2000). Feeding occurs in inter-tidal zones of coastal beaches and shorelines, and consists primarily of small coastal invertebrates. According to NHESP mapped range of this species in Massachusetts, their distribution is primarily in southern Buzzards Bay and Cape Cod. The most recent observation of this species in Scituate occurred in 2002.

SCITUATE COMMUNITY WIND PROJECT FEASIBILITY STUDY
KEMA Inc. March 2008
58
Town of Scituate Known Occurrence of Rare Species
Taxonomic Common Scientific Federal MESA (State) Most Recent
Group Name Name Status Status Observation Birds Piping Plover Charadrius melodus T T 2002 Common Tern Sterna hirundo SC 2004 Arctic Tern Sterna paradisaea SC 1932 Least Tern Sterna antillarum SC 2004 Amphibian Four-toed Salamander Hemidactylium scutatum SC 2002 Beetle Purple Tiger Beetle Cicindela purpurea SC 1935 Reptile Eastern Box Turtle Terrapene carolina SC 2002 Vascular Plant
Seabeach Needlegrass Aristida tuberculosa T 1998
Pale Green Orchis Platanthera flava var.
herbiola T 1916 Plymouth Gentian Sabatia kennedyana SC 1914 American Sea-blite Suaeda calceoliformis SC 1987 Canadian Sanicle Sanicula canadensis T 1933 Notes: T - Threatened SC - Species of Concern
Table 12: Scituate Rare Species Rare species in Scituate are listed along with federal and state status. Least Tern
Least Tern nest primarily on sandy beaches with little to no vegetation, but will also breed on gravelly shorelines of lakes and rivers. Least Terns arrive along Massachusetts coasts in early May to nest and leave by early September to winter in South America. They are diving birds and will drop from flight directly into water to feed. The NHESP indicate an active colony, recorded after 1997, north of the Project Area. The most recent observation of this species in Scituate occurred in 2004.
On November 30, 2007, letters were sent to the United States Fish and Wildlife Service (USFWS) and Massachusetts Natural History and Endangered Species Program describing the location of the proposed Project and requesting verification that no threatened or endangered species were located within the Project area. The USFWS’s response on January 2, 2008

SCITUATE COMMUNITY WIND PROJECT FEASIBILITY STUDY
KEMA Inc. March 2008
59
concluded that “no federally-listed or proposed, threatened or endangered species or critical habitat under the jurisdiction of the USFWS are known to occur in the project area(s).” The letter also states that no further Biological Assessment or further Endangered Species Act consultation with the USFWS is needed. This assessment of federally-listed T/E species is valid until January 2, 2009. The NHESP response on December 18, 2007 concluded that “at this time the site is not mapped as Priority or Estimated Habitat and the NHESP does not have any rare species concerns associated with this site.” They did, however, recommend that the potential impacts of birds be taken into consideration during the project design process.
In the event that a T/E species or species of special concern does exist at or near the site chosen for the project, appropriate mitigation can be designed to ensure that the project does not impact the particular species of concern.
9.1.2 Avian Issues
The potential for avian impacts remains a concern for wind energy development. However, smaller projects located away from migratory pathways and important bird areas may have reduced impacts. Avian issues do not pose a fatal flaw for permitting of one turbine at the Scituate WWTP site.
There are a number of beneficial impacts on bird populations that would result from an increased use of renewable energy, including wind energy. Air emissions and global climate change have been cited as serious concerns for North American bird populations (see A Birdwatcher’s Guide to Global Warming by the National Wildlife Federation and American Bird Conservancy [Price and Glick 2004]). Increased renewable energy use will slow down the negative impacts of global climate change and air emissions on people and wildlife. In addition to the positive impacts noted above, operation of wind energy facilities also has the potential to result in some adverse impacts by causing injury or death to birds through collisions and resulting in habitat loss, degradation, or displacement. While studies have shown that these negative impacts have occurred at a few sites, the results from numerous studies and reviews of impacts on birds from wind energy facilities in North America and Europe indicate that mortality rates are low, especially compared to other sources of bird mortality (Erickson et al. 2001; NWCC 2004; GAO 2005).
In November 2004, the National Wind Coordinating Committee (NWCC), a consortium of consumer groups, economic development organizations, electric power, environmental organizations, federal government, green power, state government, tribal governments, and the

SCITUATE COMMUNITY WIND PROJECT FEASIBILITY STUDY
KEMA Inc. March 2008
60
wind industry, issued the second edition of a fact sheet, “Wind Turbine Interactions with Birds and Bats: A Summary of Research Results and Remaining Questions” (NWCC 2004). The following, taken from the fact sheet, is part of an overview on the status of bird issues at wind energy facilities that aptly describes the current understanding:
Wind energy’s ability to generate electricity without many of the environmental impacts associated with other energy sources (air pollution, water pollution, mercury emissions, and greenhouse gas emissions associated with global climate change) can significantly benefit birds, bats, and many other plant and animal species. However, the direct and indirect local and cumulative impacts of wind plants on birds and bats continue to be an issue.
In a September 2005 report to congressional requesters, the United States Government Accountability Office (GAO) reviewed the impacts on wildlife from wind power. The GAO report concluded that outside of the Altamont site in northern California, the research to date has not shown bird kills in alarming numbers (GAO 2005). The GAO review of post-construction mortality studies found that bird fatalities ranged from 0 to 7.28 birds per turbine per year. Similarly, the 2004 NWCC fact sheet shows an average of 2.3 birds per turbine per year (3.1 birds per MW per year) are killed at facilities outside of California. For eastern wind farms, the NWCC fact sheet average was 4.3 birds per turbine per year (3.0 birds per MW per year) based on only two studies. No wind energy facilities in Massachusetts were included in the NWCC compilation. A recent study of avian mortality rates at the Massachusetts Maritime Academy in Buzzards Bay reported an annual mortality rate of between two and three birds per year for 2006 and 2007. The Academy installed a 660 kW utility-scale wind turbine in April 2006.
In most locations, the presence of a small number of wind turbines is unlikely to cause significant impacts to birds or result in overly contentious permitting. For example, the United States Fish and Wildlife Service (USFWS) draft Interim Guidance on Avoiding and Minimizing Wildlife Impacts from Wind Turbines (USFWS 2003) is recognized to be for wind energy projects with a minimum of five turbines. Therefore, the proposal for one turbine at the Scituate site has the benefit of being a very small-scale project compared to traditional wind energy projects.
The site location will utilize disturbed land within the industrial use of a wastewater treatment plant property. Industrial land typically provides little and/or poor habitat for birds. However, waterbirds (ducks, geese, herons, shorebirds, gulls, etc.) often frequent WWTP lagoons, occasionally in large numbers due to the presence of open water. Therefore, there may be increased avian activity at the lagoon and flying to and from this area. Generally, waterbirds

SCITUATE COMMUNITY WIND PROJECT FEASIBILITY STUDY
KEMA Inc. March 2008
61
have experienced fewer impacts from existing wind turbines than other bird families. The shrubby areas on property may also attract birds that favor that habitat.
Proposed wind energy project sites are typically screened for proximity to areas of significant bird movements (or migratory pathways) or recognized important bird areas (IBAs). As described by Massachusetts Audubon, an IBA is a site that provides essential habitat to one or more species of breeding, wintering, or migrating birds and generally supports high-priority species, large concentrations of birds, exceptional bird habitat, and/or have substantial research or educational value. The Scituate site is not considered to be an IBA; however, it is very close to an IBA. The North River Mouth and Corridor has been nominated by Massachusetts Audubon as an IBA, one of 80 IBAs across the State of Massachusetts. The IBA is located less than one mile south of the WWTP. The North River Mouth and Corridor IBA includes over 2,500 acres of riparian corridor and open water habitat bordered by emergent freshwater wetland, salt marsh, coastal beach, and marine/tidal habitat. The mouth of the river has historically been a nesting area for Least Terns and Piping Plovers and a staging area for migrant shorebirds. Large numbers of Saltmarsh Sharp-tailed Sparrows (Ammodramus caudacutus) and several species of waders can be found in the nearby salt marsh. The IBA site has also been identified as a migration corridor for more than 5,000 migratory raptors and an area where waterfowl concentrate (Massachusetts Audubon web site visited 12/11/07).
Two other IBAs are located near to the Scituate site: Wompatuck State Park (5 miles away) and Brush Island (8 miles away), but given their distance from the site, the project should have no impact on these IBAs.
Fortunately, it is not anticipated that the presence of one turbine at the Scituate site will affect the habitat or bird utilization at the IBAs. Also, threatened and endangered species are not likely to breed or use the Scituate site as significant habitat.
A review of the Massachusetts Natural Heritage Program list of rare species for the Town of Scituate revealed four local bird species: Piping Plover, Common Tern, Arctic Tern, and Least Tern. These species listed as threatened, endangered, or species of concern are unlikely to regularly occur or breed at the site. However, threatened, endangered, and species of concern are present in the North River Mouth and Corridor IBA less than one mile from the site.
9.1.3 Wetlands
No apparent wetland or waterbodies exist in the project area. In addition, the proposed project area and turbine locations are not located within Massachusetts mapped wetlands, according to

SCITUATE COMMUNITY WIND PROJECT FEASIBILITY STUDY
KEMA Inc. March 2008
62
the MassGIS Massachusetts Department of Environmental Protection Wetlands Database. The Soil Survey of Plymouth County does not indicate the presence of hydric soils in the project area. The WWTP does, however, lie immediately adjacent to a large salt marsh and the North River outlet. A written confirmation that the proposed project area is not subject to jurisdiction under the Massachusetts Wetlands Protection Act (WPA) (M.G.L.c.131, §40) is pending response from the Scituate Conservation Commission.
9.2 Consistency with Local Plans and Permitting
9.2.1 Current Town Zoning Bylaw
The Town of Scituate Zoning Bylaw was reviewed to determine potential consistency with a wind energy project at the Scituate WWTP. This Bylaw is attached in Appendix B. Section 740 of the Bylaw concerns wind energy conversion systems (WECS). The Bylaw contains two rules that might present a conflict with potential turbine site designs at site 1, the WWTP site. Section 740.2, “Setbacks from Property Lines”, requires that a WECS be located no less than 0.75 times the height of the system minus the sideyard distance from the abutting property. This requirement is stricter than that of the State Model Bylaw, which will be discussed in the next section. Section 740.6, which concerns “Noise Level Standards”, sets limits for maximum noise levels at ground level one hundred feet from the tower base. The noise level allowances during turbine operation are 3 dB above ambient noise when ambient noise is 45 dB or below, and 5 dB above ambient noise when ambient noise is 45 dB or above. These noise level requirements are, in KEMA’s opinion, relatively strict and may lead to significant hindrances in the development of a wind turbine if they are not modified or waived.
9.2.2 Current State Model Bylaw
The Division of Energy Resources (DOER) Executive Office of Environmental Affairs developed a “Model Amendment to a Zoning Ordinance or By-law: Allowing Wind Facilities by Special Permit” to provide recommendations on proper wind turbine siting in Massachusetts. This Model Bylaw language provides guidance on many aspects of wind turbine siting, including insurance requirements, structure height, setbacks, turbine color, noise, etc. The Model Bylaw does not constitute a set of zoning requirements, but rather recommended guidelines on turbine siting to be included in amendments to town zoning bylaw.
The Model Bylaw guidelines on noise defer to DEP rules which state that two conditions must be met at both the nearest property line and the nearest inhabited residence: 1) broadband sound level may not be increased more than 10 dB(A) above ambient, and 2) a pure tone condition may

SCITUATE COMMUNITY WIND PROJECT FEASIBILITY STUDY
KEMA Inc. March 2008
63
not exceed 3 dB(A) above ambient. These noise standards are not as restrictive as those stated in the Scituate Bylaw and would not likely affect siting the turbine at location 1 or 2.
9.2.3 Recommendations for Scituate Zoning Bylaw Modification
At the Town of Scituate Planning Board Meeting on September 27, 2007, KEMA employees Andy Brydges and Peter McPhee discussed potential WECS zoning issues with members of the Planning Board for consideration in future decisions to modify the Town Bylaw. The Board mentioned that it was very rare for variances to be provided for planning issues and asked KEMA for recommendations on alterations that would meet the needs of the current community wind project. KEMA will continue to work with town Energy Committee and Planning Board members to assist in developing an appropriate Bylaw for this project and possible future wind energy development.
9.2.4 Local, State, and Federal Permits
The relevant local, state, and federal permitting requirements and their likelihood of applying to the proposed wind turbine at the WWTP are listed in Appendix C.
9.3 Summary
Initial investigations into the environmental impact of a wind turbine at the WWTP suggest that there are important threatened and endangered species residing in the nearby IBA. However, state and federal authorities have concurred with our findings that the WWTP site is not a likely venue for these species. Although avian impact is expected to be minimal, birds should be considered during turbine design. Overall, renewable energy projects, including wind projects, will have a positive effect on wildlife by reducing pollution from fossil fuel generation. While the project should be compatible with local and regional plans, specific wind turbine bylaw amendments or zoning appeals may be necessary in moving forward. Due to the proximity of possible turbine locations to WWTP buildings and property lines, additional planning and permitting issues associated with turbine setbacks will likely need to be considered.

SCITUATE COMMUNITY WIND PROJECT FEASIBILITY STUDY
KEMA Inc. March 2008
64
10. Financial Analysis
10.1 Economic Issues
The Scituate WWTP currently purchases its electricity directly from the grid, with National Grid as its supplier. One of the key drivers of this project is the economic value of having the WWTP directly utilize the electricity generated by the wind turbine. This is commonly referred to as a “behind-the-meter” generation project. Electricity generated by the wind turbine and immediately consumed by the WWTP will allow the facility to offset or avoid metered usage charges associated with both electricity generation (e.g., from a power plant) and electricity delivery (e.g., from the cost of wires and associated delivery of electricity to the plant). This will be the case when power generation is coincident with power consumption. All of the WWTP’s power needs that are supplied immediately by the wind generator would therefore not be taken from the grid, thus avoiding purchasing power from the grid.
During this coincident use, additional electricity will either be sent back to the grid (if excess is generated) or bought from the grid (if wind generator supply is insufficient). Electricity purchased from the grid will be at the standard market rate. The wind generator, however, can currently sell electricity to the grid only for the avoided cost of electricity generation, which is generally a percentage of the market rate. Currently, smaller distributed generation systems in Massachusetts (under 60 kW nominal system power) are eligible for net-metering. This means that total energy generation and consumption from the grid are totaled each month and the net total is either purchased by the grid (if net generator) or bought by the generator (if net consumer). The power capacity limits of Massachusetts net-metering are currently too small for consideration in the project at the WWTP.
The potential for future “virtual net-metering” laws would allow a renewable energy producer to provide electricity “virtually” behind the meter to any qualified facilities. For a town-owned generator, for example, the electricity could be used first onsite and secondly at other town-owned buildings before being sold into the grid. If such a policy is brought into law in the future, it would provide a significantly increased economic incentive for a larger wind turbine. As of this writing, the virtual net-metering legislation is being debated in committee by the Massachusetts legislature, though the House and Senate versions do not differ significantly on this issue. However, the legislation, which is part of a broader Energy Bill, may not be enacted until Summer 2008, and would be followed by a period of rule-making by the regulatory agencies.

SCITUATE COMMUNITY WIND PROJECT FEASIBILITY STUDY
KEMA Inc. March 2008
65
Given present net-metering policies, however, a small to medium-sized behind-the-meter project has the potential to be more economical than a large or similar project that sells generation to the grid depending upon: 1) electricity costs and rate structure; 2) stand-by and power purchase rates; 3) capacity factor and cost of different turbines located at the same site; and 4) the coincidence of generation and usage. Each of these issues is discussed below.
10.1.1 Electricity Costs and Rate Structure
Based on existing load usage data covering the last two years, the WWTP uses between 107 MWh and 140 MWh of electrical energy per month. The peak power demand varies between 250 kW and 320 kW at a power factor 74 to 88 percent and apparent power11 varies from 275 kVA to 360 kVA. The current electricity usage and costs at the WWTP are summarized in Table 13.12
Based on the rate structure that National Grid uses to charge the WWTP for electricity13, KEMA estimates that more than 88 percent of the WWTP’s electricity costs, based on historical usage, could be potentially offset by electricity generated by an appropriately sized wind turbine.14 This makes it a favorable rate structure for a “behind-the-meter” wind project. See Appendix D for a copy of the WWTP rate. The actual percent of electricity usage offset will depend on the specific turbine chosen. This is looked at more closely in the section, “Financial Modeling Method.”
Scituate WWTP Estimated Electricity Usage and Maximum Possible Avoided Cost15
Average Annual Usage (kWh)
Overall Peak
Demand (kW)
Average Annual Total Cost
(Usage & Demand)
Maximum Average Annual
Avoided Cost ($)
Maximum Average Annual
Avoided Cost (%)
1,477,000 320 $ 146,000 $ 129,000 >88%
Table 13: WWTP Electricity Usage and Cost Energy and power consumption for the Scituate WWTP are given along with costs. Maximum avoided cost represents what could potentially be offset by the wind turbine.
11 Apparent power is the product of the root-mean-square (rms) current and the rms voltage in an AC-circuit. The apparent power is a measure of power in an AC system that accounts for reactive system components. 12 Based on historical usage provided by Bob Rowland, Supervisor of the Scituate Sewer Division 13 National Grid Rate G-3: large commercial and industrial Time-of-Use customers 14 Typically commercial electricity users pay usage charges($/kWh) and in addition to peak demand charges ($/kW). Monthly peak demand charges are based on a facility’s peak energy usage during a given month. Depending on the rate structure, the $/kW charge may reflect a significant portion of the bill. In this particular case it does not. Less than 12 percent of the estimated WWTP $/kWh charge is tied to fixed customer costs and demand charges. 15 Based on 23 months of WWTP usage data, from September 2005 through July 2007.

SCITUATE COMMUNITY WIND PROJECT FEASIBILITY STUDY
KEMA Inc. March 2008
66
It is worth noting that the Town completed a significant capacity upgrade to the WWTP in 2000. The Supervisor of the Scituate Sewage Division, Bob Rowland, estimates that the WWTP could see future increases in usage totaling 3390 kWh per day at a power capacity increase of 160 kW. This would nearly double the present energy usage at the plant, bringing daily capacity to over 7400 kWh per day and peak demand to 480 kW. This is in-line with the plant’s present sewage operating flow, which is only about 50% of plant capacity. Future energy usage increases would improve the economics of installing a larger turbine.
10.1.2 Power Purchase Rates
National Grid is required to purchase any excess or net electricity generation for distributed generation projects at a rate equal to the hourly ISO-NE market rate (if 1 MW or larger) or average monthly ISO-NE market rate (if less than 1 MW) for generation only.16 Typically, this price would represent less than 50 percent of the total avoided costs from offsetting usage at the WWTP. The Town of Scituate could also explore sales to competitive energy suppliers, but this provides an indication of the revenue disparity between the total avoided costs (generation and delivery) and the value of just generation sales to the grid.
10.2 Net-Metering
Rather than requiring that all energy produced must coincide with load, Massachusetts “net-metering” legislation allows any energy produced at an on-site facility to be treated, for pricing purposes, as if it were offsetting the load at the site. Current Massachusetts law only allows facilities of up to 60 kW to benefit from net-metering.17 However, the state legislature is considering increasing this cap to 2 MW. This would increase the percentage of the facility’s load that could be credited toward the WWTP’s electricity bill from about 65 to 75 percent (depending on turbine size) to up to 100 percent. Net excess generation (NEG) would still be sold at the much lower spot market rate.
10.2.1 Virtual Net-Metering
Beyond simply increasing the cap for net-metered facilities from 60 kW to 2 MW, the legislation under consideration in Massachusetts could potentially allow municipalities to engage in “virtual net-metering” (VNM). This would mean that a qualified generating facility (e.g., a wind turbine) on municipal property could contribute its net-metered electricity to any municipally-owned facility. In Scituate, this would effectively mean that the full output from the turbine could be 16 National Grid MDTE No. 1032-C 17 Database of State Incentives for Renewable Energy (DSIRE), “Massachusetts – Net Metering.” www.dsireusa.org

SCITUATE COMMUNITY WIND PROJECT FEASIBILITY STUDY
KEMA Inc. March 2008
67
priced as if it were behind the meter18, dramatically improving the economics of the project, as if it were powering the schools, library, etc. Financial modeling results show that VNM is very beneficial to the economic health of this project.
It should be noted that this analysis is based on the most recent version of VNM legislation. There is no guarantee that it will be signed into law, or that, if enacted, it will not be altered from its current form. Once signed into law, it could take a significant period of time for the appropriate regulatory authorities (Department of Energy Resources, Department of Public Utilities, etc.) to work with stakeholders to establish guidelines and procedures for putting VNM into effect.
10.3 Project Ownership
If in considering a turbine, the Town opts to pursue municipal, rather than private, ownership, Scituate must file a Home Rule petition with the state legislature, allowing the Town to finance and own/operate the turbine. This would also enable it to benefit from a VNM policy, if enacted. As potential owners, the Town of Scituate has expressed interest in maximizing the potential wind energy available at this site, as well as achieving high level economies of scale where possible.
10.4 Tax Matters and Cost of Financing
As evidenced in the previous section, wind projects are capital intensive. While a number of financing structures can be considered, our preliminary assessment addresses the two basic approaches: (1) 100% financing using debt; and (2) private financing using 100% equity.
Financing small energy projects is difficult due to their complexity and the fact that most investors focus on larger projects for reasons of scale economy. Our analysis provides Scituate with a preliminary understanding of the typical costs for privately developed small scale projects. We also studied the costs of a municipally-owned facility in comparison to the privately-financed project. Such a distinction is important because a municipal owner would have a very different financing structure than a private developer. If the town decides to move forward with a municipally-owned facility, it should consider low-cost loans that might be available through the state.
18 Note that, under current VNM legislation language, net-metered electricity prices do not offset Demand Side Management and Renewable charges in electricity billing. Furthermore, facilities larger than 1 MW do not offset distribution charges. These pending regulations are taken into account in the financial model.

SCITUATE COMMUNITY WIND PROJECT FEASIBILITY STUDY
KEMA Inc. March 2008
68
We chose a municipal bond interest rate of 4.5% over 20 years to reflect current interest rates for the publicly-financed scenarios. Financing the project in this manner might also avoid the time and cost of transaction-structuring required in a privately financed project. However, a municipally-financed project, due to its tax-exempt status, would not be able to receive any Production Tax Credits (PTC)19 and other advantageous financial treatment such as accelerated depreciation.
Unlike municipal projects, a private developer will be able to receive full tax benefits. There are two major federal tax benefits for wind project investors: 5-year accelerated depreciation and the PTC.20 The PTC is a credit against tax liability currently at the rate of 1.9 cents per kWh escalating with inflation. The PTC applies to all energy generated in the first 10 years of operation and it results, therefore, in a significant offset to the cost of producing energy from wind projects that qualify.
10.5 Optimal Project Size
The Town of Scituate began this process by seeking a one to three turbine project with the best economics. Based on physical limitations associated with the WWTP footprint, we believe a single turbine project is the most feasible option. In general, to maximize the value of a “behind-the-meter” project, it is important to maximize behind-the-meter usage and minimize sales to the grid. However, when configuring wind projects, several issues come into play:
1. Larger turbines typically have a lower installed cost per MW.
2. Different turbines can have different capacity factors, even at the same hub height.
3. Electricity production from a wind turbine should coincide as much as possible with electricity usage at the WWTP.
19 The federal Production Tax Credit is applicable to tax-paying entities only. Currently, it is at 1.9 cents/kWh escalating with inflation for the first ten years of a wind project. It was recently extended in the Tax Relief and Health Care Act of 2006 for projects starting operation by the end of 2008. The PTC has been extended several times since its inception in the early 1990’s, though there are currently considerations in Congress and the Whitehouse to not renew the PTC. A recent attempt to renew the PTC beyond 2008 failed, but additional efforts are possible. 20 Under current law, the PTC does not apply to a project that commences operation after 2008. In our analysis, we have assumed that the PTC is extended (as it has been previously) and that a project in Scituate will be eligible for the PTC if private investors are involved. We note that one risk of the private finance structure is that the PTC may not be extended.

SCITUATE COMMUNITY WIND PROJECT FEASIBILITY STUDY
KEMA Inc. March 2008
69
4. At any given time, electricity used by the WWTP in excess of generation from the wind project is being purchased from the grid at a much higher cost.
5. Excess electricity generated by the wind project will be sold into the grid at a much lower value relative to WWTP avoided electricity costs.
In general, if too small of a turbine is selected, then lost opportunity costs (i.e., electricity purchases from National Grid that could have been avoided by a larger turbine) and higher installed costs per kW would contribute to sub-optimal economics. Conversely, if too large of a turbine is selected, then greater reliance on lower value and potentially more risky grid sales (in the absence of virtual net-metering) would contribute to sub-optimal economics. With virtual net-metering, the best economics are realized by the biggest turbine.
KEMA performed an in-depth financial analysis that considered three different turbine sizes and several variables that would significantly affect results. Based on the results of this analysis, KEMA expects that a turbine in the size range of 1.5 to 2.0 MW with a hub height of up to 80 meters will be the optimal financial option for the WWTP site. Early modeling results showed that, even under the most favorable wind and legislative conditions considered, the 600 kW FL600 turbine produced undesirable or poor financial results.
It should be noted that even though a 2.0 MW interconnection may be technically feasible, interconnection requirements may be simpler with a project that is 1.5 MW or less. In addition, due consideration would also have to be given to further analysis of community concerns (e.g., visual impacts) and overall budget limitations.
10.6 Financial Modeling Method
Using a financial model provided to KEMA by the Massachusetts Technology Collaborative, we modeled 24 economic scenarios to reflect the range of financing options, net-metering scenarios, and development approaches to a behind-the-meter wind turbine project at the WWTP. We determined the Net Present Value (NPV) to the Town for each scenario. For private ownership scenarios, we also determined the Internal Rate of Return (IRR).
10.6.1 Financial Model Scenarios
Scenarios reflect different combinations of the following four variables:
1. Turbine Type: The wind turbine capacities analyzed were 600 kW, 1.5 MW and 2.0 MW. The virtual net-metering parameters under consideration by the

SCITUATE COMMUNITY WIND PROJECT FEASIBILITY STUDY
KEMA Inc. March 2008
70
Massachusetts Legislature would only allow net-metering for systems less than or equal to 2.0 MW. Therefore, turbines greater than 2.0 MW were not considered as they would not be eligible for the benefits of virtual net-metering.
2. Ownership: Ownership refers to whether the turbine would be town-owned or owned by a private entity. There are risks and benefits to both kinds of ownership. The two benefits of private-ownership are that the town bears no responsibility for the cost and maintenance of the turbine, while locking in a long term energy rate that is expected to be lower than current (and potentially escalating) market rates for electricity. The town will also benefit from leasing payments received for the WWTP turbine site. The benefit of town-ownership is that the town may completely offset some portion of town electricity costs, which is estimated to create greater economic value to the town than private ownership. However, along with gaining a greater portion of the benefits, town-ownership requires assuming a greater portion of the risks, including financing and maintaining the turbine.
3. Probability of Occurrence (P50/P90): The confidence levels for energy production are estimated assuming a normal distribution for energy production around the average value.
4. Virtual Net-Metering (Yes/No): As described earlier, virtual net-metering would allow all of the energy produced by the turbine, not just the amount used by the WWTP, to be partially counted “behind-the-meter.” In essence, the Town would be offsetting its energy use at other facilities at some portion of the retail energy rate, as opposed to selling any energy not used by the WWTP back into the grid at the wholesale rate. The legislation in its current form dictates that projects sized between 60 kW and 1 MW may receive credit for full basic service for electricity generated by the turbine not consumed by the Town. For projects between 1 MW and 2 MW, the Town may receive credit for the non-distribution portion of basic service. Using data from National Grid, the credit is worth the cost of basic service (estimated at $100/MWh) minus the distribution cost (estimated at $13/MWh).

SCITUATE COMMUNITY WIND PROJECT FEASIBILITY STUDY
KEMA Inc. March 2008
71
10.6.2 Coincident Energy Production
Coincident energy production is the amount or percentage of energy produced by a generator that coincides with a site’s electrical load “in real time.” KEMA estimated the percentage of energy generation from a wind turbine that would coincide with the Scituate WWTP’s load. This estimate is based on an analysis of average electricity demand, correlated with the number of hours that the turbine is expected to offset some or the entire load, with an additional amount factored in to account for short-term output fluctuations. Coincident energy production is only relevant to the analysis in the absence of VNM legislation.
10.6.3 Financial Model Assumptions – P50
Total energy generation and the turbine’s capacity factor were derived from Scituate meteorological tower data and long-term wind data from Thompson Island. Some inputs to the financial model were developed through a technical analysis performed by KEMA using WindFarm software. For a 2.0 MW turbine, the estimated capacity factor was found to be 29.8%, which corresponds to an annual expected energy generation of 5,222 MWh. This is over three times the amount of energy used annually at the WWTP, which is 1,477 MWh. Coincident energy production was found to be 20.4% of the turbine’s production. For the 1.5 MW turbine, the capacity factor is estimated to be 26.7%, due in part to its lower hub height. The expected output for this machine is 3,504 MWh, with coincident energy production of 28.4%. The 600 kW model has a capacity factor estimated to be 24.8%, with an expected energy output of 1,303 MWh. Coincident energy production was found to be 65.7%. These results are summarized in Figure 19.
Coincident Energy Use Forecast at P50
0
1,000,000
2,000,000
3,000,000
4,000,000
5,000,000
6,000,000
2 MW 1.5 MW 600 kW
kWh
Turbine Annual Output (kWh)WWTP Energy Use (kWh)Coincident Consumption (kWh)
Figure 19: Coincident Energy Use Forecast Annual coincident energy use is shown in relation to total WWTP energy use and total turbine output.

SCITUATE COMMUNITY WIND PROJECT FEASIBILITY STUDY
KEMA Inc. March 2008
72
10.6.4 Financial Model Assumptions – P90
As would be expected, capacity factors for P90 scenarios were less than those found in the P50 scenarios. Tables and charts related to the P90 scenarios are given in Appendix E-1. For a 2.0 MW turbine, the P90 capacity factor is 26.3%, which corresponds to an annual expected energy generation of 4,608 MWh. For the 1.5 MW model, the capacity factor is 23.3%. The expected output for this model is 3,062 MWh. The 600 kW model has a capacity factor of 21.5%, with an expected energy output of 1,131 MWh.
10.6.5 Turbine Costs
Using recent industry pricing data and in consideration of site specific variables, KEMA estimated turbine costs, installation costs, and annual operating costs for each of the turbine models, summarized in Table 14. These turbine costs are rough estimates because turbine pricing is presently in flux.
600 kWTurbine Cost 1,829,741$ Installation Costs 340,000$ Total Cost 2,169,741$ Annual Costs (O&M, Extended Warranty, Insurance, Administration) 36,250$ Turbine Annual Output (kWh) - P50 1,303,488Turbine Annual Output (kWh) - P90 1,130,566
1.5 MWTurbine Cost 3,296,250$ Installation Costs 461,713$ Total Cost 3,757,963$ Annual Costs (O&M, Extended Warranty, Insurance, Administration) 44,125$ Turbine Annual Output (kWh) - P50 3,504,438Turbine Annual Output (kWh) - P90 3,061,620
2.0 MWTurbine Cost 3,650,000$ Installation Costs 523,350$ Total Cost 4,173,350$ Annual Costs (O&M, Extended Warranty, Insurance, Administration) 58,500$ Turbine Annual Output (kWh) - P50 5,222,712Turbine Annual Output (kWh) - P90 4,607,760
Table 14: Turbine Costs All expected wind turbine costs are presented for the three wind turbines modeled.

SCITUATE COMMUNITY WIND PROJECT FEASIBILITY STUDY
KEMA Inc. March 2008
73
A more detailed breakdown of assumptions may be found in Appendix E-2, the financial model assumptions.
10.6.6 MTC Standard Financial Offer
The Massachusetts Technology Collaborative (MTC), through its Community Wind Collaborative, has developed a Standard Financial Offer (SFO) as a means of providing financing for community-scale wind projects on municipal land. Currently, the SFO consists of two elements:
• A renewable energy certificate (REC) purchase offer to support financing of the wind project. MTC has a standing offer to buy RECs from any 500 kW to 5 MW wind generating project constructed on land owned by a qualified Massachusetts municipality or municipal entity at a standard price of $40/MWh. The nominal value of the REC contract is based on the nameplate capacity of the project, as follows:
o $1.2 million/MW for projects up to 3 MW,
o An additional $400,000/MW for additional capacity up to 5 MW, and
o REC contracts capped at $4.4 million per project.
• Development support of up to $150,000 to enable the municipality to develop the project and seek development partners (developers, contractors, etc.)
RECs will be purchased by MTC from the project owner after they have been generated by the wind project. For additional details about the MTC standard financial offer, please see information available on the MTC’s web site at www.masstech.org.
NPV Turbine Size Virtual Net Metering
Probability
2,995,216$ 2.0 MW Yes P502,135,987$ 2.0 MW No P501,130,133$ 1.5 MW Yes P50
734,300$ 1.5 MW No P50 Table 15: NPV for Municipal Ownership - P50 Municipally owned wind turbine scenarios are ranked by NPV given a P50 energy production.

SCITUATE COMMUNITY WIND PROJECT FEASIBILITY STUDY
KEMA Inc. March 2008
74
10.7 Financial Model Results
10.7.1 Municipal Ownership
Under municipal ownership, Scituate would own and operate the turbine itself, taking advantage of its lower cost of capital (as compared to a private developer). The lower cost of capital is due to the lower interest rate available to the Town through tax-free municipal bonding21. However,
the Town is exposed to operations risk associated with building and operating its own power plant. All 600 kW scenarios were found to have negative NPVs on the order of $440,000 to slightly over $733,000. Each of the 1.5 MW and 2.0 MW turbine scenarios result in a positive 20-year net present value, though NPV decreases drastically with turbine size. This is primarily due to the high unit cost of capital for the 1.5 MW turbine, which has greater per kW costs than the 2.0 MW turbine.
In each of the scenarios, the greatest impact on NPV comes from virtual net-metering. With virtual net-metering, NPV and net cash flows are significantly higher. Second to virtual net-metering, probability had the greatest positive impact on NPV.
In general, high capital costs are mitigated by electricity revenues or projected savings to the Town in later project periods. The higher capacity of the 1.5 and 2.0 MW turbines leads to greater electricity revenues than the 600 kW model. The savings resulting from decreased power costs are included in the calculations of NPV to the Town. The P50 town-owned scenarios are shown in Table 15, ranked by NPV.
10.7.2 Private Ownership
In the private ownership scenarios, an independent investor would build and own the plant. A fixed-price power purchase agreement (PPA) is established, insulating the Town from increases in the price of electricity. While Scituate receives some revenues in the form of lease/host payments, the private investor retains the profits from its investment. These revenues are referred to here as PILOT (Payment in Lieu of Taxes) payments, and generally capture any lease and property tax payments paid to the Town by the developer. For purposes of the financial model, PILOT payments are assumed to total $25,000 annually (with the actual amount to be negotiated). This is why NPV does not change under different scenarios; the NPV refers to the
21 To our knowledge, no legal opinion or precedent has yet been established in Massachusetts regarding whether a town-owned Community Wind project that partially exports electricity to the wholesale power grid can issue tax free bonds to finance the full cost of that project.

SCITUATE COMMUNITY WIND PROJECT FEASIBILITY STUDY
KEMA Inc. March 2008
75
NPV of the PILOT payments made to the Town. While the NPV is not as high as the Town-owned scenarios, the Town is insulated from the risks associated with building and operating a wind turbine. The private developer benefits from tax advantages related to the Production Tax Credit and Accelerated Depreciation. The Town receives two types of revenues: one from PILOT payments and the other from the savings generated from a town’s ability to purchase power at a fixed price (compared to assumed retail prices).
Using a 10% Internal Rate of Return (IRR) as a benchmark for financial feasibility, all of the 600 kW scenarios were ruled out. IRR was found to be negative in two of the four cases for the 600 kW turbine and 1.02% for the optimal case. The 2.0 MW turbine is attractive in three of the four scenarios, with the best-case IRR being 12.18%. Only the P90 scenario without virtual net-metering does not meet the benchmark, where the IRR is 8.98%. The 1.5 MW model achieves a higher IRR when modeled with virtual net-metering, but does not exceed the 10% threshold.
Because the project is assumed to be financed through 100% equity rather than debt (i.e. the turbine is purchased outright), the private entity is rewarded with much higher cash flows than in the Town-owned model. By establishing a fixed-price contract with the developer, the Town receives a benefit in the form of a protective hedge22 against rising electricity prices, which in addition to the PILOT payments are including in the calculation of the NPV to the Town. The P50 privately-owned scenarios are ranked by IRR in Table 16. The summary of the financial model output is provided in Appendix E-3.
10.8 Conclusions
It is important to note that of the variables examined in constructing the different economic models, several remain unknown at the current time. The estimated turbine costs are rough
Developer IRR Turbine Size Virtual Net Metering
Probability NPV to Town (including hedge)
12.18% 2.0 MW Yes P50 1,611,525$ 10.61% 2.0 MW No P50 1,611,525$ 7.76% 1.5 MW Yes P50 1,183,542$ 6.63% 1.5 MW No P50 1,182,558$
Table 16: IRR for Private Ownership – P50 Privately owned scenarios are ranked by IRR for a P50 energy production.
22 A protective hedge is calculated using a starting electricity rate of $0.100 per kWh, a contract electricity rate of $0.100 per kWh, and an electricity rate escalator of 2% per year. The discount rate used is 5%, which is consistent with the discount rate used for the town modeling.

SCITUATE COMMUNITY WIND PROJECT FEASIBILITY STUDY
KEMA Inc. March 2008
76
estimates since turbine pricing is currently in flux. Also, while there is optimism about the passage of virtual net-metering legislation, the final form and full legal interpretations of such legislation are currently unknown. In particular, the ability of the project to benefit from virtual net-metering under a private ownership scenario would require further study.
Table 17 summarizes the viable economic options in order of NPV to the Town for both the virtual net-metering scenario and the current metering policy scenario. This NPV includes the expected energy hedge attained by the Town under private ownership scenarios. Of the 2.0 MW turbine scenarios, the Town reaps the greatest NPV under municipal ownership. However, it must carefully weigh the risks associated with owning and operating a turbine against the risks and effort associated with private ownership. Detailed breakdowns of the financial model outputs can be found in Appendix E-3: Financial Model Output Summary Tables.
NPV to Town (inc. hedge)
IRR Ownership Turbine Size Probability
2,995,216$ NA Town 2.0 MW P502,263,109$ NA Town 2.0 MW P901,611,525$ 12.18% Private 2.0 MW P501,458,002$ 10.39% Private 2.0 MW P901,183,542$ 7.76% Private 1.5 MW P501,130,133$ NA Town 1.5 MW P501,072,008$ 6.08% Private 1.5 MW P90
569,504$ NA Town 1.5 MW P90
NPV to Town (inc. hedge)
IRR Ownership Turbine Size Probability
2,135,987$ NA Town 2.0 MW P501,611,525$ 10.61% Private 2.0 MW P501,600,756$ NA Town 2.0 MW P901,458,002$ 8.98% Private 2.0 MW P901,182,558$ 6.63% Private 1.5 MW P501,072,008$ 5.12% Private 1.5 MW P90
734,300$ NA Town 1.5 MW P50101,684$ NA Town 1.5 MW P90
Virtual Net-Metering Scenarios
Current Metering Policy Scenarios
Table 17: Turbine Ownership Scenarios, Ranked by Net Present Value Turbine ownership scenarios are ranked by NPV for ownership, size options, and probability.

SCITUATE COMMUNITY WIND PROJECT FEASIBILITY STUDY
KEMA Inc. March 2008
77
11. Recommendations and Next Steps
11.1 Siting Recommendations
Based on its review of the physical characteristics of the WWTP property and surrounding areas, the available wind resources, interconnection issues, potential impacts, and environmental permitting issues, KEMA concludes that a utility-scale wind turbine of between 600 kW and 2.0 MW with a hub height of up to 80 meters could be erected at either site 1, in the northwestern lot of the Scituate WWTP property, or site 2, in the eastern section of the sand pit. We note that development of site 1 may require relief from or changes to the Town’s existing zoning bylaw, while site 2 is managed by the Scituate Conservation Commission, and may not be available for development.
11.2 Turbine Sizing
Proper turbine sizing begins with an economic analysis of the project. The pro forma financial review of projects using 600 kW, 1.5 MW, and 2.0 MW wind turbines demonstrates that 1.5 MW and 2.0 MW turbines could provide financial benefits to the town, while a 600 kW project is unlikely to provide such benefits. The economic analysis, standing alone, suggests that the Town should consider building a 2.0 MW project.
Looking beyond economics, the Town must decide whether the visual and noise impacts of a particular turbine at a given hub height are likely to be acceptable to the community. Further, the chosen wind turbine must function properly and efficiently in Scituate’s wind conditions. The relatively low wind speeds at the WWTP property and surrounding areas would suggest that a turbine designed for lower wind speeds would be most cost-effective. However, the high turbulence and wind shear experienced at the site may require that a more compact and robustly designed turbine be used. These issues should be discussed in detail with turbine vendors.
Finally, we note that the economics of a given project can be affected by the percentage of power that can be used on site. The financial analysis investigated the extent to which energy generated by a wind turbine could be used “behind the meter” to offset the Town’s electric bills. The potential behind-the-meter use, and thus the value of a wind turbine project, would increase significantly if virtual net-metering legislation is adopted by the legislature and implemented by utility companies. Passage of net-metering legislation is likely to improve the economics of a smaller wind energy project.

SCITUATE COMMUNITY WIND PROJECT FEASIBILITY STUDY
KEMA Inc. March 2008
78
11.3 Next Steps
Based on our review to date, KEMA recommends that the Town focus its near-term efforts on the WWTP site (site 1), which is clearly available as a site for a wind energy project. Near term steps could include:
o Providing a briefing to the Scituate Board of Selectman based on the information contained in this report;
o Reviewing the noise study;
o Making preliminary decisions regarding preferred turbine location and sizing and project ownership; and
o Considering changes to the Town’s existing wind energy conversion system bylaw in the areas of noise, using the Massachusetts Model Wind Bylaw as a reference. Specifically, the Town should consider setting allowable noise increases to 10 dB above ambient noise levels as measured at the nearest property line, consistent with DEP noise regulations.
The Town should also review the legal status of the sand pit parcel, since a project at that location could reduce noise impacts while providing similar economic benefits for the town.