Town of Nantucket Coastal Risk Assessment and Resiliency ...
157
Town of Nantucket Coastal Risk Assessment and Resiliency Strategies January 2020 Prepared For: Town of Nantucket 16 Broad Street Nantucket, Massachusetts 02554 Prepared By: Milone & MacBroom, Inc. 99 Realty Drive Cheshire, Connecticut 06410 (203) 271-1773
Transcript of Town of Nantucket Coastal Risk Assessment and Resiliency ...

Town of Nantucket Coastal Risk Assessment and
Resiliency Strategies January 2020
Prepared For: Town of Nantucket
16 Broad Street Nantucket, Massachusetts 02554
Prepared By:
Milone & MacBroom, Inc.
99 Realty Drive Cheshire, Connecticut 06410
(203) 271-1773


COASTAL RISK ASSESSMENT AND RESILIENCY STRATEGIES NANTUCKET, MA JANUARY 2020 i
Table of Contents Section Page _Toc30087102Executive Summary ................................................................................................................ i
1 Introduction .......................................................................................................................................... 1
1.1 Project Goal ................................................................................................................................... 3
2 Vulnerability and Risk............................................................................................................................ 5
2.1 Risk and Resilience Concepts ........................................................................................................ 7
2.2 Existing Conditions ........................................................................................................................ 8
2.3 Sea Level Rise .............................................................................................................................. 21
2.4 Erosion and Shoreline Change .................................................................................................... 27
2.5 Detailed Risk Assessment............................................................................................................ 33
3 Coastal Adaptation Strategies ............................................................................................................. 37
3.1 Strategies for Adaptation ............................................................................................................ 39
3.2 Adaptation Options ..................................................................................................................... 39
3.3 Shoreline Protection ................................................................................................................... 42
3.4 Community Infrastructure Protection ........................................................................................ 55
3.5 Property Protection .................................................................................................................... 60
3.6 Regulatory Tools ......................................................................................................................... 62
3.7 Procedural Tools ......................................................................................................................... 65
3.8 Public and Institutional Education .............................................................................................. 66
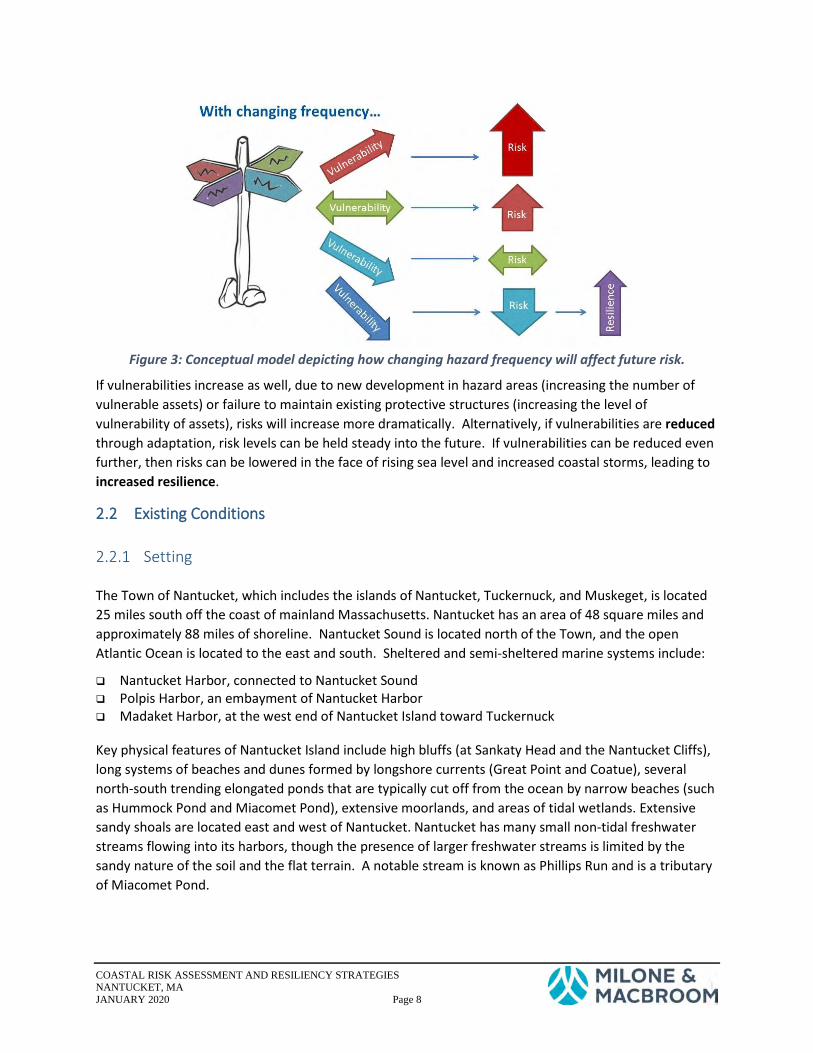
3.9 Summary of Possible Actions ...................................................................................................... 67
3.10 Resiliency Measure Preferences Identified Through Public Participation .................................. 69
3.11 Suggested Policy Considerations for Nantucket Resilience ........................................................ 71
4 Implementation and Resources .......................................................................................................... 83
4.1 Implementation Framework ....................................................................................................... 85
4.2 Funding and Resources ............................................................................................................... 86
5 References .......................................................................................................................................... 93

COASTAL RISK ASSESSMENT AND RESILIENCY STRATEGIES NANTUCKET, MA JANUARY 2020 ii
Tables Table 1: Capabilities Identified through the Online Survey ........................................................................ 18 Table 2: Summary of Historic Coastal Hazard Events Impacting Nantucket .............................................. 19 Table 3: NOAA 2017 Relative Sea Level Change Projections; Gauge 8449130, Nantucket, MA ................ 24 Table 4: MA 2018 Sea Level Projections; Nantucket, MA ........................................................................... 25 Table 5: Erosion and Accretion Rates in Selected Nantucket Coastal Transects ........................................ 31 Table 6: Vulnerable Assets and Hazards that Threaten Them .................................................................... 33 Table 7: Summary of Risk Level by Neighborhood ..................................................................................... 35 Table 8: Summary of Adaptation Options .................................................................................................. 67 Table 9: Preferred Approach to Resilience, identified by Workshop Participants ..................................... 69 Table 10: Preferred Approach to Erosion, identified by Survey Respondents ........................................... 69 Table 11: Primary Risks for Nantucket Neighborhoods .............................................................................. 70
Figures Figure 1: TNC Four Steps to Coastal Resilience. ............................................................................................ 4 Figure 2: Risk Matrix Depicting Combination of Levels of Vulnerability & Frequency ................................. 7 Figure 3: Conceptual model depicting how changing hazard frequency will affect future risk. .................. 8 Figure 4: “Planning Neighborhoods” of Nantucket, Defined for the Purposes of this Document. ............ 13 Figure 5: Observed Sea Level Data from the Nantucket Harbor Tide Gauge ............................................. 22 Figure 6: NOAA 2017 Relative Sea Level Change Projections; Gauge 8449130, Nantucket, MA ............... 25 Figure 7: MA 2018 Sea Level Projections; Nantucket, MA ......................................................................... 26 Figure 8: Conceptual Model of Implementation Framework ..................................................................... 85

COASTAL RISK ASSESSMENT AND RESILIENCY STRATEGIES NANTUCKET, MA JANUARY 2020 iii
Resources Sheets Resources Sheet 1: Nantucket Master Plan ................................................................................................ 10 Resources Sheet 2: Nantucket and Madaket Harbors Action Plan ............................................................. 16 Resources Sheet 3: Coastal Management Plan .......................................................................................... 17 Resources Sheet 4: Global and Regional Sea Level Rise Scenarios for the United States .......................... 23 Resources Sheet 5: North Atlantic Coast Comprehensive Study ................................................................ 28 Resources Sheet 6: Strategies for Adaption to Sea Level Rise .................................................................... 40 Resources Sheet 7: Sea-Level Rise & Global Climate Change: A Review of Impacts to U.S. Coasts ........... 41 Resources Sheet 8: Living Shorelines: From Barriers to Opportunities ...................................................... 45 Resources Sheet 9: Natural and Structural Measures for Shoreline Stabilization ...................................... 46 Resources Sheet 10: Urban Coastal Resilience: Valuing Nature's Role ...................................................... 47 Resources Sheet 11: Performance of Natural Infrastructure and Nature-based Measures as Coastal Risk Reduction Features ..................................................................................................................................... 48 Resources Sheet 12: Natural Defenses in Action ........................................................................................ 49 Resources Sheet 13: Coastal Wetlands and Flood Damage Reduction ...................................................... 51 Resources Sheet 14: Southern Connecticut Regional Framework for Coastal Resilience .......................... 52 Resources Sheet 15: A Guide for Incorporating Ecosystem Service Valuation into Coastal Restoration Projects ....................................................................................................................................................... 54 Resources Sheet 16: The Potential Impacts of Climate Change on Transportation ................................... 57 Resources Sheet 17: Preliminary Investigation of the Effects of Sea-Level Rise on Groundwater Levels in New Haven, CT ............................................................................................................................................ 58 Resources Sheet 18: Rolling Easements ..................................................................................................... 64 Resources Sheet 19: Assessing the Feasibility and Implications of Managed Retreat Strategies for Vulnerable Coastal Areas in Hawai’i ........................................................................................................... 72 Resources Sheet 20: Resilient DC................................................................................................................ 74 Resources Sheet 21: NYC Climate Resiliency Design Guidelines ................................................................ 76 Resources Sheet 22: The Port Authority of NY & NJ Climate Resilience Design Guidelines ....................... 77 Resources Sheet 23: Guidance for Incorporating Sea Level Rise into Capital Planning in San Francisco ... 78 Resources Sheet 24: How to Promote Resilience, Ecology, and Access at the Water’s Edge .................... 79
Appendices
A. Detailed Risk Assessment B. Paved Roads on Nantucket within Coastal Risk Zones

COASTAL RISK ASSESSMENT AND RESILIENCY STRATEGIES NANTUCKET, MA JANUARY 2020 iv
Acronyms ADCIRC - Advanced Circulation Model FEMA - Federal Emergency Management Agency FIS - Flood Insurance Study IPCC - Intergovernmental Panel on Climate Change MHHW - Mean Higher High Water MSL - Mean Sea Level NACCS - North Atlantic Coast Comprehensive Study NAVD88 - North American Vertical Datum of 1988 NFIP - National Flood Insurance Program NOAA - National Oceanic and Atmospheric Administration SFHA - Special Flood Hazard Area SWE - Stillwater Elevation TNC - The Nature Conservancy USACE - United States Army Corps of Engineers

COASTAL RISK ASSESSMENT AND RESILIENCY STRATEGIES NANTUCKET, MA JANUARY 2020 ESi
Executive Summary

COASTAL RISK ASSESSMENT AND RESILIENCY STRATEGIES NANTUCKET, MA JANUARY 2020 ESii

COASTAL RISK ASSESSMENT AND RESILIENCY STRATEGIES NANTUCKET, MA JANUARY 2020 ESiii
Setting Due to its island geography and unique geology, the Town of Nantucket and its residents have a high awareness of coastal vulnerabilities and risks. Nantucket has a great deal of experience with storm surge flooding, high winds, erosion, and intense precipitation. Three significant storm surge events in 2018, increasingly frequent nuisance flooding, and chronic erosion have underscored the risks faced by the community and highlighted the fact that property owners and municipalities bear a heavy financial burden to manage coastal hazards.
Planning Process Resilience is the ability to resist, absorb, recover from, and adapt to disasters. The goal of this Coastal Risk Assessment and Resiliency Strategies (CRARS) Report is to address the current and future social, economic, and ecological resilience of Nantucket to the impacts of sea level rise and anticipated increases in the frequency and severity of storm surge, coastal flooding, and erosion.
The CRP supplements other municipal planning documents that address climate-related hazards, in particular the Town’s Coastal Management Plan, the Nantucket Hazard Mitigation Plan (HMP) adopted in 2007 and its update adopted in 2019, and the Nantucket Municipal Vulnerability Preparedness (MVP) report prepared in 2019. The HMP is required by the Federal Emergency Management Agency (FEMA) for the municipality to be eligible for Hazard Mitigation Assistance grants, and is constrained by FEMA’s required framework, including a five-year planning time frame. The MVP process looked broadly at community vulnerabilities and resiliency actions based primarily on stakeholder input. The intention of this CRP is to:
1. Formally Assess Risk and Vulnerability using GIS mapping and projections of future conditions 2. Present a Menu of Resiliency Tools the Town can choose from to achieve resiliency goals 3. Identify Policy Changes to be considered by the Town’s Coastal Resiliency Advisory Committee
and Coastal Resiliency Coordinator, that will enable implementation of resiliency tools
The planning process was based on the coastal resilience planning process established by The Nature Conservancy (TNC). The process included a vulnerability and risk assessment, identification of existing community resiliency capabilities, review and selection of adaptation and resilience options, and public involvement in the form of two public meetings and an internet survey. See Section 1.1 for details.
Risk and Vulnerability In the context of coastal hazards, risk depends on:
The vulnerability of coastal communities and infrastructure The frequency of flooding and storm events

COASTAL RISK ASSESSMENT AND RESILIENCY STRATEGIES NANTUCKET, MA JANUARY 2020 ESiv
Coastal storms are believed to be increasing in frequency1, and flooding will increase in frequency as sea level continues to rise2. Thus, even if coastal vulnerabilities remain static, risks will increase. If vulnerabilities increase, due to development in hazard areas or failure to maintain protective structures, risks will increase more dramatically. Alternatively, if vulnerabilities are reduced through adaptation, risk can be held steady into the future. If vulnerabilities can be reduced even further, then risks can be lowered in the face of a changing climate, leading to increased resilience.
Risks and vulnerabilities on Nantucket were determined through GIS analysis, review of the HMP and the MVP stakeholder workshop, review of other municipal planning documents, discussion with Town staff, and collection of public input at meetings and through an online survey. The vulnerability and risk assessment process is described in Chapter 2 and Appendix A of this Report.
A selection of priority challenges were identified through the risk and vulnerability assessment and are described in Section 2.2.3. They include:
Storm surge flooding of the Downtown and Brant Point neighborhoods Downtown flooding during severe rain events Erosion Isolation from the mainland Fragmentation if key roads are flooded or damaged Utility system features located in risk zones Historic sites threatened by flooding or erosion Development pressure, a growing summer visitor population and increased vehicular traffic
Section 2.5 of the Report and Appendix A detail coastal threats faced by specific assets and geographies on Nantucket. Among the greatest threats to Nantucket’s shoreline, as identified in those sections, are:
Erosion of properties along the southern shore of the Town Inundation of the historic downtown area Erosion of key infrastructure along the southern shore of the Island, including two Wastewater
Treatment Plants, and the Airport Inundation and erosion of roads Erosion of beaches Loss of tidal wetlands with sea level rise The following table lists types of assets that exist on the Nantucket shoreline, and the hazards that threaten them:
1 According to the National Oceanic and Atmospheric Administration, NASA, The Intergovernmental Panel on Climate Change, and the Union for Concerned Scientists, climate change will likely lead to increased intensity of storms, including tropical cyclones (such as hurricanes). For example, see <http://www.gfdl.noaa.gov/global-warming-and-hurricanes>. 2 A tide gauge is operated by the National Oceanic and Atmospheric Administration in Nantucket Harbor. Examination of tidal data collected at this gauge from January 1965 through December 2017 show that mean sea level has been increasing at a rate of 0.14 inches (or 3.57 millimeters) per year.

COASTAL RISK ASSESSMENT AND RESILIENCY STRATEGIES NANTUCKET, MA JANUARY 2020 ESv
Asset or System Hazard or Threat Infrastructural
Roads Inundation of Low Roads or Poor Drainage Flooding Undermining by Erosion
Bridges & Culverts Inundation of Approaches Clogging of Underpasses or Culverts
Docks & Ferries Wave Damage to Structures or Boats Inundation of Facilities, Sea Level Rise
Operational Disruption
Airport Operational Disruption Erosion of Runway
Emergency Services Loss of Access Municipal Facilities Coastal Flood Inundation
Water & Wastewater
Infiltration into Pipes, Saltwater Intrusion, or Insufficient Capacity Erosion of Coastal Features & Treatment Plants
Power Loss
Energy & Communication Wind Damage to Grid
Flooding of Buried Infrastructure Flood Impacts on Response
Environmental
Great Ponds Erosion of Barrier Beaches Saltwater Intrusion from Sea Level Rise or Coastal Flooding
Fisheries & Shellfish
Rising Temperature Habitat Loss Pollution from Flooding, Erosion
Coastal Resources
Sea Level Rise & Rising Temperature Habitat Impacts Pollution from Flooding, Erosion Habitat Loss from Severe Storms
Rare Wildlife and Plants Sea Level Rise, Rising Temperature, & Erosion Habitat Impacts Societal / Cultural
Disadvantaged Groups &Social Services
Damage to Facilities or Power Loss Loss of Access
Historic / Cultural Resources
Flood, Wave, Erosion, or Wind & Debris Damage to Structure Flood Damage to Contents
Impacts from Response/Recovery
Private Properties Flood, Wave, Erosion, or Wind & Debris Damage to Structure Flood Damage to Contents
Businesses Flood, Wave, Erosion, or Wind & Debris Damage to Structure
Flood Damage to Contents Loss of Business due to Isolation
Tourism Damage to Restaurants and Stores
Damage to Natural Resources Isolation
Adaptation The Intergovernmental Panel on Climate Change (IPCC) published the landmark paper "Strategies for Adaptation to Sea Level Rise" in 1990. Three basic types of adaptation were presented in the report:
Retreat: abandonment of the coastal zone Accommodation: use of at-risk land continues, but prevention of flooding is not pursued Protection: at-risk land is protected from coastal hazards

COASTAL RISK ASSESSMENT AND RESILIENCY STRATEGIES NANTUCKET, MA JANUARY 2020 ESvi
In 2010, the National Oceanic and Atmospheric Administration (NOAA) Office of Ocean and Coastal Resource Management published Adapting to Climate Change: A Planning Guide for State Coastal Managers. The manual lists seven categories of adaptation:
Impact Identification and Assessment Awareness and Assistance Growth and Development Management Loss Reduction Shoreline Management Coastal Ecosystem Management Water Resource Management and Protection
Elements of protection, retreat, and accommodation are found in several of these categories and subcategories of adaptation.
Planning measures include emergency preparation and response, redirection of development, and procedural and financial modifications. Structural measures3 include construction of permanent or temporary flood barriers, floodproofing, and elevation of buildings. Any measures taken should be robust enough to provide adequate protection, and flexible enough to allow for adjustment under changing conditions. This typically requires a combination of methods rather than a single solution.
Site-specific measures pertain to floodproofing specific structures on a case-by-case basis. Neighborhood-scale measures apply to a specific group of buildings that are adjacent to each other. Large-scale structures might include large dike and levee systems or tide gates that can prevent tidal surge from moving upstream.
To develop a suite of viable options for the Town’s consideration, coastal resilience projects undertaken by other communities were reviewed, local physical and political factors were considered, and options were discussed with municipal officials, stakeholders, and residents.
3 Structural resiliency measures are a broader category than structural hazard mitigation measures. The following three (of the six) standard hazard mitigation categories are found within the “structural” category of resiliency actions: property protection, structural projects, and some emergency services projects.

COASTAL RISK ASSESSMENT AND RESILIENCY STRATEGIES NANTUCKET, MA JANUARY 2020 ESvii
The suite of resiliency and adaptation tools for consideration by Nantucket is described in the CRARS; these ideas are provided as a starting point only, and planning efforts by the Town are not limited to this list. These tools are summarized in the following table:
Categories of Options Specific Options
Shoreline Protection
Seawalls & Bulkheads, Groins & Breakwaters, Floodwalls & Levees Beach & Dune Management Hybrid Techniques, Bioengineered Banks, Artificial Reefs Tidal Wetland Management
Community Infrastructure Protection
Stormwater Management & Surcharge Prevention Road Elevation & Alternate Route Identification or Construction Water Supply Adaptation and Protection Sewer Pumping Station Retrofits, Wastewater Treatment Plant Protection
Property Protection Elevation, Floodproofing, Site-Scale Floodwalls, or Barriers Adaptive Re-use (Floodable Lower Floors) Property Relocation or Acquisition
Regulatory Tools Flood Damage Prevention Ordinance Modifications Zoning Regulations Modifications Rolling Easements
Procedural Tools Emergency Planning and Preparation Maintenance Planning and Operations
Public & Institutional Education Education and Training for Municipal Staff Public Meetings, Workshops, Websites, and Publications Advise Property Buyers
Suggested Policy Considerations Policy tools that can be used to guide Island-wide coastal hazard mitigation and resilience-building are presented. Specific actions are not necessarily identified; rather, frameworks to inform which actions can be pursued and when are offered. These tools are presented on the following two pages.

COASTAL RISK ASSESSMENT AND RESILIENCY STRATEGIES NANTUCKET, MA JANUARY 2020 ESviii
Suggested Policy Consideration 1: Managed Retreat Much of Nantucket’s shoreline is rapidly eroding. Protocols and precedence already exist for relocation of
threatened structures. A managed retreat policy will further empower and encourage residents to take the steps required for retreat when eroding shorelines make it necessary. The policy would also promote landward migration of tidal wetlands onto undeveloped land adjacent to existing tidal wetlands as sea levels continue to
rise. Managed Retreat Tools:
Prohibitions on new shore protection structure construction in some areas Revised zoning to protect some areas while opening others for accommodation of sea level rise or erosion Overlay zoning that prohibits protection and encourages accommodation of erosion or sea level rise Coastal setbacks that migrate inland with the shoreline Easements that restrict development within a given distance from the shoreline Buyouts of coastal property-owners Land / Density swaps or transfers of development rights that refocus development in not at-risk locations Requirements to inform buyers of flood, sea level rise, or erosion risks Rebuilding restrictions following a disaster (for example, through more stringent Substantial Damage [SD]
definitions)
Suggested Policy Consideration 2: Protection & Elevation Policy for Downtown and Brant Point Due to the significant concentration of economic, infrastructural, cultural, and other values within the
Downtown and Brant Point areas, Nantucket should develop and adopt policies for asset protection and elevation.
Considerations: Historic Preservation & Adaptation: Adopt guidelines for protection that preserves historic character. Historic Preservation & Hazard Response: Consider historic property needs during response & recovery. Access: Prioritize roads for elevation to maintain access during flood events. Street Trees: Plant saltwater-resistant trees as street trees are replaced. Business Disruption: Minimize & mitigate negative impacts of property protection on business operation. Streetscape: Preserve Downtown & Brant Point streetscapes through the adaptation process. Land Surface Elevation: Consider elevation of land surface before daily inundation risks become impossible
to manage through the above methods.
Suggested Policy Consideration 3: Design Guidance for Coastal Hazard Mitigation Infrastructure Design guidance for coastal hazard mitigation infrastructure will allow both private property owners and the
municipality to protect individual assets while integrating those actions with an Island-wide resiliency strategy. Consider existing examples from New York City and the Port Authority of New York and New Jersey.
Include: Elevation Requirements – based on local base-flood elevations and sea level rise projections. Design Best Practices –to minimize negative outcomes from construction of new coastal infrastructure. Materials – types of materials appropriate in different environments. Methods to Minimize Neighboring Impacts – such as deflected wave energy onto neighboring properties. Encouragement of Neighborhood-Scale Protection – minimize negative effects on neighboring properties. Guidelines on when to Protect, Withstand, Adapt, or Relocate.

COASTAL RISK ASSESSMENT AND RESILIENCY STRATEGIES NANTUCKET, MA JANUARY 2020 ESix
Suggested Policy Consideration 4: Beach Nourishment Beach nourishment can be an effective means of offsetting the effects of erosion for some parts of Nantucket. Many beaches around the Island are privately owned (above the high tide line), and obtaining the necessary permits for beach nourishment is a legally complicated process. The Town, working with the Conservation
Commission, can work to make this action more accessible to private property owners. Guide property owners through the permitting process. Connect owners with neighbors who may be interested in extending the nourishment project reach. Develop Guidelines about permissible beach fill types and beach profile designs.
Suggested Policy Consideration 5: Substantial Damage / Substantial Improvement Regulations
Substantial Damage is defined as any damage incurred by a structure that costs 50% or more of the value of the structure, before the damage, to repair. Substantial Improvement is defined as any project that costs 50% or more of the value of the structure before the project is begun. Floodplain regulations require that any pre-
existing, non-compliant structure that experiences Substantial Damage or undergoes a Substantial Improvement project must be brought into compliance with the most recent regulations.
Revise Substantial Improvement definition to include the cumulative costs of project occurring over a multi-year period to ensure that the threshold is reached sooner for any given structure.
Suggested Policy Consideration 6: Resilience Plan for Public Ferries
Coastal hazards and climate change pose a risk to the community’s ability to transport people, goods, and supplies to and from mainland Massachusetts by way of ferries docking in Nantucket Harbor. Weather-related
interruptions to ferry services may increase with climate change and sea level rise. Nantucket can develop a resilience plan for off-island transportation and collaborate with mainland facilities.
Include: Adaptation of port facilities: so that they continue to be usable as sea level continues to rise Secondary port locations: so that ferries or replacement ships can continue to travel to the Island Emergency travel contingencies: such as temporarily using air transportation Coordination with connecting communities: to make sure ferry travel is resilient at both ends of the route
Suggested Policy Consideration 7: Municipal Facilities
Key municipal facilities located in at-risk areas may need to be relocated over time. Consider:
Further identification of at-risk facilities Relocation of facilities over the long-term Relocation of key documents or equipment on the short term Emergency plans in case flooding occurs before relocation can be implemented
Suggested Policy Consideration 8: Business Resilience
Nantucket’s business community is essential to the Town’s economic health, and many of those businesses are at risk from coastal hazards. Nantucket can work with business owners to identify business resiliency needs and barriers, create a regulatory framework that encourages businesses to take resiliency actions, and provide other
incentives, assistance, and support. Consider:
Structural Risk Reduction: actions that increase the resilience of a business’s physical site. Operational Risk Reduction: actions that increase the ability for a business to continue operations. “Fallout” Risk Reduction: actions that minimize the impacts of interruption, damage, or revenue loss.

COASTAL RISK ASSESSMENT AND RESILIENCY STRATEGIES NANTUCKET, MA JANUARY 2020 ESx

COASTAL RISK ASSESSMENT AND RESILIENCY STRATEGIES NANTUCKET, MA JANUARY 2020 Page 1
1 Introduction

COASTAL RISK ASSESSMENT AND RESILIENCY STRATEGIES NANTUCKET, MA JANUARY 2020 Page 2

COASTAL RISK ASSESSMENT AND RESILIENCY STRATEGIES NANTUCKET, MA JANUARY 2020 Page 3
As an island community, the Town of Nantucket places a high value on advancing resilience in the face of coastal storms and climate change. Nantucket has a great deal of experience with coastal hazards. These events interrupt daily life, damage low-lying assets, cause temporary isolation from the mainland, and reconfigure the Nantucket map. Recent significant storm events (such Hurricane Sandy in 2012, Hurricane Jose in 2017, Winter Storm Grayson in 2018, and Winter Storm Riley in 2018), increasingly frequent flooding during astronomical high tides, ongoing coastal erosion, and consistently updated State and Federal climate change projections have underscored the risks associated with occupying coastal areas. Property owners and the Town bear a heavy financial burden to recover from these types of events.
Nantucket has been proactive with regards to planning for natural hazards, coastal and community resilience, and climate change. This Coastal Risk Assessment and Resiliency Strategies Report (CRARS) has been developed as a toolbox to build coastal resilience in the coming years.
1.1 Project Goal Resilience is the ability to resist, absorb, recover from, and adapt to disasters. Coastal Resilience, referring specifically to disasters arising from coastal hazards such as sea level rise, increased flooding, and more frequent and intense storm surges, can be achieved by decreasing coastal vulnerabilities (and likewise, decreasing risks) through increased planning and adaptation.
The overall goal of this strategy report is to create a set of resources Nantucket can use to address the current and future social, economic, and ecological resilience of the Town’s shoreline to the impacts of sea level rise and anticipated increases in the frequency and severity of storm surge, coastal flooding, and erosion.
The planning process was loosely based on the coastal resilience planning process established by The Nature Conservancy (TNC) (http://coastalresilience.org/approach/, see Figure 1). The five steps of the process Nantucket is taking, adapted from TNC, are:
1. Assess Risk and Vulnerability, including alternative current and future storm and sea level rise scenarios with community input
2. Identify Tools, focusing on integrative tools across social, economic and ecological systems 3. Prioritize Strategies and actions to address key vulnerabilities 4. Take Action at key sites to help communities identify and implement solutions 5. Measure Effectiveness to ensure efforts are successful
This Report focuses on steps one, two, and three.

COASTAL RISK ASSESSMENT AND RESILIENCY STRATEGIES NANTUCKET, MA JANUARY 2020 Page 4
Figure 1: TNC Four Steps to Coastal Resilience.
Image from www.reefresilience.org
The specific planning process for the CRARS included a vulnerability and risk assessment, review and selection of adaptation and resilience options, and public involvement in the form of two public workshops and an internet-based survey.
Nantucket has undertaken the State’s Municipal Vulnerability Preparedness (MVP) planning process to achieve additional goals relative to resilience planning. The MVP Planning Grant Program is designed provide support to communities to complete climate change vulnerability assessments and develop action-oriented resiliency plans. The program provides funding for communities to run Community Resiliency Building (CRB) workshops with local stakeholders. Each municipality that completes this process and develops a final report is designated as an “MVP Community.”
Nantucket conducted an 8-hour CRB workshop on January 8, 2019 with fifty-one stakeholders representing local neighborhood associations, recreation clubs, conservation associations, historic and cultural resource organizations, small businesses, tourism associations, land stewards, municipal departments, and more.
The workshop’s objectives were as follows:
Characterize primary climate-related hazards faced by Nantucket Identify the community’s strengths and vulnerabilities Come to agreement on the top-priority actions for the community
The results of the MVP process have informed much of this Report.

COASTAL RISK ASSESSMENT AND RESILIENCY STRATEGIES NANTUCKET, MA JANUARY 2020 Page 5
2 Vulnerability and Risk

COASTAL RISK ASSESSMENT AND RESILIENCY STRATEGIES NANTUCKET, MA JANUARY 2020 Page 6

COASTAL RISK ASSESSMENT AND RESILIENCY STRATEGIES NANTUCKET, MA JANUARY 2020 Page 7
2.1 Risk and Resilience Concepts In the context of hazards, risk is the product of vulnerability and frequency4. Here, vulnerability refers to the number of people, structures, and infrastructure vulnerable to a hazard event, as well as the degree to which those assets are incapable of withstanding the effects of that event.
The frequency with which a particular event occurs, combined with level of vulnerability to that event, determines the risk posed by that event.
This combination can be simplified into the following possibilities:
Low Vulnerability and Low Frequency = Low Risk Low Vulnerability and High Frequency = Moderate Risk High Vulnerability and Low Frequency = Moderate Risk High Vulnerability and High Frequency = High Risk
Vulnerability Low Med High
Freq
uenc
y Lo
w
Minimal Risk Low Risk Moderate
Risk
Med
Low Risk Moderate Risk High Risk
High
Moderate Risk High Risk Extreme
Risk
Figure 2: Risk Matrix Depicting Combination of Levels of Vulnerability & Frequency
In the context of coastal hazards, risk depends on: The vulnerability of coastal communities and infrastructure The frequency of flooding and storm events
Coastal storms are believed to be increasing in frequency, and flooding will increase in frequency as sea level continues to rise. Thus, even if coastal vulnerabilities remain static, risks will increase.
4 Some resources include a third variable, “consequence,” to the equation. This expanded equation is typically reserved for assessments focused on specific infrastructure.
Risk = Vulnerability X Frequency
COASTAL RISK ASSESSMENT AND RESILIENCY STRATEGIES NANTUCKET, MA JANUARY 2020 Page 8
Figure 3: Conceptual model depicting how changing hazard frequency will affect future risk.
If vulnerabilities increase as well, due to new development in hazard areas (increasing the number of vulnerable assets) or failure to maintain existing protective structures (increasing the level of vulnerability of assets), risks will increase more dramatically. Alternatively, if vulnerabilities are reduced through adaptation, risk levels can be held steady into the future. If vulnerabilities can be reduced even further, then risks can be lowered in the face of rising sea level and increased coastal storms, leading to increased resilience.
2.2 Existing Conditions 2.2.1 Setting The Town of Nantucket, which includes the islands of Nantucket, Tuckernuck, and Muskeget, is located 25 miles south off the coast of mainland Massachusetts. Nantucket has an area of 48 square miles and approximately 88 miles of shoreline. Nantucket Sound is located north of the Town, and the open Atlantic Ocean is located to the east and south. Sheltered and semi-sheltered marine systems include:
Nantucket Harbor, connected to Nantucket Sound Polpis Harbor, an embayment of Nantucket Harbor Madaket Harbor, at the west end of Nantucket Island toward Tuckernuck
Key physical features of Nantucket Island include high bluffs (at Sankaty Head and the Nantucket Cliffs), long systems of beaches and dunes formed by longshore currents (Great Point and Coatue), several north-south trending elongated ponds that are typically cut off from the ocean by narrow beaches (such as Hummock Pond and Miacomet Pond), extensive moorlands, and areas of tidal wetlands. Extensive sandy shoals are located east and west of Nantucket. Nantucket has many small non-tidal freshwater streams flowing into its harbors, though the presence of larger freshwater streams is limited by the sandy nature of the soil and the flat terrain. A notable stream is known as Phillips Run and is a tributary of Miacomet Pond.

COASTAL RISK ASSESSMENT AND RESILIENCY STRATEGIES NANTUCKET, MA JANUARY 2020 Page 9
The Nantucket Master Plan (accepted April 6, 2009; refer to the next page) lists the following natural features as being of specific interest to the community:
Beaches and the rare species for which those dynamic areas are habitat Nantucket Harbor, including the shellfish beds within it The Great Ponds, including Sesachacha, Miacomet, and Hummock Ponds Five Scenic Landscapes as designated by the Massachusetts Department of Conservation and
Recreation (DCR) o Coatue and parts of Great Point o Middle Moors and eastward, including Sesachacha Pond and Sankaty Golf Club o Eel Point eastward to Dionis o Smith’s Point and Esther Island o Tuckernuck and Muskeget Islands
The Master Plan also highlights Nantucket’s renewable energy resources such as wind, solar, wave power, and tidal action. The critical cultural resources of the community are specifically called out as well; the entire island is designated as a Historic District by the State and a Historic Landmark by the Federal government, and there are nearly 3,000 individual historic buildings, sites, lighthouses, burial grounds and archaeological sites on the Island (based on the Massachusetts Cultural Resource Information System; MACRIS, 2019).
By nature of Nantucket’s geography, all of these resources are connected to coastal processes to varying degrees, and will be important to consider for long-term resilience planning. The Master Plan and associated area plans promote open space preservation and discourage development encroachment on shorelines, instead focusing future growth in the Mid-Island neighborhood. The Plan notes that the One Big Beach Program protects public access to beaches, and a Beach Management Plan encompasses all Town-owned and managed beaches on the island and encourages implementation of the Harbor Management Plan and Coastal Management Plan.
“Planning Neighborhoods”
For the purposes of this report, Nantucket was broken into a series of “Planning Neighborhoods” based on municipal electric districts, the sectors identified in the Nantucket Coastal Management Plan, commonly used names for areas, and geologic patterns. These Planning Neighborhoods are intended only as a communication tool within this Report to describe geographical patterns of risk and vulnerability. The Planning Neighborhoods are as follows: Downtown – the dominant working waterfront of Nantucket, on the western end of Nantucket
Harbor, this area includes both public ferry terminals and the Town Pier. As defined here, the “Downtown” extends from near the intersection of Union Street and Orange Street to the south (near Consue Spring) to near the intersection of Cliff Road and Madaket Road to the west, to West Chester Street and Easton Street to the North. The neighborhood includes the downtown commercial area, Town Offices and the Town Archives building.
Brant Point – the peninsula that extends eastward to form the northwestern boundary of Nantucket harbor, and the western side of the harbor mouth. As defined here, “Brant Point” includes the area between Easton Street to the south and Bathing Beach Road to the northwest. This neighborhood includes the Coast Guard facility, and is made up primarily of single-family homes.

The Nantucket Master Plan identifies the Downtown neighborhood as the “symbolic center” of the Island, and the Mid-island area as a node for current and future growth and development.
• Beaches, the harbor, the great ponds, and scenic landscapes are noted as critical natural resources.
• The State-designation as a Historic District, the Federal designation as a Historic Landmark, and the plentiful historic buildings, sites, lighthouses, burial grounds and archaeological sites are specifically called out as cultural resources.
Actions relevant to resilience include:
• Protect shorelines from encroachment.• Prioritize land acquisition and conservation restrictions in
floodplains and wetland buffers.• Implement Harbor Management Plan and Coastal
Management Plan.• Construct new fire and police facilities• Protect beaches, dunes, and coastal banks with
environmentally responsible technologies .
The plan is supplemented by plans that guide development in Madaket, Mid-Island, Siasconset, Tom Nevers, Surfside, Naushop Crossing, and Brant Point. The plans include numerous actions, many addressing development patterns and some specifically highlighting erosion challenges.
The Master Plan is scheduled to be updated soon; Nantucket will benefit from incorporation of information from the Coastal Risk Assessment and Resiliency Strategies report into the updated document.

COASTAL RISK ASSESSMENT AND RESILIENCY STRATEGIES NANTUCKET, MA JANUARY 2020 Page 11
Cliff Road – covers most of the northern coast of the west side of Nantucket, from Bathing Beach
Road to the east to near the intersection of Cliff Road and Madaket Road to the west. The “Cliff Road” neighborhood extends inland to the south to West Chester Street. The coastal area is defined by eroding bluffs. The neighborhood is made up of single-family homes. Includes the Nantucket Landfill.
Maddequet/Eel Point – includes the northwestern edge of Nantucket, from the intersection of Cliff Road and Madaket Road (at Capaum Pond Road) to the east along a line south of Madaket Road and Creek Lane to the south, to Eel Point and Warrens Landing to the west.
Madaket – encompasses Madaket Harbor and the surrounding neighborhood, from south of Creek Lane to the north, to Long Pond to the east, to (but not including) Smith Point to the west. Includes Madaket Marine, Little Neck, Millie’s Bridge, and the Massachusetts Ave boat launch.
Smith Point – the southwestern-most corner of Nantucket Island, including Esther Island, connected to Madaket by “Millie’s Bridge.” This area has only a few private homes and no paved roads. A public boat launch is at the northern end of Massachusetts Avenue in this neighborhood.
Sheep Pond Road – the south shore of Nantucket east of Long Pond and west of Hummock Pond (including Clark’s Cove). The neighborhood extends north to near the intersection of Massasoit Bridge Road and Red Barn Road.
Cisco/Hummock Pond – extends from the western bank of Hummock Pond to the west to Somerset Road to the east. Inland to the north, the neighborhood is bounded by Somerset Road and Bartlett Farm Road, extending northward to encompass Hummock Pond. This neighborhood includes much of the Miacomet Golf Course green but does not include its buildings; it does include the buildings and greenhouses of Bartlett’s Farm.
Moors – a mostly undeveloped area that includes grasslands and forestlands between Long Pond and Hummock Pond, south of the Nantucket Landfill and north of Clark Cove.
Miacomet – a relatively small “Planning Neighborhood,” this area encompasses Miacomet Pond and its surroundings, from Somerset Road to the west, north into the northeastern part of the Miacomet Golf Club, east to the intersection of Miacomet Road and Sherburne Commons. The eastern boundary of the neighborhood extends almost directly south from that intersection, including the Pondview Drive neighborhood while excluding the roads off the west side of South Shore Road, and hitting the west edge of the South Shore Wastewater Treatment Plant.
South Shore/Surfside – bounded to the north by a line running from the intersection of Miacomet Avenue and Otokomi Road east through the intersection of Miacomet Road and Surfside Road to the intersection of Rugged Road and Wood Lily Road. The boundary then bends to follow Rugged Road to Lovers Lane, then runs south to the edge of the airport property at Adams Street. Bounded to the west by the Miacomet neighborhood. Includes the South Shore Wastewater Treatment Plant, Shelburne Commons Assisted Living Facility, and a number of commercial areas.
Airport – this neighborhood includes the airport and the commercial and industrial areas around it (as well as some residential areas). Covers the area from Rugged Road to the west, Pout Pond Road to the North (north of Milestone Road and Tetawkimmo Drive), and Russells Way to the east.
Tom Nevers/Southeast Quarter – encompasses the area south of Milestone Road from Russel Way to Polpis Run. Includes Tom Nevers Field and a public beach, as well as a residential neighborhood.
Siasconset – also called ‘Sconset, this is the easternmost area of the Island, between Sesachacha Pond to the north and Phillips Run to the south. It includes the ‘Sconset Wastewater Treatment Facility, a US Coast Guard facility, the Siasconset Historic District, and a small retail area. A coastal path called the Bluff Walks is a popular tourist attraction.
Quidnet – a small neighborhood at the north end of Sesachacha Pond, east of Polpis Road and south of Squam Pond. Includes large residential properties and a hotel.

COASTAL RISK ASSESSMENT AND RESILIENCY STRATEGIES NANTUCKET, MA JANUARY 2020 Page 12
Wauwinet – extends north from Squam Pond on Squam Road, and north of Pocomo Road on Wauwinet Road, with most properties near the intersection of those two roads. The neighborhood stops at the northernmost house on Wauwinet Road / Great Point Road.
Pocomo – a small peninsula that reaches into Nantucket Harbor at the harbor’s eastern end, this neighborhood consists of those properties located off of Pocomo Road and Medouie Creek road, bounded by the Pocomo Meadow tidal wetland to the south and west, and by Squam Swamp to the east.
Polpis – includes the area along Polpis Road, south of Nantucket Harbor, from Poor Richards Way to the east to Quaise Road and Altar Rock Road to the west.
Shawkemo/Quaise – includes the area along Polpis Road, south of Nantucket Harbor, from Quaise Road to Gardner Road.
Monomoy – includes the area along Polpis Road, south of Nantucket Harbor, from Gardner Road to Monomoy Road, extending south to Old South Road at Forrest Avenue.
Mid-Island – the northern edge of this neighborhood is bounded by Monomoy to the east and Downtown to the northwest. It extends westward just north of Hummock Pond Road, Hawthorne Lane, and Burnt Swamp Lane, then south along Bartlett Farm Road to the intersection of West Miacomet Road and Somerset Road. The boundary extends back east until Dooley Court. This neighborhood includes denser residential areas, including multi-family dwellings, as well as retail and commercial properties. Nantucket Town Offices and the Public Safety Building are in Mid-Island.
Coatue/Great Point – this area refers to the uninhabited wildlife refuge, managed by the Trustees of Reservation, that encompasses the entirety of the sandy barrier beach bounding Nantucket Harbor to the north. Unpaved roads exist here but minimal other human infrastructure is present.
Middle Pasture/Folger Hill – this area is primarily conservation land, located between Polpis Road to the north and Milestone Road to the south. It includes a limited number of residential properties.
Tuckernuck – the island of Tuckernuck lies west of the main island of Nantucket. The entire island is owned by private property owners, contains approximately 35 homes, and is typically uninhabited except during the summer vacation season. The island has no paved roads or public utilities.
Muskeget – the uninhabited island of Muskeget is located west of Tuckernuck. Risks for this area are minimal because it is a natural area without human habitation or infrastructure; taking no action is the recommended resiliency strategy for the island.

23
24
113
12
13
8
65
10
21
16
14
7
2
9
41917
22
15
18
1
20
1, Brant Point
2, Downtown
3, Mid-Island
4, Monomoy
5, Shawkemo/Quaise
6, Polpis
7, Pocomo
8, Wauwinet
9, Quidnet
10, Siasconset
11, Milestone Road
12, Tom Nevers/Southeast Quarter
13, Airport Area
14, South Shore/Surfside
15, Miacomet
16, Cisco/Hummock Pond
17, Moors
18, Sheep Pond Road
19, Madaket
20, Smith Point
21, Maddequet/Eel Point
22, Cliff Road
23, Coatue/Great Point
24, Tuckernuck

COASTAL RISK ASSESSMENT AND RESILIENCY STRATEGIES NANTUCKET, MA JANUARY 2020 Page 14
2.2.2 Planning Capabilities A suite of existing regulations, plans, projects, and programs within the Town of Nantucket relate to, address, or are otherwise pertinent to the Town’s pursuit of becoming a more resilient coastal community. This plan acknowledges the contribution that these resources make to Nantucket’s resilience capabilities, and was designed to work with these existing documents and actions. These resources include the following: Nantucket Zoning Bylaws – includes ordinances protecting coastal areas, open space, and wetlands,
and zoning regulations limiting construction in flood hazard zones. Nantucket Subdivision Regulations – requires subdivisions be designed to minimize natural hazard
risks and protect utilities. Nantucket Wetland Protection Regulations (2013) – defines standards and procedures for
implementation of the Nantucket Bylaw for Wetlands by the Town of Nantucket Conservation Commission. These regulations identify wetland areas and address development, pollution, invasive species, and other activities that may negatively impact wetlands.
Nantucket Master Plan (2009) – identifies Mid-Island as a node for growth, highlights natural and historic resources, prioritizes protection of flood and wetland areas, and calls for implementation of the Harbor Management Plan and Coastal Management Plan. The Master Plan is scheduled to be updated soon; the Town intends to incorporate information from this report into the updated document.
Area Plans (2003-2014) – Area Plans supplement the Master Plan and identify hazard concerns and mitigation opportunities, growth potential, and conservation goals in the neighborhoods of Brant Point, Madaket, Mid-Island, ’Sconset, Tom Nevers, Surfside, and Naushop Crossing.
Nantucket and Madaket Harbors Action Plan (2009) - presents the vision for use and development within the harbor areas; encourages protecting coastal natural resources, limiting development along the shoreline in flood risk areas, and maximizing the navigation capacity of the harbors.
Comprehensive Emergency Management Plan (2013) – lays out responsibilities and actions for hazard response and recovery
Coastal Management Plan (2014) – establishes priorities and procedures for protecting and managing Town-owned infrastructure, public access points, and roads adjacent to the coastline. Breaks the coastline into sectors (referenced in the “Planning Neighborhoods” for this document) and presents recommended actions for each.
Storm Surge and Critical Infrastructure on Nantucket (2015) – a project by Worcester Polytechnic Institute (WPI) undergraduate students that analyzes risks posed by storm surge for critical infrastructure, and presents recommended mitigation actions. A set of GIS layers depicting flood risks and stormtide pathways was also prepared.
Nantucket Hazard Mitigation Plan (2019) – an update of the Town’s initial plan (adopted in 2007), this identifies the community’s vulnerabilities with regards to natural hazards, capabilities for mitigating and responding to those hazards, and recommended actions to improve those capabilities over the next five years. Hazards addressed are flooding, hurricanes and tropical storms, sea level rise and shoreline change, summer storms and tornadoes, winter storms, wildfires, and earthquakes.
Municipal Vulnerability Preparedness Report (2019) – presents findings on hazards, community strengths and vulnerabilities, and priority resilience-building actions identified during a stakeholder workshop held on January 8, 2019.

COASTAL RISK ASSESSMENT AND RESILIENCY STRATEGIES NANTUCKET, MA JANUARY 2020 Page 15
Capital Improvement Plan (annual) – lists all capital projects planned over the next ten years, many of which are relevant to coastal resiliency, including facility upgrades, improvements to mapping capabilities, and infrastructure and utility projects.
Wannacomet Water Salt Water Intrusion Model – the Wannacomet Water Company is studying threats to the Island’s aquifer from saltwater intrusion, and the potential exacerbation of that threat due to climate change.
Additionally, the Commonwealth of Massachusetts and the Federal Government have conducted studies and produced reports that have informed this plan. These include:
Report of the Massachusetts Coastal Erosion Commission (2016) – used high resolution coastal elevation data, historical aerial photography, and delineations to determine short-term and long-term coastal erosion or accretion rates, based on changes in Mean High Water lines.
Global and Regional Sea Level Rise Scenarios for the United States (2017) – technical report published by NOAA presenting regional relative sea level rise projections for United States coasts.
Massachusetts Integrated State Hazard Mitigation and Climate Adaptation Plan (SHMCAP, 2018) – provides information on natural hazard risks across the Commonwealth.
Massachusetts Climate Change Projections (2018) – presents Massachusetts-specific climate change projections for temperature, precipitation, and sea level rise on the major drainage basin scale. Developed by the Northeast Climate Adaptation Science Center out of the University of Massachusetts, Amherst. Accessed through the Resilient MA Climate Clearinghouse, resilientMA.org, a resource created specifically to support the Massachusetts Municipal Vulnerability Preparedness program.
Massachusetts Coastal Bank Erosion Hazard Mapping (2019) – used high resolution coastal elevation data, historical aerial photography, and bank delineations to quantify the extent of erosion of tops-of coastal banks in recent decades. This dataset captures bluff erosion more effectively than the Coastal Erosion data.
Most of Nantucket’s relevent municipal planning documents recognize erosion, coastal storms, and sea level rise as key issues in need of consideration. The studies that have been, and will continue to be, performed by the Town, academic institutions, the Commonwealth, and other parties add to the base of knowledge in Nantucket with regard to future conditions, vulnerabilities, and adaptation options. Monitoring the state of these projects and plans, ensuring collaboration and communication between the responsible entities, and building on this baseline to fill knowledge and implementation gaps, will be essential in creating a resilient community.

This plan presents the vision for use and development within the harbor planning areas. Goals include protecting and restoring valuable natural resources, preserving and promoting water-dependent uses, and promoting safe operations and uses.
Specific recommendations include:
• Repair and raise jetties at harbor entrance.• Relocate fuel facilities away from downtown.• Study feasibility of developing a second
commercial dock capable of handling large vessels in an emergency.
• Evaluate alternatives for addressing loss of vessel access to harbor, including improving icebreaking capabilities and establishing temporary off-loading facilities.
• Maintain haul-out capacity at levels that will allow for the safe and timely removal of boats from the water in an emergency.
• Investigate developing a new boat ramp at the south end of town.
• Formalize boat hauling coordination before a storm between the Department of Marine and Coastal Resources and local businesses.

This plan establishes priorities and procedures for protecting and managing town-owned infrastructure, public access points, and roads adjacent to the coastline. Coastal Management principles address debris management, erosion control funding and insurance, and minimizing adverse impacts of erosion control projects.
The plan breaks Nantucket’s coastline into a series of sectors and presents a suite of recommended actions for each sector. Many actions are repeated as recommendations in multiple sectors. Sector-specific actions are condensed into a set of action items such as:
• Monitor erosion and establish points that, when reached by erosion, trigger action
• Establish emergency access routes• Develop structure maintenance plans• Develop sand management plans• Perform vulnerability studies• Identify erosion exacerbated by adjacent
land use conditions• Assess regulations• Update Hazard Mitigation Plan

COASTAL RISK ASSESSMENT AND RESILIENCY STRATEGIES NANTUCKET, MA JANUARY 2020 Page 18
Capabilities Identified through Public Participation
An online survey was used to solicit input from the public on a variety of topics related to this project. One question asked respondents what strengths they felt already exist within Nantucket to make the community resilient. Open ended responses were analyzed and categorized. Results are presented in Table 1.
Table 1: Capabilities Identified through the Online Survey
Feature # Mentions Experience and Skills 12 Community and Culture 11 Strong Economy and Municipal Spending 9 Residents 9 Education, Awareness, and Knowledge 8 Enthusiasm and Care about Resiliency 7 Municipal Planning Capabilities 6 Natural Features and Resources 5 Small Community 5 Flexibility of the Community 4 Protected or Well-Built Buildings 4 Municipal Operational Capabilities 3 Emergency Response Capabilities 2 Environmental Groups 2 Geographical Protections 1 Robust or Redundant Infrastructure 1 Preparation Operations 1 Regulations 1 Structural Protections 1
2.2.3 Challenges Nantucket possesses significant experience with coastal hazards including storm surge flooding, high winds, erosion, and precipitation. For this island community, such events mean not only interruptions to daily life and damages to low-lying assets, but temporary isolation from the mainland and potential long-term reconfiguration of the Nantucket map. The 2019 Nantucket Hazard Mitigation Plan (HMP) presents historic records of natural disaster events, including coastal flooding, hurricanes and tropical storms, and erosion events. An abbreviated selection of those events is summarized below.

COASTAL RISK ASSESSMENT AND RESILIENCY STRATEGIES NANTUCKET, MA JANUARY 2020 Page 19
Table 2: Summary of Historic Coastal Hazard Events Impacting Nantucket
Date Event Impact Summary
September 3 2010
Tropical Storm Earl
Tropical storm force winds and high surf Madaket Beach submerged Seawater overtopped beach and entered Long Pond At least $20,000 in property damage
August 28 2011
Tropical Storm Irene
Trees downed across Nantucket Sustained winds of 48 to 63 miles per hour At least $30,000 in property damage
October 29 2012
Hurricane Sandy
High winds and coastal flooding Broadway and streets east impassable Damage at the harbor marina Straight Wharf flooded
February 9 2013
Blizzard of 2013
Very strong winds, snow, storm surge Easy Street and Washington Street flooded up to three feet Beach Street flooded up to two feet Wauwinet Road near East Fire Springs Road flooded Water up to Nantucket Hotel on Easton Street in Brant Point Main Street flooded to Club Car Restaurant Significant beach erosion occurred
March 7 2013
Coastal Flood
Hulbert Avenue, Washington, Broad, Easton, and Easy Streets impassable Sheep Pond Road flooded Building foundation eroded
January 3 2014
Coastal Flood
Several roads along Nantucket Harbor flooded Easy, Broad, and Washington Street impassable
March 26 2014
Coastal Flood Flooding at Straight Wharf, on Easy Street, and in Brant Point
November 2 2014
Coastal Flood Easy Street closed
January 27 2015
January 2015 Blizzard
Very strong winds Moderate to major coastal flooding Flooding on north and northeastern facing beaches Three and a half feet of ocean water flooded the downtown Francis Street at Union Street, Washington Street from Commercial Street and Easy Street, Broad Street from Easy Street to South Water Street, and South Beach Street closed Parts of Brant Point flooded Town pier severely damaged Structural damage and seawall failure occurred
February 15 2015
Snow Storm
Heavy snow Minor flooding at Children's Beach boat ramp Barrier beach at Folger's Marsh breached Francis Street closed at Union Street Washington Street closed from Commercial Street to Francis Street
January 24 2016
Coastal Flood
Flooded boat ramps in Madaket Easy Street flooded 4 to 12 inches
February 8 2016
Coastal Flood
Front yards on Washington Street flooded Easy Street, lower Broad Street, Commercial Street flooded Several roads in Brant Point closed Traffic circle at Easton Street and Hulbert Avenue impassable

COASTAL RISK ASSESSMENT AND RESILIENCY STRATEGIES NANTUCKET, MA JANUARY 2020 Page 20
Date Event Impact Summary
September 5 2016
Named Storm Hermine
Rain and below-tropical-storm force winds Some wind damage to trees Multiple small boats sunk or dragging-anchor in Nantucket Harbor
August 16 2017 Erosion 12-foot waves on south shore
Strong rip currents
September 21 2017
Tropical Storm Jose
Strong wind gusts and heavy downpours Rainfall reached about 6 inches Minor coastal flooding Four sailboats sunk due to rainfall Several boats washed ashore
October 30 2017
Tropical Storm Philippe
Winds and waves on western coastline Waves and swells washed over head of Hither Creek Wetland filled with sand
January 3-5 2018
Winter Storm Grayson
Rain, wind, and coastal flooding Low-lying areas of Downtown flooded Easton Street flooded four feet Homes on Washington Street shifted on foundations More than 20 people rescued At least two families displaced Town opened the emergency shelter
January 30 2018
Coastal Flood
Storm surge and snow Easy Street, Easton Street, and Washington flooded.
March 2-4 2018
Winter Storm Riley
Storm surge lasted multiple tide cycles Buildings sustained flood damage High winds and waves caused erosion and direct impact to buildings Many roads impassible Brant Point isolated, cut off at Easton Street and Cobblestone Hill Sesachacha Pond breached Polpis Road overtopped, undermined Scouring at Madaket Road Erosion at Children’s Beach
Challenges have been identified through the coastal risk assessment process and supplemented by the separate Nantucket MVP process and through development of the 2019 HMP. A brief summary of those findings is presented here: Low-lying areas of the Downtown and Brant Point neighborhoods experience flooding from storm
surge during coastal storm events. Five of the top ten flood elevations measured in Nantucket history occurred in the first three months of 2018.
Downtown experiences flooding due to undersized and/or antiquated drainage during severe rain events; this is exacerbated if the event occurs during high tide and drainage is hindered by high water levels at wastewater outfalls.
Erosion is an ever-present challenge in many parts of the island. Homes have had to be demolished or relocated, roads and other infrastructure have been abandoned or rerouted, and major landmarks have been moved away from the shoreline. Erosion is expected to impact Nantucket’s wastewater treatment leachfields, as well as the southern end of the Nantucket Airport runway, in the future, and response strategies have been developed for both assets. Erosion has been identified as one of the top concerns of Nantucket residents.

COASTAL RISK ASSESSMENT AND RESILIENCY STRATEGIES NANTUCKET, MA JANUARY 2020 Page 21
Severe weather events frequently force travel between the Island and the mainland to cease, isolating the Town.
Key roads and bridges are at risk from coastal hazards; roads or bridges being undermined by erosion or inundated by flooding threatens to fragment the community. This adds to the frustrations of being isolated from the mainland.
Many essential features of the Nantucket utility system are located in risk zones, including sewer pump stations and water and sewer pipes. There is some risk to the Island’s electric grid because all its electricity comes from the mainland through underwater conduits that enter the Town through Brant Point. Increasing the community’s energy independence, resiliency, and redundancy is of interest to many residents.
Nantucket has hundreds of historic properties and sites that are threatened by flooding or erosion, and appropriate mitigation actions are more limited for these features.
Flood mitigation structures are often implemented in piecemeal fashion by individual property owners, leading to inconsistent levels of protection along the shoreline.
Nantucket is facing development pressures as well as a growing summer visitor population and increased vehicular traffic; these forces have negative impacts on natural systems and can lead to increased runoff and pollution into coastal natural features, and erosion of those features.
2.3 Sea Level Rise 2.3.1 Existing Conditions and Historic Trends A tide gauge is operated by NOAA within Nantucket Harbor, on the Steamship Wharf. This gauge has been operating since January 1, 1965.
According to data collected by this gauge (available online at tidesandcurrents.noaa.gov), the mean sea level (MSL) in Nantucket Harbor is negative (-) 0.32 feet, or 0.32 feet below the North American Vertical Datum of 1988 (NAVD88). The average maximum elevation of high tide (mean higher-high water (MHHW) is 1.80 feet above the MSL, or 1.48 feet elevation, NAVD88.
Examination of fifty-two years of tidal data collected at this gauge (from January 1965 through December 2017) show that MSL has been increasing at a rate of 0.14 inches (0.0117 feet, 3.57 millimeters) per year. These observations and trends are summarized in
Figure 5.
Sea Levels on the Nantucket shoreline have been rising 14 inches
per 100 years.

COASTAL RISK ASSESSMENT AND RESILIENCY STRATEGIES NANTUCKET, MA JANUARY 2020 Page 22
Figure 5: Observed Sea Level Data from the Nantucket Harbor Tide Gauge
2.3.2 Sea Level Projections Global Sea Level Rise
In its landmark 2001 report, the Intergovernmental Panel on Climate Change (IPCC) projected that global sea level may rise nine to 88 centimeters (0.30 - 2.89 feet) during the 21st century. According to the most recent update, Fifth Assessment Report of the Intergovernmental Panel on Climate Change, 2013, these predictions have been revised to a rise of 28 to 98 centimeters (0.9 to 3.2 feet) by 2100 relative to 1986-2005 levels.
The January 2017 NOAA Technical Report titled Global and Regional Sea Level Rise Scenarios for the United States builds on and updates their December 2012 Report, and is the current reference for sea level rise planning in the United States. The report’s updated global mean sea level range for the year 2100 is between 0.3 and 2.5 meters (1.0 to 8.2 feet) above current levels.
y = 0.0036x - 7.2465
-0.66
-0.46
-0.26
-0.06
0.14
0.34
0.54
0.74
-0.20
-0.15
-0.10
-0.05
0.00
0.05
0.10
0.15
0.20
0.25
1965 1975 1985 1995 2005 2015
feet
abo
ve 1
991
mea
n se
a le
vel
met
ers
abov
e 19
91 m
ean
sea
leve
lHistoric Mean Sea Level in Nantucket Harbor
Monthly Mean Sea Level High Confidence
Low Confidence Linear ( Monthly Mean Sea Level)

This key resource of 2017 is the official update to the 2012 report by the Army Corps of Engineers and NOAA, and accomplishes two goals:
1. Updates scenarios of global mean sea level (GMSL) rise, and
2. Integrates the global scenarios with regional factors including ocean circulation, geological changes, and vertical land movement, to identify local relative sea level (RSL) change.
According to the report:
• The upper bound for GMSL rise is 2.5 meters, and lower bound of 0.1 to 0.3 meters, by 2100.
• This range is discretized and aligned with emissions-based models into six GMSL rise scenarios, which are in turn used to derive regional RSL scenarios.
• The Northeast Atlantic coast, including in Massachusetts, will have a greater RSL rise (0.3-0.5 m greater under the Intermediate scenario) than the global average.

COASTAL RISK ASSESSMENT AND RESILIENCY STRATEGIES NANTUCKET, MA JANUARY 2020 Page 24
Local Sea Level Rise
Sea level rise is not consistent around the world, and is affected by local variations in currents, temperature, and changes in land surface elevation. It has long been expected that the rate of sea level rise in New England will be slightly higher than the global projections due to the effects of regional subsidence. However, more recent studies have asserted that changes in ocean circulation will increase the relative sea level rise along the Atlantic coast even more.
The NOAA report finds that sea level along the Northeast Atlantic Coast is projected to be greater than the global average for almost all future scenarios. In Massachusetts specifically, sea level rise is projected to be 0 to greater than 1 meter (3.3 feet) higher than the rise in global mean sea level.
Projections of the rate and extent of sea level rise in the future were used to determine Nantucket’s vulnerabilities to future coastal conditions. Uncertainties exist with regard to multiple factors that contribute to sea level change, including the rate of change in the land surface elevation, the extent and rate of glacial melting, and changes in human development and greenhouse-gas emission patterns. For this reason, multiple projections are available. The USACE hosts a sea level rise web tool ("Sea-Level Change Curve Calculator") that provides sea level projections using both USACE and NOAA projections at existing tidal gauges. The most recent version available (2019.21) was used for this assessment. Calculated sea level rise using this tool is depicted in the following table and graph. In each case, the base year is 2000.
Table 3: NOAA 2017 Relative Sea Level Change Projections; Gauge 8449130, Nantucket, MA Vertical Land Movement: 0.00476 feet per year
All values are expressed in feet Year VLM Low Int-Low Intermediate Int-High High Extreme 2000 0.00 0.00 0.00 0.00 0.00 0.00 0.00 2010 0.05 0.16 0.20 0.26 0.36 0.43 0.46 2020 0.10 0.36 0.43 0.59 0.79 0.92 0.95 2030 0.14 0.52 0.62 0.92 1.21 1.48 1.64 2040 0.19 0.72 0.85 1.28 1.77 2.26 2.49 2050 0.24 0.89 1.05 1.71 2.36 3.12 3.54 2060 0.29 1.08 1.31 2.17 3.05 4.13 4.82 2070 0.33 1.21 1.51 2.66 3.81 5.15 6.17 2080 0.38 1.38 1.71 3.22 4.66 6.36 7.71 2090 0.43 1.48 1.87 3.77 5.58 7.74 9.51 2100 0.48 1.57 2.03 4.33 6.56 9.25 11.42

COASTAL RISK ASSESSMENT AND RESILIENCY STRATEGIES NANTUCKET, MA JANUARY 2020 Page 25
Figure 6: NOAA 2017 Relative Sea Level Change Projections; Gauge 8449130, Nantucket, MA
The ranges calculated in Figure 6 and Table 3 are quite wide, but even the low projections show that sea level rise will continue throughout the current century.
Another source of local sea level rise projections comes from the 2018 “Massachusetts Climate Change Projections” put out by the Northeast Climate Adaptation Science Center of the University of Massachusetts, Amherst. This report presents downscaled sea level rise projections for Massachusetts based on four National Climate Assessment global scenarios.
Four probabilistic scenarios (Intermediate, Intermediate-High, High, and Extreme) consider two future greenhouse gas concentration trajectories (a “medium” trajectory, RCP 4.5, and a “high” trajectory, RCP 8.5) and two methods of accounting for Antarctic ice sheet contributions to sea level rise.
Table 4: MA 2018 Sea Level Projections; Nantucket, MA
Year Intermediate Int-High High Extreme 2020 0.4 0.5 0.7 0.8 2030 0.8 0.9 1.3 1.5 2040 1.1 1.4 1.8 2.3 2050 1.5 1.9 2.5 3.2 2060 2.0 2.4 3.3 4.3 2070 2.5 3.1 4.3 5.6 2080 3.0 3.8 5.4 7.0 2090 3.6 4.5 6.6 8.7 2100 4.2 5.3 7.9 10.5

COASTAL RISK ASSESSMENT AND RESILIENCY STRATEGIES NANTUCKET, MA JANUARY 2020 Page 26
Figure 7: MA 2018 Sea Level Projections; Nantucket, MA
According to the Massachusetts projections, relative sea level along Nantucket is expected to rise approximately four to ten feet by 2100 (current mean sea level is -0.32 feet NAVD88).
For planning purposes, it is advisable to use intermediate or high sea level rise projections such that a community will be better protected against worst-case scenarios. Based on the 2017 NOAA projections and the 2018 Massachusetts projections, it is reasonable to expect relative sea level on the Nantucket coast to rise by at least 4 to 6 feet above 2000 levels by 2100.
0.0
1.0
2.0
3.0
4.0
5.0
6.0
7.0
8.0
9.0
10.0
11.0
12.0
2020 2030 2040 2050 2060 2070 2080 2090 2100
Loca
l Mea
n Se
a Le
vel (
Feet
, NAV
D88)
Intermediate Intermediate High High Extreme
Relative Sea Level on the Nantucket Coast is Expected to Rise at Least 4-6 feet Above 2000 Levels by 2100.

COASTAL RISK ASSESSMENT AND RESILIENCY STRATEGIES NANTUCKET, MA JANUARY 2020 Page 27
2.3.3 Sea Level and Storm Surge Analysis
As part of the extensive Hurricane Sandy recovery effort, the North Atlantic Coast Comprehensive Study (NACCS) was authorized by the Disaster Relief Act of 2013 (Public Law 113-2) on January 29, 2013. The study area was the Atlantic Ocean coastline, back-bay shorelines, and estuaries within portions of the United States Army Corps of Engineers (USACE) North Atlantic Division. The NACCS numerical modeling and statistical analysis effort used the Advanced Circulation (ADCIRC) Model to generate a tremendous amount of storm forcing condition data, model results, and statistical analysis products, for the coastal regions from Virginia to Maine. The USACE maintains all of this information within the Coastal Hazards System (CHS), a national, coastal storm-hazard data storage and mining system.
ADCIRC total water level output data for Nantucket extracted from the CHS and reviewed. The water levels from the Flood Insurance Study (FIS) for Nantucket were based on the results of a local tide gauge analysis. The NACCS total water levels were based on simulations of tropical and extratropical storms using a coupled wave and surge model. Both studies include a wave setup component at the 1%-annual-chance storm water level. In many cases the results between the two studies are similar, however there are instances where the water levels are different at return periods (10%, 2%, and 0.2% annual-chance) where the NACCS figures include a wave setup component and the FEMA data do not. Figures from the NACCS study should be used for resiliency planning unless more updated water level figures are released in the future.
2.4 Erosion and Shoreline Change 2.4.1 Existing Conditions and Historic Trends The earliest records of shoreline change for Nantucket are available from a review of historical topographic maps and nautical charts. Maps from the late 1700s through the 1800s (for example, the “Nantucket Shoals Nautical Chart” from 1791 and the “Chart of Nantucket Island and the Eastern Half of Martha’s Vineyard” from 1776) depict a barrier island between Muskeget and Tuckernuck. This barrier island was aligned with another barrier island extending westward from the southern shore of Nantucket Island at Madaket, and Muskeget and Tuckernuck were located north of the barrier island, with the barrier beach and Tuckernuck separated by a very narrow strait.
By the end of the 1800s, maps began showing the barrier island as having moved northward or eroded entirely, with a gap between Madaket and Tuckernuck. The 1891 map of Nantucket in the “Atlas of Massachusetts” and the 1904 “New Chart of Vineyard Sound and Nantucket Shoals” show a northward erosional progression, with the southern shore of Tuckernuck finally merged with the barrier beach and aligned with the southern shore of Nantucket at Madaket. The maps from 1791 through 1904 also show a progressive shrinking of Muskeget Island. By 1951, topographic maps show the disappearance of the barrier beach west of Madaket and a wide expanse of water between Tuckernuck Island and Smith Point (the western extent of the Madaket barrier beach system).

The U.S Army Corps of Engineers prepared the NACCS study as a response to Hurricane Sandy and as a key planning tool.
• The report recalls that some south facing beach locations on Nantucket lost up to 50 feet of beach to erosion during Hurricane Bob.
• Nantucket is part of planning area “MA5” (“Bluffs, some beach, limited floodplain extent. Includes Cape Cod and also Nantucket and Martha’s Vineyard”)
• The report identifies one part of Nantucket under “risk area identification” – MA5_B: Nantucket: “This area of high exposure is found on the west side of Nantucket Harbor and includes all of the port infrastructure and the downtown area. Residential and commercial development in this area is quite dense. This is the only port to the island and is critical to supplying the year-round and seasonal populations.”
• However, Nantucket is not discussed further.
• The compendium report “Conceptual Regional Sediment Budget” does not address Nantucket.

• Part of the NACCS study was focused on analyzing historical water level measurements and combining that data with storm surge modeling to create a suite of projections for future extreme high water elevations.
• This differs from many other sea level rise projections that are limited to increases in mean sea level and do not estimate high water elevations during future storms.
Flood Elevations (meters NAVD88)StormReturnPeriod
HistoricLevels
Year 2114 Sea Level Rise ScenariosUSACE
LowUSACE
IntermediateModified
NRC-IIUSACEHigh
NOAAHighest
1 Year 1.05 1.23 1.5 2.04 2.61 3.210 Year 1.31 1.49 1.76 2.28 2.85 3.4425 Year 1.42 1.6 1.87 2.39 2.95 3.5450 Year 1.51 1.69 1.96 2.47 3.03 3.98100 Year 1.6 1.78 2.05 2.55 3.11 4.25500 Year 1.83 2.01 2.27 2.76 3.31 5.07

COASTAL RISK ASSESSMENT AND RESILIENCY STRATEGIES NANTUCKET, MA JANUARY 2020 Page 30
The aforementioned maps document a significant northward shift of the southern shoreline. For example, Hummock Pond is mapped as a single U-shaped pond as recently as 1979, though currently the beach south of the pond has advanced northward far enough to merge with the peninsula between the two arms of the U, separating Hummock Pond into two separate ponds. Likewise, several north-south ponds along the southern shoreline have disappeared over time, including Nobadeer Pond, Madequecham Pond, and most of Sheep Pond.
In October of 2017, the remains of Tropical Storm Philippe brought winds and waves that caused major sediment displacement at Madaket beach5. The extent of change is shown in the photographs below, comparing the difference seen in Google earth from April 2017 and February 2018.
It is more challenging to detect changes in the shoreline in the ‘Sconset area based on a review of the historical maps. However, topographic maps from 1945 and 1951 depict many more homes in the Codfish Park area as compared to the same area today. Specifically, homes on the east side of Codfish Park Road are clearly visible in the historical topographic maps, whereas the area east of the road is currently occupied by the beach and the ocean.
Massachusetts Agency of Coastal Zone Management Shoreline Change Project
Recent research by performed by the Massachusetts agency of Coastal Zone Management (CZM) as part of its StormSmart Coasts Project has continued to shed light on changes to the Nantucket shoreline. The Massachusetts Shoreline Change Project digitized high water line (the landward limit of wave runup at the time of local high tide) data from the mid-1800s to 2009 using historical and modern sources. The most recent shoreline data was extracted from orthophotographs and Lidar. Shoreline-perpendicular transects intersecting each of the up-to eight historical shorelines at 50-meter intervals were then used to calculate short- and long-term shoreline change rates for the entire Massachusetts coast. Results are available through interactive maps and downloadable files for use in a GIS, as well as in a report.
5 Sand from the beach was pushed northward, filling the pond north of the beach and burying the existing salt marsh near Millie’s Bridge. During this event, daily high tide migrated closer to the southwestern side of the bridge, making that important access route more exposed to daily tidal fluctuations.

COASTAL RISK ASSESSMENT AND RESILIENCY STRATEGIES NANTUCKET, MA JANUARY 2020 Page 31
The Massachusetts CZM Shoreline Change Project was most recently updated in 2013, with historic shorelines mapped from the mid-1800s through 2009. The 2013 project report, Massachusetts Shoreline Change Mapping and Analysis Project, 2013 Update (Thieler, et. Al. 2013) described the project’s findings for Nantucket as follows:
Long-term shoreline-change rates were calculated at 2,227 transects covering 91 miles of Nantucket shoreline. Generally, erosion was observed on the Atlantic Ocean-facing shores of Nantucket, Tuckernuck, and Muskeget Islands, and accretion at the end of barrier spits. The maximum erosion rate (7.2 ±1.3 meters per year) was found to be occurring on a barrier spit on Muskeget Island. Tuckernuck Island and the southern shore of Nantucket Island were also found to have high long-term erosion rates; the average long-term erosion rate for Nantucket’s southern shore is 2.1 ±0.5 meters per year.
Short-term linear-regression change-rates were calculated at 1,983 transects along 74 miles of Nantucket shoreline. The maximum short-term linear regression erosion rate 12.4 ±1.5 meters per year was measured at Tuckernuck Island. Tom Nevers Beach also had high short-term erosion rates up to 4.9 ±1.5 meters per year. For the short-term, the average rate of change for the Nantucket southern shore was 1.2 ±2.6 meters per year. The short-term maximum linear regression accretion rate of 5.5 ±4.6 meters per year was located at the end of a spit on Esther Island at the entrance to Madaket Harbor.
Table 5 lists erosion and accretion data for a selection of transects around the perimeter of Nantucket Island located near critical facilities and other points of interest. This information was taken from an independent review of the CZM Shoreline Change Project maps conducted for the 2019 Nantucket Hazard Mitigation Plan.
Table 5: Erosion and Accretion Rates in Selected Nantucket Coastal Transects
Location* Transect # Long Term** Short Term**
Net Change (ft) Rate (ft/yr) Net Change (ft) Rate (ft/yr)
Wauwinet: Outer Shore 0150 -521.23 -3.9 ±1.49 -81.63 -2.1 ±5.29 Sconset: Baxter Road 0254 -151.41 -0.82 ±0.38 -65.58 -1.61 ±4.57 Sconset: Codfish Park 0331 202.85 0.92 ±2.4 -168.5 -5.18 ±2.37 Tom Nevers 0409 -251.8 -0.98 ±2.2 -506.86 -16.17 ±4.8 South of Airport 0515 -1473.43 -9.19 ±1.05 -136.84 -4.3 ±1.61 Surfside: WWTF 0594 987.3 5.18 ±1.39 237.11 6.99 ±14.59 Surfside: Hummock Pond 0687 -1086.55 -6.59 ±0.55 -305.71 -9.65 ±2.6 Sheep Pond Road 0761 -1743.54 -10.79 ±1.15 -325.07 -9.68 ±7.19 Smith Point 0802 -1890.26 -11.68 ±1.41 -194.03 -5.31 ±8.04 Madaket: Little Neck 1106 14.5 -0.3 ±1.04 -12.17 -0.36 ±4.98 Madaket: Warren Landing 1116 -54.66 -0.33 ±0.1 -23.26 -0.75 ±2.31 Dionis: Fishers Landing 1205 230.48 2.23 ±1.52 -138.94 -4.49 ±6.01 Dionis Beach 1277 -288.29 -1.74 ±0.25 -49.15 -1.57 ±1.94 Jetties Beach West 1346 911.94 6.5 ±1.65 -51.77 -1.71 ±1.02 Jetties Beach East 1350 730.22 5.84 ±2.16 -114.6 -3.71 ±3.58 Downtown 1401 -39.99 -0.03 ±0.65 -6.3 -0.43 Shimmo Creek 1463 -34.42 -0.1 ±0.21 -12.86 -0.39 ±7.64

COASTAL RISK ASSESSMENT AND RESILIENCY STRATEGIES NANTUCKET, MA JANUARY 2020 Page 32
Location* Transect # Long Term** Short Term**
Net Change (ft) Rate (ft/yr) Net Change (ft) Rate (ft/yr) Quaise Point 1538 -57.38 -0.13 ±0.64 -64.8 -4.49 ±-9999 Wauwinet Inner Shore 1678 895.64 5.28 ±8.49 -10.86 -7.45 ±56.01
* Note that one sample transect was chosen for each general location listed in this column. Due to the close spacing of the transects, each location is crossed by multiple transects, each with different erosion or accretion rates. In some cases, a single area may be crossed by both transects that show erosion and transects that show accretion (for example, Madaket: Little Neck). ** Positive values indicate accretion (shoreline movement out into the ocean). Negative values indicate erosion (shoreline movement inland). Massachusetts Coastal Bank Erosion Hazard Mapping (2019)
The Massachusetts Department of Environmental Protection (MassDEP) and CZM produced a dataset in 2019 presenting coastal bank erosion and vulnerability. MassDEP and CZM used high resolution coastal elevation data, historical aerial photography, and bank delineations to quantify the extent of erosion of tops-of coastal banks in recent decades. This dataset captures bluff erosion more effectively than the Coastal Erosion data. The information in this dataset is presented in the risk analysis in this document at “lateral erosion extents,” rather than as erosion rates, because the State has clarified that insufficient data is available at this point to confidently translate the erosion distance over time to annual erosion rates.
2.4.2 Estimates of Future Erosion
For the risk analysis performed for this project, estimated erosion risk zones (areas that may be impacted by erosion in the future) were identified using the historic erosion rates calculated by the Massachusetts CZM Shoreline Change Project. It is important to note that erosion is complex and often episodic, and a high degree of uncertainty is inherent in projecting future erosion rates. Erosion risk zones identified in the risk analysis performed for this report are useful for understanding current and past shoreline processes observed around Nantucket, but may not accurately reflect actual future risk or damages. Projected erosion rates used in this report are intended solely to illustrate geographic variations in erosion risk and to guide further analysis and planning.
Some sections of the Nantucket shoreline contain expected erosion zones adjacent to expected accretion zones. These shoreline change “nodes” will likely play an important role in future sediment management efforts, and should be noted and highlighted.

COASTAL RISK ASSESSMENT AND RESILIENCY STRATEGIES NANTUCKET, MA JANUARY 2020 Page 33
2.5 Detailed Risk Assessment
A detailed assessment of coastal risks facing Nantucket was performed, and is presented in Appendix A. This assessment describes risks to different systems and assets, and also summarizes risks by Planning Neighborhood. Risks and vulnerabilities were determined through review of planning documents such as the Nantucket Hazard Mitigation Plan and the Municipal Vulnerability Preparedness (MVP) report, discussion with Town representatives, collection of public input at meetings and through an online survey. More details on each of the vulnerabilities can be found in each of those other documents.
An additional GIS analysis of risk areas was performed for this report. Risk areas identified in this analysis reflect current and possible future conditions based on historic data and currently available climate projections; they are intended to inform planning and assessment, and not to predict specific future impacts or damages. Mapped erosion zones in particular are not expected to accurately represent locations at risk from erosion; rather they reflect historic coastal processes and can be used to identify sites where erosion may be a problem.
2.5.1 Risks to Specific Assets Table 6 summarizes coastal risks to Nantucket, organized by asset or system. A more detailed version of this table is found in Appendix A.
Table 6: Vulnerable Assets and Hazards that Threaten Them
Asset or System Hazard Threats
Roads - Inundation of Low Roads - Poor Drainage Flooding
- Undermining by Erosion
Bridges & Culverts - Inundation of Approaches - Clogging of Underpasses
- Clogging of Culverts
Docks - Wave Damage to Structures - Inundation of Facilities
- Sea Level Rise - Wave Damage to Boats
Ferries - Wave Damage to Structures - Inundation of Facilities - Sea Level Rise
- Wave Damage to Boats - Operational Disruption
Airport - Operational Disruption - Erosion of Runway Emergency Services - Loss of Access Municipal Facilities - Coastal Flood Inundation
Water & Wastewater - Infiltration into Pipes - Saltwater Intrusion - Erosion of Coastal Features
- Power Loss - Erosion of Treatment Plants - Insufficient Capacity
Energy & Communication - Wind Damage to Grid - Flooding of Buried Infrastructure
- Flood Impacts on Response
Great Ponds - Erosion of Barrier Beaches - Saltwater Intrusion Fisheries & Shellfish - Rising Temperature Habitat Loss - Pollution from Flooding, Erosion
Coastal Resources - Sea Level Rise Habitat Impacts - Rising Temperature Habitat Loss
- Pollution from Flooding, Erosion - Habitat Loss from Severe Storms
Rare Wildlife and Plants - Rising Temperature Habitat Loss - Habitat Loss from Erosion
- Habitat Loss from Sea Level Rise
Disadvantaged Groups - Damage to Facilities - Power Loss
- Loss of Access

COASTAL RISK ASSESSMENT AND RESILIENCY STRATEGIES NANTUCKET, MA JANUARY 2020 Page 34
Asset or System Hazard Threats
Social Services - Damage to Facilities - Power Loss
- Loss of Access
Historic / Cultural Resources
- Flood Damage to Structure - Wave Damage to Structure - Erosion of Foundations
- Flood Damage to Contents - Wind & Debris Damage - Impacts from Response/Recovery
Private Properties - Flood Damage to Structure - Wave Damage to Structure - Erosion of Foundations
- Flood Damage to Contents - Wind & Debris Damage
Businesses - Flood Damage to Structure & Contents - Wave Action Damage to Structure - Erosion of Foundations
- Wind & Debris Damage - Loss of Business due to Isolation
Tourism - Damage to Restaurants and Stores - Damage to Natural Resources
- Erosion of Businesses - Isolation
Key threats to Nantucket’s shoreline include:
Erosion of properties along the southern shore of the Island Inundation of the historic downtown area Erosion of key infrastructure along the southern shore of the Island, including two Wastewater
Treatment Plants, and the Airport Inundation and erosion of roads Erosion at beaches and bluffs and loss of dunes and banks Loss of tidal wetlands with sea level rise
Risks are anticipated to increase over time due to sea level rise and climate change, and may be compounded by continuing trends of increased development and population growth. High winds during storm events, which are also predicted to increase with climate change, may put further pressure on vulnerable areas.
2.5.2 Risks to Specific Neighborhoods Different neighborhoods and areas of Nantucket face different hazards presented by current and future daily high tide, storm conditions, and erosion. The degree of risk to each Planning Neighborhood is qualitatively summarized for comparison below.
Qualitative risk levels are determined for each Planning Neighborhood based on how far inland the inundation (sea level rise and storm surge) or erosion risk zones extend, and how many buildings and feet of road fall within those areas. Risk levels are determined as follows:
Low: risk zones include less than approximately 25% of roads or buildings within 500 feet of the shoreline
Moderate: risk zones include between approximately 25% and 50% of roads or buildings within 500 feet of the shoreline
Considerable: risk zones include between approximately 50% and 75% of roads or buildings within 500 feet of the shoreline
High: risk zones include between approximately 75% and 100% of roads or buildings within 500 feet of the shoreline
Severe: risk zones extend farther inland than 500 feet from the shoreline

COASTAL RISK ASSESSMENT AND RESILIENCY STRATEGIES NANTUCKET, MA JANUARY 2020 Page 35
Additionally, the total number of buildings and total lengths of roads, as well as critical facilities and isolation risks, are taken into consideration for this exercise.
Table 7 presents a summary of relative risk levels for each Planning Neighborhood. This information can be used to compare risk levels geographically across Nantucket. Areas with low risk may still experience damage, while areas with high risk may escape impacts during a given event.
Table 7: Summary of Risk Level by Neighborhood
Planning Neighborhood Structures Roads Notes Inundation Erosion Inundation Erosion
Downtown High Moderate High Moderate ⋅ Historic Resources ⋅ Ferries & Shipping ⋅ Economic Center
Brant Point Severe Low Severe Low ⋅ Isolation Risk Cliff Road Moderate Moderate Considerable Low ⋅ Isolation Risk
Maddequet / Eel Point Low Moderate High Moderate ⋅ Isolation Risk Madaket Moderate High Moderate Severe ⋅ Relatively Dense
Smith Point Moderate Considerable N/A N/A ⋅ Minimal Density Sheep Pond Road Low Severe Low Severe ⋅ Loss of Roads
Cisco / Hummock Pond Low Severe Low Severe Moors Low Low Low Low
Miacomet Low High Low Severe South Shore / Surfside Low High Low High ⋅ WWTP at Risk
Airport Area Low High Low Severe ⋅ Airport Runway at Risk
Tom Nevers / Southeast Quarter
Low Severe Low Severe
Siasconset Low High Low Severe ⋅ Relatively Dense ⋅ WWTP at Risk
Quidnet Low Low Considerable Considerable ⋅ Low Density ⋅ Isolation Risk
Wauwinet Low Moderate Moderate Considerable Pocomo Low Considerable Low Considerable Polpis Moderate Considerable Moderate Considerable
Shawkemo / Quaise Low Moderate Low Moderate Monomoy Low Moderate Low Moderate
Mid-Island Moderate Moderate Considerable Moderate ⋅ Mostly more than 500 ft from shore
Coatue / Great Point N/A N/A N/A N/A ⋅ No Population Middle Pasture / Folger Hill Low Low Low Low ⋅ Inland
Tuckernuck Low Low N/A N/A ⋅ Private Island
Details on risks faced by each Planning Neighborhood, and how this table was created, can be found in Appendix A.

COASTAL RISK ASSESSMENT AND RESILIENCY STRATEGIES NANTUCKET, MA JANUARY 2020 Page 36

COASTAL RISK ASSESSMENT AND RESILIENCY STRATEGIES NANTUCKET, MA JANUARY 2020 Page 37
3 Coastal Adaptation Strategies

COASTAL RISK ASSESSMENT AND RESILIENCY STRATEGIES NANTUCKET, MA JANUARY 2020 Page 38

COASTAL RISK ASSESSMENT AND RESILIENCY STRATEGIES NANTUCKET, MA JANUARY 2020 Page 39
3.1 Strategies for Adaptation The IPCC published the landmark paper "Strategies for Adaptation to Sea Level Rise" in 1990. Three basic types of adaptation were presented in the report:
Retreat: abandonment of the coastal zone with no effort to protect the land from the sea. Accommodation: use of at-risk land continues, but prevention of flooding is not pursued. Protection: at-risk land is protected from coastal hazards so existing uses can continue.
In 2010, the NOAA Office of Ocean and Coastal Resource Management published the manual Adapting to Climate Change: A Planning Guide for State Coastal Managers. According to the manual, NOAA's seven categories of "Climate Change Adaptation Measures" are:
Impact Identification and Assessment Awareness and Assistance Growth and Development Management Loss Reduction Shoreline Management Coastal Ecosystem Management Water Resource Management and Protection
Elements of protection, retreat, and accommodation are found in several of these categories and subcategories of adaptation. NOAA notes that these adaptation measures are organized into categories that describe their primary purpose but, in many cases, they serve multiple purposes and could fit into multiple categories.
3.2 Adaptation Options Coastal adaptation strategies include both Planning Resiliency and Structural Resiliency.
Planning Resiliency measures include:
Emergency preparation and response Redirection or retreat of development Procedural, regulatory, and financial modifications
Structural Resiliency measures include:
Construction of seawalls and bulkheads Construction of floodwalls and levees Construction of groins and jetties Installation of temporary flood barriers Floodproofing of buildings Elevation of buildings
Note that Structural resiliency measures are a broader category than structural hazard mitigation measures, which would only include the first three bullets in the list above.

Three basic types of coastal adaptation were described in this landmark resource from the Intergovernmental Panel on Climate Change (IPCC) in 1990:
• Retreat: abandonment of the coastal zone without protecting the land from the sea. Allows ecosystems to migrate inland as sea level rises. Relocation from one area to another may cause social disruption. Can be implemented through land use regulations, building codes, and economic incentives that consider future conditions.
• Accommodation: continued use of at-risk land without pursuit of hazard prevention. Can be enabled with strong hazard preparation and flood insurance programs.
• Protection: at-risk area is protected from hazards so existing uses can continue. May block migration of ecosystems with sea level rise, and may negatively impact habitats and sediment dynamics. Can be implemented through capital projects.

Ten years after the IPCC’s 1990 paper, the Pew Center expanded on the previous concepts related to shoreline retreat.
• Growth in coastal areas increases likelihood of property damage. Major impacts of sea level rise include tidal wetland loss and displacement, coastal erosion, increased flood vulnerability, and salinization of groundwater.
• Responses to sea level rise include planned retreat, accommodation, and protection. Land-use policies must be forward-looking.
Guidance on mitigation measures presented in the resource includes:
• Hard Structures: apply in developed urban areas. Not appropriate for erosion.
• Soft Protection: respond to erosion through sediment addition or improved sediment management. Repeated additions of sediment may be necessary.
• Accommodation & Planned Retreat:Primary tools are land use and development planning, such as setback measures and post-disaster reconstruction requirements.

COASTAL RISK ASSESSMENT AND RESILIENCY STRATEGIES NANTUCKET, MA JANUARY 2020 Page 42
Ideally, any measures taken should be sufficiently robust to provide adequate protection, and flexible enough to allow for adjustment under changing conditions. Such robustness and flexibility typically require a combination of methods rather than a single solution.
Structural measures can be site-specific, "neighborhood-scale," or large-scale structures that protect many miles of infrastructure.
Site-specific measures pertain to adapting specific structures on a case-by-case basis. Neighborhood-scale measures apply to a specific group of buildings that are adjacent to each other. Large-scale measures might include large dike and levee systems or tide gates that can prevent tidal
surge from moving upstream.
The following is a discussion of the most common and effective adaptation measures that are available to a typical coastal municipality. There may be additional options not listed here.
3.3 Shoreline Protection
3.3.1 Hard Infrastructure
Hard coastal protection infrastructure refers to both constructed hard banks designed to prevent shoreline erosion and flooding, and hard structures placed within the near-shore marine environment in order to reduce the energy of wave and currents, often for the purpose of managing sediment. Hard infrastructure can be difficult to permit.
Hard Bank Protection
The first category, here referred to as Hard Bank Protection, generally includes long-lasting structures parallel to the shoreline:
Seawalls are engineered barriers that protect land from waves and flooding. Levees are engineered berms that protect land from flooding. They require large amounts of land
since they are typically constructed to be 5 to 6 times wider than they are tall. Bulkheads are engineered structures that retain soil and reduce erosion. Revetments protect against erosion by dissipating wave energy. They may be constructed of piles of
large stones (riprap), mesh cages of smaller rocks (gabions), or other materials.
It is possible to install the barriers above on a neighborhood scale to protect multiple buildings, or at a specific site (the latter is discussed in the “property protection” section below).
Hard Sediment Management Structures
Additional hard protections that are not necessarily parallel to the shoreline or that are parallel but offshore may include the following:
Jetties & Groins are built perpendicular to the beach to interrupt the flow of sand along the shoreline. Over time, sand builds up on one side (the “updrift” side) and is eroded from the other (the “downdrift” side).
Breakwaters are built parallel to the beach in the water offshore. They are designed to block waves, reducing wave energy at the shoreline. Over time, sand will accumulate towards the breakwater, eventually causing a similar effect as a groin.

COASTAL RISK ASSESSMENT AND RESILIENCY STRATEGIES NANTUCKET, MA JANUARY 2020 Page 43
Hard coastal structures are a necessary part of many developed shorefronts; they protect shoreline roads, water-dependent uses, and many private properties. While the regulatory climate will only rarely allow the construction of new hard structures, existing structures will be repaired or replaced as needed. While modifications may be prudent in some cases, opportunities for green infrastructure or hybrid solutions are often limited in these settings. Municipalities and property owners will continue to choose the methods that have been used for decades to define the edge of the shoreline, prevent erosion, and control wave energy.
3.3.2 Living Shorelines
Living Shorelines, a category of Green Infrastructure (GI) or, aims to defend against inundation and wave power by dissipating and absorbing energy, rather than deflecting or reflecting it. These techniques are also designed to enhance habitat and water quality, and to preserve the natural processes and connections between riparian, intertidal, and subaqueous areas.
Some specific living shoreline approaches include the following:
Beach Nourishment or Replenishment involves importing sand to an eroding or eroded beach from sediment-rich areas, such as a harbor undergoing dredging. The slope and width of a beach affects wave setup and runup, and can have a direct impact on flood elevations. Overall, beaches can reduce flood risks and bluff erosion hazards while creating public recreation opportunities, aesthetic value, and in the right conditions support unique habitats (www.fema.gov/benefits-natural-floodplains). Unlike hard shoreline protection measure, beach replenishment avoids addition of potentially dangerous hard debris to the high energy coastal area.
Living Shorelines are a category of Green Infrastructure (GI). Typical definitions of GI include: EPA: GI uses vegetation, soils, and natural processes to manage water and create healthier urban environments. American Rivers: GI is an approach to water management that protects, restores, or mimics the natural water cycle. GI is effective, economical, and enhances community safety and quality of life. GI incorporates both the natural environment and engineered systems to provide clean water, conserve ecosystem values and functions, and provide a wide array of benefits to people and wildlife. GI solutions can be applied on different scales, from the house or building level, to the broader landscape level. On the local level, GI practices include rain gardens, permeable pavements, green roofs, infiltration planters, trees and tree boxes, and rainwater harvesting systems. The Nature Conservancy: GI solutions are planned and managed natural and semi-natural systems which can provide more categories of benefits when compared to traditional gray infrastructure. GI solutions can enhance or even replace a functionality that is traditionally provided by man-made structures. GI solutions aim to build upon the success that nature has had in evolving systems that are inherently sustainable and resilient. GI solutions employ ecosystem services to create more resource efficient systems involving water, air and land use.

COASTAL RISK ASSESSMENT AND RESILIENCY STRATEGIES NANTUCKET, MA JANUARY 2020 Page 44
Dune Management stabilizes these natural flood barriers to protect against surges while maintaining important natural resources. FEMA describes dunes as “important first lines of defense against coastal storms” that can “reduce losses to inland coastal development.” The Lake Huron Centre for Coastal Conservation lists the benefits of dunes as including shore protection, water purification, biological diversity, erosion control, and acting as a source of sediment for natural beach replenishment.
Hybrid Techniques incorporate non-structural approaches for erosion control in combination with more traditional approaches, such as a rock structure, to support vegetation growth. Hybrid techniques are typically applied in areas of higher wave energy.
Tidal Wetland Management creates or supports the natural flood mitigation capabilities of this rare ecosystem. Tidal Wetlands have been found to reduce wave energy and decrease water surface elevations at their inland edges during storm surges. Preservation of tidal wetlands also prevent development in hazardous areas and support important habitat.
Given Nantucket’s dynamic sediment environment, as well as legislative and regulatory changes over the last decade, natural and green infrastructure risk reduction methods along the shoreline are a good choice for the community in some areas.
The many advances in green and green/gray coastal infrastructure over the last decade including living shorelines have resulted in a very large body of publications and resources related to the subject. Because communities can find it challenging to sort through these resources, synopses of the most prominent papers and resources are found on the next ten pages.

The report Living Shorelines – From Barriers to Opportunities was released by Restore America’s Estuaries in June 2015.
• The report’s focus is to identify and assess barriers that prevent broad use of living shorelines in the U.S.
• A definition of living shoreline presented in the report is: “Any shoreline management system that is designed to protect or restore natural shoreline ecosystems through the use of natural elements and, if appropriate, manmade elements. Any elements used must not interrupt the natural water/land continuum to the detriment of natural shoreline ecosystems.”
• The report notes that a “management system that breaks the water/land continuum is not considered a living shoreline…. This choice is based on the belief that any manmade break in the water/land continuum will eventually become a de facto hardened structure functioning essentially like a bulkhead or revetment.”

NOAA and the USACE collaborated through their “Systems Approach to Geomorphic Engineering” (“SAGE”) practice to publish materials in 2015. This reference guide promotes coastal risk reduction through use of living shorelines.
The three goals of living shorelines are cited as:1. Stabilizing the shoreline and reducing rates
of erosion and storm damage2. Providing ecosystem services and increasing
flood storage capacity3. Maintaining connections between land and
water ecosystems to enhance resilience
One of the highlights of the publications is the graphical display of the range of green and soft techniques to gray and hard techniques, with the following depicted in clear graphics:• Vegetation only• Edging• Sills• Beach nourishment• Beach nourishment and vegetation on dune• Breakwater• Groin• Revetment• Bulkhead• Seawall
The SAGE resources describe anticipated benefits of living shorelines, challenges, and costs.

The report considers the use of natural infrastructure to address flood and other climate change–induced risks in an urban area.
• The report had three objectives: evaluate relative merits of approaches to climate change resilience using a case study; propose an approach to quantifying ecosystem functions and services; and establish replicable methods for making decisions about using natural infrastructure in this context.
• The report discusses how a cost-benefit analysis can account for environmental benefits that are often difficult to quantify.
• Five sets of protective infrastructure were considered for their flood protection efficacy and ecosystem services co-benefits, which together contribute to resilience. The sets of alternatives included restored marshes, hard toes of mussel shells, berms, breakwaters, groins, floodwalls, and flood gates.
• The study found that when ecosystem functions and services are included in a cost-benefit analysis, hybrid infrastructure (combining nature and nature-based infrastructure with gray infrastructure) can provide the most cost-effective protection from sea-level rise, storm surges, and coastal flooding.

The report is a narrative review of nature-based risk reduction methods based on workshops and literature reviews.
• For each method of risk reduction, the report outlines strengths, weaknesses, uncertainties, suitable conditions, limitations, design metrics, resiliency factors, and examples of sites where implemented.
• The techniques addressed in the report include:
• Beach nourishment• Vegetated dunes• Edging and sills (living shorelines)• Oyster reefs• Coastal wetlands• Coastal forests
• A summary table at the end of the report allows for comparison of different methods.
• The report can be referenced when considering different approaches to protect a specific area.
• The report concludes that natural infrastructure and nature-based measures have been shown to reduce impacts of coastal hazards, and should be considered as viable options by decision-makers.

This report is a set of case study examples for nature-based solutions to risk reduction. The report notes the following:
• “Constructing engineered features designed to mimic natural features and functions can be an effective approach for reducing risks. Nature-based features can include such things as engineered dune complexes to buffer coastal communities, and living shorelines that use mostly native materials (biological and physical) to stabilize shorelines.”
• “Because many traditional ecological restoration efforts require engineering, design, and construction, restoration of purely natural systems and construction of nature-based features are probably best viewed as occurring on a continuum, and any given project may have elements of both.”
• “Practitioners are identifying opportunities to blend green and gray approaches to risk reduction. In some places the protective functions of a structural feature can be augmented with those provided by a natural or nature-based feature such as dunes, marsh, or natural floodplain, creating multiple lines of defense.”

The report notes the following [continued]:
• “Integrating natural, nature-based, non-structural, and structural approaches recognizes that risk reduction needs and opportunities are highly site specific and depend very much on the geophysical and ecological setting as well as the type and sensitivity of the assets to be protected.”
• “Given the traditional reliance on structural measures in most heavily populated areas, opportunities to promote and expand the use of natural and nature-based features will often involve incorporating them into such integrated, hybrid risk reduction systems.”
Because the case studies in the report vary widely in geography, some are not directly applicable to Nantucket. One example that may be applicable:
• Cape May highlights the benefits of wide beaches and robust dune systems, stating that “After Hurricane Sandy, Cape May communities that had participated in U.S. Army Corps of Engineers dune and beach nourishment projects…. had relatively little storm and flooding damages in places where wider beaches and deeper dune systems provided adequate buffers.”

This report presents one of the most concise yet compelling arguments for protecting or restoring tidal wetlands (marshes) for storm surge and flood risk reduction.
• In the past, reports spoke of tidal wetlands “absorbing” storm surges or attenuating wave energy without presenting direct evidence. For this paper, modeling was conducted by the authors to demonstrate that the roughness associated with tidal wetlands will, in some cases, reduce the elevation of floodwaters caused by storm surges.
• However, modeling demonstrated that in some locations (especially at the leading edge of expansive marsh systems), the roughness of marshes may increase flood levels. The report calls this is a “piling up” of water.
• Overall, flood damage reduction (in dollars) was found to be minimal for Massachusetts’ shoreline when compared to the other states in the study. This is a function of the setting and tidal wetland characteristics along the Massachusetts shoreline rather than a direct measure of the importance of tidal wetlands in Massachusetts.
• The report notes that the study underestimates wave reduction capacities of wetlands and does not account for other risk reduction benefits such as long-term stabilization of shorelines.

The Regional Framework for Coastal Resilience was a regional coastal green infrastructure assessment conducted by Milone & MacBroom, Inc. and GEI under contract to SCRCOG working in a partnership with The Nature Conservancy. Numerous lessons were learned during the planning and design phases of the Regional Framework for Coastal Resilience:
• Nature-based solutions and green infrastructure will not be possible everywhere. Some coastal structures will remain and will need to be repaired as needed.
• Some coastal structures will need to be elevated over time.
• In limited instances, new hard structures may be needed to protect infrastructure or people.
• In some locations, nature-based solutions may achieve the desired results of flood protection and/or erosion mitigation.
• Some opportunities may exist to create or increase green infrastructure adjacent to existing structures.
• Where new coastal bank protection is needed or desired, nature-based, green, or hybrid methods may be feasible.
• Living shorelines may be feasible to establish in the intertidal zone where they are not already present, and many existing tidal wetland systems may be feasible locations for marsh enhancement.

• People will continue to rely on beaches that are nourished regularly or infrequently
• Dunes can serve as parts of a flood protection system. Dunes can be enhanced or created in some locations to help reduce flood risk, although they may not eliminate risk.
• Municipalities will acquire properties and owners will elevate buildings to reduce risk where we cannot create flood protection systems or use nature-based solutions to eliminate risk.
• Numerous sections of coastal roads will need to be elevated to reduce the frequency of, and therefore reduce the risk of, flooding.
• Some coastal roads and parking lots may be candidates for abandonment or a modification in how they are paved. Natural or green infrastructure could be placed in their footprints.
• Water, wastewater, and stormwater utility infrastructure will need to be strengthened, elevated, created, or relocated over time, either as a measure to solely increase resilience or reduce associated flooding.
• Although they are not shoreline projects, many of the municipalities recognize the nexus between coastal resilience projects and stormwater management using rain garden, bioswales, and other traditional inland green infrastructure projects.

This report provides a framework to quantify ecosystem services in evaluation of coastal restoration projects. Framework steps are to define the project scope, engage stakeholders, set goals, select evaluation metrics, and design a study.
• Project goals can be both ecological and socioeconomic, and should consider stakeholder priorities, expected project benefits, and project tradeoffs.
• Goals are broken into measurable evaluation metrics, which may be further refined to consider monetary values.
• An ecosystem valuation study puts a dollar value on ecosystem services, and helps give social well-being “a seat at the table in decision making.” Valuations consider project and maintenance costs, costs of “conventional” alternatives, value of assets being protected, economic impacts, and social and cultural values.
• Examples of past studies of restoration benefits are given, including restoration of salt marshes and oyster reefs.

COASTAL RISK ASSESSMENT AND RESILIENCY STRATEGIES NANTUCKET, MA JANUARY 2020 Page 55
3.4 Community Infrastructure Protection
3.4.1 Stormwater Management
Flood management in low-lying coastal areas includes enabling the drainage of runoff flowing downhill from upland areas in addition to preventing the inflow of seawater. This challenge is exacerbated by high sea-levels that prevent simpler “gravity flow” methods of drainage. In some cases, low-lying storm drain inlets will “surcharge” (have seawater flow backwards through them) during high tide or storm surge events. This can lead to flooding in areas that otherwise would be protected from coastal waters.
Successful management of stormwater along the coast consists of three aspects: (a) slowing the flow of inland runoff to low-lying coastal areas, (b) preventing seawater from entering the system, and (c) discharging stormwater from low-lying areas without allowing elevated seawater to surcharge into those areas. For Nantucket, nutrient control and pre-treatment is also part of successful stormwater management. Stormwater is the third-largest source of controllable nutrient load to most of the community’s surface water bodies, and proper treatment is paramount to successful stormwater management.
A number of actions can address these needs:
Inland Stormwater Retention - storing water in ponds during a storm, then releasing it over time, reduces the stress put on downstream areas.
Green Stormwater Infrastructure - vegetation, soil, and other elements slow and store stormwater, treat it on site, and encourage infiltration into groundwater. Examples include rain gardens, bioswales, and permeable pavement.
Gasketed Piping - is water-tight, preventing salt-water infiltration. It is common in both sewer and water supply systems.
Stormwater Pump Stations - push water out of an area with enough force to overcome elevated seawater. Stormwater pump stations are feasible (and becoming more common with increasing sea levels) but costly to construct and operate, and represent an ongoing maintenance burden.
Floodgates at Outlets - placing a flap gate or duck bill structure on a pipe outlet prevents seawater from entering the system, reducing surcharge risk with more limited capital and operating expenses than pumping stations. A traditional flap gate is shown above to the right. These are typically made of steel or aluminum and open under the force of water building up in the pipe behind the gate. A duck bill flap gate is shown to the right.
Stormwater Flap Gate
Duck Bill Flap Gate in Provincetown

COASTAL RISK ASSESSMENT AND RESILIENCY STRATEGIES NANTUCKET, MA JANUARY 2020 Page 56
3.4.2 Roads and Transportation
Roadway alterations may include elevation, abandonment, reevaluation of emergency routes, and developing alternative egress. These are described below.
Roadway Elevation – ensures viability despite rising flood levels. While a practical approach, private properties often remain at lower, flood-prone elevations. A higher road surface can then impede drainage of floodwaters off properties.
Roadway Abandonment – it may be acceptable to abandon some roads as the cost of elevation or maintenance becomes excessive.
Alternative Egress – likely developed in connection with road abandonment or reevaluation of emergency access. New roads would have to be built along undeveloped rights-of-way.
Reevaluation of Emergency Access – some emergency routes may be abandoned (without abandoning the associated road), and alternate, non-vulnerable routes determined.
3.4.3 Water and Wastewater
Some coastal communities will face serious problems related to water supply and sanitary wastewater disposal as sea level rises and groundwater rises accordingly. Adaptation methods may include retrofits to pumping stations, hardening of Wastewater Treatment Plants, and extension of sewer and water systems.
Water Supply Adaptation:
Two key risks faced by coastal water supply system are infiltration of saltwater into groundwater or surface reservoirs as sea levels rise, and the excavation and damage of water distribution pipes by erosion of the shoreline. The positive pressure maintained in a water system will prevent saltwater from entering low elevation pipes themselves in areas where that may be a concern.
Public Water System Adaptation Options:
Procure inland surface reservoirs that are outside of saltwater inundation risk areas Monitor and combat intrusion of saltwater into groundwater supply areas Harden coastal water distribution infrastructure Reroute water distribution lines inland
Private Water Supply Adaptation Options:
Individual Water Treatment Systems Development of Community Systems – in underserved locations Extension of Public Water System – to properties not currently served Vacating Property – in extreme situations where properties may be rendered unusable

Recognizing the intricate relationships between climate change and transportation infrastructure, this resources summarizes a workshop convened in 2002 to discuss climate change impacts on transportation and the research needed to better understand those impacts. Some conclusions presented include:
• Sea level rise and storms will more frequently render low-lying coastal infrastructure inaccessible.
• Port facilities are vulnerable to sea level rise and coastal storms.
• Rising temperatures may increase pavement softening, rutting, and buckling.
• Increased extreme weather will create more frequent disruptions in shipping and cause sediment shifts in channels, increasing the need for dredging.
• However, milder winters may increase transportation safety and reliability.

One of USGS’s contributions to the field was this paper (2012) relating groundwater levels to sea level rise in coastal communities.
• Used an aquifer analysis and groundwater models to estimate the impacts of sea level rise on groundwater levels in a coastal city.
• A simulated three feet of sea level rise increased groundwater levels from 0.5 to 3 feet in different areas, with a coincident increase in surface water discharge via streams that receive groundwater.
• Modeling a 12% increase in recharge from precipitation resulted in as much as an additional one foot of groundwater rise.
• Mitigation of increased stormwater quantities by infiltration to the ground is discouraged where it may exacerbate high water table problems.

COASTAL RISK ASSESSMENT AND RESILIENCY STRATEGIES NANTUCKET, MA JANUARY 2020 Page 59
Wastewater Treatment Adaptation:
Vulnerable aspects of municipal wastewater systems include low-elevation treatment facilities themselves, sewer pumping-stations that are also often located at relatively low elevations, and sewer pipe infrastructure.
Wastewater Infrastructure Adaptation Options:
New Construction/ Reconstruction – municipal treatment facilities, or septic systems where 3relevant, should be constructed at elevations that consider sea level rise.
Retrofits – steps to protect a facility without relocating it include, but are not limited to: o Construction of flood walls or berms around structures o Floodproofing of structures or specific components o Elevation of structures or specific components o Protection of electrical supply and systems through elevation, floodproofing, and backup
generators o Hardening of and preventing sedimentation or backflow at facility outfall o Protection of access to facilities through road elevation o Protect records, files, and personnel o Enable facilities to be operated remotely
Harden Pumping Stations – steps include, but are not limited to: o Elevation of station or components o Floodproofing station without elevating o Use of submersible pumps to allow for continued operation during flooding o Providing standby power in case supply is cut off by flooding or storm activity o Setting station up for rapid repair, rather than attempting to prevent all damage o Installation of backflow prevention
3.4.4 Energy
Electric distribution infrastructure is directly at risk from high winds, inundation, elevated groundwater levels, and erosion. Loss of these utilities directly affects residents, and can have secondary impacts on the functionality of other utilities, emergency services, and recovery.
Wind can damage elevated power lines directly or cause tree limbs or other debris to damage the lines. Inundation, erosion, and fast-flowing water can dislodge utility poles. In low-lying and inundation prone areas, however, elevated groundwater levels during a storm can be equally damaging to buried utilities.
Methods for preventing damage to utility infrastructure are not suggested here, the focus instead being on creating a system that can remain resilient despite damage.
Energy Infrastructure Adaptation Options:
Pursue burial of utility infrastructure where appropriate Build redundancy into distribution grids Manage trees and tree limbs to minimize risk of tree damage to utilities Install backup generators at critical facilities Install backup fuel tanks at critical facilities Develop outage response plans that account for possible road blockages from flooding

COASTAL RISK ASSESSMENT AND RESILIENCY STRATEGIES NANTUCKET, MA JANUARY 2020 Page 60
Develop closer partnerships between community stakeholders and utilities
It is also recommended that Nantucket conduct a thorough assessment of backup power capabilities and of the Island’s gas stations.
3.5 Property Protection
The National Flood Proofing Committee (NFPC) defines floodproofing as "any combination of structural or nonstructural changes or adjustments incorporated in the design, construction, or alteration of individual structures or properties that will reduce flood damages." Proper floodproofing measures can reduce flood vulnerability, however the only way to entirely prevent damage is to relocate the structures (i.e., retreat).
Actions taken to protect property must always be vetted through the Massachusetts Building Code and Wetlands Protection Act. Floodproofing measures permitted for residential structures are more limited than those available to commercial buildings. The following section summarizes approaches to floodproofing that may be used individually or in combination for most commercial buildings. The only options available to residences are relocation or elevation.
3.5.1 Structure Elevation
Elevating a structure requires raising the lowest floor so that it is above the target design level. Almost any structurally sound small building can be elevated. Design standards vary in FEMA V-zones vs. AE-zones. The process becomes more difficult and virtually impossible with a large building that has slab on grade, is constructed out of block or brick, has multiple stories, or is connected to adjacent buildings. Elevation can also create unattractive and hard to manage areas below the buildings. Elevation has gained much wider acceptance in recent years as a means of managing coastal buildings, particularly in residential areas. In commercial buildings, elevation to more than a few feet above street level makes for uninviting and hard to access retail space, so its viability is somewhat limited.
Elevation is the only measure, other than relocation, that can be used to bring a substantially damaged or substantially improved residential structure into compliance with the community’s floodplain management ordinance. It is also permitted in FEMA-mapped velocity zones.
3.5.2 Wet Floodproofing
Modifying the operations and use of existing structures to allow flooding to occur while minimizing property damage is considered "wet floodproofing." Under this scenario, all contents (including utilities) are removed from below the flood elevation, and openings in the building wall are either maintained or increased in size to allow water to readily enter the lower floors. The openings allow the hydrostatic pressure inside and outside the building to equalize, reducing the potential for structural failure. All construction materials that may be inundated may be flood-resistant to avoid deterioration and mold.
3.5.3 Dry Floodproofing
Dry Floodproofing entails making a structure watertight by sealing walls and floors. Openings such as doors, windows, and vents, need to be fitted with removable barriers that can be installed manually or

COASTAL RISK ASSESSMENT AND RESILIENCY STRATEGIES NANTUCKET, MA JANUARY 2020 Page 61
deployed automatically during flood events. The structure being made watertight must be able to withstand the significant hydrostatic pressure that will be exerted on it during a flood event. Dry floodproofing is more often used on non-residential structures and also requires implementation planning to ensure removable barriers are appropriately deployed before floods.
3.5.4 Site-Scale Floodwalls
Floodwalls located around a structure are designed to prevent the encroachment of floodwaters. A well-designed and constructed barrier prevents floodwater from exerting hydrostatic or hydrodynamic forces on buildings, as well as from wetting structures. This avoids the need for retrofits or cleanup. Floodwalls may have openings for access. These can be sealed using automatically closing barriers or manually installed barriers that depend on human intervention when flooding is predicted.
Floodwalls are constructed of a variety of materials, and do not require large amounts of space for construction. They typically are not viable in areas of very deep flooding.
3.5.5 Temporary Barriers
Temporary flood barriers are erected manually only when flooding is imminent. These systems have a lower capital cost than a floodwall or the self-closing barriers described above, but they require human intervention prior to flooding, generating a risk that the installation is not completed and the structures are not protected.
3.5.6 Adaptive Re-Use of Structure
There are some situations in which a structure’s use is more vulnerable than the structure itself, and the site can be made more resilient by changing the use and without significant alteration to the structure. Examples include:
Making lower levels of a building commercial and upper levels residential Elevating all uses to upper levels and creating a floodable first floor Transitioning to a water-dependent use of at-risk buildings
3.5.7 Structure Relocation or Abandonment
Relocating a structure is the most dependable method of reducing flood risks. The method involves moving the structure out of the floodplain away from potential flood hazards. Costs and new sites are usually major concerns associated with building relocation.
Owners of highly vulnerable properties may wish to sell their properties, thereby avoiding the costs of continued protection and maintenance. When appropriate, the Town may wish to acquire such properties and demolish them to prevent new owners from placing themselves in similar risk. The opportunity for the Town to assist residents in this situation should be embraced when it arises, and State and Federal grant funding is available to aid in such purchases.

COASTAL RISK ASSESSMENT AND RESILIENCY STRATEGIES NANTUCKET, MA JANUARY 2020 Page 62
3.6 Regulatory Tools Many of the options listed in this section can be accomplished through, or complemented by, a variety of regulatory tools. Following is a fairly comprehensive summary.
3.6.1 Flood Damage Reduction Code Modification
Municipalities have a handful of tools for increasing the design standards associated with development in flood zones such as modifying the municipal code, zoning regulations, and/or subdivision regulations. There are several methods of increasing building standards to enhance coastal resilience within the framework of these codes and regulations. These are described below:
Freeboard – Freeboard standards require structures to be elevated higher than the level that FEMA requires through National Flood Insurance Program regulations. A freeboard standard of one or more feet provides additional certainty that floods will not damage structures, and addresses difficult-to-determine factors like wave height. The State of Massachusetts has determined that communities may not adopt freeboard that exceeds the State Building Code. By comparison, adjacent states like New York and Connecticut allow communities to adopt more stringent (higher) freeboard than the building code. Nantucket will need to consider freeboard in the future if the State’s policy is changed.
Building Height Standards – It is important to consider the relationship between building height regulations, flood-protection elevation standards, and the economic and social impacts that an exceptionally high structure could have on a neighborhood. Relaxing height limits may help developers or owners comply with both height standards and floodplain elevation requirements.
Applying V Zone Standards in A zones – This requirement would to cause a structure in the coastal A zone to be constructed per V zone standards, incorporating breakaway walls, certain pile foundations, and prohibitions on uses below the first floor. The application of more stringent codes not only protects a given structure, it also protects nearby structures from damage caused by collapsing or floating structures and debris.
Substantial Improvement – If more than fifty percent of the market value of a structure is spent making improvements to that property within a defined “lookback period”, it is considered a “substantial improvement,” and the property must be brought into compliance with the most recent floodplain management code. If the lookback period is one year, a property owner can perform improvements costing fifty percent of the value of a structure over the course of more than one year and not be required to bring the property into compliance. A longer “lookback period” in the definition of substantial improvement leads to a greater number of out-of-code properties being brought into code over time.
3.6.2 Zoning Amendments and Other Regulatory Procedures
Zoning Regulation amendments may be used to help require increases in building standards. Other changes to Zoning Regulations that may be useful for increasing resilience include:
Tidal Marsh Protection and Advancement – Areas suitable for marsh advancement may be regulated under a resource protection model of management.
Transfer of Development Rights – Such that developers continue to own coastal land, but development is relocated to less-sensitive areas.
Flexible Development Process – Clustered development, planned residential development, & open-space subdivision procedures allow development consistent with coastal resiliency.

COASTAL RISK ASSESSMENT AND RESILIENCY STRATEGIES NANTUCKET, MA JANUARY 2020 Page 63
Land Conservation for Marsh Advancement – Protect land through conservation easements, “rolling easements,” and other arrangements. Property would remain privately owned.
Green Infrastructure for Private Property and Homeowner Development – Implement incentives for property owners implementing green infrastructure improvements.
Water Dependent Uses – allow commercial water-dependent uses in residential areas to compensate property owners for loss of value due to restricted development opportunities.
Expedited Permits for Reconstruction after Emergency Events – for work which meets new standards of coastal resiliency.
3.6.3 Zoning Map Overlays
A “future risk area” zoning overlay district may be delineated using projected extents of future daily inundation or future storms of a given intensity. Once adopted, a municipality would have the authority to enact requirements for development or redevelopment within the overlay, including freeboard and application of V zone standards in coastal A zones. Other possibilities may include variable setbacks and buffers or restrictions on what types of renovations or expansions may be permitted for existing buildings.
3.6.4 Rolling Easements
The EPA publication “Rolling Easements” (Titus, 2011) states that “usually, a rolling easement would be either (a) a law that prohibits shore protection or (b) a property right to ensure that wetlands, beaches, barrier islands, or access along the shore moves inland with the natural retreat of the shore.” The term encompasses a broad set of tools that can be used to enable wetlands and beaches to naturally migrate inland without being stopped by shore protections or development.
Rolling easements can be thought of as a combination of the principles of “accommodation” and “retreat.” They allow development of low-lying coastal lands with the conscious recognition that the land will be abandoned as the sea rises to submerge it. From now until the land is threatened, valuable coastal land can be put to its highest use; once the land is threatened, it will convert to wetland or beach as if it had never been developed.
The Titus (2011) document provides a comprehensive description of rolling easements and all the adaptation measures found in this broad collection of techniques.
Regulatory Rolling Easements
Local zoning that restricts shore protection Regulations that prohibit shore protection by state coastal or wetland programs, or require removal
of structures standing on the beach or in the wetlands Building-permit conditions that require public access along the dry beach Building-permit conditions that require public access along the inland side of a new shore protection
structure

Much of EPA’s work in the early 2000a focused on setting the stage for discussions about managed retreat, and this paper was published in 2011.
• A rolling easement is a legally enforceable expectation that the shore or human access along the shore can migrate inland instead of being squeezed between an advancing sea and a fixed property line or physical structure.
• The term refers to a broad collection of legal options, many of which do not involve easements.
• A rolling easement could be either (a) a law that prohibits shore protection or (b) a property right to ensure that wetlands, beaches, barrier islands, or access along the shore moves inland with the natural retreat of the shore.
“If some lands must give way to the rising sea, the economic, environmental, and human consequences could be much less if the abandonment occurs according to a plan rather than unexpectedly.” (Titus, 2011)

COASTAL RISK ASSESSMENT AND RESILIENCY STRATEGIES NANTUCKET, MA JANUARY 2020 Page 65
Property Rights Approaches
Affirmative easements that provide the public with the right to walk along the dry beach even if the beach migrates inland
Conservation easements that prevent landowners from erecting shore protection structures or elevating the grades of their land
Restrictive covenants in which owners are mutually bound to avoid shore protection and allow access along the shore to migrate inland
Future interests that transfer ownership of land whenever the sea rises to a particular level Migrating property lines that move as the shore erodes, enabling waterfront parcels to migrate
inland so that inherently waterfront activities can continue Legislative or judicial revisions and clarifications regarding the inland migration of public access
along the shore and the rights of landowners to hold back the sea Transferable development rights that provide those who yield land to the rising sea the right to build
on land nearby
3.6.5 Land Acquisition
Coastal land acquisition should be pursued for both ecological protection and human use. Coastal land valuable for conservation includes that with ecological significance, existing or potential recreation opportunities, and exceptional or unique coastal conservation value. Factors to consider are the proximity to other protected lands and opportunities to accommodate sea level rise and tidal wetland migration. Sites to consider are undeveloped islands, intact tidal marshland, undeveloped tidally influenced riverine systems, coastal woodlands, bird habitat areas (especially waterfowl areas), anadromous and diadromous fish run areas, and sites that have been shown to have habitat for Federal or State listed threatened, endangered, or species of special concern.
Categories of Land Acquisition
Land acquisition will generally fall into four major categories:
Open Space and Undeveloped Land – including tidal marsh advancement areas Damaged or Vulnerable Property Condemned Property – such as those where providing potable water and disposing of sanitary
wastewater is not possible due to feasibility or expense. Inland Properties –to make up for the loss of lands due to sea level advancement.
3.7 Procedural Tools
In addition to construction of coastal resilience projects, implementation of structural flood protection measures, and development of hazard mitigation ordinances and regulations, municipalities can implement a wide range of procedural tools to increase resilience.

COASTAL RISK ASSESSMENT AND RESILIENCY STRATEGIES NANTUCKET, MA JANUARY 2020 Page 66
These tools include:
Emergency Plans o Preparation o Evacuation o Operation o Recovery
Debris Management Plans Tree and Utility Maintenance Plans Mitigation Project Operation and Maintenance Plans
o Flood Gate Deployment o Levee, Dune, and Beach Maintenance o Stormwater Infrastructure Inspection and Maintenance
3.8 Public and Institutional Education
Creating a community of informed and aware staff and citizens can provide essential support for coastal resilience policies and programs, and can even eliminate the need for some actions. If the reasoning behind a mitigation project is not explained, the public may not support it. If those interested in buying property are fully aware of coastal risks, they may avoid putting themselves in a vulnerable position to begin with. And some measures - such as green infrastructure, mitigation funding opportunities, and evacuation planning - require an informed municipal staff and public.
Education activities may include:
Educating Municipal Officials about coastal hazards, sea level rise, and climate change Training Staff that are responsible for maintaining hazard protection infrastructure Public Meetings and Workshops informing the public of new projects, soliciting public feedback, and
learning about unmet needs Provide Hazard Maps to the public, showing both present and projected hazard zones Mail Newsletters or Pamphlets to residents living in present and projected hazard zones Advise Property Buyers - require real estate agents to inform potential purchasers of properties in
present and projected hazard zones of their risk Provide Flood Protection Information to the Public
Nantucket appointed a Coastal Resiliency Advisory Committee and hired a full time Coastal Resiliency Coordinator in the spring of 2019. Both the committee and the coordinator present opportunities for educating municipal staff and officials, residents, business owners, and other stakeholders about coastal risks and resilience.
COASTAL RISK ASSESSMENT AND RESILIENCY STRATEGIES NANTUCKET, MA JANUARY 2020 Page 67
3.9 Summary of Possible Actions
Table 8 provides a summary of adaptation and resilience methods.
Table 8: Summary of Adaptation Options
Measure Summary Benefits Barriers to Implementation Shoreline Protection
Hard Bank Protection
Structure parallel to shore (seawall, levee, bulkhead, revetment)
Long-lasting Effective at site
False sense of security Expensive maintenance Ecosystem damage Impacts to adjacent properties Difficult to permit
Sediment Management
Structures
Structures reduce wave energy, trap sediment (groins, breakwaters)
Long Lasting May support natural processes
Permitting Down-drift sand deprivation Does not mitigate surge
Beach & Dune Management
Replenish sediment & dunes
Natural processes & habitat Aesthetic & Recreation Value
Regular maintenance Short lifespan if not maintained Limited areas of applicability
Hybrid Techniques
Natural features reduce wave energy, trap sediment. Includes bioengineered banks and artificial reefs.
Natural processes & habitat Aesthetic Value
Somewhat limited areas of applicability
Tidal Wetland Management
Creation/restoration of tidal marsh
Support Critical Habitat Reduce wave energy
Limited areas of applicability Must be very extensive to mitigate surge
Community Infrastructure Protection
Inland Runoff Management
Slow & store water upstream, lower stress in low coastal areas
Prevent exacerbation of coastal issues Support other measures
Cost Maintenance
Surcharge Prevention
Drain low areas while preventing backflow
Support other protection methods
May be expensive Requires maintenance Doesn’t address direct hazards
Transportation Infrastructure
Elevate roads or create alternative egresses
Protect emergency access and evacuation Impact on adjacent properties
Water Distribution
Protect public water system sources & distribution
Maintain critical infrastructure, quality of life, property values
Cost
Wastewater Treatment
Protect sewer lines, pumping stations, & treatment facilities
Maintain critical infrastructure Avoid compounding hazards
Cost

COASTAL RISK ASSESSMENT AND RESILIENCY STRATEGIES NANTUCKET, MA JANUARY 2020 Page 68
Measure Summary Benefits Barriers to Implementation Property Protection
Elevation Raise structure above flood level
Reduce insurance premium Open to residences Permitted in V zones
Harder to access "Dead space" under structure Difficult for some buildings
Wet Floodproofing
Retrofit lowest floor to allow flooding Relatively inexpensive Extensive post-flood cleanup
Inappropriate for most residential
Dry Floodproofing
Waterproof structure Barriers at openings
Relatively inexpensive Doesn’t require extra space
Manual barrier installation Subject to storm predictions Vulnerable to flow & waves Inappropriate for most residential
Site-Scale Floodwalls
Install concrete or earth barriers on property
Prevent water contact with structure & need for retrofits
May require large area Obstructs views
Temporary Flood Barriers
Deployable & removable barriers
Prevent water contact with structure & need for retrofits Relatively inexpensive
Manual installation Subject to storm predictions Short-term only
Relocation Move structure to safer location
All vulnerability removed Open to residences
Cost, decreased value of new site Loss of Neighborhood Cohesion
Adaptive Re-use
Maintain structure, change to floodable use Low disruption, low cost Limited applicable uses
Risk persists
Acquisition & Demolition
Sell property & convert to public open space
Landowner compensated All vulnerability removed Public & habitat benefit
Municipal Cost Loss of Neighborhood Cohesion Requires landowner interest
Regulatory Tools Floodplain
Management Increase standards for structures in risk zones
Protect new & improved construction
Older structures often exempt Doesn’t address climate change
Zoning Regulations
Prevent hazardous development patterns, allow inland migration
Control level of risk in hazard areas, plan for future changes, integrate multiple priorities
Balance with economic pressures Public pushback possible
Rolling Easements
Legal & property-right measures encourage
gradual inland migration
Work with landowners for mutual benefit
Private landowner may not be willing partners
Public and Institutional Education Education and
Outreach Keep municipal staff and
the public informed Public & institutional support for other policies & programs None

COASTAL RISK ASSESSMENT AND RESILIENCY STRATEGIES NANTUCKET, MA JANUARY 2020 Page 69
3.10 Resiliency Measure Preferences Identified Through Public Participation
Members of the public were invited to participate in development of this plan through two public workshops and an online survey. Both workshops were held at the Nantucket Police Department at 4 Fairgrounds Road; the first took place on May 10 and the second on July 18, 2019. Thirty-five (35) individuals attended the May meeting and thirty-one (31) individuals attended in July. Each public meeting consisted of a presentation on the Coastal Resiliency Plan project, and provided opportunities for public participation and feedback through “clicker” voting during the presentation, “sticker” voting on posters, comment cards, and open forum discussions. The online survey was posted from May 10 through August 26, 2018, and received 153 responses.
The information collected through those engagement efforts has been incorporated throughout this Report; in addition, the opinions of members of the public about resiliency measures are specifically highlighted here.
Approaches to Resilience
Nantucket residents who attended the two workshops were asked about their preferred approach to building resilience on Nantucket. Responses are summarized in Table 9.
Table 9: Preferred Approach to Resilience, identified by Workshop Participants
Approach # Selecting Some combination of the below 50 Retreat from at-risk areas 5 Protect at-risk areas 5 Accommodate hazards by adjusting structures and behavior 3 I don't know yet 3
These results show that Nantucket residents recognize the need to approach resilience from many angles, and to use a variety of different tools.
A similar question, but specific to erosion hazards, was asked in the online survey. Responses are summarized in Table 10.
Table 10: Preferred Approach to Erosion, identified by Survey Respondents
Approach #
Selecting Efforts to slow erosion should be made, and beach and dune nourishment used to replace lost land 41 Erosion cannot be controlled, therefore at-risk assets must be relocated 29 Efforts to slow erosion should be made while at-risk assets are relocated 25 Erosion is a natural force; do nothing other than removal and cleanup of failing structures and infrastructure 13
Erosion should be stopped at all costs 10
The results of this question reflect a variety of perspectives on erosion mitigation. Most respondents prefer some effort be made to slow erosion, but few are in favor of aggressive erosion prevention measures.

COASTAL RISK ASSESSMENT AND RESILIENCY STRATEGIES NANTUCKET, MA JANUARY 2020 Page 70
Resiliency Approach by Neighborhood
Workshop participants were asked to indicate their thoughts about resilience for each neighborhood of Nantucket. Planning Neighborhoods were grouped for the purposes of this activity to limit the amount of voting attendees were required to do. Results are presented in Table 11. The most frequently chosen resiliency approach for each neighborhood is bolded.
Results show that protection is preferred for the airport area. Protection and accommodation are tied for the Downtown and Brant Point neighborhoods, while protection and “accommodation then retreat” are tied for the neighborhoods on the south side of Nantucket Harbor. “Accommodate then retreat” is the top-ranked approach for Cliff Road and Maddequet/Eel Point, Madaket and Sheep Pond Road, Tom Nevers/Southeast Quarter, Quidnet and Wauwinet, and Coatue/Great Point. The most frequently chosen approach for Siasconset was retreat. It is important to note that the distribution of votes is relatively even for most neighborhoods, indicating a wide range of opinions.
Table 11: Primary Risks for Nantucket Neighborhoods
Resiliency Approach
Dow
ntow
n/Br
ant P
oint
Cl
iff R
oad/
Mad
dequ
et/E
el P
oint
Mad
aket
/She
ep P
ond
Rd
Cisc
o/Hu
mm
ock
Pond
/ M
iaco
met
/Sou
th S
hore
/Sur
fsid
e
Airp
ort A
rea
Tom
Nev
ers/
Sout
heas
t Qua
rter
Sias
cons
et
Qui
dnet
/Wau
win
et
Poco
mo/
Polp
is/S
haw
kem
o/
Qua
ise/
Mon
omoy
/Mid
-Isla
nd
Coat
ue/G
reat
Poi
nt
Protect 43% 19% 15% 24% 35% 15% 18% 11% 30% 17% Accommodate 43% 28% 27% 32% 30% 21% 24% 25% 24% 23% Accommodate then Retreat 10% 33% 31% 29% 18% 38% 26% 38% 30% 34% Retreat 3% 21% 27% 14% 16% 26% 32% 25% 16% 26%

COASTAL RISK ASSESSMENT AND RESILIENCY STRATEGIES NANTUCKET, MA JANUARY 2020 Page 71
3.11 Suggested Policy Considerations for Nantucket Resilience Many of the actions listed above are applicable in different parts of Nantucket, and many are already implemented as needed by private property owners and by the Town. Other documents, such as the Hazard Mitigation Plan and the Municipal Vulnerability Preparedness Program report, recommend specific actions for specific areas. In this section, policy tools that can be used to guide Island-wide coastal hazard mitigation and resilience-building are suggested. Specific actions are not necessarily identified; rather, frameworks to inform which actions should be pursued and when are offered. Resources and case studies that Nantucket can use to inform development of its own suite of coastal resiliency policies are presented throughout this section. 3.11.1 Managed Retreat Policy Nantucket has been dealing with a rapidly eroding shoreline (particularly on the south coast, but also on the eastern and northwestern shorelines) for as long as it has existed. Protocols and precedence already exist for relocation of threatened structures to inland locations, both on the same parcel or to a completely new location.
Nantucket can further empower and encourage residents to take the steps required for retreat, when eroding shorelines make it necessary, by adopting a managed retreat policy. This policy could choose from an array of regulatory and zoning tools, including:
Prohibitions on construction of new shore protection structures in some areas Revised zoning that slates certain areas for protection and others for eventual accommodation of
erosion or sea level rise Implementation of overlay zoning that prohibits protection and encourages accommodation of
erosion or sea level rise Coastal setbacks that migrate inland with the shoreline Easements, including conservation and public access, that restrict development within a given
distance from the shoreline Buyouts of coastal property-owners Land / Density swaps or transfers of development rights that allow developers in-kind
development rights in a location that is not at risk in exchange for them giving up their development rights in an at-risk location
Requirements that property sellers inform buyers of flood, sea level rise, or erosion risks Rebuilding restrictions following a disaster (this can be accomplished, for example, through more
stringent Substantial Damage [SD] definitions)
A managed retreat policy can also promote landward migration of tidal wetlands around Nantucket Harbor as sea levels continue to rise. Undeveloped areas adjacent to existing tidal wetlands that do not have hard protection separating them from those wetlands may be available for future wetland migration, and should be considered for protection. Mapping tools such as the Marsh Migration Zones map produced by the North Atlantic Landscape Conservation Cooperative (Ruddock, 2017; https://nalcc.databasin.org/datasets/) can be referenced for guidance as well.

The Hawaii Coastal Zone Management Program commissioned an assessment of managed retreat, completed in 2019. The report presents the following lessons learned about managed retreat programs:• Support for retreat rises as risks rise.• Greater support occurs in post-disaster periods.• Regulations limiting rebuilding can facilitate.• Incentives and opportunities for places to move
to (versus from) may be necessary.• Opportunities for communities to stay together
are desirable.
When considering managed retreat, the following key questions should be asked:• What criteria determine if retreat is the solution? • What are the priorities? Infrastructure, cultural
sites, or property owner rights?• What are the costs and tax implications? • What land is available to retreat to?• Who will shoulder the financial burden?• What are the legal issues to be addressed?
Some of the tools noted in the report include:• Restrictions on hard protection measures.• Buyouts, typically funded by State or Federal.• Conservation easements• Land / Density Swaps: in-kind development rights
in a different location• Require property seller to inform buyers of flood,
sea level rise, or erosion risks• Rebuilding restrictions following a disaster.• Rolling easements promote inland migration • Transfer of development rights.

COASTAL RISK ASSESSMENT AND RESILIENCY STRATEGIES NANTUCKET, MA JANUARY 2020 Page 73
3.11.2 Protection and Elevation Policy for Downtown and Brant Point While managed retreat is reasonable for some areas of the Island, it is not for the Downtown and Brant Point neighborhoods due to the significant concentration of economic, infrastructural, cultural, and other values within those areas. For those neighborhoods, Nantucket can develop and adopt policies for asset protection and elevation.
Factors that this policy may consider include:
Historic Preservation and Adaptation – the Downtown Neighborhood encompasses a National Register Historic District, and many buildings outside that district in both the Downtown and Brant Point neighborhoods are also historic. Guidelines for protective measures that can be implemented while preserving the historic character of those properties can be adopted.
Historic Preservation and Hazard Response – Nantucket can consider historic property needs during the response and recovery phase of a natural disaster before the disaster occurs. Having a historic preservation professional on-hand can help avoid losses to historic properties beyond what has already occurred during the hazard event.
Access – as individual property owners pursue resilience, the roads to and from those properties will need to be made resilient as well. The Town can prioritize roads for elevation to maintain access during flood events. Downtown, the streets oriented north-south (Easy Street, South Water Street, Washington Street) tend to be the most heavily trafficked, and elevation of those roads may serve to protect inland areas. On the other hand, elevation of east-west oriented streets (Main Street, Broad Street) may be easier to accomplish because a shorter length of road is located in the flood zone, and they may provide easier access to higher ground.
Street Trees – as these neighborhoods are exposed to coastal flooding more and more frequently, trees that are less able to cope with seawater will not be able to survive. Nantucket should focus on planting saltwater-resistant trees as street trees are replaced.
Business Disruption – elevating businesses may affect customer traffic and business visibility. Adaptation measures that minimize and mitigate negative impacts on the ability of businesses to operate successfully should be identified.
Streetscape – the streetscapes of the Downtown and Brant Point neighborhoods, or the aesthetics of the areas that give them their unique sense of place and identity, must be preserved through the process of adaptation.
Land Surface Elevation – Consider elevation of the land surface itself before daily inundation risks become impossible to manage through the above methods.

This plan was published in 2019 and lays out four resiliency goals: Inclusive Growth, Climate Action,Smarter DC, and Safe and Healthy Washingtonians.Specific strategies listed include:
• Carbon neutrality by 2050• “Green” and hazard resilient neighborhoods.• Interactive climate adaptation tracking tool.• Adaptation policy, guidance, and procedures.• Resilience Hubs and Corps for Social resilience.• Install a microgrid.• Invest in climate action.
A key strategy of the plan is to retrofit, relocate, or remove all at-risk buildings by 2050. This includes public and private buildings.
• Climate projections will be used to identify buildings at risk.
• Existing regulations will be assessed and new tools developed to promote adaptation.
• Policies and programs will be developed to support the relocation and removal of uses in areas where building retrofits are inadequate or too expensive, given the level of risk.

COASTAL RISK ASSESSMENT AND RESILIENCY STRATEGIES NANTUCKET, MA JANUARY 2020 Page 75
3.11.3 Design Guidance for Coastal Hazard Mitigation Infrastructure Inconsistent or poorly implemented hazard mitigation infrastructure may not provide the protection intended. For example, a high seawall can be circumvented by floodwaters if the protection measures of adjacent properties are not on par.
Adopting design guidance for coastal hazard mitigation infrastructure will allow both private property owners and the municipality to protect individual assets they find important while integrating those actions with an Island-wide resiliency strategy.
Guidance may include:
Elevation Requirements – flood protection structures should be built to consistent and appropriate elevations based on local base-flood elevations and sea level rise projections. Other infrastructure such as roads and utility pipes, should similarly be built to appropriate elevations.
Design Best Practices – guidance on measures to minimize negative outcomes from construction of new coastal infrastructure is essential. Factors such as the impacts a new structure will have on wave runup, inland ponding, and scour should be considered in the development of such guidance.
Materials – information should be provided on what types of materials are appropriate in different environments.
Methods to Minimize Neighboring Impacts – coastal protection infrastructure frequently deflects wave energy onto neighboring properties. Guidance should be provided on how to avoid or minimize this outcome.
Encouragement of Neighborhood-Scale Protection Measures – to minimize the negative effects of coastal protection infrastructure on neighboring properties, property owners should be encouraged to collaborate with their neighbors to pursue coastal protection.
Guidelines on when to Protect, Withstand, Adapt, or Relocate – protecting an asset as-is may not always be feasible, prudent, or safe.
Additionally, construction of new “hard” coastal protection infrastructure should be limited as much as possible. The Nantucket shoreline is an incredibly dynamic environment, and coastal structures inevitably effect those coastal processes and cause undesired or unforeseen consequences. On the erosive sections of coast, hard structures deflect energy onto neighboring parcels, exacerbating erosion in those areas. Along Nantucket Harbor, hard structures interfere with important interactions between coastal wetlands and upland habitats, and disrupt the inland migration of those wetlands, a process necessary for the survival of those ecosystems with rising seas.
New York City Climate Resiliency Design Guidelines (2019) require every capital project be constructed to a Design Elevation equal to the base flood elevation of the nearest flood zone, plus projected sea level rise at the end of the design lifespan, plus freeboard (12 inches for non-critical and 24 inches for critical facilities). The Port Authority of NY & New Jersey Climate Resilience Design Guidelines (2018) are similar, with specific sea level rise values defined based on the planning period for which infrastructure is being designed.
The Port Authority of NY & NJ Design Flood Elevation Guidelines (all values in inches):
Critical Design Year SLR Freeboard DFE No 2021-2050 +16 +12 FEMA BFE + 28 No 2051-2080 +28 +12 FEMA BFE + 40 No 2081+ +36 +12 FEMA BFE + 48 Yes 2021-2050 +16 +24 FEMA BFE + 40 Yes 2051-2080 +28 +24 FEMA BFE + 52 Yes 2081+ +36 +24 FEMA BFE + 60

This document provides guidelines for making facilities resilient to rising heat, precipitation, and sea and coastal flood levels. Version 3 is current.
• Guidance is provided on minimizing heat impacts to a facility. Future heat conditions are provided to be incorporated into design, including the number of annual heat waves and days above 90-degrees.
• The current 50-year intensity-duration-frequency curve should be used as a proxy for 5-year storms in the 2080s. Design criteria are given for infiltration, detention, and storage.
• All capital projects, even if not in a current 100-year flood zone, must be evaluated for inundation risks using the NYC Flood Hazard Mapper. Design Flood Elevations are determined by taking the current base flood elevation of the flood zone (or nearest flood zone), adding sea level rise, and adding “freeboard.” Freeboard requirements are 12 inches for non-critical and 24 inches for critical facilities.
The guidelines provide toolkits to help with resiliency building. These include:
• Exposure Screening Tool: identify climate change hazards and risks of a particular project.
• Risk Assessment Methodology: risk analysis for projects that rank on the screening tool.

Guidelines are provided for Port Authority projects located in a current or projected future coastal flood zone. The Future Flood Risk Mapper application is used to determine future flood zone extents.
The guidance for determining design flood elevation includes these steps:
1. Current FEMA BFE of nearest flood zone.
2. Add sea level rise adjustment based on design life end year:
1. 2021-2050: 16 inches2. 2051-2080: 28 inches3. 2081 onward: 36 inches
3. Add freeboard based on criticality:1. Not critical: 12 inches2. Critical: 24 inches
Critical? Design Year SLR Freeboard DFENo 2021-2050 +16 +12 FEMA BFE + 28No 2051-2080 +28 +12 FEMA BFE + 40No 2081+ +36 +12 FEMA BFE + 48Yes 2021-2050 +16 +24 FEMA BFE + 40Yes 2051-2080 +28 +24 FEMA BFE + 52Yes 2081+ +36 +24 FEMA BFE + 60

In 2015, San Francisco convened an interagency task force to develop a Sea Level Rise Action Plan (SLRAP). The plan recommend specific sea level rise projections: a “likely scenario” and an “upper end of range”
The plan resulted in guidance for Incorporating Sea Level Rise Into Capital Planning in San Francisco:
• Provides examples for specific capital projects.
• Presents step-by-step process for identifying an appropriate “Project Design Tide Elevation”
1. Select planning horizon (asset’s functional lifespan)
2. Choose appropriate sea level rise projection
3. Identify “base elevation” based on location
4. Design Tide Elevation is the amount of sea level rise that will occur by the end of the planning horizon (step 1), based on the projection selected (step 2), plus the base elevation (step 3).

Guidelines for mostly green or green/gray resilient development in flood hazard areas. Puts forward 6 steps:
1. Site assessment and planning: create an interdisciplinary team and engage the community.
2. Responsible siting and coastal risk reduction: minimize risk, consider ecological impacts, and provide emergency plans.
3. Community access and connections: create community benefits such as access, recreation, education, and programming.
4. Edge resilience: use appropriate shoreline stabilization when necessary.
5. Natural resources: support habitats and be environmentally friendly.
6. Innovation: encourage innovative design
An appendix provides a guide for decision-making about where specific stabilization measures are appropriate, based primarily on the habitat value of each measure.

COASTAL RISK ASSESSMENT AND RESILIENCY STRATEGIES NANTUCKET, MA JANUARY 2020 Page 80
3.11.4 Beach Nourishment Beach nourishment can be an effective means of offsetting the effects of erosion for some parts of Nantucket. Many beaches around the Island are privately owned (above the high tide line), and obtaining the necessary permits for beach nourishment is a legally complicated process. The Town can work to make this action more streamlined by advising applicants to use the best resources and guidance available prior to navigating the permitting process. Guidelines about permissible beach fill types and beach profile designs can be developed for Nantucket, or the State’s guidance can be used (https://www.mass.gov/files/documents/2016/08/op/bchbod.pdf).
3.11.5 Substantial Damage / Substantial Improvement Regulations Nantucket does not have a specific definition of Substantial Damage or Substantial Improvement (SD/SI) in its regulations, however the Massachusetts State Building Code does. There, Substantial Damage is defined as any damage incurred by a structure that costs 50% or more of the value of the structure, before the damage, to repair. Substantial Improvement is defined as any project that costs 50% or more of the value of the structure before the project is begun. Floodplain regulations require that any pre-existing, non-compliant structure that experiences Substantial Damage or undergoes a Substantial Improvement project must be brought into compliance with the most recent regulations.
These requirements can be strengthened by extending the Substantial Improvement definition to include the cumulative costs of project occurring over a year or multi-year period. Such a change in definition would require more structures more quickly to be brought into compliance with the most recent floodplain codes.
3.11.6 Resilience Plan for Public Ferries An issue that has been identified by the Town on a number of occasions is the risk to the community’s ability to transport people, goods, and supplies to and from mainland Massachusetts by way of ferries docking in Nantucket Harbor. Weather, such as high winds or waves, ice in the harbor, and fog, can already interrupt ferry services. With climate change and sea level rise, weather-related interruptions may increase while the land-based ferry facilities both on Nantucket and on mainland Massachusetts will be threatened by rising seas and severe storms. If a severe event were to cause a shipwreck or deposition of other debris into the narrow channel between Coatue and Brant Point, all water traffic to and from the Island would be blocked.
Nantucket can develop a resilience plan for off-island transportation. This plan may cover:
Adaptation of port facilities: so that they continue to be usable as sea level continues to rise; adaptation should include roads that provide access to the ferry facilities
Secondary port locations: such as Madaket Harbor, so that existing ferries or smaller replacement ships can continue to travel to the Island; such a secondary location may be temporary, until access to the primary wharfs is restored
Emergency travel contingencies: these may include plans to temporarily use air transportation including airplanes and helicopters
Coordination with connecting communities: such as Hyannis and New Bedford, to make sure ferry travel is resilient at both ends of the route

COASTAL RISK ASSESSMENT AND RESILIENCY STRATEGIES NANTUCKET, MA JANUARY 2020 Page 81
3.11.7 Municipal Facilities Key municipal facilities located in at-risk areas will need to be relocated over time. The prime example of this is the current location of the municipal building on Washington Street, which has experienced flooding in the past. Important documents are stored in this building. Relocation of this facility may be approached in multiple stages, with key documents and materials being relocated inland first, and operations relocated at a later date.
A municipal facility relocation policy may consider:
Further identification of at-risk facilities Relocation of facilities over the long-term Relocation of key documents or equipment on the short term Emergency plans in case flooding occurs before relocation can be implemented
3.11.8 Business Resilience Nantucket’s business community is essential to the Town’s economic health, and many of those businesses are at risk from coastal hazards. Not only is the downtown commercial core of the Town at risk from flooding, but many tourist-based industries are particularly vulnerable to changing climate conditions, and all Nantucket business is vulnerable to interruption of transportation between the Island and the mainland. For these reasons, Nantucket should work to foster resilience within its business community.
Business resilience can be improved through implementation of risk reduction strategies that fall into the following categories:
Structural Risk Reduction: actions that increase the resilience of a business’s physical site. These may include completing structural retrofits, elevation or floodproofing a building, installing flood barriers, upgrading drainage systems, acquiring a sump pump, storing emergency materials or supplies on site, securing outdoor items that could become debris, installing green infrastructure, or relocating a structure away from the risk zone.
Operational Risk Reduction: actions that increase the ability for a business to continue operations following an event. These may include diversifying services offered, securing multiple vendors, acquiring off-site storage locations, establishing partnerships with other businesses, writing up emergency preparation and response plans, installing backup generators, or backing up business files and data on the cloud.
“Fallout” Risk Reduction: actions that minimize the impact that business interruption, site damage, or revenue loss will have on a business. These may include signing a flexible lease that protects a business from having to pay rent if the building is not accessible, or purchasing insurance policies that cover floods, contents, and business interruption.
Nantucket can work with business owners to identify business resiliency needs and barriers. The Town can create a regulatory framework that encourages businesses to take the actions summarized above, and provide other incentives, assistance, and support. A selection of options available to businesses, sourced from a Statewide small-business risk-assessment and risk-reduction initiative performed in 2019 in Rhode Island, can be found at http://climatechange.ri.gov/businesses/small-biz.php.

COASTAL RISK ASSESSMENT AND RESILIENCY STRATEGIES NANTUCKET, MA JANUARY 2020 Page 82

COASTAL RISK ASSESSMENT AND RESILIENCY STRATEGIES NANTUCKET, MA JANUARY 2020 Page 83
4 Implementation and Resources

COASTAL RISK ASSESSMENT AND RESILIENCY STRATEGIES NANTUCKET, MA JANUARY 2020 Page 84

COASTAL RISK ASSESSMENT AND RESILIENCY STRATEGIES NANTUCKET, MA JANUARY 2020 Page 85
The newly-formed Coastal Resiliency Coordinator position within the Natural Resources Department is the appropriate entity for prioritizing and tracking the actions and strategies presented in this plan. The creation of this position by the Town will ensure that objectives from the CRARS Report are addressed in a coordinated manner with other planning documents such as the Hazard Mitigation Plan, Master Plan, and Harbor Management Plan.
4.1 Implementation Framework This plan is intended to inform and interact with other municipal planning documents and resiliency-building initiatives over time. Implementation of the policy recommendations presented in this plan will create a regulatory framework within the community that encourages and supports integration of resiliency concepts throughout municipal plans, agencies, and commissions. As coastal resilience becomes an integral part of municipal operations, the Town will be more able to seize opportunities to enact specific actions and strategies described in Chapter 3 of this Plan.
This Report should interface with the Town’s Hazard Mitigation Plan (HMP) during every five-year HMP update process (as required by FEMA). The appropriate actions and strategies identified in this Report should be listed in the HMP for implementation over the following five-year cycle (i.e, those which represent segments of projects that may be eligible for FEMA and other funding sources accessed by an HMP). At the same time capabilities, vulnerabilities, and risks identified during the HMP update process can be incorporated into an updated CRARS Report. Through this back-and-forth “communication,” the CRARS can remain a relevant, “living” document into the future. Note that it is recommended that the CRARS remain a separate document from the HMP in order to maintain its flexibility and local, municipal control while avoiding the constraints imposed by FEMA Region 1.
Figure 8: Conceptual Model of Implementation Framework

COASTAL RISK ASSESSMENT AND RESILIENCY STRATEGIES NANTUCKET, MA JANUARY 2020 Page 86
4.2 Funding and Resources State Sources
Massachusetts Municipal Vulnerability Preparedness Action Grants The Municipal Vulnerability Preparedness (MVP) Action Grant supports municipalities seeking to implement top-priority resiliency actions identified through the Community Resilience Building process. Municipalities who have received designation from the Executive Office of Energy and Environmental Affairs (EEA) as an “MVP Community”. The municipality is required to match 25% of total project cost using cash or in-kind contributions.
Project types may include:
Detailed Vulnerability and Risk Assessment Public Education and Communication Local Bylaws, Ordinances, Plans, and other Management Measures Redesigns and Retrofits Nature-Based Storm-Damage Protection, Drought Prevention, Water Quality, and Water Infiltration
Techniques Nature-Based, Infrastructure and Technology Solutions to Reduce Vulnerability to Extreme Heat and
Poor Air Quality Nature-Based Solutions to Reduce Vulnerability to other Climate Change Impacts Ecological Restoration and Habitat Management to Increase Resiliency
Nantucket has already successfully tapped into this resource to establish a Coastal Resiliency Coordinator.
Massachusetts Coastal Resiliency Grant Program The Massachusetts Office of Coastal Zone Management (CZM) administers the Coastal Resilience Grant Program to provide financial and technical support for local efforts to increase awareness and understanding of climate impacts, identify and map vulnerabilities, conduct adaptation planning, redesign vulnerable public facilities and infrastructure, and implement non-structural and green infrastructure approaches that enhance natural resources and provide storm damage protection.
Grants are available for a range of coastal resilience approaches. The grant program is open to municipalities and nonprofits\ that own publicly-accessible coastal property.
Eligible projects must fit one of the following categories:
Detailed Vulnerability and Risk Assessment Public Education and Communication Local Bylaws, Adaptation Plans, and other Management Measures Redesigns and Retrofits Nature-Based Storm -Damage Protection Techniques

COASTAL RISK ASSESSMENT AND RESILIENCY STRATEGIES NANTUCKET, MA JANUARY 2020 Page 87
Massachusetts Department of Environmental Protection Water Utility Resilience Program The MassDEP Water Utility Resilience Program (WURP) supports local drinking water and wastewater utilities build resilience to severe weather events. WURP works closely with the MassDEP Emergency Preparedness Officer to incorporate climate resilience into an all-hazards approach to technical assistance. Specific support WURP provides includes:
Critical Infrastructure Mapping Emergency and Security Preparedness Training Drinking Water Program Emergency Response Planning Climate Change Information and Resources
Regional Sources
Northeast Regional Ocean Council (NROC) NROC is a state/federal partnership that facilitates the New England states, federal agencies, regional organizations, and other interested regional groups in their efforts to address ocean and coastal issues from a regional perspective. NROC builds capacity of New England communities through training and by making decision support tools, maps, and other coastal resiliency information easily available to decision makers at relevant scales and formats. A small grants program has been conducted in the past to improve the region's resilience and response to impacts of coastal hazards and climate change. Nantucket should stay apprised of any new grant opportunities that may arise in the future.
Federal Sources
National Oceanic and Atmospheric Administration (NOAA) Regional Coastal Resilience Grants NOAA is committed to helping coastal communities address increasing risks from extreme weather events, climate hazards, and changing ocean conditions. To that end, NOAA's National Ocean Service is providing funding through competitive grant awards through the Regional Coastal Resilience Grants program. Awards are made for project proposals that advance resilience strategies, often through land and ocean use planning; disaster preparedness projects; environmental restoration; hazard mitigation planning; or other regional, state, or community planning efforts. Successful proposals demonstrate regional coordination among project stakeholders, leverage resources (such as funds, programs, partnerships, and others), and create economic and environmental benefits for coastal communities. Project results are evaluated using clear measures of success, with the end goal being improved preparation, response, and recovery.
Eligible applicants include nonprofit organizations; institutions of higher education; regional organizations; private (for profit) entities; and local, state, and tribal governments. Award amounts typically range from $500,000 to $1 million for projects lasting up to 36 months. Cost sharing through cash or in-kind matches is expected. Applicants must conduct projects benefiting coastal communities in one or more of the 35 U.S. coastal states or territories.

COASTAL RISK ASSESSMENT AND RESILIENCY STRATEGIES NANTUCKET, MA JANUARY 2020 Page 88
U.S. Department of Housing and Urban Development (HUD) Community Development Block Grant (CDBG) The Massachusetts Department of Housing and Community Development (DHCD) administers the CDBG program in the Commonwealth. The CDBG program provides financial assistance to eligible municipalities in order to develop viable communities by providing affordable housing and suitable living environments, as well as expanding economic opportunities, principally for persons of low and moderate income. It is possible that the CDBG funding program could be applicable for floodproofing and elevating residential and nonresidential buildings, depending on eligibility of those buildings relative to the program requirements.
CDBG Disaster Recovery (CDBG-DR) After disaster declarations, and when funds are appropriated to HUD and the Massachusetts DHCD, the Town of Nantucket should apply for CDBG-DR grants.
Natural Resources Conservation Service (NRCS) The NRCS provides technical assistance to individual landowners, groups of landowners, communities, and soil and water conservation districts on land use and conservation planning, resource development, stormwater management, flood prevention, erosion control and sediment reduction, detailed soil surveys, watershed/river basin planning and recreation, and fish and wildlife management. Financial assistance is available to reduce flood damage in small watersheds and to improve water quality. Two major programs are described below.
Emergency Watershed Protection Program (EWP) Through the EWP program, the U.S. Department of Agriculture's NRCS can help communities address watershed impairments that pose imminent threats to lives and property. Most EWP work is for the protection of threatened infrastructure from continued stream erosion. NRCS may pay up to 75% of the construction costs of emergency measures. The remaining costs must come from local sources and can be made in cash or in-kind services. No work done prior to a project agreement can be included as in-kind services or part of the cost share. EWP projects must reduce threats to lives and property; be economically, environmentally, and socially defensible; be designed and implemented according to sound technical standards; and conserve natural resources.
Watersheds and Flood Prevention Operations This program element contains two separate and distinct programs, "Watershed Operations" and "Small Watersheds." The purpose of these programs is to cooperate with state and local agencies, tribal governments, and other federal agencies to prevent damages caused by erosion, floodwater, and sediment and to further the conservation, development, utilization, and disposal of water and the conservation and utilization of the land. The objectives of these programs are to assist local sponsors in assessing conditions in their watershed, developing solutions to their problems, and installing necessary measures to alleviate the problems. Measures may include land treatment and structural and nonstructural measures. Federal cost sharing for installation of the measures is available. The amount depends upon the purposes of the project.
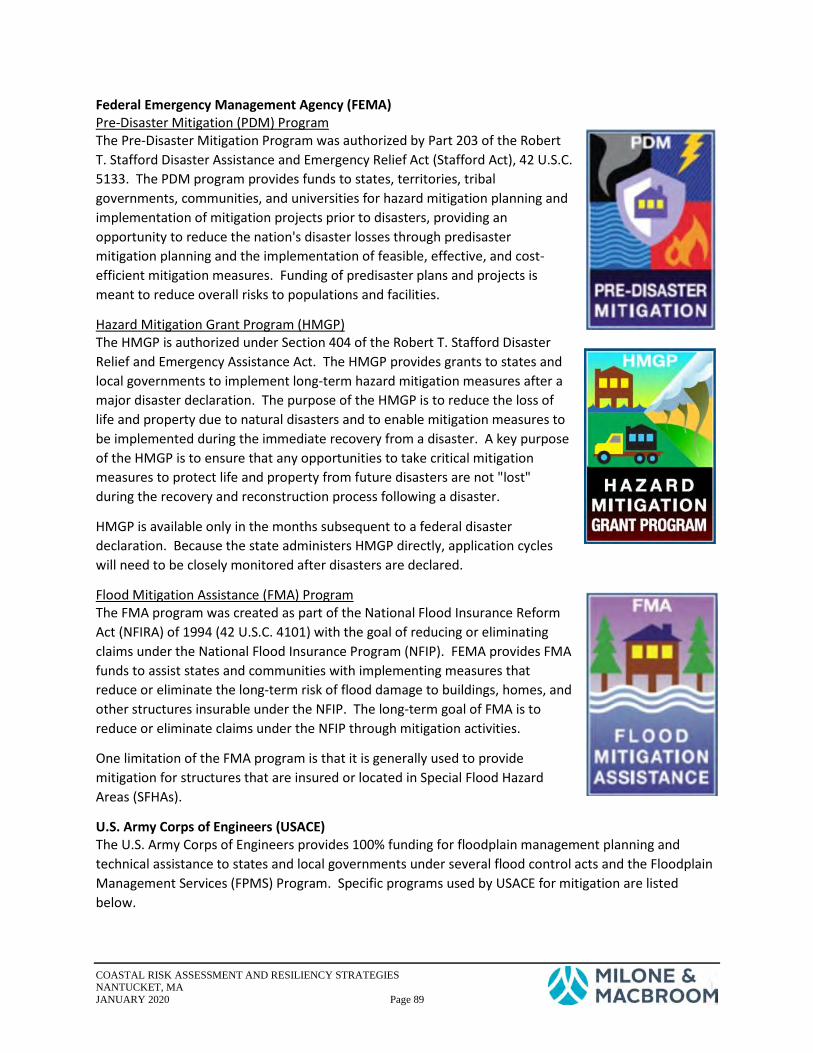
COASTAL RISK ASSESSMENT AND RESILIENCY STRATEGIES NANTUCKET, MA JANUARY 2020 Page 89
Federal Emergency Management Agency (FEMA) Pre-Disaster Mitigation (PDM) Program The Pre-Disaster Mitigation Program was authorized by Part 203 of the Robert T. Stafford Disaster Assistance and Emergency Relief Act (Stafford Act), 42 U.S.C. 5133. The PDM program provides funds to states, territories, tribal governments, communities, and universities for hazard mitigation planning and implementation of mitigation projects prior to disasters, providing an opportunity to reduce the nation's disaster losses through predisaster mitigation planning and the implementation of feasible, effective, and cost-efficient mitigation measures. Funding of predisaster plans and projects is meant to reduce overall risks to populations and facilities.
Hazard Mitigation Grant Program (HMGP) The HMGP is authorized under Section 404 of the Robert T. Stafford Disaster Relief and Emergency Assistance Act. The HMGP provides grants to states and local governments to implement long-term hazard mitigation measures after a major disaster declaration. The purpose of the HMGP is to reduce the loss of life and property due to natural disasters and to enable mitigation measures to be implemented during the immediate recovery from a disaster. A key purpose of the HMGP is to ensure that any opportunities to take critical mitigation measures to protect life and property from future disasters are not "lost" during the recovery and reconstruction process following a disaster.
HMGP is available only in the months subsequent to a federal disaster declaration. Because the state administers HMGP directly, application cycles will need to be closely monitored after disasters are declared.
Flood Mitigation Assistance (FMA) Program The FMA program was created as part of the National Flood Insurance Reform Act (NFIRA) of 1994 (42 U.S.C. 4101) with the goal of reducing or eliminating claims under the National Flood Insurance Program (NFIP). FEMA provides FMA funds to assist states and communities with implementing measures that reduce or eliminate the long-term risk of flood damage to buildings, homes, and other structures insurable under the NFIP. The long-term goal of FMA is to reduce or eliminate claims under the NFIP through mitigation activities.
One limitation of the FMA program is that it is generally used to provide mitigation for structures that are insured or located in Special Flood Hazard Areas (SFHAs).
U.S. Army Corps of Engineers (USACE) The U.S. Army Corps of Engineers provides 100% funding for floodplain management planning and technical assistance to states and local governments under several flood control acts and the Floodplain Management Services (FPMS) Program. Specific programs used by USACE for mitigation are listed below.

COASTAL RISK ASSESSMENT AND RESILIENCY STRATEGIES NANTUCKET, MA JANUARY 2020 Page 90
Section 205 – Small Flood Damage Reduction Projects This section of the 1948 Flood Control Act authorizes USACE to study, design, and construct small flood control projects in partnership with nonfederal government agencies. Feasibility studies are 100% federally funded up to $100,000 with additional costs shared equally. Costs for preparation of plans and construction are funded 55% with a 35% nonfederal match. In certain cases, the nonfederal share for construction could be as high as 50%. The maximum federal expenditure for any project is $7 million.
Section 14 – Emergency Streambank and Shoreline Protection This section of the 1945 Flood Control Act authorizes USACE to construct emergency shoreline and stream bank protection works to protect public facilities such as bridges, roads, public buildings, sewage treatment plants, water wells, and nonprofit public facilities such as churches, hospitals, and schools. Cost sharing is similar to Section 205 projects above. The maximum federal expenditure for any project is $1.5 million.
Section 208 – Clearing and Snagging Projects This section of the 1954 Flood Control Act authorizes USACE to perform channel clearing and excavation with limited embankment construction to reduce nuisance flood damages caused by debris and minor shoaling of rivers. Cost sharing is similar to Section 205 projects above. The maximum federal expenditure for any project is $500,000.
Section 205 – Floodplain Management Services This section of the 1950 Flood Control Act, as amended, authorizes USACE to provide a full range of technical services and planning guidance necessary to support effective floodplain management. General technical assistance efforts include determining the following: site-specific data on obstructions to flood flows, flood formation, and timing; flood depths, stages, or floodwater velocities; the extent, duration, and frequency of flooding; information on natural and cultural floodplain resources; and flood loss potentials before and after the use of floodplain management measures. Types of studies conducted under FPMS include floodplain delineation, dam failure, hurricane evacuation, flood warning, floodway, flood damage reduction, stormwater management, floodproofing, and inventories of floodprone structures. When funding is available, this work is 100% federally funded.
In addition, USACE also provides emergency flood assistance (under Public Law 84-99) after local and state funding has been used. This assistance can be used for both flood response and postflood response. Corps assistance is limited to the preservation of life and improved property; direct assistance to individual homeowners or businesses is not permitted. In addition, USACE can loan or issue supplies and equipment once local sources are exhausted during emergencies.

COASTAL RISK ASSESSMENT AND RESILIENCY STRATEGIES NANTUCKET, MA JANUARY 2020 Page 91
U.S. Small Business Administration Disaster Loan Assistance The Small Business Administration (SBA) provides low-interest loans to business of any size. These loans can ultimately be utilized for repairs or replacements of items in a declared disaster area. https://disasterloan.sba.gov/ela/Information/Index
U.S. Chamber of Commerce Foundation Resilience in a Box: The national program is a partnership between the UPS Foundation, the U.S. Chamber of Commerce Foundation, the World Economic Forum (WEF), and the Disaster Resistant Business (DRB) Toolkit Workgroup.
The program was designed for small businesses to educate owners on resilience, and to provide solutions for business continuity and disaster planning. The foundation of the “box” is based on based practices, and also provides additional resources including a preparedness checklist, and tips for business preparedness.
https://www.uschamberfoundation.org/resilience-box

COASTAL RISK ASSESSMENT AND RESILIENCY STRATEGIES NANTUCKET, MA JANUARY 2020 Page 92

COASTAL RISK ASSESSMENT AND RESILIENCY STRATEGIES NANTUCKET, MA JANUARY 2020 Page 93
5 References

COASTAL RISK ASSESSMENT AND RESILIENCY STRATEGIES NANTUCKET, MA JANUARY 2020 Page 94

COASTAL RISK ASSESSMENT AND RESILIENCY STRATEGIES NANTUCKET, MA JANUARY 2020 Page 95
Army Corps of Engineers. Climate Change Adaptation: Comprehensive Evaluation of Projects with Respect to Sea-Level Change. http://www.corpsclimate.us/ccaceslcurves.cfm. Revised 11/19/2014. Accessed 5/23/2016.
Bach, B., C. Cotter, M. Lepine, and S. Regan, 2015. Storm Surge & Critical Infrastructure on Nantucket. An interactive qualifying project submitted to the faculty of Worcester Polytechnic Institute in partial fulfillment of the requirements for the degree of Bachelor of Science.
Beck, M.W., B. Gilmer, Z. Ferdaña, G.T. Raber, C. Shepard, I. Meliane, J.D. Stone, A.W. Whelchel, and M. Hoover 2013. Increasing Resilience of Human and Natural Communities to Coastal Hazards: Supporting Decisions in New York and Connecticut. In: Ecosystems, Livelihoods, and Disaster Risk Reduction. Bonn, Germany: Partnership for Environment and Disaster Risk Reduction, United Nations University Press.
Brant Point Area Plan Work Group, 2012. Brant Point Area Plan. Approved by the NP&EDC in 2012. https://www.nantucket-ma.gov/DocumentCenter/View/1042
Bridges, T. S., Wagner, P. W., Burks-Copes, K. A., Bates, M. E., Collier, Z., Fischenich, C. J., Gailani, J. Z., Leuck, L. D., Piercy, C. D., Rosati, J. D., Russo, E. J., Shafer, D. J., Suedel, B. C., Vuxton, E. A., and Wamsley, T. V. 2014. Use of natural and nature-based features (NNBF) for coastal resilience. ERDC SR-15-1. Vicksburg, MS: U.S. Army Engineer Research and Development Center.
Dronkers, J., Gilbert, T.E., Butler, L.W., Carey, J.J., Campbell, J., James, E., McKenzie, C., Misdorp, R., Quin, N., Ries, K.L., Schroder, P.C., Spradley, J.R., Titus, J.G., Vallianos, L., and J. von Dadelszen, 1990. Strategies for Adaptation to Sea Level Rise. Report of the IPCC Coastal Zone Management Subgroup: Intergovernmental Panel on Climate Change. Geneva: Intergovernmental Panel on Climate Change.
Federal Emergency Management Agency, 2014, Flood Insurance Study, Nantucket County, Massachusetts (All Jurisdictions). Flood Insurance Study Number 25019CV000A. Effective June 9, 2014. https://msc.fema.gov/
Ferdaña, Z.A., S. Newkirk, A. Whelchel, B. Gilmer, and M.W. Beck 2010. Adapting to Climate Change: Building Interactive Decision Support to Meet Management Objectives for Coastal Conservation and Hazard Mitigation on Long Island, New York, USA in Andrade Pérez, A., Herrera Fernandez, B. and Cazzolla Gatti, R. (eds.). Building Resilience to Climate Change: Ecosystem-based adaptation and lessons from the field. Gland, Switzerland: IUCN. 164pp. http://data.iucn.org/dbtw-wpd/edocs/2010-050.pdf
Madaket Area Plan Work Group, Madaket Conservation Association, 2006. Madaket Area Plan Work Group Recommendation. Accepted August 7, 2006. https://www.nantucket-ma.gov/DocumentCenter/View/1046
Massachusetts Coastal Erosion Commission, 2015, Report of the Massachusetts Coastal Erosion Commission.
Massachusetts Cultural Resource Information System (MACRIS), Massachusetts Historical Commission Database. http://mhc-macris.net. Accessed 10/26/2018
The Nantucket and Madaket Harbors Plan Review Committee and the Department of Marine and Coastal Resources, 2009, Nantucket and Madaket Harbors Action Plan, May 2009.

COASTAL RISK ASSESSMENT AND RESILIENCY STRATEGIES NANTUCKET, MA JANUARY 2020 Page 96
Nantucket Planning and Economic Development Commission, 2003. Mid-Island Area Plan. Prepared with support from the Mid-Island Plan Work Group, the Mid-Island Partnership, The Preservation Institute: Nantucket, and Traditional Neighborhood Development, Inc. Approved March 3, 2003. https://www.nantucket-ma.gov/DocumentCenter/View/1047/Mid-Island-Area-Plan?bidId
Nantucket, Town of, 2009, Nantucket Master Plan. Approved by the Nantucket Planning Board on March 30, 2009. Accepted by the Town of Nantucket on April 6, 2009. https://www.nantucket-ma.gov/DocumentCenter/View/1050
____, 2013, Nantucket, MA Comprehensive Emergency Management Plan.
____, Town of Nantucket Code, Updated April 2017
____, 2019. 2019 Nantucket Community Resilience Building Workshop Summary of Findings. Town of Nantucket, Milone & MacBroom, Inc., and The Nature Conservancy. Nantucket, Massachusetts.
Nantucket, Town of, Planning & Economic Development Commission, 2001, The Nantucket Comprehensive Community Plan.
National Oceanic and Atmospheric Administration (NOAA). 2010. Adapting to Climate Change: A Planning Guide for State Coastal Managers. NOAA Office of Ocean and Coastal Resource Management. http://coastalmanagement.noaa.gov/climate/adaptation.html
National Oceanic and Atmospheric Administration. Coastal Storm Awareness Program. http://seagrant.noaa.gov/FundingFellowships/CoastalStormsAwarenessProgram.aspx. Accessed 3/22/2016.
National Oceanic and Atmospheric Administration. Tides & Currents: Center for Operational Oceanographic Products and Services. <tidesandcurrents.noaa.gov> Revised 08/08/2018.
Naushop Crossing Area Plan Work Group, 2014, Naushop Crossing Area Plan. Approved March 3, 2014. http://www.nantucket-ma.gov/DocumentCenter/View/19720/Naushop-Crossing-Area-Plan
Northeast Climate Adaptation Science Center. 2018. Massachusetts Climate Change Projections. Resilient MA Climate Change Clearinghouse for the Commonwealth (resilient MA). Accessed May 2018. http://www.resilientma.org/resources/resource::2152
Rosati, J.D., Frey, A.E., Grzegorzewski, A.S., Maglio, C.K., Morang, A., and R.C. Thomas. 2015. Conceptual Regional Sediment Budget for USACE North Atlantic Division. Prepared by the U.S. Army Engineer Research and Development Center Coastal Hydraulics Laboratory (ERDC/CHL) for the US Army Engineer North Atlantic Division (USACE-NAD) in March 2015.
Ruddock, Kevin, 2017. Marsh Migration Zones, Northeast U.S. North Atlantic Landscape Conservation Cooperative. Created May 16, 2017. Last Updated February 9, 2018
Runkle, J., K. Kunkel, R. Frankson, D. Easterling, A.T. DeGaetano, B. Stewart, and W. Sweet, 2017, Massachusetts State Summary. NOAA Technical Report NESDIS 149-MA, 4 pp. https://statesummaries.ncics.org/ma
‘Sconset Planning Committee, 2007, ‘Sconset Area Plan. Prepared with support of the Siasconset Civic Association and the ‘Sconset Trust. Accepted February 2007. https://www.nantucket-ma.gov/DocumentCenter/View/1053

COASTAL RISK ASSESSMENT AND RESILIENCY STRATEGIES NANTUCKET, MA JANUARY 2020 Page 97
Surfside Area Plan Work Group, 2008, Surfside Area Plan, Nantucket, MA. October 6, 2008. https://www.nantucket-ma.gov/DocumentCenter/View/6239
Sweet, W., Kopp, R., Weaver, C., Obeysekera, J., Horton, R., Thieler, E.R., and C. Zervas, 2017. Global and Regional Sea Level Rise Scenarios for the United States. NOAA Technical Report NOS CO-OPS 083
Thieler, E., T. Smith, J. Knisel, and D. Sampson, 2013. Massachusetts Shoreline Change Mapping and Analysis Project, 2013 Update. USGS Open-File Report 2012-1189
Tom Nevers Area Plan Work Group, Tom Nevers Civic Association, 2008. The Greater Tom Nevers Area Plan. Accepted March 31, 2008. https://www.nantucket-ma.gov/DocumentCenter/View/11787
United States Army Corps of Engineers, 2015. North Atlantic Coast Comprehensive Study: Resilient Adaptation to Increasing Risk: Main Report.
Urban Harbors Institute, University of Massachusetts Boston, 2009. Nantucket & Madaket Harbors Action Plan. Urban Harbors Institute Publications. https://www.nantucket-ma.gov/DocumentCenter/View/10269/Nantucket-and-Madaket-Harbors-Action-Plan-PDF
Whelchel A.W. and M. Beck. (In Press). Decision Tools and Approaches to Advance Ecosystem-based Disaster Risk Reduction and Climate Change Adaptation in the 21st Century. In Renaud, F., Estrella, M. (Eds.). Ecosystem-Based Disaster Risk Reduction and Adaption: Linking Science, Policy and Practice. Springer Publishing Company, New York.
Images:
Cover: “Greatpoint” – Arwcheek/wikimedia Executive Summary Cover: “Main Street July 2018” – Mrynes/wikimedia Introduction Cover: “Brant Point Lighthouse” – Hazal Ozturk Vulnerability and Risk Cover: “Shipwreck off Nantucket” – William Bradford, 1860-1866,
Metropolitan Museum of Art Coastal Adaptation Strategies Cover: “Wetland” – Gore Lamar Implementation and Resources Cover: “Hyline Ferry” – Henry Gray References Cover: “Sunset” – Tim Sackton Back Cover: “Brant Point Lighthouse” – Hazal Ozturk


Appendix A Detailed Risk Assessment


APPENDIX A: DETAILED RISK ASSESSMENT
APPENDIX A: DETAILED RISK ASSESSMENT COASTAL RISK ASSESSMENT AND RESILIENCY STRATEGIES NANTUCKET, MA, 2020 Page 1
Detailed Risk Assessment Each of Nantucket’s neighborhoods will be faced with a combination of vulnerabilities with sea level rise, erosion, and the increased incidence and severity of coastal storms. Generally, coastal hazards can include:
Stillwater Inundation – flooding from high water without the effects of waves Wave Action – can cause damage to buildings directly Erosion – removal of material can degrade beaches and undermine buildings and infrastructure Insufficient Drainage – submerged outlets or insufficient capacity can create flooding Wind – can cause direct damage by blowing debris into structures
Vulnerabilities can be viewed in the context of primary and secondary impacts. Primary impacts describe direct damages to building and infrastructure, while secondary impacts include disruptions to commerce, isolation of areas from emergency services, and the like.
Risks and vulnerabilities in the Town of Nantucket were determined through review of planning documents such as the Nantucket Hazard Mitigation Plan and the Municipal Vulnerability Preparedness (MVP) report, discussion with Town representatives, collection of public input at meetings and through an online survey. More details on each of the vulnerabilities can be found in each of those other documents.
1.1 Detailed Risk Zone Analysis Methodology A detailed analysis of coastal risks was conducting using a geographic information system (GIS) software. For this analysis, GIS shapefiles mapping locations of roads and structures were intersected with mapped risk zones in order to quantify the degree of risk that different coastal hazards present to different parts of the Island. Identification of risk zones is described below.
FEMA Special Flood Hazard Areas
The 1% annual chance (100-year) flood has been adopted by the Federal Emergency Management Agency (FEMA) as the “base flood.” Special Flood Hazard Areas (SFHAs) are the areas at risk of inundation during the base flood, as delineated as part of the NFIP. FEMA uses a variety of flood zones to delineate areas of annual chance flood hazard, summarized in the figure below:

APPENDIX A: DETAILED RISK ASSESSMENT
APPENDIX A: DETAILED RISK ASSESSMENT COASTAL RISK ASSESSMENT AND RESILIENCY STRATEGIES NANTUCKET, MA, 2020 Page 2
Figure 1: Conceptual Model of FEMA Flood Zones (Source: FEMA)
The most recent Digital Flood Insurance Rate Map (DFIRM; effective June 9, 2014) for Nantucket was downloaded from the Massachusetts Bureau of Geographic Information (MassGIS) online data clearinghouse for use in this risk analysis.
Sea Level Rise Projections
The expected extent of daily high tide flooding from sea level rise was determined using GIS analysis and localized sea level rise projections. Future relative sea level rise (RSLR) amounts of 1.7, 4.6, and 6.4 feet were all mapped for comparison purposes. These figures capture a range of probable future conditions corresponding to both the 2017 NOAA and the 2018 Massachusetts sea level rise projections for Nantucket under the “High” scenarios, as summarized in the table below:
Projection NOAA 2017 RSLR Massachusetts 2018 RSLR GIS Analysis Elevation
2030s High 1.5 - 2.2 1.6 - 2.1 1.7 2070s High 4.6 - 6.3 4.6 - 5.7 4.6 2080s High 6.3 - 7.7 5.7 - 6.9 6.4
High-resolution (1-square meter) digital elevation model (DEM) data was downloaded from the MassGIS online clearinghouse for use in this risk analysis. This DEM was constructed from Light Detection and Ranging (LiDAR) data collected in 2013 and 2014. A GIS was used to extract elevation contours from the DEM at the Mean Higher-High Water (MHHW) elevation expected under each of the three sea level rise projections use in analysis. These contours were then used to create polygons that were intersected with infrastructure and buildings to quantify risk. MHHW on average occurs once per day.
Erosion Rates
Projected impacts from erosion were determined using the two shoreline-change rates from the 2013 Massachusetts Shoreline Change Mapping and Analysis Project: the short-term rate and the long-term rate. Because of the inherent uncertainty in projecting future erosion rates, neither the historic short-

APPENDIX A: DETAILED RISK ASSESSMENT
APPENDIX A: DETAILED RISK ASSESSMENT COASTAL RISK ASSESSMENT AND RESILIENCY STRATEGIES NANTUCKET, MA, 2020 Page 3
term nor long-term rates are more likely to capture future trends; for this reason, the average of those two rates was calculated and is used as another potential future erosion rate.
Shoreline change in the next 50 years was estimated by multiplying each of the three annual rates by 50 years and mapping that change using the current Mean-High-Water line as the starting point. It is important to note that this is not a modeled projection in the same way the sea level rise projections are; rather, this is a rough estimate of future erosion potential based only on past behavior without consideration of future changes in sea level, climate, or erosion mitigation activities. Shoreline change estimates presented here are useful for understanding shoreline processes around Nantucket, but may not accurately reflect actual future risk or damages.
1.2 Risks to Specific Assets Infrastructure
Transportation Infrastructure
Roads and bridges on Nantucket are at risk of coastal flooding, poor-drainage flooding, erosion, and the compounding effects that ongoing sea level rise and climate change effects will have on those hazards. Inland roads are also at risk of winter and high wind events that can block roads with snow, ice, and debris. Increasing temperatures may affect the longevity of pavement treatments.
Table 5 provides a summary, by planning neighborhood, of roads on Nantucket that fall within FEMA flood zones, areas projected to be inundated at daily due to sea level rise, and areas projected to be impacted by erosion in the future. A list of a selection of roads within those potential risk zones is included in Appendix B of the Coastal Risk Assessment and Resiliency Strategies report.
Table 1: Summary by Neighborhood of Paved Roads of Nantucket at Risk from Floods and Erosion
*Neighborhood Feet of Road Exposed To: Feet of Road
Within 500 ft of Shore**
SLR in 2080s (I-H Scenario)
Current 1% Annual-Chance Flood
Erosion by 2080s (Average Rate)
Downtown 9,642 14,952 2,655 13,974 Brant Point 21,428 22,002 191 9,566 Cliff Road 1,846 2,355 64 3,182 Maddequet/Eel Point 6,522 8,843 676 2,938 Madaket 4,832 10,802 42,070 28,426 Sheep Pond Road 129 1,293 27,145 12,926 Cisco/Hummock Pond 0 291 22,904 9,705 Miacomet 0 912 2,978 2,683 South Shore/Surfside 113 907 3,402 11,340 Airport Area 0 0 25,974 2,462 Tom Nevers/Southeast Quarter 0 128 59,907 12,828 Siasconset 0 306 27,576 30,640 Quidnet 0 373 0 4,142 Wauwinet 2,445 4,890 3,178 6,112 Pocomo 522 1,789 373 7,453 Polpis 669 1,617 1,338 5,576 Shawkemo/Quaise 351 1,286 819 11,694 Monomoy 144 575 287 14,366 Mid-Island 348 1,427 581 1,659 Coatue/Great Point 68,862 92,356 34,026 81,014

APPENDIX A: DETAILED RISK ASSESSMENT
APPENDIX A: DETAILED RISK ASSESSMENT COASTAL RISK ASSESSMENT AND RESILIENCY STRATEGIES NANTUCKET, MA, 2020 Page 4
* The Smith Point, Moors, Middle Pasture/Folger Hill, and Tuckernuck planning neighborhoods are not presented; risk to public roads was found to be minimal. Neither Smith Point nor Tuckernuck have any municipally mapped roads; while local private roads are present, those are not accounted for here. ** “Feet of Road Within 500 ft of Shore” information is presented to aid in comparison of other risk measured presented; it is not intended to suggest that assets within 500 feet of the shore are at risk.
Docks, Piers, and Ferries
Port facilities on the water's edge are particularly vulnerable to coastal hazards including coastal flooding, sea level rise, and severe storms. Docks, piers, boat ramps, jetties, and other facilities are deliberately set at an optimal elevation relative to the water level, and therefore a rise in sea level leaves them at a less optimal elevation. However, unlike roads, these facilities tend to be rebuilt relatively frequently as compared with the time it takes for a substantial rise in sea level. The primary risks to such facilities are damages due to severe storms or loss of access due to flooding or erosion of roads to and from the facilities. Flooding of New Whale Street, Broad Street, and Easy Street risks isolating those facilities.
Aside from damage to water-port facilities, coastal hazards can affect ferry and other boat travel to and from Nantucket. High winds and waves make ferry travel dangerous or impossible. A severe coastal event that causes debris to block the single narrow channel connecting Nantucket Harbor to Nantucket Sound would interrupt all ferry transit for a time period.
Major public port facilities are located in the Downtown and Madaket neighborhoods (in Nantucket Harbor and Madaket Harbor). Other dock and marina facilities are located along the shoreline of Nantucket Harbor.
Nantucket Airport
Located in the “Airport” neighborhood on the south short of the Island, Nantucket Airport is vulnerable to erosion. Continued erosion at historic rates will cause the shoreline to impinge on the southern end of the airport’s main runway within the next 2 to 3 decades.
Utilities
Nantucket’s utilities include electricity and drinking water distribution, and wastewater collection and treatment.
Vulnerabilities to the electric system include:

APPENDIX A: DETAILED RISK ASSESSMENT
APPENDIX A: DETAILED RISK ASSESSMENT COASTAL RISK ASSESSMENT AND RESILIENCY STRATEGIES NANTUCKET, MA, 2020 Page 5
Underwater Cables – Nantucket receives electricity through two undersea cables that enter the Island near the Jefferson Street Beach. Sediment movement in this area has the potential to impact the cables.
Candle Street Substation – the underwater cables run to this substation and electricity is then distributed to the rest of Town.
Power Grid – electricity is distributed primarily through overhead powerlines, with a selection of areas where the lines are buried underground. Overhead lines are vulnerable to wind events, while buried powerlines are vulnerable to flooding. Transformers located around the island (many at ground level) may also be vulnerable to flooding.
Communications utilities, including phone and internet lines and cellular towers, are important utility infrastructure assets, although they are not municipally controlled. Vulnerabilities to communication utilities are similar, and often closely tied to, electric system vulnerabilities.
Aspects of the water and wastewater systems identified as vulnerabilities include:
The Nantucket Aquifer – Nantucket extracts groundwater through two municipal wellfields, as well as private wells scattered around the Island. Rising seas may compromise the aquifer by accelerating saltwater intrusion.
Wastewater Treatment Facilities – the Town is served by two wastewater treatment facilities, one located in the Surfside Neighborhood and the other located at the southern end of ‘Sconset. Both are vulnerable to erosion.
Sewer Pumping Stations – Nantucket has 15 sewer pumping stations; only a few are at risk from flooding. The primary station, and the one with the highest exposure to coastal hazards, is the Sea Street Pumping Station located in the Downtown Neighborhood. While the exposure of this site is high, the Town has invested a lot to protect the site from current and future flooding, and the facility is considered to be relatively resilient.
Water, Sewer, and Stormwater Pipes – the pipe systems delivering drinking water, collecting wastewater, and removing stormwater across the island are vulnerable to erosion in some sections, and to flooding in others. The primary issue with regards to high water conditions is infiltration of the water into the sewer and stormwater drainage pipes, lowering the system’s capacity. Stormwater drainage in particular struggles to operate effectively under chronic high-water conditions, such as those expected with continued sea level rise.
Fuel delivery and distribution is another important utility. The current fuel farm downtown is at risk from flooding, but the Town is in the process of relocating that facility inland.
Critical Municipal Facilities
All of the critical facilities in coastal flood zones and storm surge areas are at risk of daily flooding due to sea level rise. These include the municipal buildings 16 Broad Street, 34 Washington Street, and 37 Washington Street; the Old Police Station; Our Island Home and Landmark House. Of special concern is the Finance Department on Washington Street, which has experienced flooding numerous times in the
Candle Street Substation.
Photo: Design Associates Inc.

APPENDIX A: DETAILED RISK ASSESSMENT
APPENDIX A: DETAILED RISK ASSESSMENT COASTAL RISK ASSESSMENT AND RESILIENCY STRATEGIES NANTUCKET, MA, 2020 Page 6
last few years. The Finance Department contains important municipal documents; protecting those documents from floods is essential.
Private Property
Commercial, industrial, and residential properties along the coastline are also at risk of daily flooding due to sea level rise. In general, these are the same areas that were identified in Sections 4.0 and 5.0 in the context of coastal flooding and hurricanes, respectively. The most vulnerable areas are those where topography is relatively flat, such as Brant Point, and areas adjacent to Nantucket harbor and tidal creeks and waterways.
GIS analysis of Nantucket topography shows that 4,153 parcels on the Island are completely or partially less than 15-feet above the current MHHW elevation of 1.48 feet NAVD88. The combined present-day value of these parcels is over $12 billion. These parcels are all expected to be at risk from future flooding as sea level rise raises base flood elevations.
GIS analysis was used to produce a variety of potential erosion risk exposure zones based on the Massachusetts CZM Shoreline Change Project erosion rates. A selection of these zones were used to calculate the value of at-risk parcels; these are presented below.
Table 2: Parcels in Erosion Risk Zones
Erosion Risk Zone Number of Parcels at Risk Total Value of Parcels at Risk 250 ft of MHHW 1,505 $6,514,459,500 500 ft of MHHW 2,287 $8,536,605,200 30-year Erosion Zone 1,441 $5,230,312,000 50-year Erosion Zone 2,099 $6,080,290,000
The 250- and 500-foot risk zones were delineated by mapping all areas within those distances from the MHHW line (MHHW is 1.48 feet NAVD88). The 30- and 50-year erosion zones were delineated by taking the averages of the short-term and long-term erosion rates calculated in the Massachusetts Shoreline Change Project, and projecting them 30 and 50 years into the future, respectively. Note that these are estimated risk zones and do not represent predictions or regulatory zones.
Buildings
Table 6 summarizes the number of buildings in each planning neighborhood that fall within FEMA flood zones, areas projected to be impacted by daily inundation due to sea level rise, and areas projected to be impacted by erosion.
Table 3: Risk to Buildings from Different Hazards, by Neighborhood
**Planning Neighborhood Buildings exposed to: *Buildings within
500 ft of Shore SLR in 2080s (I-H Scenario)
Current 1% Annual-Chance Flood
Erosion by 2080s (Average Rate)
Downtown 283 419 103 322 Brant Point 427 460 17 218 Cliff Road 20 28 23 96 Maddequet/Eel Point 9 12 34 83 Madaket 69 137 279 274 Smith Point 1 2 5 5 Sheep Pond Road 1 1 41 26 Cisco/Hummock Pond 0 1 64 20 Miacomet 0 0 9 10

APPENDIX A: DETAILED RISK ASSESSMENT
APPENDIX A: DETAILED RISK ASSESSMENT COASTAL RISK ASSESSMENT AND RESILIENCY STRATEGIES NANTUCKET, MA, 2020 Page 7
**Planning Neighborhood Buildings exposed to: *Buildings within
500 ft of Shore SLR in 2080s (I-H Scenario)
Current 1% Annual-Chance Flood
Erosion by 2080s (Average Rate)
South Shore/Surfside 2 0 7 42 Airport Area 0 0 33 30 Tom Nevers/Southeast Quarter 0 0 138 63 Siasconset 0 2 200 232 Quidnet 1 8 0 49 Wauwinet 8 35 40 108 Pocomo 1 4 16 74 Polpis 11 20 29 55 Shawkemo/Quaise 3 6 31 82 Monomoy 10 14 37 110 Mid-Island 11 29 14 42 Coatue/Great Point 7 10 10 10 Tuckernuck 5 5 68 30
* “Buildings Within 500 ft of Shore” information is presented to aid in comparison of other risk measured presented; it is not intended to suggest that assets within 500 feet of the shore are at risk. ** The Moors and Middle Pasture/Folger Hill planning neighborhoods are not presented; risk to buildings was found to be minimal.
Historic Resources
The Town of Nantucket’s identity is closely associated with its historic character. The entire Island is a National Historic Landmark, the Town boasts two National Historic Districts, and hundreds of historic buildings are spread across the community. These resources present a unique set of vulnerabilities in the face of climate-related hazards. Their age often means that a degree of degradation has occurred, potentially putting the buildings at a higher risk of being damaged during an extreme event. These historic buildings were constructed before the development and adoption of many building codes and zoning regulations, so they may be located in risk zones and built in ways that make them more susceptible to hazards than a new building. Historic buildings initially sited in areas with relatively low risk of coastal inundation may be at higher exposure today due to sea level rise. Finally, implementing adaptation measures on these buildings can be complicated by requirements or desires to maintain their historic characters.
One primary cluster of vulnerable historic resources is in the Old Historic District, which consists of the Downtown area and is at risk of coastal flooding and flooding during severe storms due to compromised drainage systems. The second cluster is the “Sconset Historic District, located on the eastern edge of the Island and susceptible to erosion.
Nantucket is also known for its three historic lighthouses, each of which is, necessarily, vulnerable to coastal storms. One has had to be relocated in the past to prevent damage from erosion.
Summary
Table 7 summarizes vulnerable assets, the hazards they face, and areas at risk. The table also serves as a cross-reference to the Nantucket Hazard Mitigation Plan and Municipal Vulnerability Preparedness program; the columns to the right indicate the sources of information for each row; if a column is highlighted in blue, it means that some or all of the features in that row were identified by that

APPENDIX A: DETAILED RISK ASSESSMENT
APPENDIX A: DETAILED RISK ASSESSMENT COASTAL RISK ASSESSMENT AND RESILIENCY STRATEGIES NANTUCKET, MA, 2020 Page 8
document or process as being at risk. Vulnerabilities and risks present in specific geographies around Nantucket are discussed in detail in the following section.
Risks are anticipated to increase over time due to sea level rise and climate change, and may be compounded by continuing trends of increased development and population growth. High winds during storm events, which are also predicted to increase with climate change, may put further pressure on vulnerable areas.
Threats to Nantucket’s shoreline include:
Erosion of properties along the southern shore of the Island Inundation of the historic downtown area Erosion of key infrastructure along the southern shore of the Island,
including two Wastewater Treatment Plants, and the Airport Inundation and erosion of roads Erosion at beaches and bluffs and loss of dunes and banks Loss of tidal wetlands with sea level rise
Vulnerable aspects of Nantucket’s coastal area include:
Transportation infrastructure Wastewater utilities Natural systems Economic stability and tourist draw Residential structures, both historic and contemporary

APPENDIX A: DETAILED RISK ASSESSMENT
APPENDIX A: DETAILED RISK ASSESSMENT COASTAL RISK ASSESSMENT AND RESILIENCY STRATEGIES NANTUCKET, MA, 2020 Page 9
Table 4: Vulnerable Assets, Hazards that Threaten Them, and Areas at Risk from those Hazards
Asset or System Hazard Threats Specific Locations
Source
CRP
Risk
Ana
lysis
CRP
Publ
ic P
artic
ipat
ion
Haza
rd M
itiga
tion
Plan
MVP
Pro
cess
Infrastructural
Roads Inundation of Low Roads Poor Drainage Flooding Undermining by Erosion
- Downtown Area o Truck Routes o Easy Street
- Brant Point Area - Polpis Road at Folgers Marsh - Polpis Road at Sesachacha Pond - Eel Point Road - Baxter Road - Milestone Road - Madaket Road - Wauwinet Road - Eel Point Road (Private)
Bridges & Culverts Inundation of Approaches Clogging of Underpasses
Clogging of Culverts
- First Bridge (Madaket Road between Long Bond and North Head Long Pond)
- Second Bridge (Madaket Road at Second Bridge Bus Station) - Massasoit Bridge (S. Cambridge Street) - Millie’s Bridge (Ames Ave)
Docks
Wave Damage to Structures Inundation of Facilities
Sea Level Rise Wave Damage to Boats
- Private Downtown Docks and Piers - Municipal Downtown Docks and Piers - Coast Guard Dock in Brant Point - Private Docks/Piers in Madaket Harbor - Public Docks on Massachusetts Ave - Steamship Authority Terminal / Pier - Hi-Line Terminal / Pier

APPENDIX A: DETAILED RISK ASSESSMENT
APPENDIX A: DETAILED RISK ASSESSMENT COASTAL RISK ASSESSMENT AND RESILIENCY STRATEGIES NANTUCKET, MA, 2020 Page 10
Asset or System Hazard Threats Specific Locations
Source
CRP
Risk
Ana
lysis
CRP
Publ
ic P
artic
ipat
ion
Haza
rd M
itiga
tion
Plan
MVP
Pro
cess
Ferries
Wave Damage to Structures Inundation of Facilities
Sea Level Rise Wave Damage to Boats Operational Disruption
- Steamship Authority Terminal / Pier (Downtown) - Hi-Line Terminal / Pier (Downtown) - Navigable Channel through Harbor (maintained by US Army Corps of
Engineers)
Airport Operational Disruption Erosion of Runway - Airport
Emergency Services Loss of Access
- Fire Station Headquarters - Two Unmanned Satellite Fire Stations (garages) - Ambulance Service (associated with Fire Department) - New Hospital Opening in June - Emergency Alert Sirens - High School (only emergency shelter)
Municipal Facilities Coastal Flood Inundation - Finance Department - Mid-Island Municipal Vehicle Facilities - Warren Landing Area Municipal Vehicle Facilities
Water & Wastewater
Infiltration into Pipes Saltwater Intrusion
Erosion of Coastal Features Power Loss
Erosion of Treatment Plants Insufficient Capacity
- Mid-Island Wellfield - ‘Sconset Wellfield - Drinking Water Pipes (island wide) - Surfside Wastewater Treatment Plant - ‘Sconset Wastewater Treatment Plant - 15 Sewer Pumping Stations
o Sewer Pumping Station near Brant Point - Sewer Pipes (island wide) - Stormwater Drainage Infrastructure

APPENDIX A: DETAILED RISK ASSESSMENT
APPENDIX A: DETAILED RISK ASSESSMENT COASTAL RISK ASSESSMENT AND RESILIENCY STRATEGIES NANTUCKET, MA, 2020 Page 11
Asset or System Hazard Threats Specific Locations
Source
CRP
Risk
Ana
lysis
CRP
Publ
ic P
artic
ipat
ion
Haza
rd M
itiga
tion
Plan
MVP
Pro
cess
Energy & Communication
Wind Damage to Grid Flooding of Buried Infrastructure
Flood Impacts on Response
- Electric Cables under Nantucket Sound (into Jefferson Avenue) - Candle Street Substation - Overhead Powerlines - Local Transformers - Cell Phone Towers - Existing Fuel Tank Farm (downtown) - Fuel Supply-Chain - Planned New Fuel Tank Farm (mid-island)
Environmental
Great Ponds Erosion of Barrier Beaches
Saltwater Intrusion from Sea Level Rise or Coastal Flooding
- Long Pond - Hummock Pond - Sesachacha Pond - Miacomet Pond
Fisheries & Shellfish
Rising Temperature Habitat Loss Pollution from Flooding, Erosion
- Brant Point Shellfish Hatchery - Nantucket Harbor (all)
o Head of the Harbor Fishing Area - Madaket Harbor - Other Nearshore Fish & Shellfish Areas
Coastal Resources
Sea Level Rise Habitat Impacts Rising Temperature Habitat Loss Pollution from Flooding, Erosion Habitat Loss from Severe Storms
- Nantucket Harbor Coastal Area - Polpis Harbor Coastal Area - Madaket Harbor Coastal Area - Coastal Sandplain Grasslands - Coastal Wetlands / Salt Marshes - Recreational Beaches - ‘Sconset Bluff Walk - “Barrier Beaches” (between ponds and ocean)

APPENDIX A: DETAILED RISK ASSESSMENT
APPENDIX A: DETAILED RISK ASSESSMENT COASTAL RISK ASSESSMENT AND RESILIENCY STRATEGIES NANTUCKET, MA, 2020 Page 12
Asset or System Hazard Threats Specific Locations
Source
CRP
Risk
Ana
lysis
CRP
Publ
ic P
artic
ipat
ion
Haza
rd M
itiga
tion
Plan
MVP
Pro
cess
Rare Wildlife and Plants Rising Temperature Habitat Loss
Habitat Loss from Erosion Habitat Loss from Sea Level Rise
- Rare Bird Populations (State & Federal Level) - Rare Insect Populations (State & Federal Level) - Rare Plant Populations (State & Federal Level) - Moors/Grasslands
Societal / Cultural
Disadvantaged Groups Damage to Facilities
Power Loss Loss of Access
- Elderly Population - Homebound Populations (aging in place, disabled) - Homeless Population - Mobile LMI Communities (seasonal relocation) - Minority Populations - Immigrant & Non-Native English Speakers
Social Services Damage to Facilities
Power Loss Loss of Access
- Our Island Home - Landmark House - Nantucket Interfaith Council - Warming Centers - Food Pantry (Washington Street, in flood zone)
Historic / Cultural Resources
Flood Damage to Structure Wave Damage to Structure
Erosion of Foundations Flood Damage to Contents
Wind & Debris Damage Impacts from Response/Recovery
- Old Historic District (OHD; Downtown) - ‘Sconset Historic District (SHD) - Historic Structures (Island Wide) - 3 Lighthouses - Museums - Dreamland Film & Cultural Center - Whaling Museum
Private Properties
Flood Damage to Structure Wave Damage to Structure
Erosion of Foundations Flood Damage to Contents
Wind & Debris Damage
- Downtown and Brant Point - ‘Sconset - Madaket & Sheep Pond Road - Cliff Road & Eel Point - All Coastal Areas
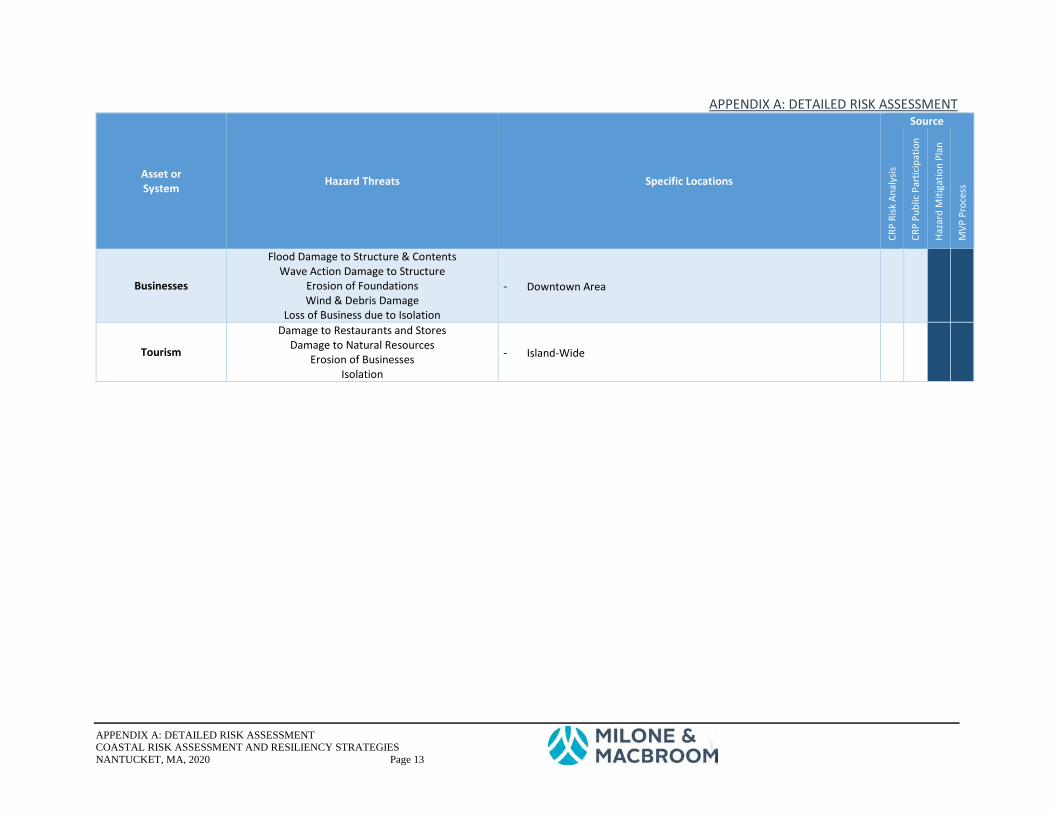
APPENDIX A: DETAILED RISK ASSESSMENT
APPENDIX A: DETAILED RISK ASSESSMENT COASTAL RISK ASSESSMENT AND RESILIENCY STRATEGIES NANTUCKET, MA, 2020 Page 13
Asset or System Hazard Threats Specific Locations
Source
CRP
Risk
Ana
lysis
CRP
Publ
ic P
artic
ipat
ion
Haza
rd M
itiga
tion
Plan
MVP
Pro
cess
Businesses
Flood Damage to Structure & Contents Wave Action Damage to Structure
Erosion of Foundations Wind & Debris Damage
Loss of Business due to Isolation
- Downtown Area
Tourism
Damage to Restaurants and Stores Damage to Natural Resources
Erosion of Businesses Isolation
- Island-Wide

APPENDIX A: DETAILED RISK ASSESSMENT
APPENDIX A: DETAILED RISK ASSESSMENT COASTAL RISK ASSESSMENT AND RESILIENCY STRATEGIES NANTUCKET, MA, 2020 Page 14
1.3 Risks to Specific Neighborhoods The preceding discussion provides a profile of town wide risks. It may also be useful to examine risks in specific areas. Different neighborhoods and areas of Nantucket face different hazards presented by current and future daily high tide, storm conditions, and erosion.
Risk areas identified in this analysis reflect current and possible future conditions based on historic data and currently available climate projections; they are intended to inform planning and assessment, and not to predict specific future impacts or damages. Mapped erosion zones in particular are not expected to accurately represent locations at risk from erosion; rather they reflect historic coastal processes and can be used to identify sites where erosion may be a problem.
Downtown
The Downtown neighborhood already experiences coastal flooding, and the risk of inundation will grow in the future. Because it is sited on the relatively low-energy Nantucket Harbor, protected by Great Point and Coatue, erosion risk is relatively low for much of the neighborhood, with a few pockets of concern, such as near Consue Spring.
Downtown Nantucket is also characterized by a working waterfront and a concentration of active wharfs and piers, with a significant number of buildings sitting over water (69 structures are partially or completely located seaward of the MHHW line, according to GIS analysis). By nature of their locations, these over-water structures are at risk from coastal storms (because they are located waterward of the shoreline they are also incorrectly identified by the erosion-mapping method as being within an erosion risk zone).
Table 5: Relative Risks to Downtown from Sea Level Rise, Storm Surge, and Erosion
Buildings Feet of Road Within 500 Ft of the Coast 322 13,974 Daily Inundation Due to Sea Level Rise Risk
Intermediate Low, 2080 74 920 Intermediate High, 2080 283 9,681 High, 2080 364 13,345
Storm Surge Risk Below 15 Feet in Elevation 657 32,442 AE Zone 313 13,743 VE Zone 105 1,187 *0.2% Annual Chance Flood Zone 46 3,317
Erosion Risk 50 Year Erosion Risk Zone (Long Term Rate) 32 0 50 Year Erosion Risk Zone (Short Term Rate) 310 14,633 50 Year Erosion Risk Zone (Average Rate) 104 2,588 * This row reports the number of assets located outside of a 1% annual chance flood zone but inside a 0.2% annual chance flood zone; assets in AE or VE zones are also at risk from a 0.2% flood event.

APPENDIX A: DETAILED RISK ASSESSMENT
APPENDIX A: DETAILED RISK ASSESSMENT COASTAL RISK ASSESSMENT AND RESILIENCY STRATEGIES NANTUCKET, MA, 2020 Page 15
Brant Point
Brant Point is a very low-lying neighborhood, the majority of which is less than 15 feet in elevation and located in FEMA flood hazard zones. Risk of daily inundation due to sea level rise is high, while erosion risk in this century is low.
Table 6: Relative Risks to Brant Point from Sea Level Rise, Storm Surge, and Erosion
Buildings Feet of Road Within 500 Ft of the Coast 218 9,566 Daily Inundation Due to Sea Level Rise Risk
Intermediate Low, 2080 117 6,085 Intermediate High, 2080 428 21,404 High, 2080 459 22,224
Storm Surge Risk Below 15 Feet in Elevation 487 23,613 AE Zone 453 21,772 VE Zone 7 187 *0.2% Annual Chance Flood Zone 9 586
Erosion Risk 50 Year Erosion Risk Zone (Long Term Rate) 9 425 50 Year Erosion Risk Zone (Short Term Rate) 64 2,362 50 Year Erosion Risk Zone (Average Rate) 18 205 * This row reports the number of assets located outside of a 1% annual chance flood zone but inside a 0.2% annual chance flood zone; assets in AE or VE zones are also at risk from a 0.2% flood event.
Cliff Road
Though located on Nantucket Sound on the north shore of Nantucket, and therefore relatively protected from the erosive forces of the Atlantic, bluff erosion is still identified as occurring in the Cliff Road neighborhood. Massachusetts Shoreline Change Project figures for this area are as follows:
Long Term: 2.69 - 0.95 ft/yr erosion Short Term: 3.97 - 0.0 ft/yr erosion
The 2019 Massachusetts Coastal Bank Erosion Hazard Mapping shows top-of-bank erosion in this area. For most of the shoreline in this neighborhood, lateral erosion loss is shown as “Low,” or less than 34 feet since 1993, which is below the margin of error for this dataset. Moderate and High lateral erosion loss is shown in the following locations:
The western section of the neighborhood, west of Gosnold Road to Washing Pond Road; the highest net erosion distance is northeast of Washing Pond Road (66.5 feet between 1993 and 2013; 3.33 ft/yr).
North of Indian Avenue (50.2 feet between 2000 and 2013; 3.86 ft/yr); this very localized erosion (adjacent transects show almost no movement between 2000 and 2013) appears to be associated with a beach access route.

APPENDIX A: DETAILED RISK ASSESSMENT
APPENDIX A: DETAILED RISK ASSESSMENT COASTAL RISK ASSESSMENT AND RESILIENCY STRATEGIES NANTUCKET, MA, 2020 Page 16
Despite the erosion rates in this neighborhood, the low density of development near the shoreline means that the risk to buildings from erosion is relatively low. Analysis shows that the primary risk in this neighborhood is flooding of roads.
Table 7: Relative Risks to Cliff Road from Sea Level Rise, Storm Surge, and Erosion
Buildings Feet of Road Within 500 Ft of the Coast 96 3,182 Daily Inundation Due to Sea Level Rise Risk
Intermediate Low, 2080 4 0 Intermediate High, 2080 20 1,831 High, 2080 33 2,600
Storm Surge Risk Below 15 Feet in Elevation 95 166,849 AE Zone 24 2,370 VE Zone 4 0 *0.2% Annual Chance Flood Zone 57 5,031
Erosion Risk 50 Year Erosion Risk Zone (Long Term Rate) 25 31 50 Year Erosion Risk Zone (Short Term Rate) 45 364 50 Year Erosion Risk Zone (Average Rate) 23 65 * This row reports the number of assets located outside of a 1% annual chance flood zone but inside a 0.2% annual chance flood zone; assets in AE or VE zones are also at risk from a 0.2% flood event.
Maddequet/Eel Point
The northwestern corner of Nantucket is a relatively low-density, low-lying neighborhood. The Massachusetts Coastal Bank Erosion Hazard Mapping shows moderate to high top-of-bank lateral erosion loss in the following locations:
East of East Tristram Avenue (up to 48.8 feet between 1993 and 2013; 2.44 ft/yr) North and west of Alliance Lane (up to 83 feet between 1993 and 2013; 4.15 ft/yr) At the northernmost point on Eel Point Road, north of North Head Long Pond (48.7 feet
between 2000, and 2013; 3.75 ft/yr)
Storm surge is a major risk for roads in this area, with loss of access identified as a concern. Erosion is the dominant direct risk of concern for private homes.

APPENDIX A: DETAILED RISK ASSESSMENT
APPENDIX A: DETAILED RISK ASSESSMENT COASTAL RISK ASSESSMENT AND RESILIENCY STRATEGIES NANTUCKET, MA, 2020 Page 17
Table 8: Relative Risks to Maddequet/Eel Point from Sea Level Rise, Storm Surge, and Erosion
Buildings Feet of Road Within 500 Ft of the Coast 83 2,938 Daily Inundation Due to Sea Level Rise Risk
Intermediate Low, 2080 0 2,444 Intermediate High, 2080 9 6,524 High, 2080 11 9,333
Storm Surge Risk Below 15 Feet in Elevation 132 27,917 AE Zone 11 6,654 VE Zone 1 2,183 0.2% Annual Chance Flood Zone 5 2,204
Erosion Risk 50 Year Erosion Risk Zone (Long Term Rate) 25 100 50 Year Erosion Risk Zone (Short Term Rate) 55 2,545 50 Year Erosion Risk Zone (Average Rate) 34 670
Madaket
Madaket is a relatively densely developed residential neighborhood at the western end of Nantucket, surrounding Madaket Harbor. This is one of the most at-risk areas of the Island, with both high erosion rates and large areas falling within flood hazard and daily inundation due to sea level rise zones, although erosion and inundation risk zones do not always occur in the same locations. Madaket also hosts the only other active and dredged harbor on Nantucket, other than the Nantucket Harbor, although it is only utilized by small vessels and no freight transport takes place.
In this area of rapid erosion, roads and homes have been lost, and others continue to be at risk. Critical facilities are not affected in this area. Massachusetts Shoreline Change Project figures for this area:
Long Term: 11.55 - 10.79 ft/yr erosion Short Term: 9.94 - 6.3 ft/yr erosion
The Massachusetts Coastal Bank Erosion Hazard Mapping shows high top-of-bank lateral erosion loss across the southern shore of this neighborhood. Specific locations are listed below:
South of Massachusetts Avenue (249 feet between 2000 and 2013; 19 ft/yr) South of Rhode Island Avenue (225.2 feet between 2000 and 2013; 17.3 ft/yr) South of Madaket Road (194.8 feet between 2000 and 2013; 15.0 ft/yr) At the end of Starbuck Road (up to 252.3 feet between 2000 and 2013; 19.4 ft/yr)

APPENDIX A: DETAILED RISK ASSESSMENT
APPENDIX A: DETAILED RISK ASSESSMENT COASTAL RISK ASSESSMENT AND RESILIENCY STRATEGIES NANTUCKET, MA, 2020 Page 18
Table 9: Relative Risks to Madaket from Sea Level Rise, Storm Surge, and Erosion
Buildings Feet of Road Within 500 Ft of the Coast 274 28,426 Daily Inundation Due to Sea Level Rise Risk
Intermediate Low, 2080 10 193 Intermediate High, 2080 68 4,817 High, 2080 117 9,536
Storm Surge Risk Below 15 Feet in Elevation 426 33,931 AE Zone 114 9,654 VE Zone 22 1,069 *0.2% Annual Chance Flood Zone 48 5,172
Erosion Risk 50 Year Erosion Risk Zone (Long Term Rate) 267 42,135 50 Year Erosion Risk Zone (Short Term Rate) 267 41,562 50 Year Erosion Risk Zone (Average Rate) 279 42,133 * This row reports the number of assets located outside of a 1% annual chance flood zone but inside a 0.2% annual chance flood zone; assets in AE or VE zones are also at risk from a 0.2% flood event.
Smith Point
Smith Point is no longer home to many dwellings, but many of those that are left fall within flood and erosion risk zones. Millie’s Bridge, which connects Smith Point to the rest of Nantucket, is at risk of damage from flooding and erosion and has historically experienced scour; significant damage to the bridge would result in the isolation of all Smith Point residents. Heavy surf from the April 16-17, 2007 nor’easter severed the end of Smith Point, known as Esther Island; there is now no official road to the three cottages on Esther. Critical facilities are not affected in this area.
Massachusetts Shoreline Change Project figures for this area are:
Long Term: 11.74 – 11.19 ft/yr erosion Short Term: 9.55 – 3.84 ft/yr erosion

APPENDIX A: DETAILED RISK ASSESSMENT
APPENDIX A: DETAILED RISK ASSESSMENT COASTAL RISK ASSESSMENT AND RESILIENCY STRATEGIES NANTUCKET, MA, 2020 Page 19
Table 10: Relative Risks to Smith Point from Sea Level Rise, Storm Surge, and Erosion
Buildings Feet of Road Within 500 Ft of the Coast 5 0 Daily Inundation Due to Sea Level Rise Risk
Intermediate Low, 2080 0 - Intermediate High, 2080 1 - High, 2080 4 -
Storm Surge Risk - Below 15 Feet in Elevation 5 - AE Zone 2 - VE Zone 0 - *0.2% Annual Chance Flood Zone 3 -
Erosion Risk - 50 Year Erosion Risk Zone (Long Term Rate) 5 - 50 Year Erosion Risk Zone (Short Term Rate) 1 - 50 Year Erosion Risk Zone (Average Rate) 5 - * This row reports the number of assets located outside of a 1% annual chance flood zone but inside a 0.2% annual chance flood zone; assets in AE or VE zones are also at risk from a 0.2% flood event.
Sheep Pond Road
Erosion is the most significant coastal hazard of concern in the Sheep Pond Road neighborhood. Many sections of the road, as well as numerous homes, have historically been lost to erosion, and continue to be at risk of erosion, in this area. Critical facilities are not affected.
Massachusetts Shoreline Change Project figures for this area:
Long Term: 11.55 – 10.63 ft/yr erosion Short Term: 9.74 – 4.82 ft/yr erosion
The Massachusetts Coastal Bank Erosion Hazard Mapping shows high top-of-bank lateral erosion loss across the southern shore of this neighborhood. Specific locations are listed below:
At the west end of Sheep Pond Road (up to 226.4 feet between 2000 and 2013; 17.4 ft/yr) At the east end of Sheep Pond Road (up to 148.7 feet between 2000 and 2013; 11.4 ft/yr) Shoreward of Red Barn Road (up to 158.5 feet between 2000 and 2013; 12.2 ft/yr)

APPENDIX A: DETAILED RISK ASSESSMENT
APPENDIX A: DETAILED RISK ASSESSMENT COASTAL RISK ASSESSMENT AND RESILIENCY STRATEGIES NANTUCKET, MA, 2020 Page 20
Table 11: Relative Risks to Sheep Pond Road from Sea Level Rise, Storm Surge, and Erosion
Buildings Feet of Road Within 500 Ft of the Coast 26 12,926 Daily Inundation Due to Sea Level Rise Risk
Intermediate Low, 2080 0 0 Intermediate High, 2080 1 142 High, 2080 1 1,619
Storm Surge Risk Below 15 Feet in Elevation 9 12,836 AE Zone 1 1,241 VE Zone 0 1 *0.2% Annual Chance Flood Zone 0 2,102
Erosion Risk 50 Year Erosion Risk Zone (Long Term Rate) 41 30,502 50 Year Erosion Risk Zone (Short Term Rate) 41 24,953 50 Year Erosion Risk Zone (Average Rate) 41 27,164 * This row reports the number of assets located outside of a 1% annual chance flood zone but inside a 0.2% annual chance flood zone; assets in AE or VE zones are also at risk from a 0.2% flood event.
Cisco/Hummock Pond
Erosion is the primary risk of concern in the Cisco and Hummock Pond neighborhood. Sections of the road in this neighborhood have been lost but no homes have become isolated. The bluff in this area has undergone erosion.
Massachusetts Shoreline Change Project figures for this area:
Long Term: 9.22 - 6.04 ft/yr erosion Short Term: 9.78 - 2.36 ft/yr erosion
The Massachusetts Coastal Bank Erosion Hazard Mapping shows high top-of-bank lateral erosion loss for much of the shoreline of this neighborhood. Specific locations are listed below:
West of Hummock Pond Road (63.2 feet between 2000 and 2013; 4.9 ft/yr) The end of Hummock Pond Road (88 feet between 2000 and 2013; 7 ft/yr) The western part of Falmouth Ave (up to 122.8 feet between 2000 and 2013; 9.4 ft/yr) Between Westerwyck Way and Walbang Avenue (up to 137.1 feet between 2000 and 2013;
10.5 ft/yr)

APPENDIX A: DETAILED RISK ASSESSMENT
APPENDIX A: DETAILED RISK ASSESSMENT COASTAL RISK ASSESSMENT AND RESILIENCY STRATEGIES NANTUCKET, MA, 2020 Page 21
Table 12: Relative Risks to Cisco/Hummock Pond from Sea Level Rise, Storm Surge, and Erosion
Buildings Feet of Road Within 500 Ft of the Coast 20 9,705 Daily Inundation Due to Sea Level Rise Risk
Intermediate Low, 2080 0 0 Intermediate High, 2080 0 0 High, 2080 0 0
Storm Surge Risk Below 15 Feet in Elevation 107 15,683 AE Zone 1 0 VE Zone 0 253 *0.2% Annual Chance Flood Zone 18 667
Erosion Risk 50 Year Erosion Risk Zone (Long Term Rate) 61 23,602 50 Year Erosion Risk Zone (Short Term Rate) 84 24,452 50 Year Erosion Risk Zone (Average Rate) 64 22,908 * This row reports the number of assets located outside of a 1% annual chance flood zone but inside a 0.2% annual chance flood zone; assets in AE or VE zones are also at risk from a 0.2% flood event.
Miacomet
As with other neighborhoods on the southern side of Nantucket, erosion is the primary hazard of concern.
Table 13: Relative Risks to Miacomet from Sea Level Rise, Storm Surge, and Erosion
Buildings Feet of Road Within 500 Ft of the Coast 10 2,683 Daily Inundation Due to Sea Level Rise Risk
Intermediate Low, 2080 0 0 Intermediate High, 2080 0 0 High, 2080 0 2
Storm Surge Risk Below 15 Feet in Elevation 24 34,327 AE Zone 0 912 VE Zone 0 0 *0.2% Annual Chance Flood Zone 1 0
Erosion Risk 50 Year Erosion Risk Zone (Long Term Rate) 13 7,342 50 Year Erosion Risk Zone (Short Term Rate) 2 1,242 50 Year Erosion Risk Zone (Average Rate) 9 2,973 * This row reports the number of assets located outside of a 1% annual chance flood zone but inside a 0.2% annual chance flood zone; assets in AE or VE zones are also at risk from a 0.2% flood event.

APPENDIX A: DETAILED RISK ASSESSMENT
APPENDIX A: DETAILED RISK ASSESSMENT COASTAL RISK ASSESSMENT AND RESILIENCY STRATEGIES NANTUCKET, MA, 2020 Page 22
South Shore/Surfside
Historic data shows the shoreline in this neighborhood as being relatively stable, though erosion is a concern due to the proximity of important assets to the shoreline. This area is densely developed with homes and is also the site of the Surfside Wastewater Treatment Plant and related facilities.
Massachusetts Shoreline Change Project figures for this area:
Long Term: 2.1 ft/yr erosion - 5.22 ft/yr accretion Short Term: 2.4 ft/yr erosion - 7.84 ft/yr accretion
The Massachusetts Coastal Bank Erosion Hazard Mapping shows low top-of-bank lateral erosion loss (within the margin of error for the dataset) for the shoreline from Surfside Road eastward to the Airport.
Table 14: Relative Risks to South Shore/Surfside from Sea Level Rise, Storm Surge, and Erosion
Buildings Feet of Road Within 500 Ft of the Coast 42 11,340 Daily Inundation Due to Sea Level Rise Risk
Intermediate Low, 2080 1 0 Intermediate High, 2080 2 76 High, 2080 2 646
Storm Surge Risk Below 15 Feet in Elevation 69 5,452 AE Zone 0 850 VE Zone 0 64 *0.2% Annual Chance Flood Zone 15 1,144
Erosion Risk 50 Year Erosion Risk Zone (Long Term Rate) 84 22,583 50 Year Erosion Risk Zone (Short Term Rate) 46 9,374 50 Year Erosion Risk Zone (Average Rate) 7 3,357 * This row reports the number of assets located outside of a 1% annual chance flood zone but inside a 0.2% annual chance flood zone; assets in AE or VE zones are also at risk from a 0.2% flood event.
Airport
This portion of Nantucket is eroding. Erosion at the airport is the primary concern, though some homes are also at risk.
Massachusetts Shoreline Change Project figures for this area:
Long Term: 8.46 - 7.51 ft/yr erosion Short Term: 3.51 ft/yr erosion - 0.56 ft/yr accretion
The Massachusetts Coastal Bank Erosion Hazard Mapping shows moderate and high top-of-bank lateral erosion loss for some of the shoreline south of Madequecham Valley Road, with erosion losses generally increasing as one moves to the east. A sample of erosion distances are listed below:

APPENDIX A: DETAILED RISK ASSESSMENT
APPENDIX A: DETAILED RISK ASSESSMENT COASTAL RISK ASSESSMENT AND RESILIENCY STRATEGIES NANTUCKET, MA, 2020 Page 23
Western end of Madequecham Valley Road (up to 45.5 feet between 1993 and 2013; 2.3 ft/yr)
Center of Madequecham Valley Road (up to 78.4 feet between 1993 and 2013; 3.9 ft/yr) Eastern end of Madequecham Valley Road, before the turn northward (up to 118.8 feet
between 1993 and 2013; 5.9 ft/yr)
Table 15: Relative Risks to the Airport Neighborhood from Sea Level Rise, Storm Surge, and Erosion
Buildings Feet of Road Within 500 Ft of the Coast 30 2,462 Daily Inundation Due to Sea Level Rise Risk
Intermediate Low, 2080 0 0 Intermediate High, 2080 0 0 High, 2080 0 0
Storm Surge Risk Below 15 Feet in Elevation 8 3,577 AE Zone 0 0 VE Zone 0 0 *0.2% Annual Chance Flood Zone 2 195
Erosion Risk 50 Year Erosion Risk Zone (Long Term Rate) 34 28,314 50 Year Erosion Risk Zone (Short Term Rate) 17 11,285 50 Year Erosion Risk Zone (Average Rate) 33 25,975 * This row reports the number of assets located outside of a 1% annual chance flood zone but inside a 0.2% annual chance flood zone; assets in AE or VE zones are also at risk from a 0.2% flood event.
Tom Nevers/Southeast Quarter
Flooding is only a minor concern in Tom Nevers and the Southeast Quarter of Nantucket; erosion is the primary risk. Portions of Tom Nevers Road have been lost to erosion, but homes have not yet been lost. The bluff in this area has undergone erosion. A parking lot was lost during a January 1998 storm. However, critical facilities are not affected.
Massachusetts Shoreline Change Project figures for this area:
Long Term: 0.85 - 3.71 ft/yr erosion Short Term: 4.53 - 16.17 ft/yr erosion
The Massachusetts Coastal Bank Erosion Hazard Mapping shows high top-of-bank lateral erosion loss for much of the shoreline south of New South Road and South Road. Erosion losses are low (within the margin of error of the dataset) east of Dorset Road. Specific lateral erosion losses are listed below:
East of Wigwam Pond (up to 110.4 feet between 2000 and 2013; 8.5 ft/yr) At Chappomiss Valley, where New South Road becomes South Road (up to 86.8 feet
between 2000 and 2013; 6.7 ft/yr) At the western end of Tom Nevers Road (up to 128.1 feet between 2000 and 2013; 9.9 ft/yr)

APPENDIX A: DETAILED RISK ASSESSMENT
APPENDIX A: DETAILED RISK ASSESSMENT COASTAL RISK ASSESSMENT AND RESILIENCY STRATEGIES NANTUCKET, MA, 2020 Page 24
Table 16: Relative Risks to Tom Nevers/Southeast Quarter from Sea Level Rise, Storm Surge, and Erosion
Buildings Feet of Road Within 500 Ft of the Coast 63 12,828 Daily Inundation Due to Sea Level Rise Risk
Intermediate Low, 2080 0 0 Intermediate High, 2080 0 0 High, 2080 1 42
Storm Surge Risk Below 15 Feet in Elevation 53 7,847 AE Zone 0 183 VE Zone 0 0 *0.2% Annual Chance Flood Zone 9 2,739
Erosion Risk 50 Year Erosion Risk Zone (Long Term Rate) 24 21,379 50 Year Erosion Risk Zone (Short Term Rate) 238 97,386 50 Year Erosion Risk Zone (Average Rate) 138 59,899 * This row reports the number of assets located outside of a 1% annual chance flood zone but inside a 0.2% annual chance flood zone; assets in AE or VE zones are also at risk from a 0.2% flood event.
Siasconset
The area known as ‘Sconset consistently shows low risk from coastal flooding, but erosion risk varies by location.
In the Low Beach area, the Massachusetts Shoreline Change Project demonstrated that the shoreline is very unstable. Between 1846 and 1887, the beach reportedly accreted 238 feet; from 1887-1955 it eroded 32 feet; and from 1955-1978, this same beach eroded 204 feet. Despite the apparent long-term net stability of the beach, any buildings constructed here when the beach was accreting would have subsequently been destroyed when it eroded.
Significant erosion occurred in Codfish Park during major storms in the 1990s, but since then the beach has accreted somewhat. More than 50 homes are located on the beach below the bluff, and these homes are extremely vulnerable to erosion and subsequent loss if erosion becomes a problem again, as is expected (in particular with sea level rise). Massachusetts Shoreline Change Project figures for this area:
Long Term: 0.49 - 1.21 ft/yr accretion Short Term: 5.05 - 4.2 ft/yr erosion
Erosion has recently plagued Sankaty Head and ‘Sconset Beach, and Sankaty Head Lighthouse has been relocated farther back from the shoreline. Homes along Baxter Road have been moved back as well, and a number of projects intended to mitigate erosion have been implemented pursuant to previous Conservation Commission approvals. Erosion of the bluff here threatens both private homes and Baxter Road. Massachusetts Shoreline Change Project figures for this area:

APPENDIX A: DETAILED RISK ASSESSMENT
APPENDIX A: DETAILED RISK ASSESSMENT COASTAL RISK ASSESSMENT AND RESILIENCY STRATEGIES NANTUCKET, MA, 2020 Page 25
Long Term: 0.85 ft/yr erosion - 0.72 ft/yr accretion
Short Term: 9.68 - 3.84 ft/yr erosion
Low Beach has accreted and eroded over a very wide range in the last 100 years. If the bluff erodes to within 100 feet of a permanent marker, the Town must plan a new location for the effluent beds at the ‘Sconset WWTP, located in this area. Massachusetts Shoreline Change Project figures for this area:
Long Term: 2.66 - 4.3 ft/yr accretion Short Term: 4.63 ft/yr erosion - 6.0 ft/yr accretion
The Massachusetts Coastal Bank Erosion Hazard Mapping shows low top-of-bank lateral erosion loss (within the margin of error of the dataset) for the southern shoreline of this ‘Sconset. Erosion losses are high along much of Baxter Road, decreasing again north near Sesachacha Pond. Sample lateral erosion losses are listed below:
Baxter Road, South of Sankaty Light (up to 173 feet between 1993 and 2013; 8.7 ft/yr) Baxter Road, at Sankaty Light (54.8 feet between 1993 and 2013; 2.7 ft/yr) End of Holcks Hollow Road (74.7 feet between 1993 and 2013; 3.7 ft/yr)
Overall, much of the ‘Sconset shoreline is characterized by high bluffs, and erosion of those bluffs is the primary risk to properties and infrastructure.
Table 17: Relative Risks to Siasconset from Sea Level Rise, Storm Surge, and Erosion
Buildings Feet of Road Within 500 Ft of the Coast 232 30,640 Daily Inundation Due to Sea Level Rise Risk
Intermediate Low, 2080 0 0 Intermediate High, 2080 0 0 High, 2080 0 0
Storm Surge Risk Below 15 Feet in Elevation 96 11,746 AE Zone 0 77 VE Zone 2 88 *0.2% Annual Chance Flood Zone 4 0
Erosion Risk 50 Year Erosion Risk Zone (Long Term Rate) 1 0 50 Year Erosion Risk Zone (Short Term Rate) 622 102,642 50 Year Erosion Risk Zone (Average Rate) 199 27,450 * This row reports the number of assets located outside of a 1% annual chance flood zone but inside a 0.2% annual chance flood zone; assets in AE or VE zones are also at risk from a 0.2% flood event.
Quidnet
The neighborhood north of Sesachacha Pond has few homes or roads, and an overall low risk from coastal hazards. Sesachacha Pond itself is a potential source of flooding and wave action, especially
Because of the difference in the methods used to delineate shoreline change over time, the Massachusetts Shoreline Change Project does not reflect the high bluff-erosion rates that exist in some parts of the neighborhood, while the Massachusetts Coastal Bank Erosion Hazard Mapping does.

APPENDIX A: DETAILED RISK ASSESSMENT
APPENDIX A: DETAILED RISK ASSESSMENT COASTAL RISK ASSESSMENT AND RESILIENCY STRATEGIES NANTUCKET, MA, 2020 Page 26
when the barrier beach between the pond and the ocean is breached (which can occur during storm events). Sesachacha Pond poses a threat to Polpis Road; in 2018 the road was washed out by flooding and wave action from the pond.
Isolation of the neighborhood due to flooding elsewhere along Polpis Road is also a concern. The Massachusetts Coastal Bank Erosion Hazard Mapping shows low top-of-bank lateral erosion loss (within the margin of error for the dataset) for the shoreline.
Table 18: Relative Risks to Quidnet from Sea Level Rise, Storm Surge, and Erosion
Buildings Feet of Road Within 500 Ft of the Coast 49 4,142 Daily Inundation Due to Sea Level Rise Risk
Intermediate Low, 2080 0 0 Intermediate High, 2080 1 0 High, 2080 4 0
Storm Surge Risk Below 15 Feet in Elevation 26 2,700 AE Zone 3 0 VE Zone 5 393 *0.2% Annual Chance Flood Zone 4 338
Erosion Risk 50 Year Erosion Risk Zone (Long Term Rate) 9 333 50 Year Erosion Risk Zone (Short Term Rate) 0 0 50 Year Erosion Risk Zone (Average Rate) 0 4 * This row reports the number of assets located outside of a 1% annual chance flood zone but inside a 0.2% annual chance flood zone; assets in AE or VE zones are also at risk from a 0.2% flood event.
Wauwinet
The Wauwinet shoreline appears to be fairly stable, though its relatively low elevation makes flooding and sea level rise a risk. The Massachusetts Coastal Bank Erosion Hazard Mapping shows low top-of-bank lateral erosion loss (within the margin of error for the dataset) for the shoreline
Table 19: Relative Risks to Wauwinet from Sea Level Rise, Storm Surge, and Erosion
Buildings Feet of Road Within 500 Ft of the Coast 108 6,112 Daily Inundation Due to Sea Level Rise Risk
Intermediate Low, 2080 1 573 Intermediate High, 2080 8 2,460 High, 2080 19 4,386
Storm Surge Risk Below 15 Feet in Elevation 90 8,029 AE Zone 13 4,715 VE Zone 22 201 *0.2% Annual Chance Flood Zone 6 346
Erosion Risk 50 Year Erosion Risk Zone (Long Term Rate) 76 6,269

APPENDIX A: DETAILED RISK ASSESSMENT
APPENDIX A: DETAILED RISK ASSESSMENT COASTAL RISK ASSESSMENT AND RESILIENCY STRATEGIES NANTUCKET, MA, 2020 Page 27
Buildings Feet of Road 50 Year Erosion Risk Zone (Short Term Rate) 21 3,697 50 Year Erosion Risk Zone (Average Rate) 40 3,153 * This row reports the number of assets located outside of a 1% annual chance flood zone but inside a 0.2% annual chance flood zone; assets in AE or VE zones are also at risk from a 0.2% flood event.
Pocomo
Based on the short-term historic erosion rate, erosion is a risk for Pocomo. Coastal flooding is not a significant risk. The Massachusetts Coastal Bank Erosion Hazard Mapping shows low top-of-bank lateral erosion loss (within the margin of error for the dataset) for the shoreline.
Table 20: Relative Risks to Pocomo from Sea Level Rise, Storm Surge, and Erosion
Buildings Feet of Road Within 500 Ft of the Coast 74 7,453 Daily Inundation Due to Sea Level Rise Risk
Intermediate Low, 2080 0 74 Intermediate High, 2080 1 497 High, 2080 6 2,169
Storm Surge Risk Below 15 Feet in Elevation 55 8,236 AE Zone 3 1,743 VE Zone 1 77 *0.2% Annual Chance Flood Zone 8 1,225
Erosion Risk 50 Year Erosion Risk Zone (Long Term Rate) 0 0 50 Year Erosion Risk Zone (Short Term Rate) 72 7,189 50 Year Erosion Risk Zone (Average Rate) 16 345 * This row reports the number of assets located outside of a 1% annual chance flood zone but inside a 0.2% annual chance flood zone; assets in AE or VE zones are also at risk from a 0.2% flood event.
Polpis
Based on the short-term historic erosion rate, erosion is a risk for Polpis. Coastal flooding is a moderate risk. The Massachusetts Coastal Bank Erosion Hazard Mapping shows low top-of-bank lateral erosion loss (within the margin of error for the dataset) for the shoreline.

APPENDIX A: DETAILED RISK ASSESSMENT
APPENDIX A: DETAILED RISK ASSESSMENT COASTAL RISK ASSESSMENT AND RESILIENCY STRATEGIES NANTUCKET, MA, 2020 Page 28
Table 21: Relative Risks to Polpis from Sea Level Rise, Storm Surge, and Erosion
Buildings Feet of Road Within 500 Ft of the Coast 55 5,576 Daily Inundation Due to Sea Level Rise Risk
Intermediate Low, 2080 1 8 Intermediate High, 2080 11 679 High, 2080 17 1,537
Storm Surge Risk Below 15 Feet in Elevation 96 13,750 AE Zone 17 1,601 VE Zone 3 0 *0.2% Annual Chance Flood Zone 29 6,520
Erosion Risk 50 Year Erosion Risk Zone (Long Term Rate) 0 0 50 Year Erosion Risk Zone (Short Term Rate) 94 15,066 50 Year Erosion Risk Zone (Average Rate) 29 1,315 * This row reports the number of assets located outside of a 1% annual chance flood zone but inside a 0.2% annual chance flood zone; assets in AE or VE zones are also at risk from a 0.2% flood event.
Shawkemo/Quaise
The Shawkemo/Quaise neighborhood shows moderate risk to buildings from erosion and low risk from flooding. The Massachusetts Coastal Bank Erosion Hazard Mapping shows low top-of-bank lateral erosion loss (within the margin of error for the dataset) for a small segment of shoreline, and no erosion for most of the neighborhood.
Table 22: Relative Risks to Shawkemo/Quaise from Sea Level Rise, Storm Surge, and Erosion
Buildings Feet of Road Within 500 Ft of the Coast 82 11,694 Daily Inundation Due to Sea Level Rise Risk
Intermediate Low, 2080 0 0 Intermediate High, 2080 3 297 High, 2080 7 1,137
Storm Surge Risk Below 15 Feet in Elevation 66 8,605 AE Zone 6 1,296 VE Zone 0 0 *0.2% Annual Chance Flood Zone 3 967
Erosion Risk 50 Year Erosion Risk Zone (Long Term Rate) 10 38 50 Year Erosion Risk Zone (Short Term Rate) 34 1,342 50 Year Erosion Risk Zone (Average Rate) 31 831 * This row reports the number of assets located outside of a 1% annual chance flood zone but inside a 0.2% annual chance flood zone; assets in AE or VE zones are also at risk from a 0.2% flood event.

APPENDIX A: DETAILED RISK ASSESSMENT
APPENDIX A: DETAILED RISK ASSESSMENT COASTAL RISK ASSESSMENT AND RESILIENCY STRATEGIES NANTUCKET, MA, 2020 Page 29
Monomoy
The Monomoy neighborhood shows moderate risk from erosion and low risk from flooding. The Massachusetts Coastal Bank Erosion Hazard Mapping shows low top-of-bank lateral erosion loss (within the margin of error for the dataset) for the shoreline.
Table 23: Relative Risks to Monomoy from Sea Level Rise, Storm Surge, and Erosion
Buildings Feet of Road Within 500 Ft of the Coast 110 14,366 Daily Inundation Due to Sea Level Rise Risk
Intermediate Low, 2080 3 9 Intermediate High, 2080 195 High, 2080 14 452
Storm Surge Risk Below 15 Feet in Elevation 60 6,457 AE Zone 14 519 VE Zone 0 *0.2% Annual Chance Flood Zone 1 275
Erosion Risk 50 Year Erosion Risk Zone (Long Term Rate) 5 0 50 Year Erosion Risk Zone (Short Term Rate) 79 7,670 50 Year Erosion Risk Zone (Average Rate) 37 269 * This row reports the number of assets located outside of a 1% annual chance flood zone but inside a 0.2% annual chance flood zone; assets in AE or VE zones are also at risk from a 0.2% flood event.
Mid-Island
Most of the Mid-Island neighborhood is located inland, and has low exposure to coastal hazards. Nevertheless, extrapolating short-term erosion rates shows a risk for buildings and infrastructure in the neighborhood. Flood risk is relatively low, though many buildings are in 0.2% annual chance flood zone.

APPENDIX A: DETAILED RISK ASSESSMENT
APPENDIX A: DETAILED RISK ASSESSMENT COASTAL RISK ASSESSMENT AND RESILIENCY STRATEGIES NANTUCKET, MA, 2020 Page 30
Buildings Feet of Road Within 500 Ft of the Coast 42 1,659 Daily Inundation Due to Sea Level Rise Risk
Intermediate Low, 2080 1 0 Intermediate High, 2080 11 348 High, 2080 33 1,324
Storm Surge Risk Below 15 Feet in Elevation 239 15,371 AE Zone 28 1,295 VE Zone 1 131 *0.2% Annual Chance Flood Zone 103 7,430
Erosion Risk 50 Year Erosion Risk Zone (Long Term Rate) 0 0 50 Year Erosion Risk Zone (Short Term Rate) 162 7,825 50 Year Erosion Risk Zone (Average Rate) 14 576 * This row reports the number of assets located outside of a 1% annual chance flood zone but inside a 0.2% annual chance flood zone; assets in AE or VE zones are also at risk from a 0.2% flood event.
Other Neighborhoods
Coatue/Great Point, Moors, Middle Pasture/Folger Hill, and Tuckernuck all have limited public infrastructure and few buildings at risk from coastal hazards.

APPENDIX A: DETAILED RISK ASSESSMENT
APPENDIX A: DETAILED RISK ASSESSMENT COASTAL RISK ASSESSMENT AND RESILIENCY STRATEGIES NANTUCKET, MA, 2020 Page 31
Summary
The degree of risk to each Planning Neighborhood, described above, is qualitatively summarized for comparison below.
Qualitative risk levels are determined for each Planning Neighborhood based on how far inland the inundation (sea level rise and storm surge) or erosion risk zones extend, and how many buildings and feet of road fall within those areas. Risk levels are determined as follows:
Low: risk zones include less than approximately 25% of roads or buildings within 500 feet of the shoreline
Moderate: risk zones include between approximately 25% and 50% of roads or buildings within 500 feet of the shoreline
Considerable: risk zones include between approximately 50% and 75% of roads or buildings within 500 feet of the shoreline
High: risk zones include between approximately 75% and 100% of roads or buildings within 500 feet of the shoreline
Severe: risk zones extend farther inland than 500 feet from the shoreline
Additionally, the total number of buildings and total lengths of roads, as well as critical facilities and isolation risks, are taken into consideration for this exercise.
Table 28 presents a summary of relative risk levels for each Planning Neighborhood. This information can be used to compare risk levels geographically across Nantucket. Areas with low risk may still experience damage, while areas with high risk may escape impacts during a given event.
Table 24: Summary of Risk Level by Neighborhood
Neighborhood Structures Roads Notes Inundation Erosion Inundation Erosion
Downtown High Moderate High Moderate ⋅ Historic Resources ⋅ Ferries & Shipping ⋅ Economic Center
Brant Point Severe Low Severe Low ⋅ Isolation Risk
Cliff Road Moderate Moderate Considerable Low ⋅ Isolation Risk Maddequet / Eel Point Low Moderate High Moderate ⋅ Isolation Risk
Madaket Moderate High Moderate Severe ⋅ Relatively Dense Smith Point Moderate Considerable N/A N/A ⋅ Minimal Density
Sheep Pond Road Low Severe Low Severe ⋅ Loss of Roads Cisco / Hummock Pond Low Severe Low Severe
Moors Low Low Low Low Miacomet Low High Low Severe
South Shore / Surfside Low High Low High ⋅ WWTP at Risk
Airport Area Low High Low Severe ⋅ Airport Runway at Risk
Tom Nevers / Southeast Quarter
Low Severe Low Severe
Siasconset Low High Low Severe ⋅ Relatively Dense ⋅ WWTP at Risk
Quidnet Low Low Considerable Considerable ⋅ Low Density ⋅ Isolation Risk

APPENDIX A: DETAILED RISK ASSESSMENT
APPENDIX A: DETAILED RISK ASSESSMENT COASTAL RISK ASSESSMENT AND RESILIENCY STRATEGIES NANTUCKET, MA, 2020 Page 32
Neighborhood Structures Roads Notes Inundation Erosion Inundation Erosion
Wauwinet Low Moderate Moderate Considerable Pocomo Low Considerable Low Considerable Polpis Moderate Considerable Moderate Considerable
Shawkemo / Quaise Low Moderate Low Moderate Monomoy Low Moderate Low Moderate
Mid-Island Moderate Moderate Considerable Moderate ⋅ Mostly more than 500 ft from shore
Coatue / Great Point N/A N/A N/A N/A ⋅ No Population Middle Pasture / Folger Hill Low Low Low Low ⋅ Inland
Tuckernuck Low Low N/A N/A ⋅ Private Island
1.4 Concerns Identified through Public Participation Members of the public were invited to participate in development of this plan through two public workshops and an online survey. Both workshops were held at the Nantucket Police Department at 4 Fairgrounds Road; the first took place on May 10 and the second on July 18, 2019. Thirty-five (35) individuals attended the May meeting and thirty-one (31) individuals attended in July. Each public meeting consisted of a presentation on the Coastal Resiliency Plan project, and provided opportunities for public participation and feedback through “clicker” voting during the presentation, “sticker” voting on posters, comment cards, and open forum discussions. The online survey was posted from May 10 through August 26, 2018, and received 153 responses.
The information collected through those engagement efforts has been incorporated throughout the Coastal Risk Assessment and Resiliency Strategies report; in addition, concerns identified by members of the public are specifically highlighted here.
Climate Change Awareness and Concerns
Nantucket residents who attended the two workshops are confident that flood and erosion hazards have become more frequent or accelerated. They are somewhat confident that precipitation has become more intense.
Workshop participants and survey respondents were asked to select which of a suite of climate-related challenges they felt were most urgent. These are summarized in Table 28 and Table 29, below.
Table 25: Most Urgent Climate Related Challenges Selected by Workshop Participants
Climate-Related Challenge # Selecting More Frequent/Intense Storms & Erosion 36 More Rapidly Rising Seas & Erosion 21 Insect- & Tick-Bourne Illnesses 3 Extreme Temperatures 1 More Frequent/Severe Droughts 0

APPENDIX A: DETAILED RISK ASSESSMENT
APPENDIX A: DETAILED RISK ASSESSMENT COASTAL RISK ASSESSMENT AND RESILIENCY STRATEGIES NANTUCKET, MA, 2020 Page 33
Table 26: Climate Risks of Concern Identified through Online Survey
Hazard of Concern Average Concern Ranking (1-3, 3, being highest)
Sea Level Rise 2.72 Accelerated Erosion 2.69 More Frequent/Intense Storms 2.65 Rising Temperatures 2.25 More Acute Droughts 1.88
Workshop participants were concerned primarily with the impacts of severe storm events, including erosion during such storms. Participants were also concerned about accelerated sea level rise and erosion under non-storm conditions. Survey respondents were concerned primary with sea level rise, although accelerated erosion and increasingly severe and frequent storms were also top concerns.
Based on these results, the top climate change concerns for Nantucket residents are:
Sea level rise Increasingly frequent and intense storms Accelerated erosion
Priority Coastal Challenges
Workshop participants were asked about which coastal challenges should be addressed first. Online survey respondents were asked to identify top hazards of concern, and hazards that had impacted them in the past. Responses are summarized in Table 30, Table 31, and Table 32.
Table 27: Priority Challenges from Workshop Participants
Which of the following needs to be addressed first? # Selecting Damage to utility infrastructure from extreme event 46 Prolonged isolation from the mainland 9 Inundation of private property and businesses 5 Damage to beaches and natural resources 5 Erosion of private properties and businesses 1
Table 28: Top Hazards of Concern Identified through Online Survey
Hazard of Concern Average Concern Ranking (1-3, 3, being highest)
Erosion Of Land 2.75 Coastal Flooding 2.65 Insect- & Tick-borne Diseases 2.44 Damage To Structures From Waves 2.43 Secondary Damage From Fuel or Sewage Leaks 2.25
Table 29: Hazards Historically Impacting Residents, Identified through Online Survey
Hazard of Concern # Selecting Erosion Of Land 54

APPENDIX A: DETAILED RISK ASSESSMENT
APPENDIX A: DETAILED RISK ASSESSMENT COASTAL RISK ASSESSMENT AND RESILIENCY STRATEGIES NANTUCKET, MA, 2020 Page 34
Hazard of Concern # Selecting Interruptions to passenger travel to and from the Island 53 Insect- & Tick-borne Diseases 51 Coastal Flooding 46
Workshop participants had a high level of concern about public utilities. Online survey results reflect, again, concern about erosion and flooding, as well as insect and tick-borne diseases (identified as a concern, albeit a relatively low one, in the workshops). Survey results also show concern about impacts to utilities, and the leaks that can be caused by those utilities. Interruptions of passenger travel to and from the Island was the second-place challenge during the workshops, and a top challenge that survey respondents reported having experienced in the past; however, it does not appear to be a major concern for the future.
Based on these results, the top hazard challenges for Nantucket residents are:
Erosion of Land Coastal Flooding Damage to Utilities
Risks to Neighborhoods
Workshop participants were asked to indicate their thoughts about risks in each neighborhood of Nantucket. Neighborhoods were grouped for the purposes of this activity to limit the amount of voting attendees were required to do. Results are presented in Table 33. The most frequently chosen risk and option for each neighborhood is bolded.
Results show that flooding is the primary concern in Downtown and Brant Point, Quidnet and Wauwinet, and the neighborhoods on the south side of Nantucket Harbor. Erosion is the primary concern in Madaket and Sheep Pond Road, all along the south shore of Nantucket from Cisco to Southeast Quarter, and on the eastern end of the Island in Siasconset. Flooding and Erosion were tied for Coatue and Great Point, and Erosion and Wind were tied for the north shore of the western part of Nantucket, in the Cliff Road and Maddequet/Eel Point neighborhoods.

APPENDIX A: DETAILED RISK ASSESSMENT
APPENDIX A: DETAILED RISK ASSESSMENT COASTAL RISK ASSESSMENT AND RESILIENCY STRATEGIES NANTUCKET, MA, 2020 Page 35
Table 30: Primary Risks for Nantucket Neighborhoods
Risk
Dow
ntow
n/Br
ant P
oint
Cl
iff R
oad/
Mad
dequ
et/E
el P
oint
Mad
aket
/She
ep P
ond
Rd
Cisc
o/Hu
mm
ock
Pond
/ M
iaco
met
/Sou
th S
hore
/Sur
fsid
e
Airp
ort A
rea
Tom
Nev
ers/
Sout
heas
t Qua
rter
Sias
cons
et
Qui
dnet
/Wau
win
et
Poco
mo/
Polp
is/S
haw
kem
o/
Qua
ise/
Mon
omoy
/Mid
-Isla
nd
Coat
ue/G
reat
Poi
nt
Flood Inundation 41% 26% 38% 29% 14% 11% 11% 35% 41% 34% Erosion 10% 32% 44% 35% 35% 38% 42% 34% 28% 34% Wind Events 12% 32% 17% 26% 33% 33% 28% 26% 19% 32% Intense Precipitation 34% 11% 2% 10% 14% 13% 18% 5% 11% 0% Drought 0% 0% 0% 0% 0% 4% 1% 0% 1% 0% Increasing Temperature 3% 0% 0% 1% 3% 0% 0% 0% 0% 0%
Specific Locations at Risk
Online survey respondents were asked to identify specific locations at risk throughout the Island. Responses were analyzed and categorized. Responses are summarized in Table 34 and in the word cloud shown as Figure 8.
Table 31: Top 20 At-Risk Locations Identified by Online Survey Respondents
Location or Landmark # of Mentions Downtown 23 Madaket 20 Sconset 11 South Shore 9 Brant Point 8 Smiths Point 8 Easy Street 7 Sconset Bluff 7 Washington Street 6 Codfish Park 5 Madaket Road 5 Ames Avenue 4 Baxter Road 4 Great Point 4 Polpis Road 4 Sankaty Head Beach Club 4 Sewer Beds 4 Tuckernuck 4 Bluffs 3 Hither Creek 3


Appendix B Paved Roads on Nantucket within Coastal Risk Zones


Paved Roads on Nantucket within Coastal Risk Zones
The table below provides a selection of paved roads1 on Nantucket that fall within FEMA flood zones, areas projected to be impacted by sea level rise, and areas projected to be impacted by erosion.
The “Flood Zone” column presents the most severe FEMA-mapped flood zone intersecting the road in question within the planning neighborhood listed; for example, if a road runs through both a 0.2% annual-chance flood zone and an AE zone (1% annual-chance), only AE is listed.
The “Sea Level Rise Risk” column presents the decade by which each road will be inundated at Mean Higher High Water (MHHW) based on NOAA 2017 projections, using the Intermediate-High Scenario. Projected MHHW inundation was mapped based on ground surface elevation only; mapping did not account for ocean currents, wave effects, erosion, or other factors. The years listed indicate the planning horizon within which MHHW inundation is projected to impact the road; for example, Broad Street in Downtown is projected to be inundated at MHHW between now and the 2050s (note that the planning horizons are “soft” boundaries, referring to decades rather than specific years).
The “Erosion Risk” column presents the decade by which each road will be impacted by erosion if erosion continues at a rate equal to the average of short-term and long-term historic rates. Mapping of areas projected to impacted by future erosion assumed constant erosion at that average rate into the future, and did not attempt to specifically account for changes in surficial geology or soil types, accelerated erosion due to sea level rise, or decelerated erosion due to human intervention. The years listed indicate the planning horizon within which erosion may impact the road based on continued erosion at the “average rate”; for example, Beaver Street in Downtown is projected to be inundated at MHHW between the 2050s and the 2080s (note that the planning horizons are “soft” boundaries, referring to decades rather than specific years).
Due to the uncertainties inherent in projecting sea level rise and erosion at specific locations, the information presented below should be considered only as planning-level estimates and should not be taken as certainties.
Name Neighborhood Flood Zone
Sea Level Rise Risk (Intermediate-High)
Erosion Risk (Average**)
Ash Ln Downtown AE Beyond 2080s Beyond 2080s Beaver St Downtown AE Beyond 2080s 2080s Broad St Downtown AE 2050's Beyond 2080s Cambridge St Downtown AE 2080s Beyond 2080s Candle St Downtown AE 2080s Beyond 2080s Coffin St Downtown AE 2080s Beyond 2080s Commercial St Downtown AE 2050's 2050s Coon St Downtown 0.2 % Beyond 2080s 2080s Dock St Downtown AE 2080s Beyond 2080s E Chestnut St Downtown AE 2080s Beyond 2080s
1 Mapped roads were provided by the Town and Nantucket as a Shapefile titled ROAD_CL_2016_06, and include private, Town, and State roads.

Name Neighborhood Flood Zone
Sea Level Rise Risk (Intermediate-High)
Erosion Risk (Average**)
E Dover St Downtown AE Beyond 2080s Beyond 2080s Easy St Downtown AE 2050's Beyond 2080s Francis St Downtown AE 2080s 2080s India St Downtown AE Beyond 2080s Beyond 2080s Main St Downtown AE 2080s Beyond 2080s Meader St Downtown AE 2080s 2080s Mulberry St Downtown AE Beyond 2080s Beyond 2080s N Union St Downtown AE Beyond 2080s Beyond 2080s N Water St Downtown AE Beyond 2080s Beyond 2080s New Whale St Downtown AE 2080s Beyond 2080s Oak St Downtown AE 2050's Beyond 2080s S Beach St Downtown AE 2080s Beyond 2080s S Beach St Ext Downtown AE 2080s Beyond 2080s S Water St Downtown AE 2080s Beyond 2080s Salem St Downtown AE 2080s Beyond 2080s Salt Marsh Wy Downtown AE 2080s 2050s Sea St Downtown AE 2080s Beyond 2080s Steamboat Wf Downtown AE 2050's Beyond 2080s Still Dock Downtown AE 2080s Beyond 2080s Straight Wf Downtown AE 2050's 2050s Union St Downtown AE 2080s 2080s Washington St Downtown VE 2080s 2050s Weymouth St Downtown AE 2080s Beyond 2080s Whalers Ln Downtown AE 2080s Beyond 2080s Bathing Beach Rd Brant Point AE 2080s Beyond 2080s Charles St Brant Point AE 2050's Beyond 2080s Cornish St Brant Point AE 2050's Beyond 2080s E Lincoln Av Brant Point AE 2050's Beyond 2080s Easton St Brant Point AE 2050's Beyond 2080s Harbor View Way Brant Point VE 2050's 2050s Henry St Brant Point AE 2050's Beyond 2080s Hulbert Av Brant Point AE 2050's Beyond 2080s James St Brant Point AE 2050's Beyond 2080s Jefferson Av Brant Point AE 2080s Beyond 2080s Johnson St Brant Point AE 2050's Beyond 2080s Mackay Wy Brant Point AE 2050's Beyond 2080s N Beach St Brant Point AE 2050's Beyond 2080s N Water St Brant Point AE Beyond 2080s Beyond 2080s North Av Brant Point AE 2080s Beyond 2080s S Beach St Brant Point AE 2050's Beyond 2080s Sandy Dr Brant Point AE 2050's Beyond 2080s Stone Barn Way Brant Point AE 2080s Beyond 2080s Swain St Brant Point AE 2050's Beyond 2080s Sylvia Ln Brant Point AE 2050's Beyond 2080s Walsh St Brant Point AE 2050's Beyond 2080s Willard St Brant Point AE 2050's Beyond 2080s Bathing Beach Rd Cliff Road AE 2050's Beyond 2080s Cobblestone Hill Cliff Road AE 2080s Beyond 2080s Jefferson Av Cliff Road AE 2080s Beyond 2080s A St Madaket None Beyond 2080s 2050s Ames Av Madaket AE Beyond 2080s 2050s Baltimore St Madaket None Beyond 2080s 2050s California Av Madaket 0.2 % Beyond 2080s 2050s D St Madaket None Beyond 2080s 2050s F St Madaket AE 2050's 2050s H St Madaket 0.2 % Beyond 2080s 2080s

Name Neighborhood Flood Zone
Sea Level Rise Risk (Intermediate-High)
Erosion Risk (Average**)
I St Madaket AE Beyond 2080s Beyond 2080s Long Pond Dr Madaket AE Beyond 2080s Beyond 2080s Madaket Rd Madaket AE 2080s 2050s N Cambridge St Madaket AE 2050's Beyond 2080s Pops Ln Madaket None Beyond 2080s 2050s Red Barn Rd Madaket AE 2080s Beyond 2080s S Cambridge St Madaket AE Beyond 2080s Beyond 2080s Tennessee Av Madaket AE 2080s 2050s Washington Av Madaket None Beyond 2080s 2050s Hummock Pond Rd Cisco/Hummock Pond None Beyond 2080s 2050s Tautemo Wy Cisco/Hummock Pond None Beyond 2080s 2080s Miacomet Rd Miacomet AE Beyond 2080s Beyond 2080s Pond View Dr Miacomet AE Beyond 2080s Beyond 2080s Chuck Hollow Rd Tom Nevers/Southeast Quarter None Beyond 2080s 2080s Elliots Wy Tom Nevers/Southeast Quarter None Beyond 2080s 2050s Old Tom Nevers Rd Tom Nevers/Southeast Quarter None Beyond 2080s 2050s Sandsbury Rd Tom Nevers/Southeast Quarter None Beyond 2080s 2080s South Rd Tom Nevers/Southeast Quarter None Beyond 2080s 2050s Tom Nevers Rd Tom Nevers/Southeast Quarter None Beyond 2080s 2050s Wanoma Wy Tom Nevers/Southeast Quarter None Beyond 2080s 2050s Anns Ln Siasconset None Beyond 2080s 2080s Baxter Rd Siasconset None Beyond 2080s 2050s Bayberry Sias Ln Siasconset None Beyond 2080s 2050s Beach St Siasconset None Beyond 2080s 2080s Codfish Park Ln Siasconset VE Beyond 2080s 2050s Gully Rd Siasconset None Beyond 2080s 2080s Hoicks Hollow Rd Siasconset None Beyond 2080s 2080s N Gully Rd Siasconset VE Beyond 2080s 2050s Polpis Rd Siasconset AE Beyond 2080s Beyond 2080s Wauwinet Rd Wauwinet AE Beyond 2080s Beyond 2080s Medouie Creek Rd Pocomo AE 2080s Beyond 2080s Wauwinet Rd Polpis AE 2080s 2080s Polpis Rd Shawkemo/Quaise AE 2080s Beyond 2080s Orange St Mid-Island AE Beyond 2080s Beyond 2080s Spring St Mid-Island AE 2080s 2080s Union St Mid-Island AE Beyond 2080s 2080s Williams St Mid-Island AE Beyond 2080s Beyond 2080s