TOWN OF BERKSHIRE NOTICE OF PUBLIC HEARING Tuesday …
126
TOWN OF BERKSHIRE NOTICE OF PUBLIC HEARING Tuesday April 21, 2015 7:00PM Berkshire Town Clerk’s Office Notice is hereby given to the residents of the Town of Berkshire, Vermont that the Berkshire Planning Commission will hold a hearing on April 21, 2015 at 7:00 p.m. at the Berkshire Town Clerk’s Office to consider for adoption the following Berkshire Municipal Plan pursuant to Chapter 117 of Title 24, Section 4387 and 4384, Vermont Statutes Annotated. According to Title 24 of the Vermont Statutes Annotated, Municipal Plans must be readopted every five years or they will expire. This plan update focused on bringing outdated data up to date, updating the goals and policies and incorporating a flood resilience element. The most recent Berkshire Town Plan will expire April 26, 2015. The purpose of this hearing is to receive public comment on the updated plan and to discuss any comments provided by the public. The proposed Berkshire Municipal Plan includes eight chapters: The Planning Process, A Snapshot of the Community, The Sense of Place, A Place for a Home, Earning a Living, Providing for the People, Keeping it Rural in the Future, and Getting from Here to There. A full text of the draft plan is on file in the Berkshire Town Clerk’s Office. The plan proposes goals and policies that impact the entire Town of Berkshire. This plan is intended to be consistent with the goals established in Title 24, Section 4302.
Transcript of TOWN OF BERKSHIRE NOTICE OF PUBLIC HEARING Tuesday …

TOWN OF BERKSHIRE NOTICE OF PUBLIC HEARING
Tuesday April 21, 2015
7:00PM Berkshire Town Clerk’s Office
Notice is hereby given to the residents of the Town of Berkshire, Vermont that the
Berkshire Planning Commission will hold a hearing on April 21, 2015 at 7:00 p.m. at the
Berkshire Town Clerk’s Office to consider for adoption the following Berkshire Municipal
Plan pursuant to Chapter 117 of Title 24, Section 4387 and 4384, Vermont Statutes
Annotated.
According to Title 24 of the Vermont Statutes Annotated, Municipal Plans must be
readopted every five years or they will expire. This plan update focused on bringing
outdated data up to date, updating the goals and policies and incorporating a flood
resilience element. The most recent Berkshire Town Plan will expire April 26, 2015. The
purpose of this hearing is to receive public comment on the updated plan and to
discuss any comments provided by the public.
The proposed Berkshire Municipal Plan includes eight chapters: The Planning Process, A
Snapshot of the Community, The Sense of Place, A Place for a Home, Earning a Living,
Providing for the People, Keeping it Rural in the Future, and Getting from Here to There.
A full text of the draft plan is on file in the Berkshire Town Clerk’s Office. The plan
proposes goals and policies that impact the entire Town of Berkshire. This plan is
intended to be consistent with the goals established in Title 24, Section 4302.

REPORT ON BERKSHIRE MUNICIPAL PLAN REVISION
Over the past year, the Berkshire Planning Commission has been working to complete an update of the Town’s “Municipal Plan”. This effort is part of a continuing planning process that guides the Town’s decisions for future growth. Their planning process conforms to the State’s four planning goals of Chapter 117, Section 4302, which strive for a comprehensive planning process that includes citizen participation, the consideration for the consequences of growth, and compatibility with surrounding municipalities. By state statute, Towns must prepare and update their town plan every five years; the current Berkshire Municipal Plan will expire on April 26, 2015. This plan revision focused on updating the all data and associated discussion, updating the goals and policies, and incorporating a flood resiliency element. The Berkshire Municipal Plan contains eight chapters, which include: The Planning Process, A Snapshot of the Community, The Sense of Place, A Place for a Home, Earning a Living, Providing for the People, Keeping it Rural in the Future, and Getting from Here to There. These chapters are consistent with the 14 goals established in Chapter 117, Section 4302. These goals aim to: maintain the historic settlement pattern of compact village centers separated by rural countryside; provide a strong and diverse economy with rewarding job opportunities; broaden access to educational and vocational training opportunities for people of all ages; provide for safe, convenient, economic, and energy efficient transportation systems; to identify, protect, and preserve important natural and historic resources; to maintain and improve the quality of air, water, wildlife, and land resources; to encourage the efficient use of energy and development of renewable energy resources; to maintain and enhance recreational opportunities; to encourage and strengthen agricultural and forest industries; to provide for the wise and efficient use of natural resources; to ensure the availability of safe and affordable housing; to plan for, finance, and provide an efficient system of public facilities and services; and to ensure the availability of safe and affordable childcare; and to encourage flood resilient communities. Berkshire zoning bylaws, subdivision regulations, and other land use ordinances are based on the information compiled and the goals expressed within the Municipal Plan. Berkshire Planning Commission members have spent many hours discussing and compiling this document and they would sincerely like to receive your feedback.

Pre
pare
d by
the
Ber
kshi
re P
lann
ing
Com
mis
sion
DRAFT March 2015
ACKNOWLEDGEMENTS
Cover photo: View North from Perley Road,
by George Lochtie
Other photo and art contributions:
Jere Levin
Heather McKeown
Arnold Byam
Loren Doe
Prepared by the Town of Berkshire with teachnical assistance from the Northwest
Regional Planning Commission

TABLE OF CONTENTS
0BTHE PLANNING PROCESS ............................................................................................................................ 1
9BA) PURPOSE ...................................................................................................................................................... 2 B) THE PLANNING PROCESS ................................................................................................................................ 2
1BA SNAPSHOT OF THE COMMUNITY ............................................................................................................. 4
11BA) PHYSICAL LOCATION AND BOUNDARIES ......................................................................................................... 5 1B) RELATIONSHIP TO THE NORTHWEST REGION ...................................................................................................... 5 1C) NOTABLE MOMENTS IN BERKSHIRE’S HISTORY ................................................................................................. 6
First Settlement .................................................................................................................................... 6 Introduction of Rail Service ............................................................................................................... 8 Farming and Manufacturing in the 1900’s ...................................................................................... 9
1D) COMMUNITY PROFILE .................................................................................................................................. 10 42BPopulation: Past Trends and Future Growth ................................................................................ 10 43BPopulation Age Groups ................................................................................................................... 13
2BTHE SENSE OF PLACE.................................................................................................................................. 15
15BA) NATURAL RESOURCES AND ENVIRONMENT .................................................................................................... 16 44BClimate .............................................................................................................................................. 16 45BGeology ............................................................................................................................................ 18 46BTopography ...................................................................................................................................... 22 Soils ..................................................................................................................................................... 24 48BWater Resources .............................................................................................................................. 29 49BCritical Areas .................................................................................................................................... 35
16BB) HISTORIC LEGACIES ..................................................................................................................................... 41 50BHistoric Districts and Structures ....................................................................................................... 41 51BArchaeological Sites and Sensitive Areas ..................................................................................... 42
17BC) LAND USE PATTERNS ................................................................................................................................... 43 52BAgricultural Land .............................................................................................................................. 44 Forest Land ........................................................................................................................................ 46 54BResidential Land ............................................................................................................................... 46 55BCommercial and Industrial Land.................................................................................................... 47 56BPublic and Semi-Public Land .......................................................................................................... 47
GOALS AND POLICIES: THE SENSE OF PLACE ..................................................................................................... 48
3BA PLACE FOR A HOME .............................................................................................................................. 52
1A) EXISTING HOUSING STOCK ........................................................................................................................... 53 B) HOUSING PROJECTIONS ............................................................................................................................... 54 C) HOUSING CONDITIONS ............................................................................................................................... 54 D) HOUSING COSTS AND AFFORDABILITY .......................................................................................................... 54 GOALS AND POLICIES: A PLACE FOR A HOME ................................................................................................... 58
EARNING A LIVING .................................................................................................................................... 59
A) BRINGING HOME THE PAYCHECK ................................................................................................................. 60 B) BUSINESS IN BERKSHIRE ................................................................................................................................. 60
Home Based Businesses ................................................................................................................... 61 Agriculture ......................................................................................................................................... 61 Manufacturing and Service Industries ........................................................................................... 62
C) INCOME AND WAGES ................................................................................................................................. 62 D) EDUCATION AND TRAINING .......................................................................................................................... 63 E) FUTURE ECONOMIC DEVELOPMENT .............................................................................................................. 63

GOALS AND POLICIES: EARNING A LIVING ........................................................................................................ 65
5BPROVIDING FOR THE PEOPLE .................................................................................................................... 66
A) MUNICIPAL GOVERNMENT .......................................................................................................................... 67 B) LIBRARY ....................................................................................................................................................... 67 C) EDUCATION ................................................................................................................................................ 70
The School System ............................................................................................................................ 70 Enrollment Trends and School Capacity ....................................................................................... 70 Childcare .......................................................................................................................................... 71
D) WATER SUPPLY ............................................................................................................................................ 72 E) WASTE WATER TREATMENT ........................................................................................................................... 73 F) SOLID WASTE DISPOSAL ............................................................................................................................... 73 G) EMERGENCY AND MEDICAL SERVICE ........................................................................................................... 74 H) RECREATION ............................................................................................................................................... 75
Trails and Other Recreation Opportunities .................................................................................... 76 I) TRANSPORTATION .......................................................................................................................................... 78
BIntroduction ...................................................................................................................................... 78 Condition of Roads and Bridges .................................................................................................... 78 Class 4 Roads .................................................................................................................................... 79 What Lies Ahead? ............................................................................................................................ 80 Rail Service ........................................................................................................................................ 80 Air and Bus Service ........................................................................................................................... 80 Carpooling and Park and Rides ..................................................................................................... 81 Pedestrian and Recreation Paths .................................................................................................. 81
J) ENERGY ....................................................................................................................................................... 83 Introduction ...................................................................................................................................... 83 Current Energy Use .......................................................................................................................... 83 Heat ................................................................................................................................................... 85 Renewable Energy Opportunities .................................................................................................. 86 Energy Efficiency and Conservation ............................................................................................. 87 Municipal Energy .............................................................................................................................. 87
GOALS AND POLICIES: PROVIDING FOR THE PEOPLE .......................................................................................... 90
“KEEPING IT RURAL” IN THE FUTURE .......................................................................................................... 93
A) SOURCE WATER PROTECTION DISTRICT ......................................................................................................... 95 B) RURAL LANDS DISTRICT ................................................................................................................................ 95 C) EXPANDED VILLAGE DISTRICT ...................................................................................................................... 97 D) FLOOD HAZARD AREA OVERLAY DISTRICT .................................................................................................... 97 GOALS AND POLICIES: KEEPING IT RURAL IN THE FUTURE ...................................................................................... 99
8BGETTING FROM HERE TO THERE ............................................................................................................... 100
40BA) THE CONTINUED PLANNING PROCESS ........................................................................................................ 101 75BPlan Coordination and Compatibility ......................................................................................... 101 75BCompatibility with the Regional Plan .......................................................................................... 103 BWork Program ................................................................................................................................. 103
41BB) WORK PROGRAM ..................................................................................................................................... 103 77BThe Continuing Planning Process: ................................................................................................ 103 78BPlan Implementation: .................................................................................................................... 103 79BSpecial Studies and Projects: ........................................................................................................ 104
0BAPPENDIX A. ONLINE PLANNING RESOURCES ...................................................................................... 106
0BAPPENDIX B. COMMUNITY SURVEY 2014 ............................................................................................... 110

DRAFT Berkshire Town Plan 2015
List of Tables 1
2
2.1 Notable Moments in Berkshire’s History 3
2.2 Populations of Surrounding Area 4
2.3 Population Change 5
3.1 Slope Categories 6
3.2 List of Water Quality Impairments 7
4.1 Housing Units 8
4.2 Household Income Distribution 9
4.3 Affordability Gap for Homeownership Costs 10
4.4 Affordability Gap for Rental Costs 11
5.1 Employment destinations for Residents 12
5.2 Percent of Individuals whose income in Past 12 Months 13
was below Poverty Level 14
6.1 Highway Mileage Summary 15
6.2 Average Daily Traffic Counts 16
6.3 Home Heating Fuel Type 17
18
19
List of Figures 20
21
2.1 Berkshire Population 22
2.2 Components of Berkshire Population Change 23
2.3 Population Trends and Projection 24
2.4 Population Pyramid 25
3.1 Soil Groups 26
3.2 Stream Channel Evolution 27
3.3 Potential Ground Water Recharge Areas 28
3.4 State Wetland Classification 29
4.1 Median Sale Price for Primary Residences 30
5.1 Number of Employers and Jobs 31
5.2 Median Adjusted Gross Income per Tax Return 32
6.1 Berkshire School Total Enrollment 33
6.2 VEC’s Energy Portfolio, 2014 34
6.3 Electric Utilities Average Rate per kWh, 2013 35
36
DRAFT Berkshire Town Plan 2015
List of Maps 1
2
3.1 Bedrock Geology 3
3.2 Surficial Geology 4
3.3 Sand and Gravel Potential 5
3.4 Topography 6
3.5 Steep Slopes 7
3.6 Major Soil Groups 8
3.7 Prime Agriculture Soils 9
3.8 Prime Forestry Soils 10
3.9 Watershed Map 11
3.10 Source Protection Areas 12
3.11 Wetlands and Flood Zones 13
3.12 Wildlife Areas 14
3.13 Conserved Land 15
6.1 Public Facilities and Utilities 16
6.2 Transportation 17
6.3 Electric Utilities 18
7.1 Proposed Land Use 19
20

DRAFT Berkshire Town Plan 2015 The Planning Process
DRAFT Berkshire Town Plan 2015 1
1
2
0BTHE PLANNING PROCESS 3
4
5
6
Town Plan Update Public Forum (Photo by NRPC) 7
8
9
10
DRAFT Berkshire Town Plan 2015 The Planning Process
DRAFT Berkshire Town Plan 2015 2
9BA) PURPOSE 1
2
The purpose of municipal planning is to provide a basis for local influence in 3
identifying and solving problems, meeting challenges and opportunities, and 4
achieving goals and objectives on behalf of the Town and its citizens. The 5
municipal plan provides the framework and the guidelines upon which to base 6
municipal action regarding the development of housing, industry, and services, 7
and for meeting virtually all community needs. The plan contains the vision of 8
what is considered vital and necessary to the residents of the community, as well 9
as the means for local government to influence the actions of those who look to 10
bring change to the community or its environment. It is planning's function to 11
attempt to direct and coordinate these actions to further the goals of the 12
community, so that all changes promote the general health, safety, and welfare 13
of residents. 14
15
16
B) THE PLANNING PROCESS 17
18
The Vermont Municipal and Regional Planning and Development Act (Title 24, 19
Chapter 117) authorizes municipalities to “undertake a comprehensive planning 20
program . . . and to prepare, maintain, and implement a plan within its 21
jurisdiction” (Section 4381). Accordingly, in 1987 the Selectboard of the Town of 22
Berkshire appointed the Berkshire Planning Commission to conduct studies and 23
prepare a comprehensive plan for the Town. 24
25
The first attempt to develop a plan for the community was in the early 1970s 26
when the Town adopted interim zoning for two years in recognition of the need 27
for planning. A municipal plan was completed in 1974, but failed to receive 28
voter approval. In 1981, the plan was reintroduced along with a proposed 29
zoning bylaw for the community, but both were defeated. The Town did adopt 30
a Flood Hazard Area Bylaw in 1983 so that Berkshire landowners would be able 31
to obtain flood insurance. This bylaw received voter approval in 1984 and is 32
currently in effect. The Selectboard also approved another year of interim 33
zoning in 1987 in order to give the new Planning Commission time to prepare the 34
municipal plan. The first municipal plan was finally adopted in August of 1989. 35
The Plan has since been revised in 2000, 2005, and now in 2010. The Zoning 36
Bylaws and Subdivision Regulations, including flood hazard regulations, were last 37
updated in 2007 as a unified development ordinance. 38
39
The plan itself should be a "living document” which is subject to revision at any 40
time, as needs dictate, and indeed it must be updated and readopted every 41
five years, in accordance with state law. The work of the Berkshire Planning 42
Commission and all other interested citizens will continue in the meantime, as 43

DRAFT Berkshire Town Plan 2015 The Planning Process
DRAFT Berkshire Town Plan 2015 3
they proceed with the implementation of the plan. This process may include: 1
2
the preparation of appropriate bylaws and programs designed to direct 3
the course of future growth and development (e.g., zoning and/or 4
subdivision regulations, an official map, a capital budget and 5
improvement program); 6
7
the review of development proposals for conformance with the town 8
plan; 9
10
preparation of future studies to identify and plan for specific problems or 11
situations that may arise; and 12
13
regular review and revision of the plan, bylaws, and programs to ensure 14
that they reflect changing conditions and needs. 15
16
Citizen participation is important at all levels of the planning process. 17
Opportunities for citizen involvement have been assured through community 18
surveys, public meetings, and occasional reports in the County Courier. 19
Commission members also consult neighboring town plans and occasionally 20
meet with planners from other communities in order to coordinate their planning 21
efforts. These efforts are intended to foster the broadest level of public 22
participation possible, and to utilize the planning process as a vehicle for 23
exercising an inclusive, community-wide vision for the future of Berkshire. 24
25

Berkshire Town Plan 2015 A Snapshot of the Community
DRAFT Berkshire Town Plan 2015 4
1
1BA SNAPSHOT OF THE COMMUNITY 2
3
4
5
6 7
Photo by Arnold Byam 8
9
10
11
12
13
14
15
16
17
18
19
20
21
22

Berkshire Town Plan 2015 A Snapshot of the Community
DRAFT Berkshire Town Plan 2015 5
11BA) PHYSICAL LOCATION AND BOUNDARIES 1
2
The Town is located in the northeast 3
corner of Franklin County, which is in 4
turn situated in northwestern Vermont. 5
Berkshire is bounded by the Province of 6
Quebec to the north, the Town of 7
Franklin to the west, the Town of 8
Richford to the east, and the Town of 9
Enosburgh and the incorporated 10
Village of Enosburg Falls to the south. 11
12
The Town of Berkshire covers more than 13
forty-three square miles of land (27,900 14
acres), and due to an error in 15
computation, was granted 2,000 acres 16
more than was normally granted to 17
Vermont towns at that time in history. 18
Berkshire is therefore larger, 19
geographically, than most towns in the 20
State. 21
22
1B) RELATIONSHIP TO THE 23
NORTHWEST REGION 24
25
Berkshire is predominantly a rural town 26
lying within the eastern sub-region of 27
the Northwest Region. It is recognized within the Regional Plan as one of the 28
most important agricultural towns in Franklin County. Under the Regional Plan, 29
most of the Town lies within designated "agricultural lands" and the remaining 30
land, considered unsuitable for farming, is included in a "conservation/forest 31
resource" category. The three hamlets of the community, West Berkshire, 32
Berkshire Center, and East Berkshire, are expected to remain the principal areas 33
of population within the Town. 34
35
The Town of Berkshire is located between two urban service areas, Richford 36
Village and Enosburg Falls. It is anticipated that the residents of Berkshire will 37
continue to rely upon these areas for services such as fire and police protection, 38
medical and educational facilities, and retail services. While, Berkshire is 39
experiencing the effects of the expansion of employment opportunities of 40
Burlington and St. Albans, northern Franklin County is not experiencing as much 41
growth as southern Franklin County. The neighboring municipalities of Enosburg 42
Falls and Richford provide expanded market opportunities for Berkshire. 43

Berkshire Town Plan 2015 A Snapshot of the Community
DRAFT Berkshire Town Plan 2015 6
The Missisquoi River furnishes the 1
Town and the Region with an 2
important natural asset. The 3
Regional Plan calls for protection 4
of the river and adjacent lands to 5
protect water quality and to 6
preserve its scenic character. The 7
Northern Forest Canoe Trail has 8
been established in Berkshire 9
along the Missisquoi River. 10
11
Within the Regional Plan, it is 12
expected that Berkshire will retain 13
its rural, agrarian character. 14
Continued economic health for the Town lies in the protection of its agricultural 15
resource base and maintaining a viable agricultural industry, principally dairy, 16
supplemented by tourism and other related land uses. It is also anticipated that 17
the Town will not be the site of significant urban-type development over the life 18
of the Regional Plan. Growth in the adjacent urban service areas; however, is 19
expected to increase the pressure for residential development on roads leading 20
into Berkshire from these centers. It is recommended within the Regional Plan 21
that most new residential growth occur in and between the communities of 22
West Berkshire and Berkshire Center, on soils suitable for on-site systems. 23
24
1C) NOTABLE MOMENTS IN BERKSHIRE’S HISTORY 25
First Settlement 26
The first "European" settlers arrived in Berkshire in 1791 and established farms in 27
the following years. Job L. Barber and Daniel Adams were the first individuals to 28
settle in Berkshire. However, possibly the most influential early settlers of Berkshire 29
were Stephen Royce, Sr. and his son. Stephen Royce, Sr. moved from Franklin, 30
Vermont to Berkshire and established a farm in 1792. Mr. Royce erected the first 31
frame house in Berkshire in 1799, which still stands today in East Berkshire. His son, 32
Stephen Royce, Jr., resided in this same house until his death in 1868. Stephen 33
Royce, Sr. was very active in promoting the organization of the Town of Berkshire 34
in 1794. He was the first representative to the State Assembly from Berkshire in 35
1796. His son Stephen Royce, Jr. served in the Vermont Supreme Court, the 36
United States circuit and district courts, and he was elected Governor of 37
Vermont in 1854. Following the arrival of these first settlers in 1792, additional 38
settlers moved to Berkshire for the opportunity to establish farms in an area 39
where the soil produced plentiful harvests. 40
41
42

Berkshire Town Plan 2015 A Snapshot of the Community
DRAFT Berkshire Town Plan 2015 7
8Table 2.1 Notable Moments in Berkshire’s History
1791 First European settlers arrived
1794 Organization of the Town of Berkshire
1864 Henry I. Stanley built a cheese factory in East Berkshire
1868 (April 29) East Berkshire fire
1872 Railroad between Richford and St. Albans was built
1942 Berkshire Fire Department Established
1969 New Berkshire Elementary School opens, last three remaining
school houses close.
2007 Town Hall renovations completed and historic building
reopens as municipal offices.
1
Berkshire in the 1800s was principally a farming community. By the mid-1800s, 2
most of the forests had been cleared away, and the Town had well over 150 3
dairy farms. The average dairy herd numbered between 20 and 30 head of 4
cattle. Many farmers were engaged in other agricultural activities as well, 5
including the making of cider and maple syrup, and cattle breeding. Frederick 6
W. Comings of East Berkshire kept 73 beehives in addition to his dairy. Philo S. 7
Ewins, a dairy farmer in West Berkshire, invented the Ewin’s improved sap 8
evaporator, and held an 1882 patent on his invention (he also patented a car 9
heater in 1882). 10
11
Berkshire also developed centers of commercial activity in the 1800s. East 12
Berkshire contained one hotel, three stores, two millinery shops, a horse-powered 13
churn factory, a carriage shop, two blacksmith's shops, an undertaker, and, by 14
the mid-1850’s about 150 inhabitants. The business district had to be rebuilt after 15
a destructive fire destroyed much of it on the evening of April 29, 1868. The fire, 16
which started in the attic of the hotel known as the "Brick House”, broke out at 17
about 5:00 p.m. Gale force wind spread the fire through wood structures on 18
both sides of the street, and before midnight, 36 buildings, including the Calvary 19
Episcopal Church, were reduced to ashes. Firefighting was hampered by a 20
scarce water supply due to a previous period of prolonged drought. 21
22
Henry I. Stanley’s cheese factory in East Berkshire, built in 1864, produced about 23
80,000 pounds of cheese per year. William Sampson and Company's horse-24
power and pump manufactory was established in East Berkshire 1873. The firm 25
produced about 15 horsepower and 350 churns per year, in addition to doing a 26
general repair business. W. H. H. Fenniman's carriage shop, established in 1878, 27
employed four men and turned out about forty carriages and sleighs per year, 28
and also had a general repair business. 29

Berkshire Town Plan 2015 A Snapshot of the Community
DRAFT Berkshire Town Plan 2015 8
1871 DeBeers Atlas Maps of East Berkshire and West Berkshire
The Village of West Berkshire in the mid-1
1800s contained one hotel, two stores, a 2
tannery, a sash, and blind manufactory, a 3
wheelwright and blacksmith shop, an 4
undertaking and cabinet shop, and about 5
one hundred inhabitants. The West Berkshire 6
flouring mill, owned by George A Jones, was 7
equipped with three "runs" of stones, and 8
did custom work. Collin Goddard's tannery 9
in West Berkshire produced over one 10
thousand hides per year. A. L. 11
Goddard's tannery, also located in 12
West Berkshire, employed three men. 13
L. A. Weld's sawmill in West Berkshire 14
was built in 1865. Approximately 15
25,000 feet of lumber were cut in the 16
mill each year. A cider mill was 17
connected to the sawmill, where 240 18
barrels of cider were produced 19
annually. 20
21
In the mid-1800’s, two stores, and a 22
blacksmith shop were located in the 23
small hamlet of Berkshire Center, 24
which had a population of about fifty 25
people. Farmers in Berkshire were 26
able to market their milk locally at 27
the cheese plant in East Berkshire 28
owned by Henry Stanley. The plant 29
was purchased by Guy Marcy in 30
1900, and was operated as a 31
creamery. 32
Introduction of Rail Service 33
Rail service in Berkshire dates back to the 1870s when an intersecting railroad 34
between St. Albans and Richford was built. The construction of this line was 35
started around 1872. 36
37
The completion of the rail link in the late 1870’s between St. Albans and Richford 38
was an extremely important development for people living in Berkshire. They 39
were then able to easily transport merchandise to markets south and west 40
through the rail center in St. Albans, and to points east and north through 41
Richford. 42

Berkshire Town Plan 2015 A Snapshot of the Community
DRAFT Berkshire Town Plan 2015 9
Train Depot, East Berkshire Photo Courtesy of Berkshire Historical Society
The Central Vermont 1
Railway offered freight 2
and passenger service 3
to the residents of 4
Berkshire in the late 5
1800s, and these 6
services continued 7
through the First World 8
War and into the 1920s 9
and 1930s. The Central 10
Vermont schedule in 11
1919 included two 12
passenger train stops 13
daily in East Berkshire, 14
and one freight stop. 15
Local merchants 16
shipped butter on 17
Mondays, and cattle on 18
Fridays. They also 19
shipped cream, and received shipments of coal and other commodities by rail. 20
Local students were able to take the train to school in Richford in the morning, 21
and return in the evening. The local train station also offered telegraph services. 22
23
The railroad maintained two rail sidings in Berkshire, one in the village of East 24
Berkshire adjacent to the train station, and one west of the village along Route 25
105. Trains were fired by coal-powered steam engines until the 1950’s, when 26
diesel engines began to be used more extensively. After a derailment 27
damaged a bridge over the Missisquoi River at Sheldon Junction in 1984, limited 28
operations continued until both sections were abandoned in early 1990s. The 29
rail line through Berkshire is now rail banked and has been converted to the 30
Missisquoi Valley Rail Trail. 31
Farming and Manufacturing in the 1900’s 32
Many of the manufacturing concerns that were established in Berkshire in the 33
1800’s continued to prosper through the first half of the 1900s; however, very few 34
new businesses were created and most were closed as the railroad declined. 35
The Samson Power and Thresher Company stayed in business into the 1940s 36
making wagons, tables, cupboards, and various other wood products, including 37
sleds, cow stanchions, wheel barrows, and other farm equipment. Gasoline 38
engines replaced horsepower, which had been manufactured at Sampson 39
Power. The company marketed Majestic Gasoline Engines, a very popular 40
make of gasoline engine, during the 1920s, 1930s, and 1940s. 41
42
Berkshire supported two creameries in the 1900’s, both located in East Berkshire: 43
Berkshire Town Plan 2015 A Snapshot of the Community
DRAFT Berkshire Town Plan 2015 10
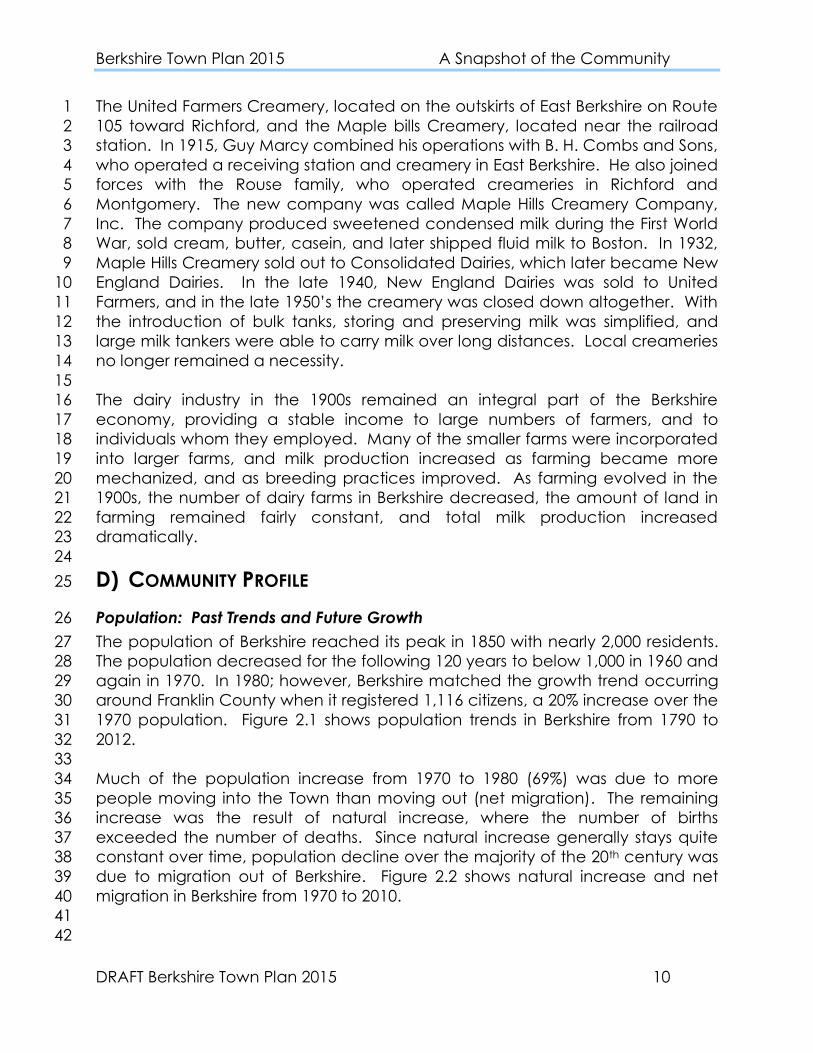
The United Farmers Creamery, located on the outskirts of East Berkshire on Route 1
105 toward Richford, and the Maple bills Creamery, located near the railroad 2
station. In 1915, Guy Marcy combined his operations with B. H. Combs and Sons, 3
who operated a receiving station and creamery in East Berkshire. He also joined 4
forces with the Rouse family, who operated creameries in Richford and 5
Montgomery. The new company was called Maple Hills Creamery Company, 6
Inc. The company produced sweetened condensed milk during the First World 7
War, sold cream, butter, casein, and later shipped fluid milk to Boston. In 1932, 8
Maple Hills Creamery sold out to Consolidated Dairies, which later became New 9
England Dairies. In the late 1940, New England Dairies was sold to United 10
Farmers, and in the late 1950’s the creamery was closed down altogether. With 11
the introduction of bulk tanks, storing and preserving milk was simplified, and 12
large milk tankers were able to carry milk over long distances. Local creameries 13
no longer remained a necessity. 14
15
The dairy industry in the 1900s remained an integral part of the Berkshire 16
economy, providing a stable income to large numbers of farmers, and to 17
individuals whom they employed. Many of the smaller farms were incorporated 18
into larger farms, and milk production increased as farming became more 19
mechanized, and as breeding practices improved. As farming evolved in the 20
1900s, the number of dairy farms in Berkshire decreased, the amount of land in 21
farming remained fairly constant, and total milk production increased 22
dramatically. 23
24
1D) COMMUNITY PROFILE 25
42BPopulation: Past Trends and Future Growth 26
The population of Berkshire reached its peak in 1850 with nearly 2,000 residents. 27
The population decreased for the following 120 years to below 1,000 in 1960 and 28
again in 1970. In 1980; however, Berkshire matched the growth trend occurring 29
around Franklin County when it registered 1,116 citizens, a 20% increase over the 30
1970 population. Figure 2.1 shows population trends in Berkshire from 1790 to 31
2012. 32
33
Much of the population increase from 1970 to 1980 (69%) was due to more 34
people moving into the Town than moving out (net migration). The remaining 35
increase was the result of natural increase, where the number of births 36
exceeded the number of deaths. Since natural increase generally stays quite 37
constant over time, population decline over the majority of the 20th century was 38
due to migration out of Berkshire. Figure 2.2 shows natural increase and net 39
migration in Berkshire from 1970 to 2010. 40
41
42

Berkshire Town Plan 2015 A Snapshot of the Community
DRAFT Berkshire Town Plan 2015 11
1 2
The Town’s population 3
reached 1,692 in 2010. 4
From 1980 to 1990, 5
Berkshire experienced 6
moderate growth 7
compared to the County 8
and adjacent towns. The 9
following decade, 10
Berkshire’s population 11
grew at a greater rate 12
than the County and 13
several adjacent towns at 14
over 16 %. Just under half 15
of the increase was due to 16
in-migration. From 2000 to 17
2010 the population 18
increased by 304 people, 19
over 60% of this growth is attributed to in-migration. 20
21
More recently, population estimates from the 2010 U.S. Census show that 22
Berkshire is among the fastest growing towns in Franklin County, with a 21.9% 23
increase in population from 2000 to 2010. Table 2.2 and 2.3 below show 24
population and population change from 1980 to 2010 for Berkshire and 25
surrounding communities. 26
27
28
Data Source: U.S. Census Decennial
Figure 2.2
Figure 2.1

Berkshire Town Plan 2015 A Snapshot of the Community
DRAFT Berkshire Town Plan 2015 12
1
81BTable 2.2 Population of the Surrounding Area
1980 1990 2000 2010
Berkshire 1,116 1,190 1,388 1,692
Enosburgh Town
and Village 2,070 2,535 2,778 2,781
Franklin 1,006 1,068 1,268 1,405
Montgomery 681 823 992 1,201
Richford 2,206 2,178 2,321 2,308
Sheldon 1,618 1,748 1,990 2,190
Franklin County 34,788 39,980 45,417 47,746
Data Source: U.S. Census Decennial
2
82BTable 2.3 Population Change (%)
1980-1990 1990-2000 2000-2010
Berkshire 6.63 16.64 21.9
Enosburgh Town
and Village -1.27 6.57
0.1
Franklin 14.92 13.60 10.8
Montgomery 20.85 20.53 21.1
Richford 6.16 18.73 -0.6
Sheldon 8.03 13.84 10.1
Franklin County 14.92 13.60 5.1
Data Source: U.S. Census Decennial
3
It is difficult to make accurate population projections for small population bases, 4
but they nonetheless are useful planning tools. Population projections are 5
based on past trends in birth, deaths and migration so they provide good 6
estimates of future conditions. The Vermont Agency of Commerce and 7
Community Development produced a report calculating projections based on 8
past trends from the 1990-2000 (“high”) time period and 2000-2010 (“low”). 9
Figure 2.3 shows the actual population of Berkshire from 1970 to 2010 and two 10
scenarios of the population change over the next 20 years. Based on these 11
projections, Berkshire could potentially experience continued growth of 11-17% 12
by 2020 with growth slowing to 8-13% by 2030. 13
14
15
16
17

Berkshire Town Plan 2015 A Snapshot of the Community
DRAFT Berkshire Town Plan 2015 13
1
2
3
4 5
43BPopulation Age Groups 6
Age distribution trends can be useful in predicting future service needs, 7
especially for school capacity and senior services. The 2000 Census reports that 8
the median age in Berkshire is 36.1 years old, which is about the same as the 9
median for Franklin County and 1.6 year younger than the state of Vermont. As 10
of 2010, the median age rose to 38.3 however Berkshire is still younger than the 11
2010 state median of 41.5 years old. 12
13
The distribution of age groups in Berkshire is very similar to that of Franklin County, 14
with the largest age group in the range of 45 to 54 years old. As the middle-15
aged population approaches retirement age, demand for senior services such 16
as housing options and rural transit will likely increase. The 25 to 44 year old 17
population is smaller in proportion. In combination with the trend of decreasing 18
family and household size, this is resulting in static school enrollment (see Section 19
VI). A breakdown by age category in Berkshire is shown in Figure 2.4. 20
21
22
23
24
931 1,116
1,190 1,388
1,692 1,882
2,040
1,978
2,233
0
500
1000
1500
2000
2500
1970 1980 1990 2000 2010 2020 2030
Po
pu
lati
on
Year
Population Trends and Projections (1970 - 2030)
Data Source: U.S. Census; Vermont Agency of Commerce and Community
Development. Vermont Population Projections 2010-2030 Report, released August 2013.
Figure 2.3

Berkshire Town Plan 2015 A Snapshot of the Community
DRAFT Berkshire Town Plan 2015 14
Figure 2.4 1
2
3 4
5
20 15 10 5 0 5 10 15 20 25
Under 10
10 to 17
18 to 24
25 to 34
35 to 44
45 to 54
55 to 64
65 to 74
75+
Females (%) Males (%)
Ag
e G
rou
p
Berkshire Population Pyramid
Data Source: U.S. Census Decennial

Berkshire Town Plan 2015 The Sense of Place
DRAFT Berkshire Town Plan 2015 15
1
2BTHE SENSE OF PLACE 2
3
Photo by NRPC 4
5
6
Berkshire Town Plan 2015 The Sense of Place
DRAFT Berkshire Town Plan 2015 16
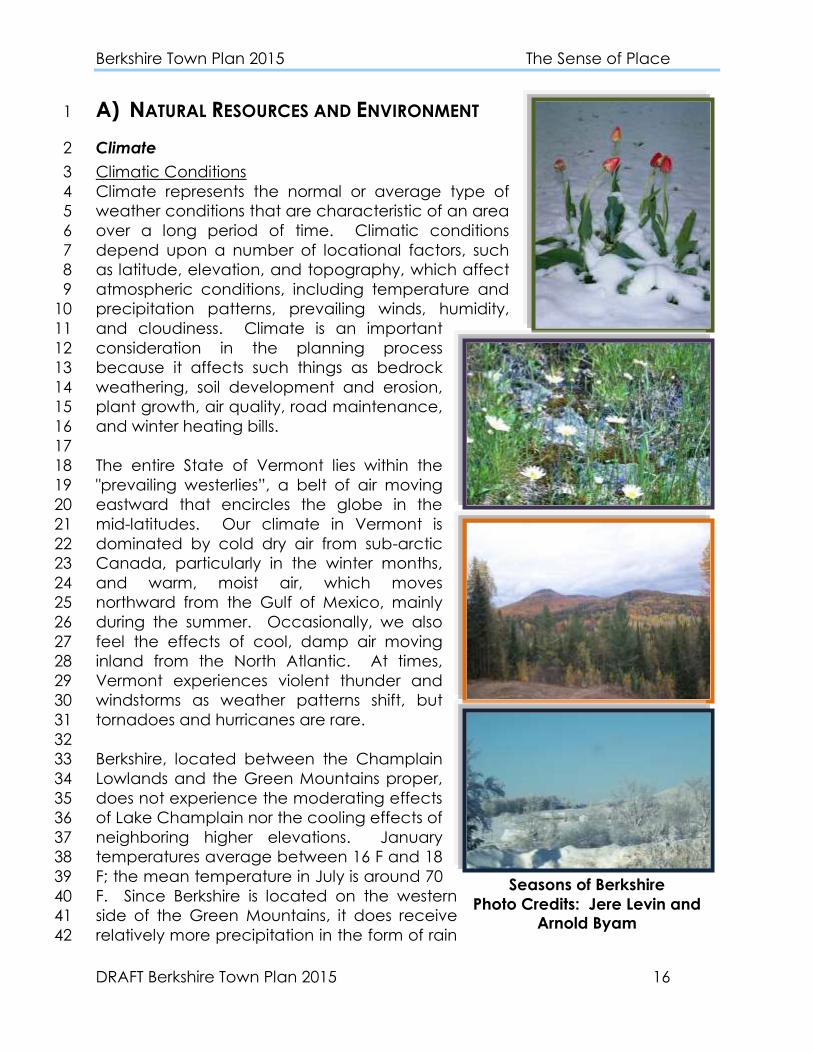
Seasons of Berkshire
Photo Credits: Jere Levin and Arnold Byam
15BA) NATURAL RESOURCES AND ENVIRONMENT 1
44BClimate 2
Climatic Conditions 3
Climate represents the normal or average type of 4
weather conditions that are characteristic of an area 5
over a long period of time. Climatic conditions 6
depend upon a number of locational factors, such 7
as latitude, elevation, and topography, which affect 8
atmospheric conditions, including temperature and 9
precipitation patterns, prevailing winds, humidity, 10
and cloudiness. Climate is an important 11
consideration in the planning process 12
because it affects such things as bedrock 13
weathering, soil development and erosion, 14
plant growth, air quality, road maintenance, 15
and winter heating bills. 16
17
The entire State of Vermont lies within the 18
"prevailing westerlies”, a belt of air moving 19
eastward that encircles the globe in the 20
mid-latitudes. Our climate in Vermont is 21
dominated by cold dry air from sub-arctic 22
Canada, particularly in the winter months, 23
and warm, moist air, which moves 24
northward from the Gulf of Mexico, mainly 25
during the summer. Occasionally, we also 26
feel the effects of cool, damp air moving 27
inland from the North Atlantic. At times, 28
Vermont experiences violent thunder and 29
windstorms as weather patterns shift, but 30
tornadoes and hurricanes are rare. 31
32
Berkshire, located between the Champlain 33
Lowlands and the Green Mountains proper, 34
does not experience the moderating effects 35
of Lake Champlain nor the cooling effects of 36
neighboring higher elevations. January 37
temperatures average between 16 F and 18 38
F; the mean temperature in July is around 70 39
F. Since Berkshire is located on the western 40
side of the Green Mountains, it does receive 41
relatively more precipitation in the form of rain 42
Berkshire Town Plan 2015 The Sense of Place
DRAFT Berkshire Town Plan 2015 17
and snow, than areas in the islands and on the lake plain. 1
2
Due to its latitude and location in the foothills of the Green Mountains, Berkshire 3
has a relatively short growing season, averaging less than 120 days between the 4
killing frosts of spring and autumn. This limits the types of crops that can be 5
produced. Cool weather crops, such as hay, wheat, rye, oats, and some root 6
crops, are particularly well suited to these growing conditions. Hybrids of warm-7
weather crops such as corn have also been developed for this climate, but 8
generally do better elsewhere. Rainfall is adequate for most type crops, though 9
some irrigation is used on very droughty soils. 10
11
The climate of Berkshire is pleasant, particularly in the summer months. Buildings, 12
however, must be built with sufficient insulation, and efficient heating systems to 13
stave off the cold of winter. The freeze and thaw cycle that makes the maple 14
sap run also buckles poorly drained pavement and roads. Spring thaws and 15
rains bring flooding and the muck of "mud season" that makes many dirt roads 16
and driveways impassable. The adversities associated with living in a northern 17
Vermont climate can be lessened by the proper planning, siting, and 18
construction of new development; and the benefits are many, clean air, warm 19
summers, white winters, and year-round outdoor recreational opportunities. 20
21
A Changing Climate 22
Over the past decade, international scientific consensus has acknowledged 23
that the climate is changing. The effects of climate will be felt internationally 24
and in a number of ways. It can be anticipated however that Berkshire and 25
Vermont in general will see different weather patterns than what has been 26
historically experienced. This can have an effect on several industries such as 27
tourism, especially for skiing and agriculture, particularly sugaring. In addition, 28
important natural resources may be affected by changes in the climate. 29
30
Air Quality 31
Weather patterns, and wind direction in particular, are important in the 32
discussion of air quality. Prevailing winds are generally from the west, but may 33
vary in direction and intensity at a particular site from season to season, day to 34
day, and hour to hour. Wind, along with other atmospheric conditions, should 35
be considered in siting any industry that produces airborne emissions. Such 36
emissions, including pollutants, smoke, and noxious odors, may be harmful to 37
human health and the environment in high enough concentrations. It is 38
therefore important for local officials to consider the requirements of maintaining 39
clean air in conjunction with the need for economic development. 40
41
Presently no potentially air-polluting industries are located in Berkshire. The 42
cumulative impact of minor sources-- including automobile emissions and some 43
agricultural practices-- may have a greater impact on local air quality in the 44

Berkshire Town Plan 2015 The Sense of Place
DRAFT Berkshire Town Plan 2015 18
Map 3.1
future. 1
45BGeology 2
Bedrock Geology 3
Geologic events have directly affected Berkshire's topography, soils, and 4
drainage patterns, which in turn have influenced the patterns of local 5
community and economic development. Berkshire lies amid the western 6
foothills of the Green Mountains, between the Champlain Lowlands (lake plain 7
and islands) to the west and the Green Mountain anticlinorium (Green 8
Mountains proper) to the 9
east. This area is underlain 10
by rocks formed from 11
sediments and volcanic 12
material deposited some 13
600 million years ago 14
(Cambrian period), which 15
were then changed and 16
hardened 17
(metamorphosed) by the 18
heat and pressure of 19
mountain building. Two 20
bedrock formations 21
predominate: the older 22
Pinnacle Formation, 23
underlying most of 24
Berkshire, and the younger 25
Underhill formation, found 26
in northwest and southeast 27
corners of Town. A small 28
area where the Missisquoi 29
River crosses the border 30
into Richford is underlain 31
by the Sweetsburg 32
Formation, a layer of black 33
slate with thin, whitish 34
banding. 35
36
The Pinnacle Formation includes two bedrock members. One was formed from 37
water deposited sands that were changed into a coarse sandstone 38
interbedded with metamorphosed clay sediments, and includes such minerals 39
as quartz, sericite, and chlorite (shown as slate, graywacke, and conglomerate 40
in dark grey on Map 3.1). The other, known as Tibbit Hill volcanics, underlies most 41
of Berkshire, and consists of metamorphosed volcanic rock interbedded with the 42
Berkshire Town Plan 2015 The Sense of Place
DRAFT Berkshire Town Plan 2015 19
Map 3.2
Figure 2.3
Source: U.S.
greywacke (shown as metasedimentary rocks; mafic igneous rocks, and their 1
metamorphic equivalents; minor carbonate in light grey on Map 3.1). Minerals 2
associated with the volcanics include albite, epidote, and chlorite. Copper, 3
once mined in Berkshire, is also found with the volcanics. Lava flows and 4
structures associated with this member are visible in outcrops near Ayers Hill. 5
6
The Underhill Formation, marked from the Pinnacle Formation beneath it by a 7
layer of dolomite and slate, consists mainly of interbedded phyllites and schists. 8
Interbeds of slate and greenstone are found in the southeast and small beds of 9
dolomite and marble outcrop in the northwest. The Pinnacle Formation is shown 10
as politic schist, phyllite, gneiss, and granofels in brown on Map 3.1. 11
12
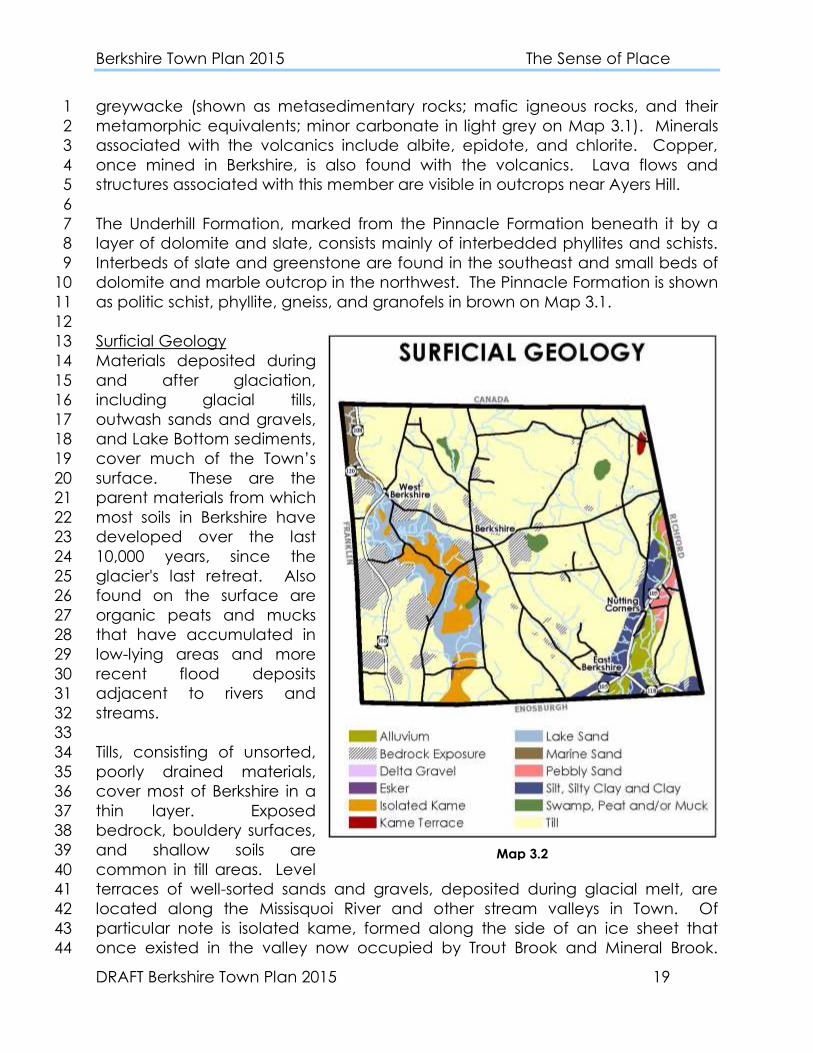
Surficial Geology 13
Materials deposited during 14
and after glaciation, 15
including glacial tills, 16
outwash sands and gravels, 17
and Lake Bottom sediments, 18
cover much of the Town’s 19
surface. These are the 20
parent materials from which 21
most soils in Berkshire have 22
developed over the last 23
10,000 years, since the 24
glacier's last retreat. Also 25
found on the surface are 26
organic peats and mucks 27
that have accumulated in 28
low-lying areas and more 29
recent flood deposits 30
adjacent to rivers and 31
streams. 32
33
Tills, consisting of unsorted, 34
poorly drained materials, 35
cover most of Berkshire in a 36
thin layer. Exposed 37
bedrock, bouldery surfaces, 38
and shallow soils are 39
common in till areas. Level 40
terraces of well-sorted sands and gravels, deposited during glacial melt, are 41
located along the Missisquoi River and other stream valleys in Town. Of 42
particular note is isolated kame, formed along the side of an ice sheet that 43
once existed in the valley now occupied by Trout Brook and Mineral Brook. 44

Berkshire Town Plan 2015 The Sense of Place
DRAFT Berkshire Town Plan 2015 20
These kame deposits are often good sources of sand, gravel, and ground water 1
and provide a well-drained, level surface on which to build. As such, they 2
represent an important resource to the Town that may be subject to competing 3
and not always compatible uses. Lake bottom silts and clays, deposited in the 4
valley occupied by the Missisquoi River, are poorly drained and unsuited for 5
most types of development, as are most flood and organic deposits. Map 3.2 6
shows surficial geology materials in Berkshire. 7
8
Earth Resources 9
A number of minerals and metals are associated with the metamorphosed 10
volcanic bedrock that underlies much of Berkshire. Copper was once mined in 11
Town, but the operation proved to be uneconomical. Mineral collection areas 12
exist at outcrops, but minerals are not likely to be present in commercial 13
quantities. 14
15
Sand and gravel deposits, 16
however, are present in 17
economically viable 18
amounts, and extraction 19
operations have been 20
on-going (Map 3.3). The 21
Town currently owns and 22
operates its own gravel 23
pit on Mineral Brook 24
Road. There is increasing 25
demand for sand and 26
gravel for use in 27
construction and road 28
maintenance, and 29
deposits are in limited 30
supply. These deposits 31
are a valuable resource 32
for the community that 33
should be protected until 34
needed and developed 35
for the benefit of local 36
residents. An inventory of 37
commercially viable 38
deposits should be undertaken in the future in order to determine their quality 39
and extent. 40
41
The environmental and social impacts of extraction operations also need to be 42
considered in their development. These include the elimination of ground water 43
recharge areas and ground water contamination; the alteration of surface 44
Map 3.3

Berkshire Town Plan 2015 The Sense of Place
DRAFT Berkshire Town Plan 2015 21
drainage patterns, soil erosion, and stream sedimentation; the possible 1
destruction of environmentally and archaeologically sensitive areas; noise, dust, 2
and increased amounts of heavy traffic; the diminished scenic quality of the 3
landscape, and limited utility for subsequent uses of a site; and reduced 4
property values. Many of these adverse impacts can be minimized through 5
appropriate site planning and development, erosion control, the phasing of 6
operations, and proper site reclamation. 7
8
Significant Geologic Sites 9
Three areas of particular geologic significance for their educational and 10
scientific value have been identified in Berkshire and are included in the 11
Vermont Natural Areas Inventory completed in the 1970s: Ayers Hill, the Berkshire 12
Kettle Hole, and the Berkshire Copper Mine. These are discussed in more detail 13
in the Critical Areas section. 14
15
16
17
18
19
20
21
22
23
24
25
26
27
28
29
30
31
32
33
34
35
36
37
Map 3.4 38

Berkshire Town Plan 2015 The Sense of Place
DRAFT Berkshire Town Plan 2015 22
46BTopography 1
Because topography provides natural barriers to movement and often 2
influences the accessibility and use of land, topographic information is 3
important in planning for land use, transportation routes, and the location of 4
public services and facilities. A general observation regarding past 5
development is that “grade follows grade.” In other words, graded land uses 6
such as transportation routes, just as water, follow paths of least resistance. It is 7
no coincidence that roads and railways often follow stream and river valleys. 8
9
Elevation 10
Elevations in Berkshire range from around 415 feet above mean sea level (m.s.l.) 11
along the Missisquoi River southwest of East Berkshire, to 1,326 feet atop Ayers Hill 12
near the northern border (Map 3.4). Most development in the Town is located 13
between 450 feet and 750 feet. Areas of high elevation, including ridge and hill 14
tops, are often visible and contribute much to the scenic beauty of the area. 15
The hills in north central Berkshire, including Ayers Hill, have also been identified 16
as probable 17
bedrock aquifer 18
recharge areas. 19
Consequently, ridge 20
and hill tops, and 21
areas over 800 feet 22
in elevation, should 23
be protected from 24
unsightly and 25
potentially harmful 26
development. 27
28
Slope 29
One of the most 30
important factors 31
controlling the 32
potential use of a 33
given parcel of land 34
is slope. Slope is the 35
inclination, or 36
change in 37
elevation, of land 38
over a horizontal 39
distance, and is 40
often expressed as 41
a percentage 42
(number of feet of 43 Map 3.5

Berkshire Town Plan 2015 The Sense of Place
DRAFT Berkshire Town Plan 2015 23
vertical rise over 100 feet of horizontal distance). Slopes are an important 1
consideration not only because of the environmental constraints that they 2
impose with regard to drainage and bearing capacity, but also because of the 3
environmental damage that may result from their alteration. Major causes of 4
slope destabilization include vegetation removal and undercutting slope banks. 5
Slope destabilization can result in accelerated runoff and soil loss, septic system 6
failure, and in the extreme, landslides and building collapse. 7
8
Land that is nearly level is generally more productive for farming, and is also 9
more easily and inexpensively developed for industrial, commercial, and large 10
scale residential uses. Steeply sloping land is usually best used for timber 11
production, which minimizes the potential for erosion and provides wildlife 12
habitat, recreation, and open space. These types of uses are not incompatible, 13
but steep terrain with multiple uses requires careful land management and 14
appropriate land use controls. Steep slopes over 15%, 20%, and 25% are shown 15
in Map 3.5, while general recommendations for the appropriate use of land with 16
regard to slope are given in Table 3.1. 17
18
83BTable 3.1: Slope Categories
Average
Slope Uses/Restrictions
0 – 3%
(SCS: “A”)
Suitable for most types of agriculture and constructions, including
higher density residential, commercial, and industrial development.
Since land is nearly level, drainage may be a problem.
3 – 8%
(SCS: “B”)
Suitable for many types of agriculture, single-family homes on
larger lots, as well as low-density multi-family housing, minor roads,
and smaller commercial and industrial buildings. These slopes have
a minimum of restrictions.
8 – 15%
(SCS: “C”)
Suitable for limited types of agriculture, single family homes on
large lots, as well as low density multi-family housing, timber
production, and recreational/open space uses. Where necessary,
terracing, retention ponds, retaining walls, and other engineering
techniques may be needed to prevent runoff and erosion.
15 – 25%
(SCS: “D”)
Suitable for timber production, limited residential, recreational, and
open space uses. Construction becomes very costly on these
slopes, rapid runoff and erosion problems are likely. These slopes
are unsuitable for most types of on-site septic systems.
Over 25%
(SCS: “E”)
All construction should be avoided on these slopes because of
high costs and the likelihood of damage to the environment.
Vegetation removal and construction could lead to widespread
slope failure.
19
20 21

Berkshire Town Plan 2015 The Sense of Place
DRAFT Berkshire Town Plan 2015 24
Soils 1
Soil is perhaps the most important physical factor governing the use of the land. 2
Most soils in Berkshire, having developed from materials deposited during 3
glaciation, represent a 10,000 year investment that has resulted in a very 4
valuable and limited resource. 5
6
In the context of land use 7
planning, four soil 8
characteristics are of 9
particular concern: 10
bearing capacity, 11
erodability and stability, 12
drainage, and resource 13
value (for agriculture, 14
forestry, building material, 15
etc.). These 16
characteristics are 17
generally dependent on 18
particle size (sand, silt, 19
and clay) and water 20
content. Poorly drained, 21
fine-grained (clay) soils 22
have the greatest 23
limitations for most types 24
of land use, in particular, 25
anything requiring the 26
installation of an on-site 27
septic system. In contrast, 28
coarse-grained, well-29
drained sandy soils, 30
though often unattractive 31
for agriculture, are 32
generally suited for 33
residential, commercial, 34
industrial, and related uses. 35
36
Soils are classified on the basis of their structure, form, composition, and 37
suitability for various types of development. The latest soil survey in Franklin 38
County was completed by the Natural Resource Conservation Service in 1998. 39
Major soil groups from this survey are shown in Map 3.6 and listed in Figure 3.1. 40
The information in Figure 3.1 is intended for planning purposes only; more 41
detailed information regarding particular soil types is available in the Soil Survey, 42
which should be consulted for specific site analyses. 43
Map 3.6

Berkshire Town Plan 2015 The Sense of Place
DRAFT Berkshire Town Plan 2015 25
1
2
Figure 3.1
Soil Groups
Limerick (Le)- Rumney Variant (Ru)- Winooski (Wt)
These soils are found along the Missisquoi River and the Trout River in the
vicinity of East Berkshire, and along the Pike River south of West Berkshire.
They formed recent flood plain deposits, and tend to be moderately well-
drained to poorly drained loamy soils.
Limitations are severe for building of any kind on these soils and septic
systems, due to seasonal flooding and wetness. The depth to bedrock is
generally 5 feet or more, however the depth to the seasonal high water table
varies from zero to 3 feet. Winooski soils are considered prime agricultural
soils; Limerick and Rumney soils are also primary agricultural soils of statewide
importance. None of these soils are considered a good source of roadfill,
sand, gravel, or topsoil.
Au Gres (AuA)- Enosburg (EnA-B)- Wareham (Wh)
These soils are found in only one location in Berkshire, along the west side of
the Missisquoi River where it intersects with Route 105 north of East Berkshire.
The soils of this group formed on terraces and old lake plains from materials
deposited by glacial melt water, and are generally somewhat poorly drained
to poorly drained, level or gently sloping, fine sandy loams.
Limitations are severe for septic systems and building of any kind, again due
to wetness. Flooding does not occur; however, the depth to the seasonal
high water table is only 0 to 1.5 feet. Depth to bedrock is generally 5 feet or
more. Enosburg soils are considered prime agricultural soils; Au Gres soils are
also primary agricultural soils of importance to the state. Au Ores soils are a
good source of sand, and Wareham soils are a fair source. None of these
soils provide a source of roadfill, gravel, or topsoil.
Munson (MuB-C)- Buxton (BxC-E)- Belgrade (BeB-C)
These soils are found in several locations: between Route 108 and Trout Brook
north of Enosburg Falls, north of the Missisquoi River in the vicinity of East
Berkshire and Samsonville, west of Route 108 near the Canadian border, and

Berkshire Town Plan 2015 The Sense of Place
DRAFT Berkshire Town Plan 2015 26
1
west of Route-105 where it enters the Town of Richford. These soils also
formed from Mater-deposited materials on old terraces and lake plains. They
are gently sloping to steep, somewhat poorly drained to moderately well-
drained, silty and clayey soils.
Limitations for building are severe due to seasonal wetness, frost action, slope,
and low bearing capacity. Depth to bedrock is 5 feet or more; depth to the
seasonal high water table averages between 0.5 and 3.5 feet. BeB is
considered a prime agricultural soil, and BeC, BxC, MuB, and MuC are consi-
dered primary soils of statewide importance. BeB is also considered a good
source for topsoil, while BeC, BxC, and MuC are fair sources of topsoil,
otherwise, these soils are not suited for topsoil, roadfill, sand, or gravel.
Scantic (ScA-B}- Raynham (RaB)- Binghamville (Bg)
The soils of this group are found in two small areas in Berkshire: near the
northwest corner of the Town, and at the southern boundary near North
Enosburg. These soils also formed from water deposited material in depres-
sions or on old lake plains. They are level to gently sloping, poorly drained silt
and clay soils.
Limitations are severe for building and on-site sewage disposal due to
wetness, frost action, and low strength. Depth to bedrock is generally 5 feet
or more and depth to the seasonal high water table varies from 0 to 2 feet.
RaB and Bg are considered prime agricultural soils, and ScA and ScB are
considered primary agricultural soils of statewide importance. None of these
soils are suitable for roadfill, topsoil, sand, or gravel.
Windsor (WsA-E)- Missisqoui (MsA-E)
Windsor and Missisquoi soils are found in a swath of land extending from the
Berkshire-Franklin boundary near West Berkshire to the Enosburg line south of
the Enosburg Town Forest. They are also found in an area northeast of the
Missisquoi River where it crosses Route 105, in a small area northwest of this,
and south of Route 118 in East Berkshire. These are nearly level to very steep,
excessively drained sandy soils that also formed from water deposited
material on old glacial terraces and lake plains.
These soils are particularly suited for development, limitations are slight for
building and septic tank absorption fields in areas having slopes of 0 to 8 %
(slope categories A and B) and moderate in areas of 8 to 15 % slope

Berkshire Town Plan 2015 The Sense of Place
DRAFT Berkshire Town Plan 2015 27
1 2
Primary Agricultural Soils 3
Primary agricultural soils, as defined by Vermont's Land Use and Development 4
Law (Act 250), include soils which, based upon their chemical and physical 5
properties, are considered especially suited for agricultural use. These are 6
subdivided into “prime” soils having a very high potential and few limitations for 7
producing food, feed, forage or fiber crops; and “good” soils of statewide 8
importance that have good potential, but one or more limitations that may 9
restrict the choice of crops and require more careful management. The 10
Vermont Agency of Agriculture also recognized “local” soils with agricultural 11
potential, but which are not regulated under Act 250. Prime, statewide, and 12
local agricultural soils are shown in Map 3.7. 13
14
In the rolling hills and mountains of northwestern Vermont, primary agricultural 15
soils, and “prime” soils in particular, are a very limited and valuable resource. 16
Agriculture depends upon the availability of high quality land, in large enough 17
acreages (a “critical land mass”), to make crop production economical. 18
However, many of the best agricultural soils, because of their physical 19
properties, are also attractive for more urban-type development, such as the 20
subdivision of land for the construction of roads, houses, businesses, and industry. 21
(category C). Development limitations increase as slope increases due to
ground water seepage and greater slope instability. Depth to bedrock is 5
feet or more, and depth to the seasonal high water table is 6 feet or more.
Windsor and Missisquoi soils (A and B) tend to be droughty, but are considered
primary agricultural soils of statewide importance. Windsor soils, where slope
permits, are good sources of roadfill and sand, but are unsuitable for gravel
and topsoil. Missisquoi soils, also depending upon slope, are suitable for
roadfill, sand, and gravel, but unsuitable for topsoil. Because water infiltrates
easily, Windsor and Missisquoi soils often overlie sand and gravel aquifers.
Woodstock (WxC-E)- Tunbridge (TwB-D)- Rock Outcrop (RoE)
These soils are found in two areas: the north central section of Berkshire, and in
the southeast corner of Town. The soils in this group formed from till deposits on
hills and bedrock ridges and consist of shallow, excessively or well drained,
loamy soils interspersed among rock outcrop. Slope conditions vary greatly.
Limitations for building and sewage disposal are generally severe due to slope
conditions and shallow soil depth, however only moderate limitations exist on
Tunbridge soils (B and C) for dwellings and small buildings without basements,
and road construction. Depth to bedrock averages 10 to 40 inches; depth to
the seasonal high water table is 6 feet or more. These are not considered
primary agricultural soils, though Tunbridge soils are considered a good to fair
source of topsoil, depending upon slope. These soils are unsuitable for roadfill,
sand, or gravel.
Peru (PeB-D, PrC-D)- Stowe (StB-D SwC-D)
These are the most common and widespread soils in the Town of Berkshire,
formed from till deposits on the upland slopes of hills and mountains. These
areas are gently to steeply sloping, and are underlain by a silty, cemented
subsurface layer, called a fragipan, which tends to impede drainage.
Limitations for building on Stowe soils are moderate to severe, depending
upon slope, due to wetness, frost action, and the presence of large stones and
rocks. The Stowe and Peru soils all have severe limitations for septic tank
absorption fields. StB soils have slight limitations for an area sanitary landfill,
and, along with StC and StD soils, moderate limitations for a trench landfill.
Depth to bedrock is 5 feet or more and depth to the seasonal high water table
is 1 to 3 feet. The more gently sloping Peru and Stowe soils (PeE and StB) are
considered prime agricultural soils, while StC is also considered a primary
agricultural soil of statewide importance. More gently sloping Stowe soils are
fair sources of roadfill and topsoil. None of these soils are suitable for sand or
gravel extraction.
Cabot (CaA-B, CbA-B)- Westbury (WrA-C)
The soils of this group are found in three areas spread widely across the
northern two-thirds of the Town. They are soils that have formed from tills and
organic matter found on the lower slopes and low-lying areas of the foothills.
A fragipan, at a depth less than 3 feet, is also characteristic of these soils,
which tend to be level to gently sloping and poorly drained.

Berkshire Town Plan 2015 The Sense of Place
DRAFT Berkshire Town Plan 2015 28
Berkshire is no exception. 1
2
This conversion of primary 3
farmland into built-up 4
development is the cause for 5
much concern statewide. 6
Building on farmland 7
effectively takes it out of 8
production and reduces an 9
already limited resource 10
base. In Berkshire, much of 11
the best farmland, located 12
along roads winding through 13
the Town, is still in agricultural 14
production. In the past, more 15
acres have been lost to shrub 16
and forest cover with the 17
abandonment of hill farms, 18
than to development; but 19
because of the importance 20
of agriculture to the 21
community, farmland 22
conversion and 23
fragmentation are prominent 24
local concerns. 25
26
Retaining large enough 27
acreages of the best soils for 28
agricultural use is necessary 29
for the continued existence of 30
farming in Berkshire. It is 31
important; however, to also 32
consider social and 33
economic factors when 34
determining what land should 35
be reserved for agriculture in 36
the future. 37
38
Primary Forestry Soils 39
Primary forestry soils have also 40
been identified by the State 41
according to their 42
productivity for commercial 43 Map 3.8
Map 3.7

Berkshire Town Plan 2015 The Sense of Place
DRAFT Berkshire Town Plan 2015 29
forestry. These soils are included within “Site I” and “Site II” productivity classes 1
based upon their chemical and physical make-up and are shown in Map 3.8. 2
3
Similar concerns exist regarding the development and fragmentation of 4
commercial forestry soils as for agricultural soils. They are more widespread in 5
Berkshire than primary agricultural soils and although there is some overlap with 6
these soils, most primary forestry soils remain undeveloped. Primary forestry soils 7
include many soils, which because of slope or drainage, are not suitable for 8
intensive development. This may reduce certain development pressures, but 9
even low intensity development such as seasonal home construction may result 10
in fragmentation and limit access to good forestland. Again, socio-economic 11
factors, as well as the soil resource, should be considered in determining which 12
tracts of potential forestry land should be reserved for that use. 13
48BWater Resources 14
Water is to the earth as blood is to the human body. Water is essential to the life 15
of the individual and the community, but too often, its continued availability 16
and purity are taken for granted. Consideration of the quantity and quality of 17
water resources, and the 18
fact that water does not 19
recognize political 20
boundaries in its 21
movement, are basic to 22
the planning process. This 23
requires some 24
understanding of the way 25
water circulates through 26
the environment (the 27
"hydrologic cycle"), how 28
human actions can modify 29
this cycle, and the possible 30
impact of these 31
modifications on the water 32
supply and the 33
environment. 34
35
36
37
38
39
40
41
42 Map 3.9

Berkshire Town Plan 2015 The Sense of Place
DRAFT Berkshire Town Plan 2015 30
Surface Water 1
Berkshire is located within the Missisquoi Basin (Map 3.9), a network of rivers and 2
streams stretching across northern Vermont and ending in Missisquoi Bay and 3
Lake Champlain. The Missisquoi River and its tributaries drain most of Berkshire. 4
The Missisquoi crosses the southeast corner of Berkshire and flows in a 5
southwesterly direction through Town. A major tributary, the Trout River, flows 6
into the Missisquoi at East Berkshire. Other tributaries include Trout Brook and 7
Giddings Brook in the southwest corner of Town. 8
9
The Pike River and its tributaries drain the northwest part of Town into Missisquoi 10
Bay. This river originates in the north central hills of Berkshire, flows southwest 11
where it joins with Mineral Brook, and then flows northward into Franklin where it 12
receives water from Lake Carmi. It then reenters Berkshire and exits at the 13
Canadian border. 14
15
The section of the Missisquoi River from the dam at East Richford to its mouth, 16
including the segment in Berkshire, has been identified as an important 17
recreational river for boating and fishing. The 10.5 mile segment through 18
Berkshire has also been cited as an important fishery for natural populations of 19
smallmouth bass, and natural and stocked populations of brown trout. The Trout 20
River into East Berkshire is also a fishery-- the home of natural populations of 21
brown and rainbow trout (Vermont Rivers Study 1986). 22
23
Additionally, after a three year study, the Missisquoi and Trout were officially 24
designated by Congress as National Wild and Scenic Rivers in 2015. This places 25
these two rivers among the Nation’s most valued and beautiful rivers that 26
remain in their natural state. Designation as a Wild and Scenic River ensures that 27
about 70 miles of the Missisquoi and Trout Rivers will continue to be protected as 28
natural assets in the area and provides access to grants to support efforts to 29
increase recreational access to these rivers by fisherman, hunters and paddlers. 30
The two rivers are also part of the Northern Forest Canoe Trail, which maps a 31
network of waterways from Canada across Lake Champlain into New York 32
State. The trail is a recreational paddling route that includes lakes, rivers and 33
streams and attracts a variety of visitors. 34
35
Water Quality 36
While water quality is generally good, many rivers and streams in Berkshire have 37
been experiencing water quality issues associated with point and non-point 38
sources of pollution. Historically, “point” sources of pollution, such as the Village 39
of Richford Sewage Treatment Plant, were considered the most significant 40
threats to water quality. However, as state and federal permitting requirements 41
have begun regulating these facilities, the “nonpoint” sources of pollution (i.e., 42
decentralized activities across the landscape that result in pollution, such as 43
farming and development) have come to be recognized as the dominant 44

Berkshire Town Plan 2015 The Sense of Place
DRAFT Berkshire Town Plan 2015 31
source of pollution in the watershed. Water quality issues in the rivers and 1
streams in Berkshire are contributing to the water quality issues experienced in 2
Missisquoi Bay and greater Lake Champlain, where they all ultimately flow. 3
4
“Stormwater” is a non-point source of pollution that applies to rain and 5
snowmelt that runs off impervious surfaces like roofs, driveways and paved 6
streets, rather than infiltrating into the ground and natural water cycle. As it flows 7
into streams and lakes, stormwater runoff often picks up pollutants such as oils, 8
fertilizers and sediment. Excess stormwater also contributes to erosion and 9
increases stream volumes during peak storm events. Larger municipalities may 10
attempt to mitigate the negative impact of excess stormwater runoff through 11
the creation of storm sewers, and even stormwater treatment plants. Berkshire’s 12
stormwater drainage system consists of a network of culverts and ditches along 13
the town highway network. 14
15
New residential and commercial development in Berkshire is encouraged to 16
implement stormwater mitigation strategies, otherwise known as Low Impact 17
Development (LID). Common LID techniques that mitigate the adverse impacts 18
of stormwater runoff include on-site rain gardens and grass swales; the utilization 19
of cisterns and rain barrels; and the installation of pervious pavement and 20
sidewalks. 21
22
Each year the State of Vermont prepares a list of waterways that are impaired 23
and are unable to meet water quality standards (the 303d list and the impaired 24
list outside the scope of 303d). They also prepare a list of waterways that may 25
be impaired but are in need of further assessment before being added to the 26
list. The impaired waterways and those in need of further assessment are listed in 27
Table 3.2. 28
29
84BTable 3.2 List of water quality impairments affecting the use of surface waters
85Bin Berkshire as designated by the draft 2014 303d list.
Stream Section Pollutant Impaired Use Water Quality Problem
Berry Brook, mount
up to and including
North Tributary
(Approx. 1 Mile)
Sediment,
Nutrients aquatic life support
Agricultural runoff,
Aquatic Habitat
Impacts
Godin Brook Sediment,
Nutrients aquatic life support
Agricultural runoff,
Aquatic Habitat
Impacts
Samsonville Brook Sediment,
Nutrients aquatic life support
Agricultural runoff,
Aquatic Habitat
Impacts
Trout Brook,
Upstream from
mouth for 2.3 miles
Nutrients aquatic life support Agricultural runoff

Berkshire Town Plan 2015 The Sense of Place
DRAFT Berkshire Town Plan 2015 32
1
In a healthy watershed, streams are able to maintain a state of equilibrium and 2
can carry the water, sediment and debris, even in high flows, without dramatic 3
changes in depth, width or slope. These streams have access to floodplain, a 4
low-lying area adjacent to the stream, where floodwaters can go. When 5
streams become heavily modified and floodplain areas are developed or filled, 6
the streams are taken out of equilibrium. Often they can become deeply 7
incised, water velocity and erosion can increase, and the stream can become 8
capable of creating greater flood damage and sediment is moved 9
downstream, reducing water quality. This process of stream channel evolution, 10
which can be seen occurring throughout the Missisquoi and Pike River 11
Watershed, is shown in Figure 3.2. 12
13
Local conservation efforts are 14
taking place around 15
Berkshire’s waterways to 16
improve water quality. The 17
Missisquoi River Basin 18
Association (MRBA), a local 19
volunteer organization has 20
formed partnerships with the 21
federal Fish and Wildlife 22
Agency and the Natural 23
Resources Conservation 24
Service to carry out various 25
projects to protect water 26
quality and recreational 27
opportunities throughout the 28
Missisquoi Watershed. 29
30
Data has been collected by 31
the Vermont DEC River 32
Management Program about 33
the physical condition of the 34
mainstem of the Missisquoi 35
River, Trout River, and the Pike 36
River. These studies, called 37
stream geomorphic assessments, document a stream’s general characteristics, 38
including width, slope, streamside vegetation and streambed materials, as well 39
as issues impacting the stream, including erosion, modifications of the stream 40
channel, the presence of bridges and culverts, etc. This comprehensive 41
information about a river can provide important baseline data from which 42
restoration projects and needs assessments can be determined. 43
44
Figure 3.2. Stream Channel Evolution
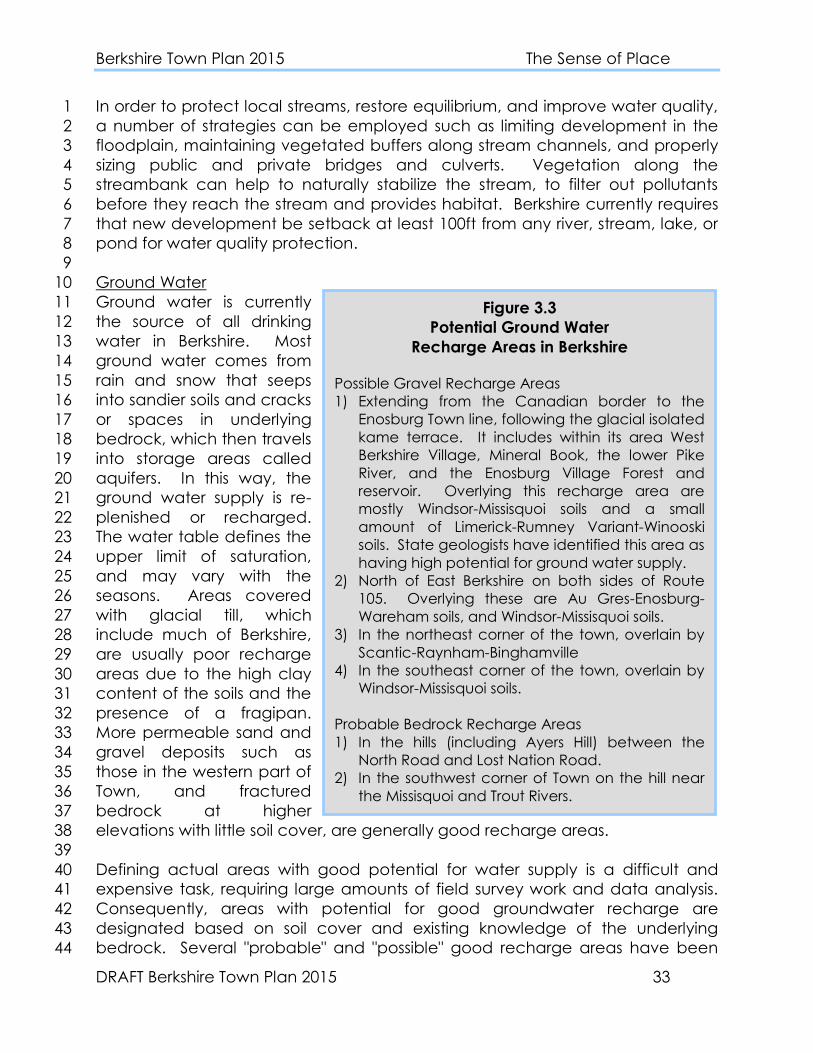
Berkshire Town Plan 2015 The Sense of Place
DRAFT Berkshire Town Plan 2015 33
In order to protect local streams, restore equilibrium, and improve water quality, 1
a number of strategies can be employed such as limiting development in the 2
floodplain, maintaining vegetated buffers along stream channels, and properly 3
sizing public and private bridges and culverts. Vegetation along the 4
streambank can help to naturally stabilize the stream, to filter out pollutants 5
before they reach the stream and provides habitat. Berkshire currently requires 6
that new development be setback at least 100ft from any river, stream, lake, or 7
pond for water quality protection. 8
9
Ground Water 10
Ground water is currently 11
the source of all drinking 12
water in Berkshire. Most 13
ground water comes from 14
rain and snow that seeps 15
into sandier soils and cracks 16
or spaces in underlying 17
bedrock, which then travels 18
into storage areas called 19
aquifers. In this way, the 20
ground water supply is re-21
plenished or recharged. 22
The water table defines the 23
upper limit of saturation, 24
and may vary with the 25
seasons. Areas covered 26
with glacial till, which 27
include much of Berkshire, 28
are usually poor recharge 29
areas due to the high clay 30
content of the soils and the 31
presence of a fragipan. 32
More permeable sand and 33
gravel deposits such as 34
those in the western part of 35
Town, and fractured 36
bedrock at higher 37
elevations with little soil cover, are generally good recharge areas. 38
39
Defining actual areas with good potential for water supply is a difficult and 40
expensive task, requiring large amounts of field survey work and data analysis. 41
Consequently, areas with potential for good groundwater recharge are 42
designated based on soil cover and existing knowledge of the underlying 43
bedrock. Several "probable" and "possible" good recharge areas have been 44
Figure 3.3
Potential Ground Water
Recharge Areas in Berkshire
Possible Gravel Recharge Areas
1) Extending from the Canadian border to the
Enosburg Town line, following the glacial isolated
kame terrace. It includes within its area West
Berkshire Village, Mineral Book, the lower Pike
River, and the Enosburg Village Forest and
reservoir. Overlying this recharge area are
mostly Windsor-Missisquoi soils and a small
amount of Limerick-Rumney Variant-Winooski
soils. State geologists have identified this area as
having high potential for ground water supply.
2) North of East Berkshire on both sides of Route
105. Overlying these are Au Gres-Enosburg-
Wareham soils, and Windsor-Missisquoi soils.
3) In the northeast corner of the town, overlain by
Scantic-Raynham-Binghamville
4) In the southeast corner of the town, overlain by
Windsor-Missisquoi soils.
Probable Bedrock Recharge Areas
1) In the hills (including Ayers Hill) between the
North Road and Lost Nation Road.
2) In the southwest corner of Town on the hill near
the Missisquoi and Trout Rivers.

Berkshire Town Plan 2015 The Sense of Place
DRAFT Berkshire Town Plan 2015 34
Map 3.10
Water Supply Source Protection Areas
identified in Berkshire and are listed in Figure 3.3. 1
2
Ground water feeds rivers, lakes, and wetlands, appears at the surface in the 3
form of seeps or springs, and is often pumped out of the ground for human use. 4
Since ground water is usually less easily polluted or contaminated than surface 5
water, it is a valuable source of drinking water. As noted earlier, Berkshire 6
depends heavily on ground water for its water supply. 7
8
It is important to note; however, that human activity occurring in a recharge 9
area can affect the quality and quantity of the ground water supply. Paving 10
large areas of land or pumping too much water can deplete the supply. 11
Leaking septic systems and underground gas tanks, road salt, industrial wastes, 12
and agricultural applications of chemicals are common sources of ground 13
water pollution. Once a ground water system is contaminated, cleaning it up is 14
very expensive and difficult, if not impossible. 15
16
The Federal Source Water Protection Program was established to protect 17
groundwater that supplies public drinking water systems. Since 1985, the 18
delineation of Public Water Source Protection Areas (SPA) has been required for 19
all proposed new sources for Public 20
Community Water Systems. This 21
program emphasizes proper 22
management of lands within Source 23
Protection Areas to reduce or 24
restrict potentially contaminating 25
activities. The State also has the 26
Groundwater Protection Rule and 27
Strategy that was adopted in 2005. 28
This provides restrictions, 29
prohibitions, standards, and criteria 30
for a groundwater protection. 31
32
There are four Water Supply Source 33
Protection Areas in Berkshire (See 34
Map 3.10), two of which are 35
protected through local zoning. 36
This plan proposes to add the remaining two ground water source protection 37
areas to the zoning regulations to afford them equal protection as identified on 38
the Proposed Land Use map. The water supplies protected in zoning include the 39
one located on the north side of Reservoir Road associated with two gravel 40
wells that supply the Enosburg Falls Water System and another associated with 41
the water supply for the Dairy Center. It is located on the border of Enosburgh 42
and Berkshire surrounding the Dairy Center on Route 105. The two water supplies 43
that should be protected include the area located on the border of Berkshire 44

Berkshire Town Plan 2015 The Sense of Place
DRAFT Berkshire Town Plan 2015 35
and Enosburgh between Perley and Woodward Neighborhood Roads, 1
associated with spring supplying the East Berkshire Water Coop. As well as the 2
area associated with the Berkshire Elementary School and surrounds the School. 3
49BCritical Areas 4
Critical areas, for the purposes of this plan, are defined as natural areas requiring 5
special protection from development. They include areas that have 6
environmental, ecological, educational, and/or scenic value, such as wetlands, 7
shorelands, flood hazard areas, important wildlife, and endangered or 8
threatened species habitats, and other areas of biological, hydrological, or 9
geological significance. 10
11
Wetlands 12
Four large wetland areas are located in Berkshire (see Map 3.11). Two are 13
located along the Pike River and Mineral Brook, another is found on the south 14
side of the Berkshire-Richford Road near Lost Nation Road, and the fourth is 15
located east of Lost Nation Road. Wetland areas are defined by the state as 16
“those areas … that are inundated by surface or ground water with a frequency 17
sufficient to support vegetation or aquatic life that depend on saturated or 18
seasonally saturated soil conditions for growth and reproduction” (10 V.S.A. 902). 19
This definition includes but is not limited to marshes, swamps, sloughs, potholes 20
fens, river and lake overflows, mud flats, bogs, and ponds. 21
22
Wetlands are indispensable but fragile natural resources. They are important for 23
a variety of reasons. They provide temporary storage for floodwaters and 24
thereby reduce flooding and protect the quality and quantity of ground water. 25
They improve surface water quality by storing organics, chemically breaking 26
down or removing pollutants, and filtering eroded sediments. They provide 27
spawning and feeding habitat for fish and other aquatic life, and a wide 28
diversity of habitat for other wildlife, including waterfowl, birds, mammals, 29
furbearers, amphibians, and reptiles. Wetlands also provide habitat that may be 30
critical for the survival of rare, threatened, or endangered species, valuable 31
resources for education and research in the natural sciences, and a diversity of 32
recreational opportunities and economic benefits. Finally, wetlands contribute 33
to community open space, and the overall beauty of the landscape. 34
35
The U. S. Fish and Wildlife Service, using color infrared aerial photography, 36
identified nearly 200 smaller wetland areas scattered throughout Berkshire. 37
These are located on National Wetlands Inventory Maps. Most of these 38
wetlands are small marshy (palustrine) areas, characterized by open water, 39
emergent plant growth (e.g., aquatic plants), forested cover, or shrub and scrub 40
growth. 41
42

Berkshire Town Plan 2015 The Sense of Place
DRAFT Berkshire Town Plan 2015 36
Not every wetland area supports all 1
wetland functions; however, critical 2
functions may be performed by a 3
particular wetland, or by an aggregate 4
of smaller wetland areas within a larger 5
area. The State's Water Resources 6
Board, as required by state (10 V.S.A., 7
Chapter 37, Section 905), has adopted 8
Wetland Rules for the identification and 9
protection of Vermont's significant 10
wetlands. Under these rules, all 11
wetlands in Vermont are designated as 12
Class I, Class II or Class III wetlands 13
(Figure 3.4). There no been any Class I 14
wetlands in Berkshire. There are many 15
wetlands identified in Berkshire 16
designated as Class II. 17
18
The State regulates land use within 19
designated wetland areas (Class I and 20
Class II) and requires buffer strips that 21
protect these wetlands from potential 22
adverse impacts of adjacent land uses. 23
Activities that will not adversely affect 24
the functions and values of these 25
wetlands are permitted. Farming 26
activities now taking place within a 27
designated wetland are exempt from these rules. 28
29
The local planning commission is responsible for undertaking studies, making 30
recommendations on wetland protection, and indicating those areas proposed 31
for protection within its municipal plan. The municipality, a municipal 32
conservation commission, an affected landowner, or a group of 15 or more 33
interested persons can petition the Board of Water Resources to do any of the 34
following: reclassify a wetland to a higher or lower designation; determine which 35
functions make a wetland significant; determine whether the size or 36
configuration of a buffer strip should be modified; or determine the final 37
boundaries of any significant wetland. 38
39
40
41
42
43
44
Figure 3.4
State Wetland Classification
Class I -include those wetlands that
the Board finds make an
exceptional or irreplaceable
contribution to Vermont's natural
heritage.
Class II -includes those wetlands
which are either valuable only in
the aggregate, or which are may
be so significant that they merit
protection in and of themselves,
but are not so exceptional or
irreplaceable that they qualify as
Class I wetlands. As proposed, this
would include any wetlands found
on the National Wetlands Inventory
Map, except for those classes
specifically excluded.
Class III -includes those wetlands
that are not designated Class I or
Class II wetlands.

Berkshire Town Plan 2015 The Sense of Place
DRAFT Berkshire Town Plan 2015 37
Flood and Erosion Hazards. 1
In response to the unprecedented flooding that occurred on Lake Champlain in 2
the spring of 2011, and in Central and Southern Vermont during Tropical Storm 3
Irene in September 2011, there has been an increased awareness statewide of 4
the dangerous effects of flooding and fluvial erosion. As climate change 5
threatens meteorological norms, and as increased development and 6
impervious surfaces put more pressure on the State’s streams and rivers, 7
communities must reexamine their approach to assessing risks posed by flooding 8
and fluvial erosion. 9
10
Flood Hazard Areas. 11
Historically, the Town of Berkshire has been subject to periodic flooding of the 12
Missisquoi River and its tributaries. The Missisquoi River, the largest river in 13
Berkshire, is surrounded by a substantial floodplain. In general, the flood plain of 14
the Missisquoi River in Berkshire is largely undeveloped area composed of marsh, 15
woodland, or land that is in agricultural use. However, East Berkshire is an 16
exception, with a dense population that is subject to substantial risk of flooding. 17
Portions of the state highways (Rte 105 and Rte 118) and Missisquoi Valley Rail 18
Trail are also located in the Missisquoi River flood plain. The Pike River, Mineral 19
Brook, Trout Brook and Trout River are tributaries of the Missisquoi River in 20
Berkshire. Each tributary has its own floodplain. 21
22
Flooding most frequently occurs in Berkshire during the late winter and early 23
spring when rainfall mixed with snowmelt causes water levels to rise on the 24
Missisquoi River. Ice jams have not caused major damage to structures along 25
the Missisquoi River in East Berkshire in recent years, but it has been responsible 26
for field and riverbank erosion. The most severe flood on record in Berkshire 27
occurred in November 1927. A storm brought 3.2 inches of rain in 24 hours, and 28
a total of 6.32 inches over its entire duration. Many Berkshire residents had to be 29
evacuated from their homes by boat. Farms in the community lost much of their 30
livestock, and bridges, including the Nutting Bridge north of East Berkshire and a 31
number of covered bridges, were swept away (Flood Insurance Study, Town of 32
Berkshire, Federal Emergency Management Agency, 1980). 33
34
As indicated in the discussion on maintaining stream equilibrium (Figure 3.2), 35
construction within floodplain areas has several negative impacts, including 36
restriction of flood flows and decreases in flood storage capacity. Impervious 37
surfaces, such as driveways and roofs, hamper the ability of floodplains to 38
absorb water, and to assimilate nutrients from residential and agricultural runoff. 39
The Federal Emergency Management Agency (FEMA) requires communities 40
who participate in the National Flood Insurance Program to adopt flood hazard 41
regulations, which is structured to minimize risk to life and property. Participation 42
in the NFIP is required for property owners to become eligible for federally-43
backed mortgage loans and flood insurance. Currently, the Town of Berkshire 44

Berkshire Town Plan 2015 The Sense of Place
DRAFT Berkshire Town Plan 2015 38
participates in NFIP and 1
has five properties with 2
flood insurance policies 3
with a total value of over 4
$1 million. 5
6
Berkshire has incorporated 7
Flood Hazard Area 8
Regulations into their 9
Zoning Bylaws and 10
Subdivision Regulations, 11
which place an additional 12
set of regulations on areas 13
of Special Flood Hazard 14
(the 100 year floodplain) as 15
identified on the FEMA 16
Flood Insurance Rate 17
Maps. 18
19
While the FEMA Flood 20
Insurance Rate Maps 21
indicate areas that are at 22
risk of inundation by flood 23
waters, the floodplain was 24
mapped in 1983 and therefore may no longer accurately reflect the true risk of 25
flooding to Berkshire. In addition, the maps do not adequately identify areas at 26
risk of erosion. 27
28
Fluvial Erosion in the River Corridor. 29
Fluvial erosion is erosion caused by the lateral and vertical movement of streams 30
and rivers. Fluvial erosion and landslides are becoming more common within 31
the Northwestern region of Vermont. The VT DEC recommends that the 32
community identify and regulate development in River Corridors, or the area 33
along the larger tributaries and rivers, that are susceptible to stream channel 34
adjustment in order to reduce the risk of erosion damage. 35
36
Historic land uses along the river and its streams including floodplain 37
encroachments and vegetative debris removal have increased the risk of 38
erosion and landslides. Historically practices including armoring, dredging, 39
gravel mining and channelization were common for the purpose of containing 40
high flows and to protect infrastructure built in the historic floodplains, however 41
this has generally resulted in an increase in streams’ power as the streams were 42
made straighter and deeper creating direct effects on the rocks and vegetation 43
that make up the channel boundary. The effects can be varied and may lead 44
Map 3.11

Berkshire Town Plan 2015 The Sense of Place
DRAFT Berkshire Town Plan 2015 39
to channel instability and increased damages from flooding. To address this 1
issue, the Vermont Agency of Natural Resources (ANR) is using the results of 2
geomorphic assessments to map river corridors and identify the extent of 3
potential for fluvial erosion hazards. 4
5
VT DEC recommends that river corridors for streams with a watershed of 2 square 6
miles or greater be set at approximately 2 to 3 times the channel width plus 50 7
feet; and for streams with less than 2 square miles watershed a minimum 50 foot 8
setback on either side of the stream. Draft maps of these recommended 9
corridors have been released by VT DEC. Should Berkshire choose to adopt river 10
corridor bylaws, regional planning staff can work with VT DEC to amend the 11
maps based on geomorphic assessment, local knowledge and the presence of 12
village centers. 13
14
Promoting Hazard Resilient Measures. 15
Berkshire’s adopted Flood Hazard Bylaw adheres to the minimum development 16
standards allowed by the National Flood Insurance Program (NFIP). Berkshire 17
should investigate the possibility of adopting additional standards for land 18
development in the flood plain to ensure public safety and reducing future risk 19
to infrastructure and investment. 20
21
Potential strategies to be considered include: 22
Prohibition on New Development – this would prohibit new structures in the 23
Flood Hazard Overlay District. 24
Increasing Standards – Communities can choose to increase the 25
requirements for new developments in the floodplain while still allowing all or 26
most forms of development. Examples include: 27
o Limit the amount of fill or impervious surface. 28
o Require structures be elevated such that the lowest floor (including 29
basement) is at least two (2) feet above the base flood elevation. This 30
requirement also can result in major reductions to flood insurance 31
premiums 32
Protect River Corridors - Communities have two options for protecting river 33
corridors, which can include adopting a River Corridor Overlay District that 34
extends beyond the mapped flood hazard areas. Often this River Corridor 35
area uses fluvial erosion hazard data as part of its basis. Adopting simple 36
setbacks or buffers from rivers in all parts of the community as a way to deter 37
development in areas that may erode in the event of severe flooding is 38
another strategy. Currently Berkshire has a 100ft buffer on all water bodies. 39
40
Limiting development within flood and river corridor areas will minimize risk and 41
provide streams the opportunity to reestablish a stable, equilibrium condition. 42
Maintaining vegetated buffers around waterways also helps to minimize risk to 43
property and provides water quality benefits. Mapping the extent of erosion 44
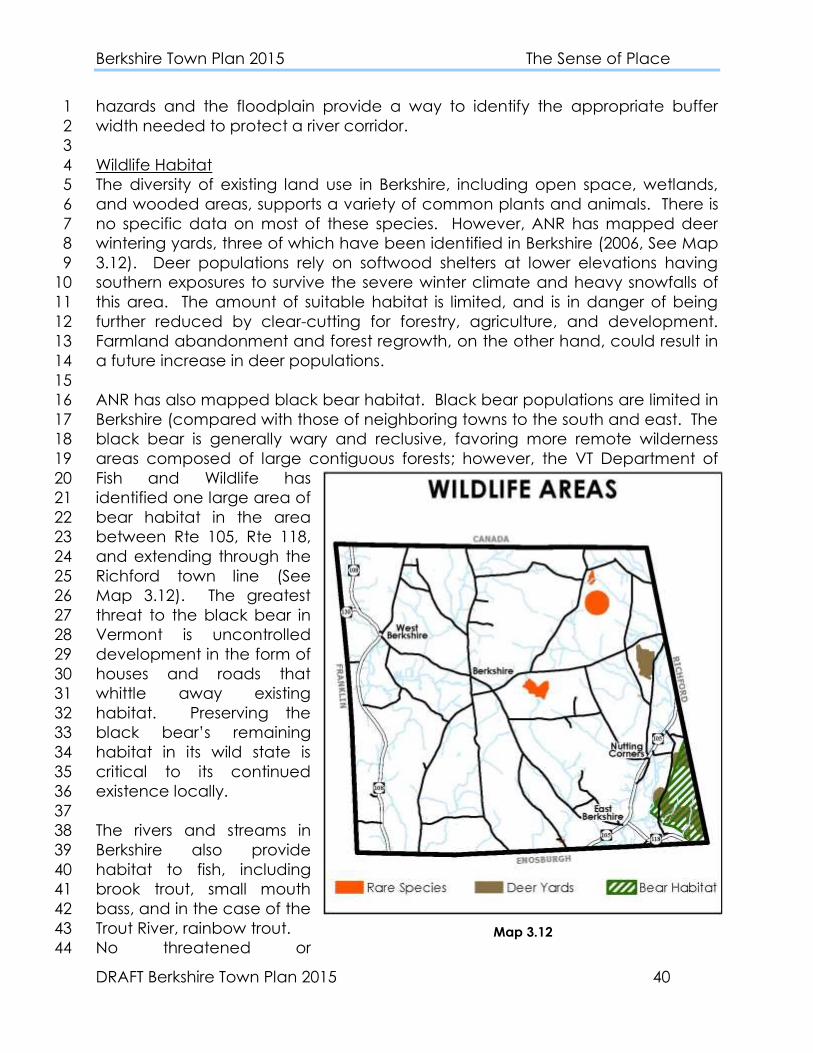
Berkshire Town Plan 2015 The Sense of Place
DRAFT Berkshire Town Plan 2015 40
hazards and the floodplain provide a way to identify the appropriate buffer 1
width needed to protect a river corridor. 2
3
Wildlife Habitat 4
The diversity of existing land use in Berkshire, including open space, wetlands, 5
and wooded areas, supports a variety of common plants and animals. There is 6
no specific data on most of these species. However, ANR has mapped deer 7
wintering yards, three of which have been identified in Berkshire (2006, See Map 8
3.12). Deer populations rely on softwood shelters at lower elevations having 9
southern exposures to survive the severe winter climate and heavy snowfalls of 10
this area. The amount of suitable habitat is limited, and is in danger of being 11
further reduced by clear-cutting for forestry, agriculture, and development. 12
Farmland abandonment and forest regrowth, on the other hand, could result in 13
a future increase in deer populations. 14
15
ANR has also mapped black bear habitat. Black bear populations are limited in 16
Berkshire (compared with those of neighboring towns to the south and east. The 17
black bear is generally wary and reclusive, favoring more remote wilderness 18
areas composed of large contiguous forests; however, the VT Department of 19
Fish and Wildlife has 20
identified one large area of 21
bear habitat in the area 22
between Rte 105, Rte 118, 23
and extending through the 24
Richford town line (See 25
Map 3.12). The greatest 26
threat to the black bear in 27
Vermont is uncontrolled 28
development in the form of 29
houses and roads that 30
whittle away existing 31
habitat. Preserving the 32
black bear’s remaining 33
habitat in its wild state is 34
critical to its continued 35
existence locally. 36
37
The rivers and streams in 38
Berkshire also provide 39
habitat to fish, including 40
brook trout, small mouth 41
bass, and in the case of the 42
Trout River, rainbow trout. 43
No threatened or 44 Map 3.12

Berkshire Town Plan 2015 The Sense of Place
DRAFT Berkshire Town Plan 2015 41
endangered species are known with habitat in Berkshire, but as of 2009, four 1
areas supporting rare species habitats have been identified (Map 3.12). To 2
prevent disturbance or illegal collection of these species, specific information on 3
the species is withheld. 4
5
Unique and Fragile Areas 6
Unique or fragile areas are landscape features other than those already defined 7
that have scientific and/or educational value. In Berkshire, these include three 8
unique geologic features described as follows: 9
10
Ayers Hill 11
This is a singularly unique area of 400 acres on Ayers Hill where the volcanic lava 12
flows and volcanic bombs of the Tibbit Hill formation are readily apparent. 13
Currently, it is in private ownership and is in need of protection. This site is 14
considered to be of state significance for its educational, scientific, and scenic 15
value. 16
17
Berkshire Copper Mine 18
The Berkshire Copper Mine is a 10-acre site associated with the old copper mine 19
that is now considered an important mineral collection area. It is also in private 20
ownership and in need of protection. The site is considered to be of state 21
significance because of its historical, educational, and scientific value. 22
23
Berkshire Kettle Hole 24
The Berkshire Kettle Hole is a well-preserved glacial feature, known as a kettle 25
hole, which formed when a chunk of buried glacial ice melted and left a hollow 26
or depression in the landscape. The Berkshire Kettle Hole is located on a three-27
acre site southwest of the hamlet of Berkshire. The kettle hole is in private 28
ownership and in need of protection. As a glacial feature, it is considered 29
locally significant. 30
31
Because of their significance, these areas should be protected from any type of 32
development that would affect their character, value, and integrity. Controlled 33
public access, in cooperation with private landowners, should be encouraged 34
for educational and scientific pursuits. 35
36
16BB) HISTORIC LEGACIES 37
50BHistoric Districts and Structures 38
Berkshire contains four historic districts and 75 historic buildings and farms, as 39
identified in a survey conducted by the Vermont Division for Historic Preservation 40
in 1983. The four designated historic districts include the three hamlets-- the 41
West Berkshire Historic District, the East Berkshire Historic District, and the Berkshire 42

Berkshire Town Plan 2015 The Sense of Place
DRAFT Berkshire Town Plan 2015 42
Center Historic District-- as well as the Montgomery Road Historic District. Site 1
listings, descriptions, photographs, and historic district maps are available in the 2
survey report available at the Town Clerk's Office. 3
4
Currently, none of the historic buildings on the index for historic sites for Berkshire 5
have been placed on the State Register of Historic Places. Selection is based 6
upon the "quality of significance" of the building site or district in local, state, and 7
national history, and often comes about through local nominations. 8
Architectural and/or cultural significance, as well as the integrity of location, 9
design, setting, materials, and workmanship, are also factors considered when 10
selecting sites for inclusion in the state register. Properties of special merit may 11
be nominated for inclusion in the National Register for Historic Places. Properties 12
determined eligible for nomination to the National Register are automatically 13
placed on the state register. Inclusion on these registers can result in some 14
public financial support for restoration, preservation, and protection activities. 15
16
The Berkshire Historical Society conducts local research, assists in updating the 17
sites and structures survey, and makes recommendations for historical register 18
nominations. The Society gathered information about the history of Berkshire to 19
include in a book. The book was published in 1994. 20
21
The Historical Society was responsible for initiating the restoration of the Town 22
Hall. Based on their investigation, the Selectboard decided to seek funding for 23
the project. They applied for and received a grant through the historical 24
preservation grant program. Along with a bond measure and additional funds 25
from an Accessibility Modifications Community Development Block Grant 26
(CDBG), the project was fully funded. The Town Hall renovation was completed 27
in 2007. The Town Offices as well as meeting space are currently located there. 28
29
51BArchaeological Sites and Sensitive Areas 30
Archaeological sites serve as tangible clues to the past and are important 31
cultural resources for their historical, educational, and scientific value. They 32
provide information about how people coped with changing environmental 33
and cultural conditions, including changes in the climate, population stress, and 34
the introduction of new technologies. 35
36
The archaeological record includes both prehistoric Native American sites and 37
historic remnants of European settlement. Evidence of Native American settle-38
ment and activity is typically contained within upper soil layers, but may be 39
deeply buried underneath floodplain deposits. The archaeological record also 40
includes the ruins, materials, and evidence of life left behind by explorers, 41
soldiers, and settlers of European descent that once passed through or settled in 42
Berkshire. The ruins and buried remains of 18th, 19th, and early 20th century 43

Berkshire Town Plan 2015 The Sense of Place
DRAFT Berkshire Town Plan 2015 43
buildings, structures, encampments, landscape features, garbage areas and 1
other activity sites comprise Berkshire's historic archaeological heritage. 2
Archaeological sites are often the only source of information for the longest part 3
of human activity in Vermont. 4
5
Because these sites are not readily visible, archaeological sites are difficult to 6
locate and may be unintentionally destroyed during construction and develop-7
ment; archaeological sites are being destroyed at an alarming rate throughout 8
Vermont and New England. They are fragile, endangered, and nonrenewable. 9
Once a site is disturbed, its value for scientific research is largely lost. 10
Accordingly, archaeological sites and lands need to be considered in the 11
planning process, and protected from the adverse impacts of growth and 12
development. 13
14
Unfortunately, it is not known where most archaeological sites in Berkshire are 15
located. Locating specific sites often requires a lot of historical research, and in 16
the case of most prehistoric sites, field investigations, and surveys. The State's 17
Division of Historic Preservation has identified archaeological “sensitive areas” in 18
the Town based upon the results of past field investigations and research in 19
nearby areas. Most prehistoric sites and many historic sites as well, are located 20
near water, since water was a necessary resource and the focus of many 21
activities. The Missisquoi River and its tributaries, and the Pike River are 22
considered especially sensitive. It is important to note, however, that sites once 23
located on waterways now often lie up to a 1000 feet away from present day 24
watercourses because the location and shape of river channels have changed 25
over time. 26
27
It is difficult to predict the location of these sites but once found they should be 28
protected since they constitute essential links to the recent and distant past. 29
Any activity within sensitive areas should be carefully monitored; and finds or 30
artifacts uncovered in the course of development anywhere within the Town 31
should be immediately reported to the State Archaeologist so that their location 32
can be recorded and a determination can be made regarding their 33
significance. 34
35
17BC) LAND USE PATTERNS 36
37
The Town of Berkshire exhibits a traditional agrarian landscape with agriculture 38
and forestry a vitally important element of the community’s character. Family 39
dairy farms and rural homesteads are woven together with the foothills and 40
forests of the Green Mountains, the historic villages of Berkshire Center, East 41
Berkshire, and West Berkshire, and the views seen along the corridors of town 42
highways to create a unique sense of place. Regionally, the Town’s rural 43

Berkshire Town Plan 2015 The Sense of Place
DRAFT Berkshire Town Plan 2015 44
character aids in defining the more urban character of its neighboring 1
communities of Enosburg Falls and Richford. 2
3
This section provides a description of the location and extent of existing land 4
uses within Berkshire, including agricultural land, forested land, and land in 5
residential, commercial, and industrial development. This information is based 6
upon field surveys and observations, conversations with local residents, and 7
town records. To better understand how the Town is developing, aerial 8
photography can be used to look at changes in land use over time and provide 9
an important resource for land use planning; imagery is available for Berkshire 10
for 2003 and 2009. The Planning Commission should review changes in land use 11
over time to inform future bylaw updates on how the town is developing. 12
52BAgricultural Land 13
Many Berkshire farms have been in the same family for decades, and some 14
have been owned by the same family for over one hundred years. The 15
Hammond Farm, the Howard Stanley Farm, and the Ewins Farm are all classified 16
as “Century Farms" based on the fact that they have remained in the same 17
family for a century or more. Berkshire is also home to some of the largest dairies 18
in Franklin County, and in the State. Brouillette Farms, Inc. in East Berkshire is an 19
example. The farm is now owned by Hans Weibel and milks over 500 head of 20
cattle. They manage a herd of over 600 21
animals. Dairy farming has remained vitally 22
important to Berkshire's economy to the 23
present day. 24
25
Most of the primary agricultural land in 26
Berkshire, including large tracts along Rte. 27
105 in the eastern half of Town and along 28
major roads in the western half, is currently in 29
production. However, some agricultural 30
lands on roads leading northward from 31
Enosburg Falls and East Berkshire have been 32
given over to residential development. 33
34
Both the amount of land in agriculture and 35
the number of farms has been decreasing 36
over the last 20 years in Berkshire. According 37
to the grand list, the amount of land in 38
agriculture has not decreased as sharply as 39
the number of recorded farmland parcels. 40
The amount of land in agriculture according 41
to the grand list decreased from 42
approximately 17,500 acres in 1999 to 43
There are 75 parcels in the Current
Use Program located in Berkshire,
which total 12,007 acres. The
current use program allows the
valuation and taxation of farm and
forest land based on its remaining in
agricultural or forest use instead of
its value in the market place.
Land trust easements are an
effective method used in Vermont
to preserve agricultural land and
provide financial compensation to
the landowner. Individual
landowners sell certain rights to
their land to ensure their land will
be kept for use as farmland,
conservation, or recreation land in
perpetuity. As of November 6, 2014
there were 1622 acres of land with
a Vermont Land Trust easement or
covenant in Berkshire.

Berkshire Town Plan 2015 The Sense of Place
DRAFT Berkshire Town Plan 2015 45
approximately 11,700 acres in 2010. In comparison, the number of recorded 1
farmland parcels decreased from 177 in 1987, to 88 in 1999, to 55 in 2010. This 2
trend is experienced statewide as farms consolidate into fewer larger farms. 3
While the issues associated with the decrease in the family farm and the viability 4
of farming in Berkshire are largely beyond the control of the Town, the Town can 5
support and promote programs that assist farmers to keep their land in 6
production, such as the land trusts, the current use program, state and federal 7
subsidies and incentives, and local zoning controls. 8
9 Map 3.13

Berkshire Town Plan 2015 The Sense of Place
DRAFT Berkshire Town Plan 2015 46
3B 1
Forest Land 2
At one time, before clearing began for agriculture, Berkshire was covered by 3
mature hardwood and softwood forests. As of 2003, forest or woodland made 4
up roughly 40 percent of total land area in Berkshire. Most of this acreage is 5
found on the ridges and hilltops of north central Berkshire, and on other areas of 6
steep slope or wet soil scattered throughout the Town. Little of this land is 7
suitable for higher density development. 8 9
All of the forested land in Berkshire, except for that in the Berkshire and 10
Enosburgh Town forests, is privately owned (see Map 3.13 for location of Town 11
forests). As noted earlier, many of the forested soils in Berkshire are considered 12
highly productive (Type I and Type II) soils for forest growth, although timber 13
stands would have to be properly nurtured and managed for commercial use. 14
Many landowners now manage their woodlots on a much smaller scale for 15
private use. All forestland owners are encouraged by the State to adopt 16
Acceptable Management Practices (AMPS) for maintaining water quality, and 17
a long-term forest management plan. At present, no management plan has 18
been developed for the municipal forest. 19
20
There are several forestry operations in Town at present including two firewood 21
processors, a woodworking shop, a procurement yard and a sawmill. There are 22
also several maple sugaring operations in Berkshire that utilize its forests. 23
Berkshire forests provide wood for fuel and construction, and recreational 24
opportunities for hikers and hunters. They also serve a number of important 25
environmental functions, which include providing important wildlife habitat, 26
preventing soil erosion in areas of steep slope, and maintaining surface and 27
groundwater quality. Large tracts of forestland can be impacted by 28
development when it infringes upon the boundaries of the forest, cuts a path 29
through it, and breaks it up into smaller parcels that may be managed 30
differently. Given that the Town's forests and woodlands add to the diversity of 31
the natural environment and local landscape, providing an appealing and 32
necessary change from open fields and the built environment; long term 33
management strategies and forest stewardship practices are needed to ensure 34
the continued protection of existing forests and their economic benefits. 35
54BResidential Land 36
Residential development is concentrated at the highest densities on relatively 37
small lots (one acre or less) in Berkshire's three hamlets: West Berkshire, East 38
Berkshire, and Berkshire Center. Of the three, East Berkshire is the largest. There 39
is a growing trend, however, toward residential "strip development” (2 or more 40
housing units per 1000 ft. of road frontage), particularly along roads leading 41
northward from Enosburg Falls and East Berkshire. This type of rural residential 42
development is increasingly common in many Vermont communities, and is in 43

Berkshire Town Plan 2015 The Sense of Place
DRAFT Berkshire Town Plan 2015 47
part determined by the need for road 1
access and on-site systems, and the desire 2
for more privacy. Lot sizes vary greatly, from 3
newly created lots of an acre or less to 4
farmhouses sitting on large tracts of land 5
(which are generally included with farms in 6
the agricultural designation). This type of 7
development; however, is often inefficient in 8
its requirements for land and utilities, and is 9
therefore more expensive to purchase, own, 10
service, and maintain. It also limits access to 11
hinterlands, and detracts from the 12
traditional pattern of clustered settlement 13
within hamlets and villages. 14
55BCommercial and Industrial Land 15
There is very little commercial and industrial land in Berkshire. The commercial 16
land that exists is located primarily in East Berkshire on relatively small lots. There 17
are also a few lots in West Berkshire and Berkshire Center occupied by 18
commercial enterprises. Berkshire is not yet afflicted with the commercial strip 19
development that has begun to plague other communities, though the 20
potential for such development exists, particularly on Rte. 105 coming from 21
Richford. 22
23
It is expected that most commercial and industrial development will continue to 24
be centered outside of Berkshire in the villages of Enosburg Falls and Richford. 25
The need exists for limited commercial and possibly some light industrial 26
development within the Town to diversify its economy and tax base. This type of 27
development also should be clustered on suitable land near existing centers in 28
order to prevent strip development and sprawl, and again, soil conditions in 29
Berkshire, particularly in East Berkshire where most commercial development is 30
likely to occur, are a limiting factor. 31
56BPublic and Semi-Public Land 32
Roughly three percent of the land in Berkshire is in public or semi-public 33
ownership, and most of this is in the Berkshire Municipal Forest, and the Town's 34
road network. Community buildings, including the town clerk's office, the town 35
garage, the fire department, and the Berkshire Elementary School occupy little 36
land. Small acreages of land should be identified near existing facilities to allow 37
for future expansions. Much of the land within present ownership, such as the 38
municipal forest and Class IV roads, could be developed and maintained for 39
community educational and recreational use. As noted earlier, the Town also 40
may want to consider the acquisition of land, development rights, or easements 41
to protect its important resources. 42
43
“Strip development” means linear
commercial development along a
public highway that includes three
or more of the following
characteristics: broad road
frontage, predominance of single-
story buildings, limited reliance on
shared highway access, lack of
connection to any existing
settlement except by highway,
lack of connection to surrounding
land uses except by highway, lack
of coordination with surrounding
land uses, and limited accessibility
for pedestrians.

Berkshire Town Plan 2015 The Sense of Place
DRAFT Berkshire Town Plan 2015 48
GOALS AND POLICIES: THE SENSE OF PLACE 1
2
GOAL 1: To preserve the sense of place in Berkshire, which consists of three 3
concentrated village centers separated by rural agricultural and 4
forest land and limited rural residential development. 5
6
GOAL 2: To protect in good quality the abundant natural and historic 7
resources in Berkshire. 8
9
GOAL 3: To support the continuation of agriculture and forestry, which 10
contribute to the rural character and sense of place in Berkshire. 11
12
GOAL 4: To protect the citizens, property and economy of Berkshire and the 13
quality of their rivers as natural and recreational resources by using 14
sound planning practices within designated Flood Hazard Areas 15
and river corridors. 16
17
Policies: 18
19
1) Local climatic and weather conditions, and impacts on local air quality, 20
should be considered in planning for suitable use of the land. 21
22
2) Regional, state, national, and international efforts to improve and protect 23
environmental quality shall be supported at the local level. 24
25
3) Development shall be sited to avoid significant geologic features, and to 26
permit future extraction of economically viable sand and gravel deposits. 27
28
4) New residential and commercial development in Berkshire is encouraged 29
to implement stormwater mitigation strategies, otherwise known as Low 30
Impact Development. 31
32
5) Intensive land development, including structures, shall be discouraged on 33
slopes greater than 25% and as much vegetative cover as possible shall 34
be maintained. 35
36
6) Only site modifications (grading and/or filling) incidental to a project shall 37
be allowed with minimal impact to existing surface drainage patterns. 38
39
7) To maintain or improve the quality of land through the consideration of 40
soil characteristics in determining its capability for development. 41
42
8) Development within agricultural and forested areas shall be discouraged 43

Berkshire Town Plan 2015 The Sense of Place
DRAFT Berkshire Town Plan 2015 49
on primary agricultural or forestry soils. 1
2
9) The town encourages agricultural and forestland be maintained for viable 3
economic use, encourages value added businesses, promotes locally 4
grown products, and encourages the implementation of 5
agricultural/forestry best management practices. 6
7
10) Forest fragmentation should be minimized through the Land Use and 8
Development Regulations. This may include defining forest fragmentation 9
and adoption of specific zoning standards. 10
11
11) Any development activity that degrades surface and/or ground water 12
quality shall be discouraged. 13
14
12) Streams, rivers, ponds, and wetlands shall be maintained in their natural 15
state, and be protected from pollution through appropriate health and 16
land use regulations. Local regulations shall provide buffer areas to 17
maintain the environmental, recreational, and scenic value of water 18
courses, water bodies, and shorelines. 19
20
13) Development within close proximity of streams and rivers shall be 21
compatible with the natural beauty of the area, shall protect existing 22
vegetation, shall be set back sufficiently to prevent erosion along stream-23
banks or pollution from subsurface sewage disposal systems, and where 24
possible shall retain visual and physical access to the water bodies. 25
26
14) Development shall be carefully sited in areas with a depth to ground 27
water of two feet or less, or in ground water Source Protection Areas. 28
29
15) Critical areas, particularly those of regional and/or state significance, shall 30
be protected from the adverse impacts of development. 31
32
16) Prohibit land development resulting in the loss of wetland storage 33
capacity or additions to the marsh areas of any substances which are 34
likely to increase the concentration of materials beyond the assimilative 35
capacities. 36
37
17) The public acquisition of land, development rights, or conservation 38
easements shall be considered where appropriate to ensure long-term 39
protection of particularly important critical areas and maintain open 40
space. 41
42
18) Encourage the protection and restoration of floodplains and upland 43
forested areas that attenuate and moderate flooding and fluvial erosion. 44

Berkshire Town Plan 2015 The Sense of Place
DRAFT Berkshire Town Plan 2015 50
1
19) Consider the use of River Corridors and buffers to discourage future 2
development in high risk areas for flooding or erosion hazards. 3
4
20) Consider strengthening the Flood Hazard Bylaws regarding land 5
development in the Special Flood Hazard Area to include standards 6
higher than the NFIP minimum standards and restrict uses to agriculture, 7
recreational and open space in order to increase public safety and 8
reduce future damages. 9
10
21) Incorporate mitigation measures when developing improvements or 11
expansion to municipal infrastructure. 12
13
22) Promote emergency planning for flood response. 14
15
23) Places of outstanding historical or educational value shall be protected 16
from development that unreasonably impairs their character or quality. 17
18
24) Development, which would adversely affect historical resources, including 19
destruction or alteration, isolation from or alteration of immediate 20
surroundings, or the introduction of disharmonious visual, audible, or 21
atmospheric elements, shall be discouraged. 22
23
25) Rehabilitation of significant historic sites and structures shall be en-24
couraged; and adaptive use of historic structures shall be emphasized 25
whenever it is economically feasible. 26
27
26) The public shall be encouraged to participate in the identification of 28
historic sites and structures, and in planning to preserve the Town's cultural 29
heritage. 30
31
27) Public uses and/or ownership shall be sought to preserve historic sites and 32
structures that are particularly significant to the community. 33
34
28) The State's Division for Historic Preservation shall be notified if development 35
is proposed within any area identified as being archaeologically sensitive 36
or historically significant; or if cultural artifacts or features are discovered 37
during the course of development. 38
39
29) Promote the Current Use Program to better manage and conserve 40
agricultural lands. 41
42
30) Promote the development of a management plan for the Town Forest. 43
44

Berkshire Town Plan 2015 The Sense of Place
DRAFT Berkshire Town Plan 2015 51
31) Conduct an inventory of forestland, natural resource features and existing 1
development to aid in the evaluation of the current land use district’s 2
effectiveness in meeting the Town’s goals. 3
4
32) To coordinate the preservation of forestland, agricultural land, and open 5
space throughout the Town to create connected corridors of 6
undeveloped land. 7
8

Berkshire Town Plan 2015 A Place for a Home
DRAFT Berkshire Town Plan 2015 52
1
2
3BA PLACE FOR A HOME 3
4
5 6
“East Franklin/Berkshire Townline” Photo By Arnold Byam 7
8
9
10
11
12
13
14
15
16
17
18
19
20
21
22
23
24

Berkshire Town Plan 2015 A Place for a Home
DRAFT Berkshire Town Plan 2015 53
1A) EXISTING HOUSING STOCK 1
2
Housing in Berkshire is a mix of isolated, rural residences and farms and small, 3
clustered settlements in the hamlets of West Berkshire, Berkshire Center, and East 4
Berkshire. As of the 2010 U.S. Census, there were 648 total housing units, 5
including 111 rented units, and an estimated 88 mobile homes. Since 2000 there 6
has been a 21.9% increase in year-round units, a rate that is similar with the 7
surrounding communities and continues to slowly rise 8
(Table 4.1). There are also 14 seasonal units, which 9
comprise 2.1% of the total housing stock. The number 10
of seasonal units has decreased 53.3% since 2000. 11
Based on census data, Berkshire has fewer seasonal 12
housing units than its neighboring communities, while 13
Franklin and Montgomery, with high seasonal 14
percentages due to Lake Carmi and Jay Peak, have 15
fewer year-round units. The Planning Commission 16
noted that the census data is under representing the 17
number of seasonal dwellings and may not be taking into account all the 18
hunting and summer camps in Town. 19
20
Table 4.1. Housing Units
1990 2000 2010
% Change Year Round (90-00)
% Change Seasonal (90-00)
% Change Year Round (00-10)
% Change Seasonal (00-10)
Year Round
Seasonal
Year Round
Seasonal
Year Round
Seasonal
Berkshire 439 35 520 30 634 14 18.5 -14.3 21.9 -53.3
Franklin 381 296 445 291 571 297 16.8 -1.7 28.3 2.1
Enosburg 1059 56 1,085 64 1209 62 2.5 14.3 11.4 -3.1
Richford 901 67 965 52 1009 64 7.1 -22.4 4.6 23.1
Montgomery 375 181 441 225 558 233 17.6 24.3 26.5 3.6
Franklin Co. 15,181 2,069 17,251 1,949 19,548 2,040 13.6 -5.8 13.3 4.7
Source: Decennial U.S. Census 1990, 2000, 2010
21
According to the U.S. Census, much of the growth in Berkshire’s housing stock 22
has occurred recently, beginning between 1970 and 1980 when the housing 23
stock increased by 42%. Since 1980, the housing stock has maintained relatively 24
higher rates of growth than pre-1970 at 13 and 16%, respectively each decade. 25 26
A housing unit is defined
as a house, apartment,
mobile home or trailer,
group of rooms or single
room occupied as
separate living quarters.
Or if vacant, intended for
occupancy as separate
living quarters.

Berkshire Town Plan 2015 A Place for a Home
DRAFT Berkshire Town Plan 2015 54
B) HOUSING PROJECTIONS 1
2
Berkshire is expected to grow as a bedroom community to supply housing to 3
workers in adjoining and nearby towns. According to 2011 U.S. Census LEHD 4
data, 12% of Berkshire workers are employed in Enosburg, 7% are employed in St. 5
Albans City, and 4% work in Richford. Another 22% of Berkshire workers 6
commute to Chittenden County. Based on existing household sizes (roughly 2.76 7
persons per year-round housing unit according to the 2010 U.S. Census) and 8
current population projections, Berkshire should need at least about 48-83 new 9
year-round units by the year 2020 and another 57-92 by the 2030 to house the 10
projected population. From 2000 to 2007, Berkshire passed an average of 15 11
building permits for new housing units. Since 2006, the number of building 12
permits has held closer to only 5 per year. This may be a local reflection of the 13
nationwide subprime mortgage crisis and subsequent economic downturn. 14
15
16
C) HOUSING CONDITIONS 17
18
The condition of the Town’s housing stock varies greatly, from older, decaying 19
homes to brand new structures. Many of the older houses in Town are well built 20
and provide relatively safe housing; a number have been restored to good 21
condition. According to the 2008-2012 U.S. Census, 32% of all housing units in 22
Berkshire were built before 1939. Another period of growth was from 1970-1999, 23
when 41% of the housing stock was built. The condition of a home is directly 24
related to the availability of funds to restore and maintain it. The Town should 25
consider setting up a housing rehabilitation program, funded with state 26
assistance (e.g., Vermont Community Development Program, or the Lake 27
Champlain Housing Trust Revolving Loan Fund), to improve the existing housing 28
stock, particularly for lower and moderate income residents. Such programs 29
have been successful in other communities in the state. 30
31
32
D) HOUSING COSTS AND AFFORDABILITY 33
34
According to property transfer records, median sale prices for primary 35
residences in Berkshire has more than doubled from $91,000 in 2000 to $200,000 36
in 2012 (Figure 4.1). While the main reason for the drastic increases in housing 37
sale prices was a booming housing market across the nation, housing sale prices 38
in communities around St. Albans and within and around Chittenden County are 39
much higher than those in Berkshire and the adjacent municipalities. The 40
housing market began to level off statewide in 2006 and 2007, and even more 41
so when a recession hit in 2008. While the number of sales and sale prices has 42
decreased slightly since the peak in 2005, the housing market is expected to 43

Berkshire Town Plan 2015 A Place for a Home
DRAFT Berkshire Town Plan 2015 55
remain stable in Vermont. 1
2
Safe, adequate housing 3
is inarguably one of our 4
most basic needs. It is 5
important to ensure that 6
adequate housing is not 7
the luxury of a select 8
few. Instead, a variety 9
of housing types (in 10
equally various price 11
ranges) needs to be 12
promoted to foster a 13
diverse community, 14
which is not 15
economically exclusive. 16
Housing which is 17
affordable for first-time 18
buyers, senior citizens 19
(often on fixed 20
incomes), and lower 21
income residents is especially important in this regard. 22
23
To define affordable housing, the state has 24
determined that 80% of the median 25
household income should be able to afford to 26
pay no more than 30% of their income on 27
housing. This definition is used as an indicator 28
for the availability of affordable housing in a 29
community. Homeownership housing costs 30
include not only the mortgage, but taxes and 31
insurance. In the case of rental units, the cost 32
is defined as rent plus utilities. According to 33
the 2008-2012 American Community Survey, 34
the median household income in the town of 35
Berkshire was $54,931. Low income 36
households are those in which income is less than 80% of the median or $43,945. 37
In excess of 30% of the households are considered “low-income” in Berkshire 38
(Table 4.2). 39
40
Using the state definition of affordable housing outlined above, Table 4.3 and 41
4.4 illustrate maximum affordable mortgages and rents in Berkshire with the 42
median sale price for a primary residence and median rent based on spending 43
no more than 30% of household income on housing. By comparing the 44
88BTable 4.2. 2012 Household
Income Distribution
Income
% of
Households
Less than $34,999 26.1
$35,000 to $49,999 16.3
$50,000 to $99,999 37.0
$100,00+ 20.6
Source: American Community Survey
2008-2012
Figure 4.1

Berkshire Town Plan 2015 A Place for a Home
DRAFT Berkshire Town Plan 2015 56
available income for homeownership for the median income and 80% of the 1
median income to the median sale price for primary dwellings, you can identify 2
if there is an affordability gap for residents. This analysis computed for 2012 3
indicates that housing is affordable for those earning the median county 4
income but for homeownership it is not affordable for lower earning households. 5
Renters falling in the “low” income category are still able to find an affordable 6
unit. 7
8
Table 4.3 Affordability Gap for Homeownership Costs in Berkshire
Percent
of HH
Median
Income
County
Median
HH
Income
30% of
Income
Per Month
Taxes &
Insurance
Income
Available
for
Housing
per
Month
Maximum
Affordable
Mortgage
Median
Sale Price
Primary
Residences
(2012)
Owner
Affordability
Gap
Median
(100%) $55,051 $1,376 $240 $1,136 $225,098 $180,388 $44,710
Low
(80%) $44,041 $1,101 $240 $861 $170,569 $180,388 ($9,819)
Very
Low
(50%)
$27,526 $688 $240 $448 $88,777 $180,388 ($91,611)
Very
Low
(30%)
$16,515 $413 $240 $173 $34,248 $180,388 ($146,140)
Data Source: Median Household Income (U.S. Census 2008-2012 ACS); Median Home Sale Price
in Franklin County (Vermont Housing Data); taxes and insurance (NRPC estimate); all other
figures computed by NRPC (30-year mortgage and 4.5% interest rate).
9
There are no dedicated low-10
income or senior housing units 11
within the Town of Berkshire. 12
However, the adjacent 13
communities of Richford and 14
Enosburg Falls have several 15
subsidized low-income and 16
senior housing units. These 17
communities are better suited 18
for low-income and senior 19
housing developments 20
because of their proximity to 21
services and walkable village 22
centers. The Town should 23
concentrate on providing 24
Table 4.4 Affordability Gap for Rental Costs in Berkshire
Income
Available
for
Housing
per
Month
Median
Gross Rent
Rental
Affordability
Gap*
Median County
HH Income
(100%) $1,376 $944 $432
Low HH (80%) $1,101 $944 $157
Very Low (50%) $688 $944 ($256)
Data Source: Median Household Income and median
gross rent (U.S. Census 2008-2012 ACS)
*Note this does not include cost of utilities.
Berkshire Town Plan 2015 A Place for a Home
DRAFT Berkshire Town Plan 2015 57
affordable housing opportunities to meet local community needs. Such efforts 1
could include the housing rehabilitation program mentioned earlier, providing 2
for some higher density and multiple housing unit development within the Town, 3
and also participation in a local or regional community land trust, a cooperative 4
effort between public and private interests. Funds, subsidies, or loan guarantees 5
available through such programs as the Farmers Home Administration (FmHA), 6
the Vermont Housing Finance Agency (VEFA), the state's Housing and 7
Conservation Trust Fund (HCTF) and Community Development Block Grants 8
(CDBG), are also intended to assist individuals and communities in meeting their 9
affordable housing needs. 10
11

Berkshire Town Plan 2015 A Place for a Home
DRAFT Berkshire Town Plan 2015 58
GOALS AND POLICIES: A PLACE FOR A HOME 1
2
GOAL 1: To provide safe and affordable housing for all segments of the 3
population. 4
5
Policies: 6
7
1) There should be a diversity of housing types and a choice between 8
renting and ownership to meet the needs and preferences of Berkshire 9
residents. 10
11
2) All primary housing, including both new construction and existing 12
buildings, should be safe, sanitary, and energy efficient. All households 13
should have a sufficient, safe water supply and means of sewage 14
disposal. 15
16
3) All new residential construction should be designed and phased so as not 17
to overburden local services and facilities, or negatively impact important 18
natural resources, including primary agricultural land. 19
20
4) Where possible, the existing housing stock should be kept as housing and 21
not be converted to other uses. The rehabilitation of existing housing units, 22
particularly for the provision of affordable housing, should be 23
encouraged. 24
25
5) Alternative housing finance arrangements and new ways of providing 26
affordable housing should be supported. 27
28
6) Second or seasonal home development should be carefully evaluated to 29
determine the potential for conversion to year-round housing, to evaluate 30
associated impacts on municipal facilities and services, and housing 31
affordability for permanent residents of the Town. 32
33

Berkshire Town Plan 2015 Earning a Living
DRAFT Berkshire Town Plan 2015 59
1
2
EARNING A LIVING 3
4
5
6 7
“East Berkshire” Artwork By Heather Mckeown 8
9
10
11
12
13
14
15
16
17
18
19
20
21

Berkshire Town Plan 2015 Earning a Living
DRAFT Berkshire Town Plan 2015 60
A) BRINGING HOME THE PAYCHECK 1
2
Historically, the presence of deep, fertile soils and the lack of major topographic 3
limitations have encouraged the agrarian trades (farming, forestry, and fishing) 4
in Berkshire. In the past, farming has provided a livelihood for many of the Town's 5
residents; however this employment sector has decreased in recent years. In 6
1980, 30% of workers were employed in agricultural jobs; the 2012 Census brings 7
it down to 9%. It is important to note that many in this industry sector are self-8
employed and therefore may be underrepresented by the census and state 9
reporting. Other types of employment opportunities in Berkshire include 10
manufacturing, retail trade, educational services, health services, and public 11
administration. 12
13
Seventy percent of Berkshire’s available workforce is classified as private wage 14
and salaried workers, the largest category, and fewer than 15% were self-15
employed. Most of the remaining worked at some level of government, from 16
local to federal. 17
18
There has also been a shift in where 19
people will travel for employment. In 20
2000, 82% of the employed population in 21
Berkshire worked within the County and 22
only 14% were commuting to Chittenden 23
County for jobs. According to 2011 24
Longitudinal Employment and Household 25
Dynamics data, which reports worker 26
location from unemployment insurance 27
coverage by the employer, 51% of the employed population in Berkshire worked 28
within Franklin County, while 40% worked within Chittenden County. Within the 29
County, Enosburgh Town and Enosburg Falls attracted the greatest number of 30
Berkshire workers at 15%, while St. Albans Town, St. Albans City, Richford, and 31
Swanton followed with 10, 7, 5, and 2.5% respectively. Outside the County, 32
Chittenden County draws 41% of Berkshire workers, with Burlington, South 33
Burlington, Essex and Colchester pulling in 10, 7, 6, and 6% respectively. 34
35
B) BUSINESS IN BERKSHIRE 36
There are several types of industry types (as defined by the VT Department of 37
Labor) located within the Town of Berkshire. These industries employ a 38
percentage of the Berkshire workforce, in addition to some workers in 39
neighboring communities who commute to Berkshire. The Vermont Department 40
of Labor reports that as of 2013 there are 13 establishments or employers 41
located in the Town, including construction, retail, and transportation industries 42
(Figure 5.1). The number and type of industries located within the Town has not 43
91BTable 5.1. Employment
Destinations for Berkshire Residents
2000 2011
Franklin County 82% 51%
Chittenden County 14% 40% Source: U.S. Census 2000, Longitudinal
Employment and Household Dynamics
2011.

Berkshire Town Plan 2015 Earning a Living
DRAFT Berkshire Town Plan 2015 61
Artwork by Heather McKeown
changed significantly over the last ten years but the number of jobs has 1
increased over time. 2
3
4
Home Based Businesses 5
Home based businesses are a major component of the local economy. Home 6
businesses, or home occupations, are especially common in rural towns like 7
Berkshire where many people work from their homes, either as a primary or 8
supplemental source of income. The advent of telecommuting, home offices, 9
and flexible job scheduling has made working from home even more prevalent. 10
Improving access to high-speed internet and cell service will increase the 11
viability of home based businesses. 12
Agriculture 13
The Town of Berkshire remains one 14
of the most important agricultural 15
communities in Franklin County 16
despite a decline in farming as a 17
source of employment over the 18
last few decades. Though the 19
number of active farms in the 20
Town has declined in recent 21
years, in part due to the federal 22
government's five-year “Whole 23
Herd Buy-out Program” that 24
began in 1985, the 25
discontinuation of the Northeast 26
Dairy Compact in 2001, and the 27
volatility of the price of milk, there 28
Figure 5.1

Berkshire Town Plan 2015 Earning a Living
DRAFT Berkshire Town Plan 2015 62
are still 55 parcels of land used for farming totaling 11,711 acres remaining in 1
Berkshire (2010 Grand List). As previously noted, these figures have been 2
decreasing over the past 20 years. National and international economic 3
pressures affecting the price of milk and the competiveness of smaller farms 4
continue to make farming increasingly difficult on Berkshire farms. Agricultural 5
enterprises in the area other than dairying include maple sugaring, beef and 6
veal production, goat farms, vegetable production, and cheese making. 7
Manufacturing and Service Industries 8
The settlements of Berkshire, East Berkshire, and West Berkshire provide a 9
minimum of goods and services, primarily gas and food, but also a car repair. 10
Based on local knowledge, commerce in the town consists of several beauty 11
salons, a convenience store, a gas station, a snack bar, four auto-repair shops, a 12
maple specialty shop, a dog kennel and a real estate office. Additionally there 13
is a woodworking business as well as a plumbing and heating contractor and a 14
saw mill. Town residents travel to the larger commercial centers of Enosburg 15
Falls, Richford Village, St. Albans, and in some cases Burlington, for shopping and 16
professional services. 17
18
19
C) INCOME AND WAGES 20
21
Between 2000 and 2012, the median adjusted gross income (AGI) of Berkshire 22
residents showed a 40% increase, from $24,462 to $34,227. The average annual 23
increase during this time 24
was approximately 3%. 25
While the median AGI in 26
Berkshire was still less than 27
the Franklin County 28
average in 2012, it is now 29
closer to the County 30
average than it was in 2000 31
(Figure 5.1). 32
Median adjusted gross 33
income is an average 34
based on individual tax 35
returns and is therefore 36
lower than household 37
income reported by the 38
U.S. Census (which may 39
include more than one tax 40
return). The 2012 median 41
household income in Berkshire is just below the median for the County and just 42
20,000
22,000
24,000
26,000
28,000
30,000
32,000
34,000
36,000
38,000
200
0
200
1
200
2
200
3
200
4
200
5
200
6
200
7
200
8
200
9
201
0
201
1
201
2
Inco
me
Year
Median Adjusted Gross Income Per Tax Return
Berkshire Franklin County Average Vermont
Figure 5.2

Berkshire Town Plan 2015 Earning a Living
DRAFT Berkshire Town Plan 2015 63
slightly higher than the State ($55,051 and $54,168 respectively). 1
2
The 2012 Census 3
indicates that the 4
percent of individuals 5
living below the 6
poverty level has 7
decreased since 2000. 8
The poverty level in 9
Berkshire is currently 10
lower than that of the County or State, which is the opposite of the trend in 2000. 11
The reduction in poverty rate may be attributed to rise in the median household 12
income to be closer to that of the County. 13
D) EDUCATION AND TRAINING 14
15
Many factors influence the attractiveness of a community to an employer 16
looking to relocate, including education levels. It is important for a community 17
to promote good access to education and training that lead to higher paying 18
jobs. Locally, post-secondary and continuing educational programs are 19
available through the Community College of Vermont (CCV) in St Albans, 20
Johnson State College in Johnson, and several colleges and universities in the 21
Burlington area, including the University of Vermont. Vocational training is 22
available through area high schools and the Enosburg Falls Vocational center. 23
Other vocational training opportunities are provided through such publicly 24
sponsored programs as Vermont Job Start and through private on-the-job 25
training programs. 26
27
The 2012 Census indicated that of the population 25 years and older, just over 28
39% of Berkshire's residents held at least a high school diploma. This is almost 29
equal to the County figure (38.4%) and higher than that for the State (31.2%). 30
The percentage of Berkshire residents with a bachelors degree or higher was 31
20.9%, while Franklin County was 22.3%, and the State was 34.2%. 32
33
E) FUTURE ECONOMIC DEVELOPMENT 34
35
Continued economic health for the Town of Berkshire lies in the maintenance of 36
a viable agricultural industry, principally dairying, supplemented by other forms 37
of agricultural activity and the provision of goods and services that support an 38
agrarian economy. The Town should encourage any efforts that support its 39
agricultural base, including the protection of primary agricultural soils and 40
farmers' rights to farm; support of tax abatement programs, such as the Use 41
Value Appraisal Program; and the possible diversification of agriculture, 42
including the support of value-added enterprises. 43
Table 5.2 Percent of individuals whose income in past
12 months was below poverty level.
1990 2000 2012
Berkshire 11.4% 13.6% 9.4%
Franklin County - 9.0% 10.2%
Vermont - 9.4% 11.6% U.S. Census 1990, 2000, American Community Survey 2008-2012.

Berkshire Town Plan 2015 Earning a Living
DRAFT Berkshire Town Plan 2015 64
1
At the same time, Berkshire residents are aware that agricultural employment 2
has been in steady decline, and more people must commute elsewhere to 3
work. Small commercial enterprises and light industry in appropriate locations 4
would complement the agrarian economy if they were in keeping with the rural 5
character of the Town and had no impact on the local environment. 6
7
The Town should encourage the development of home occupations, and small 8
businesses in or near the existing Village centers. The Town recognizes that a 9
particularly effective means to accomplish these goals, while at the same time 10
addressing residents’ expressed educational and environmental interests, would 11
be to continue to support high-speed (broadband) internet connectivity for 12
residents and businesses in the Town. Broadband internet connections 13
encourage and enable small and home-based businesses, and enhance 14
existing businesses in ways that current satellite connections cannot. To this end, 15
the Town should move proactively to become involved with the various 16
organizations working to bring internet connections to rural areas. This includes 17
supporting and closely monitoring the Vermont Broadband Council. 18
19
Tourists, attracted by the beauty of Berkshire's agricultural landscape, may also 20
play a greater role in the Town's economic future. Related development such 21
as inns, bed and breakfasts, farmers markets, craft shops, or eateries could add 22
to the local economic base. 23
24
Berkshire at this time does not have the municipal services to support larger 25
commercial enterprises and industry. It is anticipated that this type of 26
development will be located in the nearby service areas of Richford and 27
Enosburg Falls. For example, Richford has developed a small industrial park on 28
Route 105 not far from the Berkshire town line that may provide employment 29
opportunities for local residents. 30
31

Berkshire Town Plan 2015 Earning a Living
DRAFT Berkshire Town Plan 2015 65
GOALS AND POLICIES: EARNING A LIVING 1
2
GOAL: Promote a balanced, diverse economic base, with a focus on 3
locally owned enterprises. 4
5
Policies: 6
7
1) To encourage that agricultural and forest land be maintained for viable 8
economic use, encourage value added business, promote locally grown 9
products, and encourage the implementation of agricultural/forestry best 10
management practices. 11
12
2) Diversification of the economic base, including the development of 13
compatible businesses and light industry, and the promotion of home 14
occupations should be encouraged. 15
16
3) Economic development should be pursued to provide maximum 17
economic benefit with minimal environmental impact. 18
19
4) To promote opportunities for increased communications infrastructure, 20
such as broadband internet access, cell phone service, DSL and the like 21
while ensuring that infrastructure to develop these opportunities maintains 22
the rural character and does not impact scenic resources. 23
24
25
26
27

Berkshire Town Plan 2010 Providing for the People
DRAFT Berkshire Town Plan 2015 66
1
5BPROVIDING FOR THE PEOPLE 2
3
4 5
Photo by Jere Levin 6
7
8

Berkshire Town Plan 2010 Providing for the People
DRAFT Berkshire Town Plan 2015 67
A) MUNICIPAL GOVERNMENT 1
2
The Berkshire Town Hall, built in 3
1899, is an important local 4
landmark located in Berkshire 5
Center. The Town Hall houses all 6
municipal administrative and 7
treasury services as well as being 8
used for Selectboard meetings, 9
community meetings and voting. 10
Berkshire employs a clerk, an 11
assistant, auditors, zoning 12
administrator and listers to take 13
care of the daily administrative 14
needs of the Town and maintain 15
records. Until 2007, the Town Hall 16
was not used for municipal offices. 17
Its use was limited because the building’s only heating source was a wood 18
stove, it had no water service or fire protection systems, and was not ADA 19
compliant. The town built a small office next to the Town Hall to serve as the 20
municipal offices during this time; however, the Town quickly grew out of this 21
space. In response, during 2005 and 2006, the Town Hall was restored with the 22
use of funds from the Vermont Historic Preservation Program, the Vermont 23
Community Development Program and a municipal bond. In 2007, the Town 24
moved municipal offices back into the restored Town Hall and tore down the 25
small office building. Space and facilities at the Town Hall are now more than 26
adequate to serve the town for many years to come. 27
28
B) LIBRARY 29
30
The library is located in the village of East Berkshire in a Victorian house known as 31
the McKeown House, which is located next to Our Lady of Lourdes Catholic 32
Church on Route 105. Heather KcKeown, the owner, is also the Librarian. 33
Patrons can call in advance if they would like to browse or take out a book. The 34
collection contains over 4,000 volumes, both fiction and nonfiction, for adults 35
and children. New books are purchased by the librarian or donated by residents 36
in the town. 37
38
The library opened in September 1989 and is officially recognized by the state 39
although it has no paid staff, board of directors, or set hours of operation. The 40
work of readying the space for the initial, large donation of books was 41
accomplished by many volunteers, led by Heather, who also organized 42
fundraising events to raise money for the shelving, books, and other materials. 43
Berkshire Town Hall Before Renovations Photo by NRPC

Berkshire Town Plan 2010 Providing for the People
DRAFT Berkshire Town Plan 2015 68
The Berkshire Selectboard gave $1,250.00 in town monies towards the original 1
purchase of books; however it does not receive annual appropriations. 2
3

Berkshire Town Plan 2010 Providing for the People
DRAFT Berkshire Town Plan 2015 69
1
2 Map 6.1

Berkshire Town Plan 2010 Providing for the People
DRAFT Berkshire Town Plan 2015 70
C) EDUCATION 1
The School System 2
The people of Berkshire have long enjoyed an effective school system. Students 3
from Berkshire have historically performed well in high school, both in academics 4
and in extra-curricular activities, and have gone on to be successful in their post-5
academic lives. Numerous reasons for such achievements include community 6
support, teaching and staff quality, the intimacy of the school, and a sense of 7
shared responsibility. In addition, there is commitment to set high goals and 8
expectations among school personnel, parents, and community members. 9
10
Town residents consider the Berkshire Elementary School one of the community's 11
most valuable assets. Built in 1969, the elementary school currently houses 12
grades K-8 and as of the 2010-2011 school year, pre-K services are also 13
available. In 2014 the school built a new gymnasium which then allowed the 14
previous space to be converted into classrooms and other accommodations. 15
Based on current enrollment levels, the school can readily handle the capacity 16
of population. In the 2014-2015 school year, both the 4th and 5th grade 17
classrooms had to be split into two groups. To accommodate this action they 18
are currently utilizing all available space for teaching rooms; if larger class sizes 19
(>30 students) become common across multiple grades than additional 20
classroom space will be needed. School bus service is contracted. Berkshire 21
secondary students are presently enrolled as tuition students primarily in the 22
Richford and Enosburg Falls High Schools. 23
24
Enrollment Trends and School Capacity 25
As shown in Figure 6.1, enrollment at the Berkshire School has changed very little 26
over the last 15 years. Enrollment during the 2013 school year was just 8 students 27
less than in 1999. During approximately the same period (2000 to 2012), 28
population is estimated to have increased by 182 people. This indicates that the 29
population is aging and/or that families are having fewer children, as noted in 30
Section II. While the population is expected to increase over the next 20 to 30 31
years, the enrollment trends of the past 10 years indicate that school enrollment 32
will not experience proportional growth. 33

Berkshire Town Plan 2010 Providing for the People
DRAFT Berkshire Town Plan 2015 71
1 2
Other improvements at the school include providing computers and updating 3
technology. There are now computers in every classroom with high-speed 4
internet access. The purchase of updated equipment and training in its use has 5
been supported by local and federal funding. 6
7
Childcare 8
Childcare can be a growing concern for existing and prospective families, 9
including finding quality care and paying for its cost. High quality, available 10
childcare is a critical component supporting a stable workforce. As of 2013 11
there were close to 150 children under the age of 6 in Berkshire; 55% of these 12
children are in 2-parent families with both parents in the labor force and 22% are 13
in a 1-parent family that is working (2008-2013 American Community Survey). 14
Based on this data, the majority of young children has parents in the labor force 15
and will likely need access to childcare services. 16
17
According to the Vermont Dept. of Children and Families in 2014, Berkshire has 18
four registered childcare homes and one licensed early childhood center at the 19
school, currently serving 44 and 20 children respectively. Based on the 2013 20
estimate that there are 153 children under the age of 6 living in Berkshire, this 21
exceeds local childcare capacity by a large margin. 22
23
Given that the majority of residents commute outside Berkshire for employment, 24
residents may utilize services located in the neighboring communities of 25
Enosburg Falls and Richford. Enosburgh has a total childcare capacity from 26
registered home providers of 97 children and Richford has a total capacity for 27
59 children (Vermont Dept. of Children and Families, 2014). The 2008-2013 28
Figure 6.1

Berkshire Town Plan 2010 Providing for the People
DRAFT Berkshire Town Plan 2015 72
American Community Survey indicates that there are 161 children from birth to 1
age 5 living in Enosburgh and 126 children of that age living in Richford. If we 2
combine the childcare capacities in Berkshire, Enosburgh, and Richford, 150 3
children’s childcare needs are potentially not being met by local childcare 4
facilities (this is accounting for 70 spots in the other community’s school related 5
programs). It should be noted that this estimate does not tie in the needs of 6
children 6 and older who may need childcare. Data on other options, such as 7
siblings, stay at home parents, family care providers, un-registered childcare 8
homes or other opportunities, are not available. Therefore, there is currently no 9
indication of how the needs of the 150 children are being met. 10
11
D) WATER SUPPLY 12
13
Most Berkshire residents and businesses get their water supply from on-site wells 14
and springs. The community of East Berkshire is served the East Berkshire Fire 15
District #1, which as of 2013 provided water to approximately 187 connections 16
on the system. Users can include tenants in apartment buildings, five businesses, 17
and a dairy farm with tenant housing. 18
19
The existing source for this system from is a series of springs located in the Town of 20
Enosburg that, through a common collection pipe, feed a concrete reservoir 21
situated on a knoll southeast of the community at an elevation of 560 feet. The 22
storage reservoir, constructed in 1971, consists of a covered concrete basin with 23
a storage capacity of 75,000 to 80,000 gallons. From the reservoir, 24
approximately one mile of four inch and smaller cast iron and plastic water 25
mains service the community through connections; water use is not metered. 26
27
This water supply system is surrounded by 50 acres of land around the springs 28
owned by the First District to further protect the quality of the supply. This area is 29
incorporated into the Source Protection Area for the public water supply (See 30
Water Resources section). The Town of Enosburg has agreed to a buffer zone 31
around the spring to also protect the water quality. 32
33
While this system has met the demand at present, it does not meet current state 34
and federal standards required of public water systems. To address the 35
requirements, the Fire District is in the process of reviewing options for either 36
upgrading the existing water supply system with a treatment plant or 37
establishing a new well at a location in Berkshire. 38
39
Most of the growth within the Town will have to be accommodated through on-40
site systems. According to state ground water potential maps, the best areas in 41
Berkshire for high yielding wells are the gravel deposits associated with the 42
recharge area between West Berkshire and Enosburg Falls. Good ground water 43

Berkshire Town Plan 2010 Providing for the People
DRAFT Berkshire Town Plan 2015 73
potential for a public water supply exits underneath the community of West 1
Berkshire, and just west of Berkshire Center. Many local residents already draw 2
from these areas. There is no ready need to develop these ground water areas 3
for a public water system (a system that serves 10 or more users), but the Town 4
should consider ground water protection measures to meet existing and future 5
needs. 6
7
E) WASTE WATER TREATMENT 8
9
Residents are served by private on-site sewage systems. There is no municipal 10
sewage system in the town and no plan to develop one in the near future. 11
Problems with failing septic systems and leach fields have been noted in East 12
Berkshire on the west side of the Missisquoi River where in the past, poor soil 13
conditions and closely spaced buildings have resulted in direct discharge from 14
some individual systems into the river. In the late 1960’s, it was recommended 15
by a private consultant (Dubois & King) that the town consider installing 16
approximately 4,600 feet of gravity sewer and a 10,000 gallon septic tank and 17
leach field in East Berkshire, to be located just to the south of the community. 18
The Town did not pursue this option due to the then high costs of the proposed 19
facilities. It may be time to reconsider installing a community sewer system in 20
East Berkshire in order to permit a limited amount of growth, including higher 21
density, clustered residential, and commercial development near the existing 22
population center. 23
24
The Town does recognize the need to ensure that septic systems are properly 25
designed and installed to avoid septic system failure and water supply 26
contamination. Individuals wanting to install a septic system, to work on their 27
leach field, or to drill a well need to receive a Wastewater and Potable Water 28
Supply Permit from the Vermont Department of Environmental Conservation 29
(DEC). After July 1, 2007 new rules took effect which delegated the authority of 30
permitting private on-site water supply and wastewater systems entirely to the 31
State of Vermont rather than municipalities, unless a municipality applies for and 32
is granted delegation. Berkshire has not sought delegation and therefore does 33
not have authority to review or permit wastewater systems as was done prior to 34
2007. Any complaint or discovery of a failing septic system may be referred to 35
the DEC by the local Health Officer. 36
37
F) SOLID WASTE DISPOSAL 38
39
Berkshire has been an active member of the Northwest Vermont Solid Waste 40
Management District since its formation in January of 1988. The District has 41
adopted a comprehensive Solid Waste Management Plan, which is in 42
compliance with the State Solid Waste Management Plan, and has been 43

Berkshire Town Plan 2010 Providing for the People
DRAFT Berkshire Town Plan 2015 74
approved by ANR. The provisions of the District Plan, insofar as it is applicable to 1
the Town of Berkshire, shall be considered the management plan component of 2
the Town Plan. Residents must make their own arrangements with private 3
haulers for trash and recycling pick-up or visit a nearby transfer station. 4
5
A Supervisor, appointed by the town’s legislative body, represents each 6
member town on the District Board. Berkshire currently has a member 7
appointed by the Selectboard. Having a representative from Berkshire as part 8
of future District activities is an asset for our Town and should be continued. 9
10
Town residents are still concerned about the number of unregulated and 11
inadequately located and maintained junkyards that have appeared around 12
the Town in recent years. In response to this concern, the Planning Commission 13
worked with the Selectboard to draft and adopt a Junkyard Ordinance. 14
Municipal boards are hopeful that the ordinance with allow the town to 15
successfully enforce junkyard violations and eventually deter new accumulation 16
of junk within the Town. 17
18
G) EMERGENCY AND MEDICAL SERVICE 19
20
The Town of Berkshire maintains a volunteer fire department based north of East 21
Berkshire. A three-bay station, built with federal revenue sharing funds, was 22
completed in 1974. Present equipment includes a 1997 Freightliner pumper with 23
a 750-gallon booster tank and a 1000 gpm pump, a 2001 tank truck with 2200-24
gallon capacity a portable generator, and three portable pumps. The 2001 25
tank truck was converted from a milk truck that the McDermott family 26
generously donated to the town. This tanker replaced an old truck. A dry 27
hydrant is installed at Lussier’s pond on Water Tower Road for pumping when 28
needed. All dispatching is conducted out of central dispatch in St. Albans. 29
30
The Fire Department, made up about 20 volunteer members, answers an 31
average of 30 calls per year, and participates in mutual aid agreements with 32
neighboring communities. There is a constant need for more volunteers but 33
currently there are more than there have been in the past. The Fire Department 34
can usually meet the demand for service in town. However, more extensive 35
services and equipment are available from Enosburg and Richford, if needed. 36
37
Law enforcement protection is provided by the State Police, barracked in St. 38
Albans. It should also be noted that although no official contract exists with the 39
Franklin County Sheriff’s department, they will respond to a 911 call if they are in 40
the area. 41
42
The Community Health Center in Enosburg Falls and the Richford Health Center 43

Berkshire Town Plan 2010 Providing for the People
DRAFT Berkshire Town Plan 2015 75
provide care by general practitioners and pediatricians, as well as many other 1
health-care services. Berkshire contributes funds to both Enosburgh and 2
Richford to support ambulance services, which provide transportation to the 3
nearest hospital, the Northwest Medical Center in St. Albans, 25 miles away. 4
Other physicians, dentists, and optometrists maintain private practices in either 5
of these adjacent communities. Healthcare facilities are also considered 6
adequate for the near future. 7
8
H) RECREATION 9
10
Community recreation facilities in Berkshire include the playground and playing 11
fields at the Berkshire Elementary School in Berkshire Center. The original 12
facilities, funded through revenue sharing, were constructed in 1982, at a cost of 13
$18,000 to the Town. During the late 1990s, the Recreation Committee, headed 14
by Bea Lussier, held regular fundraisers to add new equipment. 15
16
Currently the facilities 17
consist of a soccer field 18
(added in 1989), a 19
basketball court, a 20
baseball field with 21
dugouts, a backstop, 22
bleachers, and a little 23
league outfield fence, a 24
play structure for climbing 25
and sliding (added in 26
1996), a sand volleyball 27
court, free standing 28
swings, slides, and spring-29
based “animals”, a 30
climbing dome, a 31
gazebo, a concession 32
stand/storage building, 33
and an equipment shed. 34
The facilities are open to 35
the public with scheduled 36
activities, primarily on the 37
ball field, continuing 38
through the summer. The 39
school also provides use of 40
its gymnasium to a 41
community group for regular volleyball games during the school year. 42
43
Little League Game (Photo by Loren Doe)
Little League Team (Photo by Loren Doe)

Berkshire Town Plan 2010 Providing for the People
DRAFT Berkshire Town Plan 2015 76
Recreation Committee 1
The Berkshire Recreation Committee is a volunteer group of Berkshire citizens 2
who work to improve recreational programs and facilities for the Berkshire 3
community. 4
5
Some of the current committee activities include: maintaining and improving 6
the playground, managing spring youth baseball and softball programs, a fall 7
youth soccer program involving 3rd and 4th graders, summer youth soccer camp 8
for all ages, winter youth basketball program for 3rd and 4th graders, a 9
discounted bowling program for all citizens of Berkshire, and an annual clean-10
up/fix-up day for all youth and parents. 11
12
The Recreation Committee raises revenue from annual fundraising and has 13
received an annual appropriation of $2,000 from the General fund since FY2008. 14
Funds raised and appropriated have been used to make many improvements 15
to the playground and ball fields located near the school as well as aid in 16
maintaining these facilities. 17
18
In 2014 the Recreation Committee received an $11,000 grant from the Vermont 19
Dept. of Buildings and General Services, Building Communities Grant program to 20
develop the Berkshire Golf Driving Range. This facility is planned to be open to 21
the community in 2015 and will provide another recreation opportunity to 22
residents as well as provide income for other recreational programs. 23
24
The work of the Recreation Committee continues to be completed, in large 25
part, by a committed group of volunteer parents and citizens who value access 26
to wholesome activities for skill building, physical fitness and just for fun. Many 27
people, both committee members and others willing to help, have given freely 28
of their time to help with these projects. Others have made significant monetary 29
donations. The Recreation Committee plans to continue their work into the 30
future as a not-for-profit corporation. 31
32
Trails and Other Recreation Opportunities 33
Besides a cross-country ski trail system in the woods on school property, Berkshire 34
residents have easy access to the Missisquoi Valley Rail Trail, an all season 35
recreational path along the former railroad right-of-way. The trail, which passes 36
through East Berkshire north of the intersection of Routes 118 and 105, begins in 37
St. Albans and links up with Canadian bike paths at the border in Richford. The 38
Town also owns a 100-acre parcel of forested land, the Berkshire Town Forest, 39
which could be developed for recreational and educational use. Town 40
residents voted in late 2004 to retain this land in municipal ownership. 41
42

Berkshire Town Plan 2010 Providing for the People
DRAFT Berkshire Town Plan 2015 77
The Missisquoi Bearcat Snowmobile Club includes both the towns of Richford 1
and Berkshire. In 2009, the club was responsible for maintaining 54.5 miles of 2
trails that run through Berkshire and Richford. The three trails that occur in the 3
Town of Berkshire are known as: VAST Rte 139, 4
VAST Rte 7, and VAST Rte 7A. 5
6
VAST Rte 139 begins in Richford at a trail 7
junction located on Hurtubise Island in the 8
center of Richford Village. The trail runs north to 9
the Canadian border and crosses Berry Road, 10
Mine Road, Hammond Road, Vt. Rte 118 in 11
Berkshire Center, Water Tower Road, Reservoir 12
Road, the Old Stagecoach Road, and joins 13
VAST Rte 7A behind the Stanhope Farm on 14
Water Tower Road. The Missisquoi Valley Rail 15
Trail is also known as VAST 7. 16
17
Funding for the building and maintenance of trails is provided by the Vermont 18
Association of Snow Travelers (VAST) through local clubs. VAST is the statewide 19
organization to which all of the local clubs belong. The Missisquoi Bearcat club 20
maintains the section of VAST Rte 7 that travels through Richford and Berkshire. 21
VAST Rte 7A in Berkshire runs roughly from North Sheldon to the Rail Trail behind 22
the Dairy Center. 23
24
With the exception of the Missisquoi Valley Rail Trail, the VAST trails in the 25
Berkshire area exist thanks to the local landowners who grant permission to build 26
trails and travel over the land only during snowmobile season. The snowmobile 27
season runs from the third Monday in December to the middle of April each 28
year. Each individual landowner agrees separately with the snowmobile club to 29
build and maintain trails. The trails are then considered part of the Statewide 30
Snowmobile Trail System (SSTS). 31
32
The Northern Forest Canoe Trail (NFCT) also provides a unique 33
recreational opportunity in the region. The Trail connects lakes, 34
rivers and streams from Canada into New England and New 35
York State. The NFCT brings a variety of paddlers into the region. 36
Supporting the recreation and tourism industries along the route 37
is part of the mission of the NFCT. 38
39
Although, traditionally much of the privately owned land in Berkshire has been 40
open to local residents for hunting and fishing, the last decade has seen an 41
increase in the posting of private land not only in Berkshire, but also statewide. 42
New development should be designed to ensure continued public access to 43
outdoor recreational opportunities in the Town. 44
Birch Stand (Photo by Jere Levin)

Berkshire Town Plan 2010 Providing for the People
DRAFT Berkshire Town Plan 2015 78
1
Other organized recreational facilities, including golf courses, tennis courts, 2
cross-country touring centers, and alpine ski resorts, are located in neighboring 3
towns, and it is likely that more of these facilities will be developed in the future. 4
Private facilities provide recreational opportunities for those who can afford it; 5
they also serve to attract tourists and seasonal or second home development. 6
The Town of Berkshire supports maintaining and enhancing recreational 7
opportunities for Vermont residents and visitors. 8
9
I) TRANSPORTATION 10
BIntroduction 11
Berkshire residents, as most residents of rural 12
towns, depend greatly on privately owned 13
motor vehicles and the local road network 14
to get around. Berkshire has a total of 63.8 15
miles of traveled roads within the Town, 16
including 12.6 miles of state highway, and 17
51.2 miles of Town highway (Class II and 18
Class III) (Table 6.1). There are also 9.2 miles 19
of Class IV roads, including pent roads, 20
within the Town. 21
22
State highways serve as connector routes to 23
other towns and carry through traffic as well 24
as local traffic. These highways are 25
numbered, repaired, and maintained by 26
the state. There are no Class I roads, which 27
form extensions of state highway routes, in 28
Berkshire. The Town receives state aid to 29
assist in the maintenance of Class II and III 30
roads, which must be negotiated on an annual basis. Class II roads are the most 31
important town roads, and are intended to carry heavier traffic loads in and 32
between towns. Class III roads serve more limited commuter traffic. All other 33
roads in the Town are designated as Class IV roads, and are not required to be 34
maintained year-round, as decided by the Selectboard. 35
36
Condition of Roads and Bridges 37
The condition of paving along state highways in the community ranges from 38
good to fair along Rte 108 and Rte 118. Rte 105 from Enosburgh to Richford is in 39
poor condition; this section of road will likely have some district leveling to 40
extend the life of the pavement in the coming years but it is not currently 41
91BTable 6.1. Mileage Summary
Town Highways:
Class I 0.00
Class II 15.65
Class III 35.56
Class IV 9.23
Trails ~7.44
Total 67.87
State Highways:
Route 105 3.700
Route 108 6.905
Route 118 1.565
Route 120 0.389
Total 12.55
9
Total Traveled Mileage (less
Class IV & trails):
63.76
9
Total Road Mileage: 80.48 Source: Vermont Agency of
Transportation, 2014

Berkshire Town Plan 2010 Providing for the People
DRAFT Berkshire Town Plan 2015 79
scheduled for rehabilitation. In terms of the state and town highway bridges, 1
improvements to several structurally deficient bridges have been made in the 2
past 10 years. In 2006, Bridge No. 26 which crosses the Trout River on Rt. 118 was 3
replaced because it was considered structurally deficient. In 2011, Bridge No. 30 4
which crosses the Missisquoi River in East Berkshire and considered a regional 5
priority was reconstructed to repair the bridge and railings. 6
7
There is concern over the increase in the amount of traffic on local roads in 8
recent years, particularly with regard to heavy truck traffic near East Berkshire 9
and weekend traffic on Richford Road and Berkshire Center Road (Town 10
Highways 3 and 5), which serve through traffic between Canada and the Jay 11
Peak ski area. Berkshire has made some major improvements in its road 12
network, including the paving of Water Tower Road (Town Highway No. 4), 13
formerly a Class II gravel road. Road surface conditions are generally good, 14
however some of the paved roads in Town are considered too narrow to safely 15
carry both vehicular and bike traffic, which has also increased in the past few 16
years. Speeding and the lack of directional and stop signs at major intersections 17
also have been identified as problems. 18
19
In 2007 the average daily traffic count (AADT) on West Berkshire Road (from the 20
Enosburg town line to the intersection with Berkshire Center Road) was 860. 21
Richford Road had an AADT of 870 and Berkshire Center Road (from the 22
intersection with VT105 to the intersection with Richford Road) has an AADT of 23
660 (Table 6.3). The traffic numbers decreased on West Berkshire Road and 24
Berkshire Center Road 25
since 2004, but 26
increased significantly 27
on Richford Road. 28
More recent data 29
(2011) was only 30
available for two of 31
the roads and show 32
the volumes are remaining steady. 33
34
The town will continue to apply for federal and state highway grants to upgrade 35
town highways and bridges as needed. Regular maintenance continues to 36
remain a priority. 37
Class 4 Roads 38
The Town of Berkshire, like many other towns, has a number of Class IV roads that 39
are very infrequently traveled. In most instances, these roads served past 40
economic industries that are no longer active, As a result, the roads have 41
deteriorated or been blocked off. Unless officially discontinued, the Town still 42
maintains the rights-of way and responsibilities of maintenance. Consideration 43
Table 6.2 Average Daily Traffic Counts
2004 2007 2011
West Berkshire Road 920 860 --
Berkshire Center Road 800 660 630
Richford Road 540 870 820
Data Source: Vermont Agency of Transportation 2013

Berkshire Town Plan 2010 Providing for the People
DRAFT Berkshire Town Plan 2015 80
should be given, therefore, to taking steps to declare portions of unused 1
highways as legal trails, pursuant to 19 V.S.A. 535. As such, the Town retains 2
ownership of the rights-of-way, but has no maintenance responsibilities. 3
Reversion of Class IV roads to legal trails would not preclude their being used for 4
land access; and, as legally designated trails, they might provide much needed 5
rights-of-way for public recreational use. As of 2015, these improvements and 6
reclassifications are not being actively considered however may become more 7
of a priority again in the future. 8
What Lies Ahead? 9
Recommendations for the future include updating road policies concerning 10
maintenance (particularly of Class IV and development roads), construction 11
standards for new roads (and sidewalks, if appropriate), and road reclassifi-12
cation. The Town should maintain a road improvement program (to be 13
included within a capital budget for the Town) so that the Town will be eligible 14
for funds, available on a competitive basis, from the Town Highway Aid 15
Program. Technical assistance in these areas is available from the Agency of 16
Transportation’s Planning Division and Local Technical Assistance Program 17
(LTAP). 18
19
Traffic patterns and road conditions may be influenced by changes in 20
agricultural operations and types of industry in the Town. They should be a 21
consideration in land use regulations as well as in future budget planning. 22
23
Rail Service 24
The railroads, once so important to the Berkshire community, have all but 25
vanished from the Town. No state rail improvements are scheduled. 26
27
Presently the nearest rail service for freight is in Richford (Canadian Pacific) and 28
St. Albans (New England Central). Amtrak passenger service is also available 29
from St. Albans. 30
Air and Bus Service 31
Berkshire has no air service within the Town. The Franklin County Airport in 32
Highgate supplies local air service. Larger interstate and international flights are 33
available at the Burlington Airport, and at Mirabel and Trudeau airports in 34
Montreal, Quebec. 35
36
Local passenger service is available from Green Mountain Transportation 37
Authority (GMTA) on a transit network (vans, mini-buses) for residents of Franklin 38
County with a shuttle service between St. Albans and Richford along Rte 105. 39
Rides can be coordinated by calling GMTA. In addition, the service currently 40
Berkshire Town Plan 2010 Providing for the People
DRAFT Berkshire Town Plan 2015 81
coordinates ride-share, Medicaid, and elderly transportation services. 1
Carpooling and Park and Rides 2
Given the rural nature of Berkshire and the reliance on automobile travel, 3
carpooling should be encouraged to decrease the amount of greenhouse 4
gasses released into the atmosphere, to conserve the use of oil and reduce 5
maintenance costs on personal vehicles. One important component of any 6
carpooling program is finding a suitable location where carpoolers can leave 7
their vehicles. 8
9
The closest formal carpool lot is the state park and ride facility along Rte 105 in 10
Enosburgh along Route 105 that accommodates 56 vehicles. This is the only 11
formal lot in northern Franklin County. The next closest lot is located in St. Albans 12
on Route 104. The Planning Commission should encourage carpooling at the 13
local park and ride by bringing awareness to the facility and the benefits of 14
carpooling such as the State’s Go Vermont program which provides registered 15
carpoolers with a Guaranteed Ride Home program. 16
Pedestrian and Recreation Paths 17
Sidewalks in East and West Berkshire were torn up and not replaced when streets 18
were widened and blacktopped. As a result, pedestrian traffic within these 19
population centers has been redirected onto the roads. Roads in town also are 20
being used increasingly by bicyclists and ATV users. Pedestrian and recreational 21
use of local roads is becoming more and more of a safety hazard to motorists 22
and others alike, given poor road conditions, greater motor vehicle traffic, and 23
the tendency of drivers to exceed the speed limit on village and back roads. 24
Biking, cross-country skiing, snowmobiling, hiking, horseback riding, etc. are 25
available on the rail trail (Missisquoi Valley Rail Trail). 26
27
Reinstallation of sidewalks in Berkshire's hamlets should be considered. 28
Moreover, the Town should consider providing designated areas (e.g., legal 29
trails) for recreational use. Again, local police enforcement of traffic laws should 30
be considered in order to more safely accommodate the multiple uses of Town 31
roads. 32
33
34
35
36

Berkshire Town Plan 2010 Providing for the People
DRAFT Berkshire Town Plan 2015 82
1 2
3 Map 6.2

Berkshire Town Plan 2010 Providing for the People
DRAFT Berkshire Town Plan 2015 83
J) ENERGY 1
Introduction 2
Vermont planning law requires that municipal plans include an energy element, 3
which is intended to plan for and promote the efficient and economic utilization 4
of energy in the community. While it is recognized that energy supply and 5
demand are directed largely by economic forces at the state, federal, and 6
international levels, there is a lot that can be done on a household and 7
community level to promote the use of renewable resources, to promote energy 8
efficiency, and to conserve energy. Energy conservation is an important step in 9
developing a comprehensive energy plan for the future of Berkshire. 10
11
Land use and energy are closely related. Land resources are used in the 12
production, transport, and disposal of energy products. Land use patterns exert 13
a strong influence on major end uses of energy, including transportation, 14
heating and cooling of buildings, and the energy used in developing 15
infrastructure. 16
Current Energy Use 17
Electricity 18
Vermont Electric Co-op (VEC) and the 19
Village of Enosburg Falls Electric Light 20
Department (EFELD) serve Berkshire 21
(Map 6.2). The Village of Enosburg 22
Falls Electric Light Department serves a 23
small area in the southwest part of 24
town and the Vermont Electric 25
Cooperative serves the rest of Town. 26
27
The Vermont Electric Cooperative 28
purchases power from a variety of 29
sources (Figure 6.2), the majority of 30
which derive power from 31
hydroelectric dams. About half of 32
VEC’s power comes from large hydro, 33
including Hydro Quebec, Niagara and 34
St. Lawrence (NY Hydro). The next largest portion comes from natural gas or oil 35
contracts from the New England power markets followed by large wind projects 36
supplied by the First Wind, LLC (Sheffield, VT) and Kingdom Community Wind 37
(Lowell, VT). The large wind systems replaced the prior utilization of Vermont 38
Yankee nuclear power in the portfolio. Some of VEC’s power comes from a 39
renewable farm based methane recovery generation system located right in 40
Berkshire. 41
Map 6.3

Berkshire Town Plan 2010 Providing for the People
DRAFT Berkshire Town Plan 2015 84
1
High-voltage electricity produced and/or purchased by VEC and EFELD moves 2
long-distances through transmission lines across the region. The Enosburg Falls 3
Electric Light Department maintains single-phase distribution lines, but no 4
transmission lines within Berkshire. 5
6
7 8
The VEC has about 681 members in the town of Berkshire. They maintain 9
distribution and transmission lines and a substation in the Town. Substations 10
reduce, or step down, the high-voltage electricity so it can be moved along the 11
distribution system. The transmission and distribution lines are the smaller poles 12
and wires on streets that connect to individual homes or businesses. The sub-13
station is located three-quarters of a mile north of East Berkshire on the west side 14
of Route 105. Transmission lines roughly parallel Route 105 from Richford to 15
Enosburg, through East Berkshire. VEC makes improvements to lines and 16
substations as needed; improvements are planned for 2015 to upgrade the 17
existing substation. 18
19
According to data collected by the Vermont Department of Public Service in 20
2013, the EFELD residential rates ($0.1604) were lower than VEC’s rates ($0.1873). 21
VEC’s residential rates were second most expensive in the state at over 18 cents 22
per kWh. EFELD rates were just below the average (16.23 cents per KWh). Figure 23
6.3 shows average electric utility customer rates in 2013 across all customer 24
types (residential, commercial, industrial). 25
26
Overall, Vermont’s electrical rates have generally stayed stable over time and 27
have not experienced the same sharp increases seen elsewhere in New 28
England. In the past the price stability in Vermont was largely due to the fact 29
that the two largest sources of power, Hydro Quebec and Vermont Yankee 30
Figure 6.2

Berkshire Town Plan 2010 Providing for the People
DRAFT Berkshire Town Plan 2015 85
have been under long-term contract. In 2011, Vermont entered a 20-year 1
contract with Hydro-Quebec and Vermont Yankee stopped power production 2
in 2012. Thus, in the coming years Vermonters, including the residents of 3
Berkshire, should monitor decisions regarding energy sources and costs of 4
electricity. 5
6
7 8
Heat 9
As shown in Table 6.3, 10
fossil fuels are the 11
primary source of home 12
heating fuel in Berkshire 13
by a wide margin. Fuel 14
oil and kerosene heat 15
50% of all occupied 16
housing units in the 17
Town, compared to 18
42.6% in Franklin County. 19
This difference may be 20
explained by the lack of 21
utility gas available in 22
Berkshire, which is used 23
in 21.7% of all homes in 24
the county. 25
26
94BTable 6.3. Home Heating Fuel Type
Berkshire Franklin County
Utility Gas 1.0% 21.7%
Bottled, Tank or LP 12.3% 13.4%
Electricity 0.0% 2.2%
Fuel Oil/Kerosene 50.3% 42.6%
Coal/Coke 0.0% 0.1%
Wood 34.6% 18.1%
Solar 0.0% 0.0%
Other Fuel 1.0% 1.6%
No Fuel Used 0.7% 0.3%
Source: American Community Survey 2009-2013
Figure 6.3

Berkshire Town Plan 2010 Providing for the People
DRAFT Berkshire Town Plan 2015 86
Renewable Energy Opportunities 1
Locally generated power from renewable sources, such as solar, wind, biomass, 2
and methane, can provide cost saving and environmental benefits for Vermont 3
municipalities. The more power produced locally (on a household or 4
community basis), the less dependent the State is on non-renewable and/or 5
non-locally produced power. Several potential renewable sources of energy 6
are locally feasible in Berkshire. Additionally State and Federal incentives make 7
some of these sources more economically viable. These opportunities should 8
continue to be considered. 9
10
Wood 11
According to the 2000 U.S. Census, 20% of all occupied housing units in Berkshire 12
use wood as a primary source of heating fuel; in 2013 the number of households 13
increased to near 35%. With an abundance of woodlands in Berkshire and the 14
surrounding region, use of wood as a primary home heating fuel has the 15
potential to continue in the future. With careful management, local forests 16
could provide a sustainable, local fuel source that promotes local economic 17
activity at an affordable cost per BTU. 18
19
In addition to using wood-stoves as a heating source on an individual household 20
basis, the clean combustion of wood chips and wood pellets for heat and 21
electricity production is another method of producing energy from local, 22
renewable timber resources. This method of electricity generation has been 23
promoted by the Vermont Department of Public Service, including a program 24
directed at heating schools. 25
26
Biogas 27
There is great potential in Vermont for anaerobic digestion and methane 28
recovery as an energy source from a variety of sources including manure, 29
industrial waste, and solid waste. The number of methane digesters on farms is 30
growing in Franklin County as dairy farmers are recognizing not only the energy 31
potential, but environmental and economic benefits as well, including 32
Berkshire’s own Berkshire Cow Power. The increased availability and continued 33
development of technology in this type of energy production should make this a 34
more feasible option for more and more farmers in Franklin County. 35
36
Wind 37
Given the topography of the town of Berkshire with a few elevated ridge lines, 38
wind could be considered as a local renewable source for energy generation 39
for residential sized systems (VT Energy Atlas). Wind turbine technology and 40
affordability continues to improve. Small-scale wind turbines for residential, 41
business, or farm applications typically range from 5 to 15 kilowatts and typically 42
stand around 80 to 100 feet tall. To produce electricity on a larger scale, the 43

Berkshire Town Plan 2010 Providing for the People
DRAFT Berkshire Town Plan 2015 87
installation of larger turbines is necessary, which can range in size from 150 feet 1
to 400 feet (U.S. Department of Energy, 2009). Large wind installations might be 2
owned by a utility or be privately developed to sell power to a utility, or to 3
supply power to a commercial or industrial user. 4
5
Some people hold the belief the presence of wind turbines can detract from the 6
aesthetic value of a place. This should be considered by decision makers and 7
community members in Berkshire. 8
9
Solar 10
Solar power generation has been proven to be viable even in Vermont’s 11
northern climate. However, given the climate and latitude this type of 12
renewable energy generation is best used in combination with other sources. 13
Solar systems can range from simple sunspaces for passive solar to advanced 14
solar electric systems with photovoltaic cells or solar hot water systems. Every 15
year, technological advances make the systems more efficient, dependable, 16
and cost effective. Technological advances like the incorporation of 17
photovoltaic components in roofing and siding materials may make solar power 18
an even more viable source of electricity in the near future. 19
20
Aside from power or heat generation, there is the opportunity to harvest solar 21
energy through proper siting, orientation, and design of structures. With passive 22
solar construction techniques for space heating and natural lighting buildings 23
can be more energy and cost effective. 24
Energy Efficiency and Conservation 25
Even with increased sources of renewable energy generation it is important to 26
focus on reducing energy use and making the use of energy as efficient as 27
possible. This will lead to the greatest to savings on energy costs. Additionally as 28
less energy is demanded, a greater percent of the energy needs can be 29
supplied by renewable and local sources. At the local level, concerns related to 30
energy efficiency and conservation, generally fall into four categories: town-31
owned or town-maintained buildings, utilities, and vehicles; private energy use in 32
residences and businesses; development patterns and the construction and 33
siting of buildings; and energy used for transportation. 34
Municipal Energy 35
The Town can take several steps to ensure that efficient use of energy and the 36
development and implementation of renewable energy resources are 37
supported. Municipal energy savings can be realized through energy audits of 38
municipal buildings and the use of “life cycle costing” practices that include 39
long-term energy savings in the analysis of facility construction and purchase of 40
new equipment. Such costing methods may demonstrate that long-term 41
energy savings outweigh the higher initial purchase or construction cost of 42

Berkshire Town Plan 2010 Providing for the People
DRAFT Berkshire Town Plan 2015 88
energy efficient equipment and building improvements. The Selectboard is 1
authorized by Vermont Statute to appoint an energy coordinator and/or an 2
energy committee as an official resource to town planners. Since local 3
information on the use of energy is limited, an energy coordinator or committee 4
may be able to collect valuable data to further energy planning in town. 5
6
According to statute, an energy coordinator and/or committee would work 7
towards the more efficient and economical utilization of existing and potential 8
energy resources and with that in mind, could coordinate energy resources 9
within the town, cooperate with the Planning Commission and with those 10
federal, state, and regional agencies of government responsible for energy 11
matters, and study and evaluate alternative sources of energy. The Planning 12
Commission supports the creation of an energy coordinator and committee in 13
Berkshire. 14
15
Homes and Businesses 16
While the Town has less direct control over private energy use, it is possible to 17
encourage weatherization, the use of improved windows, the installation of 18
insulation, and the use of renewable energy resources. Efficiency Vermont is the 19
nation's first statewide provider of energy efficiency services and is available to 20
provide technical assistance and financial incentives to Vermont households 21
and businesses to help them reduce their energy costs with energy-efficient 22
equipment and lighting as well as energy-efficient approaches to construction 23
and renovation. 24
25
The farming community has been specifically targeted by utilities for assistance 26
in increasing efficiencies and reducing electrical costs. VEC offers programs to 27
help reduce energy demand through conservation. Statewide efforts aimed at 28
agriculture include proposals to improve energy efficiencies in farm buildings 29
and machinery. Alternative technologies which produce new sources of 30
renewable energy are increasing in popularity, including digesters which 31
capture methane for use as an energy source. 32
33
Development Patterns, Building Siting and Design 34
The significance of land use related impacts on energy consumption and 35
conservation are often underestimated. Dispersed settlement patterns put a 36
greater strain on energy supplies by increasing transportation related energy 37
consumption, and by reducing space efficiencies in the delivery of essential 38
services. Reliance on automotive travel for work, school, shopping, and 39
recreation also results in greater energy expenditures for both individuals and 40
municipalities. By encouraging future development in concentrated areas, the 41
town will achieve better efficiency in the delivery of existing essential services, 42
such as fire and rescue services, solid waste pick-up, and mail delivery. 43
44

Berkshire Town Plan 2010 Providing for the People
DRAFT Berkshire Town Plan 2015 89
The Town’s current zoning bylaws encourage planned unit developments 1
(PUDs), which require that buildings be clustered for more efficient uses of land 2
and energy resources. PUDs facilitate the adequate and economic provision of 3
streets and utilities and preserve the agricultural, forested, natural and scenic 4
qualities of the Town. PUD’s are widely used tools in land use planning because 5
they can promote energy efficient siting and design. PUD’s and other 6
innovative techniques should be utilized wherever possible and appropriate. 7
8
The way that buildings are sited and constructed can affect the amount of 9
energy needed to access and use them. Development regulations can include 10
incentives to site buildings with south facing orientation for maximum solar gain, 11
use trees for wind breaks and shade, use appropriate glazing (windows) on the 12
south wall, install “thermal mass” (such as concrete, brick, quarry tile, or water) 13
to store the sun’s energy, employ high levels of insulation, and use solar water 14
heating. 15
16
Transportation 17
Transportation accounts for a significant amount of energy demand, which can 18
be reduced through conservation efforts. Ridesharing and encouraging local 19
and home businesses help reduce transportation related energy consumption, 20
and promote economic vitality in accordance with state energy goals. 21
22
According to the 2008-2012 American Community Survey, around 72% of all 23
Berkshire commuters drive alone to work, while 12.5% carpool. Given that the 24
mean travel time to work is around 30 minutes, travel to work results in significant 25
energy consumption by the Town. Alternatives to single occupancy work trips 26
would greatly decrease energy demand and pollution resulting from the 27
combustion of fossil fuels. Some alternatives include constructing park and ride 28
lots to encourage carpooling or promoting the use of lots in adjacent 29
communities such as Enosburgh. Additionally the Town can seek ways to 30
develop the local and regional economy to decrease the necessity for long 31
distance commuter trips. 32
33

Berkshire Town Plan 2010 Providing for the People
DRAFT Berkshire Town Plan 2015 90
GOALS AND POLICIES: PROVIDING FOR THE PEOPLE 1
2
GOAL 1: Make efficient use of public funds to maintain a sound fiscal 3
balance. 4
5
GOAL 2: Ensure reasonable, functional and orderly development of all 6
utilities, facilities, and services. 7
8
GOAL 3: Provide Town residents with the best possible education and 9
childcare opportunities without overburdening the town’s resources. 10
11
GOAL 4: Maintain and enhance recreational opportunities for Vermont 12
residents and visitors. 13
14
GOAL 5: Provide and maintain a safe, economical, and functional 15
transportation network for vehicular, pedestrian, and recreational 16
use within the Town. 17
18
GOAL 6: Conserve energy and encourage the use of renewable energy 19
resources. 20
21
GOAL 7: Promote land settlement and economic development patterns that 22
minimize energy demand. 23
Policies: 24
25
1) The rate of growth should not exceed the ability of the Town of Berkshire 26
to provide facilities and services. 27
28
2) The development and provision of municipal facilities and services should 29
be based upon a determination of existing need, a projection of 30
reasonably expected population increase and economic growth, and 31
upon the recognized limits of local finances and natural resources. 32
33
3) Public investments, including the construction and expansion of 34
infrastructure, should be made to remedy existing problems, to promote 35
timely and orderly land development, and to carry out the purposes of 36
this plan. 37
38
4) Capital investments, including the development or extension of 39
infrastructure, should not be made to decrease the resource value of, or 40
increase the development pressure on important agricultural land. Tax 41
incentive programs, the acquisition of development rights and 42
easements, and other methods of ensuring the continuation of agriculture 43

Berkshire Town Plan 2010 Providing for the People
DRAFT Berkshire Town Plan 2015 91
should be encouraged. 1
2
5) The Town supports broadening access to educational, childcare, and 3
vocational training opportunities. 4
5
6) The Town should conduct an annual review of road conditions in Town 6
and develop a maintenance schedule and transportation capital 7
improvements plan based upon these findings. The Town should continue 8
to develop road policies for the construction, maintenance, and 9
reclassification of town roads. 10
11
7) New construction or major reconstruction of roads and highways in the 12
Town should identify the feasibility of accommodating all users by way of 13
paths, sidewalks, or shoulders wide enough for use solely non-motorized 14
means of transportation, when economically feasible or in the public 15
interest. 16
17
8) Sidewalk or pedestrian facilities should be provided in populated areas, 18
including the hamlets of East and West Berkshire, and alternative 19
recreational paths for public use should be designated by the Town 20
where appropriate. 21
22
9) Roads should not be extended into important resource areas, including 23
critical areas, ground water source protection areas, and important 24
agricultural lands. 25
26
10) Road identification, direction, and traffic control signs should be erected 27
at appropriate locations throughout the Town. 28
29
11) All future roads, including culverts and ditching, that are to be taken over 30
and/or maintained by the Town should be designed to standards 31
approved by the Selectboard and should be appropriately marked. 32
33
12) Unnecessary "curb cuts" should be avoided, and appropriately, screened 34
off-street parking should be provided for commercial and high-density 35
residential development. 36
37
13) Promote carpooling among area residents and encourage the use of the 38
nearby state park and ride lot. 39
40
14) Opportunities for making town owned buildings more energy efficient will 41
be sought. 42
43
15) Enable public and private installation and application of appropriately 44

Berkshire Town Plan 2010 Providing for the People
DRAFT Berkshire Town Plan 2015 92
sited, small scale renewable energy production systems, such as wind 1
energy conversion and photo voltaic systems by including appropriate 2
provisions in municipal regulations. 3
4
16) Promote energy efficient siting, design and density of development 5
through local permit processes by including language in municipal 6
regulations. 7

Berkshire Town Plan 2015 Keeping it Rural in the Future
DRAFT Berkshire Town Plan 2015 93
1
2
“KEEPING IT RURAL” IN THE FUTURE 3
4
5
6
Artwork by Heather McKeown 7
8
9
10
11
12
13
14
15
16
17
18
19

Berkshire Town Plan 2015 Keeping it Rural in the Future
DRAFT Berkshire Town Plan 2015 94
Earlier sections of this plan address the Town's history, natural and cultural 1
resources, available community facilities and services, and past and anticipated 2
trends in Berkshire's growth and development, all of which affect the way that 3
land is used. The ultimate goal of this planning process is to be aware of past 4
and existing land use, and project the future land requirements for the Town. 5
Land use planning is not meant to stop development. If properly implemented, 6
identifying suitable locations for development allows the community to provide 7
for orderly growth while preserving its character. Land use planning gives the 8
Town the opportunity to choose its future, provide a balance between the 9
natural and built environment, and preserve the traditional settlement patterns, 10
village centers, and rural landscapes that contribute to its identity and sense of 11
place. 12
13
Many rural Vermont communities are faced with high growth and development 14
pressures, including Berkshire. Residents of these communities are concerned 15
that uncontrolled growth threatens the traditional landscape of compact 16
village centers surrounded by open fields and wooded hillsides. While Berkshire 17
retains much of its traditional agrarian landscape and agriculture remains vitally 18
important to the community, new residential development is happening 19
primarily outside the traditional village centers. Faced with the changing forces 20
that growth presents, planners are challenged with maintaining the rural 21
agricultural character and small village setting, while accepting and 22
accommodating a fair share of residential development in the greater region. 23
24
Berkshire primarily uses zoning and subdivision regulations to manage growth. 25
These regulations are adopted in the Berkshire Land Use and Development 26
Regulations (2007). Zoning regulates the location, type, and density of 27
development within a community through the delineation of zoning districts. 28
Subdivision regulations control the pattern of development and the way land is 29
divided up to accommodate land uses and supporting infrastructure such as 30
roads and utilities. These regulations should be evaluated and updated on a 31
regular basis in response to Town Plan updates. The Berkshire Land Use and 32
Development Regulations divide the town into four (4) zoning districts, which are 33
intended to guide the direction and placement of future growth within the Town 34
of Berkshire. This plan recommends a few minor changes to this map, as shown 35
on Map 7.1. A discussion of current land use trends and associated 36
development recommendations for each district is provided below. 37
Implementing these recommendations will help the Town manage the location, 38
amount, intensity, and character of land uses and timing of development 39
relative to provision of community facilities and services. 40
41
42

Berkshire Town Plan 2015 Keeping it Rural in the Future
DRAFT Berkshire Town Plan 2015 95
A) SOURCE WATER PROTECTION DISTRICT 1
2
The Source Water Protection District encompasses the Source Protection Areas 3
for the East Berkshire Water Cooperative and the Enosburg Falls Water System. 4
The purpose of the District is to maintain or improve the quality of these water 5
resources, including surface and ground waters, and to ensure that surface 6
water bodies and corridors are protected and well-managed. Limited 7
residential development should be allowed only as a conditional use. 8
9
B) RURAL LANDS DISTRICT 10
11
The Rural Lands District encompasses the majority of land area in the Town of 12
Berkshire, excluding the village centers, flood hazard areas, and source water 13
protection areas. The purpose of the Rural Lands District is to conserve the 14
integrity and natural qualities of the agrarian tradition and rural open space for 15
the betterment and future use of the community. The forest and the agricultural 16
character of the District will be maintained, while allowing for rural residential 17
development and compatible commercial establishments at a density the land 18
can support without central water or sewage disposal. 19
20
Agriculture, Forestry, and Forested Land 21
Retaining land in agriculture is critical to the continued vitality of farming in the 22
Rural Lands District. Agricultural land is highly susceptible to development 23
pressures as it often has soils well suited for development. The preservation of 24
productive agricultural lands and primary agricultural soils need to be balanced 25
with the need for some growth. 26
27
Forested land covers much of the Rural Lands District. Much of this land is 28
unsuited for development because of poor soil and slope conditions and its 29
importance for wildlife habitat. Many of Berkshire’s forests are well-suited for use 30
as small woodlots and low impact recreation, as well as some limited 31
opportunities for larger scale forest industries. However, there are also wooded 32
areas in Town that can provide a quiet, secluded setting for lower density 33
residential development. 34
35
Important agricultural and forestry land in the Town should be identified using a 36
"LESA" program. LESA, short for Land Evaluation and Site Assessment, is a 37
method by which important agricultural and forestry land can be identified and 38
earmarked for conservation or protection measures. This method takes into 39
account economic factors related to production, and the intent and desires of 40
the farmer, as well as soil suitability in determining the value of a particular farm 41
or parcel to the community. 42
43

Berkshire Town Plan 2015 Keeping it Rural in the Future
DRAFT Berkshire Town Plan 2015 96
Agricultural and forestry land should be protected through owner participation 1
in tax incentive programs (current use), the purchase of development 2
rights/conservation easements, and appropriate development controls. The 3
development of agricultural land if necessary should be located on wooded 4
and scrub pasturelands that are in limited production and less critical to farming 5
operations or at field edges. Development on agricultural and forested lands 6
should be clustered to retain as much land as possible in production, forest, or 7
open space. 8
9
Residential Development 10
Residential development, including seasonal home development, is expected 11
to account for the majority of land demand in the near future, with the pressure 12
for growth coming from Enosburg Falls, Richford, St. Albans, Canada, and to a 13
limited extent the Burlington area. While clustered, high-density residential 14
development is encouraged in the Expanded Village Districts, it is also expected 15
that a significant amount of residential development will continue in the Rural 16
Lands District. Careful siting and layout of residential development will limit 17
impacts on rural character, agricultural and forestry uses, wildlife habitat, and 18
environmental sensitivities. Development shall avoid agricultural and forestry 19
lands preserving them from fragmentation and conversion. Planned unit 20
developments and clustering of development is encouraged. 21
22
Home Business and Other Rural Commercial Development 23
Home businesses that maintain the working rural landscape of the Berkshire 24
countryside are encouraged to continue as a significant part of the Rural Lands 25
District. There is a place for other commercial development in the Rural Lands 26
District only to a limited extent. It should be carefully reviewed to assure that the 27
rural character of the area is maintained and there are no undue impacts on 28
existing residential, agricultural, and forestry land uses. Zoning bylaws should 29
allow some limited commercial uses only after conditional use and site plan 30
review in the Rural Lands District. Appropriate landscaping and screening is 31
important so that commercial uses blend in with the countryside. 32
33
Light Industry and Earth Resource Extraction 34
There may be appropriate locations for light industry and earth resource 35
extraction in the Rural Lands District. These potentially high-impact uses should 36
be carefully designed to avoid adverse impacts to the local environment, 37
adjacent land uses and community facilities and services. Zoning should allow 38
light industry and earth resource extraction in the Rural Lands District only after 39
conditional use and site plan review. The character of the area can often be 40
maintained through vegetative buffers or screening, and other appropriate land 41
use regulations. Sand and gravel pits in particular, should come under careful 42
public review in order to avoid the many adverse impacts that are often 43
associated with them. In particular, erosion, ground water protection, and site 44

Berkshire Town Plan 2015 Keeping it Rural in the Future
DRAFT Berkshire Town Plan 2015 97
reclamation plans should be developed. 1
2
C) EXPANDED VILLAGE DISTRICT 3
4
The purpose of the Expanded Village Districts is to maintain and support the role 5
of the village as the focus of many social and economic activities in Berkshire 6
and to provide for residential, commercial and other compatible development 7
that serves the needs of the community. Development should maintain the 8
traditional density and overall social and physical character of the villages, 9
including historic and scenic resources. It should also not exceed the capability 10
of the lands, waters, services and facilities to accommodate such density. 11
Continuing the mix of residences, civic and non-profit uses and commercial 12
establishments is encouraged. 13
14
The Expanded Village Districts currently lack any pedestrian amenities. East 15
Berkshire, the largest of the 3 village areas, would benefit from sidewalks and 16
crosswalks for a more pedestrian friendly streetscape. Zoning standards for East 17
Berkshire should require pedestrian amenities and include standards for 18
landscaping, parking, and signs. Off-street parking should be screened and 19
located to the side or rear of a building and signs should be scaled and 20
designed to complement the village character. 21
22
The desirability of locating higher density development near existing centers 23
supports the need for a centralized sewer system in East Berkshire. In West 24
Berkshire and Berkshire Center on the other hand, there are a few soils that can 25
accommodate higher densities of development. In these areas, development 26
should be designed and sited to protect local recharge areas and groundwater 27
quality. 28
29
D) FLOOD HAZARD AREA OVERLAY DISTRICT 30
31
Designation of this area is required for continued participation in the National 32
Flood Insurance Program (NFIP) and is regulated under the Town’s Flood Hazard 33
Ordinance. Included are all areas in Berkshire identified as areas of special 34
flood hazard on the National Flood Insurance maps. The purpose of the Overlay 35
District is to prevent health and safety hazards and to minimize property 36
damage due to flooding. 37
38

Berkshire Town Plan 2015 Keeping it Rural in the Future
DRAFT Berkshire Town Plan 2015 98
1 Map 7.1

DRAFT Berkshire Town Plan 2015 99
GOALS AND POLICIES: KEEPING IT RURAL IN THE FUTURE 1
2
GOAL 1: To maintain the rural, agricultural character of the Town of Berkshire, 3
including the historic settlement pattern of small hamlets separated 4
by rural countryside. 5
6
GOAL 2: To protect important natural resources and agricultural use of the 7
land, while at the same time providing sufficient space in 8
appropriate locations for residential, commercial, industrial 9
development, and for community facilities. 10
Policies: 11
12
1) Clustered development, including Planned Unit Developments (PUDs), 13
shall be encouraged where feasible and appropriate in order to protect 14
and maintain important farmland, forestland, and open space. Strip 15
development shall be discouraged. 16
17
2) Only development incidental to agricultural production should occur on 18
important agricultural lands. Good management practices, participation 19
in tax incentive programs, and the acquisition of development rights or 20
conservation easements to protect farm and forestland shall be 21
encouraged. 22
23
3) Commercial, light industrial and intensive residential development shall be 24
encouraged on suitable lands located in or immediately adjacent to 25
existing population centers. Development should be designed to be in 26
keeping with the character of the area, should not interfere with traffic 27
flow, should provide adequate parking for employees and customers, 28
and should provide landscaping, screening and/or buffers to minimize 29
any adverse impacts on adjacent lands, important natural resources, or 30
the community. 31
32
4) Community facilities and services should be provided in convenient and 33
suitable locations for the safety, use, and enjoyment of local residents. 34
New utility lines should make use of existing corridors and rights-of-way 35
wherever possible. Developers of residential subdivisions may be required 36
to provide land and/or facilities for use by residents of the proposed 37
development. 38
39
5) The town encourages agricultural and forestland be maintained for viable 40
economic use, encourages value added businesses, promotes locally 41
grown products, and encourages the implementation of 42
agricultural/forestry best management practices.43

DRAFT Berkshire Town Plan 2015 100
1
2
3
8BGETTING FROM HERE TO THERE 4
5
6
7
“Center Hill Road” Photo by Arnold Byam 8
9
10

Berkshire Town Plan 2015 Getting from Here to There
DRAFT Berkshire Town Plan 2015 101
40BA) THE CONTINUED PLANNING PROCESS 1
2
The Comprehensive Municipal Plan for the Town of Berkshire discusses at length, 3
the Town's history, present situation, and proposals for desirable growth and 4
development in the future. Implementing the plan by turning it into a living, 5
functional document is the ultimate challenge of the planning process. 6
7
Proper implementation of this plan will require continuing the planning process 8
as outlined in the first four goals of "Act 200" (Figure 7.1). All Berkshire residents 9
are encouraged to participate actively in each stage of the planning process. 10
Development should be guided by local decision-makers, with consideration 11
given to the appropriate use of the Town's resources and the consequences of 12
growth. Cooperative efforts should be undertaken between Berkshire and its 13
neighboring municipalities, the region, and the state in developing compatible 14
plans. 15
16
17 18
Also, as required by Act 200, the Town's planning process will be reviewed and 19
“confirmed” by the Regional Commission at least once over the next five years. 20
This will ensure that the Town remains eligible for state planning appropriations 21
and grants. These funds are intended to assist in the financing of local planning 22
efforts. At the same time, the Town is expected to continue to provide financial 23
support for the local and regional planning process. 24
75BPlan Coordination and Compatibility 25
It has been readily demonstrated in the past that it is very difficult for a town to 26
plan in isolation from its neighboring communities. The impacts of growth and 27
development on the community and the environment often do not recognize, 28
or may be intensified by, artificially drawn political boundaries. Battle lines are 29
too often drawn when cooperation is needed instead. Act 200 encourages 30
communities to work with each other and with the region and state in order to 31
Figure 7.1
Act 200 Planning Process Goals (1) To establish a coordinated, comprehensive planning process decisions by
municipalities, regional planning commissions, and state agencies.
(2) To encourage citizen participation at all levels of the planning process, and to
assure that decisions shall be made at the most local level possible
commensurate with their impact.
(3) To consider the use of resources and the consequences of growth and
development for the region and the state, as well as the community in which it
takes place.
(4) To encourage and assist municipalities to work creatively together to develop
and implement plans.

Berkshire Town Plan 2015 Getting from Here to There
DRAFT Berkshire Town Plan 2015 102
coordinate their planning programs. At the same time, it is necessary to 1
recognize that each community is unique in its character, needs, and desires. 2
Communication is an essential part of the planning process. 3
4
During the writing of this 5
town plan, the Planning 6
Commission reviewed the 7
town plans of neighboring 8
communities, which 9
include Franklin, Enosburg 10
Falls and Town, and 11
Richford. The Planning 12
Commission looked at the 13
plans for compatibility 14
with Berkshire’s proposed 15
land use map and 16
discussed the status of 17
any multi-town issues, 18
such as traffic or water 19
quality. A summary of this 20
analysis is provided in 21
Figure 7.2. 22
23
Berkshire planners should 24
try to schedule periodic 25
meetings with planners 26
from neighboring 27
commissions and the 28
Town should maintain its 29
representation on the 30
Board of Regional 31
Commissioners. State 32
planning efforts can be 33
tracked through direct 34
contact with State 35
agencies, through the 36
Regional Commission, 37
and through other 38
statewide organizations 39
such as the Vermont 40
Planning Association. 41
42
Figure 7.2
Land Use Compatibility with Adjacent
Communities
Along the Berkshire/Franklin border, proposed land use
is generally compatible. Berkshire’s Rural Lands District
abuts Franklin’s similar Rural Residential/Agricultural
District. The only area where land use plans differ is in
East Franklin, where Franklin’s Village District borders
Berkshire’s Rural Lands District. While the Village District
allows more commercial uses and higher density
development than the Rural District, there are no
compatibility issues.
Along the Enosburg Falls/Berkshire border, proposed
land use is generally compatible. Enosburg Falls’
conservation, recreation, and low-density residential
districts border Berkshire’s Rural Lands District. One issue
of note for both municipalities is the location of the
back-up reservoir for the Enosburg Water System off
Reservoir Road in Berkshire.
Along the Enosburgh Town/Berkshire border, proposed
land use is generally compatible. Enosburgh’s
agricultural and rural residential zones abut Berkshire’s
Rural Lands District, while a source protection area is
equally protected on both sides of the town line.
Along the Richford/Berkshire border, proposed land use
is generally compatible. Richford’s agricultural and
conservation district abut Berkshire’s Rural Lands District.
The only exception is where Richford’s
commercial/industrial, commercial, and rural
residential districts border Berkshire just after Route 105
passes into Richford. These heavier land uses have
been sited well and have not presented any
compatibility issues with Berkshire’s Rural Lands District.

Berkshire Town Plan 2015 Getting from Here to There
DRAFT Berkshire Town Plan 2015 103
75BCompatibility with the Regional Plan 1
Berkshire recognizes that it is part of a larger region and has considered the 2
compatibility of its planning goals with that of the region. Berkshire’s land use 3
planning areas are similar to the proposed land use plan adopted by the 4
Regional Planning Commission. The Regional Plan identifies Berkshire’s village 5
centers and supports the continuation of historic village and hamlet centers 6
through village center planning and designation efforts that preserve their 7
traditional character. The Regional Plan also designates Berkshire’s agricultural 8
lands as an important resource, and further states that the best farmland in the 9
region should be given the highest level of support for continued agricultural 10
use. 11
BWork Program 12
The work program on the following page outlines a recommended course of 13
action over the next five years to implement the long-term goals and objectives 14
identified within the plan. This program is intended as a guide for the planning 15
commission. It is recognized that the planning commission may not have the 16
time or funding to be able to accomplish all that is set forth. Plan 17
implementation through the development of zoning and subdivision regulations 18
should be given immediate attention and meeting the requirements of Act 200 19
should be on-going. 20
21
41BB) WORK PROGRAM 22
77BThe Continuing Planning Process: 23
24
Work to incorporate the goals and planning elements of Act 200 (Title 24, 25
Chapter 117 V.S.A.) into the plan and the planning process (5 years). 26
27
Pursue regular communication with neighboring communities, the 28
Regional Commission, and state agencies in order to coordinate planning 29
efforts. 30
31
Sponsor public informational meetings and workshops to encourage 32
public participation in the planning process. 33
34
Pursue available grants as needed to fund planning efforts. 35
36
78BPlan Implementation: 37
38
Maintain and revise as needed a zoning and subdivision bylaw, including 39
design and siting criteria and performance standards, which incorporate 40

Berkshire Town Plan 2015 Getting from Here to There
DRAFT Berkshire Town Plan 2015 104
the goals and policies of the plan and all new requirements in Title 24, 1
Chapter 117, V.S.A. Consider whether the allowed density in the Rural 2
Lands District is meeting the Town’s goals. 3
4
Develop a capital budget and program for the Town, which schedules 5
municipal capital improvements and expenditures based upon identified 6
needs, available financing, and the Town's ability to accommodate 7
growth. 8
9
Actively participate in Act 250 hearings and other state project review 10
procedures to ensure that projects are in conformance with Berkshire’s 11
Municipal Plan (as needed). 12
13
Assist the Selectboard in developing the following: 14
o a road policy and ordinance 15
o an impact fee ordinance 16
o a building code 17
18
79BSpecial Studies and Projects: 19
20
The following studies may be conducted or sponsored by the planning 21
commission as funding, time and interest permit: 22
23
Conduct a detailed land use survey, including the identification of 24
important agricultural land using a LESA system. 25
26
Identify important sand and gravel deposits in the Town, and determine 27
whether they are also important aquifer recharge areas. 28
29
Conduct a local housing study to evaluate the condition and affordability 30
of housing within the community and impacts from conversion of second 31
or seasonal homes to year-round housing. 32
33
Support the local historical society, assist in the update of the State’s 34
Historical Sites and Structures Survey for the Town, and identify potential 35
nominations for the state and national historic registers. 36
37
Encourage the formation of a Conservation Commission for the Town of 38
Berkshire. 39
40
Pursue funding opportunities to complete electronic parcel mapping of 41
the Town. 42
43

Berkshire Town Plan 2015 Getting from Here to There
DRAFT Berkshire Town Plan 2015 105
Pursue Village Designation from the Vermont Downtown Program for East 1
Berkshire and Berkshire Center. 2
3
Strengthen the flood hazard bylaws to mitigate risks to public safety, 4
critical infrastructure, historic structures and municipal investments from 5
inundation and erosion. 6
7
Conduct an analysis of the current zoning districts to identify the 8
effectiveness of the defined density per district for managing growth. As 9
a part of the analysis, consider implementing a conservation or forest 10
district to guide development in areas that may contain sensitive 11
forestland or other natural features. 12
13
14
15

Berkshire Town Plan 2015 Online Planning Resources
DRAFT Berkshire Town Plan 2015 106
0BAPPENDIX A. ONLINE PLANNING RESOURCES 1
2 The following is a list of internet resources that pertain to the community planning. 3 Resources are identified by corresponding sections of the Town Plan. Included in this list 4 are some mapping websites available to the public to allow viewing of information at a 5 parcel, town or county level and many have a function for creating a printable map. 6 7
The Sense of Place - Natural Resources & Environment 8
9 VT Agency of Natural Resources – Natural 10 Resources Atlas, 11 http://anrmaps.vermont.gov/websites/anra 12 The purpose of the Natural Resources Atlas is to provide geographic information about 13 environmental features and sites that the Vermont Agency of Natural Resources manages, 14 monitors, permits, or regulates. 15
In addition to standard map navigation tools, this site allows you to link from sites to 16 documents where available, generate reports, export search results, import data, search, 17 measure, mark-up, query map features, and print PDF maps. 18 19
20 VT Agency of Natural Resources – Biofinder, 21 http://biofinder.vt.gov 22 BioFinder is a map and database identifying Vermont's lands and waters supporting high priority 23 ecosystems, natural communities, habitats, and species. The most comprehensive assessment of 24 its kind in Vermont, BioFinder was developed by the Agency of Natural Resources and partners 25 to further our collective stewardship and conservation efforts. 26
At its core, BioFinder is 21 overlapping data sets representing terrestrial and aquatic 27 biological, ecological, and natural heritage data at various scales and aspects. A co-28 occurrence analysis then identified the locations of greatest overlap for priority ranking at the 29 statewide scale. You can use the BioFinder Mapping Tool to explore the distribution and richness 30 of Vermont's biodiversity and help secure Vermont's natural heritage for future generations. 31 32
The Sense of Place - Historic Legacies 33
34 VT Division for Historic Preservation, 35 http://accd.vermont.gov/strong_communities/preservation 36 All of the National Register, State Register and Historic Sites and Structures Survey materials are 37 now digitized and available online here: www.orc.vermont.gov. You don’t need to get a 38 username or password – just choose the town/county you want to research and the file types 39 you want to look at, and then select “view scanned document”. 40
Place for A Home 41
42 VT Housing Data, www.housingdata.org 43 A central, searchable repository of Vermont housing data provided as a public 44 resource. This site contains extensive housing data reports for Vermont — all its 45 towns, villages, counties. 46
47
48

Berkshire Town Plan 2015 Online Planning Resources
DRAFT Berkshire Town Plan 2015 107
Earning A Living 1
VT Dept. of Labor, Covered Employment and Wages, www.vtlmi.info/indnaics.htm 2 3
Providing for the People - Education 4
VT Agency of Education, http://education.vermont.gov/data/ 5 The agency collects data from Vermont's supervisory unions and school districts. In addition, the 6 agency provides training to help school professionals provide this data. 7
8
Providing for the People - Transportation 9
10 Vermont Local Technical Assistance Program Center, 11 http://vermontlocalroads.org 12 The Vermont Local Roads Program provides information, training and 13 technical assistance to cities, towns and villages in Vermont. This is done 14 through seminars and workshops, distribution of materials and technical 15 assistance to fulfill service requests. 16 17 Go Vermont, www.connectingcommuters.org 18
Go Vermont is a resource for Vermonters who want to reduce the cost and 19 environmental impact of driving. We offer free carpool matching and 20 vanpool services, and statewide bus routes, as well as free Go! Vermont 21 resources to help you promote more efficient travel options at work or at 22 home. Call our Q/A hotline and a real person can answer your 23 transportation questions (800-685-7433). 24
25 Green Mountain Transit Agency, http://gmtaride.org 26 The Green Mountain Transit Agency provides public transportation services in 27 Washington County, Lamoille County, Franklin County, Grand Isle County, the 28 Mad River Valley and the towns of Washington, Orange and Williamstown. 29
30
VT Agency of Transportation, Online Map Center, 31 http://vtransmaps.vermont.gov/webmaps.htm 32 This site contains several web-based maps such as park and ride lots, bridge and culvert 33 information, and status of pending projects. 34
35
Providing for the People - Energy 36
37 Renewable Energy Atlas of Vermont, www.vtenergyatlas.com 38 The Renewable Energy Atlas of Vermont is your tool for identifying, 39 analyzing, and visualizing existing and promising locations for 40 renewable energy and energy efficiency projects. 41 42
43 Efficiency Vermont, www.efficiencyvermont.com 44
Efficiency Vermont provides technical assistance, rebates, and other financial incentives to help 45 Vermont households and businesses reduce their energy costs with energy-efficient equipment, 46 lighting, and approaches to construction and major renovation. 47 48

Berkshire Town Plan 2015 Online Planning Resources
DRAFT Berkshire Town Plan 2015 108
1 VECAN, www.vecan.net 2 VECAN is a network of statewide Vermont 3 organizations helping communities across the 4 Green Mountain State to reduce energy costs and climate impacts through conservation, 5 increased energy efficiency and conversion to renewable energy sources. 6
7
General Links 8
9 Northwest Regional Planning Commission, http://nrpcvt.com 10 The Northwest Regional Planning Commission (NRPC) is one of eleven 11 commissions serving Vermont municipalities. NRPC operates under the 12 Vermont Municipal and Regional Planning and Development Act and its 13 adopted bylaws (Title 24, Chapter 117, V.S.A.). Our region is made up of 23 14
(19 towns, 3 incorporated villages, and 1 city) located in Franklin and Grand Isle Counties in 15 northwestern Vermont. The Commission provides services to local municipalities, area non-profits 16 and other regional organizations. 17 18 19 Vermont Planning Information Center, http://vpic.info 20 VPIC is a clearinghouse of information for planning commission, zoning boards, development 21 review boards, and their staff and all others involved in land planning and regulation in Vermont. 22 The resources on this page were created by collaboration among agencies and organizations 23 that provide technical assistance and education to local land use officials in Vermont. 24 25 Vermont State Statutes, http://legislature.vermont.gov/statutes/ 26 27 Vermont League of Cities and Towns, http://resources.vlct.org 28 The Vermont League of Cities and Towns (VLCT) is a nonprofit, nonpartisan organization that 29 serves Vermont's municipal officials. VLCT provides educational workshops and consulting 30 advice for municipal officials. 31 32 VT Dept. of Housing and Community Development, 33 http://accd.vermont.gov/strong_communities/opportunities/planning/publications 34 This agency provides training, technical assistance and regulatory guidance as well as funding 35 and incentives to businesses, individuals and municipalities. 36 37
General Permitting 38
VT Agency of Natural Resources - Permitting, www.anr.state.vt.us/dec/permits 39 The Agency of Natural Resources' three departments, Environmental Conservation (DEC), Fish 40 and Wildlife (F&W), Forests, Parks and Recreation (FPR) have regulatory responsibility for a 41 number of programs and oversee their associated permits. The majority of environmental permits 42 are issued by the DEC. 43
Permit Assistance - The Environmental Assistance Office provides permit assistance 44 through the Agency of Natural Resources' five regional offices and five satellite offices. The 45 Permit Specialists are available in these offices to answer your questions about the permit 46 process. www.anr.state.vt.us/dec/ead/index 47 48 49 50

Berkshire Town Plan 2015 Online Planning Resources
DRAFT Berkshire Town Plan 2015 109
Natural Resources Board - Act 250, www.nrb.state.vt.us/lup 1 The Act 250 program provides a public, quasi-judicial process for reviewing and managing the 2 environmental, social and fiscal consequences of major subdivisions and developments in 3 Vermont. The program is implemented through the 9 District Environmental Commissions. 4 5 Public Service Board – Section 248, www.state.vt.us/psb 6 The Public Service Board is a quasi-judicial board that supervises the rates, quality of service, and 7 overall financial management of Vermont's public utilities: cable television, electric, gas, 8 telecommunications, water and large wastewater companies. It also reviews the environmental 9 and economic impacts of energy purchases and facilities, the safety of hydroelectric dams, the 10 financial aspects of nuclear plant decommissioning and radioactive waste storage, and the 11 rates paid to independent power producers. The Board's mission is to ensure the provision of high 12 quality public utility services in Vermont at minimum reasonable costs, measured over time 13 periods consistent with the long-term public good of the state. 14 15
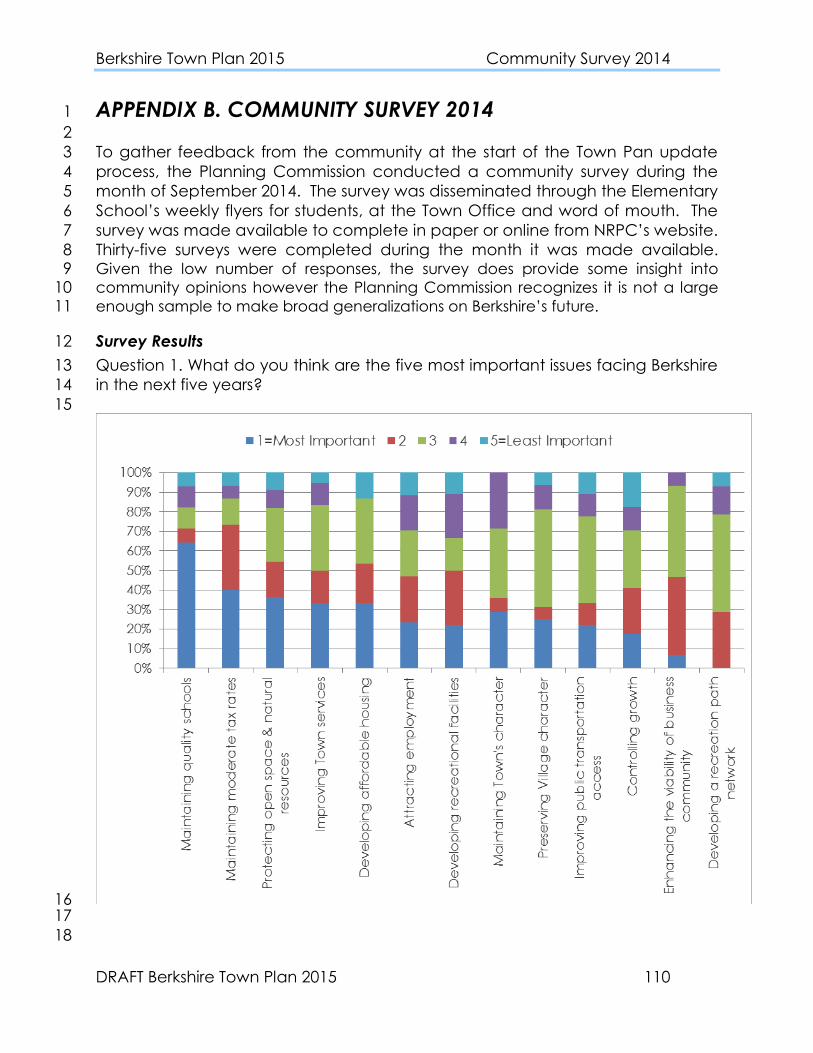
Berkshire Town Plan 2015 Community Survey 2014
DRAFT Berkshire Town Plan 2015 110
0BAPPENDIX B. COMMUNITY SURVEY 2014 1
2
To gather feedback from the community at the start of the Town Pan update 3
process, the Planning Commission conducted a community survey during the 4
month of September 2014. The survey was disseminated through the Elementary 5
School’s weekly flyers for students, at the Town Office and word of mouth. The 6
survey was made available to complete in paper or online from NRPC’s website. 7
Thirty-five surveys were completed during the month it was made available. 8 Given the low number of responses, the survey does provide some insight into 9 community opinions however the Planning Commission recognizes it is not a large 10 enough sample to make broad generalizations on Berkshire’s future. 11
S75BSurvey Results 12
Question 1. What do you think are the five most important issues facing Berkshire 13
in the next five years? 14
15
16 17
18

Berkshire Town Plan 2015 Community Survey 2014
DRAFT Berkshire Town Plan 2015 111
Question 2. List the top three things that you enjoy about Berkshire and do not 1
want to change (28 responses). [The response to this question is shown in a 2
‘wordle’ or a word cloud that gives greater prominence to words that appear 3
more frequently] 4
5
6
7
8
9
10
11
12
13
14
15
16
17
18
19
20
21
22
23
Question 3. List the top three things about Berkshire that you would like to 24
change (23 responses). [The response to this question is shown in a ‘wordle’ or a 25
word cloud that gives greater prominence to words that appear more 26
frequently] 27
28
29
30
31
32
33

Berkshire Town Plan 2015 Community Survey 2014
DRAFT Berkshire Town Plan 2015 112
Question 4. The following questions relate to the accessibility and quality of basic 1
needs and services. How would you rate our… (34 responses) 2
3
4 5
Question 5. Does Berkshire have an adequate supply of safe, healthy, and 6
affordable housing that satisfies the living requirements of residents? (31 7
responses) 8
9
10
11
12
13
14
15
16
17
18
19
20
21
0% 20% 40% 60% 80% 100%
Public facilities
(library, town hall)
Access to police
services
Fire department
Access to
ambulance service
Telecommunication
service (phone,
cellular, cable)
Transportation
system (roads,
bridges)
Rate the Accessibility and Quality of
Basic Needs and Services
Acceptable Neutral Unacceptable

Berkshire Town Plan 2015 Community Survey 2014
DRAFT Berkshire Town Plan 2015 113
1
Question 6. Should the Village Question 7. Should historic 2
areas include more... preservation be a consideration? 3
(29 responses) (31 responses) 4
5
6
7
8
9
10
11
12
13
14
15
Question 8 & 9. Do you feel the rate of _________ development has been… 16
(31 responses) (32 responses) 17
18
19
20
21
22
23
24
25
26
27
28
29
30
31
Question 10. Would you rather see East Berkshire... (32 responses) 32
33
34
35
36
37
38
39
40
41
42
43
44

Berkshire Town Plan 2015 Community Survey 2014
DRAFT Berkshire Town Plan 2015 114
1
2
Question 11. In making regulatory decisions concerning development, the Town 3
should make specific efforts to protect it's… (33 responses) 4
5
6
Question 12. What type of economic development would you like to see 7
Berkshire encourage? (33 responses) 8
9
10

Berkshire Town Plan 2015 Community Survey 2014
DRAFT Berkshire Town Plan 2015 115
The following information provides a profile of the demographics of the survey 1
respondents: 2
3
Number of years respondents’ have lived in Berkshire (32 responses) [The 4
response to this question is shown in a ‘wordle’ or a word cloud that gives 5
greater prominence to words that appear more frequently] 6
7
8 9 10 11
Number of people in respondents’ household (33 responses) 12
13 14
15
16
17

Berkshire Town Plan 2015 Community Survey 2014
DRAFT Berkshire Town Plan 2015 116
Number of respondents’ household members that are…. 1
2
Age 18 or younger Age 65 or older 3
(28 responses) (15 responses) 4
5
6
7
8
Homeownership among survey respondents’ (33 responses). 9
10
11
12
13
14
15

Berkshire Town Plan 2015 Community Survey 2014
DRAFT Berkshire Town Plan 2015 117
Status that best describes of at least one member of respondents’ household (33 1
responses). 2
3
4 5
Location of employment for at least one person working outside of the 6
respondents’ home (26 responses). *When provided, other included the Town of 7
Jay and an employer based outside of the state of Vermont. 8
9 10
11

Berkshire Town Plan 2015 Community Survey 2014
DRAFT Berkshire Town Plan 2015 118
Location in town the respondents’ reside (33 responses). 1
2
3
4
5
6
7
8
9
10
11
12
13
14
15
16
17
Respondents were asked how they would prefer to be informed of community 18
events and meetings. The respondents’ were asked to rank their top three (32 19
responses). 20
21