Towards the next generation of solar irradiance models
27
Towards the next generation of solar irradiance models Sami K. Solanki 1 , Yvonne C. Unruh 2 , William Ball 2 Manfred Schüssler 1 , Natalie Krivova 1 1 Max Planck Institute for Solar System Research, Germany 2 Imperial College, London, Great Britain
Transcript of Towards the next generation of solar irradiance models
Towards the next
generation of solar
irradiance models
Sami K. Solanki1, Yvonne C. Unruh2, William Ball2
Manfred Schüssler1, Natalie Krivova1
1Max Planck Institute for Solar System Research, Germany
2Imperial College, London, Great Britain

Achievements of modern irradiance models
> 92% of variations in
TSI during the satellite
era are reproduced by
surface magnetic
features (assuming
PMOD composite is
correct). > 95% of
VIRGO TSI variability
Unruh et al. 2008
Yeo et al. in preparation
SSI is well reproduced on solar
rotation timescale & some time
series also over the solar cycle
Spectral line variations over solar
cycle are reproduced
Correct sign of variability of
radiative flux over stellar cycles
Black: SATIRE Red: Composite
SIM
VIRGO
SATIRE

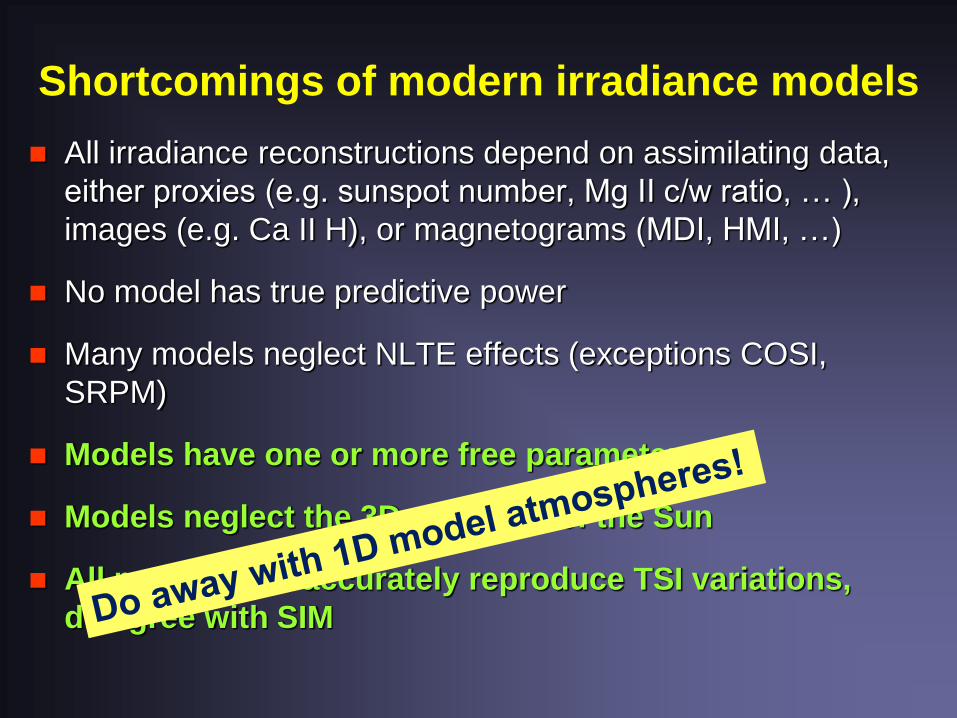
Shortcomings of modern irradiance models
All irradiance reconstructions depend on assimilating data,
either proxies (e.g. sunspot number, Mg II c/w ratio, … ),
images (e.g. Ca II H), or magnetograms (MDI, HMI, …)
No model has true predictive power
Many models neglect NLTE effects (exceptions COSI,
SRPM)
Models have one or more free parameters
Models neglect the 3D structure of the Sun
All models that accurately reproduce TSI variations, disagree
with SIM
Shortcomings of modern irradiance models
All irradiance reconstructions depend on assimilating data,
either proxies (e.g. sunspot number, Mg II c/w ratio, … ),
images (e.g. Ca II H), or magnetograms (MDI, HMI, …)
No model has true predictive power
Many models neglect NLTE effects (exceptions COSI,
SRPM)
Models have one or more free parameters
Models neglect the 3D structure of the Sun
All models that accurately reproduce TSI variations,
disagree with SIM
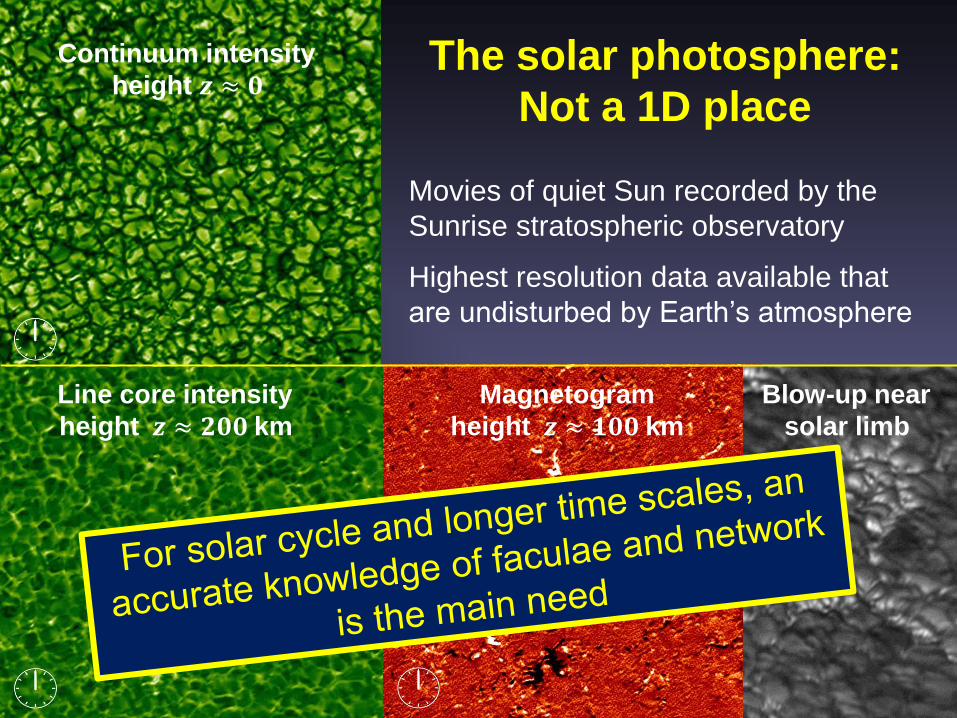
The solar photosphere:
Not a 1D place
Continuum intensity
height 𝒛 ≈ 𝟎
Line core intensity
height 𝒛 ≈ 𝟐𝟎𝟎 km
Magnetogram
height 𝒛 ≈ 𝟏𝟎𝟎 km
Movies of quiet Sun recorded by the
Sunrise stratospheric observatory
Highest resolution data available that
are undisturbed by Earth’s atmosphere
Blow-up near
solar limb

Realistic computations of faculae
One way of studying faculae and network in detail is to
consider 3D radiation MHD simulations, such as those with
the MURAM code (Vögler et al. 2005)
Simulate evolution of gas dynamics and magnetic field over
a “small” box (5-50 Mm horizontal, 1.4-8 Mm depth)
containing the solar surface
Simulation run with
10 km spatial grid
6 Mm spatial size
Homogeneous 200
G vertical initial
magnetic field
𝐵𝑧 𝐼𝑐
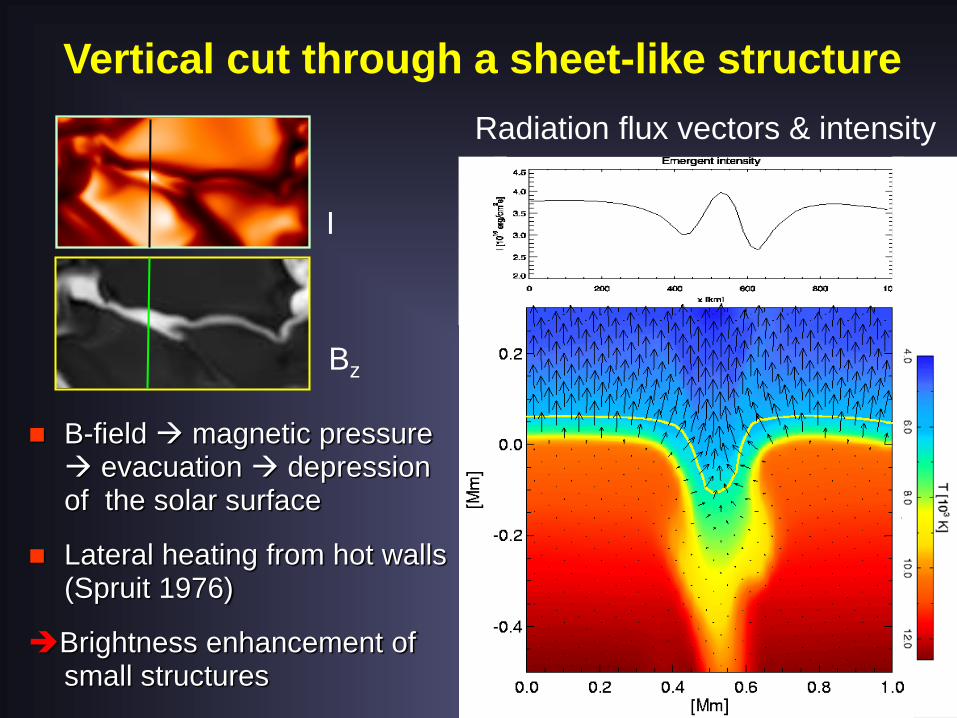
Vertical cut through a sheet-like structure
Radiation flux vectors & intensity
I
Bz
B-field magnetic pressure evacuation depression of the solar surface
Lateral heating from hot walls (Spruit 1976)
Brightness enhancement of small structures
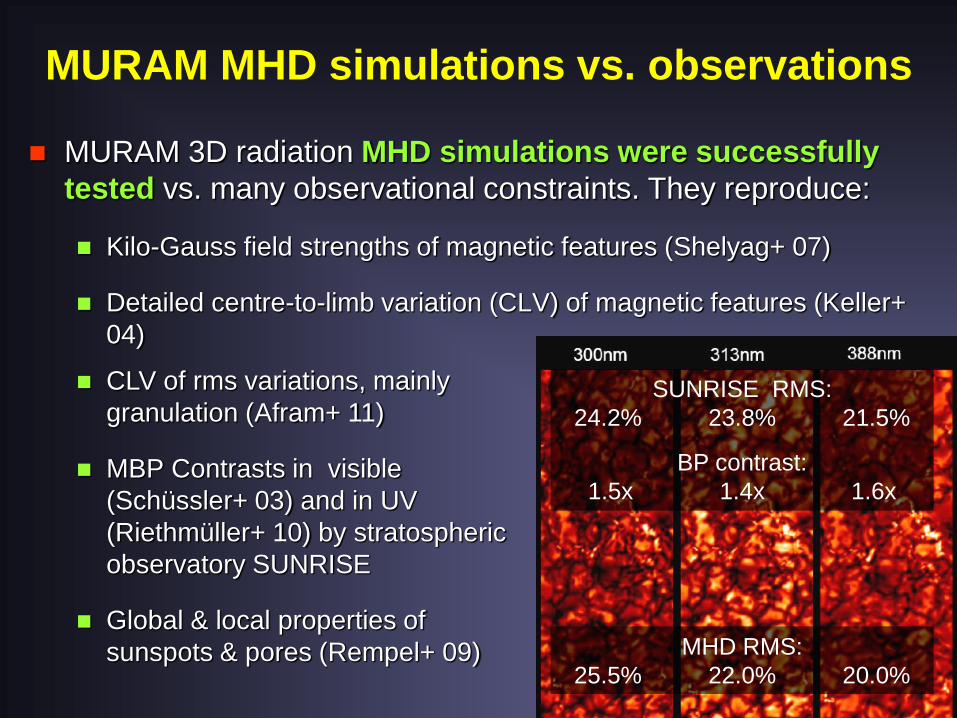
MURAM MHD simulations vs. observations
MURAM 3D radiation MHD simulations were successfully
tested vs. many observational constraints. They reproduce:
Kilo-Gauss field strengths of magnetic features (Shelyag+ 07)
Detailed centre-to-limb variation (CLV) of magnetic features (Keller+
04)
SUNRISE RMS:
24.2% 23.8% 21.5%
BP contrast:
1.5x 1.4x 1.6x
MHD RMS:
25.5% 22.0% 20.0%
CLV of rms variations, mainly
granulation (Afram+ 11)
MBP Contrasts in visible
(Schüssler+ 03) and in UV
(Riethmüller+ 10) by stratospheric
observatory SUNRISE
Global & local properties of
sunspots & pores (Rempel+ 09)

MHD simulations: from quiet Sun to plage
0 G
50 G
200 G
400 G
Magnetic field
Radiation MHD
simulations of
solar surface layers. Open lower
boundary with fixed value of
entropy for bottom inflow (i.e.
assume irradiance changes in surface layers)
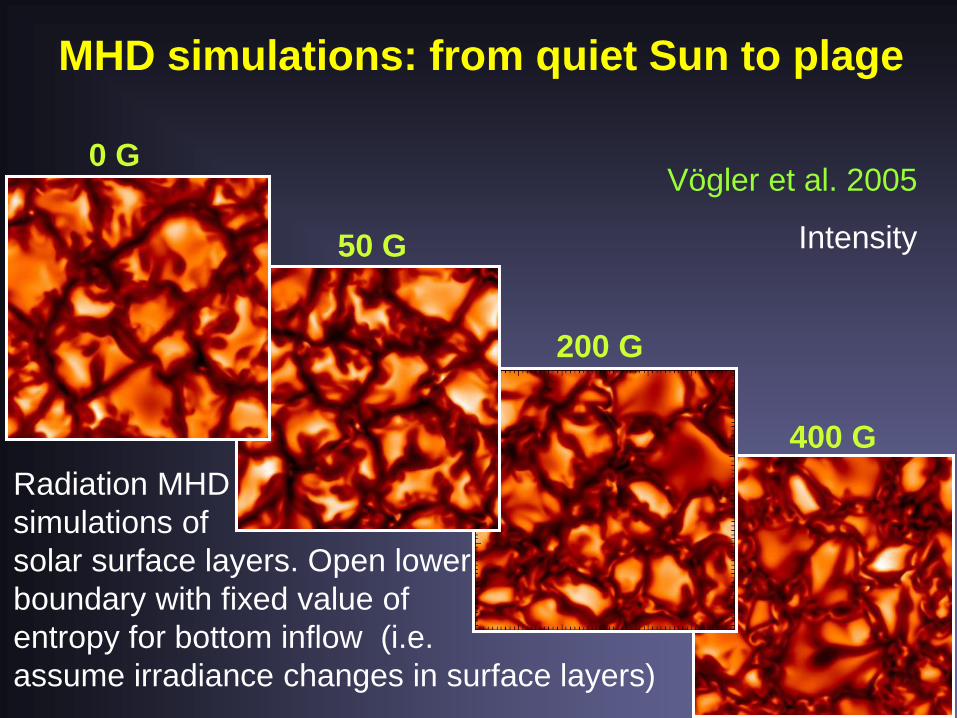
0 G
50 G
200 G
400 G
Vögler et al. 2005
Intensity
Radiation MHD
simulations of
solar surface layers. Open lower
boundary with fixed value of
entropy for bottom inflow (i.e.
assume irradiance changes in surface layers)
MHD simulations: from quiet Sun to plage

Total emitted energy flux:
integrated over all 𝜆 and angles
Mean disk center λ-integrated
intensity (i.e. emitted vertically)
Global photometric properties (contrast relative to B0=0)
Constant entropy of inflowing gas at bottom of computational box
MHD simulations: from quiet Sun to plage
Vögler (2005)
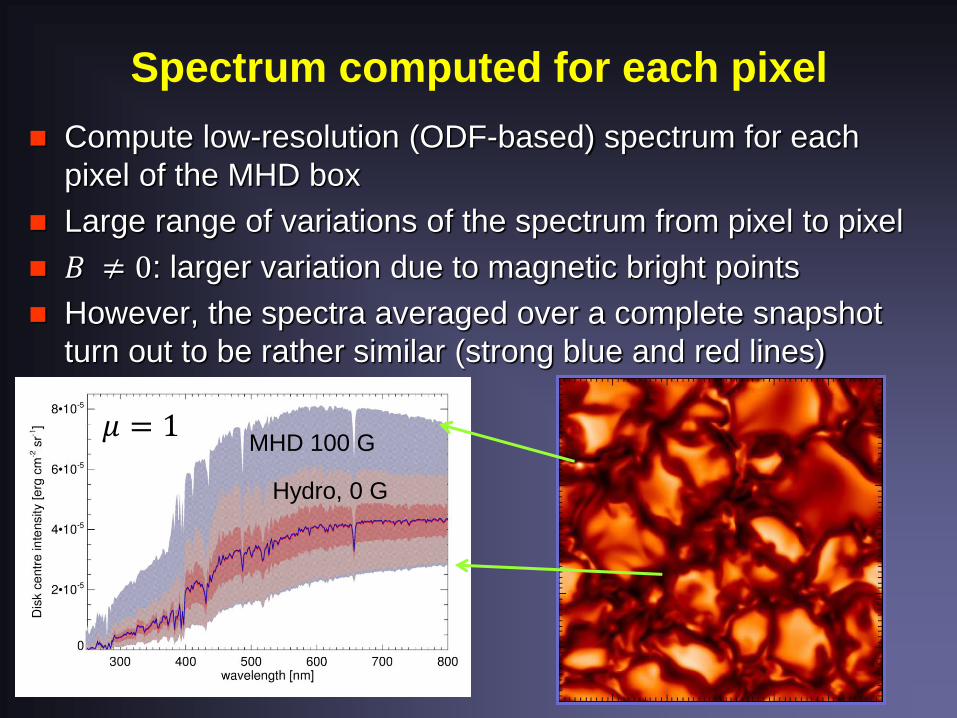
Spectrum computed for each pixel
𝜇 = 1 𝜇 = 0.5 MHD 100 G
Hydro, 0 G
Compute low-resolution (ODF-based) spectrum for each
pixel of the MHD box
Large range of variations of the spectrum from pixel to pixel
𝐵 ≠ 0: larger variation due to magnetic bright points
However, the spectra averaged over a complete snapshot
turn out to be rather similar (strong blue and red lines)
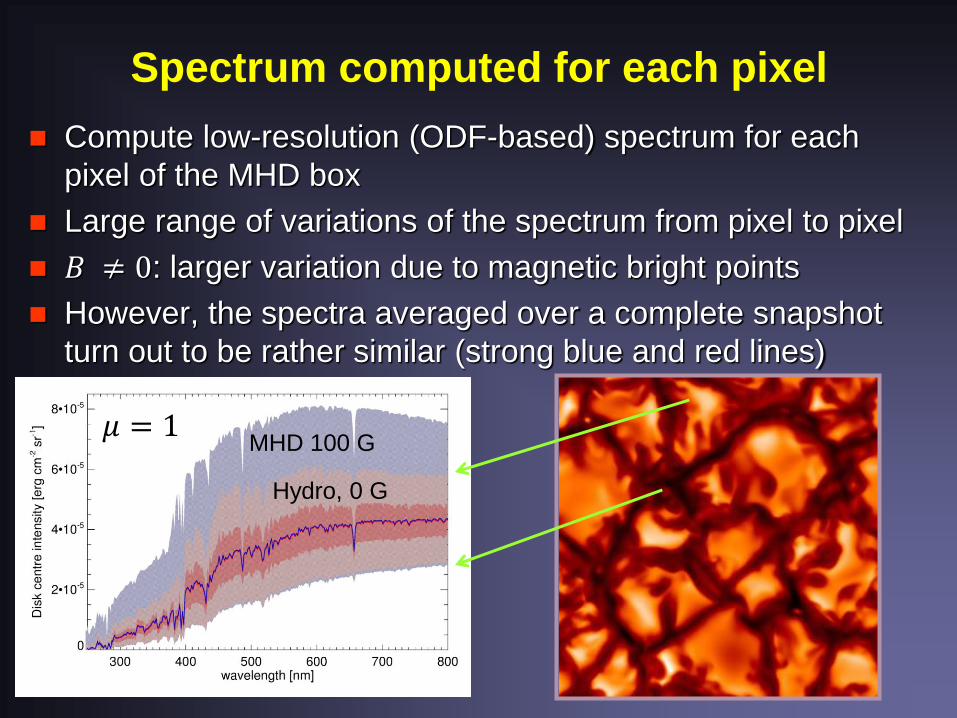
Spectrum computed for each pixel

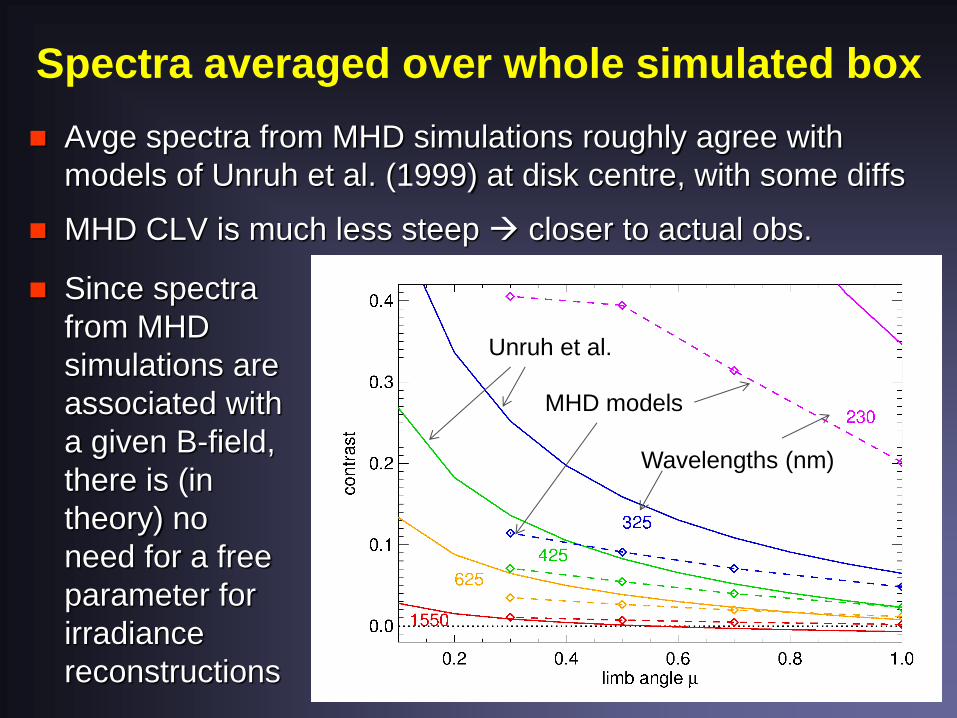
Spectra averaged over whole simulated box
MURAM 100 G
Unruh et al. 99
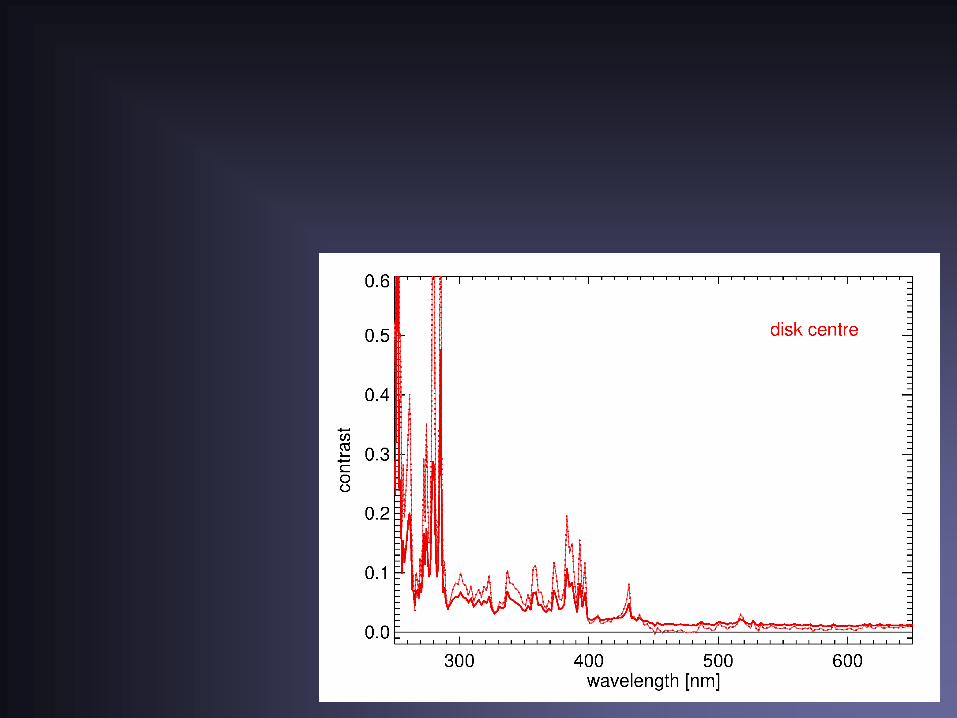
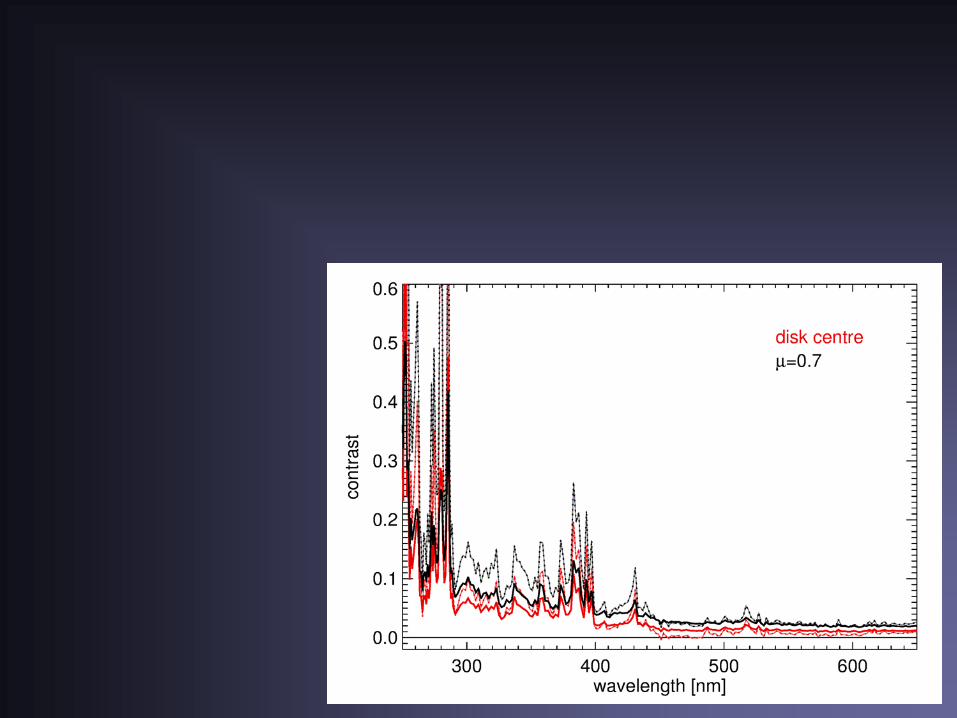
Averaged spectra from MHD simulations roughly agree with
models of Unruh et al. (1999) at disk centre, with some diffs
MHD CLV is much less steep closer to actual obs.
Since spectra
from MHD
simulations are
associated with
a given B-field,
there is (in
theory) no
need for a free
parameter for
irradiance
reconstructions
Contrast: 𝐼𝜆 𝐵 −𝐼𝜆(𝐵=0)
𝐼𝜆(𝐵=0)
Disk centre
MURAM 100 G
Unruh et al. 99
Avge spectra from MHD simulations roughly agree with
models of Unruh et al. (1999) at disk centre, with some diffs
MHD CLV is much less steep closer to actual obs.
Wavelengths (nm)
MHD models
Unruh et al.
Since spectra
from MHD
simulations are
associated with
a given B-field,
there is (in
theory) no
need for a free
parameter for
irradiance
reconstructions
Spectra averaged over whole simulated box

Conclusions I
Positive points:
3D radiation MHD simulations are much closer to reality
than the 1D models used so far. Spectral syntheses with
ODFs are feasible
The spectra have similarity with the successful model of
Unruh et al. (1999), although there are differences
The CLV of the intensity contrast from the MHD
simulations is less steep and hence closer to observations
Solar irradiance reconstructions using such spectra have
the potential to do away with the single free parameter of
SATIRE (but see next slides)

Conclusions II
Not so positive points:
Full spectrum synthesis, e.g. in NLTE, is prohibitively
expensive
Very preliminary: MURAM + ODF spectral synthesis:
Discrepancy with SIM is unlikely due to use of 1-D models
MHD simulations are robust in photosphere, less so in
chromosphere (only one code currently treats
chromosphere properly). More work needed
Full-disk magnetograms such as HMI probably sample
only a small fraction of the Sun’s magnetic flux
We are just at the beginning and have a long way to go!
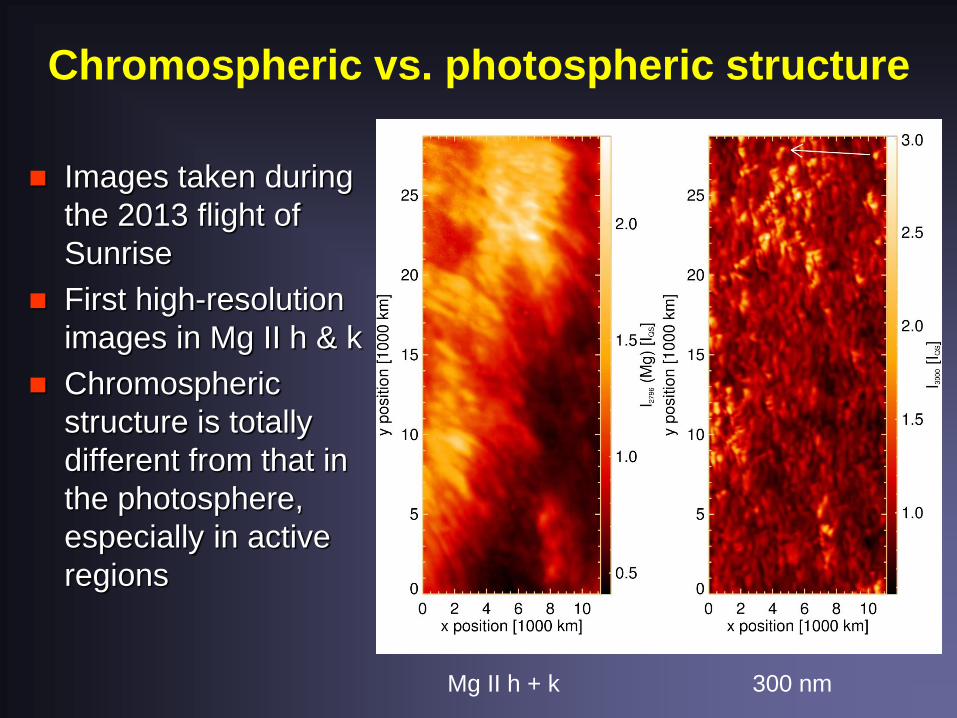
Chromospheric vs. photospheric structure
Mg II h + k 300 nm
Images taken during
the 2013 flight of
Sunrise
First high-resolution
images in Mg II h & k
Chromospheric
structure is totally
different from that in
the photosphere,
especially in active
regions

Conclusions II
Not so positive points:
Full spectrum synthesis, e.g. in NLTE, is prohibitively
expensive
Very preliminary: MURAM + ODF spectral synthesis:
Discrepancy with SIM is unlikely due to use of 1-D models
MHD simulations are robust in photosphere, less so in
chromosphere (only one code currently treats
chromosphere properly). More work needed
Full-disk magnetograms such as HMI probably sample
only a small fraction of the Sun’s magnetic flux
We are just at the beginning and have a long way to go!
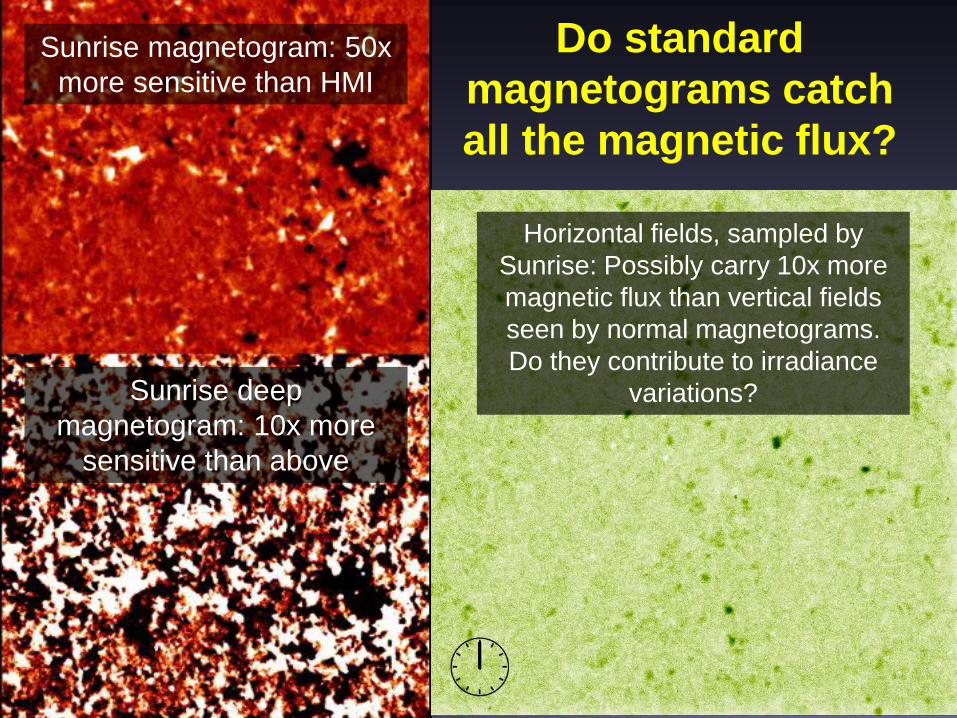
Do standard
magnetograms catch
all the magnetic flux?
Sunrise magnetogram: 50x
more sensitive than HMI
Sunrise deep
magnetogram: 10x more
sensitive than above
Horizontal fields, sampled by
Sunrise: Possibly carry 10x more
magnetic flux than vertical fields
seen by normal magnetograms.
Do they contribute to irradiance
variations?

Application to other stars
Emergent flux & contrasts show spectral type dependence
Such models can be used to compare with Kepler data
G2 (100 G) M2 (100G)

19 slides !!!


![Inter-hour direct normal irradiance forecast with multiple ... · ahead solar irradiance forecast [11, 12] and long-term solar irradiance estimation [13]. However, for an inter-hour](https://static.fdocuments.in/doc/165x107/5f43655640b4404ee374a6b6/inter-hour-direct-normal-irradiance-forecast-with-multiple-ahead-solar-irradiance.jpg)