Towards Sustainable Urban Precincts - AIRAH · 2016-09-17 · TOWARDS SUSTAINABLE URBAN PRECINCTS...
18
20/10/2010 1 TOWARDS SUSTAINABLE URBAN PRECINCTS Mark Allan Associate Director Billard Leece Partnership Architects & Urban Planners Melbourne Forum - Wednesday 29 September 2010 Towards sustainable precincts This presentation: Context – climate change and built environment Broader social issues - Melbourne’s growth Green star communities five principles Future design individual buildings, neighbourhood precincts and cities Conclusions Image source: The Economist magazine September 2010
Transcript of Towards Sustainable Urban Precincts - AIRAH · 2016-09-17 · TOWARDS SUSTAINABLE URBAN PRECINCTS...

20/10/2010
1
TOWARDS SUSTAINABLE
URBAN PRECINCTS
Mark Allan Associate Director
Billard Leece Partnership Architects & Urban Planners
Melbourne Forum - Wednesday 29 September 2010
Towards sustainable precincts
This presentation:
Context – climate change and built
environment
Broader social issues - Melbourne’s growth
Green star communities five principles
Future design individual buildings,
neighbourhood precincts and cities
Conclusions
Image source: The Economist magazine September 2010

20/10/2010
2
Sustainable community precincts,
not just the built environment
Hammarby, Sjostad, Stockholm, Sweden
Image Source: www.cabe.org.uk
Australian buildings account for;
• 23-26% of energy
• 14% of water
• 40% of solid waste
Melbourne CBD Skyline at night
Image Source: Tourism Victoria
The property industry is uniquely
placed to shape our future
Australian Buildings account for:
• 23-26% of energy
• 14% of water
• 40% of solid waste

20/10/2010
3
Context
most Australians accept the climate is changing
Source: McCrindle Research January 2009
100% Gen Y 91% Gen X 85% Boomers
8.8 million existing Australian homes
~130,000 new ones each year
Melbourne
Approximately 1.6 million
existing homes
Adds ~20,000+ each year
Housing accounts for
17% Greenhouse
emissions
Howard Arkley Family Home: Suburban Exterior 1993
Image Source: Monash University Museum of Art

20/10/2010
4
Climate change
Increased awareness
“ Australia will suffer as a result of climate change: More bushfires, floods and
more intense cyclones, Increasing coastal inundation sea level rise & storm
surges”
Source: Commonwealth of Australia 2009
Melbourne’s urban growth
1851 – 2004
Image Source: Victorian State Government

20/10/2010
5
Melbourne at 5 million
if status quo development patterns prevail
Source: Transforming Australian Cities MCC & DPCD July 2009
Growth of cities is ‘good’ if managed
The ABS forecast by 2050 Melbourne will be growing on average by:
800,000
people
per decade

20/10/2010
6
Melbourne 1970s doughnut
city avoided
Image Source: Leon Krier ‘the architecture of community’ Island press 2009

20/10/2010
7
Preferred + cities within a city
Vibrant living city centre
reduced carbon emissions in all areas of life
eco-city

20/10/2010
8
How do you define a sustainable
precinct? start with community!
A sustainable community…
respects ecological limits and natural
resources
encourages prosperity and well-being
optimises conditions for human
development
Encompass
aspirations for the future
acknowledging change
liveable, resilient, diverse, adaptable
built environments
a lower carbon and ecological footprint
GBCA Green Star Communities National
Framework 2010
GBCA national principles for
sustainable communities
1. Enhance liveability
2. Create opportunities for
economic prosperity
3. Foster environmental
responsibility
4. Embrace design
excellence
5. Demonstrate visionary
leadership and strong
governance
Image Source: Metropol, Former St Kilda Station Redevelopment
Billard Leece Partnership

20/10/2010
9
Enhance liveability
Enhance liveability
social connection

20/10/2010
10
Enhance liveability
join a club
Social capital
Child health and wellbeing
Economic and personal wellbeing
Societal change – community decline
Mobility
Home – work – shop triangle
Urban design
Better together
Source: Prof Robert Putnam ‘Bowling Alone” 2000 &
‘Better Together’ 2003
Create opportunities for
economic prosperity
“ Forget the banking and automotive
industry. Earth is the one system that is
truly „too big to fail‟.”
Source: Scientific American April 2010

20/10/2010
11
Create opportunities
Image s
ourc
e A
RU
P
Foster environmental responsibility

20/10/2010
12
Home energy
NatHERS star rating - Melbourne
Source: nathers.gov.au
Victoria
Regulation
5 Star
COAG
Regulation
6 Star Housing
May 2011 Mirvac’s
Harmony 9
9.2 Star
18.8MJm2pa
engagement with people E Behaviour change
Image source: Age newspaper

20/10/2010
13
Ecological Footprint
Suburbs
Footprint: Services 11%, Goods 23%, Mobility 12%, Housing 19% and Food 35%
Source: EPA Victoria
Embrace design excellence
Mixed use
Image Source: Danks Street Waterloo NSW
Billard Leece Partnership 2010

20/10/2010
14
Adaptive integrated design
Image Source: Danks Street Waterloo NSW
Billard Leece Partnership 2010
Visionary leadership
low density neighbourhood now
Image Source: Transforming
Australian Cities, City of
Melbourne and Victorian
Government July 2009
Maribyrnong Road, Maribyrnong, currently

20/10/2010
15
Visionary leadership
Future neighbourhood density
Image Source: Transforming
Australian Cities, City of
Melbourne and Victorian
Government July 2009
Maribyrnong Road, Maribyrnong, possible future
Adaptation
Changing the way we design buildings & infrastructure
Individual buildings
Smaller, cooler & better designed
Smart metered energy, water, waste
Adaptable
Neighbourhood precinct scale
New integrated with existing
Walkable, local jobs, vibrant town centres
Additional street tree planting
Infrastructure
City scale
Intelligent density with retrofitting
Access to services & public transport
Integrated mixed use
Image source: Cover Allen & Unwin 2007
20/10/2010
16
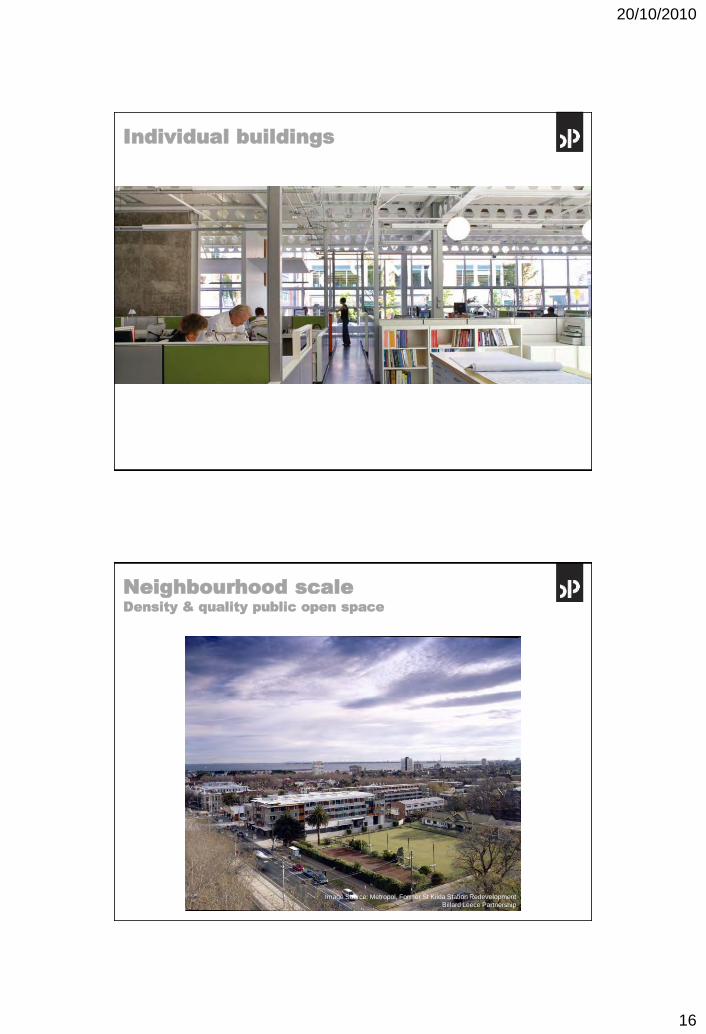
Individual buildings
Neighbourhood scale
Density & quality public open space
Image Source: Metropol, Former St Kilda Station Redevelopment
Billard Leece Partnership

20/10/2010
17
Cities are the answer
Close
1. Adaptation – buildings, neighbourhoods and cities
2. Sustainable precincts – part of Melbourne’s future
3. Engage with the community not just the built environment
4. Strong leadership, property sector, ngos, government sector

20/10/2010
18
Thank you
Questions?
Billard Leece Partnership Architects & Urban Planners
www.blp.com.au
Mark Allan Associate Director