Towards sustainable microfinance: The case of Capitec Bank ...
75
University of Cape Town Towards sustainable microfinance: The case of Capitec Bank and Grameen Bank A Thesis presented to The Graduate School of Business University of Cape Town In partial fulfilment of the requirements for the Master of Commerce Degree in Development Finance by Annette Verryn December 2014 Supervised by: Prof Nicholas Biekpe
Transcript of Towards sustainable microfinance: The case of Capitec Bank ...

Univers
ity of
Cap
e Tow
n
Towards sustainable microfinance: The case of Capitec
Bank and Grameen Bank
A Thesis
presented to
The Graduate School of Business
University of Cape Town
In partial fulfilment
of the requirements for the
Master of Commerce Degree in Development Finance
by
Annette Verryn
December 2014
Supervised by: Prof Nicholas Biekpe

Univers
ity of
Cap
e Tow
n
The copyright of this thesis vests in the author. No quotation from it or information derived from it is to be published without full acknowledgement of the source. The thesis is to be used for private study or non-commercial research purposes only.
Published by the University of Cape Town (UCT) in terms of the non-exclusive license granted to UCT by the author.

i
PLAGIARISM DECLARATION
I know that plagiarism is wrong. Plagiarism is to use another’s work and pretend that it is one’s
own.
I have used a recognised convention for citation and referencing. Each significant contribution
and quotation from the works of other people has been attributed, cited and referenced.
I certify that this submission is my own work.
I have not allowed and will not allow anyone to copy this essay with the intention of passing it
off as his or her own work
Annette Verryn

ii
ABSTRACT
This thesis investigates the level of sustainability of two microfinance institutions (MFIs):
Grameen Bank of Bangladesh and Capitec Bank of South Africa. Data from 2004 to 2013 is
used in this study employing internationally accepted sustainability criteria, namely, the Small
Enterprise Education and Promotion (SEEP) 2010 Microfinance Financial Reporting Standards
(MFRS) and the SEEP Framework of 2005. The results of this study indicate that although the
operations of both microfinance institutions are sustainable, Capitec Bank exhibits a higher
level of sustainability as compared to Grameen Bank. This is evidenced by Capitec Bank’s
higher levels of profitability, capital adequacy and solvency, operational self-sufficiency, and
healthier asset portfolio.
This finding underlines South Africa’s financial sector’s stability, institutional quality,
competitive market, and solid regulatory framework. The sustainability criteria suggest that
Capitec Bank and other South African MFIs should heed Grameen Bank’s low ROE and
insufficient capital adequacy and solvency measures. Ensuring healthy and strategic lending
portfolios gives a good ROE for a firm’s shareholders. Furthermore, the capital adequacy and
solvency ratios have important implications for an institution’s capital structure. Therefore,
Capitec and South African MFIs should maintain healthy ROE, capital adequacy and solvency
ratios in order to ensure their long-term sustainability.
As future research, it would be useful if data were made available to enable an assessment of
a failed South African MFI to obtain clearer insight into the South African microfinance
sector. Furthermore, data on Grameen and Capitec’s asset quality and social performance will
give additional insight into the social sustainability of these two MFIs.

iii
TABLE OF CONTENTS
PLAGIARISM DECLARATION ............................................................................................... i
ABSTRACT ............................................................................................................................... ii
TABLE OF CONTENTS .......................................................................................................... iii
LIST OF TABLES ..................................................................................................................... v
GLOSSARY OF TERMS ......................................................................................................... vi
ACKNOWLEDGEMENTS .................................................................................................... viii
1 INTRODUCTION .............................................................................................................. 1
1.1 Background ............................................................................................................................. 1
1.2 Problem Statement .................................................................................................................. 3
1.3 Objectives of the Study ........................................................................................................... 4
1.4 Research Questions and Scope ................................................................................................ 5
1.5 Research relevance .................................................................................................................. 5
1.6 Limitations .............................................................................................................................. 6
1.7 Outline of study ....................................................................................................................... 7
2 LITERATURE REVIEW ................................................................................................... 8
2.1 Microfinance ........................................................................................................................... 8
2.2 Perspectives to Microfinance .................................................................................................. 9
2.3 Microfinance Institutions ...................................................................................................... 10
2.4 Sustainability and Financial Performance ............................................................................. 12
2.5 Performance Measures .......................................................................................................... 13
2.5.1 Profitability ........................................................................................................................ 18
2.5.2 Capital Adequacy and Solvency ........................................................................................ 20
2.5.3 Liquidity ............................................................................................................................ 20
2.5.4 Efficiency and Productivity ............................................................................................... 20
2.5.5 Self-sufficiency ................................................................................................................. 22
2.6 Microfinance in South Africa ................................................................................................ 22
3 RESEARCH METHODOLOGY ...................................................................................... 26
3.1 Research Approach and Strategy .......................................................................................... 26
3.2 Data Collection, Frequency and Choice of Data ................................................................... 28
3.3 Data Analysis Methods ......................................................................................................... 28
4 RESEARCH FINDINGS, ANALYSIS AND DISCUSSION .......................................... 31
4.1 The Case Studies ................................................................................................................... 31
4.1.1 Grameen Bank ................................................................................................................... 31
4.1.2 Capitec ............................................................................................................................... 33
iv
4.2 Profitability ............................................................................................................................ 36
4.2.1 Return on Equity ............................................................................................................... 36
4.2.2 Return on Assets ................................................................................................................ 37
4.2.3 Operating Expense Ratio ................................................................................................... 38
4.3 Capital Adequacy and Solvency ............................................................................................ 39
4.3.1 Capital Asset Ratio ............................................................................................................ 39
4.3.2 Debt to Equity Ratio .......................................................................................................... 40
4.4 Liquidity ................................................................................................................................ 41
4.4.1 Liquid Assets ..................................................................................................................... 41
4.5 Efficiency .............................................................................................................................. 41
4.5.1 Portfolio to Assets ............................................................................................................. 41
4.6 Self-sufficiency ..................................................................................................................... 42
4.6.1 Operational Self-Sufficiency ............................................................................................. 42
5 RESEARCH CONCLUSIONS AND RECOMMENDATIONS FOR FUTURE
RESEARCH ............................................................................................................................. 44
REFERENCES ......................................................................................................................... 46
APPENDIX I ............................................................................................................................ 60
APPENDIX II .......................................................................................................................... 62
APPENDIX III ......................................................................................................................... 64

v
LIST OF TABLES
Table 2-1: Additional rating agencies ...................................................................................... 14
Table 3-1: An overview of the core SEEP financial ratios and tables ..................................... 27
Table 3-2: An overview of the financial ratios used ................................................................ 29
Table 4-1: Overview of Grameen Bank ................................................................................... 32
Table 4-2: Overview of Capitec Bank ...................................................................................... 35
Table I-1: Rating report topics ................................................................................................. 60
Table II-1: Quantitative indicator ratios ................................................................................... 62
Table III-1: Outcome of the indicators for Grameen Bank ...................................................... 64
Table III-2: Outcome of the indicators for Capitec .................................................................. 65

vi
GLOSSARY OF TERMS
BANKSETA Bank Sector Education and Training Authority
BSC Balanced scorecard
CAMEL Capital adequacy (C), asset quality (A), management capability (M),
earnings (E), liquidity management (L), and sensitivity to market risk
CBA Cooperative Banks Act
CGAP Consultative Group to Assist the Poor
DEA Data Envelopment Analysis
FSS Financial Self-Sufficiency
GDRC Global Development Research Center
IFRS International Financial Reporting Standards
Ltd Limited
LSM Living Standards Measure
MBB MicroBanking Bulletin
M-CRIL Micro-Credit Ratings International Ltd
MFIs Microfinance institutions
MFRC Micro Finance Regulatory Council
MFRS Microfinance Financial Reporting Standards
MICROS Management (M), institutional arrangement (I), capital adequacy and
asset quality (C), resources (R), operational effectiveness (O), and
scalability and sustainability (S)
MIR Microfinance Institutional Rating
MIX Microfinance Information Exchange
NCA National Credit Act
NDP National Development Plan
NGO Non-governmental Organisations
OSS Operational Self-Sufficiency
PAR Portfolio at Risk
PEARLS Protection (P), effective financial structure (E), asset quality (A), rates
of return and costs (R), liquidity (L), signs of growth (S)
ROA Return on Assets
ROE Return on Equity
ROI Return on Investment

vii
RoSCAs Rotating savings and credit associations
S&P Standard & Poor’s
SEEP Small Enterprise Education and Promotion
SHF Shareholder Owned Firms
SMME Small, Micro, and Medium-Sized Enterprise
TBB The Business Bank
viii
ACKNOWLEDGEMENTS
I would like to acknowledge the following people and express my sincere gratitude for their
valuable contribution:
Prof Nicholas Biekpe, my supervisor, for his assistance on earlier drafts.
I would like to thank Dr Emmanuel Owusu-Sekyere who was very generous with his time and
provided guidance and insight when I was at the end of my tether and did not know how to
continue.
Lastly, but most importantly, I want to thank my husband Thomas Verryn. You are my rock.
Even when things were tough, you stayed patient, encouraging, and loving. Dankie!

1
1 INTRODUCTION
1.1 Background
Income inequalities and poverty can be decreased by financial development; directly, through
financial inclusion, and indirectly through the effect of economic growth on poverty reduction
conditioned on how equitably the gains from growth is distributed (Aghion, Caroli & Garcia-
Penalosa, 1999, as cited in Green, Kirkpatrick & Murinde, 2005; Kanbur, 2000).
The role of finance in alleviating poverty and aiding development has evolved and led to the
birth of microcredit in its current form. In the 1970s, Professor Muhammad Yunus, employed
innovative microcredit approaches to improve the lives of the poor in a village in southeast
Bangladesh (Boudreaux & Cowen, 2008). The experiment was successful; modern microcredit
and the Grameen Bank were born. According to Professor Yunus (as cited in Reed, 2011:1),
The success of our venture lies in how many crumpled bank bills our once starving
members now have in their hands. But the microcredit movement, which is built around,
and for, and with money, ironically, is at its heart, at its deepest root not about money at
all. It is about helping each person to achieve his or her fullest potential. It is not about
cash capital, it is about human capital. Money is merely a tool that unlocks human dreams
and helps even the poorest and most unfortunate people on this planet achieve dignity,
respect, and meaning in their lives.
However, over the past few decades microcredit has evolved into microfinance, which includes
a broader range of products and services for poor and low income households. In addition to
needing access to microcredit, poor and low-income people require reliable, safe, and
affordable financial services to save and insure (Matin, Hulme & Rutherford, 2002).
Microfinance institutions (MFIs) are an important source of finance to poor people. Low-
income households are more vulnerable to, the impact of illness, natural disasters, theft, and
unemployment than households with higher levels of income (World Bank, 2001). In order for
them to cope with emergencies they need financial services, i.e. insurance, credit, and savings

2
that will enable them to survive disasters, cover living costs and save for future eventualities.
Access to and use of financial services empowers the poor by giving them the ability to manage
their resources (Center for Financial Inclusion, 2013). Furthermore, MFIs allow low-income
households access to financial services without the burdensome and bureaucratic practices
found in the formal financial sector (Mukama, Fish & Volschenk, 2005).
Microfinance promises to assuage poverty while covering its costs and perhaps even making a
profit (Woller, 2002). Woller continues that this promise is the reason for microfinance’s appeal
and rise to world-wide prominence. It follows that MFIs needs to be sustainable in order to
deliver on this promise.
Rao (2003) states that an MFI’s key purpose is to deliver sustainable microfinance with
economic development objectives. Rao continues that MFIs are considered to be sustainable
when they are profitable and efficient whilst pursuing lending priorities for the asset-poor, so
as to elevate the economic status of their clients without dependence on substantial subsidies.
Furthermore, the success of an MFI is dependent on both return on investment (ROI) and the
number of low-income households it serves on a sustainable basis (Khan, 2008). However,
generally the poor pay interest rates that are not high enough to cover the operating costs of the
MFI and consequently the MFI either remains dependent on donor contributions or fails
(Morduch, 1999, as cited in Khan, 2008). Sustainable MFIs are advantageous as clients are
more confident in stable institutions and MFIs can reach broader markets when financially
viable without depending on subsidies to target a small part of the population (Paxton &
Cuevas, 2002). In addition, there are three reasons for emphasising profitable MFIs. Firstly,
microcredit is expensive for banks to administer and poor people can pay high interest rates,
therefore access to microfinance is more important that its price. Secondly, subsidies caused
problems in state banks and some non-governmental organisations (NGOs), as continuous
subsidisation can reduce incentives for innovation and cost-cutting. Finally, there are not
enough subsidies available to grow the sector sufficiently. Thus if the objective is to widen
access to microfinance, there is no other alternative than pursuing financial sustainability and
eventually full commercialisation (Cull, Demirgüç-Kunt & Morduch, 2009).
3
This led to donors encouraging all MFIs to increase interest rates, use subsidies in moderation
and only in the start-up phase, earn profits, and grow as quickly as profits allow (Cull,
Demirgüç-Kunt & Morduch, 2009).
In addition to the above reasons for an increased emphasis on financial sustainability, Rhyne
and Otero (2006) contends that it is due to important developments in the microfinance industry
that include: increased competition, commercialisation of MFIs, technology, and the policy and
regulatory environment.
1.2 Problem Statement
If MFIs are to be successful at alleviating poverty, they need to be sustainable. Microfinance
institutions promote financial inclusion, which leads to the attainment of assets and
management of risks. Thus, MFIs increase people’s productivity and employment
opportunities. When MFIs fail, the poor become more vulnerable.
Although South Africa is ranked seventh globally for financial market development, the
development finance sector seems to be sluggish, if not declining (Schwab, 2014). In 2013,
three of the largest micro-enterprise lenders, Marang Financial Services, Women’s
Development Business, and the Absa Micro-enterprise Finance Division, failed (University of
Pretoria & Bank Sector Education and Training Authority [BANKSETA], 2013). Furthermore,
in 2014 African Bank was placed under curatorship by the South African Reserve Bank (South
African Reserve Bank, 2014). This leads to the question whether the South African
microfinance sector is sustainable.
In 2013, the South African government adopted the National Development Plan (NDP), which
aims to eliminate poverty and reduce inequality by 2030. One way of achieving this is by
strengthening financial services and by decreasing the cost thereof and improving access for
small- and medium-sized firms (National Planning Commission, 2012). Furthermore, the South
African government’s Cabinet approved the first draft Financial Sector Regulation Bill in
December 2013 and the revised draft of the Bill was published at the end of 2014 for further
comment (National Treasury, 2014a). Cabinet approved the implementation of a ‘twin-peaks’

4
model of financial regulation in 2011 to make the South African financial sector safer; the draft
bill is the first in a series to implement this model. Twin peaks is a broad and inclusive
framework for regulating the financial sector. The proposed Bill will establish a new Prudential
Authority within the South African Reserve Bank, which will be responsible for the promotion
and maintenance of financial stability of banks, insurers and financial conglomerates (National
Treasury, 2014b; National Treasury, 2013).
Although government appears to be dedicated to the objective of financial inclusion and a stable
financial sector, current measures were not adequate to prevent the collapse of these three MFIs.
Marang and Women’s Development Business both failed due to the absence of strong
governance and leadership. Additionally, Marang’s lack of access to on-lending capital added
to its deteriorating portfolio and decreasing sustainability. Conversely, Absa’s Micro-enterprise
Finance Division was unsuccessful due to high overhead costs and aspects of its best practices
and culture were not aligned to microfinance lending but rather to traditional banking
(University of Pretoria & BANKSETA, 2013). The collapse of these three MFIs in South Africa
within a space of a year merits the need to investigate the extent to which the microfinance
sector in South Africa is sustainable using internationally accepted sustainability criteria such
as the Small Enterprise Education and Promotion (SEEP) 2010 Microfinance Financial
Reporting Standards (MFRS) and the SEEP Framework of 2005.
1.3 Objectives of the Study
The objective of this study is to investigate the extent to which the microfinance sector in South
Africa is sustainable. A comparative analysis is done using a case study of Grameen Bank of
Bangladesh and Capitec Bank in South Africa1. The aim is to establish whether there are any
lessons to be learnt by South Africa’s microfinance sector from international best practice using
Grameen Bank as the comparative case study.
1 Due to the repetition of certain phrases, Capitec Bank will be referred to Capitec and Grameen Bank as Grameen.
Furthermore, the words self-sufficiency, profitability and sustainability will be used interchangeably.

5
1.4 Research Questions and Scope
In light of the above, this thesis investigates the financial sustainability of the South African
microfinance sector by using Capitec Bank as a proxy and comparing it with Grameen Bank.
The research questions therefore are:
Are Capitec Bank and Grameen bank profitable?
How adequate are their levels of capital and how solvent are these two institutions?
What is the level of liquidity of these two institutions?
How efficient and productive are their lending portfolios and personnel?
To what extent are the two institutions self-sufficient?
Are Capitec and Grameen Bank’s financial performance sustainable?
A sub-question that the thesis will attempt to answer is:
Can Capitec and other South African MFIs learn any lessons from Grameen Bank?
1.5 Research relevance
A number of studies have researched the microfinance sector albeit focusing on specific aspects
of financial sustainability. Dumont and Schmit (2014) assessed MFI’s financial strength by
analysing 30 of the largest MFIs’ cash flow statements between 2006 and 2010. The focus of
their study was solely on the financial performance of the 30 MFIs. Furthermore, Ncube (2009)
assessed the efficiency of the South African banking sector by analysing the cost and profit
efficiency of four large and four small South African banks, one of which is Capitec, using the
stochastic frontier model over the 2000 to 2005 period.
Other studies have investigated the South African microfinance industry. Volschenk and
Biekpe (2003) examined the South African microfinance sector by comparing differences in
this sector by ranking particular challenges of 53 MFIs. In another study, Baumann (2004)
compared the performance of four South African microfinance NGOs, which have a poverty-
alleviation focus, against several benchmarks extracted from the MicroBanking Bulletin
(MBB). Furthermore, Daniels (2004) evaluated the formal microcredit sector in South Africa
and the regulatory environment of this sector between 1990 and 2000. Additional studies

6
investigated the impact of other South African MFIs, e.g. Afrane (2002) performed an impact
study of the Sinapi Aba Trust in Ghana and the Soweto Microenterprise Development project
in South Africa on four broad areas, namely economic, access to basic services, social, and
psychological and spiritual aspects of the lives of beneficiaries and their communities. Mosley
and Rock (2004) examined six African MFIs in order to assess their poverty impact, using the
Small Enterprise Foundation and the Farmer Support Programme in the case of South Africa.
Hietalahti and Linden (2006) examined the socio-economic impacts of microcredit on women’s
welfare by assessing the Small Enterprise Foundation and the Tšhomisano Credit Programme.
This study differs from previous studies by looking at all the sustainability criteria used by the
SEEP MFRS and SEEP Framework with the exception of asset quality due to data constraints.
A direct comparative analysis is done between a representative South African MFI, namely
Capitec Bank, and the world renowned MFI, Grameen Bank of Bangladesh. This affords us the
ability to more directly identify which lessons could be learnt by South Africa’s MFI sector,
from Grameen Bank, to ensure its sustainability going forward, in light of the recent collapse
of three MFI institutions in South Africa.
1.6 Limitations
This thesis concentrates on the financial performance and sustainability of Grameen and
Capitec. It did not focus on social performance. Although both of these aspects are important
measures of the success of an MFI, there was not sufficient data to measure social performance.
Furthermore, the SEEP MFRS uses the cash ratio and the SEEP Framework uses the liquid
ratio as a measure for liquidity. However, due to unavailability of data for these ratios, this
thesis uses the liquid assets ratio as specified by the Microfinance Information Exchange
(MIX) database.
The cost per active client ratio is used as a productivity measure by SEEP MFRS. However,
as data was only partially available for this ratio, it was also not used in the thesis.

7
In light of the recent collapse of three MFIs in South Africa, a clearer counterfactual study
would have been to compare a failed MFI with a successful MFI. However this was not feasible
due to unavailability of data and lack of access to relevant information as a result of official
barriers and red tape.
1.7 Outline of study
This thesis is divided into five sections. Section 2 reviews relevant literature; section 3 details
the research methodology; section 4 analyses the research findings; section 5 concludes and
makes recommendations for future study.

8
2 LITERATURE REVIEW
2.1 Microfinance
Financial services to low-income households serve as hope of poverty alleviation for poor
households (Morduch, 1999). The expectation is that financial services, i.e. microfinance, can
fundamentally change the economic and social structures of these households. Microfinance
institutions share a commitment to supplying financial services to households that have
previously been excluded from the formal banking sector.
In this thesis, microfinance is defined ‘as the provision of financial services in limited amounts
to low-income persons and small, informal businesses’ (Basel Committee on Banking
Supervision, 2010:1). The Bank for International Settlements describes microfinance as ‘a
business line that can be carried out by a wide range of institutions providing a range of financial
services, such as lending, deposit taking, insurance, payments and funds transfers’ (Basel
Committee on Banking Supervision, 2010:34).
Initially the microfinance framework was based on sector-directed, supply-led and subsidised
credit and grounded on incorrect assumptions regarding the willingness and ability of poor
people to pay for financial services, leading to flawed policy designs and implementation.
However, a new paradigm has developed over the last two decades from poor people’s
willingness and ability to pay for savings, credit and insurance services. This new paradigm
focuses on sustainable financial institutions and systems (Zeller & Johannsen, 2006).
Furthermore, poor people are generally excluded from the formal banking system due to a lack
of collateral (Morduch, 2000). Inclusive financial systems (access to financial services without
price or non-price barriers2) benefit the poor and other disadvantaged groups. When poor people
are financially excluded they must rely on their own limited savings to either become
2 Price barriers are the high cost of transactions of financial services. Non-price barriers include but are not
restricted to geographical access to banks, lack of proper documentation of borrower, and minimum deposits
(Manji, 2010). Other non-price barriers include lack of financial infrastructure, restrictive regulations, governance
collapses, and a shortage of appropriate products (Standard Chartered Bank, 2014).

9
entrepreneurs or invest in their education, and small businesses must rely on their constrained
earnings to pursue business growth opportunities. This causes continued income inequality and
slower economic growth (Demirgüç-Kunt & Klapper, 2012).
This focus on financial inclusion in order to reduce poverty and to enable the poor to become
entrepreneurs is generally described in the literature as outreach (Hermes, Lensink & Meesters,
2011).
The Consultative Group to Assist the Poor’s (CGAP, 2006) vision for inclusive financial
systems is a world in which all poor people have permanent access to a broad range of quality
financial services, supplied by a diverse type of organisations, through a variety of convenient
instruments. As mentioned above, financial services play an important role in poverty
alleviation. When poor people have permanent access to financial services they become
empowered to embark on income earning ventures that help to alleviate poverty. Various
academics have investigated the impact of lack of capital on entrepreneurs. In a study by Evans
and Jovanovic (1989) it was found that capital is essential for starting a business, illustrating
the necessity of microfinance and financial inclusion. Furthermore, when good practice is
applied and microfinance is delivered sustainably, financial services can benefit poor
households by helping them progress from only surviving to planning for the future, obtaining
physical and financial assets, and investing in improved nutrition, better living conditions, and
their children’s health and education (CGAP, 2006). Furthermore, Robinson (2001) looked at
various case studies and deduced that microfinance promotes education and health and reduces
the incidence of child labour.
2.2 Perspectives to Microfinance
Different scholars and groups describe the objectives of MFIs in various ways. Balkenhol
(2007) states that an MFI’s objective is to assist the poor in better managing risk, taking
advantage of income generating opportunities, and empowering themselves through
institutionalisation.

10
However, responsAbility (2014) contends that an MFI’s principal objective is to become an
efficient financial institution that provides a wide range of suitable products and services to a
significant number of households and small businesses at affordable rates.
The emphasis of these two objectives is different. The first objective is of a social nature
referred to as the ‘welfarists’ perspective; whereas the second objective is firstly of a financial
nature and thereafter a social nature known as the ‘institutionalist’ perspective. The
institutionalist perspective emphasises financial sustainability and contends that MFIs should
not have to depend on external donors. Conversely, welfarists argue that the social objective of
MFIs is most important and should come first (Morduch, 2000, as cited in Serrano-Cinca,
Gutiérrez-Nieto & Molinero, 2011).
However, most academics and development practitioners agree that MFIs have a double bottom
line – outreach and sustainability. Microfinance institutions’ performance is of significance
with regards to both financial results and social impact. Microfinance institutions have a
combination of these objectives in their mission statement and policy, although their emphases
on these goals vary (Balkenhol & Hudon, 2011).
2.3 Microfinance Institutions
Microfinance institutions can be categorised according to two criteria: their legal status and
their lending methodology (Zeller & Johannsen, 2006). According to the first criteria,
microfinance providers can be classified as formal, semi-formal or informal institutions. First,
formal institutions include: private- and state-owned banks, postal banks, and non-bank
intermediaries, such as finance or insurance companies that operate within the banking laws of
a country. Semi-formal institutions include NGOs, cooperatives and sometimes banks with a
special charter. Finally, informal institutions are a varied group that offer unregistered sources
of credit; these include friends and family, employers, loan sharks, pawnbrokers, rotating
savings and credit associations (RoSCAs). However, some informal microfinance providers
become semi-formal (for example managed RoSCAs that register as chit funds in India) and a
number of MFIs evolve from semi-formal to formal institutions (such as the NGO, PRODEM,
that became BancoSol in Bolivia) (Matin, Hulme & Rutherford, 2002).
11
The second criteria, lending methodology, refers to the manner in which loans are given. The
classification used is individual loans, group loans, and village banks, which are bigger groups
of about 20 members (Mersland & Strøm, 2009). Both Capitec and Grameen use individual
loan methodology.
Group lending methodology refers to loans made to individuals in small groups (typically
consisting of three to seven neighbours). However, the group as a whole is jointly liable for the
repayment of the outstanding loan if repayment difficulties should arise.
Zeller and Johannsen (2006) studied poverty outreach by type of MFI in Bangladesh and Peru
and found that group-lending institutions generally attain the most depth of poverty outreach.
However, their study does not provide definite evidence of whether an MFI’s legal status is the
critical criterion for poverty outreach. A paper by Mersland and Strøm (2009) confirms the
finding that outreach is higher for group-lending institutions. They examined the relationship
between firm performance and corporate governance in MFIs. However, they find that non-
profit organisations and shareholder firms have the same financial performance and outreach.
Conversely, Armendáriz de Aghion and Morduch (2000) investigated individual-lending
methodology and found that evidence suggests that clients in areas that are moderately
industrialised does not benefit from group loans. They suggest that MFIs rather use direct
monitoring, regular repayment arrangements, and non-refinancing threats to effectively enter
new segments of the credit market.
Brau and Woller (2004) suggest that the capital market be utilised to give MFIs the required
resources to be sustainable and that if investors can receive earnings equal to the risk accepted,
the vision of MFIs being a poverty-alleviation instrument can be achieved in larger proportions.
Furthermore, Mersland and Strøm (2008) analysed 132 NGOs and 68 shareholder owned firms
(SHFs) to establish whether the ownership type of an MFI is significant with regards to
sustainability. Their paper established that NGOs can be as sustainable and well-performing as
SHFs. Their findings suggest that there is minimal difference between shareholder owned MFIs
and non-government MFIs.

12
2.4 Sustainability and Financial Performance
Sustainability is defined as the degree to which an organisation, in affecting its target market,
‘covers the costs of providing financial services after adjustments to its profit and loss
statement’ (Saltzman, Rock & Salinger, 1998:12). Sustainability in microfinance equates to
financial self-sufficiency (Brau & Woller, 2004).
However, financing the poor can be costly and thus the sustainability of an MFI may be at the
expense of outreach. Providing small credit amounts involves high transaction costs with
regards to screening, monitoring and administration costs, per loan (Hermes, Lensink and
Meesters, 2011). This can cause a trade-off between sustainability and outreach.
Cull, Demirgüç-Kunt and Morduch (2007) completed a comprehensive study, examining the
financial performance (using profitability measures) and outreach of 124 MFIs in 49 countries.
The study confirms the trade-off between profitability and outreach. Furthermore, the paper
also investigated whether MFIs move away from serving the poor when pursuing improved
financial performance (mission drift). The research finds that group-based lenders have less
mission drift than MFIs with individual lending methodology. Another study by Cull,
Demirgüç-Kunt and Morduch’s (2009) findings support this idea. They contend that although
commercial investment is required to fund the continuous growth of microfinance, MFIs with
strong poverty reduction objectives rather than commercial goals, are better positioned to reach
and supply poor clients with financial services.
In another study, Hoque, Chishty & Halloway (2011) analysed the impact of commercialisation
on MFIs’ capital structure, mission, and performance. Their analysis found that MFIs should
not become commercial entities and should rather implement a non-commercial approach to
financing. Their study suggests that commercialisation of MFIs cause mission drift.
Conversely, Quayes (2012) investigated data from 702 MFIs in 83 countries and found a
positive complementary relationship between self-sufficient MFIs and depth of outreach.

13
2.5 Performance Measures
As the self-sufficiency of MFIs is becoming increasingly important, various performance
measurements have been developed. These measurements are used by investors or donors,
depending on the MFI’s funding model, and the institution’s management to measure their
sustainability.
Microfinance institutions are ultimately financial institutions that deal in money. In order to
purchase and sell money, margins are important. It is also essential to operate efficiently to
keep the nominal interest rates charged by MFIs low. However, MFIs also perform a social
function by granting much needed credit to poor people. Therefore, it is important to assess
both an MFI’s financial and social performance (Serrano-Cinca, Gutiérrez-Nieto & Molinero,
2011).
There are various ways of assessing an MFI’s financial performance; one method is by using
performance measurement systems (PMSs). There are various PMSs that are not MFI specific
but can be adapted to measure an MFI’s performance. One of the best known PMSs is the
balanced scorecard (BSC) developed by Kaplan and Norton in the 1990s. In addition to the
conventional financial measures, the BSC further evaluates and promotes the required
behaviours within the organisation by looking at four broad elements, i.e. financial, customer,
internal processes, and organisational learning. These elements describe and measure activities
that are important to the efficient and successful performance of a company (Waweru &
Spraakman, 2012).
Another means of assessing MFIs financial performance is by using a rating agency. Various
microfinance rating agencies specialise in evaluating MFIs. However, there are other types of
companies that rate MFIs, e.g. ACCION International, a microfinance organisation, and
Standard & Poor’s (S&P) who initially only rated traditional financial institutions. Credit
ratings for banks normally concentrate on three key financial ratios, namely ROE, cost income
ratio, and stock-picking ratios, whereas ratings of MFIs mostly concentrate on asset quality and
efficiency so as to attract investments (Berling, 2004).

14
The four largest specialised microfinance rating agencies, MicroRate, Micro-Credit Ratings
International Limited (Ltd) (M-CRIL), Planet Rating, and MicroFinanza Rating, collaborated
in 2011 to develop a shared financial rating product name and a specialised microfinance ratings
comparability table. The collaboration also involved a public consultative process to gather
information from industry experts before finalising the new financial rating product name and
ratings comparability table. During 2012, the shared financial rating product was named
Microfinance Institutional Rating (MIR) (Abrams, 2012).
Each of the four rating agencies agreed to accept MIR as its main rating product name, but will
continue using their prior respective proprietary methodologies as well as rating grades and
lettering systems. The various rating report topics covered by the four agencies are set out in
table 1-1 in Appendix I.
According to Abrams (2012) an MIR gives an opinion on the long-term sustainability and
creditworthiness of both regulated and unregulated MFIs through a thorough assessment of
risks, performance, and market position.
According to the Global Development Research Center ([GDRC], n.d.), ratings, standardised
performance standards, and benchmarking will become more important. This is because firstly,
performance standards promote the quality and efficiency of MFIs and give private investors
assurance. Secondly, in a cut-throat environment where MFIs are pressured to become
commercial, regulators can use ratings and performance standards to split average and excellent
MFIs. Thirdly, donors want to set performance standards to give well-defined benchmarks and
guidelines to decide on future subsidies for MFIs.
Other rating agencies and companies that assess and rate MFIs and the methodology they use,
are listed in the table below.
Table 2-1: Additional rating agencies

15
Agency Methodology
ACCION International CAMEL diagnostic tool. It serves as a guideline for MFIs
that want to develop into formal, licensed financial
intermediaries. The acronym stands for Capital adequacy
(C), asset quality (A), management capability (M), earnings
(E), and liquidity management (L).
Apoyo & Asociados
Internacionales (AAI) (Fitch
Ratings associate)
AAI is a Peruvian company and applies the Fitch Ratings
Inc. conventional rating methodology to MFIs in Peru with
a benchmarking approach.
CRISIL Ltd (S&P is its major
shareholder)
An Indian company, CRISIL uses MICROS methodology
that is MFI specific. The acronym is for: management (M),
institutional arrangement (I), capital adequacy and asset
quality (C), resources (R), operational effectiveness (O),
and scalability and sustainability (S).
MicroBanking Bulletin
(MBB)
It is a benchmarking source for the microfinance sector. The
MBB publishes financial and portfolio data that is
voluntarily provided by MFIs. The MFIs are grouped
according to their characteristics and a peer group
framework is developed. Benchmarks are established for
each group. Peer groups are formed on the following main
indicators: region, scale of operations, and target market.
Furthermore, financial data is adjusted to ensure
comparability of results. The adjustments are: inflation,
subsidies, and loan-loss provision and write-offs.
PEARLS This is the World Council of Credit Unions (WOCCU)
rating system and offers credit union managers concise and
easily read reports that expose organisational weaknesses
and trends.
Each letter of the acronym measures the key areas of credit
union operations: protection (P), effective financial
structure (E), asset quality (A), rates of return and costs (R),
liquidity (L), signs of growth (S), and yield.

16
Agency Methodology
SEEP (Small Enterprise
Education and Promotion)
Network
Developed standardised methods to measure and analyse
financial performance and risk management for the
microfinance industry, called the Microfinance Financial
Reporting Standards (MFRS). It is designed to be used by
all MFIs and consists of 21 core financial ratios and tables,
and 6 additional non-core financial ratios (see table 3-1).
Standard & Poor S&P developed methodology for rating microfinance
securitisations. Its analysis of microfinance transactions
includes, where appropriate, sections of their rating
methodologies for both collateralised debt obligation
transactions and consumer finance. They adjust the
methodologies to address factors that are particular to
emerging markets and the microfinance sectors.
Source: Berling, 2004; S&P, 2008; MIX, 2010a; SEEP, 2010; GDRC, n.d.
Although financial and social performance are both valid performance dimensions in their own
right, it seems that being more partial to one than the other is against the idea of microfinance.
This conundrum has led to an interest in efficiency as a third performance dimension. Efficiency
measures ‘the maximisation of outputs for a given set of inputs, respectively the minimisation
in input use for a given set of outputs’ (Balkenhol & Hudon, 2011).
Efficiency is a convenient measure, especially for donors that have to decide whether to
continue subsidisation of an MFI, especially after the ten years thought necessary to let an MFI
mature to financial self-sufficiency (Balkenhol & Hudon, 2011).
Due to MFIs having different production functions and not having the same inputs and outputs,
the efficiency measure may be different for various MFIs. Certain MFIs have a high efficiency
due to excellent technical proficiency or productivity values, measured by the number of
borrowers to loan officers. Other MFIs may have high efficiency due to the maximisation of
returns for a given level of operating expense, i.e. allocative efficiency – the efficient use of
operating expenses (Balkenhol & Hudon, 2011).

17
However, as financial performance can be measured more easily than social performance,
efficiency ratios mostly use financial aggregates. Efficiency in microfinance is mostly
measured by the operating expense ratio (Balkenhol & Hudon, 2011) (as calculated in Table II-
1, Appendix II and discussed further later).
Other efficiency indicators include (SEEP, 2010; Balkenhol & Hudon, 2011):
Cost income ratio: Operating expense/Total revenues
Cost per active client: Operating expense/Average number of active clients
Average deposit account balance: Total deposits/Number of deposit accounts
Cost per borrower (as described below): Operating expense/Average number of active
borrowers
Cost per loan: Adjusted operating expense/Adjusted average number of loans
Operating expense/Loan portfolio
Personnel expense/Loan portfolio
Average salary/GNI per capita
Another useful way of measuring the performance and efficiency of MFIs is the Data
Envelopment Analysis (DEA) method. This method evaluates the relative efficiency in which
an organisation uses inputs to generate outputs. In this case, the outputs can be either financial
or social (Serrano-Cinca, Gutiérrez-Nieto & Molinero, 2011).
Furthermore, ratios that are essential when measuring an MFI’s self-sufficiency is operational
self-sufficiency (OSS), discussed in the next section, and financial self-sufficiency (FSS).
Financial self-sufficiency looks at how well an MFI would cover its costs if the operations were
unsubsidised (Serrano-Cinca, Gutiérrez-Nieto & Molinero, 2011).
However, SEEP (2010) excluded these two ratios from the MFRS because once an MFI surpass
100% sustainability or the breakeven point the ratios are less useful when measuring
profitability. According to SEEP (2010) Return on Average Assets and Return on Average
Equity are commercial ratios that are more suitable when analysing an established MFI’s
profitability.

18
Most of the ratios discussed above are related to financial performance measures. Unfortunately
there is still no standard for social performance measures in the microfinance industry. The
proxies normally used for outreach is the gender split of the MFI’s customer base, the size or
terms of the loan contract, the price and transaction costs accepted by the client, the number of
clients, the financial and institutional strength of the lender, and the number of products the
institutions offers, including deposits (Navajas et al., 2000). Other proxies include the number
of clients below the poverty line, or those whose income is less than one dollar a day and the
ratio of borrowers per staff member (Serrano-Cinca, Gutiérrez-Nieto & Molinero, 2011).
The number of clients indicates the breadth of outreach (scale). The higher this number, the
greater the extent of outreach. Furthermore, the average loan size per customer is commonly
used as an indicator of the depth of outreach (reaching the poor) (Serrano-Cinca, Gutiérrez-
Nieto & Molinero, 2011). In addition, the number of female borrowers is frequently used as a
social indicator as many MFIs’ objective is to support women. This is because women are
generally the poorest of the poor, and it is thought that they are the main providers of health
and education in the family.
As can be seen from the above discussion and Table II-1 in Appendix II, the various indicators
used for this thesis have been used repeatedly by various sources. A more in-depth discussion
on the indicator choice follows in Chapter 3. Table 3-3 in Chapter 3 gives an overview of each
of the indicators used, the purpose of each indicator and the application thereof. Table II-1
Appendix II gives the calculations for each indicator.
2.5.1 Profitability
Return on equity (ROE) and return on assets (ROA) are both profitability measures that
summarise the performance in the company as a whole. Thus, if asset quality is poor or
efficiency low it will be exposed in these measures (Von Stauffenberg et al., 2014).
According to Gaul (2011), ROA is the most elementary and comparable measure of profit for
MFIs. Returns encapsulate all revenues and expenses of an MFI, i.e. lending, personnel
expenses, rent, utilities, providing for loan losses. However, according to Serrano-Cinca,

19
Gutiérrez-Nieto and Molinero (2011) using ROA makes sense when measuring the
performance of an industrial firm that uses assets such as plant and equipment to generate profit.
Therefore, the turnover of a financial organisation does not necessarily pertain to total assets.
Tucker and Miles (2004) performed a study wherein they compared the performance of self-
sufficient MFIs to those that are not yet sustainable and regional commercial banks in
developing countries. They found that self-sufficient MFIs perform well on ROE and ROA.
Another measure of profitability is the operating expense ratio. However, this ratio is used in
other studies as an efficiency ratio (Balkenhol & Hudon, 2011; Serrano-Cinca, Gutiérrez-Nieto
& Molinero, 2011). For example, Balkenhol and Hudon (2011) define efficiency in
microfinance as the operating expense ratio (see Table II-1 in Appendix II for the calculation).
However, in Mersland and Strøm’s (2008) study they use the operating expense ratio as a
measure of profitability and their findings suggest that SHFs are not managed more profitably
than NGOs when considering this ratio. Furthermore, Rauf and Mahmood (2009) investigated
the growth pattern and its impact on performance of the microfinance sector in Pakistan for the
period 2004-2007 using ratio analysis. Their analysis found that microfinance banks are less
sustainable than MFIs and that microfinance banks’ operating expense ratio is the highest.
Although microfinance banks and MFIs are different microfinance services models,
unfortunately Rauf and Mahmood do not further specify what the differences are between these
entities.
In another study by Mersland and Urgeghe (2013), they analysed 319 MFIs in 68 developing
countries with up to five years of data. They investigated whether commercial funding to MFIs
is mostly driven by the MFI’s financial performance and professionalization whilst subsidised
funding is mainly driven by poverty alleviation and social inclusion objectives. By using ROA,
the operating expense ratio and the 30-day portfolio at risk (PAR) ratios to proxy the MFIs’
financial performance; they find that a higher ROA, lower operating expense ratio, and lower
30-day PAR considerably increases the probability for an MFI of having international
commercial debt. This confirms their hypothesis that commercial funding is determined by
financial performance and the level of professionalization of the MFI whilst subsidized funding
targets MFIs that are focused on women and do not prioritise financial performance or its level
of professionalization.

20
2.5.2 Capital Adequacy and Solvency
Capital adequacy and solvency ratios are used to determine whether an MFI has the capacity to
meet its debts and absorb unforeseen losses (SEEP, 2010). In a study done by Dorfleitner, Leidl
and Priberny (2013), they investigated the determinants of failures of MFIs using the
CAMELS3 rating components and other microfinance specific measures. In their study they
used the capital asset ratio as a proxy for capital adequacy. They observed that capital adequacy
can explain MFI failure and those MFIs with a higher capital asset ratio were less likely to fail.
In Hoque, Chishty and Halloway’s study (2011) the authors observed that increased leverage
(debt to equity ratio) negatively affects outreach, productivity, and risk. This is because an
increase in the cost of capital leads to an increase in the cost of borrowing, increased default
rates, and higher risk. Conversely, Quayes (2012) found that the debt to equity ratio is
statistically significant and that it has a positive impact on the depth of outreach of an MFI.
2.5.3 Liquidity
Liquidity signifies the ease with which an MFI can service its debt and cover its short-term
liabilities if it should be required (Bruett, 2005).
Dorfleitner, Leidl and Priberny (2013) used the liquid assets ratio to determine liquidity in their
sample and were not able to observe a significant relationship between the liquid assets ratio
and the probability of an MFI failing.
2.5.4 Efficiency and Productivity
3 CAMELS is the same as CAMEL but includes sensitivity to market risk (S)

21
According to Balkenhol and Hudon (2011) efficiency, in microfinance, is converting inputs
such as personnel, resources, and equipment into credit, deposits, and other financial and non-
financial services at a minimum cost. However, the social effects of microfinance are seldom
factored into efficiency indicators. As mentioned above, Balkenhol and Hudon (2011) and
Serrano-Cinca, Gutiérrez-Nieto and Molinero (2011), amongst others, use the operating
expense ratio as a proxy for efficiency. An additional proxy for efficiency is the portfolio to
assets ratio (SEEP, 2010; Bruett 2005).
Furthermore, productivity is measured by employee efficiency (Serrano-Cinca, Gutiérrez-Nieto
& Molinero, 2011). One measure for productivity is cost per borrower; another is borrowers
per staff member (Baumann, 2004).
Bartual Sanfeliu, Cervelló Royo and Moya Clemente (2011, as cited in Daher & Le Saout,
2013) used multicriterion methodology to simultaneously consider different categories
involved in measuring MFI’s performance. They found that portfolio to assets and ROE are the
important elements for improving the performance of an MFI.
Balkenhol and Hudon (2011) investigated MBB data for all available MFIs over the 2004 to
2006 periods and found that financially sustainable MFIs are generally more efficient than those
MFIs that are not yet self-sufficient. Balkenhol and Hudon (2011) observed that recent figures
indicate an increase of efficiency in MFIs, partly due to economies of scale. However, they
suggest that efficiency indicators vary according to methodology, region and probably the
poverty-focus of the MFI.
In another study by Hermes, Lensink and Meesters (2011), they used stochastic frontier analysis
to assess whether there is a compromise between outreach and efficiency in MFIs. They found
that outreach is negatively correlated to efficiency of MFIs. Furthermore, they observed that
MFIs with a smaller average loan balance are also less efficient. In addition, they found
evidence indicating that MFIs that have a higher number of female borrowers are less efficient.
Shahzad et al. (2012) analysed the performance of MFIs in South Asia using financial ratios.
They used cost per borrower, inter alia, as a proxy for productivity. The analysis of the cost per
borrower ratio indicates that a higher cost per borrower ratio indicates a smaller average loan
size and thus better outreach. Quayes’ (2012) study confirms this. Quayes found that smaller

22
loans sizes have lower service costs resulting in better depth of outreach that will positively
affect financial performance.
2.5.5 Self-sufficiency
Operational self-sufficiency (OSS) is a commonly used proxy for institutional sustainability
(Mersland & Strøm, 2009) and is an important ratio that measures how well an MFI can cover
its costs through operating revenues (Serrano-Cinca, Gutiérrez-Nieto & Molinero, 2011).
However, as mentioned above SEEP (2010) excluded OSS from the MFRS because once an
MFI surpassed 100% sustainability or the breakeven point, the ratio is less useful when
measuring profitability.
In Mersland and Strøm’s (2009) study, they used OSS, inter alia, as a proxy for financial
performance and found that OSS is not significant in their regressions, indicating that
sustainable financial performance can be achieved by both individual and group-lending MFIs.
Similarly, Quayes (2012) used OSS as a measure of financial performance and observed that
high-disclosure MFIs have higher OSS than low-disclosure MFIs. He deduces that high-
disclosure MFIs achieve better financial performance than low-disclosure MFIs without
forgoing outreach.
2.6 Microfinance in South Africa
Historically, South Africa’s financial service providers concentrated on the delivery of credit
and its approach to regulation of the microfinance sector has been from this perspective. South
Africa has generally followed a path of sporadic and reactive financial sector reform since 1992
(Meagher et al., 2006).
The Usury Act Exemption of 1992 was created with its stated policy goal ‘to spur growth in
lending to micro, small and medium sized enterprises (SMMEs)’ (Meagher et al., 2006:63).
Due to this Exemption, creditors were allowed to charge unregulated interest rates for loans
under R6,000 and payable within 36 months. The result was a thriving microcredit industry,
23
which was controlled by payroll and cash-based lending to urban, formally employed persons.
In essence, the Exemption enabled licensed micro-creditors ‘to create a separate, largely
unregulated, tier of credit provision to people on the fringes of the banking system’ (Meagher
et al., 2006:63). Subsequently the Exemption divided the market, fencing low-income persons
from the formal banking sector and formal credit opportunities. Therefore, the conditions for
the development of an efficient credit market did not exist at a time when the sector was
growing rapidly and it impeded development finance.
In reaction to the high interest rates and abusive practises of micro-creditors in the mid-1990s,
there was a convergence of interest in establishing a consumer credit regulator. In addition to
the concern of micro-creditor practices, there were fears about the lack of growth in the
market’s development. Particularly the unmet credit needs in ‘priority areas such as enterprise,
housing and education’ (Meagher et al., 2006:64). Furthermore, banks were anxious about the
negative reputation they may suffer due to the lack of standards in conduct and development
finance.
The consequence thereof was the creation of the Micro Finance Regulatory Council (MFRC)
in 1999, under a second exemption of the Usury Law. The MFRC is a non-prudential regulator
and section 21 company that has to ‘supervise the operations of those institutions lending under
its unrestricted interest rate window to facilitate more effective consumer protection and
regularisation of micro-lender operations in a growing market’ (Meagher et al., 2006:64).
The credit market in South Africa was able to transform due to the introduction of the MFRC
and the Exemption Notice of 1999. The Exemption Notice reformed the microcredit
environment and creditors with transactions not exceeding R10,000 and payable with terms of
less than 36 months were exempt. Furthermore, if micro-creditors registered and complied, they
were exempt from the interest rate controls of the Usury Act, and could therefore determine
their own rates (Meagher & Wilkinson, 2002).
The establishment of the MFRC created an environment where both large and small lenders
have an interest in extending finance to the low-income market. The industry has changed and
financial services providers are now competing to enter the market rather than trying to
withdraw from it. This resulted in product innovation and included products such as housing
and SMME finance, the development of improved saving products, and an expanding network

24
of financial institutions that are accessible to poor persons (Meagher & Wilkinson, 2002). In
addition, the South African government is currently reviewing the insurance regulatory
environment to enable the development of microinsurance (Calvin & Coetzee, 2010).
The MFRC supported and led an extensive review and development of new legislation and
other industry infrastructure to assist in a more effective and rational financial services sector
(Meagher et al., 2006). This has led to two significant pieces of regulation being introduced:
the National Credit Act (NCA), No. 34 of 2005 and the Cooperative Banks Act (CBA), No. 40
of 2007.
The NCA ‘has introduced considerable consumer protection and has created a level playing
field and higher professionalism among credit providers, thereby contributing to a stronger
enabling environment for microfinance’ (Calvin & Coetzee, 2010:8). Whereas, the CBA ‘is
intended to improve access to financial services by providing a legislative framework allowing
cooperative banks to develop and provide financial services to their members’ (Calvin &
Coetzee, 2010:8).
The Dedicated Banks Bill is another important piece of legislation that has been tabled
(Meagher et al., 2006; Calvin & Coetzee, 2010). The Bill’s purpose is to create a gap or
opportunities to establish smaller banks in South Africa. Currently there are five banks
managing approximately 90% of all banking assets in the country. However, as mentioned
above, this Bill has still not been introduced to the National Assembly.
Although the microfinance sector is maturing, it is still developing and innovating. It is past the
rapid growth period for micro-deposit services and salary-based microloans but loans to
microenterprises, a third primary product, are lagging behind and have attained less than 20%
of possible market penetration (Calvin & Coetzee, 2010).
Calvin and Coetzee (2010:41) identify a key deficiency in South Africa’s microfinance industry
as the absence of
coherent government policy in the development finance arena in general and, more
specifically, on financial inclusion or access to finance… Development of a broad Policy
on Inclusive Banking/Access/Financial Inclusion would be an important contribution to

25
the sector without which the uncoordinated current approach will continue to generate little
traction in including more South Africans in the formal financial sector.

26
3 RESEARCH METHODOLOGY
3.1 Research Approach and Strategy
This thesis used case study methodology. A case study is flexible (Hakim, 2000, as cited in
Keddie, 2006) and can involve one or more cases. The two case studies selected for analysis
were selected for purposes of analytical generalisation. These cases are the Grameen Bank and
Capitec Bank. When using analytical generalisation, the author wishes to generalise a certain
set of results to some larger theory (Yin, 2009).
Furthermore, Yin (1984, as cited in Keddie 2006) elaborates that a case study can be
descriptive, exploratory or explanatory. I used the exploratory case study, which provides the
analysis of a phenomenon that could be systematically investigated by the use of another
methodology (Keddie, 2006). The other methodology, i.e. SEEP’s MFRS and its Framework,
are discussed below.
Initially there were very few guidelines for MFIs regarding definitions and performance
measures. In 2002, the Financial Definitions Guidelines were jointly developed by MFIs, the
SEEP Network, rating companies and donor agencies. The main objective of the guidelines was
to find ‘standard definitions for selected financial terms and suggest a standard method of
calculating certain financial ratios’ (Bruett, 2005:1). The SEEP Network developed its
Framework (Measuring performance of microfinance institutions: A framework for reporting,
analysis, and monitoring) from these guidelines. The Framework attempted to develop a
consistent performance monitoring system in accordance with the International Financial
Reporting Standards (IFRS), helping managers in decision making, updating boards of
directors, and reporting to investors, donors and other interested parties. Initially the
Framework had 18 indicators that were priorities to most MFIs. In 2010, the Framework was
updated to the MFRS and now includes 21 core financial ratios and tables, and six additional
non-core financial ratios (SEEP, 2010). The ratios are divided into groups that are set-out in the
table below.

27
Table 3-1: An overview of the core SEEP financial ratios and tables
The core financial ratios and tables
Ratio type Analytical focus
Profitability (7 ratios) Will the MFI have enough financial resources to service
its clients now and in future?
Capital adequacy and solvency
ratios (2 ratios)
Can the MFI meet its obligations and absorb unforeseen
losses?
Liquidity ratio (1 ratio) Will the MFI have the resources to meet its obligations
in a timeous manner as they become payable?
Asset quality and portfolio
quality (3 ratios)
What is the quality of the MFI’s loan portfolio?
Efficiency and productivity (8
ratios)
Is the MFI serving the optimal amount of clients at the
lowest possible cost?
Asset-liability management
tables (4 tables)
What are the intrinsic risks in an MFI’s asset and
liability structure?
The non-core financial ratios
For regulated financial
institutions (2 ratios)
Is the quality and solvency of the MFI’s capital
foundation robust enough to leverage growth from
within? Can it meet its obligations and absorb
unanticipated losses? How does it compare to the Basel
guidelines?
For deposit-taking MFIs (4
ratios)
How essential are deposits to the MFI’s funding mix?
Does the MFI deliver beneficial deposit services for a
range of client financial requirements whilst managing
liquidity and security of deposits?
Source: SEEP, 2010
The author used SEEP’s financial ratios as these reporting practices are standardised and are
MFI specific.

28
3.2 Data Collection, Frequency and Choice of Data
In order to analyse Grameen Bank and Capitec Bank, secondary ratio data was obtained from
MIX. MIX is a non-profit organisation that collects data from MFIs. Collected information is
reclassified according to IFRS for comparability purposes, and then assessed for consistency
and coherence. Thereafter, it is made publicly available (MIX, 2010c).
Ratio data for the two banks span the last ten years, 2004-2013. However, all the ratios were
not available for the full period for Capitec; specifically no data on the MIX database is
available after 2012. The author used Capitec’s 2013 and 2007 annual reports, available from
their website, to calculate the ratios for the missing years. However, it was not possible to
calculate the ROA, liquid assets ratio, and OSS for 2013 due to a lack of data and thus these
ratios’ data is only available until 2012. Furthermore, the ROA, liquid assets ratio, and
operating expense ratio was also not available for 2004 and therefore data for these ratios only
start at 2005. Grameen’s data is available for the full period from MIX and did not need to be
supplemented.
Furthermore, MIX generates benchmarks based on median values for the microfinance
industry. MFIs provide data on a voluntary basis regarding portfolio performance, accounting
practices, subsidies and liability structures with supporting documentation, such as annual
reports. The thesis used MIX benchmarks to compare Capitec and Grameen’s performance
against standard sustainability criteria and global averages of the microfinance sector, focussing
on MFIs that are classified by legal status as a bank. Specifically, the benchmark for MFIs
classified as ‘banks’ is used in this study as both Capitec and Grameen Bank have this legal
status. Furthermore, the MIX 2010 benchmarks are used as these are the most recent
benchmarks available. The 2010 benchmark for banks is the global average for each ratio and
is depicted by a dotted line on each graph in section 4.
3.3 Data Analysis Methods
As discussed above, SEEP ratios attempt to standardise MFIs’ financial reporting standards. In
addition, it aims to assist MFIs in obtaining relevant indicators that will support them with

29
analysis, monitoring and decision-making in their quest to become sustainable. The financial
ratios used are presented in Appendix II, table II-1. The table below shows the various
indicators used in the thesis, the purpose of each indicator and the appropriate application for
each outcome.
Table 3-2: An overview of the financial ratios used
Ratio Purpose Application
Return on Equity Measures the MFI’s profitability.
This ratio indicates how well the
MFI used retained earnings and/or
donor money to become
sustainable.
A mature MFI should have a
positive ROE.
Return on Assets It measures how the MFI manages
its assets to optimise its
profitability.
Mature MFIs should have a
positive ROA.
Operating Expense
Ratio
This ratio measures the
administrative and operating costs
incurred to provide microcredit.
Low ratios can indicate an
ineffective use of assets, whereas
high ratios can indicate inadequate
liquidity levels. However, a lower
ratio indicates a more efficient
MFI.
Capital Asset Ratio Determines whether the MFI has
enough capital to support its assets
and absorb unexpected losses. It is
a measure of the MFI’s solvency.
The higher the capital asset ratio,
the less likely the MFI is to fail.
Debt to Equity Ratio
(also leverage or
gearing ratio)
Indicates the proportion of equity
and debt the MFI used to finance
its portfolio and other assets.
The higher the ratio, the more
risky the MFI. This is because as
an MFI increases debt relative to
equity, the more risky it becomes.
Normally, deposit-taking MFIs
and saving-based firms have
higher ratios than non-commercial
MFIs.

30
Ratio Purpose Application
Liquid Assets Signifies the ease with which an
MFI can service its debt and cover
its short-term liabilities if it should
be required.
Higher ratios indicate that the MFI
is less likely to fail as there is a
higher margin of safety.
Portfolio to Assets This indicator measures the
allocation of assets to its lending
activity.
MFIs that are highly dependent on
savings to fund their portfolios are
generally more efficient at
sustaining a high and constant
ratio. Low ratios can indicate an
ineffective use of assets, whereas
high ratios can indicate inadequate
liquidity levels.
Operational Self-
Sufficiency
Indicates whether an MFI can
cover its costs though operating
revenues.
An MFI’s breakeven point is 100
per cent.
Source: Von Stauffenberg et al., 2003; Bruett, 2005; SEEP, 2010; Dorfleitner, Leidl & Priberny, 2013; Posner,
2014

31
4 RESEARCH FINDINGS, ANALYSIS AND DISCUSSION
4.1 The Case Studies
4.1.1 Grameen Bank
Grameen Bank is a successful MFI and is perceived as the ‘international benchmark for the
concept of microcredit’ (Valadez & Buskirk, 2012:13) as mentioned previously. The Grameen
‘model’ has been successful and replicated in a large number of countries. According to the
Bank’s website (2014), Grameen provides financial services to rural poor people in Bangladesh,
including credit, savings accounts, pension plans and loan insurance. Its overall goal is poverty
elimination.
In 1974, Bangladesh was recovering from a war and the country was gripped by a famine.
Professor Yunus, after a field trip to a poor neighbouring village, realised that many poor people
were dependent on expensive credit from informal moneylenders and started lending small
amounts of his own money to the poor (Yunus & Yolis, 1998, as cited in Schicks, 2007).
Initially his experiments were unsuccessful but eventually he came up with a model that
worked. Grameen Bank was formally established in 1983 by the passing of the Grameen Bank
Ordinance (Hulme, 2008). The Grameen ‘model’ is based on a group loans mechanism, where
five people, mostly women, voluntary create a group to provide shared, morally binding group
securities instead of the collateral required by traditional banks (Fotabong, 2011). This is called
‘social collateral’, a blend of peer pressure and cohesion. The first loan is made to one person,
and the next loan will only be given to the next person when the first is capable of meeting a
regular repayment scheme, and so on. In this manner, all group members take responsibility for
the repayment of the loan. Consequently, the repayment rate of loans has never fallen below
90% (Develtere & Huybrechts, 2002).
During the 1980s and early 1990s, Grameen gradually grew with substantial inflows of donor
funding. By 1991, the Bank had more than one million borrowers and an increasing range of
products, namely housing loans, agricultural loans, etc. However, although the number of
borrowers grew steadily, the gross loan portfolio grew swiftly as clients took larger regular
32
loans and new types of loans (particularly housing loans). This led to rumours of repayment
rates decreasing and branch managers extending new loans to defaulters, which were used to
pay off the outstanding loans (Hulme, 2008).
The difficulties faced by Grameen in the latter half of the 1990s, led to its senior personnel
experimenting with new products and innovative ways of managing service delivery. By early
2001, Grameen II was launched and the Bank’s previous products were replaced by the new
range of products on different terms. The various elements of Grameen II were designed to
meet client demand and to be profitable for the Bank. Over the period of March 2001 and
August 2002, all Grameen’s 1,200 branches were moved from Grameen I’s to Grameen II’s
products and systems (Hulme, 2008).
Grameen I used a ‘poverty lending’ approach rather than a ‘financial systems’ approach. But
Grameen II has moved closer to a ‘financial systems’ approach. Although Grameen
increasingly lends to non-poor clients and has moved into savings mobilisation and is
concerned with the profitability of its products, it still campaigns for microfinance for poor
women (Hulme, 2008). With Grameen II’s move towards lending to less poor clients, it has
stopped using the group lending methodology and replaced it with individual lending
methodology (Armendáriz de Aghion & Morduch, 2000). Therefore, Grameen II’s strategy has
not been reformed but rather revolutionised (Hulme, 2008).
Grameen Bank is 94% owned by its clients and the Bangladesh government owns the remaining
6%. From 1995, Grameen does not receive donor funds (Grameen Bank, 2014) and is now
using individual-based lending methodology (Cull, Demirgüç-Kunt & Morduch, 2007).
According to the Grameen website (2014) it is self-reliant and has sufficient deposits from
borrowers and non-borrowers to fund its operations. Below follows an overview of the Bank’s
characteristics.
Table 4-1: Overview of Grameen Bank4
4 All data is for 2013 except for percent of female borrowers that is for 2012.

33
Date Established 1 January 1983
Maturity of microfinance
operations
Mature
Legal status Bank
Regulated No
Lending methodology Individual
Target market Rural, poor women and non-poor
Products and services Loans
Voluntary savings
Insurance
Financial intermediation High
Outreach Large
Profit status For profit
Assets US$ 2 213 120 838
Offices 2 567
Personnel 21 851
Number of active borrowers 6 740 000
Percent of female borrowers 96,23%
Gross Loan Portfolio US$ 1 091 739 513
Average loan balance per
borrower
US$ 161,98
Source: Hulme, 2008; MIX, 2010b; MIX, 2012a
4.1.2 Capitec
Capitec Bank is a profit motivated South African MFI, which provides a range of financial
services to its clients. These clients are the ‘unbanked’ or financially excluded in South Africa
(Coetzee, 2003).
The story of Capitec started in the late 1990s when the investment holding company PSG Group
Ltd (‘PSG’) acquired two microcredit businesses in 1998 in order to enter the microfinance

34
sector. During the same period, PSG set up another company aimed at the payroll-deductions
market, namely Anchorfin. A holding company, Keynes Rational Ltd, was set-up to manage
this venture. By the end of 1998, PSG had decided to expand into the short-term loans market
and acquired Finaid Financial Services (Pty) Ltd (‘Finaid’) (Coetzee, 2003). Finaid was a
microloan business with only one product, a 30-day loan charging 30% interest per month
(Ashton, 2012).
In 1999, growth in the Company levelled and further acquisitions occurred over the following
two years. However, there were concerns regarding the exposure to payroll deductions of
government employees and Achorfin was disposed of (Coetzee, 2003).
PSG realised there was an opportunity to increase its provision of services as it believed there
was a need for a retail bank servicing clients in the lower-income segment (Cairns, 2012). The
Business Bank (TBB), a subsidiary of PSG Investment Bank Holdings Ltd (PSGIBH), acquired
Keynes Rational in 2001 (Cairns, 2012). This group of entrepreneurs’ goal was to provide
individuals and small businesses with a variety of banking services that are economical and
affordable and are based on the individual’s risk profile, taking cash flow and ability-to-pay-
models of risk evaluation into account. In order to realise their goal they obtained a banking
license and TBB was renamed Capitec Bank Ltd in March 2001 (Coetzee, 2003). Keynes
Rational was renamed Capitec Bank Holdings Ltd and in February 2002 listed on the
Johannesburg Stock Exchange (Cairns, 2012).
In 2003, PSG unbundled its 56% holding in Capitec (Cairns, 2012). However, PSG Financial
Services Ltd now own 28.27 % of Capitec Bank Holdings Ltd (Who Owns Whom, 2014).
At first, Capitec Bank Ltd consisted of Finaid, Capitec Division, and Capitec CBS. Finaid
focused on providing short-term microcredit to clients in the living standards measure (LSM)
3-5 income-earning profiles. However, all Finaid branches were changed to the Capitec Bank
brand due to Capitec’s success in 2003 (Coetzee, 2003).
Conversely, the Capitec Division focussed on providing loans through a more organised
environment to a higher income target market in the LSM 4-7 income-earning profiles. Their
business model was very similar to that of Finaid. However, Capitec Division converted to a

35
full banking system that provides transactional banking, loans and deposit-taking services
(Coetzee, 2003).
Finally, Capitec CBS focussed on providing commercial, unsecured loans to small businesses
in the informal sector (Coetzee, 2003). However, all three divisions have now merged into
Capitec Bank Ltd. Below follows an overview of Capitec’s characteristics.
Table 4-2: Overview of Capitec Bank5
Date Established 1 March 2001
Maturity of microfinance
operations
Mature
Legal status Bank
Regulated Yes
Lending methodology Individual
Target market Lower income, the unbanked
Products and services Transacting
Loans
Voluntary savings
Financial intermediation High
Outreach Large ( > 30, 000 borrowers)
Profit status For profit
Assets US$ 427,499,7101
Offices6 647
Personnel7 9 491
Number of active borrowers8 801,809
Percent of female borrowers9 44,37%
Gross Loan Portfolio US$ 3 417 800 223
5 Data is for 2012 unless stated otherwise. 6 2014 7 2014 8 Latest available data is for 2009. However, there were in excess of 5.8 million clients at the end of August,
2014. 9 Latest available data is for 2008

36
Average loan balance per
borrower10
US$ 905,9
Source: Coetzee, 2003; MIX, 2010b; Napier & Britain, 2011; MIX, 2012b; Capitec Bank, 2014
4.2 Profitability
4.2.1 Return on Equity
Return on equity measures the MFI’s profitability. This ratio indicates how well the MFI used
retained earnings and/or donor money to become sustainable.
Source: Capitec, 2007; MIX 2010b; MIX, 2012a; MIX, 2012b; Capitec, 2013
Globally, the average ROE for MFIs with ‘bank’ as legal status is -8%. This indicates that MFIs
operating with this status are generally not profitable. Capitec’s ROE has been higher than
Grameen’s from 2007 to 2013. Capitec’s average ROE over the 2004-2013 periods was 23%.
This is in contrast with Grameen’s ROE of 10% over the same period. Although Grameen’s
ROE is not as high as Capitec’s, it is positive which indicates profitability. Von Stauffenberg
et al. (2014) indicate that an ROE in excess of 20% is high and thus it can be presumed that
Capitec is performing well.
When considering an MFI’s ROE it is also important to consider the debt to equity ratio.
Microfinance institutions that want to be highly profitable and thus have a high ROE have
10 2009
-15%
-10%
-5%
0%
5%
10%
15%
20%
25%
30%
35%
2004 2005 2006 2007 2008 2009 2010 2011 2012 2013
Capitec BankReturn onequity
Grameen BankReturn onequity
Mean

37
strong motivation to finance most of its assets through debt. But higher debt to equity ratios can
be risky (Von Stauffenberg et al., 2014).
In addition, it is important to monitor the ROE over a period of time. It is possible that the MFI
sold an asset leading to a one-time high in profitability or it could have decreased its provisions
for loan losses. Therefore, an MFI’s profitability should be analysed over a number of years.
Should an increasing ROE be sustained year after year, it is a good sign that the institution is
profitable (Von Stauffenberg et al., 2014).
Over the period, Grameen has remained profitable; however, its ROE has been erratic. Also,
Grameen’s debt to equity ratio has been above 6% since 2005, indicating that the MFI’s debt
may be too high to be sustainable. Conversely, Capitec performed consistently well over time
and its debt to equity ratio has been below 5% over the 2004-2013 period. In addition, its ROE
has been consistently above 20% since 2005. Therefore, Capitec seems to be more profitable
than Grameen Bank.
4.2.2 Return on Assets
This measurement calculates how the MFI manages its assets to optimise its profitability.
Source: MIX 2010b; MIX, 2012a; MIX, 2012b
Globally, the mean ROA of MFIs with the legal status ‘bank’ is -1%. A negative ROA signifies
that an institution is not profitable and thus it can be assumed that most of the MFIs with a
‘bank’ legal status are not profitable. Capitec has a much higher ROA ratio than Grameen,
-2%
0%
2%
4%
6%
8%
10%
12%
2004 2005 2006 2007 2008 2009 2010 2011 2012 2013
Capitec Bank Return onassets
Grameen Bank Return onassets
Mean

38
although the trend has been declining. This decline was a general trend in the South African
commercial banking sector between 2007 and 2009, which was due to the global financial crisis
and the domestic economy slowing down (Kumbirai & Webb, 2010). Furthermore, according
to an analysis by Metcalfe (2011) Capitec has grown its assets at a faster rate than other South
African banks from the MFI’s inception to 2009. This may explain the declining trend
somewhat as ROA measures the efficiency with which the MFI manages its assets with relation
to its net operating income less taxes in creating profit. If Capitec has been increasing its assets
but not its operating income less taxes, this trend can be an early sign of impending profitability
problems.
Nevertheless, Capitec’s ROA was 5% in 2012, compared to Grameen’s 0.9% in 2012 and 0.7%
in 2013. Globally, all MFI’s had a ROA average of 3% in 2012 (Von Stauffenberg et al., 2014),
making Capitec’s ROA decent. Both MFI’s have a positive ROA which is encouraging.
4.2.3 Operating Expense Ratio
This ratio measures the administrative and operating costs incurred to provide microcredit.
Source: MIX 2010b; MIX, 2012a; MIX, 2012b; Capitec, 2013
Globally, the average of the operating expense ratio for MFIs with a legal status of ‘bank’ is
27%. Capitec’s operating expense ratio has declined rapidly from a high of 123% in 2005 to
10% in 2013. There does not seem to be a definite cause for this declining trend; this trend may
simply be due to Capitec being a relatively new MFI in 2004 and that it had become more
efficient by growing. This is a positive trend as a lower ratio indicates a more efficient MFI
0%
20%
40%
60%
80%
100%
120%
140%
2004 2005 2006 2007 2008 2009 2010 2011 2012 2013
Capitec Bank Operatingexpense ratio
Grameen Bank Operatingexpense ratio
Mean
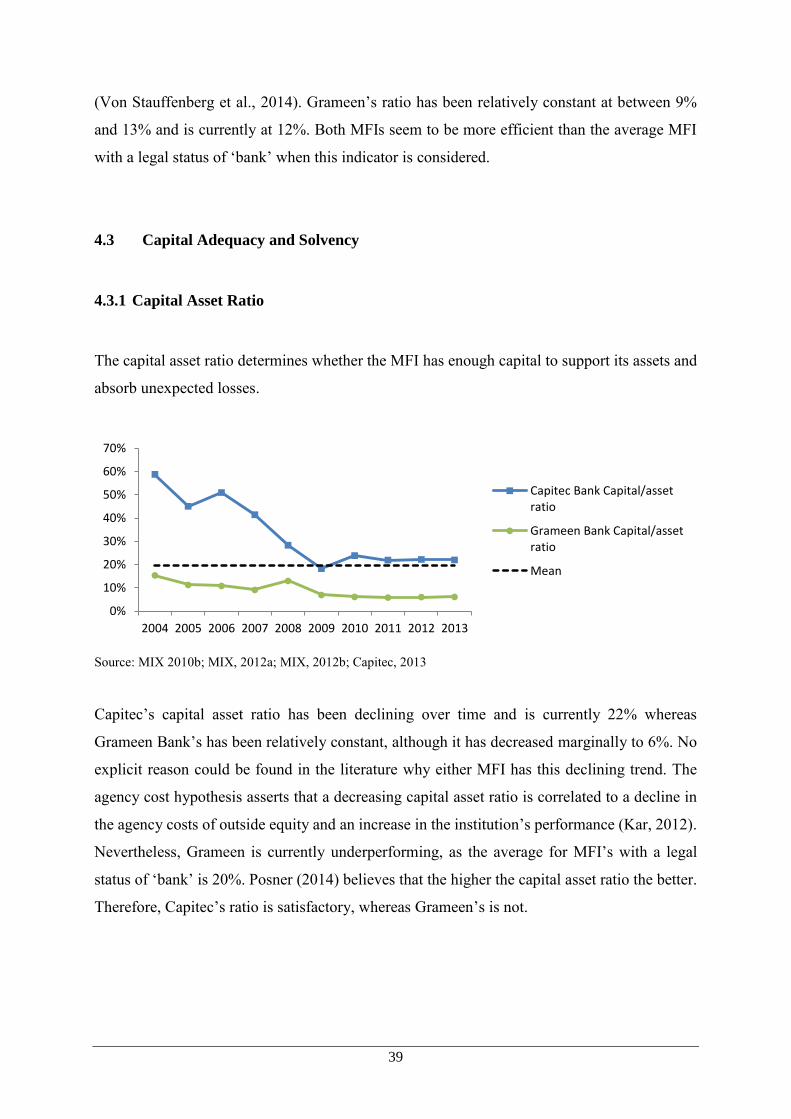
39
(Von Stauffenberg et al., 2014). Grameen’s ratio has been relatively constant at between 9%
and 13% and is currently at 12%. Both MFIs seem to be more efficient than the average MFI
with a legal status of ‘bank’ when this indicator is considered.
4.3 Capital Adequacy and Solvency
4.3.1 Capital Asset Ratio
The capital asset ratio determines whether the MFI has enough capital to support its assets and
absorb unexpected losses.
Source: MIX 2010b; MIX, 2012a; MIX, 2012b; Capitec, 2013
Capitec’s capital asset ratio has been declining over time and is currently 22% whereas
Grameen Bank’s has been relatively constant, although it has decreased marginally to 6%. No
explicit reason could be found in the literature why either MFI has this declining trend. The
agency cost hypothesis asserts that a decreasing capital asset ratio is correlated to a decline in
the agency costs of outside equity and an increase in the institution’s performance (Kar, 2012).
Nevertheless, Grameen is currently underperforming, as the average for MFI’s with a legal
status of ‘bank’ is 20%. Posner (2014) believes that the higher the capital asset ratio the better.
Therefore, Capitec’s ratio is satisfactory, whereas Grameen’s is not.
0%
10%
20%
30%
40%
50%
60%
70%
2004 2005 2006 2007 2008 2009 2010 2011 2012 2013
Capitec Bank Capital/assetratio
Grameen Bank Capital/assetratio
Mean

40
4.3.2 Debt to Equity Ratio
This ratio indicates the proportion of equity and debt the MFI used to finance its portfolio and
other assets.
Source: MIX 2010b; MIX, 2012a; MIX, 2012b; Capitec, 2013
Microfinance institutions that are considered to be ‘banks’ have an average debt to equity ratio
of 18,9:1. This is an unhealthy ratio as this ratio should be as low as possible. This is because
MFIs’ loan portfolios are supported by very little collateral.
Capitec has a more sustainable debt to equity ratio than Grameen Bank. At financial year-end
2013, for both MFIs, Capitec’s ratio was 3,5:1 and Grameen’s 15,5:1. Capitec’s ratio is
relatively low but unfortunately Grameen’s ratio implies that there is not much of a safety
cushion (in the form of equity) to absorb losses. However, Von Stauffenberg et al. (2014) advise
that it is also important to analyse the ratio over time. Rapid increases in the ratio suggest that
the MFI is approaching its borrowing limits. MIX and Intellecap (2009) reported that between
2003 and 2007 Grameen extended new loans by increasing the leverage of its capital base and
that explains the increase in this ratio over this period. However, there is no indication in the
literature why the ratio decreased in 2008 and then continued its upward trend after 2008. As
can be seen from Grameen’s graph, although the ratio increased rapidly from 2008-2011, there
has been a marginal decrease since 2012 and the ratio is slowing. It seems that Grameen was
approaching its borrowing limits. Although the ratio has been slowing, it is not decreasing
rapidly enough and therefore Grameen may have solvency problems.
-
5
10
15
20
2004 2005 2006 2007 2008 2009 2010 2011 2012 2013
Capitec Bank Debtto equity ratio
Grameen BankDebt to equityratio
Mean

41
4.4 Liquidity
4.4.1 Liquid Assets
This ratio signifies the ease with which an MFI can service its debt and cover its short-term
liabilities if it should be required.
Source: MIX 2010b; MIX, 2012a; MIX, 2012b
The mean liquid assets ratio globally for MFIs with a legal status of ‘banks’, was 20% in 2010.
Capitec’s liquid asset ratio has declined sharply from 53% in 2006 to 19% in 2012. However,
a search of the literature suggests that there is no obvious reason for this deterioration in
liquidity. Although Capitec’s liquid asset ratio has been below the 2010 global bank average
since 2011, there is still a margin of safety. Conversely, Grameen’s ratio has gradually been
increasing and was 46% in 2013, thus it has a high margin of safety. As with Capitec, an
investigation of the literature indicates that there is no apparent reason for Grameen’s increase
in liquidity.
4.5 Efficiency
4.5.1 Portfolio to Assets
This indicator measures the allocation of assets to its lending activity. The greater the share of
total assets that the gross portfolio has, the better the return on its assets (Jørgensen, 2012).
0%
10%
20%
30%
40%
50%
60%
2004 2005 2006 2007 2008 2009 2010 2011 2012 2013
Capitec Bank Non-earningliquid assets as a % of totalassets
Grameen Bank Non-earningliquid assets as a % of totalassets
Mean

42
Source: MIX 2010b; MIX, 2012a; MIX, 2012b; Capitec, 2013
The portfolio to assets ratio average, globally, for MFIs with the legal status of ‘banks’ is 67%.
Capitec’s portfolio to assets ratio of 80% was higher than Grameen’s 49% in 2013. Both MFIs
have had some variability over the 10-year period when considering this ratio. According to
Mbeba (2008), variations in this ratio may be due to seasonal activity or inflexible operational
models such as ‘batch’ lending. Although it seems that Capitec is efficient due to it maintaining
a high portfolio to assets ratio, a high ratio can indicate inadequate liquidity levels (SEEP,
2010). However, when Capitec’s ratio is read in conjunction with its liquid asset ratio, it seems
to be acceptable. Grameen’s portfolio to assets ratio seems acceptable although it has been
declining.
4.6 Self-sufficiency
4.6.1 Operational Self-Sufficiency
The OSS ratio indicates whether an MFI can cover its costs through internally generated
operating revenues only and whether it can thus operate independently of subsidies (Mbeba,
2008). This ratio determines a manager’s ability to manage the institution and to cover its
operating expenditures including the possibility of attracting subsidies (Hartarska &
Nadolnyak, 2007).
0%
10%
20%
30%
40%
50%
60%
70%
80%
90%
2004 2005 2006 2007 2008 2009 2010 2011 2012 2013
Capitec Bank Portfolio toAssets
Grameen Bank Portfolio toAssets
Mean

43
Source: MIX 2010b; MIX, 2012a; MIX, 2012b
The global average for OSS for MFIs with a legal status of ‘bank’ was 162% in 2010. This is
much higher than both Capitec and Grameen’s ratio. Grameen’s OSS has averaged 106% over
the 2004-2013 period and was 104% in 2013. Capitec’s OSS ratio averaged 125% over the
2004-2012 period and was 127% in 2012. However, the break-even point for MFIs using this
indicator is 100% indicating that the MFI’s revenue is equal to its operating expenses. Both
MFIs are therefore operationally sustainable as their revenue exceeded their operating costs
over the entire period.
0%
20%
40%
60%
80%
100%
120%
140%
160%
180%
2004 2005 2006 2007 2008 2009 2010 2011 2012 2013
Capitec Bank Operationalself sufficiency
Grameen Bank Operationalself sufficiency
Mean

44
5 RESEARCH CONCLUSIONS AND RECOMMENDATIONS FOR
FUTURE RESEARCH
It is apparent from the previous section that generally both MFIs seem to be financially
sustainable. Yet overall, it seems that Capitec is more financially sustainable than Grameen.
When considering the profitability ratios it is important to note that Von Stauffenberg et al.
(2014) cautions that looking at profitability indicators such as ROE and ROA in isolation is of
limited use as it is an aggregate of many factors. When these ratios are considered in
conjunction with the debt to equity and the operating expense ratios Capitec Bank seems to be
doing well. Additionally, Capitec is currently the second most profitable bank globally when
considering ROA (5,08%). Furthermore, its ROE is currently 25% and debt to equity ratio 4,9:1
(Haakman, 2014). However, although Grameen Bank is currently sustainable when considering
the profitability ratios the erratic nature of its ROE and relatively high debt to equity ratio may
indicate that the MFI’s debt may be too high to be sustainable.
An analysis of the capital adequacy and solvency indicators indicate that Capitec’s capital is
adequate and that it is not likely to fail. This is due to its capital asset ratio signifying that it has
enough capital to support its assets and absorb unexpected losses and its debt to equity ratio
being sufficiently low. Conversely, Grameen’s capital adequacy and solvency indicators
suggest that it will not be able to withstand unexpected losses as its capital asset ratio is too low
and its debt to equity ratio indicates that the institution may have solvency problems in the years
ahead.
The liquidity indicator shows that Capitec needs to be aware of its liquidity position. Although
its liquid assets ratio suggests that it can service its debt and cover its short-term liabilities if
needed, when read in conjunction with the portfolio to assets ratio, there may be some caution
needed. Nevertheless, Capitec has been performing well over the last decade and seems to be
becoming more sustainable. Furthermore, Moody's Investors Service (2014) reports that
Capitec already complies with Basel III liquidity ratios and has a prudent liquidity approach.
Equally, Grameen Bank’s liquidity ratio suggests that it has a high margin of safety and that
the MFI is performing sustainably despite the medium term risks posed by its debt to equity
ratio as explained above.

45
An analysis of the efficiency indicator indicates that both Capitec and Grameen are relatively
efficient. Both MFIs’ portfolio to assets ratio suggests an effective use of its assets.
Furthermore, when considering the self-sufficiency indicator both MFIs are operationally
sustainable as their revenue exceeded their operating costs over the entire period. This clearly
shows that the MFIs can operate independently of subsidies.
When all the indicators are considered, Capitec Bank and other South African MFIs should
heed Grameen Bank’s low ROE and capital asset ratios and high debt to equity ratio. Ensuring
healthy and strategic lending portfolios gives a good ROE for a firm’s shareholders.
Furthermore, the capital asset and debt to equity ratios have important indications for an
institution’s capital structure. Therefore, Capitec and South African MFIs should maintain
healthy ROE, capital asset, and debt to equity ratios in order to ensure their long-term
sustainability.
As future research, it would be useful if data were made available to enable an assessment of a
failed South African MFI to obtain clearer insight into the South African microfinance sector.
Furthermore, data on Grameen and Capitec’s asset quality and social performance will give
additional insight into the social sustainability of these two MFIs.

46
REFERENCES
Abrams, J. 2012. Global microfinance ratings comparability. Multilateral Investment Fund.
Available: http://www.fomin.org/en-us/HOME/Knowledge/idPublication/67495 [2014,
November 24].
Afrane, S. 2002. Impact assessment of microfinance interventions in Ghana and South Africa:
A synthesis of major impacts and lessons. Journal of Microfinance/ESR Review. 4(1): 37-
58. Available: https://ojs.lib.byu.edu/spc/index.php/ESR/article/view/1423 [2014,
December 5].
Armendáriz de Aghion, B. & Morduch, J. 2000. Microfinance beyond group lending.
Economics of Transition. 8(2): 401-420. DOI: 10.1111/1468-0351.00049.
Ashton, S. 2012. Capitec Bank - securing a structural advantage. Sandton, South Africa:
Investec. Available: https://www.investec.co.za/research-and-
insights/newsletters/monthly-view-newsletter/august-articles/capitec-bank-looking-for-
something-secure.html [2014, November 21].
Balkenhol, B. Ed. 2007. Microfinance and public policy: Outreach, performance and
efficiency [Abstract]. New York: Palgrave Macmillan. Available:
http://ilo.org/global/publications/ilo-bookstore/order-online/books/WCMS_091016/lang--
en/index.htm [2015, January 7].
Balkenhol, B. & Hudon, M. 2011. Efficiency. In The Handbook of Microfinance. B.
Armendáriz & M. Labie, Eds. Singapore: World Scientific. 383-396.
Basel Committee on Banking Supervision. 2010. Microfinance activities and the core
principles for effective banking supervision - final document. Switzerland: Bank for
International Settlements. Available: http://www.bis.org/publ/bcbs175.pdf [2014,
November 18].

47
Baumann, T. 2004. Pro-poor microcredit in South Africa: Cost-efficiency and productivity of
South African pro-poor microfinance institutions. Development Southern Africa. 21(5):
785-798. DOI: 10.1080/0376835042000325705.
Berling, E. 2004. Review of microfinance rating reports 2004. General Findings for
Discussion with Rating Fund Managers and Rating and Assessment Agencies. Available:
http://www.ratingfund2.org/dnn494/EN/OtherResources/Documents/tabid/145/Default.as
px [2014, November 25].
Boudreaux, K. & Cowen, T. 2008. The micromagic of microcredit. Wilson Quarterly, 32(1):
27-31. Available:
http://archive.wilsonquarterly.com/sites/default/files/articles/WQ_VOL32_W_2008_Articl
e_03.pdf [2013, September 19].
Brau, J.C. & Woller, G.M. 2004. Microfinance: A comprehensive review of the existing
literature. Journal of Entrepreneurial Finance, JEF. 9(1): 1-27. Available:
http://hdl.handle.net/10419/55971 [2014, November 19].
Bruett, T. Ed. 2005. Measuring performance of microfinance institutions: A framework for
reporting, analysis, and monitoring. Available:
https://www.onekerato.com/uploads/7/9/4/8/7948160/seep_framework_manual.pdf [2014,
November 9].
Cairns, P. 2012. Can Capitec continue to sizzle? Moneyweb. 11 May. Available:
http://www.moneyweb.co.za/moneyweb-101-for-beginners/can-capitec-continue-to-sizzle
[2014, November 21].
Calvin, B. & Coetzee, G. Ed. 2010. A review of the South African microfinance sector, 2009:
Successes, challenges, and policy issues. Available: http://www.finmark.org.za/wp-
content/uploads/pubs/MFReview.pdf [2014, December 3].
Capitec Bank Holdings Limited. 2007. Annual Report 2007. Available:
https://www.capitecbank.co.za/resources/Capitec_IntegratedAnnualReport_2007.pdf [2014,
November 14].

48
Capitec Bank Holdings Limited. 2013. Integrated Annual Report 2013. Available:
https://www.capitecbank.co.za/resources/Intergrated_Annual_Report_2013.pdf [2014,
September 10].
Capitec Bank Holdings Limited. 2014. Integrated Annual Report 2014. Available:
https://www.capitecbank.co.za/resources/2014_Annual_Report.pdf [2014, September 10].
Center for Financial Inclusion. 2013. Seizing the moment: On the road to financial inclusion.
Financial inclusion 2020 synthesis report. Available:
http://www.centerforfinancialinclusion.org/publications-a-resources/browse-
publications/555-seizing-the-moment-on-the-road-to-financial-inclusion [2015, January 5].
Coetzee, G. 2003. Innovative approaches to delivering microfinance services: The case of
Capitec Bank. Kenya: MicroSave. Available:
http://www.microfinancegateway.org/sites/default/files/mfg-en-case-study-innovative-
approaches-to-delivering-microfinance-services-the-case-of-capitec-bank-aug-2003.pdf
[2014, November 11].
Consultative Group to Assist the Poor. 2006. Good practice guidelines for funders of
microfinance. 2nd ed. Available: http://www.cgap.org/sites/default/files/CGAP-Consensus-
Guidelines-Good-Practice-Guidelines-for-Funders-of-Microfinance-Oct-2006.pdf [2014,
November 19].
Cull, R., Demirgüç-Kunt, A. & Morduch, J. 2007. Financial performance and outreach: A
global analysis of leading microbanks. The Economic Journal. 117(517): F107-F133. DOI:
10.1111/j.1468-0297.2007.02017.x.
Cull, R., Demirgüç-Kunt, A. & Morduch, J. 2009. Microfinance meets the market. Journal of
Economic Perspectives. 23(1): 167-92. DOI: 10.1257/jep.23.1.167.
Daher, L. & Le Saout, E. 2013. Microfinance and financial performance. Strategic Change.
22(1-2): 31-45. DOI: 10.1002/jsc.1920.

49
Daniels, R.C. 2004. Financial intermediation, regulation and the formal microcredit sector in
South Africa. Development Southern Africa. 21(5): 831-849. DOI:
10.1080/0376835042000325732.
Demirgüç-Kunt, A. & Klapper, L. 2012. Measuring financial inclusion: The Global Findex
Database. DOI: 10.1596/1813-9450-6025.
Develtere, P. & Huybrechts, A. 2002. Evidence on the Social and Economic Impact of
Grameen Bank and BRAC on the Poor in Bangladesh. Belgium: Higher Institute of Labour
Studies (HIVA-K.U.Leuven). Available:
http://www.microfinancegateway.org/sites/default/files/mfg-en-paper-evidence-on-the-
social-and-economic-impact-of-grameen-bank-and-brac-on-the-poor-in-bangladesh-
2002_0.pdf [2014, November 21].
Dorfleitner, G., Leidl, M. & Priberny, C. 2013. Explaining Failures of Microfinance
Institutions. DOI: 10.2139/ssrn.2316680.
Dumont, G. & Schmit, M. 2014. Tier-1 MFIs' Financial Performance: Cash-Flow Statement
Analysis Version 2.0. (Centre Emile Bernheim Working Paper No 13/054). Available:
https://dipot.ulb.ac.be/dspace/bitstream/2013/153215/5/wp13054.pdf [2014, December 5].
Evans, D.S. & Jovanovic, B. 1989. An estimated model of entrepreneurial choice under
liquidity constraints. Journal of Political Economy. 97(4): 808-827. Available:
http://www.jstor.org/stable/1832192 [2014, December 16].
Fotabong, L.A. 2011. Comparing Microfinance Models: MC2 Model versus
Other Microfinance Model. DOI: 10.2139/ssrn.2007874.
Gaul, S. 2011. Defining responsible financial performance: the role of profits. Microfinance
Information Exchange. Available: http://www.themix.org/publications/microbanking-
bulletin/2011/05/microfinance-profits [2014, November 24].
Global Development Research Center. n.d. Rating standards and certification. Available:
http://www.gdrc.org/icm/rating/index.html [2014, November 28].

50
Grameen Bank. 2014. General Questions on Grameen Bank FAQ. Available:
http://www.grameen.com/index.php?option=com_easyfaq&task=cat&catid=80&Itemid=2
00 [2015, January 7].
Green, C. J., Kirkpatrick, C. H., & Murinde, V. 2005. How does finance contribute to the
development process and poverty reduction? In Finance and development: Surveys of
theory, evidence and policy. C. J. Green, C.H. Kirkpatrick & V. Murinde. Eds.
Cheltenham: Edward Elgar. 1-26.
Haakman, L. 2014. PSG angles & perspectives: Q3 2014. Birds of a feather? Our investment
case for Capitec Bank. Available: http://www.psgam.co.za/quarterly-commentary/birds-of-
a-feather-our-investment-case-for-capitec-bank.php [2015, January 9].
Hartarska, V. & Nadolnyak, D. 2007. Do regulated microfinance institutions achieve better
sustainability and outreach? Cross-country evidence. Applied Economics. 39(10): 1207-
1222. DOI: 10.1080/00036840500461840.
Hermes, N., Lensink, R. & Meesters, A. 2011. Outreach and Efficiency of Microfinance
Institutions. World Development. 39(6): 938-948. DOI: 10.1016/j.worlddev.2009.10.018.
Hietalahti, J. & Linden, M. 2006. Socio-economic impacts of microfinance and repayment
performance: a case study of the Small Enterprise Foundation, South Africa. Progress in
Development Studies. 6(3): 201-210. DOI: 10.1191/1464993406ps138oa.
Hoque, M., Chishty, M. & Halloway, R. 2011. Commercialization and changes in capital
structure in microfinance institutions. Managerial Finance. 37(5): 414-425. DOI:
10.1108/03074351111126906.
Hulme, D. 2008. The story of the Grameen Bank: From subsidised microcredit to market-
based microfinance. DOI: 10.2139/ssrn.1300930.

51
Jørgensen, N.A. 2012. The profitability of microfinance institutions and the connection to the
yield on the gross portfolio. MSc in Applied Economics and Finance Thesis. Available:
http://hdl.handle.net/10417/2914 [2015, January 9].
Kanbur, R. 2000. Chapter 13 Income distribution and development. In Handbook of Income
Distribution. Elsevier. 791-841. DOI: 10.1016/S1574-0056(00)80016-0.
Kar, A.K. 2012. Does capital and financing structure have any relevance to the performance
of microfinance institutions? International Review of Applied Economics. 26(3): 329-348.
DOI: 10.1080/02692171.2011.580267.
Khan, A. 2008. Tackling the failure of microfinance efforts through amalgamating
microfinance with charity: two viable alternatives in the context of Pakistan. Australasian
Accounting Business and Finance Journal. 2(2): 17-33. Available:
http://ro.uow.edu.au/aabfj/vol2/iss2/2 [2014, October 24].
Keddie, V. 2006. Case study method. In The SAGE Dictionary of Social Research Methods.
V. Jupp, Ed. London, England: SAGE Publications, Ltd. 21-22. DOI:
10.4135/9780857020116.
Kumbirai, M. & Webb, R. 2010. A financial ratio analysis of commercial bank performance
in South Africa. African Review of Economics and Finance. 2(1): 30-53. Available:
http://hdl.handle.net/10520/EJC124697 [2015, January 8].
Manji, A. 2010. Eliminating Poverty? ‘Financial inclusion’, access to land, and gender
equality in international development. The Modern Law Review. 73(6): 985-1004. DOI:
10.1111/j.1468-2230.2010.00827.x.
Matin, I., Hulme, D. & Rutherford, S. 2002. Finance for the poor: from microcredit to
microfinancial services. Journal of International Development. 14(2): 273-294. DOI:
10.1002/jid.874.
Mbeba, R.D. 2008. Basic financial management and ratio analysis for MFIs toolkit.
Available:

52
http://www.microsave.net/files/pdf/Financial_Management_and_Ratio_Analysis_Toolkit.p
df [2015, January 9].
Meagher, P. & Wilkinson, B. 2002. Filling the gap in South Africa’s small and micro credit
market: An analysis of major policy, legal, and regulatory issues. Maryland: IRIS
Center. Available: http://www.microfinancegateway.org/library/filling-gap-south-africas-
small-and-micro-credit-market-analysis-major-policy-legal-and [2014, December 3].
Meagher, P., Campos, P., Christen, R., Druschel, K., Gallardo, J. & Martowijoyo, S. 2006.
Microfinance regulation in seven countries: A comparative study. Maryland: IRIS
Center. Available: http://www.microfinancegateway.org/library/microfinance-regulation-
seven-countries-comparative-study [2014, December 3].
Mersland, R. & Strøm, R.Ø. 2008. Performance and trade-offs in microfinance organisations
– does ownership matter? Journal of International Development. 20(5): 598-612. DOI:
10.1002/jid.1432.
Mersland, R. & Strøm, R.Ø. 2009. Performance and governance in microfinance institutions.
Journal of Banking and Finance. 33(4): 662–669. DOI: 10.1016/j.jbankfin.2008.11.009.
Mersland, R. & Urgeghe, L. 2013. International debt financing and performance of
microfinance institutions. Strategic Change. 22(1-2): 17-29. DOI: 10.1002/jsc.1919.
Metcalfe, B. 2011. Unlocking opportunities. Strategic and emerging issues in South African
banking 2011. South Africa: PricewaterhouseCoopers. Available:
https://www.pwc.co.za/en/assets/pdf/sa-banking-2011-v2.pdf [2015, January 8].
Microfinance Information Exchange & Intellecap. 2009. Asia microfinance analysis and
benchmarking report 2008. Available:
http://www.themix.org/sites/default/files/2008%20Asia%20Microfinance%20Analysis%2
0and%20Benchmarking%20Report.pdf [2015, January 8].
http://www.microfinancegateway.org/library/microfinance-regulation-seven-countries-comparative-study

53
Microfinance Information Exchange. 2010a. The MicroBanking Bulletin. Available:
http://www.themix.org/microbanking-bulletin/microbanking-bulletin [2014, November
28].
Microfinance Information Exchange. 2010b. 2010 MFI benchmarks. Available:
http://www.themix.org/publications/microbanking-bulletin/2011/10/2010-mfi-benchmarks
[2014, December 3].
Microfinance Information Exchange. 2010c. Microfinance data services. Available:
http://www.themix.org/data-and-analysis/data-services [2014, December 18].
Microfinance Information Exchange. 2012a. MFI report. Grameen Bank. Available:
http://www.mixmarket.org/mfi/grameen-bank [2015, January 7].
Microfinance Information Exchange. 2012b. MFI report. Capitec Bank. Available:
http://www.mixmarket.org/mfi/capitec-bank [2015, January 7].
Microfinance Information Exchange. n.d. Indicator definitions. Available:
http://www.themix.org/sites/default/files/Indicator%20Definitions.pdf [2015, January 7].
Moody's Investors Service, Inc. 2014. Credit Opinion: Capitec Bank Limited. (Global Credit
Research – 11 November 2014). Available:
https://www.capitecbank.co.za/resources/Capitec_Credit_Opinion.pdf [2015, January 9].
Morduch, J. 1999. The microfinance promise. Journal of Economic Literature, 37(4): 1569-
1614, December. DOI: 10.1257/jel.37.4.1569.
Morduch, J. 2000. The microfinance schism. World Development. 28(4): 617-629. DOI:
10.1016/S0305-750X(99)00151-5.
Mosley, P. & Rock, J. 2004. Microfinance, labour markets and poverty in Africa: a study of
six institutions. Journal of International Development. 16(3): 467-500. DOI:
10.1002/jid.1090.

54
Mukama, J., Fish, T. & Volschenk, J. 2005. Problems affecting the growth of microfinance
institutions in Tanzania. African Finance Journal. 7(2): 42-63. Available:
http://hdl.handle.net/10520/EJC33818 [2014, October 24].
Napier, M. & Britain, G. 2011. Including Africa: beyond microfinance. Centre for the Study
of Financial Innovation. Available:
http://www.citibank.com/citi/microfinance/data/news110125.pdf [2014, November 11].
National Planning Commission. 2012. Our future – make it work. National Development Plan
2030. Executive summary. Available:
http://www.gov.za/sites/www.gov.za/files/Executive%20Summary-NDP%202030%20-
%20Our%20future%20-%20make%20it%20work.pdf [2014, December 4].
National Treasury. 2013. Implementing the twin peaks model of financial regulation.
Available: http://www.treasury.gov.za/twinpeaks/20131211%20-%20TwinPeaks.pdf
[2014, December 5].
National Treasury. 2014a. Financial sector regulation bill on track. Available:
http://www.sabinetlaw.co.za/finances/articles/financial-sector-regulation-bill-track [2014,
December 5].
National Treasury. 2014b. Twin peaks: Second draft of Financial Sector Regulation Bill and
draft Market Conduct Policy Framework discussion document published for comment. 11
December 2014. Available:
http://www.treasury.gov.za/comm_media/press/2014/2014121201%20-
%20Media%20release%20FSR%20Bill%20and%20MCP.pdf [2014, December 15].
Navajas, S., Schreiner, M., Meyer, R.L., Gonzalez-Vega, C. & Rodriguez-Meza, J. 2000.
Microcredit and the Poorest of the Poor: Theory and Evidence from Bolivia. World
Development. 28(2): 333-346. DOI: 10.1016/S0305-750X(99)00121-7.
Ncube, M. 2009. Efficiency of the banking sector in South Africa. University of the
Witwatersrand. Available:
http://www.afdb.org/fileadmin/uploads/afdb/Documents/Knowledge/2009%20AEC-

55
%20Efficiency%20of%20the%20Banking%20Sector%20in%20South%20Africa.pdf?origi
n=publication_detail [2014, December 5].
Paxton, J. & Cuevas, C.E. 2002. Outreach and Sustainability of Member-Based Rural
Financial Intermediaries. In The triangle of microfinance: Financial sustainability,
outreach, and impact. M. Zeller & R.L. Meyer. Eds. Baltimore: The Johns Hopkins
University Press. 135-151. Available:
http://econpapers.repec.org/bookchap/fprifprib/0801871484.htm [2014, December 18].
Posner, E.A. 2014. How do bank regulators determine capital adequacy requirements?
University of Chicago Coase-Sandor Institute for Law & Economics Research Paper No
698. DOI: 10.2139/ssrn.2493968.
Quayes, S. 2012. Depth of outreach and financial sustainability of microfinance institutions.
Applied Economics. 44(26): 3421-3433. DOI: 10.1080/00036846.2011.577016.
Rao, P.K. 2003. Microcredit and inverted banking. In Development Finance. Berlin: Springer.
53-72.
Rauf, S.A. & Mahmood, T. 2009. Growth and performance of microfinance in Pakistan.
Pakistan Economic and Social Review. 47(1): 99-122. Available:
http://www.jstor.org/stable/25825344 [2014, December 29].
Reed, L.R. 2011. State of the microcredit summit campaign report 2011. Available:
http://stateofthecampaign.org/socr2012/ [2014, October 31].
responsAbility. 2014. Microfinance Market Outlook 2014. No “sudden stop”: demand for
microfinance soars. Available:
http://www.fgda.org/dati/ContentManager/files/Documenti_microfinanza/rA_Microfinanc
e_Market_Outlook_2014_EN.pdf [2014, September 11].
Rhyne, E. & Otero, M. 2006. Microfinance through the next decade: Visioning the who, what
where, when and how. Boston: ACCION International. Available:
http://www.microfinancegateway.org/sites/default/files/mfg-en-paper-microfinance-

56
through-the-next-decade-visioning-the-who-what-where-when-and-how-2006_0.pdf
[2014, December 17].
Robinson, M.S. 2001. The microfinance revolution: Sustainable finance for the poor.
Washington D.C.: World Bank. Available: http://www-
wds.worldbank.org/external/default/WDSContentServer/WDSP/IB/2007/08/23/000310607
_20070823152333/Rendered/PDF/232500v10REPLA18082134524501PUBLIC1.pdf
[2014, December 17].
Saltzman, S.B., Rock, R. & Salinger, D. 1998. Performance and standards in microfinance:
ACCION’s experience with the CAMEL™ instrument. Available:
http://www.centerforfinancialinclusion.org/publications-a-resources/browse-
publications/351-performance-and-standards-in-microfinance-accions-experience-with-
the-camel-instrument [2014, September 15].
Schwab, K. Ed. 2014. The global competitiveness report 2014–2015. Available:
http://www3.weforum.org/docs/WEF_GlobalCompetitivenessReport_2014-15.pdf [2014,
December 4].
Schicks, J. 2007. Developmental impact and coexistence of sustainable and charitable
microfinance institutions: Analysing BancoSol and Grameen Bank. The European Journal
of Development Research. 19(4): 551-568. DOI: 10.1080/09578810701667573.
Small Enterprise Education and Promotion Network. 2010. Pocket guide to the microfinance
financial reporting standards measuring financial performance of microfinance
institutions. Available: http://www.seepnetwork.org/pocket-guide-to-the-microfinance-
financial-reporting-standards-measuring-financial-performance-of-microfinance-
institutions-resources-180.php [2014, November 8].
Serrano-Cinca, C., Gutiérrez-Nieto, B. & Molinero, C.M. 2011. Social and Financial
Efficiency of Microfinance Institutions. In The Handbook of Microfinance. B. Armendáriz
& M. Labie, Eds. Singapore: World Scientific. 397-418.

57
Shahzad, U., Balli, H.O., Matthews, C.D. & Tripe, D.W. 2012. Performance through financial
ratios of South Asian microfinance institutions. 25th Australasian Finance and Banking
Conference. DOI: 10.2139/ssrn.2136758.
South African Reserve Bank. 2014. Remarks by the Governor of the South African Reserve
Bank, Gill Marcus. Press Conference August 10th, 2014: African Bank Limited. Available:
https://www.resbank.co.za/Lists/Speeches/Attachments/414/Governor%27s%20Address%
20-%20ABIL.pdf [2014, December 15].
Standard & Poor’s. 2008. Microfinance institutions, changing strategies for changing times.
CreditWeek [Special report]. 28(44): 13-15. Available:
http://www.mixmarket.org/sites/default/files/medialibrary/10011.162/SPCrWk1108_micro
finance.pdf [2014, November 28].
Standard Chartered Bank. 2014. Financial inclusion: Reaching the unbanked [Special
Report]. Available: https://research.standardchartered.com/PublishingImages/Financial-
Inclusion.pdf [2015, January 5].
Tucker, M. & Miles, G. 2004. Financial performance of microfinance institutions: A
comparison to performance of regional commercial banks by geographic regions. Journal
of Microfinance/ESR Review. 6(1): 41-54. Available:
https://ojs.lib.byu.edu/spc/index.php/ESR/article/view/1444 [2014, December 1].
University of Pretoria & Bank Sector Education and Training Authority. 2013. The
microfinance review 2013: From microfinance to financial inclusion. A review of the South
African microfinance sector. Trends, successes, challenges and policy issues. Available:
http://www.bankseta.org.za/downloads/BANKSETA_Microfinance_Review_Report_2013
.pdf [2014, December 4].
Valadez, R.M. & Buskirk, B. 2012. From Microcredit to Microfinance: a business
perspective. Journal of Finance and Accountancy. 6: 1-17. Available:
http://www.aabri.com/manuscripts/10693.pdf [2014, October 30].

58
Volschenk, J. & Biekpe, N. 2003. A comparative study of different segments in the South
African lending industry. South African Journal of Business Management. 34(1): 13-26.
Available: http://hdl.handle.net/10520/EJC22214 [2014, December 5].
Von Stauffenberg, D., Jansson, T., Kenyon, N. & Barluenga-Badiola, M. 2003. Performance
indicators for microfinance institutions (technical guide). 3rd ed. MicroRate. Available:
http://www.microfinancegateway.org/library/performance-indicators-microfinance-
institutions-technical-guide-3rd-edition [2014, November 13].
Von Stauffenberg, S., Von Stauffenberg, D., Rodriguez, M., Spradlin, R. & Bryant, A. 2014.
Technical Guide: Performance and Social Indicators for Microfinance Institutions.
MicroRate. Available: http://www.microrate.com/media/downloads/2014/05/MicroRate_-
Technical-Guide-20142.pdf [2014, November 13].
Waweru, N. & Spraakman, G. 2012. The use of performance measures: case studies from the
microfinance sector in Kenya. Qualitative Research in Accounting & Management, 9(1):
44 – 65. DOI: 10.1108/11766091211216105.
Who Owns Whom. 2014. Corporate Structures: Company Profile. Capitec Bank Holdings
Ltd. Available:
http://www.whoownswhom.co.za/web/?m=Hierarchies&p=view_report&id=432 [2014,
November 21].
Woller, G. 2002. From market failure to marketing failure: market orientation as the key to
deep outreach in microfinance. Journal of International Development, 14(3): 305–324.
DOI: 10.1002/jid.883.
World Bank. 2001. Helping poor people manage risk. In World development Report
2000/2001: Attacking poverty. New York: Oxford University Press. 135-159. Available:
http://www.ssc.wisc.edu/~walker/wp/wp-content/uploads/2012/10/wdr2001.pdf [2015,
January 5].
Yin, R.K. 2009. Case study research: Design and methods. 4th ed. Thousand Oaks,
California: SAGE Publications, Inc.

59
Zeller, M. and Johannsen, J. 2006. Is there a difference in poverty outreach by type of
microfinance institution? The case of Peru and Bangladesh. Global Conference on Access
to Finance: Building Inclusive Financial Systems. 30-31May 2006. Available:
http://info.worldbank.org.ezproxy.uct.ac.za/etools/docs/library/232695/ZellerJohannsen_R
evisedpaper.pdf [2014, December 2].

60
APPENDIX I
Table I-1: Rating report topics

61
Source: Abrams, 2012

62
APPENDIX II
Table II-1: Quantitative indicator ratios
Indicator MFRS ratio Sources that use ratio
Profitability Return on Equity: 𝑁𝑒𝑡 𝑜𝑝𝑒𝑟𝑎𝑡𝑖𝑛𝑔 𝑖𝑛𝑐𝑜𝑚𝑒 − 𝑇𝑎𝑥𝑒𝑠
𝐴𝑣𝑒𝑟𝑎𝑔𝑒 𝑒𝑞𝑢𝑖𝑡𝑦
Return on Assets: 𝑁𝑒𝑡 𝑜𝑝𝑒𝑟𝑎𝑡𝑖𝑛𝑔 𝑖𝑛𝑐𝑜𝑚𝑒 − 𝑇𝑎𝑥𝑒𝑠
𝐴𝑣𝑒𝑟𝑎𝑔𝑒 𝑎𝑠𝑠𝑒𝑡𝑠
Operating Expense Ratio: 𝑂𝑝𝑒𝑟𝑎𝑡𝑖𝑛𝑔 𝐸𝑥𝑝𝑒𝑛𝑠𝑒
𝐴𝑣𝑒𝑟𝑎𝑔𝑒 𝐺𝑟𝑜𝑠𝑠 𝐿𝑜𝑎𝑛 𝑃𝑜𝑟𝑡𝑓𝑜𝑙𝑖𝑜
Bruett 2005; SEEP, 2010; MIX, n.d.
Bruett 2005; SEEP, 2010; Serrano-Cinca, Gutiérrez-
Nieto & Molinero, 2011; MIX, n.d.
Bruett 2005; SEEP, 2010; Balkenhol & Hudon, 2011;
Serrano-Cinca, Gutiérrez-Nieto & Molinero, 2011; MIX,
n.d.
Capital adequacy
and solvency
Capital Asset Ratio: 𝑇𝑜𝑡𝑎𝑙 𝑒𝑞𝑢𝑖𝑡𝑦
𝑇𝑜𝑡𝑎𝑙 𝑎𝑠𝑠𝑒𝑡𝑠
Debt to Equity Ratio: 𝑇𝑜𝑡𝑎𝑙 𝑙𝑖𝑎𝑏𝑖𝑙𝑖𝑡𝑖𝑒𝑠
𝑇𝑜𝑡𝑎𝑙 𝑒𝑞𝑢𝑖𝑡𝑦
SEEP, 2010; Dorfleitner, Leidl & Priberny, 2013; MIX,
n.d.
Bruett, 2005; SEEP, 2010; MIX, n.d.
Liquidity
Liquid Assets: 𝑁𝑜𝑛 − 𝑒𝑎𝑟𝑛𝑖𝑛𝑔 𝑙𝑖𝑞𝑢𝑖𝑑 𝑎𝑠𝑠𝑒𝑡𝑠
𝐴𝑣𝑒𝑟𝑎𝑔𝑒 𝑡𝑜𝑡𝑎𝑙 𝑎𝑠𝑠𝑒𝑡𝑠
Dorfleitner, Leidl & Priberny, 2013; MIX, n.d.
Efficiency Portfolio to Assets: 𝐺𝑟𝑜𝑠𝑠 𝑙𝑜𝑎𝑛 𝑝𝑜𝑟𝑡𝑓𝑜𝑙𝑖𝑜
𝑇𝑜𝑡𝑎𝑙 𝑎𝑠𝑠𝑒𝑡𝑠
Bruett 2005; SEEP, 2010; MIX, n.d.

63
Indicator MFRS ratio Sources that use ratio
Self-sufficiency Operational Self-Sufficiency: 𝐹𝑖𝑛𝑎𝑛𝑐𝑖𝑎𝑙 𝑅𝑒𝑣𝑒𝑛𝑢𝑒
𝐹𝑖𝑛𝑎𝑛𝑐𝑖𝑎𝑙 𝐸𝑥𝑝𝑒𝑛𝑠𝑒 + 𝐼𝑚𝑝𝑎𝑖𝑟𝑚𝑒𝑛𝑡 𝐿𝑜𝑠𝑠𝑒𝑠 𝑜𝑛 𝐿𝑜𝑎𝑛𝑠 + 𝑂𝑝𝑒𝑟𝑎𝑡𝑖𝑛𝑔 𝐸𝑥𝑝𝑒𝑛𝑠𝑒
Bruett, 2005; Serrano-Cinca, Gutiérrez-Nieto &
Molinero, 2011; MIX, n.d.
Source: Saltzman, Rock & Salinger, 1998; Bruett, 2005; SEEP, 2010; Balkenhol & Hudon, 2011; Serrano-Cinca, Gutiérrez-Nieto & Molinero, 2011; Dorfleitner, Leidl &
Priberny, 2013; MIX, n.d.

64
APPENDIX III
Table III-1: Outcome of the indicators for Grameen Bank
Ratio 2004 2005 2006 2007 2008 2009 2010 2011 2012 2013
ROE 0.01 0.18 0.22 0.01 0.15 0.04 0.08 0.07 0.15 0.11
ROA 0.002 0.024 0.025 0.001 0.017 0.004 0.005 0.004 0.009 0.007
Operating
Expense Ratio 0.09 0.13 0.11 0.13 0.11 0.11 0.12 0.11 0.11 0.12
Capital Asset
Ratio 0.15 0.11 0.11 0.09 0.13 0.07 0.06 0.06 0.06 0.06
Debt to Equity
Ratio 5.51 7.89 8.25 9.96 6.71 13.43 15.44 16.11 15.57 15.46
Liquid Assets - 0.26 0.36 0.40 0.39 0.40 0.40 0.40 0.43 0.46
Portfolio to Assets 0.66 0.67 0.59 0.57 0.57 0.58 0.55 0.56 0.53 0.49
OSS 1.01 1.16 1.16 1.01 1.11 1.03 1.04 1.03 1.06 1.04
Source: MIX, 2012a

65
Table III-2: Outcome of the indicators for Capitec
Ratio 2004 2005 2006 2007 2008 2009 2010 2011 2012 2013
ROE 0.12 0.21 0.20 0.20 0.24 0.31 0.25 0.25 0.23 0.27
ROA - 0.105 0.095 0.094 0.083 0.065 0.055 0.057 0.050 -
Operating
Expense Ratio - 1.23 0.83 0.55 0.41 0.33 0.22 0.17 0.12 0.10
Capital Asset
Ratio 0.59 0.45 0.51 0.41 0.28 0.18 0.24 0.22 0.22 0.22
Debt to Equity
Ratio 0.70 1.22 0.96 1.41 2.53 4.49 3.18 3.56 3.50 3.50
Liquid Assets - 0.47 0.53 0.22 0.30 0.27 0.20 0.19 0.19 -
Portfolio to
Assets 0.30 0.43 0.41 0.75 0.65 0.59 0.76 0.80 0.80 0.80
OSS 1.22 1.26 1.29 1.27 1.23 1.24 1.23 1.27 1.27 -
Source: Capitec, 2007; MIX, 2012b; Capitec, 2013