Towards more accurate recognition of patient emotion …...2 TOWARDS MORE ACCURATE RECOGNITION OF...
157
1 Towards More Accurate Recognition of Patient Emotion Cues: Meta-Analysis of Training Literature and Development of an Assessment Tool and Multi-Component Intervention for Clinicians A dissertation presented by Danielle Blanch Hartigan to The Department of Psychology In partial fulfillment of the requirements for the degree of Doctor of Philosophy in the field of Psychology Northeastern University Boston, Massachusetts May, 2011
Transcript of Towards more accurate recognition of patient emotion …...2 TOWARDS MORE ACCURATE RECOGNITION OF...

1
Towards More Accurate Recognition of Patient Emotion Cues: Meta-Analysis of Training
Literature and Development of an Assessment Tool and Multi-Component Intervention for
Clinicians
A dissertation presented
by
Danielle Blanch Hartigan
to
The Department of Psychology
In partial fulfillment of the requirements for the degree of
Doctor of Philosophy
in the field of
Psychology
Northeastern University
Boston, Massachusetts
May, 2011

2
TOWARDS MORE ACCURATE RECOGNITION OF PATIENT EMOTION CUES: META-
ANALYSIS OF TRAINING LITERATURE AND DEVELOPMENT OF A MULTI-
COMPONENT INTERVENTION AND ASSESSMENT TOOL FOR CLINICIANS
by
Danielle Blanch Hartigan
ABSTRACT OF DISSERTATION
Submitted in partial fulfillment of the requirements
for the degree of Doctor of Philosophy in Psychology
in the Graduate School of Arts and Sciences of
Northeastern University, May, 2011

3
Abstract
The ability to make accurate perceptions of others is a valuable skill related to a variety
of positive intra- and interpersonal attributes (Hall, Andrzejewski, & Yopchick, 2009). For
healthcare providers in particular, accurate perception of patients, particularly accurate
recognition of patient emotions, is an ability associated with better patient care, and more
satisfied and adherent patients (Hall, Roter, Blanch, & Frankel, 2009). A critical component of
quality in empathic provider-patient communication is the provider‟s ability to recognize the
emotional needs of the patient. Despite the importance of this skill for effective communication,
research on clinically relevant assessment tools and training programs for emotion cue
recognition ability is extremely limited. This dissertation examines the effectiveness of training
to improve person perception accuracy, with a particular focus on improving healthcare
providers‟ ability to accurately recognize their patients‟ emotion cues.
To summarize the existing literature and assess the combined effect of training on person
perception accuracy, a meta-analysis was conducted of the existing literature on person
perception training interventions in healthy adult populations. Moderators of training
effectiveness were also examined. Overall, training interventions were shown to significantly
increase person perception accuracy in nonclinical adult populations who had received the
training, as compared to those who had not. Feedback and practice were more effective
approaches than instruction alone; however, a combination of approaches was the most effective
training intervention. No study included in the meta-analysis experimentally assessed the impact
of a training intervention to improve basic emotion cue recognition ability in healthy adult
populations.

4
With the goal of improving emotion cue recognition in healthcare providers, this
dissertation also presents an experimental investigation of the effectiveness of a comprehensive
training intervention and its individual components to increase emotion cue recognition ability.
The comprehensive training included raising awareness about the importance of emotion cues in
healthcare interactions, providing instruction for how to increase emotion cue recognition
accuracy, and practicing emotion recognition while receiving feedback. Undergraduate
participants role-playing medical students were randomly assigned to receive the comprehensive
training condition, a control group with none of these training components, or one of four
training conditions where participants received either consciousness-raising, instruction, practice
alone, or practice with feedback. Emotion cue recognition ability following training was
compared across conditions. Participants were significantly more accurate on a standardized test
of emotion cue recognition in the comprehensive condition, when they practiced, and when they
practiced and were given feedback about the correct answer, as compared to those participants in
the control condition. The impact of training condition on participant mood and reactions to the
training are also discussed. Results suggest that a 30-minute emotion recognition training
intervention could significantly improve emotion recognition accuracy.
In addition to testing the effects of training, this dissertation presents validation studies of
the Patient Emotion Cue Test (PECT), as a novel assessment of emotion recognition ability,
developed for healthcare providers (Blanch-Hartigan, 2011). The PECT consists of video clips
depicting emotion cues of an actress portraying a patient with content derived from real patient
interactions. Unlike other measures of emotion recognition ability, the PECT clips are specific to
a healthcare context, vary in the intensity of both verbal and nonverbal cues, and cover five
emotion categories and neutral affect. In three validation studies, the PECT demonstrated

5
sufficient reliability, normally distributed accuracy scores, significantly better than chance
responding, and no ceiling effect. Construct validity was established through significant
correlations with established measures of emotion recognition. The PECT was used as the
primary assessment tool for the training intervention.
Results of the meta-analysis and training intervention study suggest that training and
assessing emotion cue recognition accuracy in healthcare providers is possible. The results can
be used to guide development and implementation of future programs and research aimed at
increasing providers‟ emotion recognition.

6
Acknowledgments
First and foremost, I would like to thank an amazing woman and advisor, Dr. Judith A.
Hall. In these past five years, you‟ve been a mentor, a teacher, a therapist, and a surrogate mother
to me. I am constantly amazed by your brilliance and productivity. In addition to all the research
lessons, you‟ve provided me with an example of how to be a strong and confident woman. I hope
we continue to be friends and collaborators for years to come. Thank you from the bottom of my
heart for everything.
I want to thank my wonderful lab mates: Sue Andrzejewski, Sarah Gunnery, and Mollie
Ruben for your professional advice and sometimes not-so-professional camaraderie. If Judy has
been a surrogate mother, you‟ve all been amazing surrogate sisters- yes, even the middle one!
Thank you for all the support and laughter. I would also like to thank Maureen Gillespie and
Maria Carrillo for five years of friendship. I feel so fortunate to have gone through this crazy
graduate school process from the start to finish with two of the most beautiful and brilliant
women I know. To Jolie Baumann, Leah Dickens, Krista Hill, Allison Seitchik, and Jennelle
Yopchick, you are all the reason that graduate school was such a wonderful experience. The
countless hours of “productive procrastination” up and down the second floor hallway are what I
will remember most. I am so grateful for the memories and lifelong friendships I have made with
you at Northeastern and I cannot wait to see where life takes us all!
I would like to thank my committee members, Joanne Miller and David DeSteno for their
extremely helpful comments and suggestions throughout this process. I would also like to thank
the undergraduate research assistants who have contributed to different aspects of this research
over the years.

7
In my life outside graduate school, I am unbelievably blessed by wonderful family and
friends. I am so thankful for all of you. The deepest of thanks goes to my parents, Gary and
Linda Blanch. Thank you for teaching me the value of education and always encouraging me to
pursue whatever path I chose. This degree and all the years leading up to it would not have been
possible without your constant love and support. You are truly amazing people, who I look up to
both as parents and as friends. I love you so much. To my incredible sisters, Sara and Leanna,
you are both extraordinary individuals, who I feel fortunate just to be friends with, let alone share
this incredible bond of sisterhood. I am so proud of the beautiful women you have become and I
am thankful for all your laughter and love. Our closeness means the world to me.
Over these past five years, I have also gained the love and support of my “new” family.
Dennis, Leanne, and Brian Hartigan, thank you for being the best in-laws anyone could ask for. I
have been honored to join your family. I am so thankful for the hours you‟ve spent working on
the house, watching Bond, and the countless dinners that have made life so much easier during
this process.
And finally, I dedicate this dissertation to my wonderful and supportive husband. Mike,
thank you for always encouraging me to fulfill this dream. I know how much you have given of
yourself to support me through this process and I could not have done it without you. Each year
of graduate school is marked by the wonderful milestones in our life together: our first house,
Bond, our engagement, and our beautiful wedding. Now we can look forward to this new phase
in our lives. You are the best part of my every day and I love you with all my heart. Thank you.

8
Table of Contents
Abstract
2
Acknowledgments
6
Table of Contents
8
List of Tables
10
List of Figures
11
Preface
12
Section 1: The Effectiveness of Training to Improve Person Perception Accuracy:
A Meta-Analysis
14
Introduction 15
Method 19
Results 25
Discussion
30
Section 2: Training and Assessing Emotion Cue Recognition in Patient-Provider
Interactions
40
Chapter 1: Overview
41
Chapter 2: Development and Validation of The Patient Emotion Cue Test
(PECT)
50
Introduction 50
Method 51
Results 58
Discussion
60
Chapter 3: Experimental Test of a Multi-Component Training Intervention 65
Introduction 65
Method 65
Results 73
Discussion
80
References
93
Footnotes
117
Tables 121

9
Figures
138
Appendix A. References Included in Section 1 Training Meta-Analysis
142
Appendix B. Role Induction Script
145
Appendix C. Script for Consciousness-Raising Component
146
Appendix D. Script for Instruction Component
150
Appendix E. Emotional Sensitivity (ES) Scale from the Social Skills Inventory (SSI)
154
Appendix F. Mood Scale
155
Appendix G. Reactions to the Experiment Questionnaire
156
Appendix H. Demographic Questionnaire
157

10
List of Tables
Table 1. Characteristics of Studies Included in Meta-Analysis
121
Table 2. Effect Size Summary for Meta-Analysis on Training Effectiveness
123
Table 3. Moderators of Training Effectiveness
124
Table 4. Examples of Patient Emotion Cue Test (PECT) Verbal Content
129
Table 5. Demographic Information of Participants in Patient Emotion Cue Test
(PECT) Validation Studies
130
Table 6. Descriptive Statistics for Patient Emotion Cue Test (PECT)
131
Table 7. Correlations (r) Between Patient Emotion Cue Test (PECT) and Measures of
Nonverbal Cue Recognition
132
Table 8. Demographic Information of Participants in Training Experiment
133
Table 9. Components Included in Training Conditions
134
Table 10. Descriptive Statistics Across Conditions of Outcome Measures in Training
Experiment
135
Table 11. Correlations (r) Between Patient Emotion Cue Test (PECT) and Outcome
Measures in Training Experiment
136

11
List of Figures
Figure 1. Format of the Patient Emotion Cue Test (PECT)
138
Figure 2. Distribution of Patient Emotion Cue Test (PECT) Accuracy Scores in the
Validation Studies
139
Figure 3. Graph of the Mean Patient Emotion Cue Test (PECT) Score Across Training
Conditions
140
Figure 4. Graph of the Change in Score from Patient PECT-Practice to PECT in the
Comprehensive, Practice Alone, and Practice with Feedback Conditions
141

12
Preface
The ability to make accurate perceptions of others is a valuable skill related to a variety
of positive intra- and interpersonal attributes. For healthcare providers in particular, accurate
perceptions of patients, particularly accurate recognition of patient emotions, is an ability
associated with better patient care, and more satisfied and more adherent patients. Given that
emotion cue recognition is an important skill for healthcare providers, the next step is to develop
ways to foster and improve this ability in providers. One potential approach is to develop training
interventions. However, it is unknown whether accurate person perception is a skill amenable to
training, and, if accuracy can be increased through training, what is the best approach. Moreover,
there is almost no empirical work on training programs to increase emotion cue recognition in
healthcare providers, partially because there is no clinically relevant tool for assessing emotion
recognition.
This dissertation presents three inter-related bodies of work that advance our
understanding of the effectiveness of training in person perception accuracy, with a focus on
emotion cue recognition in the context of patient care: 1. A meta-analysis on the effectiveness of
training on person perception accuracy in the general population; 2. The development and
validation of the Patient Emotion Cue Test (PECT) as a tool for the assessment of healthcare
providers‟ emotion recognition ability; and, 3. An experimental investigation of the effectiveness
of a multi-component training program designed to enhance emotion recognition ability in
healthcare providers. 1
Section one of this dissertation is the literature review and meta-analysis on training to
improve person perception accuracy. The goal of the meta-analysis was not only to summarize

13
knowledge of the effectiveness of training to improve person perception accuracy in the general
adult population, but also to uncover gaps in this underdeveloped literature.
The second section of this dissertation deals specifically with emotion recognition
accuracy in the context of healthcare provider-patient interactions. This section includes the
development and validation of the PECT and an experimental investigation of the effectiveness
of a multi-component, emotion recognition training program.
The second section represents an analogue to a clinical study, because the research was
conducted on undergraduate student samples as a preliminary study of effectiveness and usability
of the assessment and training for healthcare providers.
The primary goal was to develop an effective emotion cue recognition training program
for healthcare providers; however, a proper assessment tool for emotion recognition accuracy in
this context did not exist. Without an appropriate measure, it would be impossible to assess the
impact of the training. Therefore, the second section of this dissertation first presents the detailed
development and validation of a novel assessment tool, the Patient Emotion Cue Test (PECT).
The PECT was used as the main assessment of training effectiveness in the training intervention
study; developing the PECT also provided training materials.
After developing an appropriate assessment tool in the PECT, the next step was to
experimentally assess the effectiveness of a multi-component training intervention to improve
emotion recognition accuracy that could be used with healthcare providers. Because systematic
study on the effectiveness of various components of training are rare, a randomized study was
conducted on the effectiveness of the comprehensive, multi-component training program and its
individual components on emotion cue recognition ability.

14
Section 1
The Effectiveness of Training to Improve Person Perception Accuracy: A Meta-Analysis

15
Introduction
Perceiving and making judgments of others is a ubiquitous part of our interpersonal
interactions. Person perception is defined as the ability to accurately perceive the states and traits
of others. This broad definition includes judgments of others‟ thoughts, emotions, personality,
status, and intentions. When we encounter another person, we use these perceptions to form
impressions of that person and to guide our subsequent interactions.
Decades of research have demonstrated the benefits of accurate person perception.
Accuracy of recognizing others‟ emotions is an important aspect of effective communication
(Hall & Bernieri, 2001a). It is associated with increased social and emotional competence, better
relationship quality, and other positive psychosocial characteristics (for a comprehensive meta-
analytic review, see Hall et al., 2009). Those who are proficient in decoding the verbal and
nonverbal cues of others have better relationships (Carton, Kessler, & Pape, 1999), and better
social adjustment and mental health (Boyatzis & Satyaprasad, 1994; Carton et al., 1999; Nowicki
& Duke, 1994). Likewise, deficits in person perception are associated with increased social
anxiety, depression, and lower self-esteem (Buss, 1989; McClure & Nowicki, 2001; Nowicki &
Carton, 1997; Nowicki & Mitchell, 1998). Accurate identification of emotional expressions of
fear is associated with prosocial behaviors of altruism (Marsh, Kozak, & Ambady, 2007), while
deficits in perceptions of fear expressions, are associated with antisocial behaviors, increased
incarceration, and symptoms of psychopathy (Hastings, Tangney, & Stuewig, 2008; Marsh &
Blair, 2008).
Person perception accuracy is also associated with positive performance and behavioral
outcomes in various applied settings. Greater interpersonal accuracy predicts better performance
in school (Halberstadt & Hall, 1980; Nowicki & Duke, 1994). More interpersonally sensitive

16
healthcare providers have more satisfied, adherent, and engaged patients (DiMatteo, Hays, &
Prince, 1986; DiMatteo, Taranta, Friedman, & Prince, 1980; Hall, et al. 2009). Salespersons with
increased emotion recognition ability earn higher average salaries and sell more of their product
(Byron, Terranova, & Nowicki, 2007).
The conclusion across studies and across fields is that accurate person perception is
associated with many positive psychosocial variables (Hall et al., 2009). An extension of this
research is to pursue avenues for improving this skill. While many researchers have examined
the correlates of accuracy (Marsh & Blair, 2008; McClure & Nowicki, 2001), literature on
approaches to improving person perception accuracy is less well developed (Costanzo, 1992).
The present meta-analysis combines and summarizes the available research from experimental
tests of the effectiveness of training to improve accuracy at inferring the internal states and traits
of others.
Numerous clinical disorders include deficits in interpersonal communication, specifically
accuracy in perceiving others, which lead to poorer relationship quality (Moffatt, Hanley-
Maxwell, & Donnellan, 1995). Training programs have been conducted with success in these
clinical populations. Adults and children with varying degrees of the autism spectrum (Lopata,
Thomeer, Volker, Nida, & Lee, 2008; Silver & Oakes, 2001), learning disabilities (McKenzie,
Matheson, McKaskie, Hamilton, & Murray, 2000), and schizophrenia (Silver, Goodman, Knoll,
& Isakov, 2004) have seen significant improvements in accuracy at perceiving others‟ emotions
as a result of training.
The overall benefit of person perception accuracy training in nonclinical adult
populations is largely unknown. Special populations typically have lower baseline person
perception accuracy, which might suggest that training would be less effective for healthy adult

17
populations without these initial deficits. Although there are meaningful individual differences,
on average healthy adults are fairly accurate in their perceptions of others. Scores on
standardized measures of emotion recognition and other person perception tasks are typically
quite high and significantly above chance. Healthy adults can also achieve accurate perceptions
after viewing very short segments, known as thin slices, of another‟s behavior (Ambady &
Rosenthal, 1992), even when making first impressions (Carney, Colvin, & Hall, 2007). This
could lead to the prediction that person perception training will be ineffective for healthy adults
because they already have high accuracy. However, there are differences in accuracy based on
what type of accuracy is being assessed. For healthy adults, accuracy in deception detection is
only slightly above the chance, or guessing level (DePaulo, Charlton, Cooper, Lindsay, &
Muhlenbruck, 1997). In addition, there is variability within healthy adults, leaving many who
could potentially benefit from improved accuracy.
Training programs have been successfully developed to improve other interpersonal skills
in healthy adults. Researchers have shown that various forms of training can improve social
skills (Argyle, Bryant, & Trower, 1974), the ability to communicate with others (Hottel &
Hardigan, 2005; Rao, Anderson, Inui, & Frankel, 2007), take the emotional perspective of others
(Chalmers & Townsend, 1990), respond empathically to others (Warner, 1984), regulate one‟s
emotions (Schuppert et al., 2009; Wadlinger & Isaacowitz, 2011), or assess the performance of
others without bias (Borman, 1975; Latham, Wexley, & Pursell, 1975; Lievens, 2001; Pulakos,
1986; Wildman, Erickson, & Kent, 1975).
Research on training designed specifically to improve person perception accuracy dates
back to the early 1920s (Allport, 1924), yet it is unknown whether person perception accuracy is
a skill that can be improved through training. Studies show mixed degrees of training

18
effectiveness, with some studies showing very large effects of training on person perception
(Gutierrez & Wallbrown, 1983; Jenness, 1932), and others indicating little or no effect of
training (Barone et al., 2005; Kohnken, 1987; Nixon & Bull, 2005), or even a detrimental effect
of training on accuracy (Kassin & Fong, 1999). Moderators of training efficacy are
underexplored both within and across studies. Therefore, even when training is effective,
questions remain about what training approaches are best, who can benefit most, and how
training should be administered, among others.
Person perception training programs have been attempted in laboratory-based college
student samples (Costanzo, 1992; Elfenbien, 2006; Gillis, Bernieri, & Wooten, 1995; Spool,
1978), police (Kohnken, 1987; Zacker, 1972), and healthcare providers (Alexander, Keitz,
Sloane, & Tulsky, 2006; Gask, Goldberg, Lesser, & Millar, 1988; Goldberg, Steele, Smith, &
Spivey, 1980; Hottel & Hardigan, 2005). However, it is unclear whether the effectiveness of
training varies across groups.
One problem with summarizing this literature is that training programs to increase person
perception accuracy vary in approach and content (Frank & Feeley, 2003). Interventions may
include some form of practice, where a participant gains familiarity with making the judgments
or exposure to the target being judged. Feedback on performance may or may not be included.
Approaches to improve person perception accuracy also include formal instruction or teaching.
A combination of training approaches may be more effective than any approach on its own
(Costanzo, 1992; Vrij, 1994), but again, systematic study of these combinations is rare.
In addition to different approaches to training, there are different content areas, or
domains, that comprise the larger concept of person perception (Hall & Bernieri, 2001a). Person
perception includes basic emotion recognition, judging thoughts and feelings, lie detection, and

19
interpersonal perceptions which are not strictly emotion-based, including judging status and
relationship quality. It is unknown whether certain domains are more or less amenable to
training.
In addition to summarizing the literature and calculating the average effect of training on
person perception accuracy across studies, this meta-analysis also examined these potential
moderators of training effectiveness.
Method
Search Procedure
A comprehensive, systematic search of the literature was conducted using PsycINFO and
MEDLINE for published articles through July, 2010. Search terms included interpersonal
sensitivity, person perception, trait, personality, emotion, emotion recognition, deception
detection, lie detection, accuracy, judgment, nonverbal, nonverbal sensitivity, empathic accuracy,
decoding, facial affect recognition AND train, training, feedback, practice, workshop,
curriculum, intervention, teach, improve, enhance, instruct. Bibliographies of all relevant articles
were also searched. In addition, the authors solicited articles through an email to all members of
the Society for Personality and Social Psychology Listserve.
Inclusion and Exclusion Criteria
For purposes of this meta-analysis, person perception was defined as accuracy in judging
the states and/or traits of others. Due to this inclusion criterion, the present meta-analysis
excluded a large body of literature on training in performance evaluation and behavioral
observation (Spool, 1978). In professional settings, appraisals of performance often include
behavioral observations (Latham & Wexley, 1977). These studies were primarily concerned with
reducing halo effects (Borman, 1975) and other rater biases (Latham et al., 1975). This type of

20
accuracy was about correctly observing and summarizing the behaviors of others and did not fall
under the present definition of person perception accuracy because participants were not
inferring the internal states and/or traits of others. This inclusion criterion also excluded articles
that trained participants to more accurately remember faces they had previously seen (Goldstein,
1985; Malpass, Lavigueur, & Weldon, 1973), as this also did not deal with perceptions of
internal states or traits.
Studies were included only if participants‟ person perception accuracy was scored against
an independent criterion; studies were excluded if they measured person perception through self-
report or a global measure of person perception ability that did not include accuracy. The
perceptions had to be of human targets; studies were excluded if the assessment included
perception of objects or environments. The measure of person perception accuracy had to
incorporate nonverbal cues. The measure could use nonverbal cues, or a combination of verbal
and nonverbal cues, but not simply verbal cues or vignettes.
Training was defined as any interventional approach designed to increase accuracy of
person perception that was not purely motivational in nature. Studies were excluded if they have
examined the effectiveness of motivation on person perception accuracy because a meta-analysis
of the effectiveness of several motivational approaches for increasing accuracy had already been
published (Hall et al., 2008). This meta-analysis on the influence of motivation on person
perception accuracy showed that increasing motivation alone did not increase the ability to
accurately infer internal states and traits from nonverbal cues. The present meta-analysis focuses
on other training approaches.
Studies were included only if the effect size was a comparison of the group(s) receiving
the training to an untrained group in a between-subjects design. Studies were not included if a

21
single group of participants were assessed pre-training, received the training, and then were
reassessed post-training. Results from these within-subject designs could not be meta-
analytically combined with results from between-subject designs (Morris & DeShon, 2002). This
meta-analysis focuses on effect sizes from between-subjects designs. Within-group designs are
excluded because the effect of the training intervention cannot be separated from improvements
due to taking the tests multiple times. 2
Participants had to be adults, greater than 18 years of age, who did not have a clinical
diagnosis. Studies were not included if they included clinical samples or children (both clinical
and nonclinical samples). There were many studies describing training programs developed for
these populations, many of which showed training to be effective in increasing emotion
recognition (Lopata et al., 2008; McKenzie et al., 2000; Silver et al., 2004; Silver & Oakes,
2001). However, because of the primary interest in developing training programs to increase
emotion recognition accuracy in healthcare providers, the current focus was on how best to
improve person perception accuracy in adults.
Lastly, the study had to be published in an English language book or journal;
dissertations were not included.
A total of 96 articles were found during this search. Sixty-six were excluded due to
failure to meet one or more of the inclusion criteria. From the remaining 30 articles (see
Appendix A), 37 independent effect sizes were calculated.
Coding of Potential Moderators
Potential moderators were coded independently by two research assistants. These
research assistants were extensively trained on how to extract this information by one of the

22
authors (SA). All coding was verified by the authors of this meta-analysis (DBH, KH, and SA)
who resolved any disagreements through consensus.
General characteristics. The following information was extracted for each effect size:
publication year; type of effect size (whether the effect size represented a mixed design, which
adjusted for pre-test ability, or represented a simple post-training comparison only); whether
participants were randomly assigned to training condition(s) and control condition. Person
perception domain was coded as deception detection or other person perception. The coded
sample characteristics included: sample size, number of male participants, number of female
participants, average age of sample, and participant type (college students, law enforcement
professionals, or other).
Training characteristics. Characteristics of the training that were coded included: group
size (whether the training was run individually, in small groups of less than five, or in large
groups of five or more); training administrator (whether the training was administered by one
researcher/instructor, more than one researcher/instructor, or self-administered/computer
administered); and total length of the training (in hours). The training approach(es) (instruction,
practice, and/or feedback) and also the total number of these training approaches were coded.
Also coded if the training included practice or feedback was whether participants practiced on
the same, similar, or different stimuli as the post-training assessment; and the number of items
participants practiced on. If participants were given performance feedback, feedback type was
coded as whether the feedback was item-specific (i.e., the correct answer was given after each
item) or overall performance (i.e., given after the completion of the assessment). If the training
included instructions, instruction type (whether the instructions contained general information,
cue-specific information, channel-specific information, or a mix/unspecified information),
23
instruction delivery (whether the instructions were delivered orally or in writing), and instruction
format (whether the instructions were given through didactic/lecture or an interactive format)
were coded.
Assessment characteristics. Characteristics coded about the person perception accuracy
assessment, the outcome by which training effectiveness was measured, included: description
and title of the accuracy measure; validity of the measure (previously validated/used in published
research or new/unknown measure created for purposes of the study); whether the assessment
stimuli were included in some aspect of the training (the same stimuli from the assessment were
included in training, stimuli that were similar in format as the assessment were included in
training but these were not included in the assessment, or the assessment stimuli were not
included in the training). If the same stimuli from the assessment were included somewhere in
the training, we coded the percentage of the assessment stimuli that were included in the training.
If similar stimuli as the assessment stimuli were included in the training, we coded whether the
similar stimuli contained the same target or a different target. We also coded stimuli format
(photo, video, live) and stimuli source (posed/acted or real/spontaneous). Assessments
containing posed stimuli were developed by instructing the target to depict a given situation (i.e.,
asking target to display happiness). Assessments containing real stimuli were developed using
naturally occurring instances of the perceptions being judged. These may have been elicited by
the experimenters but were not acted. Creating stimuli by asking targets to purposefully lie (i.e.,
saying they had headphones in their pocket when they did not (Vrij, 1994; Vrij & Graham, 1997)
was coded as posed stimuli. In addition, we extracted whether the stimuli contained nonverbal
cues only or both verbal and nonverbal cues and the channels of information included in the
stimuli (face only, body only, voice only, or mixed).

24
Effect Size Extraction
Two authors (DBH & KH) extracted effect sizes from the studies. Disagreements were
resolved through discussion and input from the third author (SA) until a consensus was reached.
The Pearson correlation, r, was used as the indicator of effect size across all studies. A
positive r indicated that accuracy scores increased with training; a negative r indicated that
accuracy scores decreased with training. When the original publication reported the difference
between trained and untrained groups as t, F, χ2, and d, these were converted to r using standard
formulas (Rosenthal, 1991). In cases where the effect size was not reported by the original
authors, if possible an effect size was calculated from the information available. In many cases
the original authors reported post-training means and standard deviations in both trained and
control samples. A basic two-sample t-test was calculated using these means and standard
deviations and the t-statistic was converted to r using standard formulas. To maintain
independence of effect sizes within the meta-analysis, when more than one effect size was
available from the same sample, the effect sizes were averaged to create one independent effect
size from each sample. For example, some studies assessed the effects of training on more than
one relevant assessment measure and some studies reported multiple training approaches
compared to a single control group. If the article stated that there was no effect of training and an
exact effect size could not be calculated from the information available (Kohnken, 1987), zero
was entered as the estimate of effect size.
This meta-analysis focuses on effect sizes from between-subjects designs, where
participants who received the training were compared to untrained controls. These effect sizes
were reported as either a comparison of post-test scores between the control group and trained
group, or as a mixed design that controlled for individuals‟ pre-training performance. In three

25
articles, authors reported both effect sizes that adjusted for pretest scores, and those that did not.
In these cases, the mixed, or adjusted, design effect size was chosen for inclusion in the meta-
analysis, to maintain independence within the meta-analysis. Including the post-only instead of
the mixed analysis did not change the results. In the 37 effect sizes from 30 articles that made up
the experimental design meta-analysis, 29 were post-only, and 8 were mixed designs that
adjusted for pre-training performance. Effect sizes were compared between these designs.
Effect sizes were converted using Fisher‟s r-to-z transformation to normalize the
distribution of r, and then averaged to create an unweighted mean effect size across studies. In
addition, effect sizes were weighted by sample size and averaged to create a weighted mean
effect size across studies, and a test of whether the mean r differed from zero was calculated
(Bornstein, Hedges, Higgins, & Rothstein, 2005).
To take into account potentially unpublished studies with nonsignificant findings, a one-
tailed “Fail safe N” was calculated (Orwin, 1983). This is an estimate of the number of additional
studies with effect sizes averaging r = 0.00 necessary to bring the combined Z to a nonsignificant
level (Robert Rosenthal, 1979). This number provides an estimation of how robust the obtained
results are, given that there could be unpublished or unknown null results.
A test for homogeneity was performed to determine if effect sizes within the meta-
analysis differed from each other more than could be expected due to sampling error. The impact
of moderators on training efficacy was assessed through fixed effects contrast analyses (Q) of
different levels of the coded moderators. Analyses were facilitated by the Comprehensive Meta-
Analysis Software program (Bornstein et al., 2005).
Results
Study Characteristics

26
A list of the studies and effect sizes included in the between groups meta-analysis can be
seen in Table 1. The meta analysis is based on a sample of 3,667 participants. The average
sample size was 99.11 participants (SD = 90.37). The sample sizes of individual studies ranged
from 20 to 390 participants. The majority of studies (68%) used samples drawn from college
student populations. Most studies (49%) used a combination of training approaches that included
instruction, practice, and feedback. The most common domain of person perception accuracy
was deception detection (49%). Six effect sizes (16%) were in the domain of empathic accuracy.
These included studies which trained perceivers to judge the thoughts and feelings of others
using the empathic accuracy paradigm (Barone et al., 2005) or Affective Sensitivity Scale
(Bullmer, 1972; Kauss et al., 1980; Robbins et al., 1979), or perceive dimensions of positivity
and dominance in interpersonal communication using the Profile of Nonverbal Sensitivity
(PONS; Hansford, 1977; Rosenthal, Hall, DiMatteo, Rogers, & Archer, 1979). Four effect sizes
were in the domain of perceiving others‟ level of comprehension (Jecker, 1965; Machida, 1986;
Webb, Diana, Luft, Brooks, & Brennan, 1997). The final domain included other person
perception tasks (9 studies, 24%), including judging others‟ status, intimacy, kinship, and
competition on the Interpersonal Perception Task (IPT; Costanzo, 1992; Nixon & Bull, 2005),
perceiving interpersonal rapport (Gillis et al., 1995), judging another‟s perceptions of oneself
(Myers, Myers, Goldberg, & Welch, 1969), judging supervisors' job-related traits (Heneman,
1988), and judging personality (Crow, 1957). There were no studies included in this meta-
analysis that trained participants in basic emotion recognition accuracy (i.e., identifying whether
a target is displaying one of a number of emotional categories).
Training Person Perception Accuracy
27
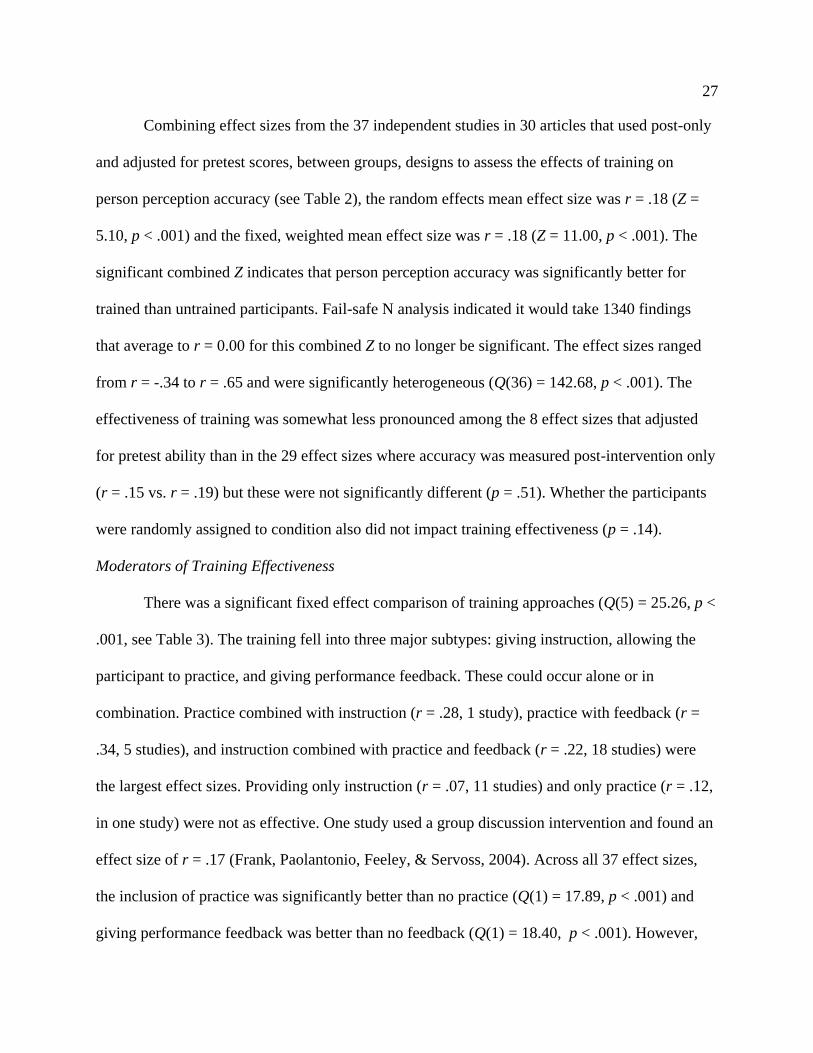
Combining effect sizes from the 37 independent studies in 30 articles that used post-only
and adjusted for pretest scores, between groups, designs to assess the effects of training on
person perception accuracy (see Table 2), the random effects mean effect size was r = .18 (Z =
5.10, p < .001) and the fixed, weighted mean effect size was r = .18 (Z = 11.00, p < .001). The
significant combined Z indicates that person perception accuracy was significantly better for
trained than untrained participants. Fail-safe N analysis indicated it would take 1340 findings
that average to r = 0.00 for this combined Z to no longer be significant. The effect sizes ranged
from r = -.34 to r = .65 and were significantly heterogeneous (Q(36) = 142.68, p < .001). The
effectiveness of training was somewhat less pronounced among the 8 effect sizes that adjusted
for pretest ability than in the 29 effect sizes where accuracy was measured post-intervention only
(r = .15 vs. r = .19) but these were not significantly different (p = .51). Whether the participants
were randomly assigned to condition also did not impact training effectiveness (p = .14).
Moderators of Training Effectiveness
There was a significant fixed effect comparison of training approaches (Q(5) = 25.26, p <
.001, see Table 3). The training fell into three major subtypes: giving instruction, allowing the
participant to practice, and giving performance feedback. These could occur alone or in
combination. Practice combined with instruction (r = .28, 1 study), practice with feedback (r =
.34, 5 studies), and instruction combined with practice and feedback (r = .22, 18 studies) were
the largest effect sizes. Providing only instruction (r = .07, 11 studies) and only practice (r = .12,
in one study) were not as effective. One study used a group discussion intervention and found an
effect size of r = .17 (Frank, Paolantonio, Feeley, & Servoss, 2004). Across all 37 effect sizes,
the inclusion of practice was significantly better than no practice (Q(1) = 17.89, p < .001) and
giving performance feedback was better than no feedback (Q(1) = 18.40, p < .001). However,

28
training was effective with or without the inclusion of instruction, and was actually marginally
less effective with instruction (Q(1) = 3.45, p < .10). There was a significant positive fixed
effects linear regression (Z = 3.57, p < .001) showing that training effectiveness increased the
more training types were included.
When practice was included, training effectiveness was not moderated by the number of
items participants practiced on (Z = 1.47, p = .55). When feedback was included, it did not
matter whether feedback was given after each item, or on overall task performance (p = .26).
Although the inclusion of instruction did not significantly improve training efficacy, when it was
included, instruction was most when it was delivered in written format (r = .31), or a mix of
formats (r = .21), as opposed to orally (r = .08, Q(3) = 23.26, p < .001). It did not matter whether
instruction contained general information, information about specific verbal or nonverbal cues,
or a mix of these (p = .83), or whether the instruction included an interactive approach,
didactic/lecture approach, or a mix of approaches (p = .42).
Training was more effective when it was delivered in a mix of group sizes (r = .40) small
groups of less than five people (r = .26), or individually (r = .23), than in large groups of more
than five people (r = .17, Q(3) = 8.16, p < .05). Training was more effective when administered
by one researcher or instructor (r = .25) than when self-administered on a computer (r = .15),
Q(1) = 5.88, p < .05). Surprisingly, although length of training varied across studies (mean =
6.37 hrs, SD = 8.34, range = 5 minutes to 35 hours), the length of training also did not moderate
effectiveness. The linear fixed effect regression was not significant (p = .36). Training
effectiveness did not increase as the length of training increased. Nor was training effectiveness
moderated by length when length was coded as a categorical moderator of less than 5 hours or 5
hours or more (p = .46).

29
Training was more effective for decoding nonverbal cues only (r = .27) than for decoding
both verbal and nonverbal cues (r = .14, Q(1) = 10.83, p < .01). Cue channel did not moderate
training effectiveness (p = .22). Training was more effective when the outcome was assessed
using a previously used or validated assessment measure (r = .24) than when the assessment was
created for purposes of the experiment (r = .15, Q(1) = 8.36, p < .01). It did not matter whether
these stimuli were derived from real/spontaneous displays (r = .18) or created by posing/acting (r
= .19, p = .89).
Training was more effective when the same assessment stimuli (r = .26) or similar
assessment stimuli (r = .22) were included in the training as opposed to when they were not (r =
.09, Q(2) = 18.46, p < .001). Overall, training was more effective when the target(s) being
perceived during the assessment was included somehow in the training (r = .26), as opposed to
not (r = .15, Q(1) = 8.44, p < .001). However, in cases where the stimuli in the assessment were
similar to stimuli used in the training they could have included the same target or not included
the same target. This did not moderate the effect of training (r = .23 vs. r = .21, p = .78). If the
same stimuli were included in the training, the training could include any proportion of the
assessment stimuli. Training was actually marginally more effective when a smaller percentage
of the assessment stimuli were included in the training (Z = -1.87, p = .06).
In a linear fixed effect regression, training was more effective as the percentage of males
in the sample increased (Z = 2.57, p = .01). The type of nonclinical population did significantly
moderate training effectiveness (Q(3) = 13.53, p = .32). Training was more effective on college
students (r = .19), law enforcement professionals (r = .20), and mixed or other types of samples
(r = .27), than on medical professionals (r = -.08).

30
Training was effective in every person perception domain, but domain significantly
moderated training effectiveness (Q(3) = 15.58, p = .001). Training was most effective for
improving accurate perceptions of others‟ comprehension (r = .47), followed by empathic
accuracy (r = .23), deception detection (r = .17), and least effective for improving other person
perceptions (r = .14).
Discussion
Results from this meta-analysis show that it is possible to increase accuracy of person
perception through training in nonclinical adult populations.
Training approach mattered. This meta-analysis is evidence that a combination of training
approaches is more effective than any one approach on its own, a finding supported by the few
studies that systematically testing combinations of approaches compared to a single approach
(Costanzo, 1992; Hill & Craig, 2004). The fact that the length of training did not impact training
effectiveness also suggests that training effectiveness is about the content and the approach.
Instruction did not work as well as practice and feedback. A potential explanation for the
lesser effectiveness of instruction may be understood if person perception is thought of as a skill
that operates largely level outside of our awareness. When perceiving others, people form
judgments quickly and often with little effort. They may make these judgments using judgment
policies, or a set of rules for forming accurate impressions that are applied largely without
conscious awareness during a person perception task. Because these judgment policies operate
outside of awareness, making them deliberate and conscious may actually lower accuracy (N.
Ambady & Gray, 2002). The judgment policies used by nonclinical adult populations when
perceiving others are highly practiced and engrained throughout a lifetime. This is what enables
rapid judgments based on very thin slices of behavior to produce accurate perceptions (Ambady,

31
Hallahan, & Conner, 1999; Carney et al., 2007; Roter, Hall, Blanch-Hartigan, Larson, & Frankel,
2011). These judgment policies are also thought to explain why increasing motivation to be
accurate on judgments of nonverbal cues is not particularly helpful (Hall et al., 2008).
The work on motivational interventions suggests that increasing person perception
accuracy requires more than manipulating participants‟ desire to improve at this skill. Perhaps
effective training requires adjustment to the unconscious processes involved in person
perception. Training was more effective when it targeted judgment processes through practice
and feedback, than when it targeted consciously controlled judgments through instruction.
Attempting to change these judgment policies solely by manipulations of conscious processes
may not be sufficient in most cases.
Giving participants instructions about specific cues to look for or how to apply those cues
is a manipulation of conscious processes. If it were possible for instruction alone to be effective,
it would occur when increasing consciousness might aid perception. The Brunswik Lens Model
of person perception suggests that accuracy is achieved through correctly observing the cues that
are associated with variation in the construct of interest (Brunswik, 1956; Hammond, 1966). For
many person perception domains, the cues associated with the construct vary or there is little
consensus about which cues indicate which constructs. However, the Brunswik model implies
that training programs that include instructions directing trainees to the correct cues should be
the most effective for person perception judgments where these cues are known, such as with lie
detection (DePaulo et al., 2003; Fiedler & Walka, 1993) and rapport (Bernieri, Gillis, Davis, &
Grahe, 1996; Bernieri & Gillis, 2001). In lie detection, there are very specific and clearly
established behavioral cues which are associated with lying. However these often contradict
perceivers‟ preconceived notions of the nonverbal behaviors that indicate deception (Akehurst,

32
Kohnken, Vrij, & Bull, 1996; Malone & DePaulo, 2001; Zuckerman, Koestner, & Driver, 1981).
Even in lie detection, instruction alone was not sufficient without additional practice and
feedback. It may be that perceivers cannot process the correct cues, without being able to
practice applying them and receiving feedback about whether they are practicing them correctly,
because they go against the unconscious judgment policies that have guided all their previous
perceptions. Future research should disentangle the impact of instruction for person perception
cues that either enhance or contradict previously learned judgment policies.
Instruction also may be ineffective because perceptions being judged often to not have
universal, reliable diagnostic cues. For example, if a participant is given instructions on how to
look for deception, it might not be helpful because target A presents different cues to deception
than target B. This may also be an explanation for why training was not effective when different
stimuli were included in the training. Practice and feedback may be more valuable because they
are specific to the individual targets being judged. Although practice and feedback were more
effective than instruction, there may be greater limits to the genearalizability of these
approaches.
Overall, an instructional training approach in the absence of practice and feedback was
not effective in improving accuracy. Another explanation for the lesser effectiveness of
instruction is that practice and feedback occur naturally in the development of these skills but
instruction may not. As is the case with lie detection, people are often unaware and never have
the opportunity to learn of the most diagnostic cues. The judgment policies for person perception
are learned through interpersonal interaction, which often includes practice and to a lesser extent
feedback. Nonclinical adults may be less receptive to instructional approaches because they have

33
already acquired judgment strategies for person perception or because they are not equipped to
learn judgment strategies through conscious awareness.
Instruction, however, did not significantly decrease accuracy and, in combination with
other training approaches, was effective. We can speculate that it may enhance the effects of
practice or feedback by giving participants a set of rules. It may take additional processing of the
information for the instruction to be effective. Perhaps this is also why instruction was more
effective in written format than when delivered orally, assuming that in the written format
participants were able to read and review the information.
Population differences may also be understood in light of this distinction. Instruction
alone has been shown to be effective for enhancing emotion recognition accuracy for adults with
learning disabilities (McKenzie et al., 2000), brain injury (Radice-Neumann, Zupan, Tomita, &
Wilier, 2009), schizophrenia (Russell, Green, Simpson, & Coltheart, 2008; Silver et al., 2004),
and children with autism (Bolte et al., 2002; Bauminger, 2007; Golan et al., 2010). Explicit,
instructional training may work for these populations because these individuals either cannot or
have not developed the ability to automatically make perceptions about others. Instructions
provide these individuals with „rules‟ to apply to a given set of stimuli.
One of the most widely studied aspects of person perception accuracy, basic emotion
recognition did not contribute any studies to the meta-analysis comparing trained participants to
untrained controls. However, other research suggests that emotion recognition may be amenable
to training. There is a large body of literature on emotion recognition training in children and
clinical populations such as autism, schizophrenia, and brain injury patients showing training to
be effective. Research on training effectiveness for emotion recognition in nonclinical adult
populations is less well developed. No studies in this meta-analysis attempted to train healthy

34
adults in basic emotion identification (i.e., judging which emotional categories a given target was
displaying), but some studies included in the meta-analysis did have affective dimensions.
Training was effective for the empathic accuracy domain. Training improved performance on the
Profile of Nonverbal Sensitivity (PONS) test, a test of accuracy in judging affective nonverbal
cues from the face, body, and voice (Hansford, 1977; Rosenthal et al., 1979). Participants watch
or listen to nonverbal cues and must decide the affective context (e.g. is the target “saying a
prayer” or “admiring nature”, “threatening someone” or “ordering food at a restaurant”).
Training also improved empathic accuracy, in paradigms in which participants were asked to
perceive the self-reported thoughts and feelings of a target in a video. There were studies in the
within-subjects meta-analysis which trained emotion recognition in nonclinical adult samples. 2
Emotion recognition accuracy was significantly higher after training in these studies, also
suggesting that this domain is amenable to training. However, the larger effect size does not
necessarily mean that it is easier to train emotion recognition than other domains of person
perception because the pre-post design intrinsically produces larger effect sizes.
Lipsey and Wilson reviewed 302 published meta-analyses that examined the
effectiveness of any psychological, educational, or behavioral intervention (Lipsey & Wilson,
1993). Like the results of this meta-analysis, they concluded that interventions generally have a
meaningful effect. Like this meta-analysis, Lipsey and Wilson also concluded that across meta-
analyses there was very little difference in effect size between studies that used randomized
versus nonrandomized between groups designs. Forty-five of the meta-analyses included in their
review provided a comparison of between- and within-subjects designs and found that the effect
size was overestimated in the within-subjects design. The effect sizes for within-subjects designs
were 61% higher than those for between-subjects designs. Future research should not only test

35
the effectiveness of training on emotion recognition accuracy using a between groups design, but
also examine which approaches are most effective for this domain. These are the primary goals
of the experiment presented later in this dissertation.
Training interventions to improve personality judgment accuracy was another domain
underrepresented in the present meta-analysis. Like other person perception domains, making
accurate judgments of personality is a skill associated with positive psychosocial characteristics.
For example, good judges of others‟ personality were characterized as more communal and
agreeable (Vogt & Colvin, 2003), and good judges of new acquaintances‟ personalities were
self- and friend-rated as more agreeable and better adjusted (Letzring, 2008). In this meta-
analysis, only two studies used an assessment measure that addressed trait judgments using the
Trait Rating Scale (Heneman, 1988) and Minnesota Multiphasic Personality Inventory (MMPI;
Crow, 1957). The Trait Rating Scale consisted of a list of 20 items that pertained to traits that
could be ascertained from a videotaped performance of a supervisor in an organizational context.
The MMPI is a personality test used in a clinical context. In an unpublished dissertation, not
included in the meta-analysis, Powell investigated the effectiveness of training to improve Big
Five personality judgments in employment interviews (Powell, 2008). The training was based on
Funder‟s suggestion that personality judgments can be improved through knowledge of how
personality is manifested in behavior (Funder, 1995). The training involved a brief lecture in
which the importance of personality judgments was emphasized and behavioral cues associated
with specific traits were reviewed, followed by a written exercise in which participants practiced
making use of personality-relevant cues, and group discussion and feedback on these judgments.
This mix of instruction, practice and feedback was effective for improving personality judgments
of certain traits (i.e. Conscientiousness and Extraversion), but not all traits (i.e. Neuroticism).

36
These studies suggest that perception of personality can be improved with training, but the most
effective approaches are not understood and additional research is warranted in this domain. No
published study has attempted to train participants to become more accurate judges of
personality traits, including Big Five traits, in a general, not context-specific, interaction.
Despite person perception accuracy being a skill where female superiority has been
documented (Hall, 1978; Hall, 1984) and is a common stereotype (Hall, Manusov, & Patterson,
2006), the training literature does not focus on gender differences. This meta-analysis suggests
that training is more effective for males because the effect sizes were larger when there was a
larger percentage of males in the sample. The fact that the training is more beneficial for male
participants suggests that these individuals may be functioning at a lower level of accuracy and
have more room for improvement than females (Hall, 1978). However, the story may be more
complicated given that individual studies report mixed results. deTurck (1991) also reported no
main effect for gender, but planned contrasts revealed that after deception detection training,
trained males were more accurate than untrained males and trained females were more accurate
than untrained females. However, untrained females were more accurate than untrained males
and there was no difference between trained females and males. Interestingly, training also
significantly impacted males‟ confidence, with trained males significantly more certain in their
deception judgments than untrained males, and both trained and untrained females. Another
study by this same author found that males were more confident in their deception judgments
(deTurck, Harszlak, Bodhorn, & Texter, 1990). In this group study, training was also particularly
effective for males when the stimuli they were judging were actors who had likewise been
trained to better hide their cues. In an empathic accuracy paradigm, there was no pretest gender
difference, but after training, females were more accurate than males on inferring thoughts but

37
not feelings (Barone et al., 2005). Costanzo (1992) found that training did not differentially
affect males‟ and females‟ accuracy for inferring status, intimacy, kinship, and competition.
Most researchers failed to report training results by gender. More research on gender differences
in training should be conducted and reported.
Also still largely unanswered by the existing training literature is whether improvements
in person perception accuracy caused by training are associated with subsequent improvements
in other interpersonal outcomes. For instance, if a training program successfully improves
accuracy and accuracy is associated with positive outcomes, such as the sale of more cars (Byron
et al., 2007) or more satisfied patients (Hall et al., 2009), does that increase in accuracy cause a
subsequent sale of more cars or an increase in patient satisfaction? Understanding how training
impacts accuracy and subsequent interpersonal behaviors and outcomes is one way to
experimentally test the hypothesis that accurate person perception is responsible for and not a
byproduct of these positive psychosocial characteristics (Hall et al., 2009). Future training
studies are a way to open the black box of individual differences in interpersonal accuracy and
understand the mechanisms that underlie these correlates of accurate person perception.
In addition, it would be beneficial to know the lasting impact of these effects. Training
may effectively improve person perception accuracy, but questions remain about whether those
results are transient or permanent, how best to maintain these improvements, and if those
improvements can generalize across domains. No studies examined whether improved accuracy
in one domain of person perception as a result of training led to improved accuracy in another
domain, for example, whether improvements in lie detection as a result of training would
increase accuracy in emotion recognition. Vrij and colleagues (1997) attempted to improve lie
detection by instructing participants how to recognize gestures associated with personality traits,

38
but they did not measure personality judgment accuracy so it is unclear whether there were
improvements in personality perception as well.
Another direction for future study is to fully explore by what mechanisms particular
training approaches demonstrate their effectiveness. For example, we know that feedback is an
effective training approach, but we have yet to understand how feedback is working. Are
participants changing their judgment policies for making inferences of others? Or does feedback
simply allow participants to better calibrate their evaluations and learn which type of judgment
policies works best (Hall, Gunnery, & Andrzejewski, 2011)?
Meta-analysis is a powerful tool for combining and summarizing data across studies, yet
there are limitations to this approach. There was a large amount of variance in effect sizes that
may not be fully explained by the moderator analyses. There may be other moderators that
explain variance in effect sizes that were not coded. Publication bias is a concern for training
studies; however, the fail-safe N indicated that it would take over 1300 studies with null results
to produce a nonsignificant combined effect size for training effectiveness. In addition, there was
significant heterogeneity and a wide range in effect sizes including negative effects, suggesting
the field has published effect sizes of varying magnitudes.
This review of the literature demonstrated fairly conclusively that training interventions
could enhance person perception accuracy in nonclinical adult populations. There are
implications for this across various aspects of everyday interactions. These results have
implications in applied settings. Healthcare providers, customer service agents, sales
representatives, teachers, and people in a host of other professions could possibly see
improvements in work efficiency attributed to improvements in person perception accuracy. One
of the most important applications for improving person perception, particularly emotion

39
recognition accuracy, is in the context of interactions between patients and their doctors, nurses,
and other healthcare providers. The next section of this dissertation focuses on training person
perception, specifically emotion recognition accuracy, in the healthcare context.

40
Section 2
Training and Assessing Emotion Cue Recognition in Patient-Provider Interactions

41
Chapter 1. General Introduction
Even in their most benign and routine form, provider-patient consultations are an
intensely personal experience. The quality of this relationship is significantly influenced by the
provider‟s interpersonal communication, a cornerstone of the patient-centered model of care
(Mead & Bower, 2000). In patient-centered care, healthcare providers are encouraged to engage
in active listening and to respond to both the physical and the emotional health of the patient. An
attempt is made to understand patients‟ emotional experiences and unique perspectives about
their disease (Beach & Inui, 2006; Mead & Bower, 2000). Emotional understanding is one of the
basic tenets of patient-centered communication (Krupat, Frankel, Stein, & Irish, 2006); empathic
providers are able to recognize the patients‟ emotions and perspective and convey this
understanding to their patients (Stepien & Baernstein, 2006).
In the clinical context, a well established link exists between effective empathic, patient-
centered communication and patient satisfaction and positive health outcomes (Kim, Kaplowitz,
& Johnston, 2004; Kinnersley, Stott, Peters, & Harvey, 1999; Mead & Bower, 2000; Stewart et
al., 2000; Stewart, 1995). Patients who perceive their providers to be more empathic even report
lower levels of anxiety immediately after their visit (van Dulmen & van den Brink-Muinen,
2004). A critical component of empathic, patient-centered communication is believed to be the
ability to detect, identify, and respond to the emotional cues of the patient (Beach & Inui, 2006;
Blue, Chessman, Gilbert, & Mainous, 2000; Del Piccolo, Goss, & Bergvik, 2006; Epstein &
Street, 2007; Norfolk, Birdi, & Walsh, 2007). Lawmakers recognize the importance of this skill
for healthcare providers. Healthy People 2010 is a decennial mandate last issued in 2000 by the
United States Department of Health and Human Services (2000) as a list of objectives for
improving the healthcare system. Healthy People 2010 pointed to the importance of strategically

42
using effective communication to improve patient health and put forth a goal to “increase the
proportion of persons who report that their health care providers have satisfactory
communication skills,” section 11-17. The concept of accurate communication was listed both
within this goal and more broadly as one of the 11 attributes of effective health communication
(section 11-4). Accurately recognizing patient emotions is important to effective, quality
communication (Hall, 2011).
Patient emotional content occur in a majority of consultations and with some frequency
(Bylund & Makoul, 2002; Duric et al., 2003; Zimmermann, Del Piccolo, & Finset, 2007).
Physicians often report that they recognize and respond appropriately to patient emotions
(DeCoster & Egan, 2001; Smith & Zimny, 1988). However, numerous studies have shown that
patient emotions are often missed or not responded to appropriately by providers (Beach, Easter,
Good, & Pigeron, 2005; Doblin & Klamen, 1997; Easter & Beach, 2004; Epstein & Street, 2007;
Jansen et al., 2011; Kim, Kols, Prammawat, & Rinehart, 2005; Levinson, Gorawara-Bhat, &
Lamb, 2000; Morse, Edwardsen, & Gordon, 2008; Oguchi et al., 2011; Ryan et al., 2005;
Uitterhoeve et al., 2008; Zimmermann et al., 2007). Providers often do not perceive signs of
patient distress (Hornblow, Kidson, & Ironside, 1988), particularly when patients cannot or do
not verbalize the symptoms of distress (Winokur, Guthrie, Rickels, & Nael, 1982).
Failure to notice or address patients‟ emotional needs can lead to misdiagnosis, incorrect
treatments, and poorer health outcomes (Zimmermann et al., 2007). Not responding
appropriately to emotion cues is also associated with less patients‟ recall of educational
information in the visit (Jansen et al., 2011).
Moments within the exchange when a patient presents emotional content to a provider
have been operationalized and labeled in a variety of ways, as “windows of opportunity” (Branch

43
& Malik, 1993), “clues” (Floyd, Lang, McCord, & Keener, 2005; Levinson et al., 2000), or
“empathic opportunities” (Bylund & Makoul, 2002, 2005; Eide et al., 2004; Epstein & Street,
2007; Morse et al., 2008). Researchers in this area reached consensus, calling these moments
“cues” and defining them as “verbal or nonverbal hints which suggest an underlying unpleasant
emotion and would need clarification from the health provider” (Del Piccolo et al., 2006; Del
Piccolo, Goss, & Zimmermann, 2005).
Although this definition is limited in a variety of ways, the term will be used in the
present research to maintain consistency. The present research will expand this definition to
include pleasant as well as unpleasant emotional content and does not stipulate that the cue must
be in need of clarification. Simply speaking, for our purposes, emotion cues are defined as a
moment where there is a presence of emotional content.
Patient emotion cues can be difficult to measure (Maguire et al., 1983). In almost all
cases, the cues are identified by researchers and not by the patient in the interaction (Bylund &
Makoul, 2002). Patient self-reports may be inaccurate due to recall bias, demand characteristics,
lack of emotional self-awareness, or other factors. However, despite these limitation, patient self-
reports are the best option for identifying patient emotion cues and establishing accuracy criteria.
The gold standard for non-clinical work in emotion recognition is to utilize self-reported
emotions or another independent method as criteria for measuring recognition ability (Ickes,
1993, 2001). Without an established criterion, it can be difficult or impossible for coders to judge
the patient‟s intent behind subtle nonverbal behaviors. Therefore, low intensity cues and
nonverbal behavior are often overlooked (Bylund & Makoul, 2002; Mead & Bower, 2002).
When nonverbal behavior is considered an emotion cue, the behaviors are often blatant and
unambiguous, such as a patient crying or sighing heavily (Del Piccolo et al., 2009). In addition,

44
emotion cues are typically identified from transcripts or audiotapes, which do not provide full
nonverbal information, and the cues are therefore defined primarily by their verbal content
(Butow, Brown, Cogar, Tattersall, & Dunn, 2002; Eide, Quera, Graugaard, & Finset, 2004; Kim
et al., 2005; Mead & Bower, 2002; Morse et al., 2008; Oguchi et al., 2011).
Nonverbal emotion content should not be overlooked. Patients‟ subtle nonverbal
behaviors are indispensable when a provider is attempting to recognize emotion cues and
understand the patient‟s emotional experience (Beach et al., 2005; Doblin & Klamen, 1997;
Machado, Beutler, & Greenberg, 1999; Schmid Mast, 2007; Roter, Frankel, Hall, & Sluyter,
2006; Zimmermann et al., 2007). Overlooking subtle behaviors can lead to inaccurate
identification of patient cues (Doblin & Klamen, 1997). Nonverbal cues occur more often than
verbal cues and patients with more severe health issues emit more nonverbal cues to
psychological distress than patients without (Davenport, Goldberg, & Millar, 1987). Patient
anxiety is more easily diagnosed when providers have access to full video information than from
a transcript alone (Waxer, 1981). Healthcare providers are more likely to use information from
nonverbal cues than verbal cues when judging patient emotions (Yogo, Ando, Hashi, Tsutsui, &
Yamada, 2000); nonverbal cues expressed by patients are used to judge levels of patient pain and
distress (von Baeyer, Johnson, & McMillan, 1984). Physicians report that they use nonverbal
information from body language and facial expressions to gauge a patient‟s anxiety and desire
for more information (Frojd, Lampic, Larsson, Birgegard, & von Essen, 2007).
Recognizing subtle emotion cues, both verbal and nonverbal, is an important factor in
empathic medical communication (Fentiman, 2007). In non-clinical contexts, accuracy of
recognizing others‟ emotions is an important aspect of effective communication (Hall &
Bernieri, 2001a) and is associated with increased social and emotional competence, better

45
relationship quality, and other positive psychosocial characteristics (Hall et al., 2009). In clinical
contexts, providers‟ accuracy at emotion recognition has received less attention (Roter et al.,
2006). However, there is evidence that a clinical provider‟s ability to recognize nonverbal
emotion cues is associated with a variety of positive patient outcomes (DiMatteo et al., 1986;
DiMatteo et al., 1980; Hall et al., 2009; Roter et al., 2008; Tickle-Degnen, 1998). In these
studies, providers‟ skill at accurately decoding the nonverbal cues of others was assessed by a
standardized test, in most cases the Profile of Nonverbal Sensitivity (PONS), and then correlated
with patient outcomes. Physicians‟ accuracy on the PONS was associated with increased patient
satisfaction (DiMatteo, Prince, & Taranta, 1979; DiMatteo et al., 1980), adherence to scheduled
appointments (DiMatteo et al., 1986), and greater vigilance and marginally greater accuracy in
diagnosing patient symptoms of depression and anxiety (Robbins, Kirmayer, Cathebras, Yaffe,
& Dworkind, 1994). For occupational therapy students, accuracy on the PONS was associated
with better overall performance in a 3-month fieldwork internship (Tickle-Degnen, 1998).
Genetic counselors‟ increased PONS scores were associated with more knowledge gained by
role-playing patients as a result of the visit. In the most recent study, with medical students,
higher scores on the PONS and another standardized emotion recognition test, the Diagnostic
Analysis of Nonverbal Accuracy (DANVA), were associated with more standardized patient
warmth and engagement during an Objective Structured Clinical Examination (Hall et al., 2009).
The medical students who were more accurate on these tests were also rated as more likeable and
received higher satisfaction scores by role-playing patients.
Even though accurately recognizing patient emotion cues is a skill associated with a
variety of positive health outcomes, medical education in most cases does not specifically train
medical students to recognize patient emotion cues as part of communication curricula

46
(Hornblow et al., 1988; Levinson et al., 2000; Satterfield & Hughes, 2007). Medical students
may be particularly poor at accurately perceiving others, as compared to their peers not in
science (Giannini, Giannini, & Bowman, 2000), perhaps because of the medical culture which
deemphasizes sensitivity in favor of technical skill (Hafferty & Franks, 1994). The undervaluing
of communication skills is particularly strong in specialties less characterized by patient
interaction, such as radiology and surgery. Medical students considering these specialties
demonstrate even lower person perception abilities than medical students interested in primary
care (Giannini et al., 2000).
Although research is very limited, there is some indication in the previous literature that
training emotion cue recognition is effective at improving participants‟ ability to recognize
emotion cues in a medical context. Dental students participated in a 35-hour training course that
focused on interpersonal communication and signals of patient anxiety. Participants greatly
increased their ability to notice and appropriately respond to the patient‟s nonverbal behavior
(Hottel & Hardigan, 2005). Medical residents assigned to a 16-hour curriculum about end-of-life
communication that included role-play practice showed an increased ability to respond to
standardized patients‟ emotional cues (Alexander et al., 2006). Family medicine residents were
randomly assigned to individual sessions about accuracy in psychiatric assessments. The
instruction and practice group showed a significant increase on assessment ability as compared
to controls (Goldberg et al., 1980). Similarly, training in detecting and managing psychiatric
illness using videotaped interviews, with particular emphasis on verbal and nonverbal patient
cues, significantly increased general practitioners‟ ability to detect psychiatric illness, sense
patient distress, and respond empathically (Gask et al., 1988).

47
In a recent study by Endres & Laidlaw (2009), 24 first year medical students took the
Micro Expression Training Tool (METT), designed to improve their ability to recognize fear,
sadness, happiness, contempt, disgust, anger, and surprise in facial expressions. As part of the
training, students practiced labeling example facial expressions, got feedback on their overall
score, received narrated instructions on the nonverbal signals of the various emotions, and
received more practice and feedback on individual items before taking a post-test. Students who
were pre-defined as good communicators in previous patient interactions improved more than
students who were pre-defined as poor communicators. All students reported the training to be
relevant, but some pointed to the fact that in real life affective information would come from
more than just facial expressions, suggesting a need for a dynamic and multi-channel assessment
tool.
Research has examined the impact of training interventions on other healthcare
communication skills. The communication abilities trained in a healthcare context are typically
broad and do not directly measure emotion cue recognition. In fact, many times they are at best
indirectly related to emotion cue recognition. Communication courses are only a small part of the
medical school curriculum and these courses typically include training in a wide range of
behaviors including gathering medical information and being an ethical provider (Hargie,
Dickson, Boohan, & Hughes, 1998). When they do address patient cues, communication training
programs often focus on eliciting emotion cues and responding appropriately to patient cues
(Butow et al., 2008). While the importance of these skills should not be ignored, if a provider is
unable to accurately recognize an emotion cue when it is present, then getting a patient to elicit
more cues or being able to respond appropriately to a cue when it is noticed are of secondary
import.

48
Training programs in a clinical context have increased providers‟ emotion cue eliciting
behaviors (Maguire, Booth, Elliott, & Jones, 1996; Maguire, Faulkner, Booth, Elliott, & Hillier,
1996), knowledge about communication in medicine (Smith et al., 1991), and interviewing and
communication skills (Maguire, 1978; Rao et al., 2007; Satterfield & Hughes, 2007). Research
has also shown that general communication skills training can increase empathy (Roter et al.,
2004). Communication training significantly improved medical students ability to establish
rapport with their patients and to gather complete and accurate information about the patients‟
concerns and health (Smith et al., 2007). Communication training may lead to positive outcomes
for not only the patient, but also the provider. General communication skills training has been
shown to increase confidence in communicating with patients (Noble, Kubacki, Martin, & Lloyd,
2007) and positive affect (Magai, Cohen, & Gomberg, 2002), and has even helped providers to
feel more positively about their jobs (McGilton, Irwin-Robinson, Boscart, & Spanjevic, 2006).
Communication training in healthcare providers is not always effective (Evans, Stanley,
Coman, & Burrows, 1989) and there are numerous limitations in this research (Satterfield &
Hughes, 2007). As was seen when searching for articles for the meta-analysis in the previous
section, these studies suffer from poor research designs (Hulsman, Ros, Winnubst, & Bensing,
1999). Often there are no control groups (Hottel & Hardigan, 2005), sample sizes are small
(Goldberg et al., 1980), and the instruments used as outcome measures are not validated and not
created for use in a clinical context (Rao et al., 2007; Stepien & Baernstein, 2006).
One of the biggest problems with assessing emotion recognition ability and the effects of
training is the lack of a universally accepted, patient-specific, assessment measurement (Cegala
& Broz, 2002; Satterfield & Hughes, 2007). While previous research has looked at emotion
recognition ability in non-clinical contexts using standardized tests (for a review see Hall &

49
Bernieri, 2001a), there are no patient-specific stimuli to measure emotion recognition ability in
healthcare providers. These commonly used, standardized tests do not present stimuli which map
onto the emotion cues a provider must recognize in a typical encounter. When interacting with
their patients, providers typically have access to information from both what the patient is saying
and what the patient is doing. The patient, therefore, presents emotion cues that contain not only
nonverbal emotion cue information but also verbal information. Patient emotion cues in these
real-life interactions also contain multiple channels of information. Providers can see the
patient‟s face and entire body, and hear the patient‟s voice. In addition, in real-life interactions,
emotion cues occur amidst moments that do not contain emotional information. When cues are
presented they may be at different intensity levels. Sometimes patients present fairly noticeable
signs of distress, but sometimes the nonverbal and verbal information is more subtle and less
obvious to the provider.
A measure to assess the impact of training emotion cue recognition for clinical providers
must address these aspects to present stimuli which mirror clinical interactions. The next chapter
describes the development and validation of the Patient Emotion Cue Test (PECT), a novel test
of emotion recognition ability in a patient-specific context.

50
Chapter 2. Development and Validation of the Patient Emotion Cue Test (PECT)
Introduction
Despite the consequences of emotion cue recognition for effective communication in
healthcare settings, there does not currently exist a clinically relevant assessment tool for
emotion cue recognition ability in healthcare providers.
The typical paradigm for research on emotion cues in clinical interactions uses
videotapes, audiotapes, or transcripts of an interaction. Trained coders identify emotion cues and
then code provider response. However, this coding approach, while suitable for some research
questions, cannot assess the providers‟ ability or accuracy at recognizing patients‟ emotion cues.
The coder cannot always know whether the patient was feeling an emotion or what emotion
category was being displayed. In this coding approach, recognition of low intensity and
nonverbal cues is not assessed because emotion cues are defined primarily by their verbal
content. Coders can miss signs of distress when focusing on verbal content (Liess et al., 2008). In
addition, coding of provider recognition is confounded with response. Most studies coding
provider responses to patient emotion cues assume not responding to a cue is an indication the
provider missed the cue, or, less commonly, they assume nonresponse is an indication the
provider ignored the cue. The distinction between missing or ignoring a cue cannot be made by
coding only a provider response, and missing or ignoring cues may be associated with different
patient outcomes. Knowing the provider‟s ability to recognize cues can allow researchers to
explore the difference between ignoring and missing a cue.
Because of the limitations of the coding approach, there is a need for a standardized,
objective test to assess emotion cue recognition ability in healthcare providers. The ideal test

51
would cover both verbal and nonverbal behavior, various cue channels (i.e., face, body, voice,
etc.), and different emotion categories (i.e., anger, sadness, etc.), making it analogous to
information available in a clinical interaction, but with an established criterion to score
providers‟ accuracy. The test stimuli would be ecologically relevant to an interaction by
presenting a real patient or, lacking that, someone acting as a patient, and the test stimuli would
be derived from real patient interactions. No existing tests of emotion recognition accuracy
combine all these elements.
With these requirements in mind, the Patient Emotion Cue Task (PECT) was
systematically developed as a clinically relevant test of emotion cue recognition of both verbal
and nonverbal behaviors of varying intensities and spanning multiple emotion categories. The
PECT was developed for the purpose of assessing individual differences in emotion recognition
accuracy, with particular relevance for healthcare providers. It was also developed to assess the
effectiveness of the emotion recognition training program, described in the next chapter of this
dissertation.
Method
Description of Test
The Patient Emotion Cue Test (PECT) consists of 47 video clips, showing a series of
emotional statements derived from real patient interactions, portrayed by a female actor who,
while acting as a patient, varied her nonverbal behavior while delivering the statements. The
PECT clips cover five emotional categories (anger, sadness, happiness, anxiety, and confusion)
as well as neutral clips, which are defined as the absence of emotional content. The intensity of
expression of the emotions varies across clips for both verbal and nonverbal behaviors
representing the emotions. The emotions can be depicted as high, low, or neutral in nonverbal

52
intensity of the emotion and as high, low, or neutral in verbal intensity of the emotion, as shown
in Figure 1. Represented in the 47-clip test is one clip from each intensity category (e.g., high
verbal and low nonverbal intensity) from each of the five emotions. There are also seven neutral
clips in which both nonverbal and verbal emotional information is neutral. The clips average
three seconds in duration and each clip is followed by eight seconds of black screen during
which the participant responds. Participants view the PECT on a computer screen and record
their responses on an answer sheet in front of them. The PECT takes just under nine minutes to
complete.
Instructions, Response Format, and Scoring
Test takers are instructed: “In this task, you will view a series of short clips of an actor
portraying a patient. Your job is to watch the clip closely and decide what you think the patient is
conveying. Circle either: Anger, Sadness, Happiness, Anxiety, or Confusion. If the patient is not
conveying any of these things, circle Neutral. If you‟re not sure, take your best guess. You
should pay attention to the words the patient is saying and what she doing in each clip.
Sometimes information comes from just the words the patient is saying. Sometimes it comes
from just what the patient is doing. Sometimes it comes from both what the patient is saying and
doing.”
For each clip, test takers answer: “What is the patient conveying?” 1= Anger, 2= Sadness,
3= Happiness, 4= Anxiety, 5= Confusion, or 6 = Neutral. Responses are scored as correct if they
identify an angry clip as anger, a neutral clip as neutral, a sad clip as sadness, etc. (0= does not
correctly identify emotion; 1= correctly identifies emotion). The overall accuracy score is the
average across all 47 clips, with possible scores ranging from .00 to 1.00.
Stimuli Development and Selection

53
The stimuli for the PECT were developed and selected to fit into the a priori structure of
the test (i.e., systematic variation in emotion category, nonverbal intensity, and verbal intensity,
see Figure 1). The first step in developing the PECT was rating and selecting the verbal content.
Statements were selected from transcripts of real patient interactions used in previous research
(Hall, Irish, Roter, & Ehrlich, 1994; Roter & Larson, 2002). One hundred sixty-seven potential
statements were read by 21 undergraduate students recruited through Northeastern University‟s
online experiment database, who received partial credit in their introductory psychology course.
For each statement, raters answered: 1. “Is an emotion present in this statement?” (1 = definitely
no to 7 = definitely yes); 2. “What specific emotion is being conveyed?” (anger, sadness,
happiness, anxiety, confusion, no emotion/other); and, 3. “How intense is the emotion being
conveyed?” (1 = not at all intense to 7 = extremely intense). Ratings of emotion presence and
intensity were reliable (Cronbach‟s α = .87 for question 1 about presence and α = .87 for
question 3 about intensity) and were averaged across raters. For question 2, “What specific
emotion is being conveyed?” the number of raters (out of 21) who identified the statement as
belonging to each category was counted. These ratings of intensiy, presence, and emotional
content were used to select neutral statements and statements in each emotion category,
conveying high and low verbal intensity of that emotion. Fifteen statements were rated as
neutral. For neutral statements an average of 12 raters (out of 21 raters; range 8-17 raters)
selected the statement as “no emotion/other.” Neutral statements had an average rating of 2.46
(SD = .24) for presence and 2.30 (SD = .24) for intensity. Eighteen statements were rated as
angry, 15 as sad, 19 as happy, 25 as anxious, and 20 as confused. Among these emotion
categorizations were statements rated as high and low intensity for each emotion. For all emotion
statements, low intensity statements were rated lower in presence and intensity than high

54
intensity statements. This difference was significant for all emotions except for confusion, which
was in the correct direction. As another way to assess the emotion intensity of the verbal
information, statements selected as low in verbal intensity had between 7 and 11 raters identify
the statement as that emotion and statements selected as high in verbal intensity had between 15
and 21 raters identify the statement as that emotion. For example, a statement selected as low
intensity anger had a smaller percentage of people identify that statement as angry and received
lower average scores on intensity and presence than a high intensity angry statement. For
examples of statements in each emotion and intensity category, see Table 4.
In the second development step, the 15 neutral, 18 angry, 15 sad, 19 happy, 25 anxious,
and 20 confused statements selected in the first development step were enacted multiple times by
an adult Caucasian female, who deliberately varied the intensity of the nonverbal behaviors
associated with the emotion (high, low, neutral). The actor was not instructed on specific
behaviors to employ, but was instructed she could convey the emotions by varying her nonverbal
behaviors (e.g., for angry statements the behaviors included intense gaze, increased rate of
speech, eye rolling, furrowed brow, and heavy breathing). She modified intensity through the
strength and number of nonverbal behaviors she conveyed within the clip. In all the clips the
actor is sitting in a chair against a blank wall facing the camera. Although situations exist when
emotion cues are expressed by patients in different body positions, this position was chosen as
being comparable to a routine clinical encounter.
The resulting 544 clips were shown to three raters with the sound off to systematically
rate visible nonverbal content. Though doing this did not permit the vocal nonverbal cues to be
included in these ratings, it was assumed that visible nonverbal cues would correspond in
intensity with the vocal nonverbal cues. For each clip, raters were asked the same three questions

55
as the participants who rated the verbal content: 1. “Is an emotion present in this clip?”; 2. “What
specific emotion is being conveyed?”; and, 3. “How intense is the emotion being conveyed?”
Raters were reliable at Cronbach‟s α = .87 for presence and α = .84 for intensity and, therefore,
ratings were averaged across raters. These ratings were used to define what clips were high
intensity, low intensity, and neutral for nonverbal information. From the 544 clips,
approximately three clips that corresponded to each intensity variation for each emotion category
and neutral were selected using the ratings of the verbal and nonverbal content, resulting in 179
clips. Low intensity clips were rated lower in presence and intensity than high intensity clips; this
difference was significant for all emotion categories. Neutral clips were rated with an average of
1.53 (SD = .56) on presence and 1.34 (SD = .43) on intensity.
In the final development study, 45 undergraduate participants from Northeastern
University‟s online experiment database watched the 179 clips and were asked to rate intensity
and accurately identify the emotional content of each clip. Raters were reliable (Cronbach‟s α =
.92) and so again, ratings were combined across raters. These ratings were used to select 47 clips
for inclusion in the final version of the PECT. Selected clips each demonstrated better than
chance accuracy and variation in responding across the 45 raters. Clips were not selected if all
participants accurately identified the emotion, as this would not allow for subsequent analysis of
individual differences. Clips selected as low intensity showed lower accuracy than high intensity
clips.
Validation Studies
Once the final set of 47 clips was selected from the development studies described above,
reliability and validity of the PECT was assessed in three studies.

56
Participants. One hundred twenty-five participants took part in the three studies (Study 1:
N = 40; Study 2: N = 26; Study 3: N = 59). Participants were undergraduate students recruited
through Northeastern University‟s online experiment database. They received partial credit in
their introductory psychology course. Students participated in a laboratory at Northeastern
University. Demographic information is available in Table 5.
Procedure. Participants were brought into the laboratory and told they would be
completing a series of tasks designed to assess their ability at judging others. Participants in all
three studies completed the PECT. Participants also took the Diagnostic Analysis of Nonverbal
Accuracy for both adult faces (DANVA2-AF) and adult voices (DANVA2-AV), validated tests
of emotion identification accuracy using 24 photographs and 24 audio clips of individuals posing
happy, sad, angry, and fearful expressions (Nowicki & Duke, 1994; 2001). Participants were
asked to identify what emotion the target is displaying, either happy, sad, angry, or fearful. The
DANVA tests do not contain neutral clips. Accuracy was scored as an average across the 24
stimuli (0= does not correctly identify emotion, 1= correctly identifies emotion).
Participants in all three studies reported their age, gender, ethnicity, and whether they
were considering medical school at any point in the future (5-point Likert scale: 1 = Definitely
no to 5 = Definitely yes). Given that in some previous literature medical students showed
decreased person perception accuracy as compared to nonscience students (Giannini et al.,
2000), this measure was included to assess differences in PECT scores for those students who
reported a strong desire to attend medical school in the future as opposed to those who did not.
In Study 2 and Study 3, participants also completed the Profile of Nonverbal Sensitivity
(PONS) for both face/body and vocal cues (Hall, 2001; Rosenthal et al., 1979). The PONS
face/body test consists of 20 2-second, silent face-only and 20 2-second, silent body-only video

57
clips of an adult female enacting different emotional scenarios. Participants were asked to decide
which of two scenarios she is portraying in each clip. In the PONS audio test, participants were
asked to make the same type of judgments of 40 content-masked audio clips of an adult female
voice. Accuracy for each test was scored as an average across the 40 stimuli (0= does not
correctly identify scenario, 1= correctly identifies scenario).
In Study 2 participants also completed the Face Recognition Test, which measures
memory for faces (Malpass & Kravitz, 1969). Twenty photographs of male faces are presented
for 2 seconds each. The photographs are presented a second time mixed with 20 new faces.
Participants were asked to decide whether they had seen the face during the first set of faces.
Accuracy was scored as an average across the 40 items (0 = incorrect, 1 = correct).
All materials and procedures for the three validation studies and the development steps
that included undergraduate participants were approved by the Institutional Review Board at
Northeastern University.
Analysis. Mean accuracy on the PECT was tested against chance level, which for this test
was .17 because there were six answer choices. Scores on the PECT were correlated with self-
reports and other tests using Pearson‟s correlation coefficients (r). Results from the three
independent studies were combined using meta-analysis. All effect sizes (r) were transformed
using the Fisher‟s r-to-z transformation to normalize the data, weighted by sample size, and
averaged. A combined Z score and probability were calculated (Rosenthal, 1991). The meta-
analyses were assisted by use of Comprehensive Meta-Analysis software (Bornstein et al., 2005).
Additional Materials
PECT-Practice. An additional set of clips called the PECT-Practice was developed
through the same development process as the PECT and covered the same emotion categories

58
and verbal and nonverbal intensities. There was no duplication between the PECT-Practice clips
and the PECT clips. Both the PECT and PECT-Practice were given to participants in Study 1 and
Study 2. Order of administering the two tests was counterbalanced and randomly assigned. The
PECT-Practice did not differ in mean and standard deviation from the PECT (PECT-Practice
mean from Study 1 and Study 2 combined = .68, SD = .08, PECT mean from Study 1, 2, 3
combined = .68, SD = .08). Scores on the PECT and PECT-Practice were significantly positively
correlated (from Study 1 and Study 2, average weighted mean r = .36, p < .01). The PECT-
Practice was intended as a tool for practice and was used as a practice tool in the training study
described in this dissertation.
Alternate response option. In addition to the 6-choice scoring option described earlier, the
PECT also has an alternate two-question response/scoring option. This response option was used
in the training study described in this dissertation. Test takers first answer whether emotional
information is present by answering question 1: “Is the patient conveying something?” (0 = not
at all, 1 = yes, weakly, 2 = yes, strongly). Test takers then identify the emotion cue from five
emotion categories. If the test taker answered yes, weakly or yes, strongly on question 1, the test
taker answers question 2: “What is the patient conveying?” by choosing: 1= Anger, 2= Sadness,
3= Happiness, 4= Anxiety, or 5= Confusion.
Results
Descriptive Statistics
Results are based on pooled data from participants in all three validation studies (N =
125), unless otherwise specified. Results from the three studies demonstrate that overall accuracy
scores on the PECT were normally distributed (see Figure 2) and significantly above chance
responding (t(124) = 73.52, p < .001, compared to 6-choice guessing level of .17). Scores ranged

59
from .47 to .85 with a modal score of .68 (see Table 6). The overall mean accuracy score was
also .68 (SD = .08). Means and standard deviations did not significantly differ across studies
(Study 1 mean accuracy = .69 (.08), Study 2 mean accuracy = .66 (.08), Study 3 mean accuracy
= .66 (.07)).
Accuracy broken down by emotion category and emotion intensity is shown in Table 6.
As expected, when emotional content was present, accuracy increased, as more emotional
information was available to the participant. Clips with high verbal and high nonverbal emotion
intensities were the most accurately identified.
The PECT was designed to include clips of varying difficulty. The average accuracy for
each of the 47 clips ranged from .06 (SD = .25) to .99 (SD = .08). Although all clips were
selected in the development process to have above chance accuracy levels, four clips had below
chance accuracy in the validation studies (average accuracy on clip 16 = .06, clip 24 = .08, clip
30 = .11, and clip 44 = .16). These four clips were all in the low intensity nonverbal category and
the most common mistake was to identify them as neutral. Importantly, average accuracy on
these four clips was significantly associated with overall PECT accuracy (r(124) = .21, p < .05),
indicating that those participants who were correct on these especially difficult items were better
overall on the test. Deleting these four clips from the analyses did not alter the pattern of results.
Reliability
Reliability for the test was modest (Cronbach‟s α = .47 on the three studies pooled and α
computed). PECT reliability was comparable across studies (Study 1 α = .48, Study 2 α = .52,
Study 3 α = .38). This level of reliability is typical of other nonverbal sensitivity tests having
relatively few items. The internal consistency of the other measures was α =.29 for DANVA2-
AF, α = .10 for DANVA2-AV, α = .41 for PONS face/body, and α =.31 for PONS audio. All of

60
these are lower than the PECT reliability. Spearman Brown Split-half reliability was similar
(Study 1 r = .42, Study 2 r = .67, Study 3 r = .39, combined r = .46).
Relationship with Measures of Nonverbal Cue Recognition
The PECT, which contains both visual and auditory information, demonstrated
convergent validity through correlations with standardized tests representing multiple channels
of emotion recognition (see Table 7). This includes recognition of emotion in facial expressions
on the DANVA2-AF (weighted average correlation across three studies r = .25, p < .01), and
emotion in vocal cues on the DANVA2-AV (weighted average correlation across three studies r
= .29, p < .01) and the PONS audio test (weighted average correlation across three studies r =
.25, p < .01).
In Study 1, a lack of correlation with the Face Recognition Test (r = -.05, ns) suggests the
PECT is more than just a memorization or attention task.
Participant age (weighted average correlation over three studies, r = -.09, ns), ethnicity
(F(5,116) = 1.20, ns), and consideration of medical school in the future (weighted average
correlation over three studies, r = .07, ns) were not associated with accuracy on the PECT.
Participant gender was not significantly associated with accuracy, but the PECT did show a
small female advantage across the three studies (weighted average correlation across three
studies, r = .10, ns).
Discussion
The ability to recognize the emotion cues of patients is an important skill for healthcare
providers (Hall, 2011). The Patient Emotion Cue Test (PECT) is a new tool designed to measure
this ability. In three studies, the PECT demonstrated normally distributed accuracy scores within
an acceptable range; participants responded significantly better than chance, with sufficient

61
variability and no ceiling effect. Discriminant validity is suggested through a lack of association
with a test of memory for and attention to faces. Across the three studies, the PECT
demonstrated construct validity through significant correlations with established measures of
emotion recognition. These correlations are impressive given that interpersonal sensitivity tests
often show little correlation with each other (Hall & Bernieri, 2001a). In fact, in the sample
reported here, the PONS face/body and PONS audio were not significantly correlated with the
DANVA2-AF and DANVA2-AV in either Study 2 or Study 3. In addition, the correlations
between the PECT and these measures of nonverbal cue recognition would not be expected to be
of large magnitude because they are not perfectly equivalent skills. The PECT contains neutral
cues and verbal information, which the others do not. Therefore, the PECT may be measuring a
related, although slightly different skill set. Future research should investigate whether the PECT
predicts clinical outcomes, such as performance in the doctor-patient interaction and patient
satisfaction.
The PECT was developed because of a need for an objective tool for measuring emotion
recognition ability in healthcare providers. In a healthcare setting, the PECT has greater face
validity because the content and instructions are directly applicable to patient care and mirror the
presentation of emotion cues in real provider-patient interactions. The PECT is one of few tests
that include simultaneous presentation of verbal and nonverbal emotion cue information,
something not found in single-channel tests. It benefits from multiple channels without
sacrificing being relatively short and easy to administer.
Many established tests of emotion recognition cannot measure detection of emotion cues
because they do not include neutral stimuli. Without neutral stimuli, the test takers are always
aware that the stimuli they are judging contains emotional content, which overlooks an aspect of

62
emotion recognition, the ability to detect whether an emotion cue is occurring in the first place.
For example, in the DANVA, participants are instructed to pick which of four basic emotion
categories the facial expressions presented to them are representing (happy, sad, angry, fearful);
participants know a priori that each face will display one of these emotions. The DANVA and
similar tests measure an important aspect of emotion recognition, which has demonstrated
predictive ability for many positive personality characteristics and relationship outcomes (Hall et
al., 2009). However, in everyday doctor-patient interactions, emotion cues are imbedded within
conversation. The ability to accurately identify emotional content occurs alongside the ability to
detect that an emotion cue has occurred at all. Because the PECT includes neutral clips, emotion
recognition accuracy as measured by the PECT includes both the ability to detect and identify
emotion cues.
The PECT does have limitations, one of which is its modest internal consistency. Modest
inter-item reliability is not necessary a threat to the validity of an assessment (McCrae, Kurtz,
Yamagata, & Terracciano, 2011). In fact, if each of the items in a test is designed to measure a
distinct aspect of the construct of interest, then the internal consistency would be expected to be
lower than if all items are measuring a very narrowly defined aspect. In the PECT, each clip
represents judgment of one emotion category, one nonverbal intensity variation, and one verbal
intensity variation. The traditional item-analysis approach to stimuli selection involves selecting
items based on inter-item correlations. The PECT development did not take this approach.
Instead, clips were rigorously tested and then selected to be exemplars of a given category (i.e.,
high intensity verbal anger and low intensity nonverbal anger). Therefore, stimuli were not
selected to maximize reliability but to maximize fit into the a priori structure of the test. As a
result, reliability was lower than would be ideal for a test developed using standard psychometric

63
test construction, but on par with tests developed using the latter approach and on par with the
other tests of nonverbal cue recognition (Hall, 2001b; Rosenthal et al., 1979). For example, the
internal consistency of the other measures in these validation studies, the DANVA and PONS
tests, were lower than the internal consistency of the PECT. Like the PECT, the well validated
PONS face/body and PONS audio used an a priori method of stimulus selection (Rosenthal et al.,
1979).
Producing stimuli using an actor somewhat limits the realism of the measure. However,
using actors as standardized patients to assess providers‟ abilities is a common practice in
medical education. Medical students are familiar with this procedure from objective structured
clinical examinations (OSCEs) and other training activities, including for assessment of
interpersonal skills (van Zanten, Boulet, & McKinley, 2007). Variations of this method have
been successfully used in previous research to depict patient cues (Brown et al., 2002; Deladisma
et al., 2008). Healthcare providers report being comfortable responding to acted (Sheldon et al.,
2009; Uitterhoeve et al., 2008), or even virtual patients (Deladisma et al., 2007; Deladisma et al.,
2008). Acted clips of patient interactions are capable of capturing the attention of students and
have been used effectively in communication training (Wong, Saber, Ma, & Roberts, 2009).
Existing, validated tests in nonmedical contexts almost exclusively use acted clips (Nowicki &
Duke, 1994; Rosenthal et al., 1979). In the meta-analysis reported in Section 1 of this
dissertation, training effectiveness did not vary as a function of whether the assessment measures
were developed using acted or naturally occurring stimuli.
The PECT features clips of one female target person. Although ability to decode different
individuals or different genders cannot be directly assessed using this method, it also assures that
variation in perceivers‟ accuracy is not due to variation in encoding ability of the actors.

64
Frequently tests of emotion recognition feature stimuli with one (i.e., PONS) or a small number
of actors (i.e., DANVA). Researchers should not use the PECT or other tests with one target to
draw conclusions about overall accuracy for different emotions, as this may be an artifact of the
encoding ability of the target. However, individual differences in emotion cue recognition can be
assessed using one actor. In fact, this measure would be akin to assessing accuracy in several
providers by having them all interact with the same real or standardized patient.
There are additional patient characteristics (i.e., ethnicity), emotion categories (i.e.,
disgust), and other factors that are not part of the PECT stimuli. However, no test, especially one
that is relatively short, can or does cover all aspects of emotion recognition. The length of any
test is a very important practical consideration in the medical context. The PECT is a novel test
of emotion cue recognition specifically designed for healthcare providers, which is short and
easily administered.
The PECT could also be a useful tool for self-assessment of this interpersonal skill.
Healthcare providers may be unaware of their abilities in emotion cue recognition, especially in
comparison to their peers. Medical students often overestimate their communication performance
(Blanch-Hartigan, 2010). Perhaps because there are no clinically relevant measures of emotion
recognition, students have a difficult time trying to gauge their performance and
researchers/educators cannot judge how right or wrong students are in these self-assessments.
The PECT is a valid measure of emotion cue recognition that can be used to assess the
benefits of a training intervention designed to improve emotion recognition. The training
intervention described in the next chapter will use the PECT-Practice as a training tool for
practice and feedback and the PECT as the primary outcome measure to assess emotion cue
recognition ability after training.

65
Chapter 4. Experimental Test of a Multi-Component Training Intervention
Introduction
Although accurately perceiving patients‟ nonverbal emotion cues is associated with
positive patient outcomes (Hall, 2011), medical education in most cases does not specifically
train healthcare providers to recognize patient emotion cues as part of the communication
curricula (Levinson et al., 2000).
This dissertation chapter presents a study of the effectiveness of a novel multi-component
training intervention expected to increase emotion cue recognition ability. Participants, serving
as analogues to healthcare providers, were randomly assigned to no training or one of five
training conditions, with either instruction, awareness, practice, or feedback, or a comprehensive
training condition, which included all of these components. Emotion cue recognition ability
following training was assessed using the PECT. The goal is to test the effectiveness of this
training program for future use in training healthcare providers.
Method
Participants
Students were recruited through Northeastern University‟s online experiment database
and received partial credit in their introductory psychology course. A total of 209 participants
completed the experiment. After examination of the data, six participants were removed from the
data set. These participants were outliers on the PECT. In most cases, notations were made by
the research assistants running the session indicating these participants‟ answer sheets were
incorrectly numbered or they had difficulty with the directions. One of these participants was an
outlier on almost all the tests administered. The excluded participants did not belong

66
disproportionately to any one training condition. The final number of participants was 203.
These participants were on average 19 years old, 59% female, and the majority were Caucasian.
These characteristics did not differ significantly across conditions. Demographic information for
the total sample and within conditions is available in Table 8.
Role induction. All participants received a role induction asking them to think and act
like a medical student while participating in the experiment (see Appendix B). The present
training program was designed for use with medical students; the role induction asking
undergraduates to imagine themselves to be a medical student was intended to attenuate some of
the attentional and motivational differences between undergraduate participants and real medical
students. Because the training was developed for medical providers, it referred to patients and
patient emotions. The PECT, the primary assessment, instructed participants that the stimuli
being judged were an actor portraying a patient. Therefore, the role induction also ensured that
the training and assessment seemed reasonable in a university laboratory setting.
During the validation of the PECT described earlier, the role induction was piloted to
determine if it had any effects on PECT performance in undergraduate students. Most
importantly, this piloting of the role induction was conducted to ensure that the role induction did
not have any unforeseen detrimental effects on PECT performance (i.e., asking undergraduates
to think and act like medical students would not cause them to reject the tasks and perform
poorly). Participants in this pilot (N = 27) were randomly assigned to either receive the role
induction or not. Results of this pilot test revealed that PECT scores were significantly higher for
participants who had received the role induction compared to those who had not (F(1,26) = 6.45,
p < .05). Results indicated that the induction was not detrimental to performance but actually
improved performance. The role induction was thus administered to each participant in the

67
training experiment, to frame the experiment and ensure that the undergraduate participants
would represent a medical student sample as closely as possible.
However, because most undergraduate students have no experience as medical
professionals, whether there were differences in training effectiveness for those undergraduate
participants who were considering medical school in the future and those who were not was also
assessed.
Description of Training Components
Participants were assigned to one of six training conditions: 1. Comprehensive, 2.
Consciousness-Raising, 3. Instruction, 4. Practice Alone, 5. Practice with Feedback, or 6. Control
(see Table 9).
The Comprehensive Training condition included multiple training components:
Consciousness-Raising component, Instruction component, and Practice with Feedback
component. These components are described in detail below. The components of this training
were presented to the participant in the order listed above.
The Control condition did not receive any of the training components.
The remaining conditions each included only one of the training components and were
designed to assess the individual effectiveness of each component of the Comprehensive
Training condition.
Consciousness-Raising condition: The goal of the Consciousness-Raising condition was
to highlight for the participant the importance of emotion recognition and empathic
communication in the medical interview. The Consciousness-Raising component included a
definition of emotion cues, the frequency of these cues in the general medical interaction, and
how often these cues are missed or ignored by providers. It also described consequences and

68
correlates of both recognizing and not recognizing patient cues. Examples were given from the
research to lend credibility to the arguments presented. This component was presented to the
participant in the form of a 10-minute videotaped presentation. The script (see Appendix C) was
delivered by a professionally dressed male, 28 years old, with an authoritative demeanor.
Instruction condition: The goal of the Instruction condition was to provide information
that can aid in emotion cue recognition and improve performance on the PECT. However, the
Instruction component was not intended to teach “to the test,” but was intended to increase
emotion recognition accuracy and so covered not only information that would be relevant to the
testing procedure (PECT), but also emotion recognition in a clinical interaction. The instruction
covered basic verbal and nonverbal indicators of the emotion cue categories, and general
emotion recognition advice based on findings in the research literature (e.g. Ryan et al., 2005).
This script (see Appendix D) was presented to the participant in the form of a 10-minute
videotaped presentation, read by the same male presenter. Since the participants in this condition
were given general advice about cue recognition, if effective, this too might have been a result of
raising consciousness. However, it was different in its primary focus from the Consciousness-
Raising condition.
Practice Alone condition: The goal of the Practice Alone component (without feedback)
was to provide participants with the opportunity to practice taking a test like the PECT.
Participants completed the PECT-Practice. No feedback on performance was provided during or
after taking the PECT-Practice. The PECT-Practice took just under ten minutes to complete.
Practice with Feedback condition: In this condition, participants completed the PECT-
Practice, but they were given feedback about each clip. After participants recorded their answers
for each clip, the correct answer was displayed on the screen. For example, if the clip depicted

69
high verbal anger intensity and low nonverbal anger intensity, the feedback read, “She was
angry. She conveyed anger strongly through her words and weakly through her nonverbals.” The
feedback therefore encompassed both the detection and identification aspects of their response
and the verbal and nonverbal intensities. The participants were given time and encouraged to
compare their answer to the correct answer but instructed not to change their original answer.
The PECT-Practice with feedback after each item took just over 12 minutes to complete.
Assessment
PECT. All participants took the two-question response format PECT. This response
format asks test takers two questions. First, test takers detect whether emotion is present by
answering question 1: “Is the patient conveying something?” (0 = Not at all, 1 = Yes, weakly, 2
= Yes, strongly). If an emotion is detected (answer is Yes, weakly or Yes, strongly), the test taker
was asked to Identify the emotional content by answering question 2: “What is the patient
conveying?” by choosing 1 = Anger, 2 = Sadness, 3 = Happiness, 4 = Anxiety, or 5 =
Confusion.
Accuracy for each test taker was the average of their emotion categorization accuracy
across all 47 clips (0= does not correctly identify the emotion, 1= correctly identifies the
emotion). 3 This is an amalgamation of the question 1 and question 2. Participants who answered
question 1, “not at all” were scored as incorrect when the clip was depicting anger, sadness,
happiness, anxiety, or confusion. Participants were scored as incorrect for the neutral clips if they
answered “yes, weakly” or “yes, strongly” to question 1 and as correct for if they answered “not
at all.” Participants were scored as correct for all other clips if they answered question 1 as either
“yes, weakly” or “yes, strongly” and selected the correct emotion in question 2.

70
Additional outcome measures. All participants completed three nonverbal cue recognition
tests, the DANVA2-AF, the DANVA2-AV, and the Face Recognition Test. These tests were
described in Chapter 2.
Participants completed self-report measures on the computer. The Emotional Sensitivity
scale from the Social Skills Inventory (SSI-ES) (Riggio, 1986; Riggio & Riggio, 2001) is a 15-
item scale which measures one‟s belief that one can detect and decode nonverbal emotional
messages from others and the trait of being attentive to emotional cues (Appendix E). The scale
includes items such as, “It is nearly impossible for people to hide their true feelings from me—I
seem to always know” and “I can spend hours just watching other people.” Participants respond
on a 9-point scale from 1 = Not at all true of me to 9 = Very true of me and their responses are
averaged across the 15 items. This scale was included to determine whether the training
conditions influenced perceived ability, as well as whether perceived ability was related to actual
ability measured by the PECT.
Self-reported mood and feelings of power were measured by asking participants, "Please
rate how you are feeling right now on the following items," from 1 = Not at all to 9 = very. The
twelve items were: awkward, nervous, angry, powerless, happy, relaxed, uncomfortable, tense,
powerful, dominant, strong, and cheerful (Schmid Mast, Jonas, & Hall, 2009; Appendix F). The
order of presentation was randomized by the computer for each participant. The mood items
were included to assess whether feeling states differed between training conditions and, if so, if
these differences could explain any differences in effectiveness between conditions. In addition,
participants completed seven additional items, presented in a randomized order, which included
assessments of their motivation, confidence, and enjoyment of the tasks they had just completed
(Appendix G). The self-reports of reactions to the training were included as an attempt to

71
understand participants‟ reactions to the training and differences in these reactions across
conditions. Not only are they indicators of acceptability of the training for application in medical
school, but like the mood measures, these reactions may also provide preliminary evidence for
mechanisms of training effectiveness that could be explored in future research. The relationship
between these self-reported items and PECT performance was also assessed on the total sample,
but we did not expect these items would predict performance.
Participants also provided basic demographic information including age, gender,
ethnicity, and major (Appendix H). Future plans for medical school were assessed through one
item, “Are you considering medical school at any point in the future” (1 = Definitely no, 2 =
Probably no, 3 = Unsure, 4 = Probably yes, 5 = Definitely yes). For some analyses, participants
who were unsure were removed from the analyses and this variable was dichotomized into
participants who were considering medical school (probably yes and definitely yes) and
participants who were not (probably no and definitely no). Because the training was designed for
eventual use with medical students, it was important to assess differences in the training for those
students who reported a strong desire to attend medical school in the future as opposed to those
who did not. If the training was less effective for students who were considering medical school,
this might suggest that medical students would not react well to the training.
Procedure
The experiment was run in a laboratory at Northeastern University. Participants were run
individually by trained research assistants who were blind to the goal of the study. Participants
entered the lab and were consented to participate. Next each participant was handed a clipboard
that contained the role induction and were asked to follow along as the experimenter read the
role induction to the participant. Participants were then randomly assigned to one of the six

72
conditions and received or did not receive the training component(s) as previously described.
Next, participants completed the PECT, followed by the DANVA faces, DANVA voices, and
Face Recognition test, in that order. After these tests, participants completed the online
questionnaires: the SSI-ES, mood items, reactions to training, and demographic questions, in that
order. Participants were reminded before answering these items to answer as honestly as
possible; a participant number was entered as the only identifier. Lastly, participants were
debriefed and given credit for participation.
The entire experiment was designed to fit within an hour session. Each of the components
took approximately ten minutes to complete. As a result, the entire session for participants in the
Comprehensive condition took approximately 60 minutes. The participants in the Control
condition took approximately 30 minutes and participants in the remaining conditions took
approximately 40 minutes.
All study materials and procedures were approved by the Institutional Review Board at
Northeastern University.
Analysis Plan
The main analysis of training effectiveness was a one-way ANOVA with six levels of the
independent variable to examine the impact of the different training conditions on PECT
performance. In addition, Dunnett‟s post hoc analyses compared each training condition to the
control (Dunnett, 1955). Two-way ANOVAs were used to test whether the effect of training
condition on PECT score differed as a function of participant gender or consideration of medical
school in the future. Additional one-ways ANOVAs examined differences between training
conditions on the PECT-Practice, DANVA tests, Face Recognition, self-reported mood, and
reactions to training. Fisher‟s Least Significant Difference (LSD) post hoc tests examined

73
pairwise differences between the individual conditions on all these outcome variables. The
associations between PECT performance and the PECT-Practice, DANVA tests, Face
Recognition, self-reported mood, and reactions to training were assessed through Pearson
correlation coefficients (r).
Results
Descriptive Statistics
Across all participants, scores on the PECT were normally distributed and ranged from
.47 to .89 with an overall mean of .70 and standard deviation of .08. Descriptive statistics in the
entire sample for all outcome variables are located in Table 10.
The correlations between PECT scores and the DANVA2-AF (r = .13, p < .10, see Table
11), DANVA2-AV (r = .21, p < .01), and Face Recognition (r = -.05, ns) mirror results from the
PECT development studies described in Chapter 2. Again, the PECT was correlated with
performance on the DANVA tests of emotion recognition, a different approach to testing a
similar construct as the PECT, but was not correlated with a test of memory for faces, a construct
not measured in the PECT.
As predicted, participants‟ self-reported mood and reaction measures did not
significantly correlate with PECT score (see Table 11 for the correlations between the PECT and
the self-report measures). Like other studies of person perception, participants‟ self-reported
confidence in their abilities (DePaulo et al., 1997) and self-reported motivation (Hall et al., 2008)
were not associated with emotion recognition accuracy as measured by the PECT.
Effect of Training Condition on the PECT
The main analysis, a one-way ANOVA of condition on emotion recognition accuracy,
revealed a significant omnibus effect of training condition on PECT score (F(5,197) = 8.44, p <

74
.001). For a graph of the mean PECT score in each condition, see Figure 3. Dunnett t-tests
comparing each condition to the Control revealed significantly better performance in the
Comprehensive condition (p < .001), the Practice with Feedback condition (p < .001), and the
Practice Alone condition (p < .05), as compared to the Control condition. The Instruction and
Consciousness-Raising conditions did not significantly differ from the untrained controls. The
effect size (r) for the comparison between the Comprehensive condition and untrained Control
condition was r = .43. Fisher‟s LSD post hoc comparisons revealed that participants in the
Comprehensive condition had significantly higher PECT accuracy scores than participants in the
Practice Alone (p = .05), Instruction (p < .001), and Consciousness-Raising (p < .001)
conditions. The Practice Alone condition had significantly higher PECT accuracy than the
Consciousness-Raising condition (p < .01), and marginally higher PECT accuracy than the
Instruction condition (p = .10). Participants in the Practice with Feedback condition had
significantly higher PECT scores than participants in the Instruction condition (p = .01) and the
Consciousness-Raising condition (p < .001), and marginally higher scores than those in the
Practice Alone condition (p < .10). The Consciousness-Raising and Instruction conditions did
not differ from each other, nor did the Practice with Feedback and Comprehensive conditions
differ from each other.
A 6X2 ANOVA of training condition and the dichotomized considering medical school
variable did not show a main effect of considering medical school or an interaction of
considering medical school and training condition on PECT performance (F(5, 160 = 1.04, p =
.40). Thus the training conditions were not differentially effective for those students considering
medical school compared to those who participants who were not.

75
A 6X2 ANOVA of training condition and participant gender on PECT performance did
not show a significant main effect of gender or an interaction of gender and training condition
(F(5,191) = .44, p = .82). Males and females performed equally well on the PECT, replicating
results from the PECT piloting. Thus the training conditions affected males and females equally.
Effect of Training Condition on the PECT-Practice
In the Comprehensive, Practice Alone, and Practice with Feedback conditions,
participants took the PECT-Practice as part of the training (N = 99). In the Comprehensive
condition, participants viewed the consciousness-raising DVD and instruction DVD before
taking the PECT-Practice with feedback. In the Practice Alone condition, the participants
completed the PECT-Practice without feedback and without the other components. In the
Practice with Feedback condition, the participants completed the PECT-Practice with feedback
after each item, as in the Comprehensive condition, but these participants did not see the
consciousness-raising or instruction DVD. Scores on the PECT-Practice in these conditions can
be compared as another examination of the effect of training. There was a significant effect of
condition on PECT-Practice score (F(2,96) = 4.70, p = .01) across these three conditions. LSD
post hoc analysis revealed that participants in the Comprehensive condition did significantly
better on the PECT-Practice (M = .73, SD = .08) than participants in the Practice Alone condition
(M = .66, SD = .09, p = .003) and the Practice with Feedback condition (M = .68, SD = .09, p =
.05). The Practice with Feedback condition did have slightly, although not significantly, higher
PECT-Practice scores than the Practice Alone condition. Because participants in the Practice
Alone condition did not receive performance feedback as they were completing the PECT-
Practice, the difference in means between the Practice with Feedback and Practice Alone
conditions can be explained by the presence of feedback as the PECT-Practice was being

76
completed. However, the comparison between the Comprehensive condition and Practice with
Feedback condition is especially interesting. Recall that the only difference between these two
conditions was that before taking the PECT-Practice, participants in the Comprehensive
condition had watched both the consciousness-raising and instructional videos. Participants
taking the PECT-Practice in the Practice with Feedback condition had not seen either of these
videos. The significant difference between these two conditions on PECT-Practice can be
attributed to the presence of the consciousness-raising plus instruction videos in the
Comprehensive condition. These results suggest that consciousness-raising and instruction
combined may have some distinct positive contribution to improving performance. However, it
must be acknowledged that neither the Instruction condition nor the Consciousness-Raising
condition was significantly different from the Control condition in the main analysis with PECT
score as the outcome variable. In addition in the main analysis, the Comprehensive condition,
which included both the consciousness-raising and instruction videos, was not significantly
different from the Practice with Feedback, which did not contain either of these.
Effect of Training Condition on Change in Performance
Change in emotion recognition accuracy was assessed by a repeated measures analysis
with condition (Comprehensive, Practice with Feedback, or Practice Alone) as the between-
subjects variable and change in performance from the PECT-Practice to the PECT as the within-
subjects variable. Results are presented in Figure 4. Not surprisingly, pooling all three conditions
there was a significant improvement in performance from the PECT-Practice to the PECT, as
indicated by a significant within-subjects main effect (F(1, 96) = 22.91, p < .001). There was the
expected main effect of training condition (F(2, 96) = 5.21, p < .01), with participants in the
Comprehensive condition showing higher scores than the participants in the Practice Alone or

77
Practice with Feedback conditions. The interaction between change in performance from PECT-
Practice to PECT and training condition was not significant (F(2, 96) = 1.49, p = .23). However,
looking at the pattern of means, participants in the Comprehensive condition had higher scores
on the PECT-Practice than participants in the Practice Alone and Practice with Feedback
conditions, a result described earlier, and showed a smaller increase from PECT-Practice to
PECT than participants in Practice Alone and Practice with Feedback conditions.
The main effect showed that participants did better on the PECT than they did on the
PECT-Practice. This improvement is not simply due to the PECT-Practice being an easier test
than the PECT. In piloting described in Footnote 2, average score on the PECT-Practice was
equivalent to the PECT. This repeated measures analysis corroborates the findings from the main
analysis that the Comprehensive, Practice with Feedback, and Practice Alone conditions had
improved emotion recognition accuracy as a result of training. These groups demonstrated better
performance on the PECT as a result of training compared to those conditions where participants
did not take the PECT-Practice first and significant overall improvement in emotion recognition
accuracy before and after training.
Effect of Training Condition on Tests of Decoding Nonverbal Cues
The Comprehensive training significantly improved performance on the PECT. An
important question was whether it also improved performance on other nonverbal judgment
tasks. One-way ANOVAs were conducted to examine the impact of training condition on the
other tests (Table 10). There was no significant difference between training conditions on the
DANVA2-AF (p = .92), DANVA2-AV (p = .53) or the Face Recognition Test (p = .19). The
equivalence between conditions remained when comparing just the Comprehensive condition to
Control condition; there was no difference between trained and untrained participants (all F <

78
.33), suggesting that the impact of training did not extend to these other person perception tasks.
Effect of Training Condition on Mood and Reactions to Training
Using a series of one-way ANOVAs to examine differences in self-reported mood and
reactions to training, significant differences were found between conditions on self-reported
powerlessness (F(5, 188) = 2.92, p = .02), nervousness (F(5, 187) = 3.09, p = .01), ease of doing
the tasks (F(5, 196) = 2.74, p = .02), and the SSI emotional sensitivity subscale (F(5, 197) =
2.81, p = .02, see Table 10 for means and standard deviations in all conditions). There were
marginal differences between conditions on self-reported learning (“I learned something about
recognizing emotions today,” F(5,197) = 2.07, p = .07) and motivation (“I wanted to do well on
the tasks today,” F(5, 196) = 1.88, p = .10).
Fisher‟s LSD post hoc analyses were used to assess pairwise differences for these
significant and marginally significant omnibus tests. Participants in the Comprehensive and
Practice with Feedback conditions reported learning significantly more about recognizing
emotions (Comprehensive: M = 3.97, SD = .83, and Practice with Feedback: M = 3.97, SD = .95)
as compared to the Consciousness-Raising (M = 3.56, SD = .94) and Control conditions (M =
3.52, SD = .80). Participants received feedback during the practice test in only the Practice with
Feedback and the Comprehensive conditions. Participants reported the tasks were significantly
less easy when they were in these conditions receiving feedback (Comprehensive: M = 3.18, SD
= .94, and Practice with Feedback: M = 3.21, SD = 1.05), than in the Instruction (M = 3.76, SD =
1.08) and Practice Alone (M = 3.81, SD = .69) conditions. Interestingly, although considered a
trait measure, the SSI-ES was significantly affected by training condition. Participants self-
reported less emotional sensitivity in the Practice with Feedback condition (M = 4.82, SD = 1.18)
than in all the other conditions, especially the Practice Alone condition (M = 5.70, SD = .81).

79
Taken together these results suggest that providing feedback caused participants to question their
own trait abilities and view the person perception tasks as more challenging. Interestingly, the
groups with feedback in reality did significantly better than the other groups; these perceptions of
inadequacy were incorrect.
Feelings of powerlessness and nervousness were higher in the groups with the lowest
PECT performance, the Consciousness-Raising and Control conditions. Participants reported
feeling significantly more powerless in the Consciousness-Raising condition (M = 3.60, SD =
2.15) than in the Instruction condition (M = 1.94, SD = 1.29) and Practice Alone condition (M =
2.36, SD = 1.77) and marginally more powerless than in the Comprehensive condition (M = 2.81,
SD = 2.20) and Control condition (M = 2.77, SD = 1.52).
Participants also reported feeling significantly more nervous in Consciousness-Raising
condition (M = 3.57, SD = 2.56) than in the Instruction (M = 2.09, SD = 1.57), Practice Alone (M
= 2.48, SD = 1.82), Practice with Feedback (M = 2.50, SD = 1.88), and Comprehensive
conditions (M = 2.20, SD = 1.30). Telling participants that emotion recognition is an important
skill, in the absence of information, made them more uneasy. Participants in the Control
condition (M = 3.32, SD = 2.39) reported feeling significantly more nervous than in the
Comprehensive and Instruction conditions and marginally more nervous than in the Practice with
Feedback condition. These participants had to take the battery of person perception tests, starting
with the PECT, shortly after entering the laboratory, without additional information. However,
feelings of nervousness and powerlessness did not account for the poor performance. Although
participants in the Consciousness-Raising and Control conditions had the poorest performance
on the PECT, overall and within these individual conditions, feelings of nervousness and

80
powerlessness were not correlated with PECT performance, meaning that these feelings did not
directly mediate PECT performance.
The presence of instruction may act to assuage feelings of nervousness and
powerlessness. Participants in the Instruction condition reported significantly less feelings of
powerlessness than in the Consciousness-Raising and Practice with Feedback condition, and
marginally less powerlessness than in the Comprehensive and Control conditions. Participants in
the Instruction condition also reported feeling significantly less nervous than participants in the
Consciousness-Raising and Control conditions. Participants in the Instruction condition reported
learning significantly more (M = 3.79, SD = .59) as compared to the Consciousness-Raising (M =
3.56, SD = .94) and Control (M = 3.52, SD = .80) conditions, suggesting that they recognized the
contents of the instructional video as informative and a teaching tool. However, PECT
performance was not significantly better in the Instruction condition than in the other conditions.
Again, overall and within conditions the amount participants reported learning was not correlated
with PECT performance.
Participants reported being significantly less motivated in the Comprehensive condition
(M = 3.88, SD = 1.02) than in all the other conditions (M = 4.32, SD = .77). The Comprehensive
condition lasted longer than the other conditions and these mood and reaction measures were the
last task at the end of the one-hour experimental session. Therefore, their lower self-reported
motivation may be a reflection of the participants‟ desire to leave the experiment.
Discussion
As predicted, the comprehensive, multi-component training significantly improved
emotion recognition accuracy as compared to untrained controls. Practice with Feedback
emerged as the most effective training components. The Practice with Feedback condition and

81
Comprehensive condition showed the greatest emotion recognition accuracy, compared to the
Control condition, and did not significantly differ from eachother. Practice Alone also showed
significantly more accurate emotion recognition than controls, but the effect of Practice Alone
was smaller than for the conditions that also included feedback. No training components caused
a significant decrease in performance.
Follow-up self-reports of mood and reactions to the training were also compared between
conditions. Raising participants‟ awareness about the importance of emotion recognition as a
skill, in the Consciousness-Raising condition, increased feelings of nervousness and
powerlessness. Giving instructional information to participants lessened feelings of nervousness
and powerlessness. Participants given performance feedback showed decreased confidence in
their trait abilities, although they felt they had learned more about emotion recognition than
participants in the other conditions. Neither self-reported confidence nor learning was
significantly related to emotion recognition accuracy, as indicated by a nonsignificant correlation
between PECT score and both self-reporting finding the tasks to be easy and learning a lot about
emotion recognition during the tasks. This was true when the correlation was assessed in the
entire sample and separately within each of the conditions.
Consciousness-Raising in the absence of other training approaches was not sufficient to
increase emotion recognition. This condition had the poorest PECT performance, even slightly,
although not significantly, lower than the Control condition; however, participants in this
condition also reported higher levels of nervousness and powerlessness. Telling participants,
“This is important!” without any information or feedback made them nervous. Although self-
reports of felt nervousness were not correlated with performance, perhaps this increased

82
nervousness was associated with another outcome that caused the poorer performance in this
group than other training conditions.
Interestingly, according to self-reports, feedback caused participants to find the tasks
harder and gave them a sense they were poor emotion identifiers. Again, it is important to note
that none of the self-report measures dealing with confidence correlated with actual performance,
across conditions or within any of the conditions. These results mirror a meta-analysis by
DePaulo and colleagues, which found no relation between measured deception detection
accuracy and self-reported confidence in deception detection ability (DePaulo et al., 1997) and a
meta-analysis in the healthcare context, which indicated that medical students‟ self-assessment of
performance is often inaccurate, especially for self-assessment of communication skills (Blanch-
Hartigan, 2010).
In a study by Vrij and colleagues in the domain of deception detection, participants in an
instruction plus feedback condition were significantly more confident about their deception
detection ability than participants in an instruction only, or no instruction condition (Vrij, 1994).
Like the present study, self-reported confidence and objectively measured accuracy were not
correlated. However, it is interesting that the presence of feedback improved confidence in the
Vrij study and not in the present study. One possibility is that there are differences in a priori
confidence between the domains of deception detection and emotion recognition accuracy.
Participants may have started out with a lower expectation about their ability to accurate detect
deception than in their ability to accurately recognize emotions. Deception detection is not a
domain where people typically receive feedback about their accuracy. Confidence in ability for
deception detection would increase if participants went into the task thinking they would perform
more poorly than they did. Participants may have assumed that in the domain of emotion

83
recognition, they were more skilled. Self-reports are not an adequate tool to assess the impact of
person perception training. Since confidence is not associated with performance in this
experiment and across the literature, the effectiveness of a training intervention should not be
judged on whether participants demonstrate increases or decreases in confidence after training.
For this reason, accuracy assessed without objective criteria was not included in the meta-
analysis in Section 1 of this dissertation and was not used as a primary assessment of the training
intervention in Section 2.
Participants in the Practice with Feedback and Comprehensive condition believed that
they were less skilled in emotion recognition despite increased PECT performance. It is possible
to forewarn participants receiving feedback that although they may feel as if they‟re doing
poorly, they may in fact be improving. This may alleviate feelings of incompetence or
uncertainty with performance. However, forewarning participants might serve to eliminate the
effectiveness of feedback in these conditions. Perhaps the feedback forced participants to
recognize their own inadequacies in a skill they believed to be obvious or easy and, therefore,
they were more attentive during the PECT-Practice or during the PECT assessment. More
research is needed to understand this complicated pattern.
In the present experiment, giving participants feedback about the correct answer to each
practice test stimulus increased performance on the assessment test. Another question for future
research is whether overall performance feedback on a practice test would be as effective as the
item-specific feedback given in this training. For example, participants could be told after
completing the PECT-Practice their overall score and/or how their score compared to other
participants. This manipulation could help answer whether feedback works by lowering self-
confidence and increasing attention or whether the participant is learning emotion recognition

84
skills. If getting feedback after the whole practice test increases PECT performance, it would
suggest that increased attention or motivation is driving the increase in subsequent emotion
recognition accuracy, because general performance feedback in would not teach the participants
where the mistakes were or how to improve them. In the person perception meta-analysis in
Section 1, feedback was equally as effective whether it was general or specific to each practice
item. However, this is still worth exploring in the emotion recognition domain.
It is unlikely that recognizing poor performance through feedback caused participants to
more effectively apply the instructions and consciousness-raising information they received in
the training, as these components preceded the Practice with Feedback component in the
Comprehensive condition. In the future, researchers could test whether practice with feedback
followed by instruction yields even larger effects of training. Additional research should explore
the most effective order for presentation of the training components in the Comprehensive
condition by systematically varying the order in which the components are presented.
Also, in the present experiment, it was up to the participant to compare their answer to
the correct answer during the PECT-Practice with feedback. The computer simply displayed the
correct answer after each clip. Although participants were given time and encouraged to compare
their answers, it is possible that not every participant did this, or did this for each clip. Perhaps
the effect of feedback would be even larger if the comparison between the participants‟ answer
and the correct answer was read aloud or explicitly stated after each practice clip, potentially
increasing participants‟ attention to the correctness or incorrectness of their answers.
The training intervention did not significantly impact performance on the Face
Recognition test. The PECT is different from the Face Recognition test, which tests participants‟
ability to remember recently seen faces. The training was not developed to address facial

85
recognition and did not cause increased accuracy at this skill. This is not surprising. In a study of
schizophrenic patients, feedback and practice in mimicking emotional expressions led to
improvements in labeling of others‟ emotions, but did not generalize to a task where patients
discriminated between emotional faces (Penn & Combs, 2000). If the multi-component training
approach had enhanced performance on this memory task, it would call into question whether the
training was simply increasing attention to the assessment stimuli and was not specifically about
training emotion recognition ability.
Interestingly, the training components, including practice with feedback, did not
significantly improve performance on the other assessments of emotion recognition included in
this experiment, the DANVA tests for identifying emotions in faces and voices. The most likely
explanation for the lack of a training effect is that these tests are in a different format than the
PECT. In the meta-analysis in Section 1, whether the assessment stimuli were included in the
training was a significant moderator of training effectiveness. Training was not effective when
the outcome was assessed using different stimuli from the training. Training was most effective
when the stimuli were the same or similar. The DANVA stimuli are different from the PECT
stimuli and the focus of the training components in channel, verbal and nonverbal content, and
clinical relevance. There is evidence from the previous literature and the meta-analysis in Section
1 that all of these factors could potentially contribute to the lack of this training‟s effectiveness
on the DANVA tests.
The stimuli in the DANVA tests were from one channel (photographs of faces only on
the DANVA2-AF and content-masked, audio only cues on the DANVA2-AV). A study of
emotion recognition in patients with traumatic brain injury found that training in one channel
(the face) did not generalize to emotion recognition in another channel (the voice; Radice-

86
Neumann et al., 2009). Also, their training, which used photographs to train emotion recognition
in faces, did not generalize to an assessment that tested emotion recognition in multi-channel
video presentations. In a study by Golan and Baron-Cohen (2006), adults with Asperger
syndrome or high-functioning autism significantly improved the recognition of emotions in
photographs of faces after a training program with photographs as instructional stimuli, but
again, this improvement did not generalize to emotion recognition on video stimuli. Another
study by these authors suggested that training with video stimuli might generalize to assessments
including other video stimuli. They found that training emotion recognition using video stimuli
of emotional faces on animated vehicles did generalize to increased emotion recognition
accuracy on video stimuli of humans demonstrating emotional faces (Golan et al., 2010). Taken
together, these studies suggest that training on single-channel stimuli does not necessarily
generalize to judgments of multi-channel stimuli, and vice versa, but that training on multi-
channel stimuli may generalize to similar multi-channel stimuli. Also, there is some suggestion
in the research that channels that include the body may be most amenable to training (Rosenthal
et al., 1979, p. 340). Unlike the PECT, neither DANVA test contained information from the
body. The DANVA tests may be less amenable to any kind of training, including this one,
because it does not include this channel. Future research could compare participants given the
Comprehensive training condition to untrained participants using the multi-channel Interpersonal
Perception Task (IPT; Costanzo & Archer, 1989), although it is not an emotion recognition test.
Unfortunately, there is no multi-channel test of emotion recognition that is similar to the PECT
on which to test training generalizability.
In addition to the channel differences, the PECT stimuli included both verbal and
nonverbal content; the DANVA tests did not. In this experiment, the Instruction component

87
specifically addressed how cues to emotion recognition are found in both the verbal and
nonverbal content of the stimuli. The item-specific feedback also addressed the verbal and
nonverbal information that went into forming a correct judgment of the stimuli. Because the
DANVA tests only contain nonverbal information, they may require different judgment policies
than the PECT clips. Therefore, they may be less amenable to a training program, such as this
one, which focuses on making complex judgments integrating both verbal and nonverbal
emotion cue information.
An additional explanation for the lack of generalization to the DANVA tests is that these
outcomes lacked a clinically relevant focus. The DANVA stimuli were not patients. Participants
were aware that the PECT target was a patient and the items within the PECT were clinical in
nature. The PECT may have made more sense to the participant as an assessment tool, because
the training included information and awareness specifically about patient emotion cues.
From a clinical perspective, the lack of generalizability to the DANVA tests is not
entirely discouraging. Improved performance on the PECT, a naturalistic test of emotion
recognition with one target, is akin to a provider seeing one patient and improving the ability to
recognize her emotions after training. Perhaps practice with feedback increased the ability to
recognize the emotions of this particular target, or patient. Target-specific improvements and
generalized improvements in emotion recognition may actually be distinct skills. This training
demonstrated target-specific improvements. In a clinical setting, this is akin to a provider using
feedback about a particular patient‟s emotions to improve their ability to recognize that
particular patient‟s emotions in a future visit. However, feedback about that particular patient
may not improve the provider‟s ability to recognize the emotions of other patients, thus not

88
improving emotion recognition in general. Further testing is needed to understand whether the
current training demonstrated generalized improvements.
It would not be practical to have entire training sessions dedicated to the emotion
recognition of a single patient. However, the results of this training intervention imply that if a
provider were to get feedback about a patient‟s emotions, the provider might be more accurate in
recognizing that patient‟s subsequent emotion cues. Unfortunately, providers typically do not
know if the emotions they recognize in their patients were accurate or inaccurate. If all patients
presented emotion cues to their provider, and then followed the emotion cues with explanations
of what they were feeling, the providers could assess their accuracy and increase their emotion
recognition ability. Of course, emotion recognition is not this simplistic in real patient-provider
interactions. Providers may be distracted and fail to attend to not only the emotion cue, but the
subsequent feedback about that cue. Providers may not provide the space in a communication
interaction for patients to follow-up on their emotions in this way (Maguire et al., 1996;
Zimmermann et al., 2007). Patients may not be able to give feedback; they may not be fully
aware when they are experiencing emotions or displaying these emotions to their providers (Hall,
Murphy, & Schmid Mast, 2007) or may not want to disclose their emotions to the provider
(Floyd et al., 2005).
Unfortunately, in the present experiment, there is no way of assessing whether
improvements in PECT performance as a result of training would correspond to subsequent
improvements in clinical interactions. As was shown in the meta-analysis in Section 1 of this
dissertation, almost no training study has addressed this important issue. Future research should
test the limits of training generalization by including clinical outcome measures, such as patient
satisfaction or analysis of communication patterns using tools like the Roter Interaction Analysis

89
System (Roter & Larson, 2002) to explore changes in clinical outcomes potentially improved by
emotion recognition training.
In addition to understanding how training effects generalize, future research should
examine how long the training effects last. Because all participants completed the PECT as the
first outcome measure after training, no time had elapsed between the training components and
the primary outcome measure. The fact that the DANVA tests did not show training
improvements could be due to the fact that these occurred after the PECT and more time had
elapsed. The effects of training may have dissipated. Although not much has been done to
examine the longevity of training effects, there is some suggestion that training effects continue
at follow-ups that are one week (Penn & Combs, 2000; Russell et al., 2008), two weeks (Radice-
Neumann et al., 2009), and even six weeks (Beaumont & Sofronoff, 2008) post-training. It
should be noted, however, that these results were not in nonclinical adult populations, but in
children and adults with clinical deficits in emotion recognition.
The results of this training experiment indicated that the effects of feedback were more
than just acclimation to the testing procedures, response format, and test stimuli. The Practice
Alone condition showed significant improvements over Control, these participants could become
accustomed to the instructions and the format of the test. However, if this was the primary
mechanism behind training effectiveness, then the Practice Alone condition would have had
improvements at the same level as the Practice with Feedback condition. The PECT scores in the
Practice with Feedback condition were marginally higher than the scores in the Practice Alone
condition, which implies that feedback had a training effect above simply acclimating
participants to the testing procedures. The Practice Alone condition also involved more than just
acclimating to the test because participants were making emotion recognition judgments. A

90
separate condition where participants were shown the stimuli, instructions, and scoring sheet, but
were not asked to make any judgments would help to tease apart the unique effect of acclimating
to the testing procedure.
The length of each condition varied in the present training experiment. Each of the
components took approximately ten minutes to complete. As a result, the Comprehensive
condition lasted longer than conditions with only one component, which lasted longer than the
Control condition. Because the training conditions varied in length, it is possible that there were
attentional or motivational differences between the training conditions that have nothing to do
with the training itself. However, stretching out each component to fill the same amount of time
as the Comprehensive condition would potentially result in increased potency of that component
and would not allow for a direct comparison of that component to Control. For example, 30
minutes of practice might not have the same effect as 10 minutes of practice. The meta-analysis
showed that increased length of training did not necessarily translate into increased training
effectiveness. However, what is unanswered here and in the meta-analysis is whether
lengthening training could lead to greater longevity or generalizablity of training effects.
From a practical perspective, a strength of this training is its relatively short length. The
average length of training in the meta-analysis was approximately six hours. The current training
was effective in approximately 30 minutes. The training was designed to be integrated into
medical school or continuing medical education as a module in a communication/interviewing
course. This is possible because it is relatively short, has excellent face validity, and does not
require an expert to administer. The results of this experiment also suggest that training
interventions and assessment measures for healthcare providers should include multi-channel
feedback and instruction, because this is most akin to the patient-provider interaction. Providers

91
would typically need to recognize patient emotions from multiple channels in a face-to-face, live
interaction. Therefore, training programs designed for healthcare providers should incorporate a
multi-channel approach.
The present experiment was not conducted with a clinical sample, but with undergraduate
college students. It is easy to assume that healthcare providers or those in medical education
would respond differently to the training, that they would be more attentive or motivated and
therefore respond differently to training. However, this should not be a predetermined
assumption. In this study, undergraduate students who reported they were “probably” or
“definitely” considering medical school did not respond differently to training than those
students who were not considering medical school in the future. It is unlikely this sample of
potential medical students was exceptionally unlike a future sample of first or second year
medical students in a communication course, the very students for whom this training was
designed. This piloting with undergraduate students was an important first step in validating the
training. Because of the numerous demands and time constraints for medical students and other
healthcare providers, it was important to assess the efficacy of training before it was tested with a
clinical population.
The Comprehensive condition was effective and Practice with Feedback emerged as the
most effective training approach, although there was some evidence that each component of the
multi-component intervention had some effect on emotion recognition accuracy, either on its
own or in combination with other components. However, the mechanisms for the improved
emotion recognition accuracy are still unclear. Significant conditional differences in self-reports
of mood and reactions to training did not mediate accuracy improvements. It may be that each
component worked through a different mechanism (e.g., Consciousness-Raising increased
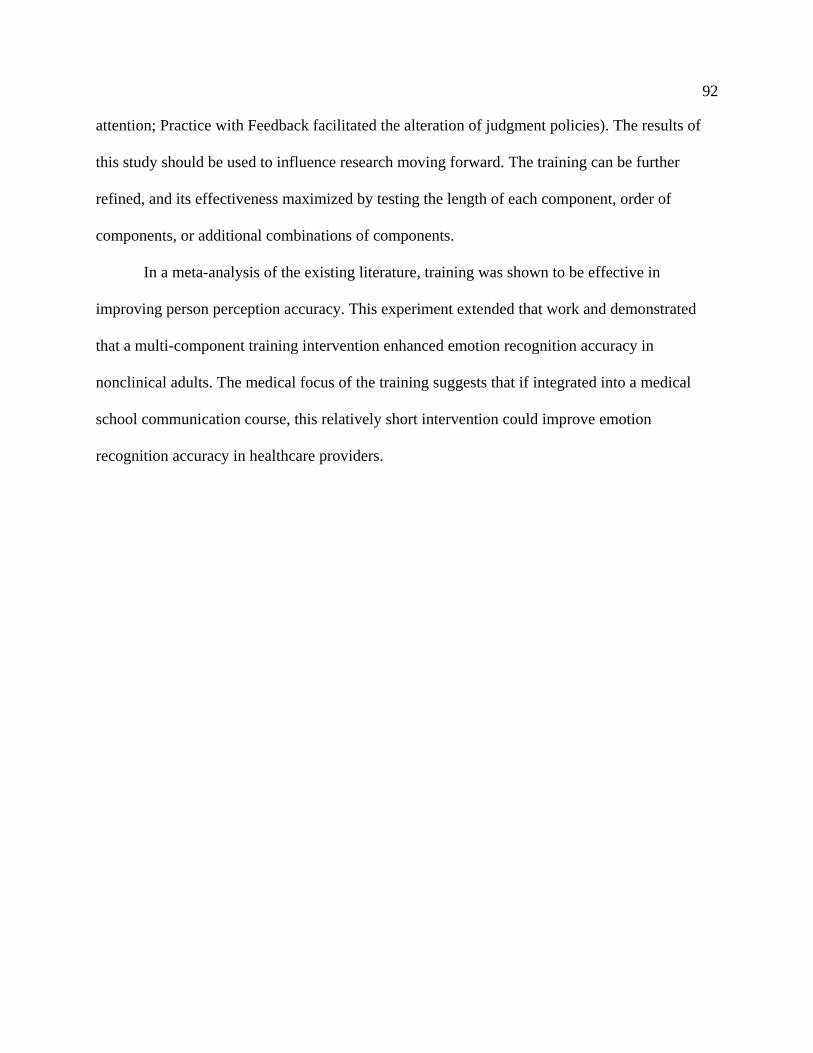
92
attention; Practice with Feedback facilitated the alteration of judgment policies). The results of
this study should be used to influence research moving forward. The training can be further
refined, and its effectiveness maximized by testing the length of each component, order of
components, or additional combinations of components.
In a meta-analysis of the existing literature, training was shown to be effective in
improving person perception accuracy. This experiment extended that work and demonstrated
that a multi-component training intervention enhanced emotion recognition accuracy in
nonclinical adults. The medical focus of the training suggests that if integrated into a medical
school communication course, this relatively short intervention could improve emotion
recognition accuracy in healthcare providers.

93
References
Akehurst, L., Kohnken, G. N., Vrij, A., & Bull, R. (1996). Lay persons' and police officers'
beliefs regarding deceptive behaviour. Applied Cognitive Psychology, 10(6), 461-471.
Alexander, S. C., Keitz, S. A., Sloane, R., & Tulsky, J. A. (2006). A controlled trial of a short
course to improve residents' communication with patients at the end of life. Academic
Medicine, 81(11), 1008-1012.
Allport, F. H. (1924). Social Psychology. Cambridge, MA: Riverside Press.
Ambady, N., & Gray, H. M. (2002). On being sad and mistaken: mood effects on the accuracy of
thin-slice judgments. Journal of Personality and Social Psychology, 83(4), 947-961.
Ambady, N., Hallahan, M., & Conner, B. (1999). Accuracy of judgments of sexual orientation
from thin slices of behavior. Journal of Personality and Social Psychology, 77(3), 538-
547.
Ambady, N., & Rosenthal, R. (1992). Thin slices of expressive behavior as predictors of
interpersonal consequences: A meta-analysis. Psychological Bulletin, 111(2), 256-274.
Argyle, M., Bryant, B., & Trower, P. (1974). Social skills training and psychotherapy: A
comparative study. Psychological Medicine: A Journal of Research in Psychiatry and the
Allied Sciences, 4(4), 435-443.
Bolte, S., Feineis-Matthews, S., Leber, S., Dierks, T., Hubl, D., & Poustka, F. (2002). The
development and evaluation of a computer-based program to test and to teach the
recognition of facial affect. International Journal Of Circumpolar Health, 61 Suppl 2,
61-68.

94
Barone, D. F., Hutchings, P. S., Kimmel, H. J., Traub, H. L., Cooper, J. T., & Marshall, C. M.
(2005). Increasing empathic accuracy through practice and feedback in a clinical
interviewing course. Journal of Social and Clinical Psychology, 24(2), 156-171.
Bauminger, N. (2007). Brief report: Individual social-multi-modal intervention for HFASD.
Journal of Autism and Developmental Disorders, 37(8), 1593-1604.
Beach, M. C., & Inui, T. (2006). Relationship-centered care. A constructive reframing. Journal
of General Internal Medicine, 21 Suppl 1, S3-8.
Beach, W. A., Easter, D. W., Good, J. S., & Pigeron, E. (2005). Disclosing and responding to
cancer "fears" during oncology interviews. Social Science and Medicine, 60(4), 893-910.
Beaumont, R., & Sofronoff, K. (2008). 'A multi-component social skills intervention for children
with Asperger syndrome: The Junior Detective Training Program': Errata. Journal of
Child Psychology and Psychiatry, 49(8).
Bernieri, F. J., Gillis, J. S., Davis, J. M., & Grahe, J. E. (1996). Dyad rapport and the accuracy of
its judgment across situations: A lens model analysis. Journal Of Personality And Social
Psychology, 71(1), 110-129.
Bernieri, F. J., & Gillis, J. S. (2001). Judging rapport: Employing Brunswik's lens model to study
interpersonal sensitivity. In J. A. Hall & F. J. Bernieri. (Eds.), Interpersonal Sensitivity:
Theory and Measurement (pp. 67-88). Mahwah, NJ: Lawrence Erlbaum Associates.
Blanch-Hartigan, D. (2011). Medical students' self-assessment of performance: Results from
three meta-analyses. Patient Education and Counseling, in press.
Blanch-Hartigan, D. (2011). Measuring providers' verbal and nonverbal emotion recognition
ability: Reliability and validity of the Patient Emotion Cue Test (PECT). Patient
Education and Counseling, 82(3), 370-376.

95
Blue, A. V., Chessman, A. W., Gilbert, G. E., & Mainous, A. G., 3rd (2000). Responding to
patients' emotions: important for standardized patient satisfaction. Family Medicine,
32(5), 326-330.
Borman, W. C. (1975). Effects of instructions to avoid halo error on reliability and validity of
performance evaluation ratings. Journal of Applied Psychology, 60(5), 556-560.
Bornstein, M., Hedges, L., Higgins, J., & Rothstein, H. (2005). Comprehensive meta-analysis,
2nd edition. Englewood, NJ: Biostat.
Boyatzis, C. J., & Satyaprasad, C. (1994). Children's facial and gestural decoding and encoding:
Relations between skills and with popularity. Journal of Nonverbal Behavior, 18(1), 37-
55.
Branch, W. T., & Malik, T. K. (1993). Using 'windows of opportunities' in brief interviews to
understand patients' concerns. Journal of the American Medical Association, 269(13),
1667-1668.
Brown, R. F., Butow, P. N., Henman, M., Dunn, S. M., Boyle, F., & Tattersall, M. H. (2002).
Responding to the active and passive patient: flexibility is the key. Health Expectations,
5(3), 236-245.
Brunswik, E. (1956). Perception and the representative design of psychological experiments (2d
ed.). Berkeley, CA US: University of California Press.
Bullmer, K. (1972). Improving accuracy of interpersonal perception through a direct teaching
method. Journal of Counseling Psychology, 19(1), 37-41.
Buss, A. H. (1989). Personality as traits. American Psychologist, 44(11), 1378-1388.

96
Butow, P., Cockburn, J., Girgis, A., Bowman, D., Schofield, P., D'Este, C., et al. (2008).
Increasing oncologists' skills in eliciting and responding to emotional cues: evaluation of
a communication skills training program. Psychooncology, 17(3), 209-218.
Butow, P. N., Brown, R. F., Cogar, S., Tattersall, M. H., & Dunn, S. M. (2002). Oncologists'
reactions to cancer patients' verbal cues. Psychooncology, 11(1), 47-58.
Bylund, C. L., & Makoul, G. (2002). Empathic communication and gender in the physician-
patient encounter. Patient Education and Counseling, 48(3), 207-216.
Bylund, C. L., & Makoul, G. (2005). Examining empathy in medical encounters: an
observational study using the empathic communication coding system. Health
Communication, 18(2), 123-140.
Byron, K., Terranova, S., & Nowicki, S., Jr. (2007). Nonverbal emotion recognition and
salespersons: Linking ability to perceived and actual success. Journal of Applied Social
Psychology, 37(11), 2600-2619.
Carney, D. R., Colvin, C. R., & Hall, J. A. (2007). A thin slice perspective on the accuracy of
first impressions. Journal of Research in Personality, 41(5), 1054-1072.
Carton, J. S., Kessler, E. A., & Pape, C. L. (1999). Nonverbal decoding skills and relationship
well-being in adults. Journal of Nonverbal Behavior, 23(1), 91-100.
Cegala, D. J., & Broz, S. L. (2002). Physician communication skills training: A review of
theoretical backgrounds, objectives and skills. Medical Education, 36(11), 1004-1016.
Chalmers, J. B., & Townsend, M. A. (1990). The effects of training in social perspective taking
on socially maladjusted girls. Child Development, 61(1), 178-190.
Costanzo, M. (1992). Training students to decode verbal and nonverbal cues: effects on
confidence and performance. Journal Of Educational Psychology, 84(3), 308-313.

97
Costanzo, M., & Archer, D. (1989). Interperting the expressive behavior of others: The
Interpersonal Perception Task. Journal of Nonverbal Behavior, 13(4), 225-245.
Crow, W. J. (1957). The effect of training upon accuracy and variability in interpersonal
perception. Journal of Abnormal Psychology, 55(3), 355-359.
Davenport, S., Goldberg, D., & Millar, T. (1987). How psychiatric disorders are missed during
medical consultations. Lancet, 2(8556), 439-441.
DeCoster, V. A., & Egan, M. (2001). Physicians' perceptions and responses to patient emotion:
implications for social work practice in health care. Social Work in Health Care, 32(3),
21-40.
Del Piccolo, L., de Haes, H., Heaven, C., Jansen, J., Verheul, W., Finset, A., et al. (2009) Coding
of health provider talk related to cues and concerns. Retrieved from www.each.eu.
Del Piccolo, L., Goss, C., & Bergvik, S. (2006). The fourth meeting of the Verona Network on
Sequence Analysis "Consensus finding on the appropriateness of provider responses to
patient cues and concerns". Patient Education and Counseling, 61, 473-475.
Del Piccolo, L., Goss, C., & Zimmermann, C. (2005). The third meeting of the Verona Network
on Sequence Analysis. Finding common grounds in defining patient cues and concerns
and the appropriateness of provider responses. Patient Education and Counseling, 57,
241-244.
Deladisma, A. M., Cohen, M., Stevens, A., Wagner, P., Lok, B., Bernard, T., et al. (2007). Do
medical students respond empathetically to a virtual patient? American Journal of
Surgery, 193(6), 756-760.

98
Deladisma, A. M., Johnsen, K., Raij, A., Rossen, B., Kotranza, A., Kalapurakal, M., et al.
(2008). Medical student satisfaction using a virtual patient system to learn history-taking
communication skills. Studies in Health Technology and Informatics, 132, 101-105.
DePaulo, B. M., Charlton, K., Cooper, H., Lindsay, J. J., & Muhlenbruck, L. (1997). The
accuracy-confidence correlation in the detection of deception. Personality & Social
Psychology Review, 1(4), 346.
DePaulo, B. M., Lindsay, J. J., Malone, B. E., Muhlenbruck, L., Charlton, K., & Cooper, H.
(2003). Cues to deception. Psychological Bulletin, 129(1), 74-118.
deTurck, M. A. (1991). Training observers to detect spontaneous deception: effects of gender.
Communication Reports, 4(2), 81-89.
deTurck, M. A., Harszlak, J. J., Bodhorn, D. J., & Texter, L. A. (1990). The effects of training
social perceivers to detect deception from behavioral cues. Communication Quarterly,
38(2), 189-199.
DiMatteo, M. R., Hays, R. D., & Prince, L. M. (1986). Relationship of physicians' nonverbal
communication skill to patient satisfaction, appointment noncompliance, and physician
workload. Health Psychology, 5(6), 581-594.
DiMatteo, M. R., Prince, L. M., & Taranta, A. (1979). Patients' percentions of physicians'
behavior: determinants of patient commitment to the therapeutic relationship. Journal of
Community Health, 4(4), 280-290.
DiMatteo, M. R., Taranta, A., Friedman, H. S., & Prince, L. M. (1980). Predicting patient
satisfaction from physicians' nonverbal communication skills. Medical Care, 18(4), 376-
387.

99
Doblin, B. H., & Klamen, D. L. (1997). The ability of first-year medical students to correctly
identify and directly respond to patients' observed behaviors. Academic Medicine, 72(7),
631-634.
Dunnett, C. W. (1955). A multiple comparison procedure for comparing several treatments with
a control. Journal of the American Statistical Association, 50(272), 1096-1121.
Duric, V., Butow, P., Sharpe, L., Lobb, E., Meiser, B., Barratt, A., et al. (2003). Reducing
psychological distress in a genetic counseling consultation for breast cancer. Journal of
Genetic Counseling, 12(3), 243-264.
Easter, D. W., & Beach, W. (2004). Competent patient care is dependent upon attending to
empathic opportunities presented during interview sessions. Current Surgery, 61(3), 313-
318.
Eide, H., Frankel, R., Haaversen, A. C., Vaupel, K. A., Graugaard, P. K., & Finset, A. (2004).
Listening for feelings: identifying and coding empathic and potential empathic
opportunities in medical dialogues. Patient Education and Counseling, 54(3), 291-297.
Eide, H., Quera, V., Graugaard, P., & Finset, A. (2004). Physician-patient dialogue surrounding
patients' expression of concern: applying sequence analysis to RIAS. Social Science and
Medicine, 59(1), 145-155.
Elfenbien, H. A. (2006). Learning in emotion judgements: training and the cross-cultural
understanding of facial expressions. Journal of Nonverbal Behavior, 30(1), 21-36.
Endres, J., & Laidlaw, A. (2009). Micro-expression recognition training in medical students: a
pilot study. BMC Medical Education, 9, 47.

100
Epstein, R. M., & Street, R. L. J. (2007). Patient-Centered Communciation in Cancer Care:
Promoting Healing and Reducing Suffering. National Cancer Institute, NIH Publication
No. 07-6225. Bethesda, MD.
Evans, B. J., Stanley, R. O., Coman, G. J., & Burrows, G. D. (1989). Psychological tests to
measure the effects of medical education on students' interpersonal skills. Medical
Education, 23(6), 492-497.
Fentiman, I. S. (2007). Communication with older breast cancer patients. Breast Journal, 13(4),
406-409.
Fiedler, K., & Walka, I. (1993). Training lie detectors to use nonverbal cues instead of global
heuristics. Human Communication Research, 20(2), 199-223.
Floyd, M. R., Lang, F., McCord, R. S., & Keener, M. (2005). Patients with worry: presentation
of concerns and expectations for response. Patient Education and Counseling, 57(2),
211-216.
Frank, M. G., & Feeley, T. H. (2003). To catch a liar: Challenges for research in lie detection
training. Journal of Applied Communication Research, 31(1), 58-75.
Frank, M. G., Paolantonio, N., Feeley, T. H., & Servoss, T. J. (2004). Individual and small group
accuracy in judging truthful and deceptive communication. Group Decision and
Negotiation, 13(1), 45-59.
Frojd, C., Lampic, C., Larsson, G., Birgegard, G., & von Essen, L. (2007). Patient attitudes,
behaviours, and other factors considered by doctors when estimating cancer patients'
anxiety and desire for information. Scandinavian Journal of Caring Sciences, 21(4), 523-
529.

101
Funder, D. C. (1995). On the accuracy of personality judgment: A realistic approach.
Psychological Review, 102(4), 652-670.
Gask, L., Goldberg, D., Lesser, A. L., & Millar, T. (1988). Improving the psychiatric skills of the
general practice trainee: an evaluation of a group training course. Medical Education,
22(2), 132-138.
Giannini, A. J., Giannini, J. D., & Bowman, R. K. (2000). Measurement of nonverbal receptive
abilities in medical students. Perceptual and Motor Skills, 90(3), 1145-1150.
Gillis, J., Bernieri, F. J., & Wooten, E. (1995). The effects of stimulus medium and feedback on
the judgement of rapport. Organizational Behavior and Human Decision Processes, 63,
33-45.
Golan, O., Ashwin, E., Granader, Y., McClintock, S., Day, K., Leggett, V., et al. (2010).
Enhancing emotion recognition in children with autism spectrum conditions: An
intervention using animated vehicles with real emotional faces. Journal of Autism and
Developmental Disorders, 40(3), 269-279.
Golan, O., & Baron-Cohen, S. (2006). Systemizing empathy: Teaching adults with Asperger
syndrome or high-functioning autism to recognize complex emotions using interactive
multimedia. Development and Psychopathology, 18(2), 591-617.
Goldberg, D. P., Steele, J. J., Smith, C., & Spivey, L. (1980). Training family doctors to
recognise psychiatric illness with increased accuracy. Lancet, 2(8193), 521-523.
Goldstein, A. G. (1985). Effects of training on Japanese face recognition : reduction of the other
- race effect. Bulletin of the Psychonomic Society, 23(3), 211-214.
Gutierrez, L. E., & Wallbrown, F. H. (1983). Enhancing nonverbal sensitivity through glossolalic
training. Journal of Psychiatric Treatment & Evaluation, 5(1), 9-13.

102
Hafferty, F. W., & Franks, R. (1994). The hidden curriculum, ethics teaching, and the structure
of medical education. Academic Medicine, 69(11), 861-871.
Halberstadt, A. G., & Hall, J. A. (1980). Who's getting the message? Children's nonverbal skill
and their evaluation by teachers. Developmental Psychology, 16(6), 564-573.
Hall, J. A., Andrzejewski, S., & Yopchick, J. (2009). Psychosocial correlates of interpersonal
sensitivity: a meta-analysis. Journal of Nonverbal Behavior, 33, 149-180.
Hall, J. A. (1978). Gender effects in decoding nonverbal cues. Psychological Bulletin, 85(4),
845-857.
Hall, J. A. (1984). Nonverbal Sex Differences: Communication Accuracy and Expressive Style.
Baltimore: Johns Hopkins University Press.
Hall, J. A. (2001). The PONS Test and the psychometric approach to measuring interpersonal
sensitivity. In J. A. Hall & F. J. Bernieri (Eds.), Interpersonal Sensitivity: Theory and
Measurement (pp. 143-160). Mahwah, NJ: Lawrence Erlbaum Associates.
Hall, J. A. (2011). Clinicians' accuracy in perceiving patients: Toward an integrative approach to
communication skill. Patient Education and Counseling, Under Review.
Hall, J. A., & Bernieri, F. J. (2001a). Interpersonal Sensitivity : Theory and Measurement.
Mahwah, NJ: L. Erlbaum Associates.
Hall, J. A., Blanch, D. C., Horgan, T. G., Murphy, N. A., Rosip, J. C., & Schmid Mast, M.
(2008). Motivation and interpersonal sensitivity: Does it matter how hard you try?
Motivation and Emotion, 33(3), 291-302.
Hall, J. A., Gunnery, S. D., & Andrzejewski, S. A. (2011). Nonverbal emotion displays,
communication modality, and the judgment of personality. Journal of Research in
Personality, 45(1), 77-83.

103
Hall, J. A., Irish, J. T., Roter, D. L., & Ehrlich, C. M. (1994). Satisfaction, gender, and
communication in medical visits. Medical Care, 32(12), 1216-1231.
Hall, J. A., Manusov, V., & Patterson, M. L. (2006). Women's and Men's Nonverbal
Communication: Similarities, Differences, Stereotypes, and Origins. In V. Manusov &
M. L. Patterson (Eds.), The Sage Handbook of Nonverbal Communication. (pp. 201-218).
Thousand Oaks, CA, US: Sage Publications, Inc.
Hall, J. A., Murphy, N. A., & Schmid Mast, M. (2007). Nonverbal self-accuracy in interpersonal
interaction. Personality and Social Psychology Bulletin, 33(12), 1675-1685.
Hall, J. A., Roter, D. L., Blanch, D. C., & Frankel, R. M. (2009). Nonverbal sensitivity in
medical students: Implications for clinical interactions. Journal of General Internal
Medicine, 24(11), 1217-1222.
Hammond, K. R. (1966). The Psychology of Egon Brunswik. Oxford England: Holt, Rinehart &
Winston.
Hansford, B. C. (1977). Microteaching, feedback, dogmatism, and nonverbal perceptiveness.
Journal of Psychology: Interdisciplinary and Applied, 95(2), 231-235.
Hargie, O., Dickson, D., Boohan, M., & Hughes, K. (1998). A survey of communication skills
training in UK schools of medicine: Present practices and prospective proposals. Medical
Education, 32(1), 25-34.
Hastings, M. E., Tangney, J. P., & Stuewig, J. (2008). Psychopathy and identification of facial
expressions of emotion. Personality and Individual Differences, 44(7), 1474-1483.
Heneman, R. L. (1988). Traits, behaviors, and rater training: Some unexpected results. Human
Performance, 1(2), 85-98.

104
Hill, M. L., & Craig, K. D. (2004). Detecting deception in facial expressions of pain: Accuracy
and training. The Clinical Journal of Pain, 20(6), 415-422.
Hornblow, A. R., Kidson, M. A., & Ironside, W. (1988). Empathic processes: perception by
medical students of patients' anxiety and depression. Medical Education, 22(1), 15-18.
Hottel, T. L., & Hardigan, P. C. (2005). Improvement in the interpersonal communication skills
of dental students. Journal of Dental Education, 69(2), 281-284.
Hulsman, R. L., Ros, W. J. G., Winnubst, J. A. M., & Bensing, J. M. (1999). Teaching clinically
experienced physicians communication skills. A review of evaluation studies. Medical
Education, 33(9), 655-668.
Ickes, W. (1993). Empathic Accuracy. Journal of Personality, 61, 587-609.
Ickes, W. (2001). Measuring Empathic Accuracy. In J. A. Hall & F. J. Bernieri (Eds.),
Interpersonal Sensitivity: Theory and Measurement (pp. 219-242). Mahwah, NJ:
Lawrence Erlbaum Associates.
Jansen, J., van Weert, J. C., de Groot, J., van Dulmen, S., Heeren, T. J., & Bensing, J. M. (2011).
Emotional and informational patient cues: the impact of nurses' responses on recall.
Patient Education and Counseling, 79(2), 218-224.
Jecker (1965). Improving accuracy in interpreting non-verbal cues of comprehension.
Psychology in the Schools, 2(3), 239.
Jenness, A. (1932). The effects of coaching subjects in the recognition of facial expression.
Journal of General Psychology, 7, 163-178.
Kassin, S. M., & Fong, C. T. (1999). 'I'm innocent!': Effects of training on judgments of truth
and deception in the interrogation room. Law and Human Behavior, 23(5), 499-516.
105
Kauss, D. R., & et al. (1980). The long-term effectiveness of interpersonal skills training in
medical schools. Journal of Medical Education, 55(7), 595-601.
Kim, S. S., Kaplowitz, S., & Johnston, M. V. (2004). The effects of physician empathy on
patient satisfaction and compliance. Evaluation & the Health Professions, 27(3), 237-
251.
Kim, Y. M., Kols, A., Prammawat, S., & Rinehart, W. (2005). Sequence analysis: responsiveness
of doctors to patient cues during family planning consultations in Mexico. Patient
Education and Counseling, 58(1), 114-117.
Kinnersley, P., Stott, N., Peters, T. J., & Harvey, I. (1999). The patient-centredness of
consultations and outcome in primary care. British Journal of General Practice, 49(446),
711-716.
Kohnken, G. n. (1987). Training police officers to detect deceptive eyewitness statements: Does
it work? Social Behaviour, 2(1), 1-17.
Krupat, E., Frankel, R., Stein, T., & Irish, J. (2006). The Four Habits Coding Scheme: Validation
of an instrument to assess clinicians' communication behavior. Patient Education and
Counseling, 62(1), 38-45.
Latham, G. P., & Wexley, K. N. (1977). Behavioral observation scales for performance appraisal
purposes. Personnel Psychology, 30(2), 255-268.
Latham, G. P., Wexley, K. N., & Pursell, E. D. (1975). Training managers to minimize rating
errors in the observation of behavior. Journal of Applied Psychology, 60(5), 550-555.
Letzring, T. D. (2008). The good judge of personality: Characteristics, behaviors, and observer
accuracy. Journal of Research in Personality, 42(4), 914-932.

106
Levinson, W., Gorawara-Bhat, R., & Lamb, J. (2000). A study of patient clues and physician
responses in primary care and surgical settings. Journal of the American Medical
Association, 284(8), 1021-1027.
Liess, A., Simon, W., Yutsis, M., Owen, J. E., Piemme, K. A., Golant, M., et al. (2008).
Detecting emotional expression in face-to-face and online breast cancer support groups.
Journal of Consulting and Clinical Psychology, 76(3), 517-523.
Lievens, F. (2001). Assessor training strategies and their effects on accuracy, interrater
reliability, and discriminant validity. Journal of Applied Psychology, 86(2), 255-264.
Lipsey, M. W., & Wilson, D. B. (1993). The efficacy of psychological, educational, and
behavioral treatment: Confirmation from meta-analysis. American Psychologist, 48(12),
1181-1209.
Lopata, C., Thomeer, M. L., Volker, M. A., Nida, R. E., & Lee, G. K. (2008). Effectiveness of a
manualized summer social treatment program for high-functioning children with autism
spectrum disorders. Journal of Autism and Developmental Disorders, 38(5), 890-904.
Machado, P. P., Beutler, L. E., & Greenberg, L. S. (1999). Emotion recognition in
psychotherapy: impact of therapist level of experience and emotional awareness. Journal
of Clinical Psychology, 55(1), 39-57.
Machida, S. (1986). Teacher accuracy in decoding nonverbal indicants of comprehension and
noncomprehension in Anglo- and Mexican-American children. Journal Of Educational
Psychology, 78(6), 454-464.
Magai, C., Cohen, C. I., & Gomberg, D. (2002). Impact of training dementia caregivers in
sensitivity to nonverbal emotion signals. International Psychogeriatrics, 14(1), 25-38.

107
Maguire, G. P., Goldberg, D., Hobson, R. F., Margison, F., Moss, S., & O'Dowd, T. (1983).
Evaluating the teaching of a method of psychotherapy. British Journal of Psychiatry 144,
575-580.
Maguire, P. (1978). The value of feedback in teaching interviewing skills to medical students.
Psychological Medicine, 8(4), 695-704.
Maguire, P., Booth, K., Elliott, C., & Jones, B. (1996). Helping health professionals involved in
cancer care acquire key interviewing skills--the impact of workshops. European Journal
of Cancer, 32A(9), 1486-1489.
Maguire, P., Faulkner, A., Booth, K., Elliott, C., & Hillier, V. (1996). Helping cancer patients
disclose their concerns. European Journal of Cancer, 32A(1), 78-81.
Malone, B. E., & DePaulo, B. M. (2001). Measuring sensitivity to deception. In J.A. Hall & F.J.
Bernieri. (Eds.), Interpersonal Sensitivity: Theory and Measurement. (pp. 103-124).
Mahwah, NJ US: Lawrence Erlbaum Associates Publishers.
Malpass, R., Lavigueur, H., & Weldon, D. (1973). Verbal and visual training in face recognition.
Perception & Psychophysics, 14(2), 285-292.
Malpass, R. S., & Kravitz, J. (1969). Recognition for faces of own and other race. Journal Of
Personality And Social Psychology, 13(4), 330-334.
Marsh, A. A., & Blair, R. J. R. (2008). Deficits in facial affect recognition among antisocial
populations: A meta-analysis. Neuroscience and Biobehavioral Reviews, 32(3), 454-465.
Marsh, A. A., Kozak, M. N., & Ambady, N. (2007). Accurate identification of fear facial
expressions predicts prosocial behavior. Emotion, 7(2), 239-251.

108
McClure, E. B., & Nowicki, S., Jr. (2001). Associations between social anxiety and nonverbal
processing skill in preadolescent boys and girls. Journal of Nonverbal Behavior, 25(1), 3-
19.
McCrae, R. R., Kurtz, J. E., Yamagata, S., & Terracciano, A. (2011). Internal consistency, retest
reliability, and their implications for personality scale validity. Personality and Social
Psychology Review, 15(1), 28-50.
McGilton, K., Irwin-Robinson, H., Boscart, V., & Spanjevic, L. (2006). Communication
enhancement: Nurse and patient satisfaction outcomes in a complex continuing care
facility. Journal of Advanced Nursing, 54(1), 35-44.
McKenzie, K., Matheson, E., McKaskie, K., Hamilton, L., & Murray, G. C. (2000). Impact of
group training on emotion recognition in individuals with a learning disability. British
Journal of Learning Disabilities, 28, 143-147.
Mead, N., & Bower, P. (2000). Patient-centredness: a conceptual framework and review of the
empirical literature. Social Science and Medicine, 51(7), 1087-1110.
Mead, N., & Bower, P. (2002). Patient-centred consultations and outcomes in primary care: a
review of the literature. Patient Education and Counseling, 48(1), 51-61.
Moffatt, C. W., Hanley-Maxwell, C., & Donnellan, A. M. (1995). Discrimination of emotion,
affective perspective-taking and empathy in individuals with mental retardation.
Education & Training in Mental Retardation & Developmental Disabilities, 30(1), 76-85.
Morris, S. B., & DeShon, R. P. (2002). Combining effect size estimates in meta-analysis with
repeated measures and independent-groups designs. Psychological Methods, 7(1), 105-
125.

109
Morse, D. S., Edwardsen, E. A., & Gordon, H. S. (2008). Missed opportunities for interval
empathy in lung cancer communication. Archives of Internal Medicine, 168(17), 1853-
1858.
Myers, G. E., Myers, M. T., Goldberg, A., & Welch, C. E. (1969). Effect of feedback on
interpersonal sensitivity in laboratory training groups. Journal of Applied Behavioral
Science, 5(2), 175-185.
Nixon, Y., & Bull, P. (2005). The effects of cultural awareness on nonverbal perceptual
accuracy: British and Japanese training programmes. Journal of Intercultural
Communication, 9, 63-80.
Noble, L. M., Kubacki, A., Martin, J., & Lloyd, M. (2007). The effect of professional skills
training on patient-centredness and confidence in communicating with patients. Medical
Education, 41(5), 432-440.
Norfolk, T., Birdi, K., & Walsh, D. (2007). The role of empathy in establishing rapport in the
consultation: a new model. Medical Education, 41(7), 690-697.
Nowicki, S., & Duke, M. (1994). Individual differences in the nonverbal communication of
affect: the Diagnostic Analysis of Nonverbal Accuracy Scale. Journal of Nonverbal
Behavior, 18, 9-34.
Nowicki, S., & Duke, M. (2001). Nonverbal receptivity: the Diagnostic Analysis of Nonverbal
Accuracy (DANVA). In J. A. Hall & F. J. Bernieri. (Eds.), Interpersonal Sensitivity:
Theory and Measurement. (pp. 183-198). Mahwah, NJ: Lawrence Erlbaum Associates.
Nowicki, S., & Duke, M. P. (1994). Individual differences in the nonverbal communication of
affect: The Diagnostic Analysis of Nonverbal Accuracy Scale. Journal of Nonverbal
Behavior, 18(1), 9-35.

110
Nowicki, S., Jr., & Carton, E. (1997). The relation of nonverbal processing ability of faces and
voices and children's feelings of depression and competence. The Journal of Genetic
Psychology: Research and Theory on Human Development, 158(3), 357-363.
Nowicki, S., Jr., & Mitchell, J. (1998). Accuracy in identifying affect in child and adult faces and
voices and social competence in preschool children. Genetic, Social, and General
Psychology Monographs, 124(1), 39-59.
Oguchi, M., Jansen, J., Butow, P., Colagiuri, B., Divine, R., & Dhillon, H. (2011). Measuring the
impact of nurse cue-response behaviour on cancer patients' emotional cues. Patient
Education and Counseling.
Orwin, R. G. (1983). A fail-safe N for effect size in meta-analysis. Journal of Educational
Statistics, 8(2), 157-159.
Penn, D. L., & Combs, D. (2000). Modification of affect perception deficits in schizophrenia.
Schizophrenia Research, 46(2-3), 217-229.
Powell, D. M., & B. (2008). Assessing personality in the employment interview: The impact of
rater training and individual differences on rating accuracy. ProQuest Information &
Learning, US.
Pulakos, E. D. (1986). The development of training programs to increase accuracy with different
rating tasks. Organizational Behavior and Human Decision Processes, 38(1), 76-91.
Radice-Neumann, D., Zupan, B., Tomita, M., & Wilier, B. (2009). Training emotional
processing in persons with brain injury. The Journal of Head Trauma Rehabilitation,
24(5), 313-323.

111
Rao, J. K., Anderson, L. A., Inui, T. S., & Frankel, R. M. (2007). Communication interventions
make a difference in conversations between physicians and patients: a systematic review
of the evidence. Medical Care, 45(4), 340-349.
Riggio, R. E. (1986). Assessment of basic social skills. Journal Of Personality And Social
Psychology, 51(3), 649-660.
Riggio, R. E., Riggio, H. R. (2001). Self-report measurement of interpersonal sensitivity. In J. A.
Hall & F. J. Bernieri. (Eds.), Interpersonal Sensitivity: Theory and Measurement. (pp.
127-142). Mahwah, NJ US: Lawrence Erlbaum Associates Publishers.
Robbins, A. S., Kauss, D. R., Heinrich, R., Abrass, I., Dreyer, J., & Clyman, B. (1979).
Interpersonal skills training: evaluation in an internal medicine residency. Journal of
Medical Education, 54(11), 885-894.
Robbins, J. M., Kirmayer, L. J., Cathebras, P., Yaffe, M. J., & Dworkind, M. (1994). Physician
characteristics and the recognition of depression and anxiety in primary care. Medical
Care, 32(8), 795-812.
Rosenthal, R. (1979). The file drawer problem and tolerance for null results. Psychological
Bulletin, 86(3), 638-641.
Rosenthal, R. (1991). Meta-Analytic Procedures for Social Research (rev. ed.). Thousand Oaks,
CA US: Sage Publications, Inc.
Rosenthal, R., Hall, J. A., DiMatteo, M. R., Rogers, P. L., & Archer, D. (1979). Sensitivity to
Nonverbal Communication: The PONS Test. Baltimore, MD: The Johns Hopkins
University Press.

112
Roter, D., & Larson, S. (2002). The Roter interaction analysis system (RIAS): Utility and
flexibility for analysis of medical interactions. Patient Education and Counseling, 46(4),
243-251.
Roter, D. L., Erby, L. H., Hall, J. A., Larson, S., Ellington, L., & Dudley, W. (2008). Nonverbal
sensitivity: Consequences for learning and satisfaction in genetic counseling. Health
Education, 108(5), 397-410.
Roter, D. L., Frankel, R. M., Hall, J. A., & Sluyter, D. (2006). The expression of emotion
through nonverbal behavior in medical visits. Mechanisms and outcomes. Journal of
General Internal Medicine, 21 Suppl 1, S28-34.
Roter, D. L., Hall, J. A., Blanch-Hartigan, D., Larson, S., & Frankel, R. M. (2011). Slicing it
thin: New methods for brief sampling analysis using RIAS-coded medical dialogue.
Patient Education and Counseling, 82(3), 410-419.
Roter, D. L., Larson, S., Shinitzky, H., Chernoff, R., Serwint, J. R., Adamo, G., et al. (2004). Use
of an innovative video feedback technique to enhance communication skills training.
Medical Education, 38(2), 145-157.
Russell, T. A., Green, M. J., Simpson, I., & Coltheart, M. (2008). Remediation of facial emotion
perception in schizophrenia: Concomitant changes in visual attention. Schizophrenia
Research, 103(1-3), 248-256.
Ryan, H., Schofield, P., Cockburn, J., Butow, P., Tattersall, M., Turner, J., et al. (2005). How to
recognize and manage psychological distress in cancer patients. European Journal of
Cancer Care, 14(1), 7-15.
Satterfield, J. M., & Hughes, E. (2007). Emotion skills training for medical students: a
systematic review. Medical Education, 41(10), 935-941.

113
Schmid Mast, M. (2007). On the importance of nonverbal communication in the physician-
patient interaction. Patient Education and Counseling, 67(3), 315-318.
Schmid Mast, M., Jonas, K., & Hall, J. A. (2009). Give a person power and he or she will show
interpersonal sensitivity: The phenomenon and its why and when. Journal of Personality
& Social Psychology, 97(5), 835-850.
Schuppert, H. M., Giesen-Bloo, J., van Gemert, T. G., Wiersema, H. M., Minderaa, R. B.,
Emmelkamp, P. M. G., et al. (2009). Effectiveness of an emotion regulation group
training for adolescents: A randomized controlled pilot study. Clinical Psychology &
Psychotherapy, 16(6), 467-478.
Sheldon, L. K., Ellington, L., Barrett, R., Dudley, W. N., Clayton, M. F., & Rinaldi, K. (2009).
Nurse responsiveness to cancer patient expressions of emotion. Patient Education and
Counseling, 76(1), 63-70.
Silver, H., Goodman, C., Knoll, G., & Isakov, V. (2004). Brief emotion training improves
recognition of facial emotions in chronic schizophrenia. A pilot study. Psychiatry
Research, 128(2), 147-154.
Silver, M., & Oakes, P. (2001). Evaluation of a new computer intervention to teach people with
autism or asperger syndrome to recognize and predict emotions in others. Autism, 5(3),
299-316.
Smith, R. C., Osborn, G., Hoppe, R. B., Lyles, J. S., Van Egeren, L., Henry, R., et al. (1991).
Efficacy of a one-month training block in psychosocial medicine for residents: a
controlled study. Journal of General Internal Medicine, 6(6), 535-543.
Smith, R. C., & Zimny, G. H. (1988). Physicians' emotional reactions to patients.
Psychosomatics, 29(4), 392-397.

114
Smith, S., Hanson, J. L., Tewksbury, L. R., Christy, C., Talib, N. J., Harris, M. A., et al. (2007).
Teaching patient communication skills to medical students: a review of randomized
controlled trials. Evaluation & the Health Professions, 30(1), 3-21.
Spool, M. D. (1978). Training programs for observers of behavior: A review. Personnel
Psychology, 31, 853-888.
Stepien, K. A., & Baernstein, A. (2006). Educating for empathy: A review. Journal of General
Internal Medicine, 21(5), 524-530.
Stewart, M., Brown, J. B., Donner, A., McWhinney, I. R., Oates, J., Weston, W. W., et al.
(2000). The impact of patient-centered care on outcomes. Journal of Family Practice,
49(9), 796-804.
Stewart, M. A. (1995). Effective physician-patient communication and health outcomes: a
review. Canadian Medical Association Journal, 152(9), 1423-1433.
Tickle-Degnen, L. (1998). Working well with others: the prediction of students' clinical
performance. The American Journal Of Occupational Therapy, 52(2), 133-142.
Uitterhoeve, R., de Leeuw, J., Bensing, J., Heaven, C., Borm, G., Demulder, P., et al. (2008).
Cue-responding behaviours of oncology nurses in video-simulated interviews. Journal of
Advanced Nursing, 61(1), 71-80.
U.S. Department of Health and Human Services. (2000). Healthy people 2010. 2nd ed.
Understanding and improving health and objectives for improving health. Retrieved
August 5th, 2009, from http://www.healthypeople.gov.
van Dulmen, S., & van den Brink-Muinen, A. (2004). Patients' preferences and experiences in
handling emotions: A study on communication sequences in primary care medical visits.
Patient Education and Counseling, 55(1), 149-152.

115
van Zanten, M., Boulet, J. R., & McKinley, D. (2007). Using standardized patients to assess the
interpersonal skills of physicians: six years' experience with a high-stakes certification
examination. Health Communication, 22, 195-205.
Vogt, D. S., & Colvin, C. R. (2003). Interpersonal orientation and the accuracy of personality
judgements. Journal of Personality, 71(2), 267-295.
von Baeyer, C. L., Johnson, M. E., & McMillan, M. J. (1984). Consequences of nonverbal
expression of pain: patient distress and observer concern. Social Science & Medicine,
19(12), 1319-1324.
Vrij, A. (1994). The impact of information and setting on deception by police detectives. Journal
of Nonverbal Behavior, 18(2), 117-136.
Vrij, A., & Graham, S. (1997). Individual differences between liars and the ability to detect lies.
Expert Evidence, 5(4), 144-148.
Wadlinger, H. A., & Isaacowitz, D. M. (2011). Fixing our focus: Training attention to regulate
emotion. Personality and Social Psychology Review, 15(1), 75-102.
Warner, R. (1984). Enhancing teacher affective sensitivity by a videotape program. Journal of
Educational Research, 77(6), 366-368.
Waxer, P. H. (1981). Channel contribution in anxiety displays. Journal of Research in
Personality, 15, 44-56.
Webb, J. M., Diana, E. M., Luft, P., Brooks, E. W., & Brennan, E. L. (1997). Influence of
pedagogical expertise and feedback on assessing student comprehension from nonverbal
behavior. The Journal of Educational Research, 91(2), 89-97.

116
Wildman, B. G., Erickson, M. T., & Kent, R. N. (1975). The effect of two training procedures on
observer agreement and variability of behavior ratings. Child Development, 46(2), 520-
524.
Winokur, A., Guthrie, M. B., Rickels, K., & Nael, S. (1982). Extent of agreement between
patient and physician ratings of emotional distress. Psychosomatics, 23(11), 1135.
Wong, R. Y., Saber, S. S., Ma, I., & Roberts, J. M. (2009). Using television shows to teach
communication skills in internal medicine residency. BMC Medical Education, 9, 9.
Yogo, Y., Ando, M., Hashi, A., Tsutsui, S., & Yamada, N. (2000). Judgments of emotion by
nurses and students given double-bind information on a patient's tone of voice and
message content. Perceptual and Motor Skills, 90, 855-863.
Zacker, J. (1972). Understanding one's clients: An attempt to improve sensitivity and morale in
police recruits. Psychological Reports, 31, 999-1008.
Zimmermann, C., Del Piccolo, L., & Finset, A. (2007). Cues and concerns by patients in medical
consultations: a literature review. Psychological Bulletin, 133(3), 438-463.
Zuckerman, M., Koestner, R., & Driver, R. (1981). Beliefs about cues associated with deception.
Journal of Nonverbal Behavior, 6(2), 105-114.

117
Footnotes
1 The meta-analysis in section one represents collaboration between myself, Krista Hill at
Northeastern University, and Susan Andrzejewski at Franklin and Marshall College. I have taken
a leading role in the project in the following ways: developing the project, bringing together the
collaborators, overseeing literature searching, verifying coding, calculating effect sizes, running
analyses, and writing the manuscript. I am the first author on both a poster prepared for the
Society for Personality and Social Psychology Conference and the manuscript, currently in
preparation.
The PECT development and piloting were individual projects done with supervision and
input from my advisor, Judith Hall. The development and testing of the PECT is described in a
published article of which I am the sole author (Blanch-Hartigan, 2011). Minor changes were
made and details were added when necessary to fit within this larger dissertation document.
The development and trial of the multi-component training program was an individual
project done with supervision and input from my advisor, Judith Hall. Additional input on the
project was received from Edward Krupat at Harvard Medical School, and dissertation
committee members, Joanne Miller and David DeSteno at Northeastern University.
In addition to the input acknowledged above, undergraduate research assistants were
involved in many aspects of this dissertation; they assisted in running experimental sessions, data
entry, data coding, and literature searching. The undergraduates were not involved in the writing
or editing of this document.
2 In doing this meta-analysis, effect sizes were also collected from within-subjects designs,
where a single group of participants was assessed pre-training, received the training, and then

118
was reassessed post-training. These effect sizes could not be combined with results from the
primary meta-analysis of between-subjects designs (Morris & DeShon, 2002). Sixteen articles
reporting 21 independent effect sizes representing a within-subjects approach were found and a
separate meta-analysis was conducted on these studies. Combining the 21 effect sizes from
within-subjects designs, the random effects mean effect size was r = .44 (Z = 7.06, p < .001) and
the fixed, weighted mean effect size was r = .40 (Z = 10.50, p < .001). The significant combined
Z indicated that person perception accuracy was significantly greater after training than before
training. The effect sizes ranged from r = .00 to r = .88 and were significantly heterogeneous
(Q(20) = 42.62, p = .001). Fail safe N analysis indicated it would take 771 findings that average
to r = 0.00 for this combined Z to no longer be significant. Ten of these effect sizes were in the
domain of basic emotion recognition accuracy and showed a significant improvement after
training (combined fixed effect r = .48, Z = 7.75, p < .001).
3 The two-question PECT response format allows for calculation of detection accuracy for
each participant. Detection accuracy is scored as the correlation between participants‟ answer for
Question 1 (Is the patient conveying something?) and the criterion intensity of verbal and
nonverbal information provided in each clip. The criterion intensity is coded as follows. Absence
of information is assigned a score of 0, low intensity a score of 1, and high intensity a score of 2.
To determine the overall intensity score of each clip, the intensity score for the verbal
information and the intensity score for the nonverbal information are added together. For
example, a clip that depicts high intensity verbal anger (score = 2) and low intensity nonverbal
anger (score = 1) would receive an overall intensity score of 3. A clip that depicts low intensity
verbal information (score = 1) and an absence of nonverbal information (score = 0) would

119
receive an overall intensity score of 1. Neutral clips (absence of verbal and nonverbal
information) receive an overall intensity score of 0, and clips depicting high verbal and
nonverbal intensities would receive an overall criterion intensity score of 4. For each clip this
overall intensity score is the criterion by which to assess the participants‟ responses. The
participants answer the first question, “Is the patient conveying something?” with 0 = Not at all,
1 = Yes, weakly, or 2 = Yes, strongly. Their answer to this question (how much emotion they
detect) for each of the 47 clips is correlated across clips with the criterion intensity score for each
clip. The resulting correlation for each participant is his/her detection accuracy score.
The first 25 participants run in the training study are not included in any PECT detection
accuracy analyses due to a change in wording of the answer choices for question 1: “Is the
patient conveying something?” The original answer choices were 0 = No, 1 = Possibly, 2 =
Probably, 3 = Definitely. After the 25th
participant the answer choices for question 1 were
changed to 0 = Not at all, 1 = Yes, weakly, 2 = Yes, strongly. The change was made because the
original choices were thought to correspond more to participants‟ confidence in their ability to
pick up on subtle cues, than their ability to accurately report the intensity of the cues.
Excluding the first 25 participants, detection accuracy and overall PECT score (which is
the identification accuracy across the two questions) were highly correlated for both the PECT (r
= .62, p < .001) and PECT-Practice (r = .58, p < .001). Training significantly affected detection
accuracy (F(5,173) = 2.60, p < .05) and the pattern of means was equivalent to the results for
PECT score. When the effect of training on PECT score was examined in an ANCOVA,
controlling for detection accuracy, the influence of training condition on accuracy remained
significant (F(5, 196) = 5.99, p < .001). However, when the effect of training on detection
accuracy was examined, with PECT score entered as a covariate, the effect of training was no

120
longer significant (F(5, 196) = .47, p = .80), indicating that it was identification accuracy that
was driving the results. Therefore, detection accuracy was not included in subsequent analyses
and will not be described further in this dissertation.

121
Table 1
Characteristics of Studies Included in Meta-Analysis
First
Author
Publication
Year
N
Effect
size (r)
Analysis
Person Perception Domain
Barone 2005 54 0.00 Mixed Empathic Accuracy
Bullmer 1972 221 0.33 Post-Only Empathic Accuracy
Costanzo 1992 105 0.19 Post-Only Other
Crow 1957 72 -0.13 Mixed Other
DePaulo 1982 44 0.30 Post-Only Deception Detection
deTurck 1990 390 0.20 Post-Only Deception Detection
deTurck 1990 188 0.10 Post-Only Deception Detection
deTurck 1991 183 0.33 Post-Only Deception Detection
Feeley 1995 103 0.12 Post-Only Deception Detection
Fielder 1993 72 0.45 Post-Only Deception Detection
Frank 2004 210 0.17 Post-Only Deception Detection
Gillis 1995 89 0.19 Post-Only Other
59 0.42 Post-Only Other
Hansford 1977 74 0.40 Mixed Empathic Accuracy
Heneman 1988 40 0.20 Post-Only Other
Hill 2004 120 0.22 Post-Only Deception Detection
Jecker 1965 20 0.44 Mixed Comprehension
Kassin 1995 40 -0.34 Post-Only Deception Detection

122
Kauss 1980 46 -0.08 Post-Only Empathic Accuracy
Kohnken 1987 80 0.00 Post-Only Deception Detection
Levine 2005 256 -0.25 Post-Only Deception Detection
90 0.00 Post-Only Deception Detection
158 0.30 Post-Only Deception Detection
Machida 1986 40 0.37 Post-Only Comprehension
Myers 1969 69 0.12 Post-Only Other
Nixon 2005 25 0.04 Post-Only Other
28 -0.06 Post-Only Other
29 0.00 Post-Only Other
Robbins 1979 51 0.00 Mixed Empathic Accuracy
Rosenthal 1979 25 0.28 Post-Only Empathic Accuracy
Vrij 1997 40 0.41 Mixed Deception Detection
29 -0.18 Mixed Deception Detection
Vrij 1994 360 0.27 Post-Only Deception Detection
Webb 1997 30 0.23 Post-Only Comprehension
46 0.65 Post-Only Comprehension
Zuckerman 1985 117 0.36 Post-Only Deception Detection
Zuckerman 1984 64 0.28 Mixed Deception Detection

123
Table 2
Effect Size Summary for Meta-Analysis on Training Effectiveness
N Range
Fixed
Mean
Effect
Size (r)
Random
Mean
Effect
Size (r)
Combined Z
Test of
Homogeneity (Q) Fail-safe N
37 -.34 to .65 .18 .18 11.00***
142.68***
1340
***p < .001

124
Table 3
Moderators of Training Effectiveness
Moderator Categories
Effect
size (r)
Number
of
Studies
(k)
Fixed
effects
Contrast
(Q)
Characteristics of the Overall Study
Type of Effect Size Post-test only .19***
29 .44
Mixed design .15**
8
Random Assignment Individuals randomly assigned .17***
25 3.91
Groups randomly assigned .29***
4
Not randomly assigned to condition .20***
8
Domain Deception detection .17***
18 15.56***
Empathic accuracy .23***
6
Comprehension perception .47***
4
Other person perception .14**
9
Participant Type College students .19***
25 13.53**
Law enforcement professionals .20***
3
Medical professionals -.08 3
Other .27***
6

125
Characteristics of the Training
Length < 5 hours .24***
11 .46
≥ 5 hours .21***
10
Group Size Individual .23***
4 8.16*
Small groups (< 5) .26***
8
Large groups (≥ 5) .17***
17
Mix of group sizes .40***
1
Administrator Self /computer administered .15***
12 5.88*
Administered by a single instructor .25***
7
Approach Instruction & practice & feedback .22***
18 25.26***
Instruction & practice .28 1
Practice & feedback .34***
5
Instruction alone .07* 11
Practice .12 1
Other .17* 1
Included Instruction? No .25***
7 3.45
Yes .17***
30

126
If Instruction, General .15* 5 .87
Instruction Type Cue-specific .17***
15
Channel-specific .30* 1
Mix/unspecified .16 9
If Instruction, Written .31***
6 23.26***
Instruction Delivery Oral .08**
12
Both .21***
3
Unspecified .17***
9
If Instruction, Didactic/lecture .15***
11 2.84
Instruction Format Interactive .44 1
Mix of formats .18***
13
Unspecified .10 4
Included Practice? No .09**
12 17.89***
Yes .23***
25
Included Feedback? No .09**
14 18.40***
Yes .24***
23

127
If Practice or Feedback, Similar to assessment stimuli .25***
18 3.22
Stimuli Different from assessment stimuli .13 4
If Feedback, Item-specific .25***
18 2.71
Feedback Type General performance .19**
3
Both .09 2
Characteristics of the Person Perception Assessment
Assessment in Training Same stimuli included in training .26***
9 18.46***
Similar stimuli included in training .22***
12
Stimuli not included in training .09 16
Target in Training Same target included training .26***
13 8.44**
Target not included in training .15***
24
If Similar, Same target included training .23***
4 .08
Target in Training Target not included in training .21***
8
Validity Previously used/validated assessment .24***
11 8.36**
Assessment created for study .15***
26
Stimuli Source Real/spontaneous displays .19***
18 .24

128
Posed/acted displays .18***
18
Mix .22* 1
Stimuli Format Live .12 1 .28
Videotaped .18***
36
Stimuli Cue Channel Face only .22* 1 3.07
Body only .26***
3
Mixed channels .17***
25
Stimuli Content Nonverbal cues only .27***
13 10.83***
Verbal and nonverbal cues .14***
20
*p < .05
**p < .01
***p < .001

129
Table 4
Examples of Patient Emotion Cue Test (PECT) Verbal Content
Emotion
Category
Emotion
Intensity
Example Statement from PECT
Anger High I completely disagree with you.
Low It was a whole week before he got the results back.
Sadness High I‟m sitting here and tears are starting to well up just
listening to you, so I it‟s not very far behind me.
Low Well, it‟s been getting worse.
Happiness High It‟s so good to hear that.
Low Yeah. It‟s fine. I don‟t have any problems there.
Anxiety High This situation is making me a little nervous.
Low That‟s bad enough, but it‟s the shortness of breath that‟s
got me concerned.
Confused High I don‟t think I understand what you‟re suggesting.
Low Then, I don‟t know. I felt better.
Neutral Neutral He did a sore throat culture.

130
Table 5
Demographic Information of Participants in Patient Emotion Cue Test (PECT) Validation Studies
Study 1 Study 2 Study 3 Combined
Sample
Sample Size [N] 40 26 59 125
Age [Mean (SD)] 19.45 (1.83) 19.08 (1.35) 18.68 (1.12) 19.02 (1.47)
Gender [N (%)]
Male 20 (50.0) 7 (27.0) 18 (30.5) 45 (36.0)
Female 20 (50.0) 19 (73.0) 41 (69.5) 80 (64.0)
Ethnicity [N (%)]
Caucasian 22 (55.0) 17 (65.0) 34 (58.0) 73 (58.0)
Asian 11 (27.5) 3 (11.5) 15 (25.0) 29 (23.0)
Hispanic/Latino 1 (2.5) 2 (8.0) 4 (7.0) 7 (6.0)
African American 3 (7.5) 0 1 (2.0) 4 (3.0)
Middle Eastern 1 (2.5) 0 1 (2.0) 2 (2.0)
Other/Multiracial 2 (5.0) 3 (11.5) 2 (3.0) 7 (6.0)
No Response 0 1 (4.0) 2 (3.0) 3 (2.0)
Considering Medical School [N (%)]
Definitely or Probably No 26 (65.0) 15 (58.0) 32 (54.0) 73 (58.0)
Unsure 7 (17.5) 7 (27.0) 12 (20.0) 26 (21.0)
Definitely or Probably Yes 7 (17.5) 3 (11.5) 13 (22.0) 23 (18.0)
No Response 0 1 (4.0) 2 (3.0) 3 (2.0)

131
Table 6
Descriptive Statistics for Patient Emotion Cue Test (PECT)
Mean (SD)a
Overall Accuracy .68 (.08)
Emotion Specific Accuracy
Anger .65 (.18)
Sadness .75 (.14)
Happiness .66 (.13)
Anxiety .50 (.17)
Confusion .68 (.14)
Neutral .78 (.21)
Emotion Intensity-Specific Accuracy
Neutral Verbal, Neutral Nonverbal .78 (.21)
Neutral Verbal/Low Nonverbal or
Neutral Nonverbal/Low Verbal
.44 (.13)
Low Verbal, Low Nonverbal .61 (.13)
Low Verbal/High Nonverbal or High
Verbal/Low Nonverbal
.80 (.13)
High Verbal/High Nonverbal .88 (.12) a Data from Study 1, 2, 3 combined

132
Table 7
Correlations (r) Between Patient Emotion Cue Test (PECT) and Measures of Nonverbal
Cue Recognition a
Study 1
N = 40
Study 2
N = 26
Study 3
N = 59 b
Weighted mean
effect size (r)
Combined Z
DANVA2-AF .13 .53**
.20 .25 2.92**
DANVA2-AV .31* .11 .34
** .29 2.96
**
PONS face/body - .21 .06 .12 1.03
PONS audio - .43* .13 .25 2.13
*
DANVA2-AF = Diagnostic Analysis of Nonverbal Accuracy for adult faces, DANVA2-
AV = Diagnostic Analysis of Nonverbal Accuracy for adult voices, PONS = Profile of
Nonverbal Sensitivity a All correlations control for participant gender
b Due to time constraints, some participants in Study 3 were unable to complete both the
PONS face/body and PONS audio and so were randomly assigned to take one test. For
the correlation with PONS face/body N = 42 and with PONS audio N = 40 in Study 3. *p < .05,
**p <.01

133
Table 8
Demographic Information of Participants in Training Experiment
Training Condition
Total
Sample
Compreh-
ensive
Consciousn
ess-Raising Instruction
Practice
Alone
Practice
with
Feedback
Control
Sample Size [N] 203 34 36 34 33 33 33
Age [Mean (SD)] 19.28(1.46) 19.29(2.14) 19.17(1.34) 19.71(1.59) 19.12(1.27) 19.09(1.42) 19.27(1.38)
Gender [N (%)]
Male 84 (41) 14 (41) 16 (44) 15 (44) 14 (42) 13 (39) 12 (36)
Female 119 (59) 20 (59) 20 (56) 19 (56) 19 (58) 20 (61) 21 (64)
Ethnicity [N (%)]
Caucasian 133 (66) 22 (65) 23 (64) 24 (71) 24 (73) 20 (61) 20 (61)
Asian 27 (13) 5 (15) 6 (17) 2 (6) 2 (6) 6 (18) 6 (18)
Hispanic/Latino 10 (5) 3 (9) 1 (3) 1 (3) 1 (3) 2 (6) 2 (6)
African American 13 (6) 2 (6) 3 (8) 2 (6) 1 (3) 3 (9) 2 (6)
Middle Eastern 6 (3) 0 (0) 0 (0) 1 (3) 2 (6) 1 (3) 2 (6)
Other/Multiracial 14 (7) 2 (6) 3 (8) 4 (12) 3 (9) 1 (3) 1 (3)
Considering Medical
School [N (%)]
Definitely or
Probably No
140 (69) 18 (53) 26 (72) 22 (65) 27 (82) 24 (73) 23 (70)
Unsure 31 (15) 5 (15) 6 (17) 4 (12) 2 (6) 8 (24) 6 (18)
Definitely or
Probably Yes
32 (16) 11 (32) 4 (11) 8 (24) 4 (12) 1 (3) 4 (12)

134
Table 9
Components Included in Training Conditions
Condition
Role
Induction
Consciousn
ess-Raising
Video
Instruction
al Video
PECT-
Practice
without
feedback
PECT-
Practice
with item-
specific
feedback
PECT and
additional
measures a
Comprehensive X X X X X
Consciousness-
raising
X X X
Instruction X X X
Practice Alone X X X
Practice with
Feedback
X X X
Control X X a Additional outcome measures include (in order): Diagnostic Analysis of Nonverbal Accuracy for
adult faces (DANVA2-AF) and adult voices (DANVA2-AV), Face Recognition Test, Emotional
Sensitivity scale from the Social Sensitivity Index (SSI_ES), self-reported mood items, reaction to
training self-report measures, and demographic questions.

135
Table 10
Descriptive Statistics Across Conditions of Outcome Measures in Training Experiment
N
Total
Sample
Compre-
hensive
Conscious
-ness
Raising Instruction
Practice
Alone
Practice
with
Feedback Control F Objective
Measures
PECT
203 .70 (.08) .75 (.09) .66 (.08) .68 (.08) .71 (.07) .74 (.06) .67 (.08) 8.44***
PECT-Practice 99 .69 (.09) .72 (.08) .66 (.09) .68 (.09) 4.70**
DANVA2-AF 203 .72 (.07) .71 (.07) .71 (.09) .72 (.07) .72 (.07) .73 (.07) .72 (.08) 0.29
DANVA2-AV 202 .78 (.10) .78 (.10) .77 (.09) .76 (.09) .80 (.09) .78 (.10) .78 (.10) 0.83
Face
Recognition 203 .72 (.08) .70 (.09) .75 (.08) .71 (.08) .73 (.08) .73 (.08) .71 (.09) 1.52
Self-Reported
Measures
Tense 193 3.10 (2.21) 2.94 (2.24) 3.09 (2.24) 2.84 (2.21) 3.39 (2.18) 3.31 (2.13) 3.03 (2.40) 0.30
Cheerful 193 5.19 (1.91) 4.87 (2.24) 5.37 (1.96) 5.41 (1.70) 5.18 (1.29) 5.06 (2.33) 5.23 (1.91) 0.34
Angry 194 2.08 (1.75) 2.32 (1.66) 1.94 (1.64) 1.53 (1.44) 1.97 (1.70) 2.38 (2.03) 2.35 (1.92) 1.16
Dominant 193 3.24 (2.01) 3.29 (2.22) 3.26 (1.84) 2.97 (2.02) 3.34 (1.79) 3.19 (2.35) 3.39 (1.96) 0.17
Happy 194 5.82 (1.89) 5.19 (2.12) 5.86 (1.85) 6.41 (1.52) 5.76 (1.62) 5.63 (2.17) 6.06 (1.81) 1.50
Nervous 193 2.71 (2.04) 2.20 (1.30) 3.57 (2.56) 2.09 (1.57) 2.48 (1.82) 2.50 (1.88) 3.32 (2.39) 3.09**
Awkward 194 3.14 (2.21) 2.68 (2.01) 3.69 (2.53) 3.03 (2.32) 3.15 (2.22) 3.13 (2.12) 3.13 (2.03) 0.71
Powerless 194 2.74 (1.93) 2.81 (2.20) 3.60 (2.15) 1.94 (1.29) 2.36 (1.77) 2.88 (2.18) 2.77 (1.52) 2.92*
Uncomfortable 194 2.49 (1.83) 2.29 (1.70) 2.80 (2.18) 1.88 (1.21) 2.91 (2.17) 2.41 (1.70) 2.61 (1.75) 1.40
Strong 193 4.93 (2.20) 4.42 (2.54) 5.31 (1.75) 5.16 (2.00) 5.09 (1.94) 4.35 (2.44) 5.19 (2.41) 1.17
Powerful 194 3.84 (1.98) 3.39 (2.01) 3.69 (1.81) 4.22 (1.86) 4.03 (1.86) 3.50 (2.02) 4.19 (2.30) 1.05
Relaxed 194 6.00 (2.18) 6.35 (2.20) 6.06 (2.17) 6.19 (2.12) 5.70 (2.11) 5.88 (2.37) 5.84 (2.21) 0.39
Learned
Something 203 3.74 (.82) 3.97 (.83) 3.56 (.94) 3.79 (.59) 3.67 (.65) 3.97 (.95) 3.52 (.80) 2.07+
Important
Skill 203 4.76 (.52) 4.79 (.59) 4.67 (.56) 4.74 (.51) 4.79 (.55) 4.76 (.50) 4.82 (.39) 0.37
Good at It 203 3.58 (.85) 3.62 (.95) 3.53 (.91) 3.85 (.86) 3.61 (.66) 3.39 (.96) 3.45 (.79) 1.22
Confident in
Ability 203 3.54 (.95) 3.59 (.96) 3.53 (.91) 3.79 (.88) 3.48 (.97) 3.42 (1.06) 3.42 (.94) 0.72
Tasks easy 202 3.48 (.10) 3.18 (.94) 3.33 (1.10) 3.76 (1.08) 3.81 (.69) 3.21 (1.05) 3.61 (.93) 2.74*
Motivation 202 4.25 (.83) 3.88 (1.02) 4.22 (.76) 4.44 (.75) 4.27 (.80) 4.33 (.78) 4.33 (.78) 1.88+
Enjoyable 203 3.61 (.96) 3.32 (1.20) 3.50 (.94) 3.76 (.89) 3.52 (.91) 3.82 (1.04) 3.76 (.66) 1.42
SSI -ES 203 5.35 (1.02) 5.41 (1.03) 5.47 (.78) 5.37 (1.08) 5.70 (.81) 4.82 (1.18) 5.29 (1.04) 2.81*
DANVA2-AF = Diagnostic Analysis of Nonverbal Accuracy for adult faces, DANVA2-AV = Diagnostic Analysis of
Nonverbal Accuracy for adult voices, PECT = Patient Emotion Cue Test, SSI-ES = Emotional Sensitivity scale from the
Social Sensitivity Index + p < .10, *p < .05, **p <.01, *** p < .001

136
Table 11
Correlation (r) Between Patient Emotion Cue Test (PECT) and Outcome
Measures in Training Experiment a
PECT Accuracy
Other Tests
PECT-Practice .34** [N = 99]
DANVA2-AF .13t
DANVA2-AV .21**
Face Recognition - .05
Demographics
Age - .05
Gender b
.02
SSI-ES .004
Mood Measures
Tense .04
Cheerful .10
Angry - .04
Dominant .03
Happy - .003
Nervous .01
Awkward - .08
Powerless .01
Uncomfortable - .01
Strong - .05
Powerful - .02
Relaxed .04
Reactions to Training
I learned something about recognizing emotions today .11
Recognizing the emotions of others is important - .04
I am good at recognizing the emotions of others - .001
I am confident in my ability to recognize the emotions
of others.
.07
I found the tasks today to be fairly easy. .003
I wanted to do well on the tasks today. .04
I found the tasks today enjoyable. .01

137
DANVA2-AF = Diagnostic Analysis of Nonverbal Accuracy for adult faces,
DANVA2-AV = Diagnostic Analysis of Nonverbal Accuracy for adult voices, SSI-ES
= Emotional Sensitivity scale from the Social Sensitivity Index
t p < .10, * p < .05, ** p < .01, **** p < .001
a N = 203 unless otherwise indicated
b Gender coded as 0 = male, 1 = female

138
Figure 1. Format of the Patient Emotion Cue Test (PECT)
Intensity of Verbal Emotion
Cues
High
Low
Neutral
Intensity of Nonverbal
Emotion Cues
High 5 clips 5 clips 5 clips
Low 5 clips 5 clips 5 clips
Neutral 5 clips 5 clips 7 clips

139
Figure 2. Distribution of Patient Emotion Cue Test (PECT) Accuracy Scores in the Validation
Studies
Frequency Stem & Leaf
3.00 .4 688
4.00 .5 1133
18.00 .5 555777777777779999
21.00 .6 111111111133333333333
34.00 .6 5555555555558888888888888888888888
31.00 .7 0000000022222222222224444444444
10.00 .7 6666666888
3.00 .8 022
1.00 .8 5

140
Figure 3. Graph of the Mean Patient Emotion Cue Test (PECT) Score Across Training
Conditions
0.6
0.62
0.64
0.66
0.68
0.7
0.72
0.74
0.76
0.78
PE
CT
Sco
re
Training Condition

141
Figure 4. Graph of the Change in Score from Patient PECT-Practice to PECT in the
Comprehensive, Practice Alone, and Practice with Feedback Conditions
0.64
0.66
0.68
0.7
0.72
0.74
0.76
0.78
PECT-Practice PECT
Emo
tio
n R
eco
gnit
ion
Acc
ura
cy S
core
Emotion Recognition Accuracy Task
Comprehensive
Practice Alone
Practice with Feedback

142
Appendix A
References Included in Section 1 Training Meta-Analysis
Barone, D. F., Hutchings, P. S., Kimmel, H. J., Traub, H. L., Cooper, J. T., & Marshall, C. M.
(2005). Increasing empathetic accuracy through practice and feedback in a clinical
interview course. Journal of Social and Clinical Psychology, 24 (2), 156-171.
Bullmer, K. (1972). Improving accuracy of interpersonal perception through a direct teaching
method. Journal of Counseling Psychology, 19(1), 37-41.
Costanzo, M. (1992). Training students to decode verbal and nonverbal cues: Effects on
confidence and performance. Journal of Educational Psychology, 84 (3), 308-313.
Crow, W. J. (1957). The effect of training upon accuracy and variability in interpersonal
perception. Journal of Abnormal Psychology, 55(3), 355-359.
DePaulo, B. M., Lassiter, G. D., & Stone, J. I. (1982). Attentional determinants of success at
detecting deception and truth. Personality and Social Psychology Bulletin, 8(2), 273-279.
deTurck, M. A. (1991). Training observers to detect spontaneous deception: Effects of gender.
Communication Reports, 4 (2), 81-89.
deTurck, M. A., Harszlak, J. J., Bodhorn, D. J., & Texter, L. A. (1990). The effects of training
social perceivers to detect deception from behavioral cues. Communication Quarterly, 38
(2), 189-199.
deTurck, M. A., & Miller, G. R. (1990). Training observers to detect deception effects of self-
monitoring and rehearsal. Human Communication Research, 16 (4), 603-620.
Feeley, T. H., deTurck, M. A., & Young, M. J. (1995). Baseline familiarity in lie detection.
Communication Research Reports, 12 (2), 160-169.
Fiedler, K., & Walka, I. (1993). Training lie detectors to nonverbal cues instead of global
heuristics. Human Communication Research, 20 (2), 199-223.
Frank, M. G., Paolantonio, N., Feeley, T. H., & Servoss, T. J. (2004). Individual and small group
accuracy in judging truthful and deceptive communication. Group Decision and
Negotiation, 13, 45-59.
Gills, J. S., Dernieri, F. J., & Wooten, E. (1995). The effects of stimulus medium and feedback
on the judgment of rapport. Organization Behacior and Human Decision Process, 64 (1),
33-45.

143
Hansford, B. C. (1977). Microteaching, feedback, dogmatism, and nonverbal perceptiveness. The
Journal of Psychology, 95, 231-235.
Heneman, R. L. (1988). Traits, behaviors, and rater training: Some unexpected results. Human
Performance, 1(2), 85-98.
Hill, M. L., & Craig, K. D. (2004). Detecting deception in facial expressions of pain accuracy
and training. The Clinical Journal of Pain, 20 (6), 415-422.
Jecker, J. D., Maccoby, N., & Breitrose, H. S. (1965). Improving accuracy in interpreting non-
verbal cues of comprehension. Psychology in the Schools, 2 (3), 239-244.
Kassin, S. M., & Fong, C. T. (1999).”I‟m innocent!”: Effects of training on judgments of truth
and deception in the interrogation room. Law and Human Behavior, 23 (5), 499-515.
Kauss, D. R., & et al. (1980). The long-term effectiveness of interpersonal skills training in
medical schools. Journal of Medical Education, 55(7), 595-601.
Kouknken, G. (1987). Training police officers to detect deceptive eyewitness statements: Does it
work? Social Behaviour, 2, 1-17.
Levine, T. R., Feeley, T. H., McCornack, S. A., Hughes, M., & Harms, C. M. (2005). Testing the
effects of nonverbal behavior training on accuracy in deception detection with the
inclusion of a bogus training control group. Western Journal of Communication, 69 (3),
203-217.
Machida, S. (1986). Teacher accuracy in decoding nonverbal indicants of comprehension and
noncomprehension in Anglo- and Mexican-American children. Journal of Educational
Psychology, 78(6), 454-464.
Myers, G. E., Myers, M T., Goldberg, A., & Welch, C. E. (1969). Effect of feedback on
interpersonal sensitivity in laboratory training groups. The Journal of Applied Behavioral
Science, 5 (2), 175-185.
Nixon, Y., & Bull, P. (2005). The effects of cultural awareness on nonverbal perceptual
accuracy: British and Japanese training programmes. Journal of Intercultural
Communication, 9, 64-80.
Robbins, A. S., Kauss, D. R., Heinrich, R., Abrass, I., Dreyer, J., & Clyman, B. (1979).
Interpersonal skills training: evaluation in an internal medicine residency. Journal of
Medical Education, 54(11), 885-894.
Rosenthal, R., Hall, J. A., DiMatteo, M. R., Rogers, P. L., & Archer, D. (1979). Sensitivity to
Nonverbal Communication: The PONS Test. Baltimore, MD: The Johns Hopkins
University Press; 1979.

144
Vrij, A. (1994). The impact of information and setting on detection of deception by police
detectives. Journal of Nonverbal Behavior, 18 (2), 117-136.
Vrij, A., & Graham, S. (1997). Individual differences between liars and the ability to detect lies.
Expert Evidence, 5 (4), 144-148.
Webb, J. M., Diana, E. M., Luft, P., Brooks, E. W., & Brennan, E. L. (1997). Influence of
pedagogical expertise and feedback on assessing student comprehension from nonverbal
behavior. The Journal of Educational Research, 91(2), 89-97.
Zuckerman, M., Koestner, R., & Alton, A. O. (1984). Learning to detect deception. Journal of
Personality and Social Psychology, 46 (3), 519-528.
Zuckerman, M., Koestner, R., & Colella, M. J. (1985). Learning to detect deception from three
communication channels. Journal of Nonverbal Behavior, 9 (3), 188-194.

145
Appendix B
Role Induction Script
This lab researches how doctors communicate with their patients. Most of the work we
do is with real doctors and patients, but today we‟re testing out a new method for teaching
medical students to communicate with patients and we need your help.
Your job for today is to be a medical student. For this experiment, pretend that you are in
medical school- in a medical communication course. As part of the curriculum in this
communication course you learn all sorts of different skills that help you interact with patients.
Learning these skills is part of learning to be a good doctor.
The various tasks that you will do today are a part of this communication course and
we‟re asking you to imagine you are a medical student as you complete the activities.

146
Appendix C
Script for Consciousness-Raising Component
Research has shown that emotion recognition is a skill that can in fact be improved with
instruction and training.
Today I‟m going to present you with a basic skill set for improving emotion recognition
accuracy. This instruction is short, but we‟ll cover strategies and hints for recognizing emotions
in patient interactions. First, I will cover some general skills that will increase your receptiveness
to these emotion cues. Then I will cover specific verbal and nonverbal cues to some basic
emotions- some things you can look for and listen for when making these judgments. I will cover
five basic emotions that may occur with some frequency in medical interactions: Anger, Sadness,
Anxiety, Confusion, and Happiness. I will also discuss how to detect when one of these emotions
is not present. These are times when the patient is neutral or unemotional.
The information today is based on decades of research on emotion recognition. Some of
this will be new to you. Some of the advice may seem fairly basic or obvious, but together the
hope is that this instruction provides you with some practical and applicable information that you
can use to improve your interactions with patients.
The first step in improving your ability to recognize patient emotions is to create an
environment that is conducive to emotional expression. Create an air of privacy and comfort by
assuring the patient that he or she is free to share with you.
Emotion cues are conveyed both through verbal and nonverbal information. Verbal
information refers to the words the patient chooses, what the patient says. Nonverbal information
refers to the behaviors of the body, facial expressions, gazing and other eye contact, and also
vocal cues such as tone of voice, loudness, and rate of speech.

147
When you‟re trying to detect and identify a patient‟s emotions you must look at both
what they are saying and how they look or behave when saying it.
Sometimes it‟s easy. Sometimes verbal information and nonverbal information occur
together and at a very high intensity. Patients might look sad, sigh, tear up, and confess that
things have been horribly difficult lately.
Sometimes it‟s not quite so easy. A patient may say they are worried or upset in a very
monotone or neutral way. If you weren‟t listening carefully to what they were saying, you‟d miss
what was being conveyed.
The key for verbal emotion cue recognition is listening. Listen when the patient is
talking. Let them talk a few minutes without interruption. Emotion cues can come after long
silences or an extended pause in a narrative, as the patient mentally prepares to share the
emotional content.
Look for key words that convey certain emotions. To indicate sadness, a patient might
say that they are not doing so well, or that they are alone. A sad patient might talk about crying
or tears. A patient who is angry or upset might tell you that you are wrong, or that they disagree
with you. To indicate anxiety, a patient might talk about how a certain diagnosis or set of
symptoms is causing worry. They may talk about or hint about being nervous about something.
A patient who is confused or uncertain might ask questions. A confused patient may talk
about not being sure or not understanding. On the other hand, a patient who is relatively happy
with the care may talk about being fine, not worrying, or having no problems. They may talk
about things being easier or comfortable.
The key for nonverbal emotion cue recognition is looking and listening beyond just the
words. Looking at the patient- Not at a computer, not at a file or notes on a clipboard. Sit at eye

148
level. It is about noticing more than just the words- it‟s about paying attention to nonverbal
behavior.
Even if the patient‟s words are not indicating that they are experiencing an emotion, there
might be cues to the emotion that leak out in the nonverbal behaviors. In fact, the concept of
„nonverbal leakage‟ is an important one for researchers: it means that a person can convey
information about their emotional state that they are unaware of conveying, and this often
happens through nonverbal cues.
There are many different channels where nonverbal cues might lie. The different
channels represent the different places to look for cues. Emotion cues might be recognized
through observation of body movements. These include the patient‟s posture or how they are
sitting in the chair. Are they slouching, fidgeting? Looking at the patient‟s hands, you can
observe different gestures, or touching behaviors. Looking at the face can also provide clues to
the patient‟s emotions. Facial expressions can often convey a patient‟s true feelings in the
absence of any other emotion cues. Looking at the patient‟s eyes can also provide clues. Are they
looking straight at you? Are they gazing away? Lastly, the voice is a very powerful channel for
communicating emotion cue information nonverbally. Is the patient talking fast or slow? Softly
or loudly? High pitch or low pitch?
Look for some key nonverbal behaviors that may convey the specific emotions. An
anxious patient may fidget by moving in their seat, shaking or rubbing their legs, wringing their
hands, or self-touching in some other way. They may have a nervous half-smile. They may shake
their head. Facial clues to anxiety can include wrinkling between the eyebrows (as the eyebrows
are pulled up and together), and more blinking. A sad patient may talk slower and with a lowered
voice. They may sigh. Often they will look down or away. A confused patient might say

149
something that is not a question in a questioning tone. They may look up when speaking as if
searching for an answer or their eyes might squint. They may gesture by putting their palms up
or rubbing their neck. They may have more pauses in their speech. An angry patient may talk
louder and place emphasis on certain words. They may grab their arm or roll their eyes. The
brows may be lowered and drawn together and the lower or upper eyelid might get tense, and the
mouth might be pressed firmly together. A happy patient may talk in a more excited or upbeat
tone. They may have bouncy movements and smile and nod with more frequency. They may
speak with a raised pitch at the end of their statements. Sometimes you can tell the difference
between a polite or masking smile and a smile of real enjoyment by looking to see if there are
little crowsfeet at the outer corner of the eyes; in real enjoyment, the cheeks are likely to rise and
produce those little wrinkles near the eye.
A neutral patient, who at present is not experiencing any of the emotions above, is likely
to look at you while talking. They are probably not gesturing or fidgeting. Their words will not
convey any emotion content or have key words associated with the emotions. They seem to be
stating facts, both in their words and in the way they deliver these words.
As I‟m sure you realize, intensities of both these verbal and nonverbal cues can vary a lot
in real patient interactions, and the verbal and nonverbal cues might convey different
information. Patients might say an emotion cue word in a neutral way, as if they were stating a
fact. Or they might say neutral words but have nonverbal that seem to indicate the presence of an
emotion. The key is to pay attention to both what the patient is saying and doing to look for cues
to the patient‟s emotions.

150
Appendix D
Script for Instruction Component
Let me start out by asking, what do you think is the most common medical procedure?
This procedure occurs every time any physician and any patient come in contact with each other.
In fact, the most common medical procedure is the basic medical interview. An average
physician will conduct 120,000-160,000 interviews during their career. Communication is the
most common medical procedure.
That is why medical education is not complete without interview and communication
skills training. That is why, right from the start of medical school, you‟re learning
communication skills. That is why examinations and practice include interactions with real or
standardized patients. Because effective communication is essential.
It may seem that communication is easy- we communicate with our friends and family,
our colleagues and strangers every day. We have been practicing communication through our
whole lives- since we learned how to talk and even before. But the truth is that although we all
communicate, there are many areas where we can improve our communication skills thereby
improving patient health.
Today I‟m going to talk to you about one such skill. Today I‟m going to talk to you about
the importance of recognizing patients‟ emotions. I‟m going to present for you research and
evidence from actual clinical populations in an attempt to convince you that recognizing patient
emotions is more than just a good thing, but is a critical component in effective patient care and
something that is worth working hard for.
We hear over and over again that patient-centered communication, or a good bedside
manner is important in patient care. As I‟m sure you know, we hear this for a good reason. A

151
well-established link exists between effective empathic communication and both patient
satisfaction and positive health outcomes. Healthy People 2010, a nationwide health promotion
mandate put forth in 2000 by the United States Department of Health and Human Services,
points to the importance of strategically using effective communication to improve patient health
and puts forth a goal to “increase the proportion of persons who report that their healthcare
physicians have satisfactory communication skills” The concept of accurate communication is
listed both within this goal and more broadly as one of the 11 attributes of effective health
communication. This is because accurately recognizing patient emotions is important to
effective, quality communication.
Researchers outside of medicine have known for decades that accurately recognizing
emotions in others is an important life skill. Accuracy of recognizing others‟ emotions is an
aspect of effective communication that is associated with increased social and emotional
competence, better relationship quality, and a whole host of positive psychosocial characteristics,
as shown in dozens of published studies in the psychology and medical literatures.
In other applied settings, this skill can be a powerful tool. A 2007 study in the Journal of
Applied Social Psychology showed that salespersons with increased emotion recognition ability
not only earn higher average salaries but also sell more of their product than those who are less
adept at this skill.
Likewise, a critical component of effective interpersonal communication in the medical
interaction is the ability to detect, identify, and respond to the emotional needs of the patient.
Patient with emotional needs aren‟t rare occurrences. Research has shown that emotional
content occurs in a majority of consultations.

152
Moments within the exchange when a patient presents emotional content to a physician
have been labeled in a variety of ways, as “windows of opportunity”, “clues” , or “empathic
opportunities.” Recently, researchers in this area met and reached consensus, calling these
moments “cues” and defining them as “verbal or nonverbal hints which suggest an underlying
unpleasant emotion and would need clarification from the health provider‟
Sometimes a patient will come out and say when something is bothering them. But often
the cues to patient emotions are more subtle and come in the form of nonverbal behavior. Subtle
nonverbal behaviors of patients are indispensable when a physician is attempting to recognize
emotion cues and understand the patients‟ emotional experience. Nonverbal emotion cues
actually occur more often than verbal cues. Patients with more severe health issues emit more
nonverbal cues to psychological distress than patients without. Patient anxiety is more easily
diagnosed when physicians have access to full video information than from a transcript alone,
indicating that the nonverbal information is an important cue source. Experienced physicians
report that they use nonverbal information from body language and facial expressions to gauge a
patient‟s anxiety and desire for more information.
So why do we need to improve this skill? Well, numerous studies have shown that these
emotion cues are often missed by physicians. A study published in 2000 in the Journal of the
American medical Association showed that across primary care and surgical settings, physicians
missed opportunities to respond to these cues over 70% of the time. Other research has come to
the same conclusion, that almost two thirds of emotion cues are missed or not acknowledged
appropriately by the physician. Failure to notice or address patients‟ emotional needs can lead to
misdiagnosis, incorrect treatments, and poorer health outcomes.

153
In addition, there is evidence that a physician‟s ability to recognize nonverbal emotion
cues is associated with a variety of positive patient outcomes. Two studies in 1979 and 1980
showed that the skill of accurately recognizing emotions was associated with increased patient
satisfaction and compliance. In 2009, these results were replicated in medical students. Medical
students that were more accurate at recognizing emotions were liked more by their patients, had
a better rapport, and had patients that were engaged in the visit.
You might not have ever considered emotion recognition to be a skill. More importantly,
you might not have ever considered emotion recognition to influence patient outcomes. But
accurately recognizing the emotional cues from your patients is one small, yet essential way that
you can really influence and improve patient care.

154
Appendix E
Emotional Sensitivity (ES) Scale from the Social Skills Inventory (SSI)
(Riggio, 1986; Riggio et al., 2001)
Instructions: For each statement, select the answer that best describes you.
Scale: 1 = Not at all true of me to 9 = Very true of me
1. When someone is speaking I spend as much time watching their movements as I do
listening to what they are saying.
2. There are very few people who are as sensitive and understanding as I.
3. At parties, I can instantly tell when someone is interested in me.
4. I am interested in knowing what makes people “tick.”
5. Without fail, I can always tell the character of a person by watching him or her interact
with others.
6. It is nearly impossible for people to hide their true feelings from me—I seem to always
know.
7. I can accurately judge a person‟s character the first time that I meet him or her.
8. One of my greatest pleasures in life is simply being with people.
9. I can instantly spot a “phony” person the moment I meet him or her.
10. I really dislike other people telling me their problems.
11. I sometimes cry at sad movies.
12. I am easily able to touch or hug a distressed person in order to comfort them.
13. I can spend hours just watching other people.
14. People often tell me that I am a sensitive and understanding person.
15. When my friends are angry or upset they seek me out to help calm them down.

155
Appendix F
Mood Scale
Instructions: Please rate how you are feeling right now on the following items.
Scale: 1 = Not at All to 9 = Very
Awkward
Nervous
Angry
Powerless
Happy
Relaxed
Uncomfortable
Tense
Powerful
Dominant
Strong
Cheerful

156
Appendix G
Reactions to the Experiment Questionnaire
Instructions: Please answer the following questions about the tasks you completed today.
Scale: 1 = Strongly Disagree
2 = Somewhat Disagree
3 = Neutral
4 = Somewhat Agree
5 = Strongly Agree
1. I learned something about recognizing emotions today.
2. Recognizing the emotions of others is important.
3. I am good at recognizing the emotions of others.
4. I am confident in my ability to recognize the emotions of others.
5. I found the tasks today to be fairly easy.
6. I wanted to do well on the tasks today.
7. I found the tasks today enjoyable.

157
Appendix H
Demographic Questionnaire
1. What is your age?
2. What is your gender?
o Male
o Female
3. Please indicate your ethnicity:
African American/Black
Native American
Hispanic/Latino(a)
Caucasian/White
Middle Eastern/North African
Asian/Pacific Islander
Multiracial
Other (Please specify) __________________________
4. Please indicate your major _____________________________________
5. If undecided, please list two majors you are considering?
6. Are you considering medical school at any point in the future?
o Definitely no
o Probably no
o Unsure
o Probably yes
o Definitely yes


![Integration of Driver Behavior into Emotion Recognition ... · [2] Unimodal Facial Emotion Recognition. 6 70.2% [3] Unimodal Speech Emotion Recognition 3 88.1% [4] Unimodal Speech](https://static.fdocuments.in/doc/165x107/5f082e657e708231d420be2a/integration-of-driver-behavior-into-emotion-recognition-2-unimodal-facial.jpg)