Towards measuring trade in value-added and other indicators of global value chains: Current OECD...
29
Towards measuring trade in value-added and other indicators of global value chains: Current OECD work using I/O tables Bo Meng (OECD and IDE-JETRO) & Sébastien Miroudot (OECD) Global Forum on Trade Statistics, Geneva, 2-4 February 2011
-
Upload
marilyn-berman -
Category
Documents
-
view
227 -
download
5
Transcript of Towards measuring trade in value-added and other indicators of global value chains: Current OECD...

Towards measuring trade invalue-added and other indicators
of global value chains:Current OECD work using I/O tables
Bo Meng (OECD and IDE-JETRO) & Sébastien Miroudot (OECD)
Global Forum on Trade Statistics, Geneva, 2-4 February 2011

OECD 2
Background
Reduction of transaction costs and changing global demand structures
↓Increasing fragmentation of production, vertical specialisation (VS) trade and new firm strategies
“At least half of the observed increase in world trade can be explained by means of a model of world trade that incorporates
vertical specialisation.”(Yi, 2003)
OECD 3
Fragmentation of production: the example of theBoeing 787 Dreamliner
Source: www.newairplane.com
Escape slides: Air Cruisers (USA)
Horizontal Stabiliser:Alenia Aeronautica (Italy)
Centre fuselage: Alenia Aeronautica (Italy)
Final assembly: BoeingCommercial Airplanes (USA)
Vertical Stabiliser: BoeingCommercial Airplanes (USA)
Landing gear: Messier-Dowti (France)Electric brakes: Messier-Bugatti (France)Tires: Bridgestone Tires (Japan)
Doors & windows:Zodiac Aerospace (USA)PPG Aerospace (USA)
Tools/Software: Dassault Systemes (France)Navigation: Honeywell (USA)Pilot control system: Rockwell Colins (USA)Wiring: Safran (France)
Centre wing box:Fuji Heavy Industries (Japan)
Engines: GE Engines (USA),Rolls Royce (UK)
Wing box: Mitsubishi Heavy Industries (Japan)Wing ice protection: GKN Aerospace (UK)
Engine nacelles: Goodrich (USA)Aux. power unit: HamiltonSundstrand (USA)
Flight deck seats:Ipeco (UK)
Lavatories:Jamco (Japan)
Cargo doors: Saab (Sweden)
Forward fuselage:Kawasaki Heavy Industries (Japan)Spirit Aerosystems (USA)
Raked wing tips: Korean AirlinesAerospace division (Korea)
Flight deck controls:Esterline (USA),Moog (USA)
Passenger doors:Latécoère Aéroservices (France)
Prepreg composites:Toray (Japan)
Rear fuselage:Boeing South Carolina (USA)
OECD 4
Policy concerns
• Traditional international trade statistics do not adequately describe current trade flows nor allow full understanding of the nature and impact of economic globalisation whether in terms of income or employment.
• When a good (or service) crosses borders several times at different stages of processing, conventional trade statistics record each time the full value of the good, including embodied (imported) intermediate inputs.
– Leads to “multiple-counting”
– Tends to hide actual patterns of trade among countries as the economy producing the final good seems to export the whole value when in reality it may have only marginally contributed to this value.
• What can we do?
– New indicators to assess the impact of vertical specialisation on trade and to understand international production networks.
– Measuring the value-added content of trade and calculating the contribution of each economy to the global value chain.
OECD 5
Measuring trade in value-added: policy implications
• A new perspective on trade can change the way we deal with the following issues:
– Trade imbalances: reallocation of bilateral trade deficits and surplus across partner countries
– Trade disputes: who are “them” and “us” once domestic value-added in foreign products has been accounted for?
– Trade and macro-economic shocks: size of the 2008-2009 trade collapse and transmission of the crisis through trade channels.
– Trade and employment: where are jobs created and lost in global value chains?
– Trade and environment: impact of trade on greenhouse gas emissions.
• Trade in gross and value-added terms: two complementary approaches.
– Gross flows: global imbalances, expenditures (consumers’ perspective), link to monetary aspects.
– Value-added flows: bilateral imbalances, global value chains (producers’ perspective), factor content of trade.
OECD 6
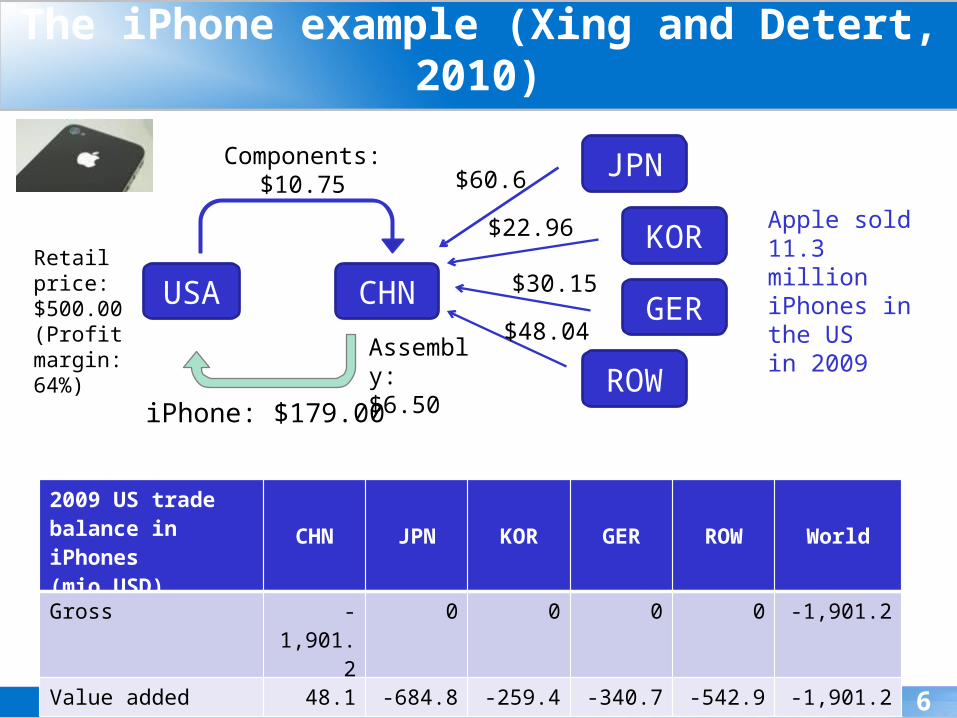
USA CHN
iPhone: $179.00
Assembly: $6.50
2009 US trade balance in iPhones(mio USD)
CHN JPN KOR GER ROW World
Gross -1,901.2 0 0 0 0 -1,901.2
Value added 48.1 -684.8 -259.4 -340.7 -542.9 -1,901.2
Components: $10.75
The iPhone example (Xing and Detert, 2010)
JPN
KOR
GER
ROW
$60.6
$22.96
$30.15
$48.04
Apple sold 11.3 million iPhones in the USin 2009
Retail price: $500.00(Profit margin: 64%)
OECD 7
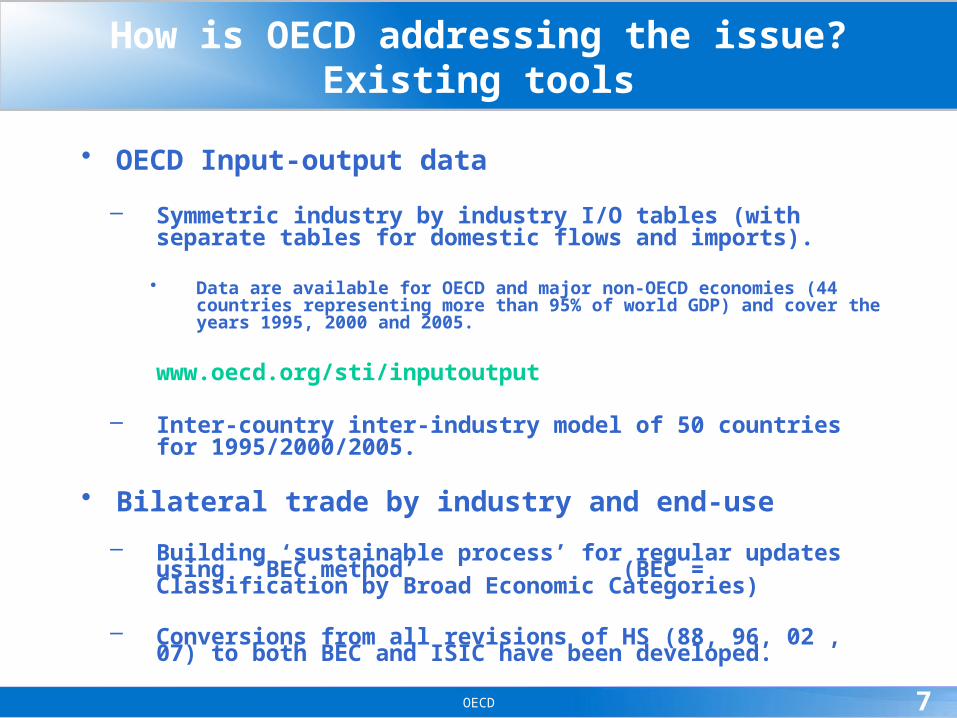
How is OECD addressing the issue?Existing tools
• OECD Input-output data
– Symmetric industry by industry I/O tables (with separate tables for domestic flows and imports).
• Data are available for OECD and major non-OECD economies (44 countries representing more than 95% of world GDP) and cover the years 1995, 2000 and 2005.
www.oecd.org/sti/inputoutput
– Inter-country inter-industry model of 50 countries for 1995/2000/2005.
• Bilateral trade by industry and end-use
– Building ‘sustainable process’ for regular updates using ‘BEC method’ (BEC = Classification by Broad Economic Categories)
– Conversions from all revisions of HS (88, 96, 02 , 07) to both BEC and ISIC have been developed.

OECD 8
Case studies
1) How does a country join GVCs? Looking at 3 factors.
Structural decomposition analysis of vertical specialisation
2) Is a single country-based framework effective?
International I-O based fragmentation indicator
3) Where and by which route value added is induced?
Spillover effect analysis using international I-O table
OECD 9
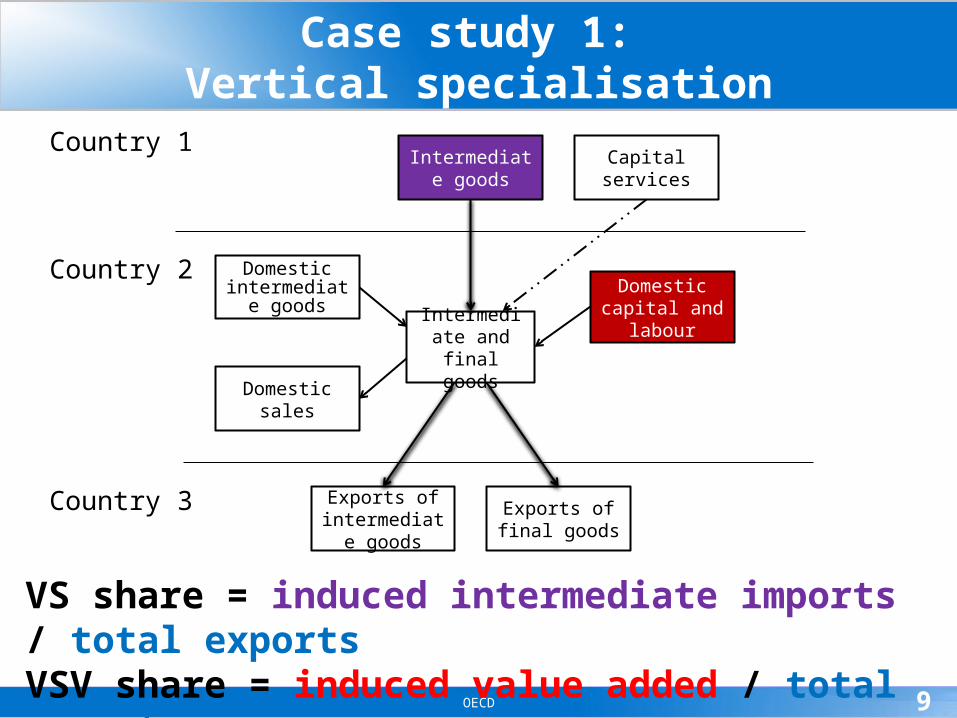
Case study 1: Vertical specialisation
VS share = induced intermediate imports / total exportsVSV share = induced value added / total exports
Country 1
Country 2
Country 3
Domestic intermediate
goods
Domestic sales
Capitalservices
Intermediate and final
goods
Exports of intermediate
goods
Exports of final goods
Domestic capital and
labour
Intermediate goods

OECD 10
Case study 1: Vertical specialisation
VS share = induced intermediate imports / total exportsVSV share = induced value added / total exports
Country 1
Country 2
Country 3
Domestic intermediate
goods
Domestic sales
Capitalservices
Intermediate and final
goods
Exports of intermediate
goods
Exports of final goods
Domestic capital and
labour
Intermediate goods

OECD 11
Case study 1: Vertical specialisation
VS share = induced intermediate imports / total exportsVSV share = induced value added / total exports
Country 1
Country 2
Country 3
Domestic intermediate
goods
Domestic sales
Capitalservices
Intermediate and final
goods
Exports of intermediate
goods
Exports of final goods
Domestic capital and
labour
Intermediate goods
OECD 12
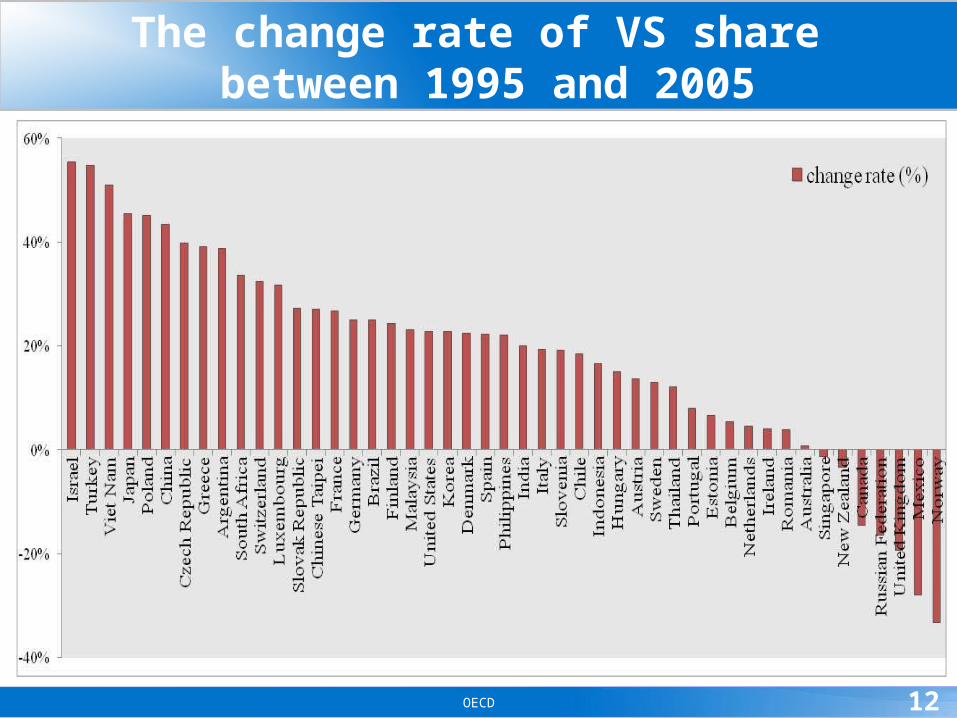
The change rate of VS share between 1995 and 2005

OECD 13
Structural decomposition analysis on vertical specialisation indicator
I-O based decomposition technique =>
∆VS share = f (∆m, ∆B, ∆e)
∆VSV share = f (∆v, ∆B, ∆e)
m: import dependency, B: domestic inter-industrial production system, e: export structure,v: primary input dependency (value added ratio).
OECD 14
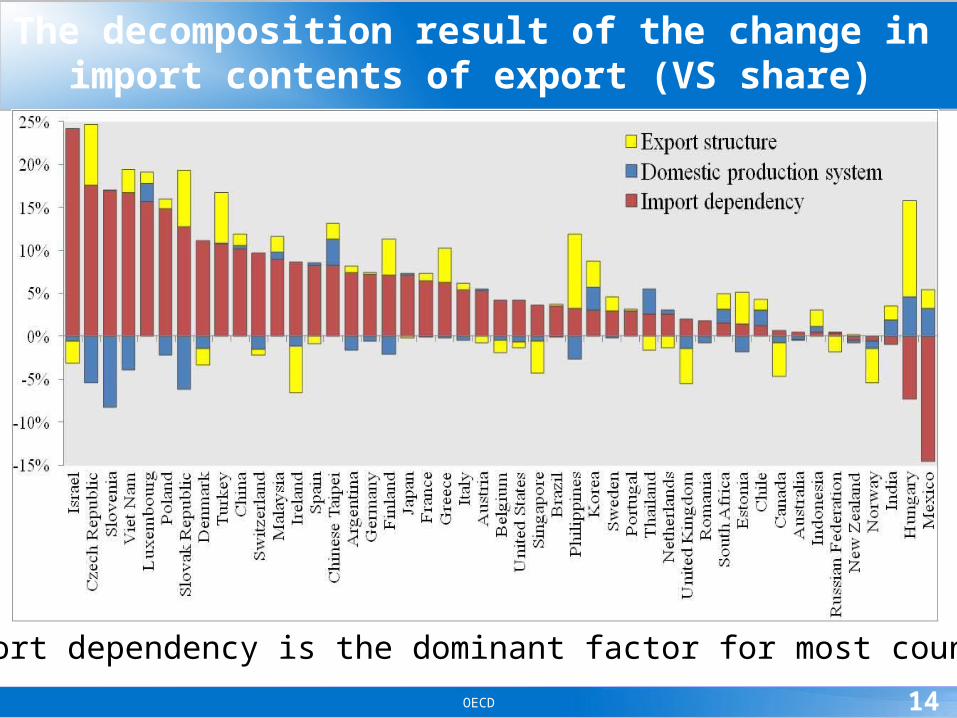
The decomposition result of the change in import contents of export (VS share)
Import dependency is the dominant factor for most countries

OECD 15
The decomposition result of the change in import contents of export (VS share)
Import dependency is the dominant factor for most countries

OECD 16
The decomposition result of the change in induced value added by export (VSV share)
Induced valued added of unit export has decreased for most countries

OECD 17
Value added induced by export grew much faster than value added itself, although value added induced by one unit export has decreased between 1995 and 2005.
Tur
key
Ital
yP
ortu
gal
Uni
ted
Stat
esU
nite
d K
ingd
omF
ranc
eB
elgi
umN
ethe
rlan
dsG
reec
eSw
itzer
land
Fin
land
Slov
enia
New
Zea
land
Mex
ico
Est
onia
Swed
enSo
uth
Afr
ica
Aus
tral
iaSp
ain
Den
mar
kJa
pan
Can
ada
Hun
gary
Phi
lippi
nes
Slov
ak R
epub
licIn
done
sia
Mal
aysi
aG
erm
any
Lux
embo
urg
Aus
tria
Nor
way
Irel
and
Cze
ch R
epub
licK
orea
Chi
leT
haila
ndIn
dia
Isra
elR
ussi
an F
eder
atio
nSi
ngap
ore
Pol
and
Bra
zil
Arg
entin
aV
iet N
amC
hina
0%
50%
100%
150%
200%
250%
300%
the real growth rate of value added
the real growth rate of VSV (real value added induced by export)

OECD 18
Value added induced by export grew much faster than value added itself, although value added induced by one unit export has decreased between 1995 and 2005.
Tur
key
Ital
yP
ortu
gal
Uni
ted
Stat
esU
nite
d K
ingd
omF
ranc
eB
elgi
umN
ethe
rlan
dsG
reec
eSw
itzer
land
Fin
land
Slov
enia
New
Zea
land
Mex
ico
Est
onia
Swed
enSo
uth
Afr
ica
Aus
tral
iaSp
ain
Den
mar
kJa
pan
Can
ada
Hun
gary
Phi
lippi
nes
Slov
ak R
epub
licIn
done
sia
Mal
aysi
aG
erm
any
Lux
embo
urg
Aus
tria
Nor
way
Irel
and
Cze
ch R
epub
licK
orea
Chi
leT
haila
ndIn
dia
Isra
elR
ussi
an F
eder
atio
nSi
ngap
ore
Pol
and
Bra
zil
Arg
entin
aV
iet N
amC
hina
0%
50%
100%
150%
200%
250%
300%
the real growth rate of value added
the real growth rate of VSV (real value added induced by export)
OECD 19
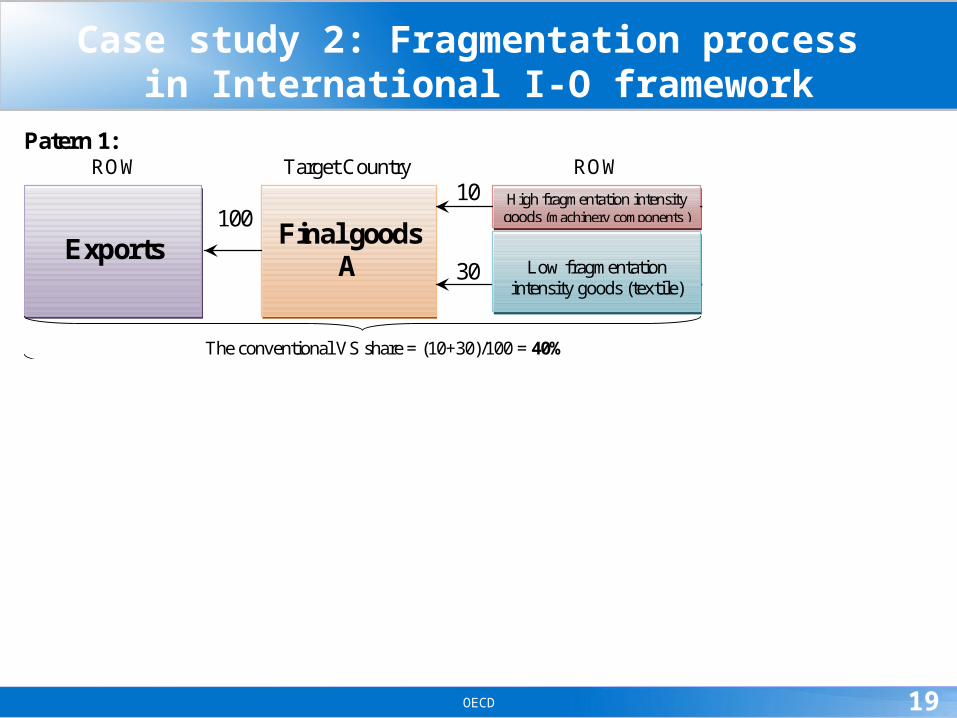
Patern 1:
ROW Target Country ROW World 10 5 100 30 3 The conventional VS share = (10+30)/100 = 40%
Total fragmentation chain index = (10+30+5+3)/100 = 48%
Patern 2:
ROW Target Country ROW World 30 15 100 10 1 The conventional VS share = (30+10)/100 = 40%
Total fragmentation chain index = (30+10+15+1)/100 = 56%
Exports
Final goods
A
High fragmentation intensity goods (machinery components )
Low fragmentation intensity goods (textile)
Exports
Final goods
B
Intermediate imports
Intermediate imports
Low fragmentation
intensity goods (textile)
High fragmentation intensity goods (machinery components )
Low fragmentation intensity goods (textile)
Case study 2: Fragmentation process in International I-O framework

OECD 20
Patern 1:
ROW Target Country ROW World 10 5 100 30 3 The conventional VS share = (10+30)/100 = 40%
Total fragmentation chain index = (10+30+5+3)/100 = 48%
Patern 2:
ROW Target Country ROW World 30 15 100 10 1 The conventional VS share = (30+10)/100 = 40%
Total fragmentation chain index = (30+10+15+1)/100 = 56%
Exports
Final goods
A
High fragmentation intensity goods (machinery components )
Low fragmentation intensity goods (textile)
Exports
Final goods
B
Intermediate imports
Intermediate imports
Low fragmentation
intensity goods (textile)
High fragmentation intensity goods (machinery components )
Low fragmentation intensity goods (textile)
Case study 2: Fragmentation process in International I-O framework

OECD 21
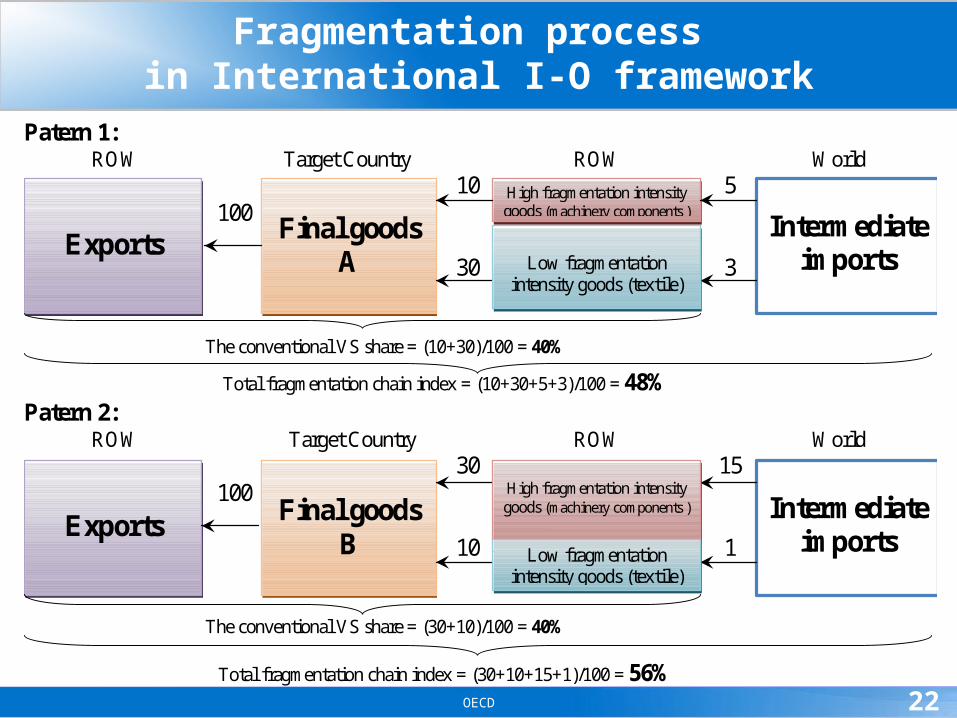
Patern 1:
ROW Target Country ROW World 10 5 100 30 3 The conventional VS share = (10+30)/100 = 40%
Total fragmentation chain index = (10+30+5+3)/100 = 48%
Patern 2:
ROW Target Country ROW World 30 15 100 10 1 The conventional VS share = (30+10)/100 = 40%
Total fragmentation chain index = (30+10+15+1)/100 = 56%
Exports
Final goods
A
High fragmentation intensity goods (machinery components )
Low fragmentation intensity goods (textile)
Exports
Final goods
B
Intermediate imports
Intermediate imports
Low fragmentation
intensity goods (textile)
High fragmentation intensity goods (machinery components )
Low fragmentation intensity goods (textile)
Case study 2: Fragmentation process in International I-O framework
OECD 22
Patern 1:
ROW Target Country ROW World 10 5 100 30 3 The conventional VS share = (10+30)/100 = 40%
Total fragmentation chain index = (10+30+5+3)/100 = 48%
Patern 2:
ROW Target Country ROW World 30 15 100 10 1 The conventional VS share = (30+10)/100 = 40%
Total fragmentation chain index = (30+10+15+1)/100 = 56%
Exports
Final goods
A
High fragmentation intensity goods (machinery components )
Low fragmentation intensity goods (textile)
Exports
Final goods
B
Intermediate imports
Intermediate imports
Low fragmentation
intensity goods (textile)
High fragmentation intensity goods (machinery components )
Low fragmentation intensity goods (textile)
Fragmentation process in International I-O framework

OECD 23
Decomposition of fragmentation process
Applying I-O based decomposition technique to the fragmentation measure:
Total Fragmentation degree = VS + IDF
VS: Conventional Vertical Specialisation indicator
IDF: Indirect Fragmentation Indicator (IDF)

OECD 24
Asian fragmentation index (1995/2005)
0
0.1
0.2
0.3
0.4
0.5
0.6
0.7
0.8
0.9
1
95 05 95 05 95 05 95 05 95 05 95 05 95 05 95 05 95 05 95 05 95 05 95 05
Singapore Malaysia Philippines Thailand Chinese Taipei
Korea China Indonesia New Zealand Australia Japan India
IDF VS
(1.0 = Goods and Services exported as final expenditure)
OECD 25
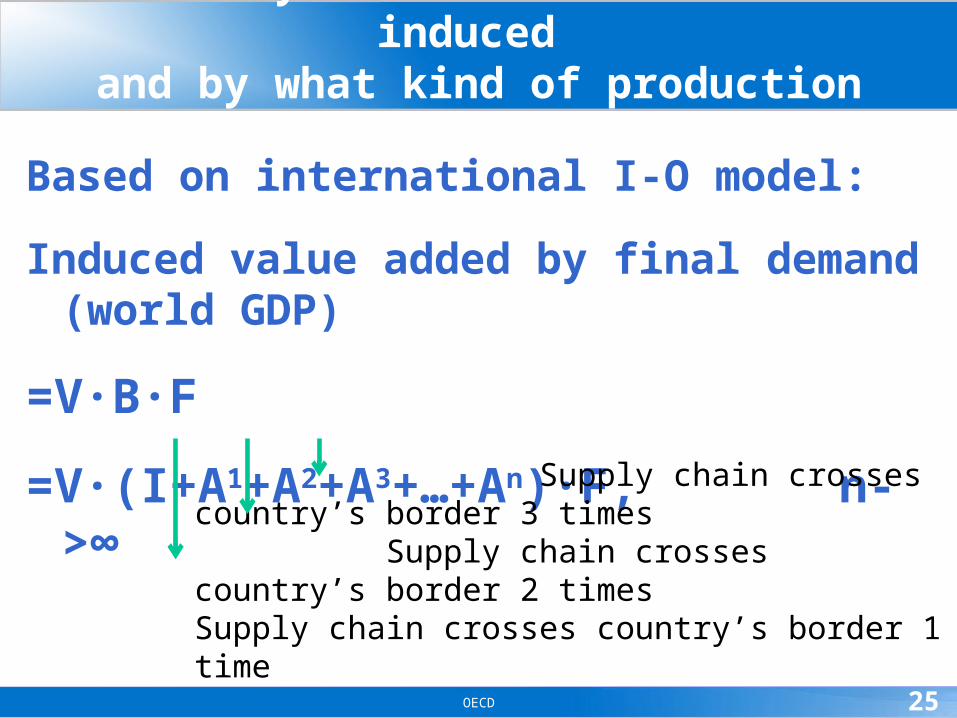
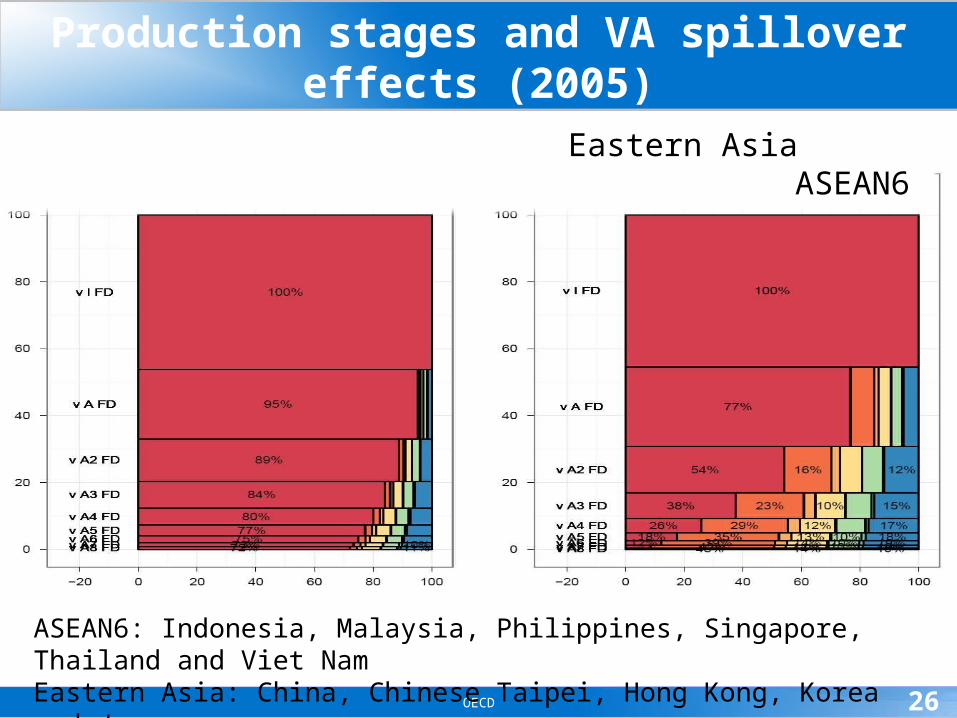
Case study 3: Where value added is induced and by what kind of production chain?
Based on international I-O model:
Induced value added by final demand (world GDP)
=V∙B∙F
=V (I+A∙ 1+A2+A3+…+An) F, n->∙ ∞ Supply chain crosses country’s border 3 times Supply chain crosses country’s border 2 timesSupply chain crosses country’s border 1 time
OECD 26
ASEAN6: Indonesia, Malaysia, Philippines, Singapore, Thailand and Viet NamEastern Asia: China, Chinese Taipei, Hong Kong, Korea and Japan
Production stages and VA spillover effects (2005)
Eastern Asia ASEAN6

OECD 27
How is OECD addressing the issue?New work planned
2011-2012 project to measure trade in value-added:
– 1st step: Document on concepts, methodologies and challenges.
– Major challenge is presenting results that can be easily understood and interpreted by non-practitioners of I/O modelling.
– Co-operation with other organisations and projects – share ideas and compare results, minimise duplication of efforts.
OECD 28
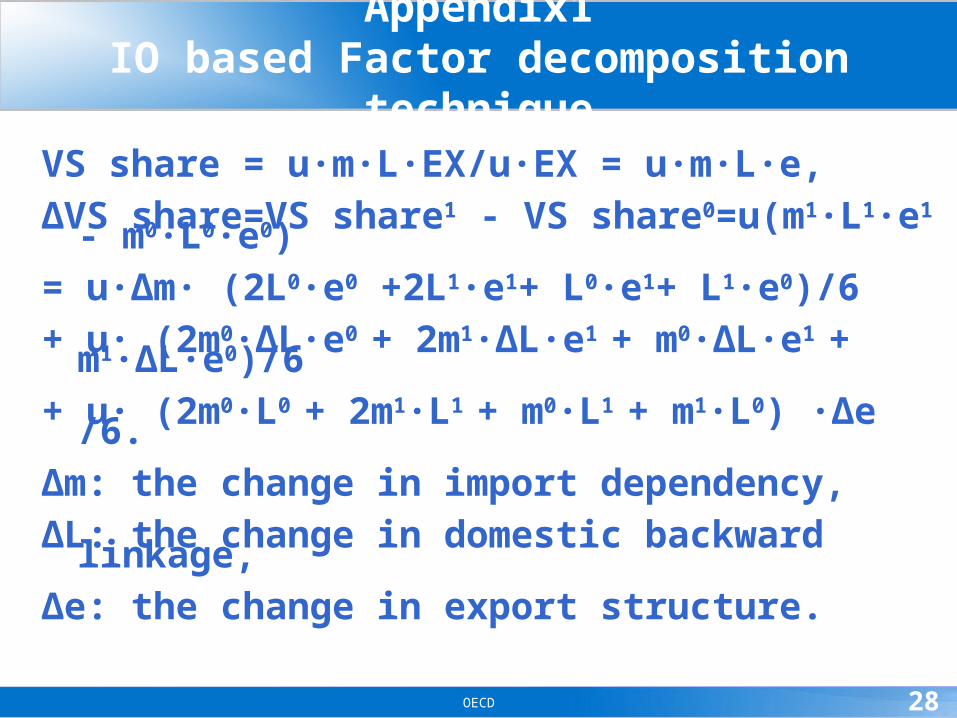
Appendix1IO based Factor decomposition technique
VS share = u m L EX/u EX = u m L e,∙ ∙ ∙ ∙ ∙ ∙ ∙∆VS share=VS share1 - VS share0=u(m1 L∙ 1 e∙ 1 - m0 L∙ 0 e∙ 0) = u ∆m (2L∙ ∙ 0 e∙ 0 +2L1 e∙ 1+ L0 e∙ 1+ L1 e∙ 0)/6 + u (2m∙ 0 ∆L e∙ ∙ 0 + 2m1 ∆L e∙ ∙ 1 + m0 ∆L e∙ ∙ 1 + m1 ∆L e∙ ∙ 0)/6+ u (2m∙ 0 L∙ 0 + 2m1 L∙ 1 + m0 L∙ 1 + m1 L∙ 0) ∆e /6.∙∆m: the change in import dependency, ∆L: the change in domestic backward linkage, ∆e: the change in export structure.

OECD 29
Appendix 2Decomposition of fragmentation process
Total intermediate trade (3-country international I-O model):A X=A (I-A)-1 F= A B F
Trade induced by country 1’s exports of final goods(EX1fd):
Ф1: VS based on single I-O table Ф2: Indirect Fragmentation (IDF) indexФ1 + Ф2: Total Fragmentation(TF) indexФ3: induced intra-country transaction
𝑢∙𝐴∙(I−A)−1 ∙EXfd1
= 𝑢൭ 0 0 0A21 0 0A31 0 0൱∙B∙൭EXfd100 ൱+u൭0 A12 A130 0 A230 A32 0 ൱∙B∙൭EXfd100 ൱+u൭A11 0 00 A22 00 0 A33൱∙B∙൭EXfd100 ൱
= Φ1 +Φ2 +Φ3