Towards high-available and energy-efficient virtual computing environments in the cloud
14
Future Generation Computer Systems 40 (2014) 30–43 Contents lists available at ScienceDirect Future Generation Computer Systems journal homepage: www.elsevier.com/locate/fgcs Towards high-available and energy-efficient virtual computing environments in the cloud Altino M. Sampaio a , Jorge G. Barbosa b,∗ a Instituto Politécnico do Porto, Escola Superior de Tecnologia e Gestão de Felgueiras, CIICESI, Felgueiras, Portugal b Universidade do Porto, Faculdade de Engenharia, Departamento de Engenharia Informática, LIACC, Porto, Portugal highlights • A review of failure-aware algorithms for resource provisioning on clouds. • The development of power- and failure-aware cloud scheduling algorithms that implement vertical and horizontal platform elasticity. • Autonomous readjustment of virtual-to-physical mappings on-the-fly. • Extensive evaluation of the dynamic strategy and of the scheduling algorithms. • Random workloads and workloads that follow the Google cloud tracelogs. article info Article history: Received 1 August 2013 Received in revised form 25 June 2014 Accepted 27 June 2014 Available online 7 July 2014 Keywords: Scheduling Energy-efficiency Consolidation Proactive fault-tolerance Platform elasticity abstract Empowered by virtualisation technology, cloud infrastructures enable the construction of flexible and elastic computing environments, providing an opportunity for energy and resource cost optimisation while enhancing system availability and achieving high performance. A crucial requirement for effective consolidation is the ability to efficiently utilise system resources for high-availability computing and energy-efficiency optimisation to reduce operational costs and carbon footprints in the environment. Additionally, failures in highly networked computing systems can negatively impact system performance substantially, prohibiting the system from achieving its initial objectives. In this paper, we propose algorithms to dynamically construct and readjust virtual clusters to enable the execution of users’ jobs. Allied with an energy optimising mechanism to detect and mitigate energy inefficiencies, our decision- making algorithms leverage virtualisation tools to provide proactive fault-tolerance and energy-efficiency to virtual clusters. We conducted simulations by injecting random synthetic jobs and jobs using the latest version of the Google cloud tracelogs. The results indicate that our strategy improves the work per Joule ratio by approximately 12.9% and the working efficiency by almost 15.9% compared with other state-of- the-art algorithms. © 2014 Elsevier B.V. All rights reserved. 1. Introduction Cloud computing is a specialised distributed-computing para- digm that has recently gained popularity as a resource platform for on-demand, high-availability, and high-scalability access to re- sources. Cloud computing represents a new type of computational model, providing better use of distributed resources, while offer- ing dynamic, flexible infrastructures and quality of service (QoS). From a hardware point of view, users have the illusion of infinite computing resources that are available on demand [1,2]. ∗ Corresponding author. Tel.: +351 220 413 279. E-mail addresses: [email protected] (A.M. Sampaio), [email protected] (J.G. Barbosa). A cloud computing model exploits virtualisation [3] to ren- der vertical and horizontal scalability, interoperability, failover, load balancing, improved system manageability, and reduction of infrastructure operational costs through resource consolidation. Virtual machine (VM) technologies provide flexible and scalable system services to cloud computing systems, creating a power- ful computing environment where virtualised resources can be dynamically allocated, expanded, reduced, or moved as demand varies. With the development of virtualisation tools such as KVM, Xen, and VMware, new capabilities are introduced, such as VM live migration, VM checkpoint/restart, and VM pause/unpause, while the performance overhead for applications is maintained within an acceptable range [3,4]. As cloud computing follows a utility model of consumption, users contract computing power based on their expected needs. http://dx.doi.org/10.1016/j.future.2014.06.008 0167-739X/© 2014 Elsevier B.V. All rights reserved.
Transcript of Towards high-available and energy-efficient virtual computing environments in the cloud

Future Generation Computer Systems 40 (2014) 30–43
Contents lists available at ScienceDirect
Future Generation Computer Systems
journal homepage: www.elsevier.com/locate/fgcs
Towards high-available and energy-efficient virtual computingenvironments in the cloudAltino M. Sampaio a, Jorge G. Barbosa b,∗
a Instituto Politécnico do Porto, Escola Superior de Tecnologia e Gestão de Felgueiras, CIICESI, Felgueiras, Portugalb Universidade do Porto, Faculdade de Engenharia, Departamento de Engenharia Informática, LIACC, Porto, Portugal
h i g h l i g h t s
• A review of failure-aware algorithms for resource provisioning on clouds.• The development of power- and failure-aware cloud scheduling algorithms that implement vertical and horizontal platform elasticity.• Autonomous readjustment of virtual-to-physical mappings on-the-fly.• Extensive evaluation of the dynamic strategy and of the scheduling algorithms.• Random workloads and workloads that follow the Google cloud tracelogs.
a r t i c l e i n f o
Article history:Received 1 August 2013Received in revised form25 June 2014Accepted 27 June 2014Available online 7 July 2014
Keywords:SchedulingEnergy-efficiencyConsolidationProactive fault-tolerancePlatform elasticity
a b s t r a c t
Empowered by virtualisation technology, cloud infrastructures enable the construction of flexible andelastic computing environments, providing an opportunity for energy and resource cost optimisationwhile enhancing system availability and achieving high performance. A crucial requirement for effectiveconsolidation is the ability to efficiently utilise system resources for high-availability computing andenergy-efficiency optimisation to reduce operational costs and carbon footprints in the environment.Additionally, failures in highly networked computing systems can negatively impact system performancesubstantially, prohibiting the system from achieving its initial objectives. In this paper, we proposealgorithms to dynamically construct and readjust virtual clusters to enable the execution of users’ jobs.Allied with an energy optimising mechanism to detect and mitigate energy inefficiencies, our decision-making algorithms leverage virtualisation tools to provide proactive fault-tolerance and energy-efficiencyto virtual clusters. We conducted simulations by injecting random synthetic jobs and jobs using the latestversion of the Google cloud tracelogs. The results indicate that our strategy improves the work per Jouleratio by approximately 12.9% and the working efficiency by almost 15.9% compared with other state-of-the-art algorithms.
© 2014 Elsevier B.V. All rights reserved.
1. Introduction
Cloud computing is a specialised distributed-computing para-digm that has recently gained popularity as a resource platformfor on-demand, high-availability, and high-scalability access to re-sources. Cloud computing represents a new type of computationalmodel, providing better use of distributed resources, while offer-ing dynamic, flexible infrastructures and quality of service (QoS).From a hardware point of view, users have the illusion of infinitecomputing resources that are available on demand [1,2].
∗ Corresponding author. Tel.: +351 220 413 279.E-mail addresses: [email protected] (A.M. Sampaio), [email protected]
(J.G. Barbosa).
http://dx.doi.org/10.1016/j.future.2014.06.0080167-739X/© 2014 Elsevier B.V. All rights reserved.
A cloud computing model exploits virtualisation [3] to ren-der vertical and horizontal scalability, interoperability, failover,load balancing, improved system manageability, and reduction ofinfrastructure operational costs through resource consolidation.Virtual machine (VM) technologies provide flexible and scalablesystem services to cloud computing systems, creating a power-ful computing environment where virtualised resources can bedynamically allocated, expanded, reduced, or moved as demandvaries. With the development of virtualisation tools such as KVM,Xen, and VMware, new capabilities are introduced, such as VM livemigration, VM checkpoint/restart, and VM pause/unpause, whilethe performance overhead for applications is maintained withinan acceptable range [3,4].
As cloud computing follows a utility model of consumption,users contract computing power based on their expected needs.

A.M. Sampaio, J.G. Barbosa / Future Generation Computer Systems 40 (2014) 30–43 31
However, not all users request the contracted computing powerfor the entire period of the contract. Meisner et al. [5] showed thatmuch of the energy used in a data centre is wasted on idle systems,and, in typical deployments, server utilisation is below 30%. As en-ergy costs are becoming amore significant factor in the operationalcosts of modern businesses, it is a natural consequence that energyconsumption enters into the service cost equation to provide per-formance at reasonable prices. Rather than ensuring absolute per-formance at any cost, the focus is to maintain high service-levelperformance [6]. In this study, we measured the service perfor-mance by the success rate of job completion by the deadline. Theservice-level agreement (SLA), or contract, is defined for each jobby specifying a deadline guaranteed by the system.
Node failures are a characteristic of a distributed system thatcan have thousands of nodes running a variety of different jobs.Fu [7] reported that a node’s mean time between failures (MTBF)is 1.25 h in a petaflop system. In this paper, we propose a two-step strategy, composed of a cloud manager and a cloud sched-uler, to construct and dynamically manage energy-efficient virtualclusters to execute sets of independent tasks in which computingresources are affected by failures. To improve the availability of vir-tual clusters and maximise the rate of completed jobs, we apply aproactive failure tolerance technique. We consider the problem ofdynamically mapping tasks, running on virtual machines, to phys-ical machines (PMs) in a power- and failure-aware manner. Thesevirtual-to-physical resource-mapping decisions must consider theperformance status, power efficiency, and reliability levels of thecomputing nodes. The optimisation decision includes selecting theCPU capacity necessary to accomplish the tasks within their re-spective deadlines, considering the predicted MTBF of each nodeand the migration overhead of the VMs.
By ensuring that tasks are completed by their deadlines, we aresatisfying the SLA imposed on each job. However, we also considerthat an SLA violation may occur, and, therefore, the SLA should in-clude a penalty to the service provider for those occurrences, asproposed in [6].
Our optimisation strategy also enables the infrastructure to re-act to energy inefficiencies by continuouslymonitoring power con-sumption. Our approach is adequate to implement scalable andelastic service platforms on demand because of its dynamic charac-teristic. Additionally, it adapts to and reduces stop times in main-tenance operations. In such situations, the administrators shouldonly specify the PMs and their maintenance operation times. Ourproposed strategies enable the autonomous rescheduling of thetasks currently running to complete the submitted users’ jobs inan energy-efficient manner.
The main contributions of this paper are:1. a review of failure-aware algorithms for resource provisioning
of cloud infrastructures;2. the development of power- and failure-aware cloud schedul-
ing algorithms that implement vertical and horizontal platformelasticity;
3. the development of a dynamic scheduling strategy to providepower- and failure-aware virtual clusters that reactively de-tect energy optimising opportunities andperformconsolidationto reduce energy consumption while maintaining service-levelperformance;
4. an extensive evaluation of the dynamic strategy and thescheduling algorithmswith randomly generatedworkloads andwith workloads that follow the latest version of the Googlecloud tracelogs; and
5. a dynamic configuration of the CPUportion assigned to eachVMthat reduces the consumed energy and maintains the service-level performance.The scheduling algorithms proposed in this study are improved
versions of our previous work [8]. Additionally, we introduce anextended evaluation using randomly generated workloads and re-alistic workloads based on the recent Google cloud tracelogs [9].
The remainder of this paper is organised as follows. Section 2introduces and discusses the related work based on dynamicplacement and provisioning of VMs. Section 3 presents the archi-tecture of our controller to enable a power- and failure-aware dy-namic mapping of VMs to PMs, formulates the VM placement andprovisioning problems, and introduces the proposed algorithms.Section 4 introduces the metrics used to evaluate the performanceof the algorithms and describes the workloads and failure charac-teristics used in the simulations. Section 5 presents the results anddiscusses the performance of the proposed algorithms. Section 6presents the conclusions of our current research and introduces fu-ture research directions.
2. Related work
This paper presents an approach for the dynamic schedulingof virtual machines in clusters, considering both optimisation ofenergy efficiency and physical-node reliability to provide energy-efficient and highly available computing environments. Below, wediscuss relevant work in the literature related to similar issues.
The work by Xu and Fortes focused on initial [10] and dynamic[11] mapping of VMs to physical resources. The objectives inboth studies were to simultaneously minimise costs due to totalresource wastage, power consumption, and thermal dissipation.The first publication, on initialmapping, proposed an improved ge-netic algorithmwith fuzzymulti-objective evaluation to efficientlysearch the large solution space and conveniently combine the con-flicting objectives. The second publication concentrated on thedynamic placement of the VMs, where the authors aimed to op-timise a multi-objective utility function that aggregates the threeobjectives in a weighted sum. The authors also defined thresh-old values and observation window sizes for condition detec-tion and the stabilisation of the computing infrastructure. ThePADD scheme [12] minimised energy consumption while satis-fying service-level agreement (SLA) requirements. The authors’scheme dynamically migrated the VMs onto fewer PMs during pe-riods of low utilisation and then expanded them onto more nodesif the need arose. The proposed algorithm aimed to minimise thetotal energy while meeting a given performance requirement andis based on the free CPU capacity thresholds of the nodes. It alsouses a buffering technique to implement safety margins, thus re-serving capacity to addressworkload demand fluctuations. The SLAspecifies howmuch of a demandmust be processed within a giventime limit. SLA violations can occur because the PADD scheme isbest-effort-based. Lee and Zomaya [13] proposed two consolida-tion task heuristics that maximise resource utilisation and explic-itly take into account both active and idle energy consumption.The heuristics assign each task to the resource for which the en-ergy consumption for executing the task is minimised without anyperformance degradation. Beloglazov et al. [6] proposed a modi-fied best-fit algorithm for energy-aware resource provisioning indata centres while continuing to deliver the negotiated SLA. Theperformance is measured by the percentage of SLA violations thatoccurred. Unlike our work, none of the cited studies addressed theproblem of scheduling with respect to energy efficiency and fail-ure occurrence. However, the last study described above is used asa comparison baseline, where no failure-aware mechanism is im-plemented and the VM re-initiates when there is a failure. This isreferred to as the common best-fit (CBFIT) algorithm in our resultssection and is further described in Section 3.6.
Fault-tolerant scheduling has been extensively studied inthe literature regarding real-time systems, such as in Al-Omariet al. [14] andZhu et al. [15],where fault tolerance is achievedusinga primary backup technique that consists of scheduling the sametask in two different processors; therefore, a failure can be toler-ated, and the task is still able to execute before its deadline. This
32 A.M. Sampaio, J.G. Barbosa / Future Generation Computer Systems 40 (2014) 30–43
technique privileges processing time without considering the en-ergy consumed, and therefore, it is not considered here in moredetail.
Various other studies have addressed the issue of computingenvironment availability and reliability, targeting SLA fulfilment.For example, Feller et al. built Snooze [16], a scalable, fault-tolerant,and distributed consolidationmanager for heterogeneous clusters.The goal of Snooze is to dynamically consolidate the workload ofthe underlying heterogeneous software and hardware cluster ar-rangement,which is composedof a combination of both virtual andnon-virtual machines. The approach divides the problem into twoparts, namely, consolidation and idle-time management, and for-mulates the mapping of the workload to the PMs as an instance ofa one-dimensional bin-packing problem (CPU) in which the PMsrepresent the bins and the workload represents the items to bepacked. To solve this problem, the authors used heuristic algo-rithms with relaxed constraints that take into account the migra-tion of the VMs. Additionally, they used the replication techniqueto achieve fault-tolerance, which increases the consumed energyto complete the same set of jobs. Loveland et al. [17] combineddifferent virtualisation technologies to provide high-availability(HA) configurations based on redundancy (such as active/activeand active/passive) while minimising costs. Nagarajan et al. [18]performed the first comprehensive study of proactive fault toler-ance (FT) using VM migration mechanisms. The authors appliedXen to migrate an MPI task from a health-deteriorating node to ahealthy node. Their solution integrates an intelligent performancemonitoring interface (IPMI) for health enquiries (migrations arethreshold-activated) with Ganglia, which determines node targetsfor migration based on load averages. Each node in the cluster runsa daemon that monitors resource usage and then multicasts thatinformation to all the other nodes. Thus, all the nodes have an ap-proximate view of usage throughout the entire cluster. The proac-tive FT daemon selects the target node for migration as the nodethat does not yet host a guest virtual machine and has the lowestCPU usage. The FT daemon provides three features, i.e., (i) healthmonitoring, (ii) decision making, and (iii) load balancing. In thecase of a node failurewithout prior health deterioration symptoms,the system automatically reverts to the reactive fault tolerance ap-proach, i.e., by restarting from the last checkpoint. The combina-tion of proactive and reactive mechanisms decreases the cost ofreactive fault tolerance by lowering the checkpoint frequency. TheVgrADS project [19] provides a virtual grid execution system thatprovides uniform qualitative resource abstraction of aggregate re-sources from disparate sources under different policies, such asgrids and clouds. The authors applied virtual grid execution forscheduling sets of deadline-sensitive weather forecasting work-flows, balancing performance, reliability, and cost. Fault toleranceis achieved through the replication of task execution. The systemworks by first applying a rank value to each workflow job and thenscheduling the jobs based on their rank priorities. Fu [7] inves-tigated and proposed failure-aware node selection strategies forthe construction and reconfiguration of virtual clusters to enhancesystem availability, achieving high performance. His approachleverages proactive failure management techniques, based on VMmigrations, and considers both the performance and reliabilitystatus of computing nodes when making selection decisions. Heproposed the optimistic best-fit (OBFIT) and pessimistic best-fit(PBFIT) algorithms to determine the best qualified nodes to whichto allocate the VMs to run user jobs. Experiments showed that ahigher rate of successfully completed jobs was achieved by usingOBFIT and PBFIT strategies. However, these algorithms do not per-form well with bad prediction accuracy (below 40%). The resultsshowed that the approach enabled a 17.6% increase in job com-pletion rate compared with that achieved with the current LANLHPC cluster. The algorithmsOBFIT and PBFITwere proposed for thesame scenario considered in this study, and they were then com-pared with our proposed power- and failure-aware scheduling al-gorithms.
3. Energy- and failure-aware virtual clusters
This section provides the formal description of an energy-efficient and failure-aware cloud architecture, which dynamicallymaps VMs to PMs, to improve the completion rate of users’ jobswhile decreasing energy consumption.
3.1. System overview and problem formulation
We consider a private cloud computing environment con-sisting of a cloud provider and multiple cloud users. The cloudarchitecture, information flow, and relative control blocks are illus-trated in Fig. 1. The cloud computing infrastructure is composed ofh physical machines, where M is the vector representing the PMs,M = {m1, . . . ,mh}. Physical hosts are homogeneous, i.e., they havethe same CPU capacity C , memory capacity R, network bandwidthN , access to a shared storage space S for storing the disk images ofthe VMs, and predicted time in the future for the occurrence of fail-ures Fi, which can vary among PMs such thatmi = {C,M,N, S, Fi}.In our work, we define a failure as any anomaly caused by hard-ware or software fault, an unstable environment, or intentional ormistaken actions by the infrastructure administrator that stops thecomputing infrastructure components from working correctly.
In a typical usage scenario, cloud users submit their jobs, andthe cloud manager then reserves the necessary resources fromthe cloud infrastructure to run their jobs. Each job j = (Tj, dj)is composed of a set of n independent CPU-intensive tasks, tq ∈Tj, q ∈ {1, . . . , n}, and a deadline, dj. Once tasks are independent,the job deadline becomes the deadline of the longest task. The taskworkloads are expressed in Mflops. The cloud manager runs theresource allocation algorithm that creates mappings of tasks tomachines. Then, it creates and manages VMs to execute the tasks,where each VMwill run on top of one PM at a time. The set of VMsconstitutes the user’s virtual cluster execution environment. A jobis scheduled only if a VM can be assigned to each task of the job. AVM encapsulates the task execution environment and is the unit ofmigration in the system. In our model, multiple distinct VMs canbe mapped to a single PM. Job deadlines become activated as soonas cloud users submit jobs.
Although machines are composed of several components, suchas memory, network interface cards, and storage disks, the powerconsumed by the active physical nodes is primarily dictated by theCPU resource [20,6]. Thus, we consider only the CPU power con-sumption in our energy model. Based on [11,6], the power con-sumption, P , of a PM, i, can be estimated based on the linear powermodel, Pi = p1+p2×CPU%, where CPU% is the percentage of CPUutilisation for a given time interval, measured for a PM i at runtime.The p1 and p2 factors are the power consumption when the PM isin idlemode and the additional power consumption from CPU util-isation, respectively. The factor p2 is typically proportional to theoverall system load. Eq. (1) is the power efficiency of a PM i at a spe-cific sample time and reflects how much useful work is producedfor a given power consumption as follows:
EPi =CPU i%
p1+ p2× CPU i%× (p1+ p2) (1)
where the workload is represented by the percentage of CPU util-isation and the factor p1 + p2 is used to normalise the efficiency.The power efficiency increases monotonically with the workload,reaching 1 at 100% CPU usage [10,11]. By efficiently consolidatingthe VMs, idle PMs can go into sleep mode, which improves powerconsumption because an idle PM consumes from 60% to 70% of itstotal power [20,6].
The optimisation problem consists of scheduling all the tasksof the submitted jobs so that the energy consumed is minimised,with the realisation that the PMs are the cause of failures. Every

A.M. Sampaio, J.G. Barbosa / Future Generation Computer Systems 40 (2014) 30–43 33
Fig. 1. Private cloud management architecture.
task t for all submitted jobs (J) may run on any machine m ∈ M .A schedule is defined by a function schedJ : J → M that assignsto each task t ∈ J a set of machines Mt ⊂ M . Because of nodefailures, each task may be executed on a single machine or maymigrate between machines more than once. The failure predictionmechanism specifies the off times for eachmachine, and a schedulefor a task may specify a set of machines on which the tasks areseparately executed.
The objective function is themaximisation of the average powerefficiency of the execution of all jobs, defined by Eq. (2), for allactive physical nodes u, at all sample times f , as follows:
EP =
fs=1
ui=1 EPiu
f, ∀u ≤ h (2)
subjected to the deadline constraint given by Eq. (3) for each taskt as follows:
FT (t) ≤ dt (3)
where FT is the completion time of the task and dt is the deadlineof t .
The deadline constraint may lead to an empty schedule de-pending on the resources available, their reliability, and the dif-ference between each task execution time and its deadline. Theformulation presented above considers a set of jobs available at thescheduling time. However, the cloud is dynamicwith respect to re-source availability and number of job submissions by users. Thus, anew schedulewould have to be producedwhen any of those condi-tions change. The optimisation problem isNP-complete and cannotbe readily solved in a dynamic environment. Therefore, it is impor-tant to develop heuristic algorithms, such as those proposed in thispaper, which can adapt the schedules on-the-fly.
Resource sharing is a common practice in virtualised environ-ments. However, despite hypervisor slicing and resource sharingamong co-located VMs, the execution of one VM can still affect theperformance of the others. This phenomenon is known as perfor-mance interference and is caused by the competition for resourcesby running tasks. Performance interference in virtual environ-ments induces slowdown of running applications, thus imposinga deviation between expected and delivered QoS. Several authorshave investigated this problem and have proposed techniques topredict the slowdown [21], where performance degradation, fromthe last level of cache space and memory bandwidth sharing, canbe estimated with an error less than 4%. In this study, the SLA wasbased on the specific deadline for each job; therefore, we can ac-commodate the estimated performance degradation when select-ing the PMs and assigning a CPU percentage to each task. In ourmodel,without loss of generality,we assume that there is nodegra-
dation when resources are shared to evaluate the proposed algo-rithms with respect to energy management and job completionrates during node failure without introducing additional variables.
3.2. Cloud manager
The cloud manager continually obtains the virtual and physicalmachine statuses, such as the nodes’ reliability, power consump-tion, and execution progress of the tasks. Based on the informationcollected, the cloud manager makes decisions concerning oppor-tunities to improve energy efficiency, e.g., VM consolidation or theneed to migrate VMs to facilitate PM failure toleration. The consol-idation mechanism transfers VMs from lower, loaded PMs to otherPMs, thereby improving the energy efficiency by putting the firstPMs in sleep mode and increasing the load rate of the active PMs.
Forecasting the time at which the next failure is going to occur,in a certain PM, can be determined using the tool described in[7,22]. The authors argued that the predictor tool can accuratelypredict failure occurrences with an average accuracy of 76.5%. If aPM fails unpredictably or fails before its running VMs conclude themigration process, those VMs will be re-initiated in spare PMs.
3.2.1. PM statesBecause amachine in an idle state can consume from60% to 70%
of the power consumedwhen it is running at full CPU speed [20,6],unused systems can enter a sleep state [23] to reduce power con-sumption. There have been some notable efforts to reduce theoverhead caused by entering and waking from a sleep state. Forexample, it has been shown [5] that a typical blade server con-suming 450 W at peak can transit rapidly in a fraction of a mil-lisecond to anear-zero-power idle state, consuming approximately10.4W. Thus, a reduction of power consumption can be effectivelyachieved in modern real-world systems by switching idle PMs tosleepmode in response to instantaneous loads, incurring near-zerooverhead. Another feasible technique to reduce the power con-sumption of idle, or low-loaded, PMs is to use Dynamic VoltageFrequency Scaling (DVFS) [24]. However, as is noted in [6], DVFSis only applied to the CPU and not to other system components,resulting in lower gains of energy compared with the technique ofswitching idle PMs to the sleep state.
3.2.2. VMs migrationMigrations are required either for energy optimisation or when
a failure is predicted to occur. We opted for stop and copy mi-grations that accomplish the migration process in a shorter inter-val of time than live migrations [25]. In a live migration, memorypages are iteratively copied from source to destination node, with-out stopping the execution of the migrating VM [26]. The over-head introduced by this approach is a function of the frequency

34 A.M. Sampaio, J.G. Barbosa / Future Generation Computer Systems 40 (2014) 30–43
Algorithm 1 Cloud manager algorithm1: function cloudManager(pmList, cloudUsers)2: Event e← NULL3: while true do4: jobList ← NULL5: if e == ConsolidationEvent then6: jobList.add(pmList.getTasksFromPMsPowerInefficient(γ , τ ))7: else8: jobList.add(pmList.getTasksFromPMsAboutToFail(ζ ))9: jobList.add(pmList.getTasksFromPMsFailed())
10: jobList.add(cloudUsers.getUnscheduledJobs())11: end if12: map← schedAlg(pmList, jobList.getTaskList())13: ifmap = NULL then14: executeMapping(map) ◃ Executes the VMs to PMs mapping15: pmIdleList ← NULL, map← NULL16: pmIdleList.add(pmList.getIdlePMs())17: pmSetSleepMode(pmIdleList)18: end if19: e← WaitForEvent()20: end while21: end function
of the writing to the memory pages because dirty memory pagesmust be re-copied. In contrast, stop and copy migration requiresthe VM to be stopped and its image to be transferred before ex-ecution restarts at the new location. In this case, migration timedepends on the amount of memory allocated to the VM, which iscompletely transferred; thus, the cost is mostly constrained by thenetwork bandwidth [6,27].
Several strategies for VM migration have previously been eval-uated [18,25] with respect to working set size, and the results haveshown that live migration of VMs can almost double the migrationtime comparedwith the time associatedwith themigration of VMsusing the stop and copy method. The migration of VMs with thestop and copy method requires 12–14 s, in contrast to the 14–25 srequired for a live migration, on average.
3.2.3. Cloud manager algorithmAlgorithm 1 describes the cloud manager algorithm. In line 8,
the PM failure prediction mechanism identifies the PMs that areabout to fail and forces all VMs running on those machines to mi-grate before a failure occurs in the preservation of thework alreadycompleted. In line 9, the VMs that were running on PMs that failed,before migrating their VMs, are added to the job list to be initiatedagain. In line 10, all tasks that have not yet been scheduled in thelast scheduling instant and tasks from the new jobs that, mean-while, have arrived are added to the job list. In line 6, if there areno other tasks to schedule, we use the consolidation mechanismfor power efficiency improvement [28] that uses a single thresholdto identify under-utilised PMs. Thismechanism identifies the tasksthat, if migrated, would increase the system power efficiency andadds those tasks to the list. The destination PM is decided by thescheduling algorithm in line 12. If there are other tasks to sched-ule, the consolidation is postponed because those taskswill changethe load on the PMs.
In line 12, a scheduler algorithm is called tomap the set of avail-able tasks to the PMs, regardless of whether they are new tasksor tasks to be migrated. Only tasks that can start immediately aremapped. The remaining tasks stay on the unscheduled list, i.e., theresult produced from the scheduling algorithm is not a plan formapping all available tasks. Such an approach enables the schedul-ing algorithm to execute faster and ismore adapted to the dynamicbehaviour of a cloud.
If a valid map results from the scheduling algorithm, it is ap-plied in line 14. The map includes the initiating of new tasks, as
well as the migration of running tasks. If more than one migrationoccurs from a source PM, they occur sequentially in time. After themap is applied, the idle machines are collected in line 16 and areset to sleep mode in line 17. Then, the algorithmwaits for an eventin line 19. The events that may occur are changes to the environ-ment, namely, a PM failure, a PM failure estimate, a VM consolida-tion event, completion of a task, or the arrival of a new job. Whenany of these events occurs, the cloudmanager starts a newschedul-ing iteration. The assignment of the CPU portion assigned to a VMmay be changed only if it is rescheduled from a migration opera-tion or a task re-initiation.
3.3. Power- and failure-aware scheduling algorithms
In this subsection, we introduce our proposed scheduling al-gorithms to allocate VMs in a power- and failure-aware manner.The cloud manager invokes these algorithms to carry out task(re)scheduling. Because the problem of mapping the VMs to thePMs is NP-complete, the proposed algorithms are heuristic.
The submitted jobs and their tasks have heterogeneous re-source requirements and varying deadlines. First, we define eachtask’s minimum and maximum execution speeds and slack time,which are used by the algorithms to prioritise tasks.
Eq. (4) defines the minimum resources r(t), in Mflops/s, as-signed to a task t that are necessary to complete its remainingworkloadW (t, µ) in the time from time µ+mei to the task dead-line dt . For example, consider the matrix multiplication algorithmthat requires 2n3 flops for matrices of size (n, n) to compute. If theamount of time available to execute the task is 120 s, the requiredresource is 2n3/120 flops/s. Likewise Stillwell et al. [29], we as-sume that a task t only requires themaximumamount of resourcesmax r(t) necessary to execute at the maximum speed, a value de-fined by the user.
min r(t) ≥W (t, µ)
dt − µ−mei(4)
where µ is the current time and the parameter mei represents theoverhead required for a VM to migrate from node e to node i. Theparametermei is 0 if we are scheduling the task for the first time orre-initiating it.
The slack time of task t , as shown in Eq. (5), expresses thedifference between the task deadline dt and the minimum time

A.M. Sampaio, J.G. Barbosa / Future Generation Computer Systems 40 (2014) 30–43 35
Table 1List of symbols.
Symbol Description
h Number of physical servers/nodesCi Capacity of physical node iJS , JC Numbers of jobs submitted and jobs completed, respectivelyf Number of time units for the simulation periodu Number of active PMs, at a certain time unit sri(t) Task t capacity request over PM i (Mflops/s)δi Predicted instant of failure for node idt Completion deadline for task tµ The current timeW (t, µ) Remaining workload for task t , at instant µ (Mflops)mei Overhead migration of a VM/task, from node e to node iRi Reliability weight of node i
necessary for task completion as follows:
slack_time = (dt − µ)−W (t, µ)
max r(t). (5)
The tasks for which Eq. (5) returns a negative value are can-celled, and the corresponding jobs are considered incomplete, in-curring an SLA violation. Assigning each task a CPU power betweenmin r(t) andmax r(t), we are satisfying the strict SLAs imposed oneach job.
We configure the cap parameter [41] from the Xen creditscheduler for fine-grained CPU assignment, allocating the strictlynecessary amount of CPU power to execute a task before itsdeadline. The Xen credit scheduler is the default CPU schedulerused by the Xen hypervisor [30]. It assigns a cap and weights toeach VM instance to control the sharing of computing resourcesamong several VMs. The weights determine the proportion of CPUtime allocation to each VM when several VMs compete for theCPU, meaning that VMs with higher weights will have a higherexecution priority. The cap specifies the maximum percentage ofCPU resources that a VM can obtain in a non-work-conservingmode (i.e., a VM instance cannot use more than its share of theCPU). By dynamically adjusting the CPU cap using the Xen creditscheduler, the fraction of CPU resources assigned to eachVMcan beupdated to explore the available CPU fraction in the physical nodeuntil the sumof the caps of all co-locatedVM instances is 100% [31].
In both algorithms proposed in this study, when a VM migra-tion occurs, the CPU resource assigned to the VM is re-evaluatedand the destination PM and VM requirements are adjusted; thus,the CPU requirement of the source PM may be different from thatof the destination PM. This dynamic CPU update only occurs whenmigrations are performed, allowing horizontal and vertical scalingof the VMswith respect to the CPU allocation. Table 1 lists the sym-bols used in the schedule algorithms described next.
3.4. POwer- and Failure-Aware Relaxed time Execution (POFARE)
For the incoming jobs {j1, . . . , jk}, the cloud manager creates aset of virtual clusters, one for each user, to execute the tasks as-sociated with the jobs. When invoked by the cloud manager, thealgorithm selects, at each step, a VM to schedule and determines adestination PM.
3.4.1. VM selectionThe algorithm creates a list of prioritised groups of tasks
{t1, . . . , tn×k}. The priorities are, from the highest to the lowestpriority (1) proactive failure tolerance; (2) re-initiating of failedtasks; and (3) scheduling of new tasks. Power-optimising schedul-ing is performed when there are no other types of tasks. Then, thetasks in each group are sorted in ascending order according to theslack_time of the tasks (Eq. (5)). These steps correspond to lines 3–5of the algorithm POFARE that is described in Algorithm 2.
3.4.2. VM placementAfter a VM is selected to be scheduled from the prioritised list,
in line 6 of Algorithm 2, all PMs are evaluated with respect to taskresource requirements, PM power efficiency, and reliability. In line11, the algorithm checks that node i can supply the minimum re-sources required by task t , which is evaluated using Eq. (6) as fol-lows:
ri(t)+n
k=1
ri(tik) ≤ Ci (6)
where {ti1 , ti2 , . . . , tin} is the set of tasks running on node i andri(tik) is the resource assigned to task tik . The machine is consid-ered a candidate if the minimum resource demand of t , plus theoverall resources required by all tasks that run on physical node i,does not exceed the node capacity Ci. For the first evaluation, ri(t)is min r(t).
If the first condition is true in line 11, the second condition isassessed, i.e., the algorithm verifies that the node i can executepart of the task before a failure in i occurs, as evaluated by Eq. (7).This equation indicates that task t can be (re)scheduled ormigratedfrom node e to a non-reliable physical node i at time µ + mei,which is predicted to fail at instant δi, if (1) it provides the resourcesri(t) required by task t during the δi − µ time interval and (2)task t will have to migrate to another, currently unknown physicalnode where it cannot require more resources than those needed toenable execution at maximum speed, max r(t).
ri(t)× (δi − µ−mei)+ (max r(t))× (dt − δi −mei)
≥ W (t, µ),
if
(δi − µ−mei)
≤W (t, µ)
max r(t)∧ ri(t) ∈ [min r(t),max r(t)]
.
(7)
If the machine is not selected by the above equation, Eq. (8) isevaluated. In other words, if task t starts at time µ+mei at node i,with a predicted instant of failure δi later than the task deadline dt ,the amount of resources necessary to complete the task within thedeadline can be allocated without additional migrations. If node idoes not satisfy Eq. (8), it is discarded to receive the current task.
ri(t)× (dt − µ−mei) ≥ W (t, µ)
if
(δi − µ−mei)
>W (t, µ)
min r(t)∧ ri(t) ∈ [min r(t),max r(t)]
.
(8)
All machines are evaluated and, in line 21, a maximum of onemachine is the pmSelected, i.e., the node that best improves thepower efficiency of the machine (Eq. (1)) and that can provide therequired resources. If there is more than one node providing thesame power efficiency, EP , the node with the highest reliability isselected in line 14. Eq. (9) represents the reliability weight for agiven node i. The node with the lowest Ri is the most reliable.
Ri =1
2δi−dt−mei. (9)
The criterion for choosing the node that returns the lowestvalue of Eq. (9) allows tasks that have a low slack time to be as-signed to run in nodes that have the necessary resources to avoidmigrations. The algorithm sets the cap parameter in the Xen creditscheduler to reserve the resources necessary to complete the taskswithin their deadlines. The algorithm supports a work-conservingmode during task execution if the CPU capacity of a node is notcompletely consumed. In such cases, the remaining free CPU ca-pacity is distributed equally among all running VMs until the entire

36 A.M. Sampaio, J.G. Barbosa / Future Generation Computer Systems 40 (2014) 30–43
Algorithm 2 POwer- and Failure-Aware Relaxed time Execution (POFARE)1: function pofare(pmList, jobList)2: mappingList ← NULL3: jobList.taskList.removeTasksHavingNegativeSlackTime()4: jobList.taskList.groupTasksByReason()5: jobList.taskList.sortTasksInGroupsByIncreasingSlackTime()6: for all task ∈ jobList.taskList do7: lRweight ← NULL ◃ lowest reliability weight8: hEpower ← NULL ◃ highest power efficiency9: pmSelected← NULL
10: for all pm ∈ pmList do11: if pm.hasResources(task) and pm.hasReliability(task) then12: rWt ← pm.getReliabilityWeight(task)13: ePw← pm.getPowerEfficiency(task)14: if ePw > hEpower or (ePw = hEpower and rWt < lRweight) then15: lRweight ← rWt16: hEpower ← ePw17: pmSelected← pm18: end if19: end if20: end for21: if pmSelected = NULL then22: mappingList ← {task, pmSelected}23: pmSelected.updateResourcesAvailable(task.minResources)24: end if25: end for26: returnmappingList ◃ VMs (tasks) to PMs mapping27: end function
CPU capacity of the node is consumed or the maximum capacity ofall VMs is reached, thus enabling the task to run at the maximumpossible speed. In cases where there is no physical node providingthe minimum required resources min r(t) to complete a task t byits deadline dt , that task is put on hold until the cloud computingenvironment releases the necessary resources.
3.5. POwer- and failure-aware minimum time execution (POFAME)
The POFAME algorithm differs from the POFARE algorithm inthe amount of CPU resources that are assigned to a task. POFAMEselects a PM that maximises the power efficiency, as POFAREdoes, but it reserves the maximum amount of resources needed toexecute the task (in line 23 of Algorithm2), limited by the availablePM resources and the maximum amount of resources requiredby the task. POFARE reserves the minimum required resources tocomplete the task by its deadline, thereby increasing the task’scompletion time.
The complexity of POFARE and POFAME is given by the productof the number of tasks, n, to be scheduled at a given time and thetotal number of machines,m. For a single iteration, the complexityof both algorithms is O(n×m).
3.6. Comparison of scheduling algorithms
We implemented three other algorithms to compare their per-formance with that of our algorithm, namely, the optimistic best-fit (OBFIT) algorithm, the pessimistic best-fit (PBFIT) algorithm [7],and a best-fit type of algorithm that is based on the MBFD algo-rithm [6] and herein called the common best-fit (CBFIT) algorithm.BecauseMBFDdoes not consider node failures, CBFIT is a simplifiedversion to show the impact of the pro-active fault-tolerant migra-tions. The CBFIT strategy selects, fromall available PMs, the PM thathas the minimum capacity necessary to run a task to optimise en-ergy consumption. In turn, OBFIT collects a set of PMs that will notfail before a task’s deadline. Then, from this set of PMs, it weighs
and selects the PM that has both the minimum required capacityandminimum reliability to run a VM. The PBFIT strategy calculatesthe average available capacity level Caverage among the computingnodes that will not fail before the task deadline, and from the setof PMs that will fail before the task deadline, it selects the PMwithcapacity Cp such that Caverage+ Cp results in the minimum requiredcapacity to run the task.
4. Evaluation and simulation scenario
In this section, the metrics used to evaluate the algorithmperformance are presented. The workloads, failure characteristics,and simulation scenario are also described.
4.1. Performance metrics
To evaluate the performance of the algorithms, we definedthree metrics: (i) the completion rate of users’ jobs; (ii) the ratioof useful Mflops processed to the energy consumed; and (iii) theworking efficiency. The first metric, expressed as Eq. (10), mea-sures the completion rate of users’ jobs, EJ , which is calculated asthe ratio of the number of jobs completed by their deadline, JC , tothe number of submitted jobs, JS . Its value falls in the interval [0, 1],and it is the SLAmetric. The difference between EJ and 1,multipliedby 100, is the percentage of SLA violations.
EJ =JCJS
. (10)
The energy-efficiency metric, EM , shown in Eq. (11), calculatesthe amount of energy consumed, in Joules, to produce usefulwork. By useful work, we count the number of Mflops associatedwith successfully completed jobs only, JC . EM is calculated bydividing the sum of the workloads from all tasks of successfullycompleted jobs by the overall energy consumption. The energy isthen calculated by multiplying the average power consumption ofthe computing infrastructure (i.e., for all active physical nodes u at

A.M. Sampaio, J.G. Barbosa / Future Generation Computer Systems 40 (2014) 30–43 37
all sample times f ) by the number of sample times f , multiplied by60 (because the samples are obtained eachminute).We henceforthrepresent this metric as Mflops/Joule.
EM =
j
θj ×
nt=1
W (t, 0)
fs=1
ui=1 Piu
f × f × 60
,
θj =
1, if job j completed0, otherwise.
(11)
Eq. (12) shows the calculation of the working efficiency, EW ,which is used as a metric with which to determine the quantityof useful work performed (i.e., the completion rate of users’ jobs)by the consumed power. It is determined by multiplying EJ , thecompletion rate of jobs, by the average power efficiency based onEq. (1) for all active physical nodes i ∈ [1, u] at all sample times f .
EW =
fs=1
ui=1 EPiu
f× EJ , ∀u ≤ h. (12)
Eqs. (11)–(12) express the amount of useful work performedfrom different perspectives. The first equation quantifies thenumber of usefulMflops by the consumedenergy,while the secondequation measures the quantity of useful work (i.e., completionrate of users’ jobs) performed with the consumed power. The bestalgorithm should be the algorithm that maximises both, enablingthe processing of more Mflops with a lower amount of energy andmaximising the job completion rate while keeping high levels ofpower efficiency.
4.2. Workload and failure characteristics
In this section, we describe the characteristics of the workloadsand failures injected in the simulator to evaluate the performanceof the scheduling algorithms.
4.2.1. Random synthetic workloadsTo create a set of synthetic workloads, we chose the Poisson
distribution as the basis of the synthetic jobs [32]. The average jobinter-arrival time was set to 10 min, and each job was composedof an average of 10 tasks. Additionally, the average task length toMTBF ratio varied on a logarithmic scale of {0.01, 0.1, 1, 10}. Inother words, if we consider a ratio of 1, the average task lengthequals the MTBF. The average CPU utilisation per task was set to20% of the node capacity. The injection of this type ofworkload intothe simulator will enable an analysis of the impact of the averagetask length to theMTBF ratio on the performance of the schedulingalgorithm. Considering these workload characteristics, we created100 synthetic jobs. A job deadline equals the deadline of its longesttask, and the task deadlines are rounded up to 10%more than theirminimum necessary execution time.
4.2.2. Workloads based on Google cloud tracelogsRecent studies analysing the latest version of the Google cloud
tracelogs [9], spanning 29 days, yielded significant data on thecharacteristics of submitted workloads and the management ofcluster machines. These studies enable further work on importantissues, such as resource optimisation, energy-efficiency improve-ments, and failure correlation. Some authors [33,34] argue that ap-proximately 75% of jobs only run one task andmost of the jobs haveless than 28 tasks that determine the overall system throughput.The medium length of a job is 3 min, and the majority of jobs runin less than 15 min, despite the fact that there are a small number
of jobs that run longer than 300 min. Moreover, task length fol-lows a lognormal distribution [35], with most of the tasks requir-ing a short amount of time [36]. This same distribution applies toCPU usage, which varies from near 0% to approximately 25%, indi-cating that a high proportion of tasks consume resources at lowerrates. For the same reason, a lognormal distribution can be appliedto describe the number of tasks per job. Depending on the clusteror day observed, job inter-arrival times follow distributions suchas lognormal, gamma, Weibull, or even exponential [34–36], witha mean time of 4 s. Regarding RAM usage, most of the tasks useless than 2.5% of the node’s RAM [34]. Based on these studies, wecreated 3614 synthetic jobs to simulate cloud users’ jobs, requiringa RAM size of 256, 512, or 1024 MB, selected randomly. The totalnumber of tasks is 10357, and each task deadline is rounded upto 10% more than its minimum necessary execution time. The jobdeadline equals the deadline of its longest task.
4.2.3. Failures and unavailability propertiesFor each physical node, the MTBF is programmed according to
a Weibull distribution, with a shape parameter of 0.8, which hasbeen shown [37] to well approximate the time between failuresfor individual nodes, as well as for the entire system. Failed nodesstay unavailable (i.e., mean time to repair (MTTR)) during a pe-riod modelled by a lognormal distribution, with a mean time setto 20min, varying up to 150min. Failure tolerance is implementedthrough proactive VM stop and copymigration, rather than check-pointing. The predicted occurrence time of failure is earlier thanthe actual occurrence time. When a node fails, the tasks runningon it are restarted in a different set of nodes, from scratch, if thereis adequate time to execute those tasks before their deadlines. Wehave assumed that the initiating of VMs uses negligible overhead.Cavilla et al. [38] demonstrated that it is possible to initiate mul-tiple VM instances in less than 1 s, assuming that the VM imagesand data are stored in a Network Attached Storage (NAS).
4.3. Simulation setup
We simulated the cloud computing infrastructure describedin Fig. 1, which is composed of 50 homogeneous physical nodes.The CPU capacity of the physical nodes was assumed to be 800Mflops/s, values that can be evaluated using Linpack [39]. Thepower consumed by the fully loaded physical nodes was 250 W.Theparameters p1 and p2, for Eq. (1),were set to 70% and30%of fullpower consumption, respectively. The scheduling algorithms haveno knowledge of when jobs arrive. The average amount of CPU re-sources required by a VM was set to 160 Mflops/s (20% of a node’scapacity) for the random workload, implying that, on average, themaximum number of VMs per node is 5. Each VM requires a RAMsize of 256, 512, or 1024 MB, randomly selected. The migrationoverhead of the VM depends on the memory size and the networkbandwidth, which, in this experiment, was set to 1 Gigabit/s [6,27].Tasks with deadlines extending past the failure time of their nodemigrate ζ = 3 min before the nodes predicted failure time.
When the consolidation mechanism is applied, the size of thesliding window with which to detect energy-optimising opportu-nities is 5min, with a CPU usage threshold of τ = 55% and numberof occurrences within thewindow of γ = 3.We have chosen thesevalues based on our previous study [28], which demonstrated thatthese values produce an optimal ratio of the amount of work per-formed to the consumed energy.
It has been shown elsewhere [7,22] that the failure predictortool can predict failure occurrences with an average accuracy of76.5%. In our simulations, we have measured the impact of fail-ure prediction accuracy on the performance of the scheduling al-gorithms, as well as the average task length to MTBF ratio, whenthe prediction accuracy is 75%.

38 A.M. Sampaio, J.G. Barbosa / Future Generation Computer Systems 40 (2014) 30–43
(a) Completion rate of user’ jobs. (b) Power-efficiency.
(c) Energy-efficiency. (d) Working efficiency.
Fig. 2. Impact of the average task length toMTBF ratio in the performance of scheduling algorithms,without dynamic consolidation, for randomworkloads. The configurationis: (i) MTBF= 200 min; (ii) average failure prediction accuracy= 75%.
5. Results and analysis
This section presents the results associated with the algorithmperformance. First, we inject a set of randomworkloads to investi-gate how well the algorithms perform for tasks with different av-erage task length to MTBF ratios. Then, we use the Google-basedworkloads to assess the algorithm performance with and with-out the consolidation mechanism that dynamically re-adapts theschedule to improve power efficiency. The section ends with thereporting of preliminary results from the adoption of the proposedalgorithms in a real platform.
5.1. Random synthetic workloads
The results from the first set of simulations are shown inFig. 2. These simulations used the synthetic workload character-istics introduced in 4.2.1. We fixed the MTBF at 200 min, andthe average task length to MTBF ratio was varied within the set{0.01, 0.1, 1, 10}. Additionally, the average prediction accuracy forthe failure predictor tool was set at 75%, and the results were ob-tained without dynamic consolidation. The CBFIT algorithm doesnot consider failureswhen scheduling anddoes not performmigra-tions when failures occur. It re-initiates the tasks of a node whenit fails. CBFIT is a best-fit algorithm that is used in this study as abasis for performance comparison.
Fig. 2(a) shows the job completion rate as a function of the av-erage task length to MTBF ratio. It shows that as the average tasklength increases compared with the MTBF, the completion rate ofusers’ jobs decreases. For the values of 0.01 and 0.1, task lengthsare small compared with the MTBF and OBFIT, POFAME and PO-FARE perform similarly, completing almost 100% of the jobs. CB-FIT also performs well for 0.01 because the task lengths are smallcompared with the MTBF; thus, the failures do not affect its per-formance. However, for the 0.1 case, the job completion rate forCBFIT decreases significantly. For the values of 1 and 10, failures
occur in almost all tasks and CBFIT completes only 1% of tasks fora ratio of 1 and 0% for a ratio of 10, with most of the time spent onre-initiating tasks. For a given task, OBFIT only selects nodes thatdo not fail until the task deadline, and, therefore, it does not per-formmigrations to prevent failures. Consequently, its performancealso decreases significantly for the ratio of 1, with only 21% of thejobs completed. For the ratio of 0.1, POFARE and POFAME complete99% of the jobs. Although it is a high rate of success, it is not 100%because of the additional overhead caused by the migration of theVMs to tolerate node failures. The migration technique shows sig-nificant improvements for the ratios of 1 and 10 compared withthe other algorithms. In contrast, PBFIT tends to complete morejobs when dealing with unreliable PMs, as it only schedules tasksto unreliable PMs.
Fig. 2(b) shows the average power efficiency that allows theevaluation of the consolidation rate achieved by each algorithm.For the average task length to MTBF ratio of 0.01, low power effi-ciency is achieved, i.e., approximately 50%, meaning that the loadof a node is far from 100%. As the task sizes increase, the nodes runat a higher percentage of CPU utilisation. POFARE is the best algo-rithm in all cases; the results are above 90% for the ratios 1 and10. The power efficiency indicates the node loads during the ex-periments, including the workload of tasks that could not be com-pleted by their deadlines. For a ratio of 10, OBFIT obtains a powerefficiency of 0 because it does not schedule tasks onunreliable PMs,and, therefore, it does not launch any VMs. The other algorithmsachieve high rates of power efficiency, but only POFAME and PO-FARE are able to complete jobs at rates of 4% and 3%, respectively.
Fig. 2(c) illustrates the energy efficiency (EM ), which is repre-sented by the ratio of the useful work to the energy consumed(Mflops/Joule). For the average task length to MTBF ratio of 0.01,all algorithms achieve a Mflops/Joule ratio lower than that for theratio of 0.1 because the same job completion rate is achieved inboth cases (Fig. 2(a)), but the consolidation is lower for the ratioof 0.01 (Fig. 2(b)). The highest rate of Mflops/Joule is achieved for0.1 and decreases for the ratios of 1 and 10 for all algorithms. The
A.M. Sampaio, J.G. Barbosa / Future Generation Computer Systems 40 (2014) 30–43 39
(a) Completion rate of jobs regarding failure predictionaccuracy.
(b) Average energy consumed regarding failure predictionaccuracy.
(c) Energy-efficiency regarding failure prediction accuracy. (d) Working efficiency regarding failure prediction accuracy.
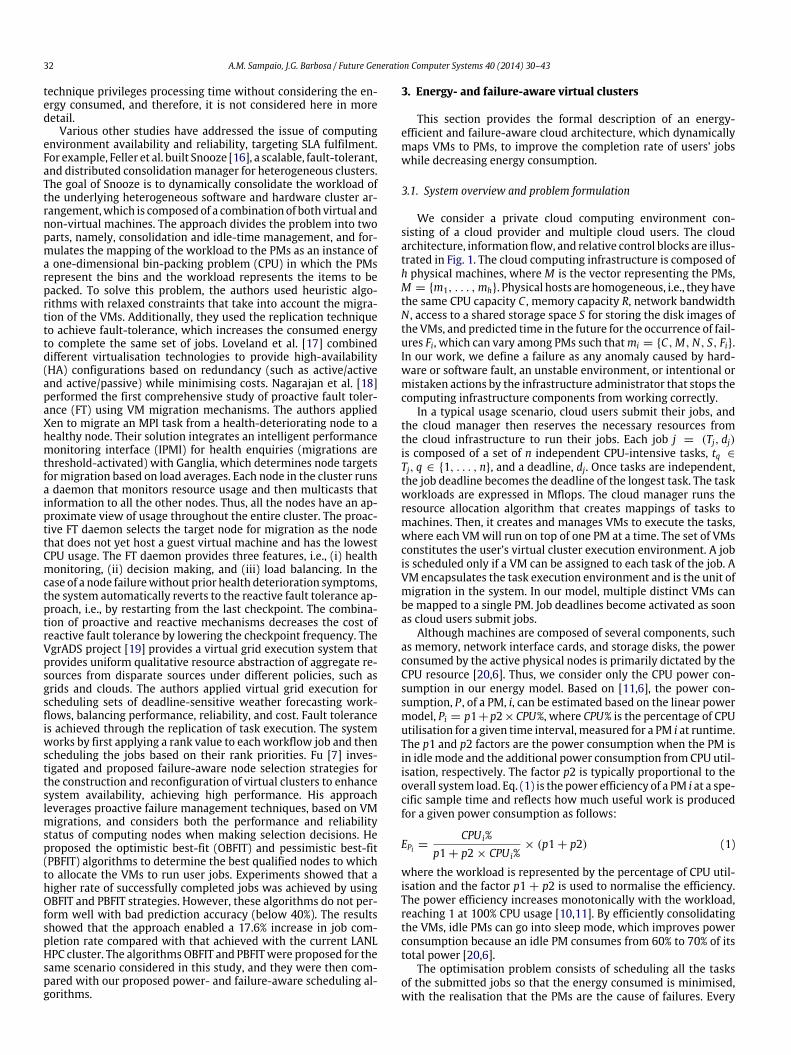
Fig. 3. Energy- and failure-aware scheduling algorithms, without dynamic consolidation, for Google-based workloads. The configuration is: (i) average task length= 3min;(ii) MTBF= 200 min.
CBFIT algorithm yields a Mflops/Joule value near zero for the ratioof 1 because the job completion rate is only 1%. POFARE shows animprovement over OBFIT by 23.6%, 16.9%, and 72.4% for the ratiosof 0.01, 0.1, and 1, respectively.
The working efficiency metric is shown in Fig. 2(d). It mea-sures the useful work based on the consumed power, similar to theenergy efficiency, which considers energy; therefore, the samefunction shape is obtained as in Fig. 2(c). POFARE shows an im-provement over OBFIT of 26.2%, 20.3%, and 219.7% for the ratios of0.01, 0.1, and 1, respectively.
A comparison of the performance results obtained by CBFITwith those obtained by POFAME and POFARE shows that the over-head imposed by pro-active migrations resulted in higher ratesof completed jobs, power, energy, and working efficiencies and,therefore, increased the system availability. The number of migra-tions, as a percentage of the total number of tasks, for the ratiosof 0.01 and 0.1 are 0.1% and 3.1% for POFAME and 0.1% and 3.8%for POFARE, respectively. For the ratios of 1 and 10, the number ofmigrations increases to 126% and 350% for POFAME and POFARE,respectively, which is expected because the tasks are longer thantheMTBF. However, POFAME and POFARE still completemore jobswith better efficiency than OBFIT, CBFIT, and PBFIT. The averagenumber of VMs per node for POFARE was 5, 9, 11, and 11 for theratios of 0.01, 0.1, 1, and 10, respectively.
5.2. Workloads based on Google cloud tracelogs
Fig. 3 shows the results for the workloads introduced in Sec-tion 4.2.2, obtained without the dynamic consolidation mecha-nism. The characteristics of these workloads are well defined withrespect to job duration. The goal is to evaluate the performanceof the algorithm for a realistic workload. The previously usedmetric, the average task length to MTBF ratio, is not applicable;thus, we consider the influence of the failure prediction accuracy(FPA) on the algorithm performance [7,22]. FPA is defined as the
difference between the actual and predicted failure time, ex-pressed as a percentage. For example, if a physical node is supposedto fail at minute 100, the failure predictor tool will predict the fail-ure at minute 10 if the FPA is 10%. This means that failure predic-tion inaccuracies have a direct impact on the MTBF perceived bythe algorithms that consider node reliability. As before, the MTBFwas set to 200 min. If the average task length is 3 min, the averagetask length to MTBF ratio is 0.015 in this experiment.
The results of CBFIT are constant for all values of FPA, as it doesnot take failures into account when scheduling and does not per-form task migration to prevent failures. When a node fails, CBFITre-initiates the task in another node. Fig. 3(a) plots the comple-tion rate of users’ jobs as the FPA varies from 10% to 100%. We canconclude that, for an FPA below or equal to 20%, a simple best-fitalgorithm (CBFIT) completes more jobs than any of the other algo-rithms. In this case, the failure prediction error generates excessivetask migrations than required, thus affecting the rate of completedjobs. Additionally, the energy consumed by OBFIT, POFAME, andPOFARE (Fig. 3(b)) is lower for an FPA below or equal to 20% be-cause when a job cannot be finished, the algorithms do not launchtheir tasks and, therefore, do not spend energy computing that partof the job. The working efficiency (Fig. 3(d)), which combines therate of jobs completed with the average power efficiency, providesa better evaluation of the algorithmperformance. Additionally, CB-FIT is only best for an FPA of 10%.
For an FPA greater than or equal to 30%, OBFIT, POFAME, andPOFARE achieve a job completion rate near 100%. This result is inaccordance with the results of Fig. 2(a) for an average task lengthto MTBF ratio of 0.01 (in this case, it is 0.015) and an FPA of 75%,where a job completion rate close to 100%was obtained. An impor-tant characteristic of POFAME and POFARE is that they achieve analmost constant energy consumption (Fig. 3(b)), energy efficiency(Fig. 3(c)), andworking efficiency (Fig. 3(d)), indicating that, for theconsidered workload, the performance and the system availabilityare nearly independent of the failure prediction accuracy.

40 A.M. Sampaio, J.G. Barbosa / Future Generation Computer Systems 40 (2014) 30–43
(a) Impact in the completion rate of jobs by applying energyoptimisation.
(b) Average energy consumed regarding failure predictionaccuracy.
(c) Energy-efficiency regarding failure prediction accuracy. (d) Working efficiency regarding failure prediction accuracy.
Fig. 4. Energy- and failure-aware scheduling algorithms, with dynamic consolidation, for Google-based workloads. The configuration is: (i) average task length = 3 min; (ii)MTBF = 200 min; (iii) τ = 55%; (iv) γ = 3.
PBFIT provides the worse completion rate of users’ jobs be-cause most of the tasks are short, which implies that they wouldbe scheduled only if the physical nodes were failing all the time.Consequently, tasks are not scheduled and the energy consumed isalso lower than that of the remaining algorithms.
The energy consumed to run the users’ jobs vs. the variation inFPA is depicted in Fig. 3(b). Disregarding the PBFIT case that is lim-ited to very few PMs, the results show that POFARE is generallythe best algorithm to produce work at lower energy consumptionfor different values of FPA. The results in Fig. 3(c) show that thePOFARE strategy uses the energy more efficiently to produce workwith respect to Mflops/Joule, with an improvement of 6.7% com-pared with OBFIT for an FPA of 75%. The results for the workingefficiency in Fig. 3(d) show that for 75% FPA, POFARE yields a 4.8%improvement over OBFIT.
We can conclude that POFARE is the strategy that producesmore work, in terms of useful Mflops and number of completedjobs, for less energy. Specifically, if we take into account the factthat the average FPA achieved by the failure predictor tool is ap-proximately 75%, the POFARE algorithm yields 0.049 Mflops/Jouleand a working efficiency of almost 68%. These results show thatPOFARE is the most suitable algorithm to allocate resources to ex-ecute cloud users’ jobs in an energy-efficient manner.
In the next set of simulations, we assess the performance of thealgorithms when using the energy-optimising mechanism to dy-namically readjust virtual clusters. With the consolidation mecha-nism (Algorithm 1, line 6), a VM can be migrated if it benefits thepower efficiency.
Fig. 4(a) depicts the impact on job completion rate comparedwith the results obtained without applying the consolidationmechanism. As before, the impact on POFARE is higher only for anFPA of 10%. For the remaining cases, the reduction in job comple-tion rate is below 0.4% for POFARE. The CBFIT algorithm always im-proves the job completion rate associated with the power-drivenmigrations, namely, an improvement of approximately 0.6%.
Fig. 4(b) shows the energy consumed, and, compared withFig. 3(b), the results show that POFAME, POFARE, and CBFIT reducethe consumed energy when power-oriented migrations are per-formed. Considering an FPA of 75% and POFARE, the energy con-sumption, with consolidation, is reduced by almost 11.3% withoutsignificantly affecting the job completion rate, which was reducedby less than 0.08%.
Considering Fig. 4(c) and (d), the results show that POFAMEand POFARE are clearly the strategies that benefit most from theenergy-optimisingmechanism.Moreover, POFARE is the algorithmthat utilises energy more efficiently to produce work and, for thespecific FPA of 75%, yields an improvement over OBFIT of approxi-mately 12.9% and 15.9% with respect to Mflops/Joule and workingefficiency, respectively. We can conclude that with consolidation,the improvements of POFARE over OBFIT are significantly greaterthan those without consolidation.
To analyse the impact of the power-oriented migrations,Table 2 shows results for the Google cloud tracelogs and an FPA of75%. The consolidation mechanism reduces the energy consumedusing POFARE from 26.9 to 23.9 MJ, a reduction of 11.2%, whilekeeping the same job completion rate. The number of migrationsincreases from 0.8%, due to failure tolerance migrations, to 2.55%,which also includes power-oriented migrations. OBFIT yields a jobcompletion rate of 100% butwith an increase of 13.8% in consumedenergy compared with POFARE. The 3.12% of VM migrations forCBFIT, without consolidation, are re-initiates. With consolidation,there is a 1.6% migration rate. From the energy and job comple-tion rate columns in Table 2, we can conclude that the consoli-dation mechanism improved all algorithms in these two aspects.The average number of VMs per PM is similar for CBFIT, OBFIT, andPOFAME. The POFARE algorithm is more relaxed in terms of thepower assigned to tasks and, therefore, results in a higher numberof VMs per PM. Considering that a computational node may have64 GB of memory and that each VM requests up to 1 GB of mem-ory, it is feasible to host 21 VMs per node onmodern cluster nodes.

A.M. Sampaio, J.G. Barbosa / Future Generation Computer Systems 40 (2014) 30–43 41
Table 2Results for Google cloud tracelogs for energy, job completion rate, ratio of VM migrations to total number of tasks, and number of VMs per PM for the case of 75% of failureprediction accuracy without consolidation (wocs) and with consolidation (wcs).
Algorithm Energy (106 J) Job comp. rate VMmigrations Av. # of VM p/PMwocs/wcs wocs/wcs wocs/wcs wocs/wcs
CBFIT 27.7/25.1 95%/95.5% (3.12%)+ 1.6% 16/17OBFIT 28.3/27.2 100%/100% 0%/0.99% 17/16POFAME 28.1/25.3 99.6%/99.8% 1.05%/2.95% 17/17POFARE 26.9/23.9 99.8%/99.8% 0.8%/2.55% 21/22
Table 3Results for Google cloud tracelogs without failures for energy, job completion rate, ratio of VM migrations to total number of tasks, and number of VMs per PM, withoutconsolidation (wocs) and with consolidation (wcs).
Algorithm Energy (106 J) Job comp. rate VMmigrations Av. # of VM p/PMwocs/wcs wocs/wcs wocs/wcs wocs/wcs
CBFIT 27.8/25.2 100%/99.8% 0%/2.1% 16/17OBFIT 27.7/25.2 100%/99.9% 0%/1.99% 16/17POFAME 28.6/25.3 100%/99.8% 0%/2.43% 16/17POFARE 26.9/23.9 100%/99.9% 0%/1.82% 21/22
The average number of PMs used, for all algorithms, ranges from 7to 9.
Table 3 shows results for the case where there are no node fail-ures during the execution.We can conclude that POFARE is still thebest algorithm, consuming less power for the same rate of com-pleted jobs, with and without consolidation.
5.3. Real platform evaluation
The results presented above are based on a simulation used toevaluate the algorithms for a large set of workloads and failurerates, since it is found to not be feasible or practical, to guaran-tee repeatable conditions for such a set of experiments [6]. The ex-periment reported in this section provides preliminary results ofthe adoption of the proposed algorithms in a real platform. Cloudsystems use middle-wares such as OpenStack, Eucalyptus, andOpenNebula, among others. In the current versions, these cloudmiddle-wares do not allow the vertical scaling of a task, i.e., a taskcannot change the percentage of CPU power assigned to it dur-ing run time. The algorithm proposed in this paper, POFARE, isbased on vertical scaling, i.e., higher or lower, of the CPU powerassigned to each task; therefore, we develop a prototype of ourCloud Manager algorithm (Algorithm 1) to perform the real plat-form evaluation. The experimental testbed consisted of 24 nodes(cores) from an IBM cluster with the following characteristics:each physical server is equipped with an Intel Xeon CPU E5504composed of 8 cores working at 2.00 GHz, supporting virtualisa-tion extensions and deploying 24 GB of RAM. The Xen 4.1 vir-tualisation software was installed in the Ubuntu Server 12.04operating system.We have applied the conditions reported in Sec-tion 5.2, with an MTBF of 200 min and an average task length toMTBF ratio of 0.015. Each node behaves based on the descriptionin Section 4.2.3. The cloud manager is made aware of the cur-rent status of each node by collecting heartbeat messages [40].When a node fails, it stops sending heartbeat messages, and thecontroller subsequently considers that a failure as occurred. Thetask workload follows the Google cloud tracelogs, as explained inSection 4.2.2. To implement such a workload, the stress software(available on Ubuntu Linux), which emulates a workload, is used.We created 151 jobs with a total of 389 tasks that ran for approx-imately one hour to complete an instance of the experiment. Allthe characteristics of the jobs, i.e., those used in simulations, aremaintained.
Fig. 5 shows the results obtained from the experiments whenapplying both energy-optimising and fault-tolerant mechanisms.These experimental results confirm, in general, those obtained
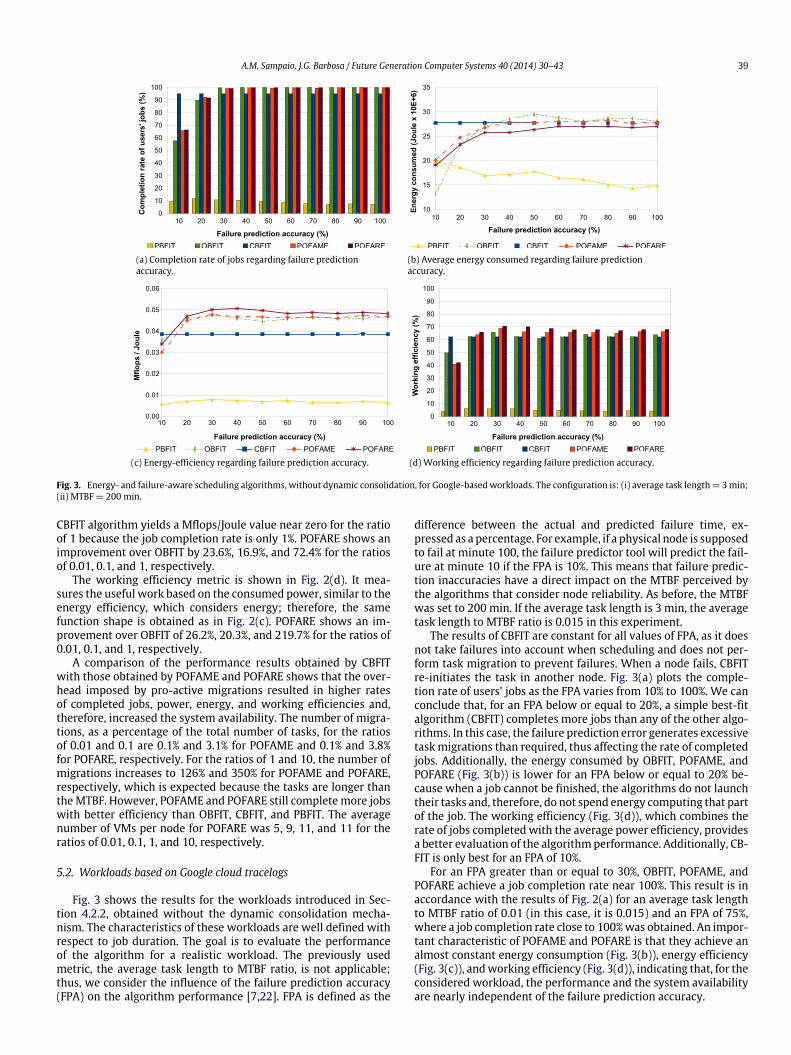
through simulations (Fig. 4(c) and (d)). Fig. 5(a) shows that thePOFARE algorithm utilises energy more efficiently in terms ofMflops/Joule, outperforming POFAME and OBFIT by 16.4% and by18.4% on average, respectively. For an FPA of 100%, the deliveredMflops/Joule of the POFARE algorithm decreases to a value nearPOFAME. This behaviour is justified by the fluctuation of the as-signed amount of CPU to each task, which is not constant in the realsystem, as considered in the simulation. For lower values of FPA,this effect does not affect POFARE because the error margin usedto avoid failures accommodates such fluctuations. For FPA valueslower than 20%, simple algorithms, such as CBFIT, perform betterthan any of the other algorithms.
In Fig. 5(b), the results for the working efficiency also demon-strate that for different values of FPA, POFARE obtains a higher de-gree of consolidation than do all of the other algorithms. POFAREobtains on average 15.2% and 23.5% higher working efficiency thando POFAME and OBFIT, respectively.
In conclusion, the real experiment showed that POFARE con-sumes less energy than any of the other strategies and that com-pletes a similar number of jobs by their deadlines for FPA valuesequal to or greater than 25%.
6. Conclusions and future work
In this paper, we have proposed two algorithms that applyproactive fault tolerance to address node failures. The objective isto maximise the useful work performed by the consumed energyin cases where the infrastructure nodes are subject to failure. Thisobjective implies an increase in the amount of useful Mflops pro-cessed per energy unit, as well as the number of jobs completed bythe consumed power. To achieve this objective, we developed twodynamic VM allocation algorithms, POFAME and POFARE, whichuse two different methods to provide energy-efficient virtual clus-ters to execute tasks within their deadlines. While the POFAMEalgorithm tries to reserve the maximum required resources to ex-ecute tasks, POFARE leverages the cap parameter from the Xencredit scheduler to execute tasks with the minimum required re-sources. The testswere conductedby injecting two sets of syntheticjobs. The first set was generated based on the Poisson distributionand allowed us to assess the scheduling algorithm performanceusing different average task length to MTBF ratios. The improve-ment in energy efficiency of POFARE over OBFIT is 23.6%, 16.9%,and 72.4% for the average task length ratios of 0.01, 0.1, and 1, re-spectively. The improvement in working efficiency of POFARE overOBFIT is 26.2%, 20.3%, and 219.7% for the ratios of 0.01, 0.1, and1, respectively. The characteristics of the second set of workloads
42 A.M. Sampaio, J.G. Barbosa / Future Generation Computer Systems 40 (2014) 30–43
(a) Energy-efficiency regarding failure prediction accuracy. (b) Working efficiency regarding failure prediction accuracy.
Fig. 5. Experiments for Energy- and failure-aware scheduling algorithms, with dynamic consolidation, for Google based workloads. The configuration is: (i) average tasklength= 3 min; (ii) MTBF= 200 min; (iii) τ = 55%; (iv) γ = 3.
used the latest version of the Google cloud tracelogs. The resultsshowed that the solutions obtained with the POFARE algorithmare the best, compared with well-known algorithms, such as thebest-fit OBFIT algorithm. The results show that the POFARE algo-rithm improves the work per Joule ratio by approximately 12.9%and the working efficiency by 15.9% compared with the OBFIT re-sults obtainedwith dynamic optimisation andmaintenance of sim-ilar levels of completed jobs. The results also showed that a relaxedstrategy (POFARE), which assigns theminimum required resourcesto each task, yields better results than a strategy (POFAME) thatassigns the maximum required resources to each task. The pre-liminary results for a real platform evaluation confirmed thesimulation results. Future research will address the platform het-erogeneity in both node computation power and energy consump-tion. With respect to job characterisation, we will also considerdata-intensive jobs to increase the range of applicability of the pro-posed algorithms. Another relevant problem consists of processingworkflows in the cloud, such that jobswhere tasksmayhave prece-dence will also be considered.
Acknowledgement
The authors would like to thank the IBM Portugal Center forAdvanced Studies for providing access to a high-performance IBMCluster, where the real platform experiments were performed.
References
[1] M. Armbrust, A. Fox, R. Griffith, A.D. Joseph, R. Katz, A. Konwinski, et al., Abovethe clouds: a Berkeley view of cloud computing, Technical Report UCB/EECS28, Dept. Electrical Eng. and Comput. Sciences, University of California,Berkeley, 2009.
[2] M. Armbrust, I. Stoica, M. Zaharia, A. Fox, R. Griffith, A.D. Joseph, et al., A viewof cloud computing, Commun. ACM 53 (4) (2010) 50–58.
[3] G. Vallee, T. Naughton, C. Engelmann, H. Ong, S.L. Scott, System-levelvirtualization for high performance computing, in: Proceedings of the 16thEuromicro Conference on Parallel, Distributed and Network-Based Processing,PDP 2008, Toulouse, France, 2008, pp. 636–643. http://dx.doi.org/10.1109/PDP.2008.85.
[4] K. Ye, X. Jiang, S. Chen, D. Huang, B. Wang, Analyzing and modeling theperformance in Xen-based virtual cluster environment, in: Proceedings ofthe 12th IEEE International Conference on High Performance Computingand Communications, HPCC 2010, Melbourne, Australia, 2010, pp. 273–280.http://dx.doi.org/10.1109/HPCC.2010.79.
[5] D. Meisner, B.T. Gold, T.F. Wenisch, PowerNap: eliminating server idle power,in: Proceeding of the 14th International Conference on Architectural Supportfor Programming Languages and Operating Systems, 2009, Washington, DC,USA, pp. 205–216.
[6] A. Beloglazov, J. Abawajy, R. Buyya, Energy-aware resource allocation forefficient management of data centers for Cloud computing, Future Gener.Comput. Syst. 28 (5) (2012) 755–768.
[7] S. Fu, Failure-aware resource management for high-availability computingclusters with distributed virtual machines, J. Parallel Distrib. Comput. 70 (4)(2010) 384–393. http://dx.doi.org/10.1016/j.jpdc.2010.01.002.
[8] A. Sampaio, J. Barbosa, Dynamic power- and failure-aware cloud resourcesallocation for sets of independent tasks, in: Proceedings of the IEEEInternational Conference on Cloud Engineering, IC2E 2013, San Francisco, CA,USA, 2013, pp. 1–10. http://dx.doi.org/10.1109/IC2E.2013.16.
[9] Google cluster data V2. URL: http://code.google.com/p/googleclusterdata/wiki/ClusterData2011_1.
[10] J. Xu, J.A.B. Fortes, Multi-objective virtual machine placement in virtualizeddata center environments, in: Proceedings of the 2010 IEEE/ACM Int’lConference on Green Computing and Communications & Int’l Conference onCyber, Physical and Social Computing, GREENCOM’10, Hangzhou, China, 2010,pp. 179–188. http://dx.doi.org/10.1109/GreenCom-CPSCom.2010.137.
[11] J. Xu, J. Fortes, A multi-objective approach to virtual machine managementin datacenters, in: Proceedings of the 8th ACM International Conference onAutonomic Computing, ICAC 2011, Karlsruhe, Germany, 2011, pp. 225–234.http://dx.doi.org/10.1145/1998582.1998636.
[12] M.Y. Lim, F. Rawson, T. Bletsch, V.W. Freeh, PADD: power aware domaindistribution, in: Proceedings of the 29th IEEE International Conference onDistributed Computing Systems, ICDCS 2009,Montreal, Québec, Canada, 2009,pp. 239–247. http://dx.doi.org/10.1109/ICDCS.2009.47.
[13] C.Y. Lee, A.Y. Zomaya, Energy efficient utilization of resources in cloudcomputing systems, J. Supercomput. 60 (2) (2012) 268–280.
[14] R. Al-Omari, A.K. Somani, G.Manimaran, An adaptive scheme for fault-tolerantscheduling of soft real-time tasks inmultiprocessor systems, J. Parallel Distrib.Comput. 65 (2005) 595–608.
[15] X. Zhu, X. Qin, M. Qiu, QoS-aware fault-tolerant scheduling for real-time taskson heterogeneous clusters, IEEE Trans. Parallel Distrib. Syst. 60 (6) (2011)800–812.
[16] E. Feller, L. Rilling, C. Morin, R. Lottiaux, D. Leprince, Snooze: a scalable,fault-tolerant and distributed consolidation manager for large-scale clus-ters, in: Proceedings of the 2010 IEEE/ACM Int’l Conference on Green Com-puting and Communications & Int’l Conference on Cyber, Physical andSocial Computing, GREENCOM’10, Hangzhou, China, 2010, pp. 125–132.http://dx.doi.org/10.1109/GreenCom-CPSCom.2010.62.
[17] S. Loveland, E.M. Dow, F. LeFevre, D. Beyer, P.F. Chan, Leveraging virtualizationto optimize high-availability system configurations, IBM Syst. J. 47 (4) (2008)591–604. http://dx.doi.org/10.1147/SJ.2008.5386515.
[18] A.B. Nagarajan, F.Mueller, C. Engelmann, S.L. Scott, Proactive fault tolerance forHPC with Xen virtualization, in: Proceedings of the 21st Annual InternationalConference on Supercomputing, ICS’07, Seattle, WA, USA, 2007, pp. 23–32.http://dx.doi.org/10.1145/1274971.1274978.
[19] L. Ramakrishnan, D. Nurmi, A. Mandal, C. Koelbel, D. Gannon, T.M. Huang,et al., VGrADS: enabling eScience workflows on grids and clouds with faulttolerance, in: Proceedings of the Conference on High Performance ComputingNetworking, Storage and Analysis, SC’09, Portland, OR, USA, 2009, p. 47.http://dx.doi.org/10.1145/1654059.1654107.
[20] A. Berl, E. Gelenbe, M. Di Girolamo, G. Giuliani, H. De Meer, M.Q. Dang,K. Pentikousis, Energy-efficient cloud computing, Comput. J. 53 (7) (2009)1045–1051. http://dx.doi.org/10.1093/comjnl/bxp080.
[21] S. Govindan, J. Liu, A. Kansal, A. Sivasubramaniam, Cuanta: quantifying effectsof shared on-chip resource interference for consolidated virtual machines, in:Proceedings of the 2nd ACM Symposium on Cloud Computing, 2011, pp. 1–14.
[22] S. Fu, C.Z. Xu, Exploring event correlation for failure prediction in coalitionsof clusters, in: Proceedings of the 2007 ACM/IEEE Conference on Supercom-puting, SC’07, Reno, NV, USA, 2007, pp. 41:1–41:12. http://dx.doi.org/10.1145/1362622.1362678.
[23] S. Nedevschi, L. Popa, G. Iannaccone, S. Ratnasamy, D.Wetherall, Reducing net-work energy consumption via sleeping and rate-adaptation, in: Proceedings ofthe 5th USENIX NSDI, 2008, pp. 323–336.
[24] W. Kim, M.S. Gupta, G.-Y. Wei, D. Brook, System level analysis of fast, per-core DVFS using on-chip switching regulators, in: IEEE 14th InternationalSymposium on High Performance Computer Architecture, HPCA, 2008,pp. 123–134.
[25] S. Fu, Failure-aware construction and reconfiguration of distributed virtualmachines for high availability computing, in: 9th IEEE/ACM InternationalSymposium on Cluster Computing and the Grid, 2009, pp. 372–379.

A.M. Sampaio, J.G. Barbosa / Future Generation Computer Systems 40 (2014) 30–43 43
[26] C. Clark, K. Fraser, S. Hand, J.G. Hansen, E. Jul, C. Limpach, I. Pratt, A. Warfield,Live migration of virtual machines, in: Proceedings of the 2nd Symposium onNetworked Systems Design and Implementation, NSDI 2005, USENIX, Boston,USA, 2005.
[27] M.R. Hines, K. Gopalan, Post-copy based live virtual machine migration usingadaptive pre-paging and dynamic self-ballooning, in: Proceedings of the ACMInternational Conference on Virtual Execution Environments, 2009, pp. 51–60.
[28] A. Sampaio, J. Barbosa, Optimizing energy-efficiency in high-availablescientific cloud environments, in: Proceedings of the IEEE InternationalConference on Cloud and Green Computing, CGC 2013, Karlsruhe, Germany,2013, pp. 76–83.
[29] M. Stillwell, F. Vivien, H. Casanova, Dynamic fractional resource schedulingversus batch scheduling, IEEE Trans. Parallel Distrib. Syst. 23 (3) (2012)521–529. http://dx.doi.org/10.1109/TPDS.2011.183.
[30] P. Barham, B. Dragovic, K. Fraser, S. Hand, T. Harris, A. Ho, R. Neugebauer,I. Pratt, A. Warfield, Xen and the art of virtualization, in: Proc. 19th ACMSymposium on Operating Systems Principles, SOSP 2003.
[31] Z. Shen, S. Subbiah, X. Gu, J. Wilkes, CloudScale: elastic resource scaling formulti-tenant cloud systems, in: Proceedings of the 2nd ACM Symposium onCloud Computing, 2011.
[32] V. Berten, J. Goossens, E. Jeannot, On the distribution of sequential jobs inrandom brokering for heterogeneous computational grids, IEEE Trans. ParallelDistrib. Syst. 17 (2) (2006) 113–124.
[33] Z. Liu, S. Cho, Characterizing machines and workloads on a Google cluster,in: Proceedings of the International Conference on Parallel ProcessingWorkshops, ICPPW 2012, Pittsburgh, PA, USA, 2012, pp. 397–403. http://dx.doi.org/10.1109/ICPPW.2012.57.
[34] C. Reiss, A. Tumanov, G.R. Ganger, R.H. Katz, M.A. Kozuch, Towards under-standing heterogeneous clouds at scale: Google trace analysis, Intel Scienceand Technology Center for Cloud Computing, Technical Report, 2012, URL:http://www.pdl.cs.cmu.edu/PDL-FTP/CloudComputing/ISTC-CC-TR-12-101.pdf.
[35] C. Walck, Hand-book on statistical distributions for experimentalists, InternalReport SUF-PFY/96-01, Particle Physics Group, Fysikum University of Stock-holm, Stockholm, 2007.
[36] I.S. Moreno, P. Garraghan, P. Townend, J. Xu, An approach for characterizingworkloads in Google cloud to derive realistic resource utilization models,in: Proceedings of the IEEE International Symposium on Service-OrientedSystem Engineering, SOSE 2013, San Francisco, CA, USA, 2013, pp. 49–60.http://dx.doi.org/10.1109/SOSE.2013.24.
[37] B. Schroeder, G.A. Gibson, A large-scale study of failures in high-performancecomputing systems, IEEE Trans. Dependable Secure Comput. 7 (4) (2010)337–350. http://dx.doi.org/10.1109/TDSC.2009.4.
[38] H.A. Lagar-Cavilla, J.A. Whitney, A. Scannell, P. Patchin, S.M. Rumble, Eyal deLara,M. Brudno,M. Satyanarayanan, SnowFlock: rapid virtualmachine cloningfor cloud computing, in: Proceedings of 4th ACM European Conference onComputer Systems, EuroSys, 2009, pp. 1–12.
[39] Linpack, 2012. URL: http://www.netlib.org/linpack/.[40] W. Zhao, P.M. Melliar-Smith, L.E. Moser, Fault tolerance middleware for cloud
computing, in: IEEE 3rd International Conference on Cloud Computing, July2010, pp. 67–74.
[41] L. Cherkasova, D. Gupta, A. Vahdat, Comparison of the three CPU schedulers inXen, Perform. Eval. Rev. 35 (2) (2007) 42.
Altino M. Sampaio received his B.Sc. degree in Electricaland Computer Engineering from the University of Porto,Porto, Portugal, in 2002. Since 2008 he serves as a teacherassistant in several computer science courses at InstitutoPolitécnico do Porto, Porto, Portugal. He started his Ph.D.studies in computer science at the University of Porto,Portugal, in 2009. His research interests are in the fieldsof Cloud and distributed computing systems, especiallyresources scheduling, considering fault tolerance andenergy optimisation in Cloud Computing.
Jorge G. Barbosa received the B.Sc. degree in Electrical andComputer Engineering from the Faculty of Engineering ofthe University of Porto (FEUP), Portugal, the M.Sc. degreein Digital Systems from the University of ManchesterInstitute of Science and Technology, England, in 1993, andthe Ph.D. degree in Electrical and Computer Engineeringfrom FEUP, Portugal, in 2001. Since 2001 he is an AssistantProfessor at FEUP. His research interests are relatedto parallel and distributed computing, heterogeneouscomputing, scheduling in heterogeneous environments,cloud computing and biomedical engineering.