Towards Green Growth in Emerging Market Economies
49
OECD Green Growth Papers Towards Green Growth in Emerging Market Economies EVIDENCE FROM ENVIRONMENTAL PERFORMANCE REVIEWS March 2019 2019-01
Transcript of Towards Green Growth in Emerging Market Economies

OECD Green Growth Papers
www.oecd.org/greengrowth
Towards Green Growth in Emerging Market EconomiesEVIDENCE FROM ENVIRONMENTAL PERFORMANCE REVIEWS
March 2019
2019-01

OECD GREEN GROWTH PAPERS
The OECD Green Growth Strategy, launched in May 2011, provides concrete recommendations and measurement tools to support countries’ efforts to achieve economic growth and development, while at the same time ensure that natural assets continue to provide the ecosystems services on which our well-being relies. The strategy proposes a flexible policy framework that can be tailored to different country circumstances and stages of development. This paper has been authorised for publication by Mr. Rodolfo Lacy, Director, Environment Directorate. OECD Green Growth Papers should not be reported as representing the official views of the OECD, or of its member countries. The opinions expressed and arguments employed are those of the authors. The statistical data for Israel are supplied by and under the responsibility of the relevant Israeli authorities. The use of such data by the OECD is without prejudice to the status of the Golan Heights, East Jerusalem and Israeli settlements in the West Bank under the terms of international law. This document and any map included herein are without prejudice to the status of or sovereignty over any territory, to the delimitation of international frontiers and boundaries and to the name of any territory, city or area.
OECD Green Growth Papers aim to describe preliminary results or research in progress by the author(s) and are published to stimulate discussion on specific topics and obtain feedback from interested audiences.
They complement the OECD Green Growth Studies series, which aims to provide in-depth reviews of the green growth issues faced by different sectors.
Comments on Green Growth Papers are welcomed, and may be sent to:
OECD Green Growth Unit, 2, rue André Pascal, 75775 PARIS CEDEX 16, France or by email to [email protected].
---------------------------------------------------------------------------
OECD Green Growth Papers are published on:
www.oecd.org/greengrowth
---------------------------------------------------------------------------
Please cite this paper as: Capozza, I. and Samson, R. (2019), “Towards Green Growth in Emerging Market Economies: Evidence from Environmental Performance Reviews”, OECD Green Growth Papers, 2019-01, OECD Publishing, Paris. © OECD 2019 You can copy, download or print OECD content for your own use, and you can include excerpts from OECD publications, databases and multimedia products in your own documents, presentations, blogs, websites and teaching materials, provided that suitable acknowledgment of OECD as source and copyright owner is given. Applications for permission to reproduce or translate all or part of this material should be made to: OECD Publishing, [email protected].

2 │
TOWARDS GREEN GROWTH IN EMERGING MARKET ECONOMIES © OECD 2019
Table of contents
Foreword ................................................................................................................................................ 4
Executive summary ............................................................................................................................... 5
1. Introduction ....................................................................................................................................... 7
2. Emerging market economies need to accelerate the green growth transition ............................. 8
3. Emerging market economies need strategic direction and supporting institutional frameworks ...................................................................................................................................... 13
4. Progress in using environmentally related taxes and pricing CO2 emissions has been slow .... 16
4.1. Taxes on energy and transport .................................................................................................... 16 4.2. Taxes on non-renewable resources ............................................................................................. 18
5. Further effort is needed to reduce environmentally harmful subsidies ..................................... 20
5.1. Fossil fuel subsidies .................................................................................................................... 20 5.2. Agricultural subsidies ................................................................................................................. 22
6. Increased investment in sustainable infrastructure is critical ..................................................... 25
6.1. Energy infrastructure .................................................................................................................. 27 6.2. Transport Infrastructure .............................................................................................................. 30 6.3. Water, sanitation and waste infrastructure .................................................................................. 31
7. Eco-innovation is key to capturing opportunities from green growth ........................................ 35
7.1. Eco-innovation performance and policy ..................................................................................... 35 7.2. Environmental goods and services markets ................................................................................ 36
8. Reducing poverty and social exclusion are essential to green growth ........................................ 39
8.1. Domestic policies ........................................................................................................................ 39 8.2. Development co-operation .......................................................................................................... 41
Notes ..................................................................................................................................................... 44
References ............................................................................................................................................ 45
Tables
Table 1. Economic costs of environmental degradation and natural resource depletion ...................... 11 Table 2. Perceived quality of infrastructure .......................................................................................... 25 Table 3. Environmental conflicts in selected emerging market economies .......................................... 40
Figures
Figure 1. More people have higher incomes, but inequality remains high .............................................. 8 Figure 2. Emerging market economies face significant environmental pressures ................................ 10 Figure 3. Revenue from environmentally related taxation has declined ............................................... 16 Figure 4. Support to fossil fuel consumption is high in many countries ............................................... 20

│ 3
TOWARDS GREEN GROWTH IN EMERGING MARKET ECONOMIES © OECD 2019
Figure 5. Support to farmers has declined in many countries ............................................................... 23 Figure 6. Most emerging market economies rely on fossil fuels for power generation ........................ 28 Figure 7. Revenue from tariffs covers operating costs in many emerging market economies .............. 33 Figure 8. Environmental technology is an increasingly important component of innovation ............... 35 Figure 9. Environment-related aid has grown in most emerging market economies ............................ 42 Figure 10. Emerging market economies increasingly provide aid to other countries ........................... 43
Boxes
Box 1. The world’s largest social protection program: Brazil’s Bolsa Familia ...................................... 9 Box 2. Green growth challenges in Brazil, Chile, Colombia, Indonesia, Mexico, Peru, South Africa
and Turkey ................................................................................................................................. 11 Box 3. South Africa’s Green Economy Accord .................................................................................... 15 Box 4. Chile’s new taxes on CO2, air pollutants and vehicles .............................................................. 18 Box 5. Mexico’s reform of transport fuel subsidies .............................................................................. 21 Box 6. Improved targeting of electricity subsidies in Indonesia ........................................................... 22 Box 7. Examples of road, water and waste pricing ............................................................................... 26 Box 8. Peru’s law on investment promotion for economic growth and sustainable development ........... 27 Box 9. Brazil’s investment in renewable energy ................................................................................... 29 Box 10. Promotion of industrial energy efficiency in Turkey ............................................................... 30 Box 11. Medellin’s public transport system .......................................................................................... 31 Box 12. Examples of subsidies for basic services ................................................................................. 32 Box 13. Full-cost recovery and affordability in setting wastewater tariffs in Turkey ........................... 33 Box 14. Chile’s international centres of excellence .............................................................................. 36 Box 15. The Indonesian Programme for Pollution Control, Evaluation and Rating ............................. 37 Box 16. South Africa’s Working for Water programme ....................................................................... 40 Box 17. Managing socio-environmental conflict in Peru ...................................................................... 41

4 │
TOWARDS GREEN GROWTH IN EMERGING MARKET ECONOMIES © OECD 2019
Foreword
This paper provides a cross-country review of progress towards green growth in selected emerging market economies that are members or partners of the OECD. It draws on the OECD’s Environmental Performance Reviews conducted for Brazil, Chile, Colombia, Mexico, Peru, South Africa and Turkey between 2013 and 2018, as well as the mid-term progress report presented by Mexico in 2018 and the OECD Green Growth Policy Review of Indonesia (forthcoming in 2019). It presents the main achievements in the countries reviewed, along with common trends and policy challenges. It provides insights into the effectiveness and efficiency of green growth policy frameworks and measures, which may provide useful lessons for other OECD and partner countries.
Unless otherwise indicated, all information comes from the reviews of the selected countries. As the reviews were conducted over several years, information for some countries may be more recent than others. However, the paper takes into account major policy changes since these countries’ reviews depending on information availability, and presents updated data and indicators across selected countries. The figures presented in this report are based on data available up to October 2018.
The authors of the report are Rachel Samson of Carist Consulting and Ivana Capozza of the OECD Environment Directorate. Nathalie Girouard, Head of the Environmental Performance and Information Division at the OECD Environment Directorate, provided oversight and guidance. Mauro Migotto provided statistical support and Annette Hardcastle provided administrative support. Natasha Cline-Thomas and Lupita Johanson prepared the report for publication.
The OECD Environmental Policy Committee and its Working Party on Environmental Performance reviewed the paper. It also benefited from comments and suggestions of several colleagues from the OECD Economics Department and Environment Directorate including Gérard Bonnis, Falilou Fall, Andrés Fuentes Hutfilter, Eija Kiiskinen, Britta Labuhn, Xavier Leflaive, Christine Lewis, Jaco Tavenier, Lisa Meehan and Frédérique Zegel.
Keywords: environment and development; green growth; environmental policy; natural resources; environmental taxes and subsidies; clean technology; infrastructure.
JEL code(s): O13, 044, Q55, Q56, Q58.

│ 5
TOWARDS GREEN GROWTH IN EMERGING MARKET ECONOMIES © OECD 2019
Executive summary
There is a need to accelerate the green growth transition. Economic growth has helped lift millions of people out of poverty in emerging market economies (EMEs). Many of them are adopting new strategies, policies and governance structures aimed at improving environmental performance. However, growing environmental damage and resource degradation pose significant risks for EMEs, which depend on natural resources. Chile, Colombia, Brazil, Indonesia and Turkey are among the top 10 OECD and partner countries in terms of contribution of subsoil assets to economic growth. EMEs are also vulnerable to climate change, water scarcity, soil degradation, biodiversity loss and pollution.
Emerging market economies need strategic direction and supporting institutional frameworks to fully align growth and environmental objectives. Brazil, Chile, Colombia, Indonesia, Mexico, Peru, South Africa and Turkey have all begun to set sustainable development or green growth strategic frameworks, or to integrate the Sustainable Development Goals in their economic development planning documents. Chile, Colombia, Mexico and Peru have also developed, or are in the process of developing, a set of green growth indicators tailored to the circumstances of their countries, drawing on the OECD’s 2011 Green Growth Indicator framework. However, all countries face governance and implementation challenges, partly due to inadequate human and financial capacity. Where ministerial and other co-ordinating bodies relating to green growth are in place, they are often not strong enough to break down silos across institutions and policies. Responsibilities for delivering results are often not clearly identified, and there is no mechanism to hold those with responsibilities accountable for delivering results.
Progress in using environmentally related taxes and pricing CO2 emissions has been slow. Most EMEs have traditionally made little use of pricing instruments. Fuels are generally little taxed due to equity concerns, but some countries have introduced or announced tax reforms that would raise fuel taxes. Chile, Colombia and Mexico introduced carbon taxes. These reforms go in the right direction, although the implied carbon prices remain relatively low and many sectors are exempt. In 2015, the share of carbon dioxide (CO2) emissions from energy use facing a carbon price signal varied from 12% in South Africa to 62% in Mexico. Vehicle taxation does not usually consider vehicles’ environmental performance. In some countries, vehicle taxes push consumers towards older, used vehicles. Chile’s approach to the taxation of passenger vehicles can be a model for other countries. Non-renewable resources are generally a significant source of fiscal revenue for many EMEs. Countries need to ensure that natural resource rents are sufficiently taxed.
Further effort is needed to reduce environmentally harmful subsidies. Many EMEs subsidise use of fossil fuels at levels well above the average of OECD countries. Some countries have made important strides to cut these subsidies. Indonesia and Mexico implemented major reforms of transport fuel subsidies, and South Africa has gradually phased out subsidies for coal-based electricity generation. However, other countries such as Brazil, Peru and Turkey have been sliding backwards. Replacing subsidies for fuel use with direct cash transfers to low-income households would better target poverty while providing a greater incentive to limit energy consumption. This would primarily require improving the tax/transfer system in many EMEs, however. Agricultural subsidies have declined as a percentage of gross farm receipts over the past decade across many EMEs,

6 │
TOWARDS GREEN GROWTH IN EMERGING MARKET ECONOMIES © OECD 2019
and their level is generally below the OECD average. However, support remains largely tied to agricultural production. This potentially encourages overuse of land, water, fertilisers and pesticides. Environmental criteria are rarely integrated in agricultural support programmes.
Increased investment in sustainable infrastructure is critical. Infrastructure investment should contribute to using resources and energy efficiently, to reducing emissions of greenhouse gases (GHGs) and to improve resilience of infrastructure to climate change. However, many EMEs do not systematically and effectively integrate environmental or climate change adaptation criteria into infrastructure investment strategic decisions. Investment in renewable energy and water supply and sanitation has grown substantially, but further effort is needed to expand services to remote and rural areas, improve energy efficiency, extend rail and public transit and improve waste infrastructure. Regulatory uncertainty has slowed investment in renewables in some countries. There are examples of effective use of charges and mechanisms to mobilise the private sector to finance investment in infrastructure and service provision, as well as to engage the financial sector in promoting green investment. However, there is a need to improve control, efficiency, transparency and integrity of procurement processes related to infrastructure projects, and to streamline the administrative procedures for granting environmental permits.
Eco-innovation is key to capturing opportunities from green growth. Innovation policies in EMEs have given progressively more emphasis to environmental technology, although in an often inconsistent manner. In many EMEs, environmental technology account for at least 10% of all patents registered by residents in those countries. Brazil, Chile, Indonesia and Mexico are part of the Mission Innovation initiative that commits members to double their clean energy research and development (R&D) spending by 2021. There is some evidence that environmental goods and services (EGS) markets are growing in EMEs thanks to better environmental regulations and increased infrastructure investment. To fully benefit from these market opportunities, these countries need to strengthen environmental regulations and their enforcement, enhance the use of pricing instruments, and extend green procurement and eco-labelling programmes. This would stimulate demand for environmental technology. There is also a need to improve the information base about the EGS market and job opportunities.
Reducing poverty and social exclusion are essential to green growth. Environmental policies can impose costs on the most vulnerable. Development projects in sectors such as mining and energy can disrupt local natural resources that are essential to the livelihood of rural communities. This has often resulted in environmental conflicts in many EMEs. Systematic environmental assessment of projects, better public participation in decision making and careful consideration of distributional impacts of policies are needed to help address these conflicts. Brazil’s Bolsa Floresta, Indonesia’s social forestry concessions and South Africa’s Working for Water programme are all examples of effective programmes that provide job opportunities in environmental conservation activities to vulnerable population groups. Development co-operation can help leverage domestic resources to help address environmental and poverty alleviation objectives in an integrated way.

│ 7
TOWARDS GREEN GROWTH IN EMERGING MARKET ECONOMIES © OECD 2019
1. Introduction
Emerging market economies (EMEs)1 have experienced unprecedented growth in the last decades. However, current trends of population and economic growth in many such economies have increased pressures on their natural resources and environment. This has drawn attention to the need to shift towards a development path that avoids locking-in environmentally harmful infrastructure and leaving a legacy of costly environmental damage and resource degradation.
Green growth has emerged as an approach to foster economic growth while ensuring that natural assets continue to provide the resources and environmental services on which the well-being of societies relies. This approach implies to cost-effectively address environmental challenges without exacerbating inequality or poverty, while generating and capturing economic opportunities in domestic and international markets for environmental goods and services. Carefully designed and implemented green growth policies can help countries sustainably manage their natural assets for future generations; reduce poverty; generate economic growth and job opportunities; develop resilient infrastructure; improve access to clean water and sanitation; diversify energy supplies; lower pollution and greenhouse gas (GHG) emissions; and provide more secure livelihoods for rural and poor populations that depend on natural resources (OECD, 2013a). Green growth is the operational policy toolkit that can help OECD member and non-member countries achieve the Sustainable Development Goals (SDGs) adopted in September 2015 by the United Nations General Assembly.
June 2019 will mark 10 years since the adoption of the OECD Green Growth Declaration, which now counts several EMEs among its Adherents. The OECD has reviewed countries’ progress towards green growth in all of its Environmental Performance Reviews (EPRs) since 2010. These include the EPRs of more than 30 OECD member countries and five partner countries. These reviews show that both developed countries and EMEs still struggle to make the changes needed to fully integrate economic and environmental decision making.
This paper draws on the EPRs of Brazil, Chile, Colombia, Mexico, Peru, South Africa and Turkey conducted between 2013 and 2018, as well as the mid-term progress report presented by Mexico in 2018 and the OECD Green Growth Policy Review (GGPR) of Indonesia (forthcoming in 2019). Unless otherwise indicated, all information comes from the reviews of the selected EMEs. The paper takes into account major policy changes since the EPRs of these countries depending on information availability, and presents updated data and indicators across selected EMEs. As these countries were reviewed over several years, information for some countries may be more recent than others.
The paper aims to provide a sense of progress and challenges towards green growth in these countries. It presents the main achievements, policy challenges and lessons learnt, including best practices and areas requiring reform. The policy recommendations emerging from the reviews may provide useful lessons for other OECD member and partner countries to accelerate their transition towards green growth.

8 │
TOWARDS GREEN GROWTH IN EMERGING MARKET ECONOMIES © OECD 2019
2. Emerging market economies need to accelerate the green growth transition
Strong economic growth in emerging market economies (EMEs) over the past decade (Figure 1) has helped lift millions of people out of poverty, but has often led to growing environmental damage and resource degradation. This poses risks for future economic growth and well-being, as EMEs are more dependent on natural resources and more vulnerable to risks from climate change. EMEs are also a critical part of achieving global environmental objectives, such as reducing GHG emissions and slowing biodiversity loss.
Figure 1. More people have higher incomes, but inequality remains high
Note: In left panel, data for Peru refer to 2016; in right panel, 2005-14 data for South Africa, 2005-15 data for Brazil and Russian Federation, 2006-15 data for Chile, 2008-12 data for the People’s Republic of China, 2013 data for Indonesia, 2011 data for India. The Gini coefficient measures the extent to which the distribution of income (before taxes) among individuals or households within an economy deviates from a perfectly equal distribution. It is 0 in case of perfect equality and 100 in case of maximal inequality. Source: OECD (2018), “Green growth indicators”, OECD Environment Statistics (database); World Bank (2018), World Bank Indicators (database).
Natural resource extraction is a key driver of growth in many EMEs. Chile, Colombia, Brazil, Indonesia and Turkey are among the top 10 OECD and partner countries in terms of contribution of subsoil assets to economic growth (OECD, 2017a). Agriculture represents a relatively large share of employment in many EMEs (often above 10%), while industry contributes about 20% to 40% of value added. The OECD has recommended policy reforms to raise productivity, boost competitiveness, lower trade barriers and reduce administrative burden. Investment in energy and transport infrastructure, innovation and skills policies, agricultural modernisation and efforts to address labour informality and corruption will be particularly important to support long-term growth (OECD, 2018a).
Emerging market and developing economies are now home to over 80% of the world’s population. They also continue to face significant challenges with inequality. Inequality can foster mistrust in new developments, investment and policy changes, potentially leading to conflict. Poverty, inequality and disparities in accessing basic services have fallen over the past decade in most EMEs (Figure 1). Targeted social transfers such as
5 000
10 000
15 000
20 000
25 000
Real GDP per capita
2017 2005
USD, 2010 prices
010203040506070
Gini coefficient
2016 2005

│ 9
TOWARDS GREEN GROWTH IN EMERGING MARKET ECONOMIES © OECD 2019
Brazil’s Bolsa Familia have contributed to this outcome (Box 1). Inequality remains widespread, however. In Latin America, poverty still affects 25% of the population, and 40% of the population can fall back into poverty as a result of negative shocks. The region has among the highest levels of inequality in the world (OECD/ECLAC/CAF, 2018).
Box 1. The world’s largest social protection program: Brazil’s Bolsa Familia
In 2003, Brazil’s government launched the social protection programme Bolsa Familia to consolidate four programmes into one unified conditional cash transfer programme. Beneficiaries receive, on average, BRL 70 per month in direct transfers conditional on school attendance and regular health checks. The government launched an active search policy and established a unified social programme registry to consolidate information and statistics about income and living standards. In 2011, Bolsa Familia was expanded to increase beneficiaries’ income, expand access to public goods and services and provide support for finding jobs and other income opportunities. It is now the world’s largest social protection programme: in 2013 it reached 11 million families, or 50 million people, about one quarter of Brazil’s population.
Bolsa Familia has helped improve the living standards of Brazil’s poorest families. It is estimated that the programme contributed to between 33% and 50% of the drop in extreme poverty and helped reduce inequality (as measured by the Gini coefficient) by 15% to 20%. It has had a significant multiplier effect on household consumption (2.4) and gross domestic product (GDP) (1.8), and helped reduce regional inequality. Beneficiaries tend to have better health care provision. Children under the programme tend to have lower dropout and higher progression rates in education. The programme is well-targeted, and its overall cost is about 0.5% of GDP.
Source: OECD (2015), OECD Environmental Performance Reviews: Brazil 2015.
At the same time, environmental pressures are rising. While GHG emissions have declined in OECD countries, they are growing rapidly in EMEs (Figure 2). However, some countries are improving their carbon dioxide (CO2) productivity, in terms of getting more gross domestic product (GDP) per unit of emissions produced than in the past. There has been little progress in non-energy material use productivity, implying that resource use efficiency is not improving. Air pollution has also been getting worse (Figure 2), mainly due to increased use of, often old, vehicles and continued used of solid fuels for home heating and cooking. Air pollution is a significant health concern in major metropolitan area, as well as in rural areas. Water scarcity is a growing issue in certain regions, which is expected to be exacerbated by climate change. Performance on deforestation is mixed. Forest area has increased in Chile and Turkey, but has continued to decline in other countries. Brazil, Colombia and Mexico have managed to reduce forest loss in the last decade (FAO, 2015; Figure 2), although there are signs that deforestation has been rising again in Brazil (OECD, 2018b).

10 │
TOWARDS GREEN GROWTH IN EMERGING MARKET ECONOMIES © OECD 2019
Figure 2. Emerging market economies face significant environmental pressures
Note: The accuracy of PM2.5 exposure estimates varies considerably by location. Accuracy is poor in areas with few monitoring stations and in areas with very high PM2.5 concentrations such as Africa, the Middle-East and South Asia. Accuracy is generally good in regions with dense monitoring station networks. Source: FAO (2018), FAOSTAT (database); OECD (2018), “Green growth indicators”, OECD Environment Statistics (database); OECD (2018), “Air quality and health: Exposure to PM2.5 in countries and regions”, OECD Environment Statistics (database).
Estimates of some of the economic costs of environmental degradation highlight the importance of a swift transition to green growth (Table 1). Economic growth in EMEs has often come at the expense of environmental quality. Adjusting the economic growth rates of Brazil, Chile, Colombia, Indonesia, Mexico, South Africa and Turkey for pollution abatement would reduce their GDP growth in 1991-2013 between 0.17 and 1.11 percentage points (OECD, 2017a; Table 1). A solid evidence base is needed to understand the link between the economy and the environment. Mexico was among the first countries to develop and implement a system of integrated economic and environmental accounting in the early 1990s, which has been updated regularly since then (OECD, 2013b).
050
100150200250300
Production-based CO2 emissions
2015 2005
Index 2000=100
02468
10
Production-based CO2 productivity, GDP per unit of energy-related CO2 emissions
2015 2005
USD/kg, 2010 prices
020406080
100
Mean population exposure to PM2.5
2017 2005
Micrograms/m3
WHO guideline
-2 000-1 500-1 000- 500
5001 0001 5002 000
Average annual change in forest cover
2010-16 2005-10
1 000 ha/yr

│ 11
TOWARDS GREEN GROWTH IN EMERGING MARKET ECONOMIES © OECD 2019
Table 1. Economic costs of environmental degradation and natural resource depletion
Brazil Adjusting economic growth for pollution abatement would reduce GDP growth by 0.38 percentage
points in 1991-2013. Chile If the growth accounting framework considered emissions of GHGs and air pollutants, Chile’s GDP
growth would be lower by nearly 0.17 percentage points in 1991-2013. Colombia The health costs of air pollution (urban and indoor) and inadequate water and sanitation are
estimated at 2% of GDP. Indonesia Adjusting economic growth for pollution abatement would reduce GDP growth by 0.25 percentage
points in 1991-2013. Mexico The costs of environmental degradation and natural resource depletion represented an estimated
7% of GDP in 2010. The costs of air pollution alone represent around 4% of GDP. Peru The cost of environmental damage represented an estimated 4% of GDP in the early 2000s, mostly
associated to the health impact of water pollution, indoor and outdoor air pollution, and lead exposure.
South Africa Adjusting economic growth for pollution abatement would reduce GDP growth by 0.17 percentage points in 1991-2013.
Turkey Adjusting economic growth for pollution abatement would reduce GDP growth by 1.11 percentage points in 1991-2013.
Note: The scope of economic costs of environmental degradation varies widely across countries due to methodological differences. Source: OECD (2013), OECD Environmental Performance Reviews: Mexico 2013; OECD (2014), OECD Environmental Performance Reviews: Colombia 2014; OECD (2016), OECD Environmental Performance Reviews: Chile 2016; OECD (2017), Green Growth Indicators 2017; OECD/ECLAC (2017), OECD Environmental Performance Reviews: Peru 2017.
Overall, Brazil, Chile, Colombia, Indonesia, Mexico, Peru, South Africa and Turkey are making progress towards green growth, with new strategies, policies and governance structures aimed at improving environmental performance. However, not all countries are positioning themselves to take advantage of green growth opportunities, and efforts need to be expanded and accelerated to keep pace with population and economic growth. A snapshot of the challenges facing the eight countries is included in Box 2.
Box 2. Green growth challenges in Brazil, Chile, Colombia, Indonesia, Mexico, Peru, South Africa and Turkey
Brazil has significantly reduced deforestation in the Amazon, but agricultural expansion continues to threaten forests and native vegetation and to affect water and soil quality. Traffic congestion and air pollution have increased in most cities. Inadequate sanitation and wastewater treatment infrastructure has also led to water and soil contamination, and water scarcity has become a significant issue in certain regions. The government has implemented several positive measures towards green growth, but the integration of environmental, social and economic objectives has largely been ad hoc to date.
Chile has made progress in pricing resource use and pollution and has expanded energy, transport and water infrastructure. However, reliance on natural resources, urbanisation and rising living standards are increasing environmental pressures, including air pollution, loss of native forests, soil erosion, and soil and water contamination. Climate change is expected to exacerbate water scarcity in the northern regions.
Colombia continues to experience extremely high income inequality and concentration of landholdings. The poor lack access to environmental services such as water and sanitation and suffer the most from pollution and hazardous chemicals. Colombia has introduced several policy

12 │
TOWARDS GREEN GROWTH IN EMERGING MARKET ECONOMIES © OECD 2019
initiatives aimed at addressing environmental pressures, but a lack of coherence between economic sectoral plans and environmental goals persists.
Continued deforestation and strong reliance on fossil fuels make Indonesia one of the world’s largest GHG emitters. Pressures on the country’s natural resources and biodiversity have grown. Waste, water, energy and transport services need to be extended to cope with growing population and urbanisation. The government has taken steps towards green growth, including by substantially reducing fossil fuel subsidies in recent years. It aims to make the National Medium-Term Development Plan 2020-24 Indonesia’s first “low-carbon national development plan”.
Mexico faces increasing environmental pressures from population growth and urbanisation, including high motorisation rates, rising GHG emissions and limited access to drinking water and sanitation. Pressures on the country’s rich biodiversity remain intense. Production and consumption patterns have generally been less energy- and material-intensive than in more developed economies, but the gap has narrowed. Mexico has made several important reforms in recent years, moving away from transport fuel subsidies, introducing a carbon tax, increasing protection of biodiversity and embracing climate change as a policy priority.
Pressures from the extractive industry, unplanned urbanisation and deforestation have increased in Peru. The country is also highly vulnerable to the impact of climate change and natural disasters. Peru has strengthened its environmental institutions and legal framework, but more needs to be done to ensure effective implementation of environmental policies. There is a lack of consistency between development policies, often relying on natural resource extraction, and environmental goals.
South Africa’s economy has been historically driven by mining, manufacturing and agriculture, all highly dependent on low-priced water and coal-based electricity. It suffers from water scarcity and faces significant infrastructure gaps to provide environmental services and address transport congestion and pollution. South Africa has made efforts to increase the use of renewables, although coal-based electricity remains dominant. It has incorporated environmental goals in its national development framework and made strides to engage the business community in achieving these goals.
Turkey has made progress in relatively decoupling its economic growth from environmental pressures such as air emissions, energy and water use, and waste generation. However, rapid economic and population growth, together with urbanisation, is likely to aggravate these pressures. Fossil fuel subsidies and investment in new coal facilities are likely to slow progress towards a greener economy. Integration of environmental protection into economic plans and implementation of key environmental policies need to be accelerated. However, there are signs of emerging eco-innovation and new industry-led initiatives in improving environmental sustainability.
Source: OECD (2013), OECD Environmental Performance Reviews: Mexico 2013; OECD (2013), OECD Environmental Performance Reviews: South Africa 2013; OECD (2014), OECD Environmental Performance Reviews: Colombia 2014; OECD (2015), OECD Environmental Performance Reviews: Brazil 2015; OECD (2016), OECD Environmental Performance Reviews: Chile 2016; OECD (2019), OECD Environmental Performance Reviews: Turkey; OECD (forthcoming 2019), OECD Green Growth Policy Review of Indonesia; OECD/ECLAC (2017), OECD Environmental Performance Reviews: Peru 2017.

│ 13
TOWARDS GREEN GROWTH IN EMERGING MARKET ECONOMIES © OECD 2019
3. Emerging market economies need strategic direction and supporting institutional frameworks
Green growth means effectively aligning economic growth and environmental objectives. This requires fully mainstreaming green growth across ministries and sub-national organisations, on the one hand, and into relevant sectoral policies, programmes and regulations, on the other. This is particularly important in emerging market economies (EMEs), where some of the most important sectors in terms of employment and GDP are also major sources of environmental damage and resource degradation. Agriculture, fisheries, forestry, mining, oil and gas extraction, and transport should be prime targets for green growth mainstreaming. However, environment has traditionally been the exclusive domain of environmental ministries, and other institutions often lack the capacity or direction needed to contribute effectively.
OECD research and EPRs have highlighted some core elements that are essential for an effective mainstreaming of green growth (OECD, 2015a):
• High-level strategic direction – all ministries need clear mandates from heads of government.
• Accountability – those with responsibilities should be held accountable for results. • Resources – adequate financial and human resources are essential to
implementation. • Knowledge dissemination – widely sharing research, data, analysis and lessons
learned is crucial.
The eight EMEs considered in this report have mixed results on each of these elements. The foundation of high-level strategic direction is beginning to be established. Chile, Colombia, Mexico, Peru and Turkey have adhered to the 2009 OECD declaration on Green Growth. Chile developed the National Programme on Sustainable Consumption and Production and is in the process of updating its 2013 Green Growth Strategy. Mexico and Turkey have made inclusive green growth and sustainable development as core principles and objectives of their recent national development plans. South Africa’s national economic framework for 2010-20 – the New Growth Path – incorporates social inclusiveness and green growth. Colombia’s Constitution calls for the systematic integration of environmental goals into national development plans, and the 2010-14 National Development Plan devoted an entire chapter to environmental sustainability and risk prevention. Brazil has a sustainable development strategy and a national plan on sustainable consumption and production. Indonesia aims to make the National Medium-Term Development Plan (RPJMN) 2020-24 its first “low-carbon national development plan” that would balance economic, poverty reduction and environmental goals. Since 2014, Peru’s government has been working on incorporating green economy principles in national development planning, including through the development of a green growth strategy.
However, progress on accountability has been less encouraging. A number of countries have ministerial and other co-ordinating bodies relating to green growth or sustainable development, such as Turkey’s National Sustainable Development Commission. However, these co-ordinating bodies are often not strong enough to break down silos across institutions and improve consistency across policies. There is often no shared responsibility for delivering results, leaving environment ministries as one voice among competing

14 │
TOWARDS GREEN GROWTH IN EMERGING MARKET ECONOMIES © OECD 2019
ministries. There is often a lack of focus, coherence and efficiency. In Brazil, for example, with over 400 interagency committees, boards and working groups related to environmental issues, it can be costly and time consuming for member agencies to participate in decision making (OECD, 2015b). In Colombia, responsibility for policy implementation is at the sub-national level, with 33 Autonomous Regional Corporations (CARs). The environment ministry oversees and co-ordinates the activities of the CARs, but does not have the power to enforce direction or consistency (OECD, 2014a). This is common to many unitary and federal countries.
South Africa has developed a model of accountability that could be replicated in other countries. As part of its 2009-14 Medium-Term Strategic Framework, South Africa’s president and ministers signed a number of performance agreements on the implementation of 12 government outcomes, including one related to the protection and enhancement of environmental assets and natural resources. The agreements describe the contribution of respective ministries to the delivery of each outcome and have resulted in significant mainstreaming of environmental considerations into the policies, measures and programmes of other government departments (OECD, 2013c). Similarly, Peru’s National Environmental Action Plan 2011-21 specifies the priority targets and the strategic actions to achieve them, and it provides indicators to evaluate implementation by environmental authorities at the three levels of government (OECD/ECLAC, 2017).
All countries face implementation difficulties, partly due to inadequate human and financial capacity. The capacity of sub-national governments is a common problem, with many local governments lacking the finances needed to effectively implement national policy direction or actively participate in co-ordination. Poorer, more remote regions often face the most significant challenges.
Knowledge is essential to making progress. Scientific and economic research on environmental issues helps establish priorities and thresholds; data allows for effectively targeting policies and measuring progress; policy analysis helps determine the best approach; and lessons learned from other countries and jurisdictions that have tackled similar issues in the past help ensure that the leading practices are put in place. Colombia’s 2008 Strategic Environmental Assessment on Environmental Health, for example, paved the way for its Air Pollution Prevention and Control Policy. The OECD systematically monitors a set of green growth indicators to help countries assess and compare their progress towards green growth (OECD, 2017a). Green growth indicators are also an important part of effective policy selection, design, prioritisation and review.
Chile, Colombia, Mexico and Peru have developed, or are in the process of developing, a set of green growth indicators tailored to the circumstances of their countries, drawing on the OECD’s Green Growth Indicator framework. Chile, for example, added behavioural and wellbeing indicators, and Mexico added indicators on productivity of wastewater treatment services, subsidies to electric power services and companies with green certifications (OECD, 2014b). Colombia and Peru are part of a multi-country initiative to establish a framework to monitor green growth in the Latin American region.2 Turkey’s sustainable development indicators are relatively comprehensive, including a set of 80 SDG indicators. The Indonesian Ministry of National Development Planning is building modelling capacity on economy-environment interlinkages, in collaboration with national and international academic institutions, to support the development of the RPJMN 2020-24 (OECD, forthcoming 2019a). Yet data limitations continue to be a challenge for many EMEs.

│ 15
TOWARDS GREEN GROWTH IN EMERGING MARKET ECONOMIES © OECD 2019
Mainstreaming environmental and green growth considerations requires both clear strategic direction and effective implementation instruments. South Africa chose to pursue a partnership approach with business, trade unions and community organisations through its Green Economy Accords (Box 3). Chile has used Clean Production Agreements (APLs) to encourage environmental performance improvements in production sectors that go beyond minimum legal requirements. Estimates suggest that APLs will contribute to reducing GHG emissions by 18.4 million tonnes of CO2 by 2020 (OECD, 2016a). Mexico established a dedicated unit in its environment ministry to co-ordinate the contributions of sectors to environmental sustainability objectives and track sector progress. Draft plans and programmes have been the subject of strategic environmental assessment since 2005 in Peru and since 2009 in Indonesia.
Box 3. South Africa’s Green Economy Accord
In 2011, South Africa launched a Green Economy Accord built on multi-stakeholder partnerships. The Accord covered 12 areas including renewable energy, energy efficiency, green products, waste management practices, biofuels for vehicles and clean-coal, extending transport and electricity infrastructure, and green employment and skills development. The partnership approach brought together government with business, trade unions and community organisations to build shared objectives and approaches. It integrated environmental objectives into the economic growth ambitions of the South African business community and public concern regarding job creation.
The Accord was estimated to cost ZAR 220 billion (USD 14.4 billion) over five years, equivalent of 1.6% of GDP. The goal was to start with an initial injection of government funding that would progressively shift to full reliance on private sources by 2025. The South African Green Fund was established in 2012 with an initial budget of ZAR 800 million (USD 52 million) as catalytic finance for high-impact green economy projects, support for institutional and technical capacity, and to attract additional resources to support green economy development. The Industrial Policy Action Plan also provided support to green industries and industrial energy efficiency, and helped build renewable energy generation.
However, the implementation of the Accord faced some criticism. Despite establishing ambitious, time-bound targets for each of the 12 shared commitments, some felt that the government had failed to deliver on the promises. Capacity constraints, a lack of policy co-ordination and insufficient evidence supporting the job creation potential of initiatives slowed progress. South Africa’s experience highlights the importance of providing adequate resources and effective institutional co-ordination mechanisms for implementation, and closely aligning efforts with programmes targeted more generally at economic growth and employment objectives.
Source: OECD (2013), OECD Environmental Performance Reviews: South Africa 2013.

16 │
TOWARDS GREEN GROWTH IN EMERGING MARKET ECONOMIES © OECD 2019
4. Progress in using environmentally related taxes and pricing CO2 emissions has been slow
Greening the tax system and implementing environment-related pricing instruments helps to shift consumer and producer behaviour towards more environmentally beneficial actions, goods and services. These instruments offer an opportunity to cost-effectively meet environmental objectives, stimulate innovation and investment, and generate revenue that can be used to offset impacts on vulnerable households or businesses, reduce distortionary taxes, or invest in infrastructure and social programmes. However, in most emerging market economies (EMEs) tax and pricing instruments are not well developed. There is generally a preference for encouraging the purchase of cleaner goods (such as vehicles and home appliances) through subsidies as opposed to putting a price on environmentally damaging behaviour (i.e. the use of such goods) in line with the polluter pays principle.
4.1. Taxes on energy and transport
As in most countries, the majority of environmentally related tax revenue in the eight EMEs included in this report comes from taxes on energy products, primarily transport fuels, and vehicles. Environmentally related taxation has decreased as a percentage of total tax revenue and as a percentage of GDP in a number of EMEs, as well as on average in the OECD (Figure 3).
Figure 3. Revenue from environmentally related taxation has declined
Source: OECD (2018), “Environmental policy instruments”, OECD Environment Statistics (database).
Energy taxation should reflect the environmental costs that energy production and use imposes on society, such as GHG emissions and air pollution. This would encourage reduced energy use and investment in energy efficient and renewable energy technology. In most OECD countries and EMEs alike, however, tax rates do not fully reflect environmental costs of energy production and use due to low rates and several exemptions and discounts. Most EMEs have relatively low tax rates on transport fuels out of social concerns. However, these taxes can be progressive in these countries, as low-income
0%
4%
8%
12%
16%
20%
2016 or latest 2005
% of total tax revenue
0%
1%
2%
3%
4%
5%
2016 or latest 2005
% of GDP
Environmentally related tax revenues

│ 17
TOWARDS GREEN GROWTH IN EMERGING MARKET ECONOMIES © OECD 2019
households spend a lower share of their income on transport fuels compared to high-income households. As a result, effective carbon tax rates on transport fuels are lower than in the majority of OECD countries (OECD, 2018c). Turkey is the only exception, due to relatively high taxes on petrol. Like most other countries, EMEs also continue to tax diesel at a lower rate than petrol, despite the fact that diesel has a higher carbon content and generates higher emissions of nitrogen oxide (NOx) and particulate matter (PM). For example, while Turkey’s tax rates on vehicle fuels have increased since 2008, the differential between petrol and diesel has remained constant (OECD, 2019). Colombia, however, reduced the gap between diesel and petrol taxes in its 2012 tax reform. Brazil and Peru have moved in the other direction, lowering the tax rate on transport fuels. Indonesia continues to subsidise diesel (OECD, 2018d).
Many energy sources are also fully or partially exempt from taxation. Indonesia imposes taxes on diesel and petrol (at regional level), but not on fuel used in sectors other than transport. Lower tax rates apply to coal and natural gas in Turkey. Coal is taxed at a reduced rate and natural gas is exempt in Mexico. South Africa has no taxes on coal or fuel for household heating. Chile has no taxes on aviation fuel, coal or natural gas (other than compressed natural gas used for transport). Colombia has no tax on liquefied petroleum gas, which accounts for 8% of fuel consumption. Brazil’s fuel consumption tax is zero for all fuels except petrol and diesel. Fuel is exempt from taxation in 350 districts of eastern Peru.
Nonetheless, many countries have made progress in the use of environmentally related taxes, and some have introduced a carbon tax. Chile introduced carbon and air pollutant taxes in 2017. Since 2017, Colombia has also imposed a carbon tax on fossil fuels used for combustion (mainly in the petrochemical and refinery sectors) (World Bank, Ecofys and Vivid Economics, 2017). In its 2013 fiscal reform, Mexico introduced a carbon tax and increased effective tax rates on transport fuels (SEMARNAT, 2018). As a result, 30% of CO2 emissions from energy use are priced at or above EUR 30 per tonne (a conservative estimate of the climate damage) in Mexico, the highest share in the Americas (OECD, 2018e). In 2017, it launched a year-long emission trading (ETS) test. South Africa has gradually increased fuel consumption taxes and the electricity generation levy. It has been planning to implement a carbon tax, but the implementation date remains uncertain.
While these regimes are an important step towards green growth, the stringency of carbon pricing remains relatively low, and the systems include several exemptions and exclusions that limit coverage. OECD (2018e) estimates that, in 2015, the share of CO2 emissions from energy use facing a carbon price signal varied from 12% in South Africa to 62% in Mexico. These shares increased in Chile, Turkey and, more markedly, in Mexico between 2012 and 2015. However, they remained low compared to most OECD countries (although these estimates do not take into account the most recent reforms, such as the introduction of a carbon tax in Chile). Adjustments should be made over time that improve the effectiveness and efficiency of pricing.
Taxes on vehicles, road use and company cars can influence vehicle purchase decisions and driving behaviour. While taxes on vehicle purchases are common, most of the eight countries analysed here exempt certain classes of vehicles and do not incorporate environmental criteria. Turkey’s vehicle taxation system, for example, provides some environmental incentives, but generally pushes consumers towards older, used vehicles that are likely to have higher emissions. Chile’s approach, which ties the tax to fuel efficiency, NOX emissions and the vehicle’s retail price, is a potential model for other countries to consider (Box 4). Similar taxation systems, together with more demanding emission

18 │
TOWARDS GREEN GROWTH IN EMERGING MARKET ECONOMIES © OECD 2019
standards, would also discourage the import of polluting second-hand cars from countries where regulation has tightened.
Like many OECD countries, EMEs subsidise the private use of company cars through favourable tax treatment. This results in an estimated annual subsidy of EUR 1 300 per company car in South Africa, for example (Harding, 2014). In Chile, employees who benefit from a company-owned car must add at least 20% of the car’s net book value to their income, but this still results in tax revenue forgone. Free or subsidised parking spaces provided by employers are also considered taxable income in Chile. In addition to being regressive, the lenient taxation of company cars encourages private car use and long-distance commuting, with negative impacts on fuel consumption, emissions of GHGs and local air pollutants, noise, congestion and risk of accidents.
Box 4. Chile’s new taxes on CO2, air pollutants and vehicles
Chile has implemented a series of taxes to reduce GHG emissions and the health costs of air pollution, and to encourage consumers to purchase more environmentally friendly vehicles. The taxes also generate revenue that can help support social, economic development and environmental programmes.
In 2017, Chile levied carbon and air pollution taxes on stationary sources with boilers or turbines that generate at least 50 thermal megawatts, affecting around 100 facilities and 27% of CO2 emissions. For CO2, the tax rate is set at USD 5 per tonne. Taxes on air pollutants, including PM, NOX and sulphur dioxide (SO2), will depend on the local population, a dispersion coefficient and the social costs of the pollutants. These taxes are important steps for Chile, which will need to reinforce these taxes in the future, by increasing their rates, extending their coverage to the mining and quarrying sectors, and allowing some cost pass through to higher-income households. A 2018 draft law proposes to extend the tax to all installations emitting 100 tonnes or more of PM and more than 25 000 tonnes of CO2 per year, irrespective of installed capacity.
Since 2015, Chile has been phasing in a tax on new private passenger vehicle registrations. The tax is differentiated based on the vehicle’s test-cycle urban fuel efficiency and NOX emissions, as well as the retail price. The tax is therefore lower for cleaner and cheaper vehicles, and favours petrol over diesel. However, the tax does not apply to commercial vehicles and Chile has one of the largest gaps in taxation rates between petrol and diesel.
Source: OECD (2016), OECD Environmental Performance Reviews: Chile 2016.
4.2. Taxes on non-renewable resources
Non-renewable resource taxes are a relatively non-distortionary way for governments to raise revenue. They have historically represented a significant source of fiscal revenue for many EMEs. However, the slide in commodity prices has resulted in a significant drop of this revenue in recent years. Countries such as Chile, Colombia and Peru – where hydrocarbon and mining revenue accounted for between 10% and 20% of total revenue in 2010 –registered a sharp reduction in revenue (to around 5% or lower). Still, 23% of total government revenue comes from the exploitation of non-renewable resources in Mexico (OECD et al, 2018).
Taxes and royalties can be based on profitability or the quantity or value of material produced. It is rare for countries to incorporate environmental criteria within a royalty regime, though there can be incentives for companies to invest in sustainable development

│ 19
TOWARDS GREEN GROWTH IN EMERGING MARKET ECONOMIES © OECD 2019
initiatives within the community or region in which they are operating. Irrespective of the taxation system used, countries need to ensure that natural resource rents are sufficiently taxed. The revenue raised can finance government environment-related infrastructure and initiatives, among others, as done in Brazil and Colombia, for example. However, the earmarking of revenue from non-renewable resource taxes can create budget rigidities and the income stream may be too uncertain for investment in long-term projects.
Brazil applies royalties and a windfall profit tax to existing oil and gas production. For production started before 2010, 10% of the windfall profit tax revenue is allocated to the National Climate Change Fund. Revenue from production started after 2010 feeds a social fund, half of which is used for education and health spending, and the remainder is spread across other areas including the environment.
Colombia reformed its system of distribution of mining royalties in 2011. Before the reform, most royalties were directly transferred to the departments and municipalities where resource exploitation took place. At least 60% of these direct royalties had to be spent on investment to cover basic needs in the areas of health, education and water supply and sanitation. The rest of the royalties went to the National Royalty Fund, intended for mining promotion, environmental protection and regional investment projects. The new royalty system allocates royalties to six main funds, with the aim of distributing royalty revenue more evenly across regions and improve the effectiveness of revenue spending. However, the reform implies that the Autonomous Regional Corporations no longer receive support from the National Royalty Fund to finance environmental investment. While allocating royalties to the region where mining takes place may reinforce regional inequalities, not doing so can lead to local areas withdrawing support for mining projects (Korinek, 2015).

20 │
TOWARDS GREEN GROWTH IN EMERGING MARKET ECONOMIES © OECD 2019
5. Further effort is needed to reduce environmentally harmful subsidies
Several countries provide subsidies that encourage pollution or over-extraction of resources, are a burden on government budgets and are often socially unfair, thereby slowing progress towards green growth. These include support for consumption and production of fossil fuels and use of agricultural inputs such as land, water, pesticides and fertilisers. While some important reforms have taken place across the eight countries included in this report, such as fuel subsidy reform in Mexico and Indonesia and the reduction of agricultural support in most countries, further effort is needed to further phase out environmentally harmful subsidies.
5.1. Fossil fuel subsidies
Global support for fossil fuel consumption totalled around USD 493 billion in 2014, predominantly from developing and emerging market economies (EMEs). Both the G20 and the APEC (Asia-Pacific Economic Co-operation) have made commitments to “rationalise and phase out over the medium term inefficient fossil fuel subsidies that encourage wasteful consumption” (IEA, 2016a). Despite some progress in reducing subsidies to fossil fuel consumption, in many EMEs they are still a higher share of total tax revenue than the OECD average (Figure 4).
Figure 4. Support to fossil fuel consumption is high in many countries
Source: OECD (2018), “Green Growth Indicators”, OECD Environmental Statistics (database).
Fossil fuel subsidy reform can encourage reduced fossil fuel use, while reducing fiscal costs and allowing for more efficient poverty-alleviation measures. Subsidies such as road fuel price smoothing mechanisms and reduced electricity tariffs are largely captured by higher income groups, which spend a larger share of their earnings driving cars and have higher per capita electricity consumption than poorer households. Replacing tax exemptions and price discounts with direct cash transfers to low-income households would better target poverty while providing a greater incentive to limit energy consumption. This would primarily require improving the tax/transfer system in many EMEs, to make sure that government transfers reach those in need.
0%1%2%3%4%5%6%7%8%
India Indonesia South Africa Brazil Mexico Chile Turkey Colombia China(People'sRep. of)
OECD Russia
Fossil fuel consumption support, % total tax revenue
2016 2005
25.5% in 2005

│ 21
TOWARDS GREEN GROWTH IN EMERGING MARKET ECONOMIES © OECD 2019
At the end of 2013, Mexico eliminated the support it provided for the consumption of petrol and diesel, and the government gradually increased retail prices in the transition to the 2017 fuel price liberalisation (Box 5). Mexico also subsidises electricity consumption in the agriculture and residential sectors through reduced tariffs, resulting in electricity prices that are still far below the average cost of energy supply. The cost of the subsidy was more than three times the amount of investment in the electricity sector for 2007-10. A pilot programme was developed to reform the electricity subsidy for agricultural water pumping, where farmers payed a higher electricity price, but received a cash-transfer equivalent based on their average consumption for the previous three years. This aimed to correct price signals without impacting net income. The government plans to launch other pilot projects where farmers would pay higher electricity prices in exchange of equivalent subsidies tied to efficient irrigation technologies (SEMARNAT, 2018).
Box 5. Mexico’s reform of transport fuel subsidies
At the end of 2013, Mexico eliminated the support it provided for the consumption of petrol and diesel fuel through its floating excise tax. The federal government then steadily increased retail prices on a monthly basis in order to reduce support to consumers, in the transition to the fuel price liberalisation of 2017. Mexico’s efforts, together with lower international oil prices, have reduced total consumer support in Mexico from MXN 244 billion (USD 18.5 billion) in 2012 to MXN 34 billion (USD 2.5 billion) in 2014 (OECD, 2015c). The fuel tax is now the third largest tax in terms of revenue, after income taxes and the value added tax.
While there has been a negative social reaction to the reforms as prices have increased, analysis shows that the reform is progressive, as it affects only 50% of (mainly higher-income) households that own a car. The introduction of the tax during a slump in oil prices helped mitigate the initial impact, along with the gradual introduction of the change.
Source: Arlinghaus and van Dender (2017), “Environmental Tax and Subsidy Reform in Mexico”; OECD (2015), OECD Companion to the Inventory of Support Measures for Fossil fuels 2015.
Indonesia has also made strides to reduce its fossil fuel and electricity subsidies (Box 6). Pressured by a growing fiscal burden, in 2013-14 the Indonesian government progressively increased transport fuel prices, while providing cash transfers to 15.5 million households over four months. As a result, subsidy expenditure declined by 65% in 2014-15, to 1% of GDP (IEA, 2016b). However, not all price reforms have been implemented as announced. The government froze the retail price of petrol in 2016, despite the rise in world oil prices, and budget expenditure linked to fossil fuel support increased again in 2018 (OECD, 2018d).
Other countries have been sliding backwards. Peru cut petrol taxes by 30% in 2014. Brazil’s 1990s reform agenda, which aimed at liberalising the energy sector and removing subsidies, stalled in 2002. The Brazilian government then froze the prices of petrol, diesel and liquefied petroleum gas between 2006 and 2012, and has repeatedly reduced fuel tax rates. Fuel prices were raised in 2012 and 2013, but partly offset by reducing the fuel consumption tax to zero. The OECD estimated that the tax adjustment resulted in about USD 1.7 billion in foregone revenue in 2012 (OECD, 2015b). In Turkey, a 2018 regulation caps taxes on fuel products whose prices are increasing, aiming at stabilising fuel prices in the face of fluctuations in international oil prices and exchange rates (OECD, 2019).
Colombia has also historically subsidised fuel consumption, disbursing close to 1% of GDP in fuel subsidies in 2014. In South Africa, the government estimates that the zero value

22 │
TOWARDS GREEN GROWTH IN EMERGING MARKET ECONOMIES © OECD 2019
added tax (VAT) rate on fuels and its diesel refund system cost the public budget about USD 947 million in lost revenue in 2010-11, equivalent to 2% of total tax receipts. Chile has fuel price stabilisation measures, but has capped spending; its consumer-related support is low relative to other countries in Latin America.
Box 6. Improved targeting of electricity subsidies in Indonesia
Electricity consumption has been long subsidised in Indonesia. The central government sets electricity tariffs below electricity production costs and compensates the state-owned electricity company PLN for the price-cost gap. In the early 2010s, average retail tariffs were about one-third below PLN’s production costs. The gap has narrowed as the government improved targeting of the subsidy, but tariffs remain below average costs, and appear low in comparison to regional peers.
In 2013, the government gradually raised electricity tariffs for the largest or wealthier power consumers, and adopted a monthly price adjustment mechanism to keep the tariff at a level that would match PLN’s production costs. At the end of 2016, only low income households remained subsidised. However, these still represented about 70% of PLN’s consumers. The average electricity tariff increased by 39% between 2013 and 2017. This induced electricity savings of around 7% per year by 2015 and reduced the subsidy by half. However, the government announced to keep electricity prices constant until at least 2019.
Source: OECD (forthcoming 2019), Green Growth Policy Review of Indonesia; OECD (forthcoming 2019), Indonesia’s effort to phase out and rationalise its fossil-fuel subsidies, A report on the G20 peer-review of inefficient fossil-fuel subsidies that encourage wasteful consumption in Indonesia.
South Africa has gradually phased out subsidies for coal-based electricity generation. This is particularly important in South Africa, where coal-fired power plants represent over 90% of electricity production and a major source of GHG and air pollutant emissions. The government also started measuring and publishing tax expenditure in 2011 to increase transparency in the tax system. On the contrary, the oil and mining industries benefit from significant fiscal advantages in Colombia. Turkey provides support for coal production. Brazil provides special tax regimes for its oil and gas producers, with public support for oil and gas exploration and extraction estimated to be USD 530 million in 2014.
5.2. Agricultural subsidies
Agricultural subsidies have declined as a percentage of gross farm receipts over the past decade across many EMEs. Their level is generally below the OECD average, with the exception of Indonesia and Turkey (Figure 5). However, in most cases, support is based on commodity output, in the form of market price support, and input use. These are the most distorting and potentially environmentally harmful forms of agricultural subsidies, because they are tied to production. They stimulate production and input use, encouraging agricultural expansion and intensification, overuse of water, fertilisers and pesticides, with a potentially negative impact on soil, water and biodiversity. These forms of subsidies reduce incentives to use production factors more efficiently and discourage innovations that would make the agricultural sector more competitive. In addition, market price support tends to benefit relatively well-off farmers while hurting the poor the most.

│ 23
TOWARDS GREEN GROWTH IN EMERGING MARKET ECONOMIES © OECD 2019
Figure 5. Support to farmers has declined in many countries
Note: Data for Indonesia refer to 2015. Source: OECD (2018), “Producer and consumer support estimates”, OECD Agricultural statistics (database, 2017 and 2018 editions).
In contrast to other EMEs, support to agriculture increased in Indonesia in 2005-16 (Figure 5), aiming to achieve self-sufficiency in the production of staple crops. It amounted to 4.6% of GDP in 2015, the highest share in the world (OECD, 2017b). The budgetary burden from fertiliser subsidies increased more than 10-fold (in real terms) in 2005-15. While subsidies are intended for small farmers, around one third of fertiliser subsidies was misallocated in 2015 and largely benefited the largest farms (OECD, 2016b). Several subsidies are linked to the production of oil palm and timber products, which potentially encourage deforestation. Current support to oil palm encourages the expansion of planted areas as opposed to stimulating improvement in productivity (which is about half its potential).
Support to farmers has declined significantly in Turkey, but remains well above the OECD average (Figure 5). Turkey reformed its agricultural subsidies in 2016 to target strategic crops in the areas most suitable to them. This could reduce pressures in areas of water scarcity. However, livestock subsidies were raised, which is likely to increase pressures on land use and aquatic ecosystems.
Colombia continues to provide more agricultural support than other Latin American countries (Figure 5). Extensive cattle breeding is a major factor in land degradation and deforestation, GHG emissions, water use and pollution. Subsidised irrigation charges are so low in Colombia that they represent less than 0.5% of production costs, even for water-intensive crops such as rice. Fertilisers and pesticides are also exempted from VAT, which contributes to Colombia having one of the highest rates of fertiliser use in Latin America.
On the other hand, Brazil has incorporated some environmental criteria into support for farmers. Since 2008, access to subsidised rural credit in the Amazon biome has been conditional on the legitimacy of land claims and provision of information to demonstrate compliance with environmental regulations. The change has effectively helped reduce deforestation in those areas, showing the potential for expansion to other regions. In 2010, Brazil launched the Low-Carbon Agriculture Programme to consolidate a range of concessional credit lines that targeted good environmental practices. Similarly, Turkey
0%
5%
10%
15%
20%
25%
30%
South Africa Brazil Chile Costa Rica Mexico Colombia Russia China(People'sRep. of)
OECD Turkey Indonesia
Producer support estimate, % gross farm receipts
2017 2005

24 │
TOWARDS GREEN GROWTH IN EMERGING MARKET ECONOMIES © OECD 2019
introduced payments for soil conservation in 2006 and concessional loans for the adoption of organic agriculture and good farming practices in 2009. The volume of environmentally oriented programmes is, however, small relative to total agricultural support in both countries.
Biofuel and biodiesel subsidies should also be regularly reviewed to ensure that they have a positive environmental impact. Biofuel use could help reduce air pollution caused by the generally old vehicle fleets operating in large urban agglomerations in several EMEs (IEA, 2018). However, not all biofuels or production methods generate environmental benefits. Some production methods or feedstocks produce higher GHG emissions than traditional fuels, and there are growing concerns regarding impacts on land and water use. Indonesia’s ambitious biofuel blending mandate (30% biodiesel and 20% bioethanol blending by 2025), for example, are likely to further drive expansion of palm oil plantations at the expense of forests and peatland.
Several countries support biofuels through blending requirements and favourable tax regimes. Building environmental criteria into the subsidies, and developing certification systems similar to those used in forestry, could help countries streamline their support for biofuels and biodiesel. For example, Brazil’s RenovaBio policy (to be implemented as from 2020) sets the target to reduce GHG emissions from transport by 10% by 2028; it will establish emission reduction targets for fuel distributors and a system of tradeable carbon savings credits. Credits will be assigned to biofuel producers on the basis of the life-cycle emission savings of the fuel compared with petroleum products. Distributors will be required to purchase credits to meet their annual emission reduction targets. The system is expected to make advanced biofuels economically more attractive, as they are less carbon intensive and will be assigned more credits (IEA, 2018).3

│ 25
TOWARDS GREEN GROWTH IN EMERGING MARKET ECONOMIES © OECD 2019
6. Increased investment in sustainable infrastructure is critical
Infrastructure is an important element of both growth and environmental strategies in most countries, but is particularly critical in emerging market economies (EMEs) that have low quality infrastructure and are growing rapidly (Table 2). Significant investments in transport, energy, telecommunications and water and waste infrastructure are needed across all EMEs. Ensuring that these investments support energy and water use efficiency and limit emissions of GHGs and other pollutants will help avoid locking-in environmentally harmful long-lived infrastructure that could be a liability in the future. The resilience of infrastructure to climate change impacts should also have a high priority to help protect the economy and its future growth. However, none of the countries considered in this report systematically integrates environmental or climate change adaptation criteria into their infrastructure investment strategies and programmes, as is the case for many OECD countries.
Table 2. Perceived quality of infrastructure
Rankings out of 137 countries according to the perceived quality of infrastructure, 2017
Source: WEF (2017), The Global Competitiveness Report 2017-2018.
Significant investments in infrastructure have been made across the eight countries considered in this report over the past decade, but much more is needed to meet economic, environmental and social objectives. For example, Chile needs infrastructure investment of around 5% of GDP on average per year to 2023 just to maintain its competitiveness. In all Latin America, meeting medium-term infrastructure needs would require nearly doubling investment spending from the current 3.5% of GDP per year (OECD, 2016c).
Extending and upgrading sustainable infrastructure will primarily require greater public sector investment. Revenue from non-renewable resources, through taxes and royalties, could provide income for investment in environmental and low-carbon infrastructure, among others (OECD, 2016c). However, public finance alone will be insufficient. Mobilising private investment and extending the use of pricing instruments could help fill the financing gap (Box 7). Peru, for example, has introduced tax incentives to spur private participation in infrastructure investment: the law on tax-funded works allows firms to finance and operate public projects by deducing investment costs from their tax liability. Turkey’s ambitious infrastructure investment plan to 2023 (USD 325 billion) foresees a large proportion of private sector financing.
Overall infrastructure Transport Electricity and telephony Chile 41 47 43 Indonesia 52 30 77 Turkey 53 23 90 South Africa 61 35 86 Mexico 62 38 84 Brazil 73 65 72 Peru 86 97 75 Colombia 87 98 76
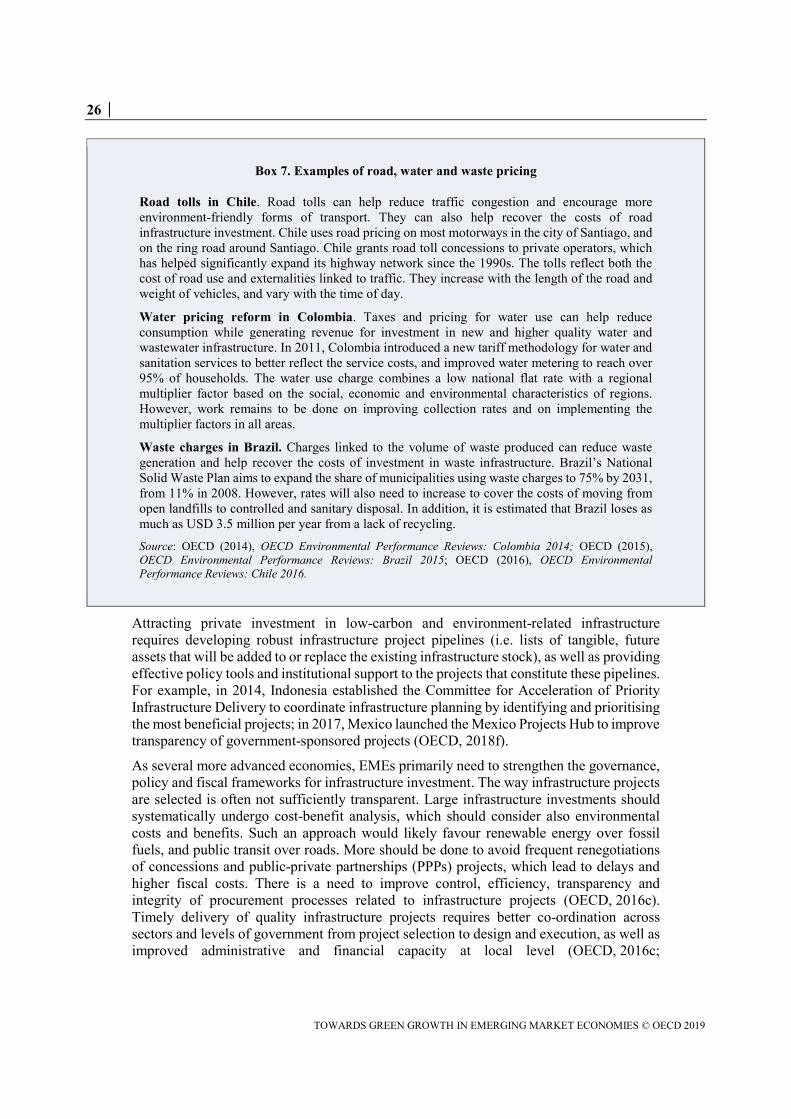
26 │
TOWARDS GREEN GROWTH IN EMERGING MARKET ECONOMIES © OECD 2019
Box 7. Examples of road, water and waste pricing
Road tolls in Chile. Road tolls can help reduce traffic congestion and encourage more environment-friendly forms of transport. They can also help recover the costs of road infrastructure investment. Chile uses road pricing on most motorways in the city of Santiago, and on the ring road around Santiago. Chile grants road toll concessions to private operators, which has helped significantly expand its highway network since the 1990s. The tolls reflect both the cost of road use and externalities linked to traffic. They increase with the length of the road and weight of vehicles, and vary with the time of day.
Water pricing reform in Colombia. Taxes and pricing for water use can help reduce consumption while generating revenue for investment in new and higher quality water and wastewater infrastructure. In 2011, Colombia introduced a new tariff methodology for water and sanitation services to better reflect the service costs, and improved water metering to reach over 95% of households. The water use charge combines a low national flat rate with a regional multiplier factor based on the social, economic and environmental characteristics of regions. However, work remains to be done on improving collection rates and on implementing the multiplier factors in all areas.
Waste charges in Brazil. Charges linked to the volume of waste produced can reduce waste generation and help recover the costs of investment in waste infrastructure. Brazil’s National Solid Waste Plan aims to expand the share of municipalities using waste charges to 75% by 2031, from 11% in 2008. However, rates will also need to increase to cover the costs of moving from open landfills to controlled and sanitary disposal. In addition, it is estimated that Brazil loses as much as USD 3.5 million per year from a lack of recycling.
Source: OECD (2014), OECD Environmental Performance Reviews: Colombia 2014; OECD (2015), OECD Environmental Performance Reviews: Brazil 2015; OECD (2016), OECD Environmental Performance Reviews: Chile 2016.
Attracting private investment in low-carbon and environment-related infrastructure requires developing robust infrastructure project pipelines (i.e. lists of tangible, future assets that will be added to or replace the existing infrastructure stock), as well as providing effective policy tools and institutional support to the projects that constitute these pipelines. For example, in 2014, Indonesia established the Committee for Acceleration of Priority Infrastructure Delivery to coordinate infrastructure planning by identifying and prioritising the most beneficial projects; in 2017, Mexico launched the Mexico Projects Hub to improve transparency of government-sponsored projects (OECD, 2018f).
As several more advanced economies, EMEs primarily need to strengthen the governance, policy and fiscal frameworks for infrastructure investment. The way infrastructure projects are selected is often not sufficiently transparent. Large infrastructure investments should systematically undergo cost-benefit analysis, which should consider also environmental costs and benefits. Such an approach would likely favour renewable energy over fossil fuels, and public transit over roads. More should be done to avoid frequent renegotiations of concessions and public-private partnerships (PPPs) projects, which lead to delays and higher fiscal costs. There is a need to improve control, efficiency, transparency and integrity of procurement processes related to infrastructure projects (OECD, 2016c). Timely delivery of quality infrastructure projects requires better co-ordination across sectors and levels of government from project selection to design and execution, as well as improved administrative and financial capacity at local level (OECD, 2016c;

│ 27
TOWARDS GREEN GROWTH IN EMERGING MARKET ECONOMIES © OECD 2019
OECD, 2018g). There is also a need to streamline the administrative procedures for granting environmental permits, as done in Peru, for example (Box 8).
Many countries such as South Africa and Mexico have established dedicated funding for environment-related infrastructure such as renewable energy, urban transit and water supply and sanitation. Some countries have taken steps to enhance the financial sector’s engagement in green growth. Brazil’s Central Bank, for example, requires the financial institutions under its supervision to establish social and environmental responsibility policies and risk management systems. The Brazilian Development Bank has applied social and environmental screening of all direct and large indirect lending projects since 2010. Colombia’s government signed a green protocol agreement with the Colombian banking association to provide lending for green projects, improve the environmental performance of banks and introduce environmental screening of investment projects. In 2017, Indonesia’s Financial Services Authority issued a regulation requiring financial institutions to develop a sustainable finance programme and to annually report on its implementation. All eight countries have borrowers participating in the green bond market (Environmental Finance, 2017). The Industrial Development Bank of Turkey issued the first-ever Turkish Green Sustainable Bond in May 2016, worth USD 300 million, and Indonesia launched its first sovereign green bond in early 2018. At least 70% of the proceeds from any green bond issued by Indonesia must be used to finance environment-friendly projects.
Box 8. Peru’s law on investment promotion for economic growth and sustainable development
In 2015, Peru set up a combined environmental license, so called Global Environmental Certification, for large-scale investment projects that may cause significant environmental damage. This certification allows for all environment-related licenses to be included in a single administrative procedure. The National Service of Environmental Certification for Sustainable Investments (SENACE) is in charge of issuing these Global Environmental Certifications. It acts as a one-stop shop for licensing, integrating environmental impact assessment approvals and permits from various other administrations (water, forests, energy and mining, health).
The system responds to the need to speed up the approval of projects of economic and social importance for the country. However, there are concerns that it may limit public participation, due to the relatively short time-frame of the procedure (150 working days).
Source: OECD/ECLAC (2017), Environmental Performance Reviews: Peru 2017.
6.1. Energy infrastructure
Energy infrastructure is fundamental to a successful transition to green growth, as fossil fuel-based energy production continues to be a major contributor to GHG emissions and air pollutants in many countries. The mix of sources to generate electricity varies significantly across EMEs, but fossil fuels generally dominate (Figure 7).

28 │
TOWARDS GREEN GROWTH IN EMERGING MARKET ECONOMIES © OECD 2019
Figure 6. Most emerging market economies rely on fossil fuels for power generation
Source: IEA (2018), “World energy balances”, IEA World Energy Statistics and Balances (database).
Nonetheless, investment in renewable electricity has boomed in EMEs, exceeding investment in developed countries for the first time in 2015. The People’s Republic of China, India, Brazil and Mexico were in the top ten global list of investing countries in 2017 (FS-UNEP and BNEF, 2018). Renewable energy investment grew by 810% in Mexico between 2016 and 2017, by more than 65% in Indonesia and Peru, by 55% in Chile and by 8% in Brazil (Box 9). Chile confirms its competitiveness in solar power investment and Indonesia is a world leader in geothermal technology. Increased investments have been supported by renewable energy targets and quota obligations, as well as power auctions that have replaced previously-used, and more expensive, feed-in-tariff systems. A 2017 auction for new capacity in Mexico established new record lows for onshore wind and solar photovoltaics (FS-UNEP and BNEF, 2018).
However, investment declined by 88% in South Africa, because the national utility requires renewable energy developers to cut electricity prices as a condition to enter power purchase agreements (FS-UNEP and BNEF, 2018). Similarly, Indonesia’s 2017 regulation that imposes locally based tariffs introduced regulatory uncertainty and reduced the attractiveness of renewables investment in some regions (OECD, 2018d; OECD, forthcoming 2019a). Despite the increase in feed-in tariffs, investment in electricity generation from renewables has slowed in Turkey due to a combination of factors including high licence and connection fees, delays in grid connection and expansion, regulatory uncertainty for distributed generation and exchange rate risks (OECD, 2019).
0%10%20%30%40%50%60%70%80%90%
100%
SouthAfrica
Indonesia Mexico India China(People'sRep. of)
Turkey Russia OECD Chile Peru Colombia Brazil
Electricity production, by source (2017 or latest available year)
Coal Natural Gas Oil Nuclear Hydro Other renewables Other

│ 29
TOWARDS GREEN GROWTH IN EMERGING MARKET ECONOMIES © OECD 2019
Box 9. Brazil’s investment in renewable energy
In 2017, Brazil was the world’s eighth largest investor in renewables. Total investment, excluding large hydro, reached USD 6 billion. This represents an 8% growth from the previous year. Wind and solar power attracted most of investment, with a 204% increase for solar compared to 2016. Brazil’s Development Bank (BNDES), the Climate Change Fund and several state funds and programmes have contributed to investment in renewable energy. Brazil aims to reduce GHG emissions from its electricity sector by 27% by 2020 through expansion of hydropower and other renewables.
Brazil began supporting renewable electricity generation with feed-in tariffs, but it shifted to using power auctions in 2009. Brazil held its first solar power auction in October 2014. However, political and economic uncertainty have slowed down investment in some years (FS-UNEP and BNEF, 2018). Renewable-based power plants have been delayed also by inadequate transmission infrastructure, particularly in the Northeast region where wind power potential is strongest. Differences in environmental regulations across states result in additional transaction and administrative costs for project developers.
Brazil’s local content requirements (LCRs) have helped to develop a domestic wind power industry, but may limit industry productivity and financing capacity in the long term (OECD, 2015b). The OECD advises countries with nascent or uncompetitive solar or wind-turbine industries to address local impediments to competitiveness through other means, such as support for research and development, training programmes and instruments that stimulate domestic demand for renewables. By raising the cost of inputs for downstream businesses, LCRs can lead to increased overall costs, reduced price competitiveness, less international investment and higher wholesale electricity prices (OECD, 2015d). Source: FS-UNEP and BNEF (2018), Global Trends in Renewable Energy Investment 2018; OECD (2015), OECD Environmental Performance Reviews: Brazil 2015; OECD (2015), Overcoming Barriers to International Investment in Clean Energy.
Energy efficiency is a largely untapped environmental and economic opportunity in EMEs, which tend to have energy-intensive industrial structures and inefficient buildings. The economic benefits of energy efficiency investment includes lower long-run energy costs and job opportunities for the construction sector. A 2013 analysis by the International Energy Agency estimated that Brazil could reduce final energy consumption by 11% by 2035 through measures in industry, transport and buildings such as adoption of best available techniques, mandatory fuel economy standards and enhanced building codes (IEA, 2013). The eight EMEs considered in this report have begun to implement energy efficiency regulations and promotion programmes. For example, Turkey requires large industrial installation to implement energy management systems (Box 10). However, there remains scope for improving implementation and cost-effectiveness of such programmes.

30 │
TOWARDS GREEN GROWTH IN EMERGING MARKET ECONOMIES © OECD 2019
Box 10. Promotion of industrial energy efficiency in Turkey
Turkey requires industrial establishments consuming more than 1 000 tonnes of oil equivalent to be certified to the ISO 50001 energy management system (EnMS) standard. In 2016, Turkey was estimated to have around 100 of the 1 200 (8%) large energy-intensive industrial installations applying the ISO 50001 standard. A UNDP/UNIDO project is promoting greater use of energy management systems in Turkey through targeted training and information.
Companies in Turkey can also enter into a voluntary agreement to reduce their energy intensity by an average of 10% over three years in exchange for having 20% of their energy costs subsidised during the first year. To date, seven voluntary agreements have been completed, while another eight are within the three-year monitoring period. Additional incentives may be needed to increase the involvement of industrial installations in energy efficiency programming. Source: OECD (2019), OECD Environmental Performance Reviews: Turkey 2019.
6.2. Transport Infrastructure
In all eight countries examined in this report, roads, railways and ports are poor compared to international standards (Table 2) and many areas still lack basic infrastructure. Poor quality transport infrastructure restricts economic growth, reduces international competitiveness and limits the participation of rural communities in the economy. In Colombia, for example, the costs of internal freight transport are among the highest in the world due to a lack of adequate infrastructure. Brazil is estimated to need USD 35 billion for public transport in 38 metropolitan areas to make up for deficiencies (OECD, 2015b). In addition, the strong reliance on road transport is a major source of congestion, GHG and air pollutant emissions.
Integrated land-use and transport planning is fundamental to containing the environmental impacts of transport. Regulatory and fiscal incentives and efficient pricing are equally important to stimulate technological development and divert transport away from energy- and carbon-intensive transport modes (Banister et al., 2015). Road tolls are proving to be tools to reduce productivity losses from slow travel times, recover costs of road infrastructure and encourage more environment-friendly forms of transport. Chile has effectively used road pricing on most motorways in the capital city of Santiago, with revenue helping to leverage private sector investment and expand the highway network (Box 7). Other countries have been making significant public investments in public transit, and the use of public-private partnerships has been increasing.
Innovative approaches are also making public transport infrastructure more feasible and affordable for EMEs. Public-private partnerships in Santiago (Chile) and Medellin (Colombia) have helped expand urban public transport (Box 11). Curitiba (Brazil) opted for a low-cost bus rapid transit (BRT) system instead of urban rail, helping to reduce car trips and achieve some of the lowest ambient air pollution in Brazil. The privately run system operates without subsidies, charging a flat passenger fare. Indonesia’s TransJakarta is the first BRT system in Southeast Asia and the world’s longest. More BRT systems are planned in 29 cities, and a metro system is being developed in Jakarta (OBG, 2018). Still, road transport accounts for the largest share of infrastructure investment in Indonesia (OECD, 2018f) and for 25% of planned capital investment in 2017-23 in Turkey.

│ 31
TOWARDS GREEN GROWTH IN EMERGING MARKET ECONOMIES © OECD 2019
Box 11. Medellin’s public transport system
Medellin developed a metro system – financed through public-private partnership – that includes a metro cable system that takes passengers up steep mountainsides that line the Valley of Medellin. The network of clean and efficient metro cars serves over half a million passengers every day. In 2012, it was named one of the world’s top transport systems by the Institute for Transportation and Development Policy.
The system is credited with saving 175 000 tonnes of CO2 per year, USD 1.5 billion in respiratory health costs and USD 4 billion in reduced traffic accidents and congestion. It has also connected poor residents from favelas (squatter communities along the mountainside) to commerce, education, health care and other amenities in the city. New transit hubs in the favelas have also sparked economic activity, with thriving locally-owned restaurants and shops. Source: Madrid J. (2012), “Medellin’s amazing metro system: Colombia uses public transport to drive societal change”.
6.3. Water, sanitation and waste infrastructure
Water, sanitation and waste infrastructure has improved significantly in the eight countries considered in this report over the past 25 years. Access to piped water and sanitation has been extended. However, it remains insufficient, especially in rural and poor regions where the quality of infrastructure is generally low. In addition, substantial population growth means that countries will need to expand services. For example, Mexico will need to provide an additional 36 million people with drinking water over the next two decades (OECD, 2018h). The total investment to be made until 2023 for urban wastewater infrastructure (new or renovated sewerage networks and wastewater treatment plants) is estimated at USD 7.5 billion in Turkey.
The water and wastewater sectors have particularly high capital investment costs. International financial assistance has been an important source of finance for investment in the water sector in some EMEs. Shifting to more predictable sources of finance such as tariffs would put the sector on a more robust financial path. EMEs need to ensure the efficiency of new investments, including full consideration of future operation and maintenance (O&M) costs and social implications. The provision of free basic services to households and exemptions for certain sectors are often not the best way to address social considerations and they discourage efficient water use and waste prevention (Box 12). Affordability concerns are better addressed through targeted social transfers.

32 │
TOWARDS GREEN GROWTH IN EMERGING MARKET ECONOMIES © OECD 2019
Box 12. Examples of subsidies for basic services
In Chile, municipalities usually award contracts to private operators for waste services that allow for charging residents a fee based on both fixed and variable costs (as part of the property tax). However, many municipalities partially or totally waive the payment based on households’ socio-economic conditions. On the other hand, rising water prices, with private concessions that allow operators to fully recover costs, encouraged an 18% reduction in household drinking water consumption between 2000 and 2014.
In Colombia, charges for water, waste, electricity, gas and telephone services vary according to the socio-economic category of the housing unit. There are six categories (estratos), with the three poorest categories receiving subsidies on their utility bills and the two highest paying a premium. However, with an estimated 90% of Colombians in the poorest three estratos, premiums are not able to fully finance subsidies. More accurate targeting of low-income households, and greater incentives for reduced consumption, would help improve cost recovery while improving resource use.
Mexico applies increasing block tariffs in setting prices for water supply and sanitation services. Tariffs are set independently by each municipality. They comprise between 5 and 17 blocks in the main cities, and are differentiated by type of final user. Little or nothing is charged for the first block to give low-income households access to basic water services and provide a cross-subsidy from larger water users. This mechanism provides incentives for larger consumers to save water. However, areas of “water poverty” remain.
In South Africa access to free basic services for electricity, water and waste services varies. About 35% of households receive free basic electricity, 58% receive free basic water services and 33% free basic sanitation services. Most municipalities have introduced free basic waste collection services. However, South Africa also has a sophisticated system of water pricing for those not receiving free services. This includes charges at all stages of the water cycle and increased prices for additional use at the margin that provide an incentive to save water.
Source: OECD (2013), OECD Environmental Performance Reviews: Mexico 2013; OECD (2013), OECD Environmental Performance Reviews: South Africa 2013; OECD (2014), OECD Environmental Performance Reviews: Colombia 2014; OECD (2016), OECD Environmental Performance Reviews: Chile 2016.
Sufficient and well-designed taxes and prices related to water and waste services can help reduce water use, control pollution and limit waste generation, while generating revenue that can be used to invest in water and waste infrastructure. Brazil, Chile, Colombia, Mexico, Peru, South Africa and Turkey all have sufficient water and sanitation revenue to cover O&M costs, but not enough to invest in new or deteriorating infrastructure (Figure 7). In Brazil, for example, not all states charge for water, rates are low and not automatically adjusted for inflation, and around 40% of distributed water does not generate revenue due to unbilled consumption, water theft, metering inaccuracies and physical water losses. In Turkey, only a small number of utilities still have capacity for tariff increases to finance new investment, as in many service areas tariffs are already above affordability limits (Box 13). Colombia has introduced a new tariff methodology for water and sanitation services, but further work is needed to improve collection rates (Box 7). Overall, the O&M performance of water utilities can be improved in many EMEs. Systematic monitoring and benchmarking of performance of utilities and of the quality of their services would help in this respect (OECD, 2019).

│ 33
TOWARDS GREEN GROWTH IN EMERGING MARKET ECONOMIES © OECD 2019
Figure 7. Revenue from tariffs covers operating costs in many emerging market economies
Note: The operating cost coverage ratio is total billed revenue divided by total operational expenses. Ratios greater than 1 imply that revenue is sufficient to cover costs, while ratios below 1 imply that they are insufficient. Data for Colombia are 2004 and 2010, data for People’s Republic of China and Mexico are 2005 and 2012, data for Brazil are 2005 and 2015, data for Peru are 2005 and 2014, data for Chile are 2005 and 2008, data for India are 2005 and 2009, and data for Turkey are 2005 and 2008. Source: IB-NET (2015), The International Benchmarking Network for Water and Sanitation Utilities (database).
Box 13. Full-cost recovery and affordability in setting wastewater tariffs in Turkey
According to the Turkish legislation, all wastewater infrastructure administrations can set up full-cost recovery water and wastewater user fees (i.e. tariffs covering installation, maintenance, operation, monitoring of wastewater treatment plants and other related services). A 2018 regulation provides for maximum and minimum tariff levels for each service area. The tariff level should consider customer affordability. An affordable tariff per cubic meter is to be below 2.5% of the household income of the lowest quintile in the utility service area. This means that all income groups, including higher income households, pay a tariff below this threshold. This does not provide incentives for water saving and does not make efficient use of cost recovery capacity of households.
The share of wastewater fees in the total tariff for waste services is less in Turkey than in most OECD countries, where they account for roughly half of the total. However, in many service areas, tariffs exceeds affordability limits. This leaves little room for increasing tariffs to finance new investment. Most utilities will have to implement cost-efficiency measures to accommodate higher capital costs within affordability constraints.
Source: OECD (2019), OECD Environmental Performance Reviews: Turkey 2019.
Several countries have introduced water abstraction and pollution charges. In Brazil, water abstraction and pollution charges apply to water supply and sanitation utilities, industry, hydropower and agriculture. However, they are unevenly implemented and, where they exist, their levels are too low to drive behavioural change of most users and to finance water resources management (OECD, 2017c). Abstraction charges in Indonesia, Mexico and Peru are designed to reflect the value of water resources and their availability. However, in many countries exemptions are widespread and many users abstract water without having
0
0.5
1
1.5
2
2.5
South Africa Chile Mexico Brazil Turkey Colombia Russia Peru China(People'sRep. of)
India Indonesia
Operating cost coverage ratio
2017 2005

34 │
TOWARDS GREEN GROWTH IN EMERGING MARKET ECONOMIES © OECD 2019
a permit, as is the case in Indonesia. Mexico uses a portion of revenue from water abstraction charges to support payment for ecosystem services programmes that encourage conservation actions in watersheds, forests and other priority areas for biodiversity. Peru’s pollution charge varies according to the water quality of the receiving water body. Colombia and Mexico also have water pollution charges, but they are not always well enforced.
Waste infrastructure is in need of significant investment across the eight countries, with sparse waste collection services, poor quality sanitary landfills, widespread illegal dumping and a lack of recycling. Some recycling and waste-to-energy facilities are emerging in South Africa. Chile has committed to double the number of sanitary landfills installed, increasing the number of municipalities with access to landfills from 30% in 2010 to 75% by 2020. In 2018, it introduced a ban on plastic shopping bags. To meet the goals of Turkey’s Waste Management Action Plan, about USD 7 billion is estimated to be needed by 2023. This will include developing regional solid waste processing and recycling facilities, new sanitary landfills, and upgrading and remediating unsanitary landfills.
The use of waste charges has been increasing across the eight countries, but the coverage and rates of charges are too limited to influence waste generation or recover waste service costs. In Peru, user charges cover barely half of the costs of municipal waste collection and disposal, and arrears are widespread in municipalities. South Africa pioneered the introduction of the plastic bag levy in 2004. Indonesia tested a low “plastic bag fee” in 28 cities in 2016, which reduced plastic bag use by 55% over three months. The fee was withdrawn, but may be reintroduced. Colombia also introduced an advanced recycling fee as part of its Extended Producer Responsibility Initiative. In Mexico, cities charge a flat rate for waste collection, with lower rates in poorer areas. However, the charges are not tied to the volume of waste, and billing is not always effectively enforced. Brazil has committed to expand the share of municipalities using waste charges from 11% in 2008 to 75% by 2031, but will also need to increase rates (Box 7).

│ 35
TOWARDS GREEN GROWTH IN EMERGING MARKET ECONOMIES © OECD 2019
7. Eco-innovation is key to capturing opportunities from green growth
Innovation can generate new sources of growth and help lower environmental compliance costs. It is also key to decoupling growth from pollution and the use of natural capital. Eco-innovation can be encouraged through flexible, predictable policy signals such as carbon, water and waste pricing that create demand for cost-effective ways to reduce environmental impacts. Support for research and development (R&D), education and skills, and access to finance are also core elements of successful eco-innovation strategies.
7.1. Eco-innovation performance and policy
Most emerging market economies (EMEs) have put increased emphasis on overall innovation as part of development strategies, but eco-innovation has not been the primary emphasis in most of the countries considered in this report. Nonetheless, in Brazil, Chile, Colombia, Indonesia, Mexico, Peru and South Africa patents on environment-related technologies represent at least 10% of all patents (Figure 8). In some countries, such as Chile, this reflects increased spending on R&D related to the environment, as well as higher investment by private companies and non-profit organisations. However, the total number of patents (for technology in all sectors) remains small in most EMEs.
Figure 8. Environmental technology is an increasingly important component of innovation
Note: Higher value inventions that have sought patent protection in at least two jurisdictions (family size: two or more). Data are based on patent applications and refer to fractional counts of patents by inventor’s country of residence and priority date. Source: OECD (2018) “Patents in environment-related technologies: Technology development by inventor country”, OECD Environment Statistics (database).
There is significant scope to accelerate the pace of progress through the development of coherent eco-innovation policy frameworks and strategies. Few of the eight countries have formal eco-innovation strategies, but many have developed programmes or policies that encourage R&D related to eco-innovation and improve environmental education.
Brazil, Chile, Indonesia and Mexico are part of the 23-member initiative called Mission Innovation that commits members to double their clean energy R&D spending by 2021.
0%2%4%6%8%
10%12%14%16%18%20%
Chile Peru Indonesia Colombia OECD Mexico Brazil South Africa Russia India China(People'sRep. of)
Turkey
Environment-related technologies as percentage of all technologies (period averages)
2012-2014 2005-2007

36 │
TOWARDS GREEN GROWTH IN EMERGING MARKET ECONOMIES © OECD 2019
Mexico’s 2014-18 Special Programme for Science, Technology and Innovation includes several environmental priority areas (e.g. economic evaluation of ecosystem services; social and ecosystem vulnerability to climate change). Mexico also launched the Sectoral Environmental Research Fund to support applied scientific research in the environmental sector (SEMARNAT, 2018). Peru intends to boost its R&D investment by a factor of five, from 0.15% of GDP. Its National Strategy for the Development of Science, Technology and Innovation gives priority to biotechnology and environmental science and technology. South Africa’s ten-year innovation plan 2008-18 identified climate change as one its five grand challenges. Brazil’s National Strategy for Science, Technology and Innovation 2012-15 had two of its five objectives focused on environment. Chile also established International Centres of Excellence in solar and marine energy to attract investment in green technology and innovation (Box 14).
Box 14. Chile’s international centres of excellence
Chile’s International Centres of Excellence (ICEs) were initiated in 2009 as joint R&D institutions that bring together cutting-edge international players with local partners. They are intended to ease access to international resources, skills and technology, while promoting local innovation, skills development and enhanced linkages between research and businesses.
As of 2016, 14 ICEs had been established, including a Marine Energy ICE and the Centre for Solar Energy Technologies. The latter is jointly operated by the German Fraunhofer Institute for Solar Energy Systems and the Pontifical Catholic University of Santiago. The ICE conducts research on solar electricity generation, solar heat for industrial use and solar water treatment, as well as testing high radiation solar technologies and providing quality assurance through standards and certification. Source: OECD (2016), Environmental Performance Reviews: Chile 2016.
7.2. Environmental goods and services markets
There are little, if any, official statistics information about the market of environmental goods and services (EGS) in EMEs. Yet, there is some evidence that market opportunities have expanded, with growth in environmental policy development and enforcement and increased infrastructure investment. For example, the US Department of Commerce (2017) estimated the market potential for environmental technology, goods and services in Brazil to be over USD 30 billion in 2017, due to the large population and growing middle class rather than to strong adherence to environmental laws. The market potential in Mexico was estimated at over USD 15 billion in 2017, thanks to unprecedented investment in environmental infrastructure (US Department of Commerce, 2017). The Chilean EGS market was estimated to be 1.7% of GDP in 2010 and to employ 28 600 workers across about 2000 companies (OECD, 2016a). Turkey is the second largest solar thermal market after the People’s Republic of China. Its exports of environment-related products grew between 2002 and 2015 from 4.8% to 6.4% of total exports, but Turkey remains below the OECD average (OECD, 2019).
EMEs could build on international experience to improve their information base about the EGS market and job opportunities. This would help assess the effects of environmental policies and their socio-economic outcomes, and facilitate the development and evaluation of policies aimed at accelerating the transition towards green growth.
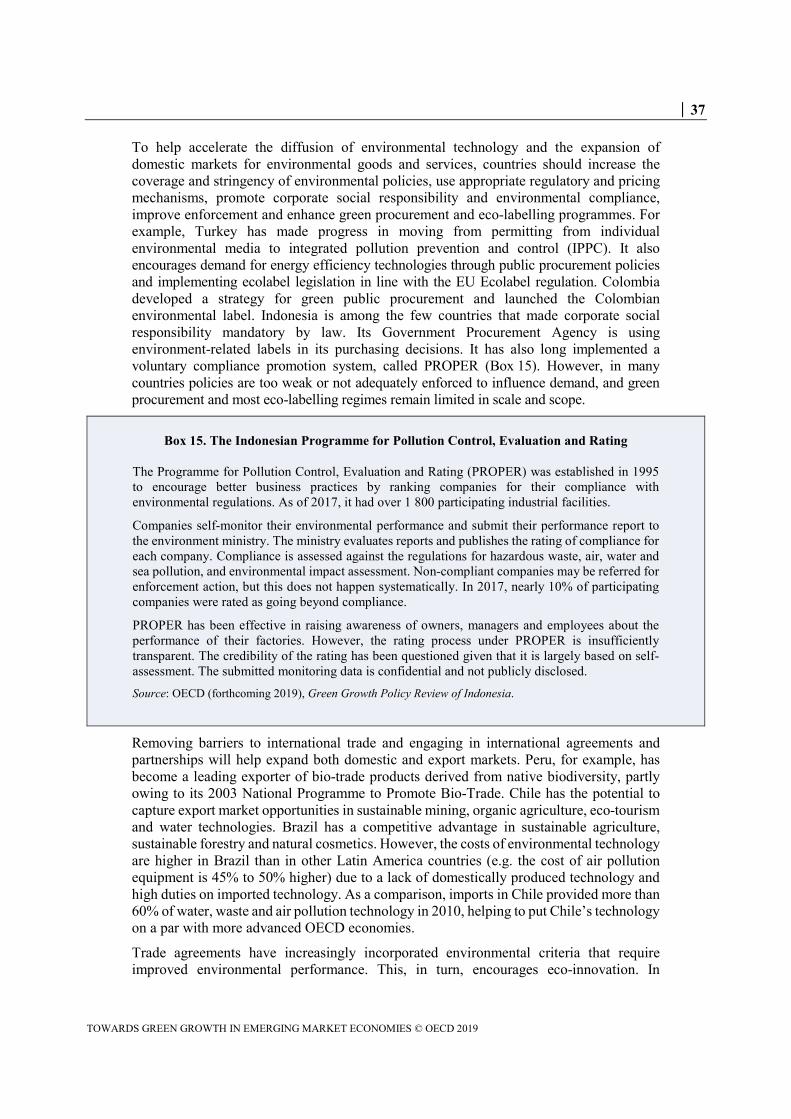
│ 37
TOWARDS GREEN GROWTH IN EMERGING MARKET ECONOMIES © OECD 2019
To help accelerate the diffusion of environmental technology and the expansion of domestic markets for environmental goods and services, countries should increase the coverage and stringency of environmental policies, use appropriate regulatory and pricing mechanisms, promote corporate social responsibility and environmental compliance, improve enforcement and enhance green procurement and eco-labelling programmes. For example, Turkey has made progress in moving from permitting from individual environmental media to integrated pollution prevention and control (IPPC). It also encourages demand for energy efficiency technologies through public procurement policies and implementing ecolabel legislation in line with the EU Ecolabel regulation. Colombia developed a strategy for green public procurement and launched the Colombian environmental label. Indonesia is among the few countries that made corporate social responsibility mandatory by law. Its Government Procurement Agency is using environment-related labels in its purchasing decisions. It has also long implemented a voluntary compliance promotion system, called PROPER (Box 15). However, in many countries policies are too weak or not adequately enforced to influence demand, and green procurement and most eco-labelling regimes remain limited in scale and scope.
Box 15. The Indonesian Programme for Pollution Control, Evaluation and Rating
The Programme for Pollution Control, Evaluation and Rating (PROPER) was established in 1995 to encourage better business practices by ranking companies for their compliance with environmental regulations. As of 2017, it had over 1 800 participating industrial facilities.
Companies self-monitor their environmental performance and submit their performance report to the environment ministry. The ministry evaluates reports and publishes the rating of compliance for each company. Compliance is assessed against the regulations for hazardous waste, air, water and sea pollution, and environmental impact assessment. Non-compliant companies may be referred for enforcement action, but this does not happen systematically. In 2017, nearly 10% of participating companies were rated as going beyond compliance.
PROPER has been effective in raising awareness of owners, managers and employees about the performance of their factories. However, the rating process under PROPER is insufficiently transparent. The credibility of the rating has been questioned given that it is largely based on self-assessment. The submitted monitoring data is confidential and not publicly disclosed. Source: OECD (forthcoming 2019), Green Growth Policy Review of Indonesia.
Removing barriers to international trade and engaging in international agreements and partnerships will help expand both domestic and export markets. Peru, for example, has become a leading exporter of bio-trade products derived from native biodiversity, partly owing to its 2003 National Programme to Promote Bio-Trade. Chile has the potential to capture export market opportunities in sustainable mining, organic agriculture, eco-tourism and water technologies. Brazil has a competitive advantage in sustainable agriculture, sustainable forestry and natural cosmetics. However, the costs of environmental technology are higher in Brazil than in other Latin America countries (e.g. the cost of air pollution equipment is 45% to 50% higher) due to a lack of domestically produced technology and high duties on imported technology. As a comparison, imports in Chile provided more than 60% of water, waste and air pollution technology in 2010, helping to put Chile’s technology on a par with more advanced OECD economies.
Trade agreements have increasingly incorporated environmental criteria that require improved environmental performance. This, in turn, encourages eco-innovation. In

38 │
TOWARDS GREEN GROWTH IN EMERGING MARKET ECONOMIES © OECD 2019
addition, international climate finance, emission trading and offset mechanisms can help to promote technology and knowledge transfer and develop innovative capacity. The Clean Development Mechanism, for example, has helped promote technology transfer in Mexico and Brazil.

│ 39
TOWARDS GREEN GROWTH IN EMERGING MARKET ECONOMIES © OECD 2019
8. Reducing poverty and social exclusion are essential to green growth
8.1. Domestic policies
The social impact of green growth policies is a key factor influencing public support in all countries, and especially so in emerging market economies (EMEs), which generally face high inequality, poverty and unemployment. Labour informality tends to be high in many of these countries, particularly in the agricultural sector. Poor and rural communities are the most vulnerable to the impacts of environmental degradation and natural disasters. In Colombia and Indonesia, for example, the poor working in illegal mines are more exposed to hazardous substances; in Colombia, workers that produce illegal crops are more exposed to chemicals. In all eight countries, poverty has become an urban issue due to massive rural-to-urban migration. However, communities in rural and isolated areas such as forest areas in Brazil and Indonesia often lack access to electricity, drinking water and basic sanitation.
The eight countries examined in this report have developed approaches to address both social and environmental challenges that could be expanded or replicated in other environmental policy areas. South Africa developed a Working for Water programme that hires and trains members of marginal communities to remove invasive vegetation (Box 16). Brazil’s Pro-Catador programme includes capacity building, technical training, improved working conditions and expanded opportunities for waste pickers; its Bolsa Floresta and Bolsa Verde programmes provide monthly cash payments to families living in protected areas in exchange for forest conservation efforts. Mexico’s payment for ecosystem services programme primarily benefits vulnerable populations, and provides financial assistance to poor rural and indigenous communities living in protected areas. Indonesia’s social forestry concessions provide forest communities with the right to use state-owned forest land for 35 years, thereby supporting the livelihoods of poor rural communities, discouraging land clearing and encouraging the adoption of practices for the sustainable management of natural resources (OECD, forthcoming 2019a; Santika et al., 2017).
The number of environmental conflicts related to mining, energy and infrastructure projects across countries shows the deep concern held in many communities about the impacts of development on local natural resources, intertwined with inequality, social exclusion, unemployment and poverty. Unclear land tenure has led to land conflicts involving local communities and is a driver of deforestation. Brazil, Chile, Colombia, Indonesia, Mexico, Peru and Turkey rank in the top 15 in the world in terms of the number of environmental conflicts. Chile, Colombia and Peru stand out in terms of conflict per number of inhabitants (Table 3). Several actions are needed to reduce conflict, including improving environmental services in rural and remote areas, clarifying land tenure, strengthening environmental enforcement, improving environmental assessment of projects, extending access to information, education and justice, and enhancing public participation in decision making. Peru, for example, has taken several measures in this direction (Box 17).

40 │
TOWARDS GREEN GROWTH IN EMERGING MARKET ECONOMIES © OECD 2019
Box 16. South Africa’s Working for Water programme
South Africa established its Working for Water programme in 1995. The programme hires and trains members of marginal communities to remove invasive plants that are high-water consumers. This helps preserve water resources for human needs and the environment. The workers benefit from employment and training that includes technical skills, small business development and health education.
The programme has run more than 300 projects throughout the country, employed about 20 000 people per year and cleared more than one million hectares of invasive alien plants. Wood removed as part of the programme is made available to pulp, paper and board mills for processing, helping create jobs in rural areas.
The programme faced early criticism for favouring people with better connections and offering only short term work. Subsequent reforms helped it to be seen as broadly successful from both an environmental and social perspective. A similar programme, titled “Working on Fire”, was created to help mitigate the consequences of wild fires and provide employment.
Source: OECD (2013), OECD Environmental Performance Reviews: South Africa 2013.
Table 3. Environmental conflicts in selected emerging market economies
2018
Country Number of environmental conflicts
(number of conflicts per million population in brackets) World ranking
India 278 (0.21) 1st Colombia 128 (2.61) 2nd Brazil 113 (0.54) 3rd China (People’s Republic of) 87 (0.06) 5th Mexico 87 (0.67) 5th Peru 86 (2.75) 6th Indonesia 65 (0.25) 9th Turkey 58 (0.72) 11th Chile 50 (2.77) 13th South Africa 21 (0.37) 27th
Source: Environmental Justice Atlas (2018), https://ejatlas.org/ (accessed 23 October 2018).

│ 41
TOWARDS GREEN GROWTH IN EMERGING MARKET ECONOMIES © OECD 2019
Box 17. Managing socio-environmental conflict in Peru
To help manage rising environmental conflict, Peru has tried to improve overall environmental awareness and the participation of rural and indigenous communities in decisions that have environmental implications. The Office of the Ombudsman monitors social conflicts and issues a monthly report.
In 2011, Peru established the Advisory Office on Socio-environmental Matters (OAAS) within the environment ministry. OAAS is responsible for the management, prevention and solution of socio-environmental disputes.
The National Office for Dialogue and Sustainability is a government agency under the aegis of the Prime Minister’s office responsible for setting up mechanisms for co-ordination with the different government levels, as well as with stakeholders and leaders from the public and private sectors.
New legislative and administrative measures have also been adopted to enhance citizen participation in decision making, such as the Prior Consultation Law that regulates the process for consulting indigenous communities about activities in their territories. Peru’s new Payment for Ecosystem Services Law aims to secure investment in environmental services for rural and marginalised areas.
Source: OECD/ECLAC (2017), Environmental Performance Reviews: Peru 2017.
8.2. Development co-operation
Development co-operation can contribute to achieving green growth in a way that aligns with poverty alleviation and social inclusion objectives. Environment continues to be a major theme of bilateral and multilateral assistance provided to EMEs (Figure 9). The emphasis on environment-related assistance is expected to increase, as development agendas shift to align with climate finance commitments and the 2030 Agenda for Sustainable Development and its 17 Sustainable Development Goals (SDGs).
Even modest amounts of development financing can leverage significant investment, in addition to contribute to capacity building and technology transfer. For example, in 2009-12, USD 414 million in concessional loans from the World Bank’s Clean Technology Fund leveraged co-financing from public and private institutions that resulted in additional USD 3.6 billion investment for sustainable urban transport, energy-efficient equipment and renewables in Mexico. In Chile, USD 15 million from Canada in climate finance for a solar photovoltaics (PV) project resulted in the co-financing and mobilisation of USD 46 million (Government of Canada, 2015).

42 │
TOWARDS GREEN GROWTH IN EMERGING MARKET ECONOMIES © OECD 2019
Figure 9. Environment-related aid has grown in most emerging market economies
Source: OECD (2018), “Creditor Reporting System: Aid Activities”, OECD International Development Statistics (database).
EMEs themselves are also increasingly acting as providers of development assistance to other emerging and developing economies (Figure 10). Brazil, Chile and Mexico are active partners in triangular co-operation, which often involves partnerships with bilateral providers and international organisations. Several of the projects being undertaken are environment-related. The Amazonia Sem Fogo project of Bolivia, Brazil and Italy, for example, aims to reduce deforestation by developing alternatives to the use of fire in agriculture. Peru has participated in more than 30 regional and global projects that received contribution from the Global Environment Facility. Mexico has also engaged with Japan in environment and disaster prevention in El Salvador and Guatemala, and with Spain on water and sanitation in Haiti. Turkey provides aid for water, sanitation and hygiene, as well as a training programme for industrial energy efficiency.
As EMEs expand their role in development co-operation, they will need to mainstream environment and sustainability criteria into the design and implementation of their development programmes, and develop efficient and transparent reporting of development assistance. Mexico, for example, established a national system of information in international development co-operation with support from the OECD Development Assistance Committee (DAC) and the UN Development Programme.
0
50
100
150
200
250
Colombia Brazil China(People's Rep.
of)
Indonesia Turkey India Peru Mexico South Africa Chile
Bilateral allocable ODA targeting the environment as principal objective (period averages)
2014-16 2005-07
USD million, 2016 prices

│ 43
TOWARDS GREEN GROWTH IN EMERGING MARKET ECONOMIES © OECD 2019
Figure 10. Emerging market economies increasingly provide aid to other countries
Note: OECD estimates of concessional flows for development from countries that do not report to DAC statistical systems. These estimates are on a gross basis because information on repayments is not available. Estimates are based on publically available information and are not necessarily complete or comparable. For some countries, estimates on funds channelled through multilateral organisations are based on data from the UN Department of Economic and Social Affairs, www.aidflows.org, and websites of other multilateral organisations. Data include only development-related contributions. Local resources – financing from a country through multilateral organisations earmarked to programmes within that same country – are excluded. As for reporting countries, coefficients are applied to core contributions to multilateral organisations that do not exclusively work in countries eligible for receiving ODA. These coefficients reflect the developmental part of the multilateral organisations’ activities. Figures for India and South Africa are based on their fiscal years. For example, 2012 data correspond to fiscal year 2012/13. Source: OECD (2017), Development Co‑operation Report 2017: Data for Development.
500
1 000
1 500
2 000
2 500
3 000
3 500
China (People'sRep. of)
India Brazil Mexico South Africa Chile Indonesia Colombia
Estimates of gross concessional flows for development co-operation2010-15 averageMillion USD

44 │
TOWARDS GREEN GROWTH IN EMERGING MARKET ECONOMIES © OECD 2019
Notes
1 For the purpose of this paper, emerging market economies are broadly identified as those having a gross domestic product per capita higher than most developing countries but lower than developed countries. Emerging market economies are generally experiencing rapid economic growth and their living standards are gradually converging towards those of high-income economies. Brazil, Colombia, Mexico, Peru, South Africa and Turkey are upper-middle income countries according to the World Bank classification. Indonesia is a lower-middle-income country and Chile is a high-income country. 2 The initiative is supported by the United Nations Industrial Development Organization (UNIDO) in co-operation with the OECD, the Development Bank of Latin American (CAF), the Latin American and Caribbean Economic System (SELA) and the United Nations Environment Programme (UNEP). 3 The International Energy Agency considers advanced biofuels as sustainable fuels produced from non-food crop feedstocks, which are capable of significantly reducing lifecycle GHG emissions compared with fossil fuel alternatives, and which do not directly compete with food and feed crops for agricultural land or cause adverse sustainability impacts (IEA, 2018).

│ 45
TOWARDS GREEN GROWTH IN EMERGING MARKET ECONOMIES © OECD 2019
References
Arlinghaus, J. and K. van Dender (2017), “The environmental tax and subsidy reform in Mexico”, OECD Taxation Working Papers, No. 31, OECD Publishing, Paris, https://doi.org/10.1787/a9204f40-en.
Banister, D., P. Crist and S. Perkins (2015), “Land transport and how to unlock investment in support of “green growth””, OECD Green Growth Papers, No. 2015/01, OECD Publishing, Paris, https://doi.org/10.1787/5js65xnk52kc-en.
Environmental Finance (2017), Green Bonds: Review of 2017, Environmental Finance, London, www.environmental-finance.com/assets/files/Green%20Bonds%20Review%20of%202017.pdf.
FAO (2015), Global Forest Resources Assessment 2015, Food and Agriculture Organization of the United Nations, Rome.
FS-UNEP and BNEF (2018), Global Trends in Renewable Energy Investment 2018, Frankfurt School-UNEP Collaborating Centre and Bloomberg New Energy Finance, Frankfurt am Main, www.fs-unep-centre.org .
Government of Canada (2015), “International Climate Financing: Chile” (webpage), https://climate-change.canada.ca/finance/country-pays.aspx?id=45
Harding, M. (2014), “Personal tax treatment of company cars and commuting expenses: Estimating the fiscal and environmental costs”, OECD Taxation Working Papers, No. 20, OECD Publishing, Paris, https://doi.org/10.1787/5jz14cg1s7vl-en.
IEA (2018), Renewables 2018: Analysis and Forecasts to 2023, International Energy Agency, Paris, https://doi.org/10.1787/re_mar-2018-en.
IEA (2016a), Energy Subsidies, International Energy Agency, Paris, www.worldenergyoutlook.org/resources/energysubsidies/.
IEA (2016b), “Fossil fuel subsidy reform in Mexico and Indonesia”, Partner countries series, International Energy Agency, Paris, https://webstore.iea.org/partner-country-series-fossil-fuel-subsidy-reform-in-mexico-and-indonesia.
IEA (2013), World Energy Outlook 2013, International Energy Agency, IEA, Paris, https://doi.org/10.1787/weo-2013-en.
Korinek, J. (2015), “Managing the minerals sector: Implications for trade from Peru and Colombia”, OECD Trade Policy Papers, No. 186, OECD Publishing, Paris, https://doi.org/10.1787/5jrp6wrc2r7l-en.
Madrid, J. (2012), “Medellin’s amazing metro system: Colombia uses public transport to drive societal change”, ThinkProgress (website), http://thinkprogress.org/climate/2012/03/13/443330/medellin-metro-system-colombia-public-transport/.
OBG (2018), “Increased public spending and private investment driving expansion in Indonesia transport”, in The Report: Indonesia 2017, Oxford Business Group, London, https://oxfordbusinessgroup.com/overview/development-agenda-indonesia%E2%80%99s-transport-sector-midst-increased-public-spending-and-private.
OECD (forthcoming 2019a), Green Growth Policy Review of Indonesia, OECD Publishing, Paris.
OECD (forthcoming 2019b), Indonesia’s effort to phase out and rationalise its fossil-fuel subsidies, A report on the G20 peer-review of inefficient fossil-fuel subsidies that encourage wasteful consumption in Indonesia, OECD Publishing, Paris.

46 │
TOWARDS GREEN GROWTH IN EMERGING MARKET ECONOMIES © OECD 2019
OECD (2019), OECD Environmental Performance Reviews: Turkey 2019, OECD Publishing, Paris, https://doi.org/10.1787/9789264309753-en.
OECD (2018a), OECD Economic Outlook, Volume 2018 Issue 1, OECD Publishing, Paris, https://doi.org/10.1787/eco_outlook-v2018-1-en.
OECD (2018b), OECD Economic Surveys: Brazil 2018, OECD Publishing, Paris, https://doi.org/10.1787/eco_surveys-bra-2018-en.
OECD (2018c), Taxing Energy Use 2018: Companion to the Taxing Energy Use Database, OECD Publishing, Paris, https://doi.org/10.1787/9789264289635-en.
OECD (2018d), OECD Economic Surveys: Indonesia 2018, OECD Publishing, Paris, https://doi.org/10.1787/eco_surveys-idn-2018-en.
OECD (2018e), Effective Carbon Rates 2018: Pricing Carbon Emissions through Taxes and Emissions Trading, OECD Publishing, Paris, https://doi.org/10.1787/9789264305304-en.
OECD (2018f), Developing Robust Project Pipelines for Low-Carbon Infrastructure, Green Finance and Investment, OECD Publishing, Paris, https://doi.org/10.1787/9789264307827-en.
OECD (2018g), Economic Outlook for Southeast Asia, China and India 2018 - Update: Promoting Opportunities in E-commerce, OECD Publishing, Paris, https://doi.org/10.1787/9789264302990-en.
OECD (2018h), Getting it Right: Strategic Priorities for Mexico, OECD Publishing, Paris, https://doi.org/10.1787/9789264292062-en.
OECD (2017a), Green Growth Indicators 2017, OECD Green Growth Studies, OECD Publishing, Paris, https://doi.org/10.1787/9789264268586-en.
OECD (2017b), Agricultural Policy Monitoring and Evaluation 2017, OECD Publishing, Paris, https://doi.org/10.1787/agr_pol-2017-en.
OECD (2017c), Water Charges in Brazil: The Ways Forward, OECD Studies on Water, OECD Publishing, Paris, https://doi.org/10.1787/9789264285712-en.
OECD (2016a), OECD Environmental Performance Reviews: Chile 2016, OECD Publishing, Paris, www.oecd.org/environment/oecd-environmental-performance-reviews-chile-2016-9789264252615-en.htm.
OECD (2016b), OECD Economic Surveys: Indonesia 2016, OECD Publishing, Paris, http://dx.doi.org/10.1787/eco_surveys-idn-2016-en.
OECD (2016c), Promoting Productivity for Inclusive Growth in Latin America, OECD Better Policy Series, OECD, Paris, http://pac-files.oecd.org/acrobatebook/0316081e.pdf.
OECD (2015a), Towards Green Growth? Tracking Progress, OECD Green Growth Studies, OECD Publishing, Paris, http://dx.doi.org/10.1787/9789264234437-en.
OECD (2015b), OECD Environmental Performance Reviews: Brazil 2015, OECD Publishing, Paris, www.oecd.org/env/oecd-environmental-performance-reviews-brazil-2015-9789264240094-en.htm.
OECD (2015c), OECD Companion to the Inventory of Support Measures for Fossil Fuels 2015, OECD Publishing, Paris, http://dx.doi.org/10.1787/9789264239616-en.
OECD (2015d), Overcoming Barriers to International Investment in Clean Energy, Green Finance and Investment, OECD Publishing, Paris, https://doi.org/10.1787/9789264227064-en.
OECD (2014a), OECD Environmental Performance Reviews: Colombia 2014, OECD Publishing, Paris, www.oecd.org/env/country-reviews/colombia2014.htm#Informations.

│ 47
TOWARDS GREEN GROWTH IN EMERGING MARKET ECONOMIES © OECD 2019
OECD (2014b), Green Growth Indicators 2014, OECD Green Growth Studies, OECD Publishing, Paris, https://doi.org/10.1787/9789264202030-en.
OECD (2013a), Putting Green Growth at the Heart of Development, OECD Green Growth Studies, OECD Publishing, http://dx.doi.org/10.1787/9789264181144-en.
OECD (2013b), OECD Environmental Performance Reviews: Mexico 2013, OECD Publishing, Paris, www.oecd.org/env/country-reviews/mexico2013.htm.
OECD (2013c), OECD Environmental Performance Reviews: South Africa 2013, OECD Publishing, Paris, www.oecd.org/env/country-reviews/oecd-environmental-performance-reviews-south-africa-2013-9789264202887-en.htm.
OECD/ECLAC (2017), OECD Environmental Performance Reviews: Peru 2017, OECD Publishing, Paris, https://doi.org/10.1787/9789264283138-en.
OECD/ECLAC/CAF (2018), Latin American Economic Outlook 2018: Rethinking Institutions for Development, OECD Publishing, Paris, https://doi.org/10.1787/leo-2018-en.
OECD et al. (2018), Revenue Statistics in Latin America and the Caribbean 2018, OECD Publishing, Paris, https://doi.org/10.1787/rev_lat_car-2018-en-fr.
Santika, T. et al. (2017), “Community forest management in Indonesia: Avoided deforestation in the context of anthropogenic and climate complexities”, Global Environmental Change, Vol. 46/August, pp. 60-71, http://dx.doi.org/10.1016/j.gloenvcha.2017.08.002.
SEMARNAT (2018), “Environmental Performance Reviews. Mid-term progress report of Mexico”, report presented at the Working Party on Environmental Performance on 13-15 February 2018, Ministry of Environment and Natural Resources of Mexico, Mexico City.
US Department of Commerce (2017), “2017 Top Markets Report, Environmental Technologies, A Market Assessment Tool for U.S. Exporters”, US Department of Commerce, International Trade Administration, Washington, DC, www.trade.gov/topmarkets/pdf/Environmental_Technologies_Top_Markets_Report2017.pdf.
World Bank, Ecofys and Vivid Economics (2017), State and Trends of Carbon Pricing 2017, World Bank, Washington, http://documents.worldbank.org/curated/en/468881509601753549/pdf/120810-REVISED-PUB-PUBLIC.pdf
World Economic Forum (WEF) (2017), The Global Competitiveness Report 2017-2018, World Economic Forum, Geneva, http://www3.weforum.org/docs/GCR2017-2018/05FullReport/TheGlobalCompetitivenessReport2017%E2%80%932018.pdf.

OECD Green Growth Papers
www.oecd.org/greengrowth
Towards Green Growth in Emerging Market EconomiesEVIDENCE FROM ENVIRONMENTAL PERFORMANCE REVIEWS
March 2019
2019-01