Towards Further Verification of Physiologically-Based...
44
JPET#251413 1 Title Page Towards Further Verification of Physiologically-Based Kidney Models: Predictability of the Effects of Urine-Flow and Urine-pH on Renal Clearance Takanobu Matsuzaki, Daniel Scotcher, Adam S. Darwich, Aleksandra Galetin, and Amin Rostami- Hodjegan Centre for Applied Pharmacokinetic Research, University of Manchester, Manchester, UK (T.M., D.S., A.S.D., A.G., A.R.-H.). Research Laboratories for Development, Shionogi & Co., Ltd., Osaka, Japan (T.M.) Simcyp Limited (A Certara Company), Sheffield, UK (A.R.-H.) This article has not been copyedited and formatted. The final version may differ from this version. JPET Fast Forward. Published on November 9, 2018 as DOI: 10.1124/jpet.118.251413 at ASPET Journals on August 13, 2019 jpet.aspetjournals.org Downloaded from
Transcript of Towards Further Verification of Physiologically-Based...

JPET#251413
1
Title Page
Towards Further Verification of Physiologically-Based Kidney Models: Predictability of
the Effects of Urine-Flow and Urine-pH on Renal Clearance
Takanobu Matsuzaki, Daniel Scotcher, Adam S. Darwich, Aleksandra Galetin, and Amin Rostami-
Hodjegan
Centre for Applied Pharmacokinetic Research, University of Manchester, Manchester, UK (T.M., D.S.,
A.S.D., A.G., A.R.-H.).
Research Laboratories for Development, Shionogi & Co., Ltd., Osaka, Japan (T.M.)
Simcyp Limited (A Certara Company), Sheffield, UK (A.R.-H.)
This article has not been copyedited and formatted. The final version may differ from this version.JPET Fast Forward. Published on November 9, 2018 as DOI: 10.1124/jpet.118.251413
at ASPE
T Journals on A
ugust 13, 2019jpet.aspetjournals.org
Dow
nloaded from

JPET#251413
2
Running Title Page
Running title: Prediction of perturbed drug renal clearance
Corresponding author:
Prof. Amin Rostami-Hodjegan, Centre for Applied Pharmacokinetic Research, The University of
Manchester, Stopford Building, Oxford Road, Manchester M13 9PT, United Kingdom. Phone: +44-
161-3060634, Fax: +44-114-2922333, E-mail: [email protected]
Manuscript Statistics:
Number of text pages: 25
Number of tables: 3
Number of figures: 6
Number of References: 83
Number of words in Abstract: 235/250
Number of words in the Introduction: 805/750
Number of words in the Discussion: 1467/1500
This article has not been copyedited and formatted. The final version may differ from this version.JPET Fast Forward. Published on November 9, 2018 as DOI: 10.1124/jpet.118.251413
at ASPE
T Journals on A
ugust 13, 2019jpet.aspetjournals.org
Dow
nloaded from

JPET#251413
3
List of nonstandard abbreviations:
AFE average fold error
AAFE absolute average fold error
AKI acute kidney injury
AUC area under the curve
CCD cortical collecting ducts
CLint,uptake intrinsic uptake clearance
CLint,efflux intrinsic efflux clearance
CLint,HLM intrinsic metabolic clearance in human liver microsome
CLiv intravenous clearance
CLPD,x passive permeability clearance across membrane x
CLR renal excretion clearance
CLR,filt renal filtration clearance
CL/F oral clearance
DDI drug-drug interactions
DT distal tubule
IVIVE in vitro to in vivo extrapolation
GFR glomerular filtration rate
LogP octanol-water partition coefficient
LoH loop of Henle
MATE multidrug and toxin extrusion protein
MCD medullary collecting ducts
MechKiM mechanistic kidney model
OAT organic anion transporters
Papp apparent permeability
Pmem apparent membrane permeability
PBPK physiologically-based pharmacokinetic(s)
PT proximal tubule
This article has not been copyedited and formatted. The final version may differ from this version.JPET Fast Forward. Published on November 9, 2018 as DOI: 10.1124/jpet.118.251413
at ASPE
T Journals on A
ugust 13, 2019jpet.aspetjournals.org
Dow
nloaded from
JPET#251413
4
RMSE root mean square error
Vss volume of distribution at steady state
Recommended section: Metabolism, Transport, and Pharmacogenomics
This article has not been copyedited and formatted. The final version may differ from this version.JPET Fast Forward. Published on November 9, 2018 as DOI: 10.1124/jpet.118.251413
at ASPE
T Journals on A
ugust 13, 2019jpet.aspetjournals.org
Dow
nloaded from

JPET#251413
5
Abstract
In vitro-in vivo extrapolation (IVIVE) of renal excretory clearance (CLR) using the physiologically-
based kidney models can provide mechanistic insight into the interplay of multiple processes
occurring in the renal tubule. However, the ability of these models to quantitatively capture the impact
of perturbed conditions (e.g., urine flow/ urine pH changes) on CLR has not been fully evaluated. The
current work aimed to assess the predictability of the effect of urine flow and urine pH on CLR and
tubular drug concentrations (selected examples). Passive diffusion clearance across the nephron tubule
membrane was scaled from in vitro Caco-2 permeability data by nephron tubular surface area to
predict fraction reabsorbed and CLR of caffeine, chloramphenicol, creatinine, dextroamphetamine,
nicotine, sulfamethoxazole and theophylline. CLR values predicted using mechanistic kidney model at
urinary pH of 6.2 and 7.4 resulted in prediction bias of 2.87 and 3.62-fold, respectively. Model
simulations captured urine flow dependent CLR, albeit with minor under-prediction of the observed
magnitude of change. The relationship between drug solubility, urine flow and urine pH, illustrated in
simulated intra-tubular concentrations of acyclovir and sulfamethoxazole, was in agreement with
clinical data on tubular precipitation and crystal-induced acute kidney injury. This study represents the
first systematic evaluation of the ability of the mechanistic kidney model to capture the impact of urine
flow and urine pH on CLR and drug tubular concentrations with the aim to facilitate refinement of
IVIVE-based mechanistic prediction of renal excretion.
This article has not been copyedited and formatted. The final version may differ from this version.JPET Fast Forward. Published on November 9, 2018 as DOI: 10.1124/jpet.118.251413
at ASPE
T Journals on A
ugust 13, 2019jpet.aspetjournals.org
Dow
nloaded from

JPET#251413
6
Introduction
Together with the liver, the kidneys play a principal role in the excretion of a wide variety of
xenobiotics, including drugs, metabolites and toxins, as well as endogenous compounds. Renal
excretion can be defined as the elimination of unchanged solutes from the blood into the urine, as a net
result of the processes of glomerular filtration, tubular secretion, and tubular reabsorption (Tucker,
1981).
Passive tubular reabsorption is a major process controlling the extent of renal excretion of many
substances (Varma et al., 2009; Scotcher et al., 2016b). The magnitude of passive reabsorption
depends on the lipophilicity and extent of ionization of a drug, and physiological properties such as
urine flow rate and the pH of the luminal fluid in the renal tubule (Tang-Liu et al., 1983). Urine flow
and urine pH dependent CLR has been reported for several drugs (Beckett et al., 1969; Sharpstone,
1969; Tang-Liu et al., 1982; Blanchard and Sawers, 1983; Birkett and Miners, 1991). Such trends are
often mechanistically rationalized by the Henderson-Hasselbalch equation as arising from perturbed
tubular reabsorption (Tucker, 1981; Molander et al., 2001).
In addition, urine flow and urine pH can be important contributors to renal toxicity risk.
Sulfamethoxazole and acyclovir are low solubility compounds, and crystalluria leading to acute
kidney injury (AKI) reported for these drugs has been attributed to changes in urine flow and urine pH
(Perazella, 1999). Direct measurement of the concentration of drugs in renal tubules with comparison
to compound solubility properties may be beneficial in managing such risk. In the absence of direct
measurements of intra-tubular concentrations in humans, use of mechanistic models representing
pharmacokinetic processes within the proximal tubules in a physiologically meaningful context, may
provide useful insights and inferences in a quantitative manner.
In order to predict human renal excretion clearance (CLR), an in vitro-in vivo extrapolation (IVIVE)-
based approach using a mechanistic renal tubular reabsorption model was previously reported and
validated with a set of 45 drugs that undergo limited secretion (Scotcher et al., 2016b). Advantages of
This article has not been copyedited and formatted. The final version may differ from this version.JPET Fast Forward. Published on November 9, 2018 as DOI: 10.1124/jpet.118.251413
at ASPE
T Journals on A
ugust 13, 2019jpet.aspetjournals.org
Dow
nloaded from

JPET#251413
7
this model include separation of drug- and physiological/system-specific information, which allows
potential extrapolation to populations with different pathophysiological features. Despite its
physiological nature, an important limitation of this static model was that urine flow dependent CLR
could not be adequately described which also limits simulation of intra-tubular drug concentrations.
Mechanistic kidney models developed within a physiologically-based pharmacokinetic (PBPK)
modelling framework can theoretically resolve the above limitations. However, these models typically
include a large number of parameters, and measured data to inform some of the system (physiological)
parameters may not exist (e.g., proximal tubule cellularity) or are associated with uncertainty (e.g.,
renal transporter abundances) (Neuhoff et al., 2013; Scotcher et al., 2016a). In addition, some
parameters may exhibit biological variability that is not controlled or monitored in a typical clinical
study; for example, urinary pH can range from 4.5 to 8, but is generally slightly acidic (i.e., 5.5 to 7.0)
because of metabolic activity (Simerville et al., 2005). Another challenge with such complex models is
ensuring identifiability of parameters as plasma concentration-time data may not always be
informative for all model parameters (Hsu et al., 2014; Huang and Isoherranen, 2018), as discussed
previously (Tsamandouras et al., 2015; Scotcher et al., 2017; Guo et al., 2018). All above is applicable
also in the case of renal elimination especially when attempting to quantitatively separate roles of
active transport and passive permeability to overall secretion and/ or reabsorption (e.g., salicylic acid,
creatinine). Therefore, independent verification of specific model assumptions relating to passive
permeability of drugs in kidney would be of benefit since this is currently lacking.
The overall aim of this study was to assess the accuracy of a mechanistic kidney model for simulation
of CLR and intra-tubular concentrations under perturbed conditions, particularly changes in urine flow
and urine pH, when only effects relating to passive permeability were considered. Mechanistic
description of active processes was not addressed; readers interested in this topic are directed
elsewhere (Hsu et al., 2014; Posada et al., 2015; Ball et al., 2017). The accuracy of IVIVE-based
predictions of both CLR, and fold-changes in CLR due to urine flow or pH changes was evaluated for
caffeine, chloramphenicol, creatinine, dextroamphetamine, nicotine, sulfamethoxazole and
This article has not been copyedited and formatted. The final version may differ from this version.JPET Fast Forward. Published on November 9, 2018 as DOI: 10.1124/jpet.118.251413
at ASPE
T Journals on A
ugust 13, 2019jpet.aspetjournals.org
Dow
nloaded from

JPET#251413
8
theophylline. Criteria for their selection included availability of clinical data under perturbed
conditions for CLR, particularly changes in urine flow and urine pH. Subsequently, the ability of the
kidney model to simulate intra-tubular concentrations was investigated for low solubility drugs
acyclovir and sulfamethoxazole. The effects of variations in urine flow and urine pH was assessed in
order to evaluate likelihood of precipitation risk associated with crystalluria. Clinical reports on the
effect of urine flow/pH changes on the occurrence of crystalluria for these two drugs were used for
indirect validation of the simulated intra-tubular drug concentrations. Implications of the findings on
the mechanistic prediction of tubular reabsorption and CLR using IVIVE-PBPK modelling are
discussed.
This article has not been copyedited and formatted. The final version may differ from this version.JPET Fast Forward. Published on November 9, 2018 as DOI: 10.1124/jpet.118.251413
at ASPE
T Journals on A
ugust 13, 2019jpet.aspetjournals.org
Dow
nloaded from

JPET#251413
9
Materials and Methods
Development of initial PBPK model without Mechanistic Kidney Model (MechKiM). A literature
search in PubMed identified seven drugs for which CLR and urine flow rates were simultaneously
reported in the same subjects; these drugs were caffeine, chloramphenicol, creatinine,
dextroamphetamine, nicotine, sulfamethoxazole and theophylline. In addition, acyclovir and
sulfamethoxazole were selected to assess the relationship between tubular concentrations and
solubility due to their association with crystalluria. Mean plasma concentration-time profiles and
pharmacokinetic parameters were collated from the reported clinical studies (Table 1).
Pharmacokinetic parameters of interest were the area under the curve (AUC) for the plasma
concentration-time profile, the intravenous clearance (CLiv) and apparent oral clearance (CL/F),
volume of distribution at steady state (Vss) and CLR. Where necessary, data were digitized using
WebPlotDigitizer (version 3.12 and 4.0, https://automeris.io/WebPlotDigitizer). Where necessary, CLR
values were calculated from the urinary excretion rate (urine concentration × urine flow rate) divided
by its plasma concentration, or total urine excretion amount divided by AUC.
All simulations presented herein were performed using the Simcyp simulator, version 16, release 1
(Certara, Sheffield, UK) (Jamei et al., 2009; Jamei et al., 2013). Drug-dependent parameters for the
initial PBPK models without implementation of the MechKiM are listed in Supplemental Tables S-1
and S-2. All simulations were performed using the default “Healthy volunteers” population template
file in the Simcyp simulator. The workflow used for refinement and verification of compound files in
the full PBPK model, as required for use of MechKiM, is shown in Figure 1.
For the whole-body PBPK models, distribution parameters including Vss and tissue-to-plasma partition
coefficients (Kp) were predicted using modified Rodgers and Rowland method, (Rodgers et al., 2005;
Rodgers and Rowland, 2006; Gaohua et al.). Predicted Kp values were optimized by an empirical
scalar (same factor used for all tissues) in order to recover the observed Vss, as estimated from
observed plasma-concentration profile using parameter estimation module in the simulator (weighted
least squares fitting, weighted by the reciprocal of the predicted value squared). No refinement of
This article has not been copyedited and formatted. The final version may differ from this version.JPET Fast Forward. Published on November 9, 2018 as DOI: 10.1124/jpet.118.251413
at ASPE
T Journals on A
ugust 13, 2019jpet.aspetjournals.org
Dow
nloaded from

JPET#251413
10
predicted Kp was necessary for creatinine (Kp scalar = 1). Metabolic clearance and CLR input
parameters for the caffeine and theophylline PBPK models were not changed from the default values.
The intrinsic hepatic metabolic clearance parameters (CLint,HLM) for amphetamine, chloramphenicol
and nicotine were obtained using back-calculation of CLint from available CLiv data, using the well-
stirred model and correcting for CLR.
Following verification of the clearance and distribution parameters, first-order oral absorption model
parameters, fraction absorbed (Fa) and the absorption rate constant (ka), were optimized and verified
for caffeine, creatinine, dextroamphetamine, and theophylline. Since the production rate of creatinine
is reported to be 18.72 mg/kg/day in human (Boroujerdi, 1982), an intravenous infusion dosing of
18.72 mg/kg/day was implemented to mimic the production rate of creatinine. The cooked meat meal
is suggested to contain about 340 mg creatinine (Mayersohn et al., 1983) and therefore, oral
administration of 340 mg creatinine was assumed for this condition. Data used for verification were
from independent clinical studies different to those used for parameter refinement and developing the
model; details of clinical studies collated are listed in Table 1. During verification and refinement of
PBPK models, simulations in 10 trials of virtual subjects were performed following trial designs
(dosing route, amount, and frequency; number of individuals and age of subjects) reported in the
respective publications.
Prediction of tubular reabsorption in MechKiM: Physiological parameters and scaling
approach. Previously reported IVIVE-based static tubular reabsorption model (Scotcher et al., 2016b),
is a 5-compartment mechanistic model, comprising of segments representing the glomerulus proximal
tubule (PT), the loop of Henle (LoH), the distal tubule (DT), and the collecting ducts (CD) (Scotcher
et al., 2016b). In contrast, MechKiM, is comprised of eight segments representing the glomerulus,
three sub-regions of PT (PT-1, PT-2, and PT-3), the LoH, the DT, and the cortical and medullary CD
(CCD and MCD) (Neuhoff et al., 2013). The MechKiM parameterizes passive permeability of drugs
across the tubular epithelium as permeability clearances through the apical (CLPD,apical) and basolateral
This article has not been copyedited and formatted. The final version may differ from this version.JPET Fast Forward. Published on November 9, 2018 as DOI: 10.1124/jpet.118.251413
at ASPE
T Journals on A
ugust 13, 2019jpet.aspetjournals.org
Dow
nloaded from

JPET#251413
11
(CLPD,basal) membranes, rather than a ‘drug-specific’ apparent permeability (Papp) and a ‘system-
specific’ tubular surface area.
In this study, an IVIVE approach was adapted from the static model for prediction of passive tubular
reabsorption (Scotcher et al., 2016b). Papp values across Caco-2 cell monolayers were obtained from
various literature sources, and details for each individual drug investigated are listed in Supplemental
Table S-3. The passive permeability in MechKiM is applied to the unbound and unionized species.
According to Henderson-Hasselbalch equations, chloramphenicol, dextroamphetamine, nicotine and
sulfamethoxazole are estimated to have a smaller fraction in unionized form at apical (donor side, pH
6.5) and basolateral side (receiver side, pH 7.4) in the pH gradient format of the Caco-2 permeability
assay (Supplemental Figure S-1 and Table S-4). In vitro Papp measurements across Caco-2 cell
monolayers can be affected by the drug characteristics (e.g., lipophilicity, pKa, unbound fraction in
buffer and cells, and unspecific adsorption to in vitro systems) and assay conditions (e.g., buffer pH,
rotation speeds, transporters and density of cell monolayer). Full details of the assay conditions were
not consistently reported alongside the Caco-2 Papp data that were collected from the literature.
Therefore, in order to calculate the CLPD used in MechKiM, the assumption was made that literature
reported Caco-2 Papp values were representative of the passive permeability of unbound and unionized
drug.
The apparent membrane permeability (Pmem) was calculated on the basis that resistance is the inverse
of permeability, and by assuming that the membrane resistance associated with the Caco-2 cell
monolayer is attributable to the sum of resistances associated with the apical and basolateral
membranes (Eq. 1 (Avdeef, 2012; Kramer, 2016). This method makes several assumptions: the
permeability of drugs across the apical membrane is equal to that of the basolateral membrane; no
significant accumulation or binding of drug within the cell; assay is performed under sink conditions
and no relevant effects of the filter support, aqueous boundary layer or para-cellular pathway.
����� = ���� (Eq. 1)
This article has not been copyedited and formatted. The final version may differ from this version.JPET Fast Forward. Published on November 9, 2018 as DOI: 10.1124/jpet.118.251413
at ASPE
T Journals on A
ugust 13, 2019jpet.aspetjournals.org
Dow
nloaded from

JPET#251413
12
Pmem was scaled to CLPD,apical and CLPD,basal using regional tubular surface area (TSA), as IVIVE scaling
factor for each ith tubular section represented by the model (Eq. 2).
���,� = ���� × ���� (Eq. 2)
Tubular surface area for each tubular section were recalculated to adapt to MechKiM from the
reported values for the 5-compartment model (Supplemental Table S-5; (Scotcher et al., 2016b)), and
are listed in Table 2 The CLPD values for each drug are shown in Supplemental Table S-6.
Predictive performance of the model against Freab and CLR parameters was assessed for several
compounds. The focus of the work was on renal elimination and corresponding changes in CLR;
therefore, predictive performance of plasma concentration-time profiles was not assessed. Transporter
contribution was assumed to be negligible for the compounds investigated. Although in vitro data
indicate involvement of renal transporters in some instances (e.g., creatinine), the roles of filtration
and/ or passive permeability to renal elimination are expected to be dominant. Simulations were
performed following the reported clinical study designs in 10 trials of virtual subjects from the healthy
volunteer population provided in the software. The effect of different assumed values for urinary pH
on prediction of CLR was investigated by fixing the urine pH parameter to 7.4 (Simcyp default value)
or 6.2 (Rose et al., 2015). Due to lack of measured data on segmental filtrate pH in human (Neuhoff et
al., 2013), tubular pH was assumed to be the same as urinary pH in this study. In order to compare the
predictability of different models, prediction of CLR by the static model was also assessed, as
described previously (Scotcher et al., 2016b). The tubular surface area and tubular flow rate values
used for the static model are listed in Supplemental Table S-7.
Development of PBPK model for acyclovir in MechKiM and consideration of active secretion.
Acyclovir is rapidly excreted in the urine via glomerular filtration and tubular secretion via renal
transporters, including organic anion transporter (OAT)1, OAT2, OAT3 and multidrug and toxin
extrusion (MATE)1, and MATE2-K (Takeda et al., 2002; Tanihara et al., 2007; Ito et al., 2010; Cheng
et al., 2012; Ye et al., 2012; Ye et al., 2013; Mathialagan et al., 2017). Predicted CLR value of
acyclovir in MechKiM without considering renal transporters (i.e., filtration clearance only) was 115
This article has not been copyedited and formatted. The final version may differ from this version.JPET Fast Forward. Published on November 9, 2018 as DOI: 10.1124/jpet.118.251413
at ASPE
T Journals on A
ugust 13, 2019jpet.aspetjournals.org
Dow
nloaded from
JPET#251413
13
mL/min, thereby under-predicting the observed CLR value of 283 mL/min (Soul-Lawton et al., 1995)
(Supplemental Table S-8). Accurate mechanistic representation of transporter kinetics for acyclovir
was out of scope of this study, and therefore an operational model was developed to simulate this
compound’s active secretion. The operational model, featuring a single basolateral transporter-
mediated uptake clearance and a single apical efflux clearance, was developed using a previously
described step-wise approach (Hsueh et al., 2018). Firstly, a CLint,uptake value for uptake transport in the
renal proximal tubules was determined by fitting the in vivo plasma concentration-time profile (Soul-
Lawton et al., 1995) (weighted least squares fitting, weighted by the reciprocal of the predicted value
squared), while fixing a CLint,efflux value of 1 µL/min/million proximal tubule cells as reference value
(Hsueh et al., 2018). Secondly, using the resulting CLint,uptake value (14.0 µL/min/million proximal
tubule cells), the CLint,efflux value (1.15 µL/min/million proximal tubule cells) was obtained by
sensitivity analysis of the observed CLR data (283 mL/min (Soul-Lawton et al., 1995)) (Supplemental
Figure S-2). The simulated concentration-time profiles were in good agreement with observed data
(Supplemental Figure S-3). Finally, observed acyclovir CLR data reported by other clinical studies
were used for model verification (Supplemental Table S-8).
Simulation of urine flow dependent CLR. Effects of variations of urine flow on CLR were simulated
for each drug using the virtual population representative (male, age: 20 years, body weight: 81 kg) in
healthy volunteer population. Dosage information used for simulations are listed in Supplemental
Table S-9. Urine and tubule pH values of 4.5, 6.2 and 8.0 were used in order to investigate the impact
of the fraction of drug as unionized species. The relative change in CLR was calculated using CLR
predicted when urine flow rate = 1 mL/min as baseline. Focus of the work was on relative changes as a
result of perturbed renal elimination, analogous to approaches applied for the evaluation of drug-drug
or drug-disease interactions (e.g., (Yoshida et al., 2017). Changes in plasma drug concentrations due to
urine flow variations are typically small and not frequently reported, so were not evaluated in the
current study. Baseline CLR at urine flow rate of 1 mL/min was calculated from reported clinical data
over a flow range; details for individual drugs and clinical studies are shown in Supplemental Table S-
10.
This article has not been copyedited and formatted. The final version may differ from this version.JPET Fast Forward. Published on November 9, 2018 as DOI: 10.1124/jpet.118.251413
at ASPE
T Journals on A
ugust 13, 2019jpet.aspetjournals.org
Dow
nloaded from

JPET#251413
14
Tubular flow rate input parameter values used in the MechKiM and the static model are listed in
Supplemental Tables S-11 and S-12, respectively. In order to maintain mass balance, Simcyp
MechKiM tubular outflow rates were matched to the inflow rates of the subsequent tubule
compartment. Therefore, the inflow rate to the first proximal tubule compartment was defined as the
GFR and was set to 120 mL/min. Bladder urine flow rates in MechKiM were varied from 0.1 mL/min
to 20.0 mL/min to cover the range observed in clinical studies measuring CLR; the adjusted flow rate
values were calculated by the Simcyp software for the remaining tubular compartments. In clinical
observations, patients with reported acyclovir-induced AKI showed low urine output of approximately
0.1 – 0.2 mL/min (Giustina et al., 1988; Eck et al., 1991). Although higher urine flow rate values (up
to approximately 28 mL/min) have been reported in human under extreme water diuresis, clinical CLR
data under this condition were not found in literature (Supplemental Table S-13).
In the case of the static tubular reabsorption model, midpoint flow rates were assumed for each tubular
region; the highest flow rate investigated (11.6 mL/min) was determined by the assumed flow rate at
the beginning of the collecting duct, and the urine flow rate range from 0.1 mL/min to 11.6 mL/min.
The flow rates for the remaining tubular regions were not changed in the static model, following the
assumption that changes to urine flow rate are mediated by changes to water permeability only in the
collecting duct. This assumption is in accordance with current understanding of the physiological
regulation of water balance via a feedback mechanism involving osmoreceptor, arginine vasopressin,
and aquaporin (Knepper et al., 2015).
Simulation of urine pH dependent CLR. Effects of variations of urine pH on CLR were simulated for
each drug using a generic virtual study design of 10 trials of 10 subjects (proportion of females: 0.5;
age: 20-50 years) in healthy volunteer population. Dosage information for simulations is shown in
Supplemental Table S-9. The fluid pH at each tubule (PT, LoH, DT, and CD) was varied from pH 4 to
pH 9, while assuming the same for urine pH. GFR for virtual subjects were calculated using the
Cockcroft-Gault equation, based on serum creatinine, age and weight of the defined virtual population,
and bladder urine flow rates were 1 mL/min. Observed data obtained from the literature are listed in
This article has not been copyedited and formatted. The final version may differ from this version.JPET Fast Forward. Published on November 9, 2018 as DOI: 10.1124/jpet.118.251413
at ASPE
T Journals on A
ugust 13, 2019jpet.aspetjournals.org
Dow
nloaded from

JPET#251413
15
Supplemental Table S-10. Data were presented graphically as fold changes in CLR from baseline
values at either 1mL/ min urine flow rate or pH 6.2. As with the urine flow simulations, primary focus
was on the magnitude of changes, rather than the absolute values.
Simulation of tubular concentration for acyclovir and sulfamethoxazole. Acyclovir and
sulfamethoxazole are associated with the precipitation of crystals in the distal tubular lumen including
collecting ducts in patients and non-human animals (Brigden et al., 1982; Tucker, 1982; Tucker et al.,
1983; Sawyer et al., 1988; Perazella, 1999). To evaluate the relationship between tubular
concentration and solubility, tubular concentrations of acyclovir and sulfamethoxazole were simulated
using the population representative (a 20 years old man, 81 kg of body weight) in healthy volunteer
population. In addition, urine concentration was calculated from simulated excreted urine amount and
urine flow rate, using sampling at regular intervals for 0.25 h, 1 h, 3 h, or 6 h. The solubility of
acyclovir is 2.5 mg/mL in water at 37°C (Arnal et al., 2008), and sulfamethoxazole shows pH-
dependent solubility (0.51 mg/mL at pH 4.11, 0.61 mg/mL at pH 5.48, 8.25 mg/mL at pH 7.16, 37.7
mg/mL at pH 7.79) in aqueous buffer at 37°C (Dahlan et al., 1987). Urine flow rate for simulation was
fixed to either 1 mL/min (control), 0.2 mL/min (assuming volume depletion), or 5 mL/min (assuming
fluid therapy). Urine pH used for acyclovir simulation was set at the median value of pH 6.2, whereas
a range between pH 4 and pH 8 was investigated for sulfamethoxazole due to urine pH sensitive CLR.
Data Analysis. The predictability of the PBPK model and the other approaches was assessed by
calculating the average fold error (AFE), the absolute average fold error (AAFE), and root mean
square error (RMSE), as per the following equations:
��� = 10���∑ ������� �!"� #$%��&� '' ���� = 10���∑(������� �!"� #$%��&� '('
)*�� = +1,-(log(234567589 − log(�658<=>5899�
This article has not been copyedited and formatted. The final version may differ from this version.JPET Fast Forward. Published on November 9, 2018 as DOI: 10.1124/jpet.118.251413
at ASPE
T Journals on A
ugust 13, 2019jpet.aspetjournals.org
Dow
nloaded from

JPET#251413
16
where n is the number of assessed studies for each drug. In addition, the percentage of studies within
the 2-fold and 3-fold was assessed by comparison of the predicted and observed pharmacokinetic
parameters.
This article has not been copyedited and formatted. The final version may differ from this version.JPET Fast Forward. Published on November 9, 2018 as DOI: 10.1124/jpet.118.251413
at ASPE
T Journals on A
ugust 13, 2019jpet.aspetjournals.org
Dow
nloaded from

JPET#251413
17
Results
PBPK models without mechanistic kidney model. Compound specific input parameters for the
developed PBPK models for the investigated drugs are listed in Supplemental Table S-1 and S-2. The
simulated concentration-time profiles prior to activation of mechanistic kidney model were generally
in good agreement with observed data for all drugs (Supplemental Figure S-4). Although some
misspecification of the absorption phase may be apparent for some drugs (or could not be fully
verified with available clinical data), accurate description of oral absorption was not considered an
essential feature of the model for the purpose of the current study, and therefore further refinement of
oral absorption was not performed.
Prediction of CLR using mechanistic kidney model. Subsequently, CLR was predicted using IVIVE
of tubular reabsorption for seven drugs/endogenous molecules, namely caffeine, chloramphenicol,
creatinine, dextroamphetamine, nicotine, sulfamethoxazole, and theophylline. Predictions were
performed using mechanistic kidney model and following different urinary pH assumptions (Table 3
and Supplemental Figure S-5). Urinary and tubular pH at average condition (i.e., without co-
administration of ammonium chloride or sodium bicarbonate for urine acidification or alkalification,
respectively) were assumed to be either 7.4 (Simcyp default value) or 6.2 (Rose et al., 2015). Overall
predictability of CLR using MechKiM model was poorer compared with the static model, reflected in
AAFE of 3.62, 2.87, and 1.97 for the MechKiM model at pH 7.4 and 6.2, and the static reabsorption
model, respectively (Table 3). Use of urinary pH of 6.2 improved the predictability of CLR using the
mechanistic kidney model relative to pH 7.4. However, these differences typically arose from
relatively small differences in predicted Freab (Supplemental Table S-15). Urinary pH had no impact on
simulated CLR for caffeine, creatinine, dextroamphetamine, and theophylline (Supplemental Figure S-
5). Simulated CLR at pH 6.2 was in better agreement with the observed data for chloramphenicol and
sulfamethoxazole compared to pH 7.4, whereas opposite trends were seen for nicotine. Based on this
analysis, pH 6.2 was used as baseline urine pH in MechKiM for subsequent simulations of the average
condition.
This article has not been copyedited and formatted. The final version may differ from this version.JPET Fast Forward. Published on November 9, 2018 as DOI: 10.1124/jpet.118.251413
at ASPE
T Journals on A
ugust 13, 2019jpet.aspetjournals.org
Dow
nloaded from

JPET#251413
18
As expected, simulation of acyclovir CLR without consideration of renal transporters resulted in a
substantial under-prediction of CLR (Supplemental Table S-8). When renal transporters were
accounted for using an operational model, simulated CLR of acyclovir was in close agreement with
observed values (predicted/ observed ratio: 0.93), and no impact of pH was noted. The simulated
concentration-time profiles using MechKiM at urine pH of 6.2 are shown in Figure 2. The simulations
of systemic profiles were generally in agreement with the model where prediction of CLR was not
done in a mechanistic manner.
Simulation of urine flow dependent CLR. The impact of changes in urine flow rate on the simulated
CLR of eight selected drugs was assessed (See Figure 3), by changing the relevant tubular flow rate
parameters in mechanistic kidney model while keeping urine pH constant at 4.5, 6.2 and 8.0. Overall,
prediction of changes in CLR at different urine flow rates by MechKiM showed better consistency with
observed data than predictions using the static model. The model predictions identified caffeine,
sulfamethoxazole and theophylline as compounds with the largest relative change in CLR resulting
from changes in urine flow rate, in agreement with observed data. However, an overall under-
prediction of the magnitude of urine-flow dependent changes in CLR was apparent. This under-
prediction trend was particularly evident for sulfamethoxazole in the acidic urine condition. In the
current dataset, use of urinary pH of 6.2 resulted in the best agreement with predicted change in CLR
for caffeine, creatinine and theophylline. The simulated trend in CLR for chloramphenicol at urinary
pH 4.5 was generally in agreement with observed data. Although simulations for nicotine under acidic
condition (pH 4.5) predicted a urine flow dependent CLR, the magnitude of this predicted effect was
small. Large variability in nicotine observed CLR data and small range of corresponding urine flow
rates made it difficult to determine the true extent of co-variability for this drug. There was no effect
of urine flow on predicted CLR of creatinine and acyclovir, which are low permeability compounds
(Papp = 1.08 and 0.291 × 10⁻⁶ cm/s, respectively).
This article has not been copyedited and formatted. The final version may differ from this version.JPET Fast Forward. Published on November 9, 2018 as DOI: 10.1124/jpet.118.251413
at ASPE
T Journals on A
ugust 13, 2019jpet.aspetjournals.org
Dow
nloaded from

JPET#251413
19
Simulation of urine pH dependent CLR. Simulated impact of changes in urine pH on CLR of the
eight drugs was also assessed (Figure 4), by changing the urine and tubular fluid pH in MechKiM,
while keeping urine flow rate constant at 1 mL/min in 100 virtual healthy subjects. Simulated CLR of
chloramphenicol, nicotine and sulfamethoxazole was sensitive to urine pH over the range of 4.5 to 8.0,
whereas no effect was seen for remaining compounds. The trends in simulated pH-dependent changes
in CLR for sulfamethoxazole were largely in agreement with the observed data, although observed
trends for nicotine and dextroamphetamine were not recovered. In the case of chloramphenicol,
theophylline and acyclovir, prediction accuracy could not be assessed due to lack of clinical CLR
values reported with corresponding urine pH data.
This article has not been copyedited and formatted. The final version may differ from this version.JPET Fast Forward. Published on November 9, 2018 as DOI: 10.1124/jpet.118.251413
at ASPE
T Journals on A
ugust 13, 2019jpet.aspetjournals.org
Dow
nloaded from

JPET#251413
20
Simulation of renal tubular concentrations of acyclovir and sulfamethoxazole. High dose of
acyclovir was reported to induce crystal-induced AKI (Sawyer et al., 1988; Perazella, 1999). Low dose
of this drug is typically well-tolerated, but can also cause AKI in the presence of severe volume
depletion (urine output: 350 mL/24 hr) (Giustina et al., 1988). Analogous to acyclovir,
sulfamethoxazole can cause AKI in the presence of acidic urine (pH < 7.15) (Perazella, 1999). Tubular
concentrations of acyclovir and sulfamethoxazole were simulated using doses for which crystal-
induced AKI have been reported. Simulations of acyclovir PK and CLR at high dose (500 mg/m2
intravenous infusion, t.i.d. for 14 days) indicated that MCD was the tubular region with the highest
Cmax (Figure 5A). Acyclovir predicted MCD tubular filtrate Cmax of 4.69 mg/mL at normal urine flow
rate (1 mL/min), which exceeds the reported aqueous solubility of 2.5 mg/mL. Urinary concentrations
calculated from simulated data for urine sampling every 0.25 h were comparable to the simulated
MCD tubule concentrations, whereas urine sampling at 3 h intervals or longer showed less agreement
(Figure 5B). At a low dose (5 mg/kg intravenous infusion, q.d. for 2 days) predicted concentrations of
acyclovir in MCD tubule were below aqueous solubility at normal urine flow, but above aqueous
solubility cut-off when urine flow was low (0.2 mL/min, Figure 6A). Similarly, simulation of high
dose (25 mg/kg q.i.d. for 14 days) of sulfamethoxazole with normal urine flow rate (1 mL/min)
predicted Cmax in MCD tubules equal to its solubility when pH < 7 (Figure 6B). In addition, low urine
flow rate increased tubular concentration of sulfamethoxazole beyond its aqueous solubility limit.
Simulation of high urine flow of 5 mL/min markedly decreased the Cmax of acyclovir and
sulfamethoxazole in MCD tubules; in this condition their simulated tubular Cmax were below solubility
limit.
This article has not been copyedited and formatted. The final version may differ from this version.JPET Fast Forward. Published on November 9, 2018 as DOI: 10.1124/jpet.118.251413
at ASPE
T Journals on A
ugust 13, 2019jpet.aspetjournals.org
Dow
nloaded from

JPET#251413
21
Discussion
Several mechanistic pharmacokinetic kidney models have been reported in the literature, with some
recent efforts focusing predominantly on describing in vivo roles of transporter kinetics without
mechanistically accounting for passive permeability (Felmlee et al., 2013; Neuhoff et al., 2013; Dave
and Morris, 2015; Burt et al., 2016; Scotcher et al., 2017). Models developed for the purpose of
describing passive tubular reabsorption have allowed simulation of urine flow dependent CLR of drugs
with different permeability properties (Tang-Liu et al., 1983; Komiya, 1986; Mayer et al., 1988).
However, these models did not account for the varying physiology of the renal tubule in a mechanistic
and quantitative manner, and therefore lack the ability to simulate intra-tubular drug concentrations.
While a mechanistic kidney model implemented within the whole body PBPK model in the Simcyp
simulator could in principle overcome such limitations, the utility of this model for prediction of
tubular reabsorption and effects of physiological changes in urine flow and pH has not been
demonstrated so far (Neuhoff et al., 2013).
In the current study, passive permeability parameters of the mechanistic kidney model were informed
by IVIVE by adapting the scaling approach and regional tubular surface areas, as described previously
(Scotcher et al., 2016b). Although the analysis of the current dataset showed tendency for under-
prediction of observed CLR, such mis-predictions are expected to have marginal consequence on the
systemic exposure, as extensively reabsorbed drugs are often cleared mainly by non-renal routes.
Furthermore, apparently large differences in predicted and observed CLR for extensively reabsorbed
compounds can arise from only minor mis-predictions of the fraction reabsorbed (Supplemental Table
S-15). For example, under-prediction of Freab of 0.99 by 1% (i.e., predicted Freab of 0.98) results in 2-
fold over-prediction of CLR for a completely unbound drug. For average conditions, overall CLR
predictions at pH 6.2 (AAFE of 2.87) were more accurate than the assumption of urinary pH of 7.4
(AAFE of 3.62; Table 3), although nicotine was exception to this trend (Supplemental Table S-14). A
more thorough evaluation of the IVIVE predictive performance of the mechanistic kidney model, with
a larger dataset of drugs, is required to confirm trends observed here. Despite this discrepancy,
predicted CLR for nicotine at both pH were within 3-fold of observed data.
This article has not been copyedited and formatted. The final version may differ from this version.JPET Fast Forward. Published on November 9, 2018 as DOI: 10.1124/jpet.118.251413
at ASPE
T Journals on A
ugust 13, 2019jpet.aspetjournals.org
Dow
nloaded from

JPET#251413
22
Prediction of CLR using the static reabsorption model showed lower bias compared with MechKiM,
despite the use of the same IVIVE scaling factors. The difference between the models may arise from
different physiological assumptions of each model, for example MechKiM accounts for permeability
across cell membranes whereas static model considers permeability across epithelial cell monolayer.
However, the static model has limited ability to simulate concentration-time profiles in renal tubules,
or account for compound ionization and permeability of different ionized species (Scotcher et al.,
2016b).
Choice of in vitro permeability assay may be another consideration when evaluating ability of kidney
models to predict CLR and Freab (Kunze et al., 2014; Scotcher et al., 2016b; Mathialagan et al., 2017).
Colon derived Caco-2 and other in vitro cell lines differ from heterogeneous epithelial cells
constituting the nephron tubule in terms of tight-junctions (affecting para-cellular drug permeability),
transporter expression and presence of microvilli. To address the latter, recent study employed an
empirical surface area scaling factor in order to recapitulate CLR from in vitro permeability data using
a 35-compartment model (Huang and Isoherranen, 2018). No empirical scaling factor was applied in
the current study; instead, the IVIVE approach relied upon physiological assumptions, although
verification of each of the specific parameter values has not yet been achieved.
The mechanistic kidney model accurately identified drugs that exhibit urine flow dependent CLR,
despite under-prediction trends of the magnitude of the effect evident in some cases (Figure 3). These
under-predictions are likely related to the under-prediction of the Freab as discussed above. The model
predicted that the CLR for drugs with higher permeability would be the most sensitive to changes in
urine flow, in agreement with previous studies (Tang-Liu et al., 1983; Komiya, 1986; Mayer et al.,
1988). Conversely, negligible effect of urine flow on CLR was predicted for low permeability
compounds creatinine and acyclovir, in agreement with clinically reported data for creatinine (Tang-
Liu et al., 1983). While previously published kidney models have been able to capture the relationship
This article has not been copyedited and formatted. The final version may differ from this version.JPET Fast Forward. Published on November 9, 2018 as DOI: 10.1124/jpet.118.251413
at ASPE
T Journals on A
ugust 13, 2019jpet.aspetjournals.org
Dow
nloaded from

JPET#251413
23
between urine flow and CLR by fitting model to observed data (‘top down’ approach), they lacked the
ability to simulate local concentrations in tubules (Tang-Liu et al., 1982; Tang-Liu et al., 1983).
According to Henderson-Hasselbalch equations, dextroamphetamine (pKa 10.1 for base) shows a low
fraction unionized (<1%) within range of pH 4.5-8.0 (Supplemental Table S-4). Simulated CLR for
dextroamphetamine was sensitive to changes in urine pH only at pH > 8, in contrast to observed data
in which pH sensitivity occurs across a broader range (Figure 4). Similar outcomes were found for
nicotine, highlighting some uncertainty in fraction unionized across urine pH range and/or
permeability of the ionized species. Measurement of intrinsic permeability of both unionized and
ionized drug species may provide advantages over use of Papp. However, the former requires a more
thorough experimental design and delineation of effects of assay conditions in addition to factors like
binding of drugs to cellular proteins and lipids, organelle-specific partitioning of drugs and transporter
activities via mechanistic modelling (Neuhoff et al., 2003; Volpe, 2008; Avdeef, 2012; Zamek-
Gliszczynski et al., 2013). This approach was not considered in the current study due to the disparate
experimental conditions of the literature Papp data collated. It is also recommended to perform
experiments in the presence of a passive permeability marker and use transporter inhibitors in assay
media.
In the current study, regional differences in filtrate pH were not considered due to scarcity of relevant
physiological data. The micro-puncture studies reported in rat indicate that the urine (pH 6.1) is more
acidic than the proximal tubule filtrate (pH 6.7) in control conditions, but each of these can vary under
different pathophysiological states such as acidosis (Malnic et al., 1972). Factors leading to an acidic
urinary pH include a larger body weight, old age, and increased intake of meat (Rose et al., 2015),
whereas alkaline urine was observed in patients with a urinary tract infection (Simerville et al., 2005).
Clinical data show urine pH can decrease to <5.5 in patients with chronic kidney disease (Kraut and
Kurtz, 2005). In addition to tubular reabsorption, changes in filtrate pH may also affect activity of
some transporters in vivo (e.g., MATE transporters). However, previous studies that used PBPK
modelling to simulate the effect of renal insufficiency on pharmacokinetics of renally eliminated drugs
This article has not been copyedited and formatted. The final version may differ from this version.JPET Fast Forward. Published on November 9, 2018 as DOI: 10.1124/jpet.118.251413
at ASPE
T Journals on A
ugust 13, 2019jpet.aspetjournals.org
Dow
nloaded from

JPET#251413
24
assumed that pH of urine and tubular fluid were unaffected by disease (Hsu et al., 2014; Hsueh et al.,
2018). All above highlights the importance of consideration of changes in urine pH and its impact on
individual renal elimination processes when carrying out modeling and simulation within a PBPK
framework, in particular for the prediction of drug exposure in specific patient populations.
The current study provides supporting evidence for the application of mechanistic kidney model for
simulation of drug concentrations in tubular filtrate in different regions of the nephron. Whereas data
for pre-clinical species can be evaluated using experimental data obtained by invasive methods (e.g.,
micro-puncture (Senekjian et al., 1981)), such data are not available for humans for ethical reasons.
Therefore, indirect verification was performed using reported cases of drug induced crystalluria-AKI.
The relationship between solubility and simulated renal tubular concentration of acyclovir and
sulfamethoxazole were in agreement with current clinical practices of managing precipitation risk and
likelihood of crystal formation in MCD tubules by varying urine flow rate and urine pH. The analysis
of simulated acyclovir concentrations in MCD tubule in different scenarios indicated that urine
sampling every 0.25h would sufficiently capture the dynamic changes of MCD tubular concentrations,
in contrast to urine sampling at every 3h (Figure 5B). Considering practical difficulties of collecting
urine at such short intervals, simulation of tubular concentration using the PBPK modelling can be a
useful tool to identify compounds and dosing regimens that would be at risk of crystalluria-AKI.
Supporting information could also be obtained from further development and application of high
spatial resolution bio-imaging techniques (Notohamiprodjo et al., 2011).
In conclusion, the current study implemented an IVIVE-PBPK approach for predicting CLR of renally
excreted drugs that undergo tubular reabsorption and following changes in urine flow and urine pH. In
addition, the mechanistic kidney model simulated the relationship between solubility and renal tubular
concentration to rationalize and mitigate the risk of crystal-induced AKI. This comprehensive
evaluation represents an additional step towards qualification of mechanistic kidney models for
studying pharmacokinetic variability arising from different clinical scenarios and patient
characteristics. However, uncertainty in the inter- and intra-individual variability of regional tubular
This article has not been copyedited and formatted. The final version may differ from this version.JPET Fast Forward. Published on November 9, 2018 as DOI: 10.1124/jpet.118.251413
at ASPE
T Journals on A
ugust 13, 2019jpet.aspetjournals.org
Dow
nloaded from

JPET#251413
25
urine flow and tubular fluid pH remains. Following further development, coupling of mechanistic
kidney models for prediction of pharmacodynamic/toxicity effects and risk/probabilities of clinical
outcomes under various scenarios is envisaged.
This article has not been copyedited and formatted. The final version may differ from this version.JPET Fast Forward. Published on November 9, 2018 as DOI: 10.1124/jpet.118.251413
at ASPE
T Journals on A
ugust 13, 2019jpet.aspetjournals.org
Dow
nloaded from

JPET#251413
26
Acknowledgments
Takanobu Matsuzaki and Daniel Scotcher equally contributed to this work. We acknowledge Drs.
Sibylle Neuhoff and Howard Burt for expert advice and technical assistance, and Eleanor Savill for
help with submission.
Authorship Contributions
Participated in research design: Matsuzaki, Scotcher, Galetin, Darwich, and Rostami-Hodjegan.
Performed data analysis: Matsuzaki, Scotcher, Galetin, and Rostami-Hodjegan.
Wrote or contributed to the writing of the manuscript: Matsuzaki, Scotcher, Galetin, Darwich, and
Rostami-Hodjegan.
This article has not been copyedited and formatted. The final version may differ from this version.JPET Fast Forward. Published on November 9, 2018 as DOI: 10.1124/jpet.118.251413
at ASPE
T Journals on A
ugust 13, 2019jpet.aspetjournals.org
Dow
nloaded from

JPET#251413
27
References
Arnal J, Gonzalez-Alvarez I, Bermejo M, Amidon GL, Junginger HE, Kopp S, Midha KK, Shah VP, Stavchansky S, Dressman JB and Barends DM (2008) Biowaiver monographs for immediate release solid oral dosage forms: aciclovir. J Pharm Sci 97:5061-5073.
Avdeef A (2012) Absorption and drug development: solubility, permeability, and charge state. John Wiley & Sons, Hoboken, New Jersey, US.
Ball K, Jamier T, Parmentier Y, Denizot C, Mallier A and Chenel M (2017) Prediction of renal transporter-mediated drug-drug interactions for a drug which is an OAT substrate and inhibitor using PBPK modelling. Eur J Pharm Sci 106:122-132.
Beckett AH, Salmon JA and Mitchard M (1969) The relation between blood levels and urinary excretion of amphetamine under controlled acidic and under fluctuating urinary pH values using [14C] amphetamine. J Pharm Pharmacol 21:251-258.
Benowitz NL and Jacob P, 3rd (1993) Nicotine and cotinine elimination pharmacokinetics in smokers and nonsmokers. Clin Pharmacol Ther 53:316-323.
Birkett D and Miners J (1991) Caffeine renal clearance and urine caffeine concentrations during steady state dosing. Implications for monitoring caffeine intake during sports events. Br J Clin Pharmacol 31:405-408.
Blanchard J and Sawers S (1983) Relationship between urine flow rate and renal clearance of caffeine in man. J Clin Pharmacol 23:134-138.
Blum M, Liao S and de Miranda P (1982) Overview of acyclovir pharmacokinetic disposition in adults and children. Am J Med 73:186-192.
Boroujerdi M (1982) The comparability of pharmacokinetics of creatinine in rabbit and man: a mathematical approach. J Theor Biol 95:369-380.
Brigden D, Bye A, Fowle A and Rogers H (1981) Human pharmacokinetics of acyclovir (an antiviral agent) following rapid intravenous injection. J Antimicrob Chemoth 7:399-404.
Brigden D, Rosling AE and Woods NC (1982) Renal function after acyclovir intravenous injection. Am J Med 73:182-185.
Burke JT, Wargin WA, Sherertz RJ, Sanders KL, Blum MR and Sarubbi FA (1982) Pharmacokinetics of intravenous chloramphenicol sodium succinate in adult patients with normal renal and hepatic function. J Pharmacokinet Biopharm 10:601-614.
Burt H, Neuhoff S, Almond L, Gaohua L, Harwood M, Jamei M, Rostami-Hodjegan A, Tucker G and Rowland-Yeo K (2016) Metformin and cimetidine: Physiologically based pharmacokinetic modelling to investigate transporter mediated drug–drug interactions. Eur J Pharm Sci 88:70-82.
Cheng Y, Vapurcuyan A, Shahidullah M, Aleksunes LM and Pelis RM (2012) Expression of organic anion transporter 2 in the human kidney and its potential role in the tubular secretion of guanine-containing antiviral drugs. Drug Metab Dispos 40:617-624.
Dahlan R, McDonald C and Sunderland VB (1987) Solubilities and intrinsic dissolution rates of sulphamethoxazole and trimethoprim. J Pharm Pharmacol 39:246-251.
Dave RA and Morris ME (2015) Semi-mechanistic kidney model incorporating physiologically-relevant fluid reabsorption and transporter-mediated renal reabsorption: pharmacokinetics of γ-hydroxybutyric acid and l-lactate in rats. J Pharmacokinet Pharmacodyn 42:497-513.
de Miranda P, Good SS, Laskin OL, Krasny HC, Connor JD and Lietman PS (1981) Disposition of intravenous radioactive acyclovir. Clin Pharmacol Ther 30:662-672.
This article has not been copyedited and formatted. The final version may differ from this version.JPET Fast Forward. Published on November 9, 2018 as DOI: 10.1124/jpet.118.251413
at ASPE
T Journals on A
ugust 13, 2019jpet.aspetjournals.org
Dow
nloaded from

JPET#251413
28
Dolder PC, Strajhar P, Vizeli P, Hammann F, Odermatt A and Liechti ME (2017) Pharmacokinetics and Pharmacodynamics of Lisdexamfetamine Compared with D-Amphetamine in Healthy Subjects. Front Pharmacol 8:617.
Eck P, Silver SM and Clark EC (1991) Acute renal failure and coma after a high dose of oral acyclovir. N Engl J Med 325:1178-1179.
Felmlee MA, Dave RA and Morris ME (2013) Mechanistic models describing active renal reabsorption and secretion: a simulation-based study. AAPS J 15:278-287.
Gaohua L, Turner DB, Fisher C, Riedmaire AE, Musther H, Gardmer I and Jamei M (2016) A Novel Mechanistic Approach to Predict the Steady State Volume of Distribution (Vss) using the Fick-Nernst-Planck Equation, in The PAGE 2016 meeting.
Giustina A, Romanelli G, Cimino A and Brunori G (1988) Low-dose acyclovir and acute renal failure. Ann Intern Med 108:312.
Guo Y, Chu X, Parrott NJ, Brouwer KLR, Hsu V, Nagar S, Matsson P, Sharma P, Snoeys J, Sugiyama Y, Tatosian D, Unadkat JD, Huang SM and Galetin A (2018) Advancing Predictions of Tissue and Intracellular Drug Concentrations Using In Vitro, Imaging and Physiologically Based Pharmacokinetic Modeling Approaches. Clin Pharmacol Ther.
Hsu V, de LT Vieira M, Zhao P, Zhang L, Zheng JH, Nordmark A, Berglund EG, Giacomini KM and Huang S-M (2014) Towards quantitation of the effects of renal impairment and probenecid inhibition on kidney uptake and efflux transporters, using physiologically based pharmacokinetic modelling and simulations. Clin Pharmacokinet 53:283-293.
Hsueh CH, Hsu V, Zhao P, Zhang L, Giacomini KM and Huang SM (2018) PBPK Modeling of the Effect of Reduced Kidney Function on the Pharmacokinetics of Drugs Excreted Renally by Organic Anion Transporters. Clin Pharmacol Ther 103:485-492.
Huang W and Isoherranen N (2018) Development of a Dynamic Physiologically Based Mechanistic Kidney Model to Predict Renal Clearance. CPT Pharmacometrics Syst Pharmacol.
Hutabarat RM, Unadkat JD, Sahajwalla C, McNamara S, Ramsey B and Smith AL (1991) Disposition of drugs in cystic fibrosis. I. Sulfamethoxazole and trimethoprim. Clin Pharmacol Ther 49:402-409.
Ito S, Kusuhara H, Kuroiwa Y, Wu C, Moriyama Y, Inoue K, Kondo T, Yuasa H, Nakayama H, Horita S and Sugiyama Y (2010) Potent and specific inhibition of mMate1-mediated efflux of type I organic cations in the liver and kidney by pyrimethamine. J Pharmacol Exp Ther 333:341-350.
Jamei M, Marciniak S, Edwards D, Wragg K, Feng K, Barnett A and Rostami-Hodjegan A (2013) The simcyp population based simulator: architecture, implementation, and quality assurance. In Silico Pharmacol 1:1-14.
Jamei M, Marciniak S, Feng K, Barnett A, Tucker G and Rostami-Hodjegan A (2009) The Simcyp population-based ADME simulator. Expert Opin Drug Metab Toxicol 5:211-223.
Kaplan SA, Weinfeld RE, Abruzzo CW, McFaden K, Jack ML and Weissman L (1973) Pharmacokinetic profile of trimethoprim-sulfamethoxazole in man. J Infect Dis 128:Suppl:547-555 p.
Knepper MA, Kwon T-H and Nielsen S (2015) Molecular physiology of water balance. New Engl J Med 372:1349-1358.
Komiya I (1986) Urine flow dependence of renal clearance and interrelation of renal reabsorption and physicochemical properties of drugs. Drug Metab Dispos 14:239.
Kramer SD (2016) Quantitative aspects of drug permeation across in vitro and in vivo barriers. Eur J Pharm Sci 87:30-46.
Kraut JA and Kurtz I (2005) Metabolic Acidosis of CKD: Diagnosis, Clinical Characteristics, and Treatment. Am J Kidney Dis 45:978-993.
This article has not been copyedited and formatted. The final version may differ from this version.JPET Fast Forward. Published on November 9, 2018 as DOI: 10.1124/jpet.118.251413
at ASPE
T Journals on A
ugust 13, 2019jpet.aspetjournals.org
Dow
nloaded from
JPET#251413
29
Kunze A, Huwyler J, Poller B, Gutmann H and Camenisch G (2014) In vitro-in vivo extrapolation method to predict human renal clearance of drugs. J Pharm Sci 103:994-1001.
Laskin OL, de Miranda P, King DH, Page DA, Longstreth JA, Rocco L and Lietman PS (1982a) Effects of probenecid on the pharmacokinetics and elimination of acyclovir in humans. Antimicrob Agents Chemother 21:804-807.
Laskin OL, Longstreth JA, Saral R, de Miranda P, Keeney R and Lietman PS (1982b) Pharmacokinetics and tolerance of acyclovir, a new anti-herpesvirus agent, in humans. Antimicrob Agents Chemother 21:393-398.
Lelo A, Birkett D, Robson R and Miners J (1986) Comparative pharmacokinetics of caffeine and its primary demethylated metabolites paraxanthine, theobromine and theophylline in man. Br J Clin Pharmacol 22:177-182.
Malnic G, Aires MDM and Giebisch G (1972) Micropuncture study of renal tubular hydrogen ion transport in the rat. Am J Physiol 222:147-158.
Mannisto PT, Mantyla R, Mattila J, Nykanen S and Lamminsivu U (1982) Comparison of pharmacokinetics of sulphadiazine and sulphamethoxazole after intravenous infusion. J Antimicrob Chemother 9:461-470.
Mathialagan S, Piotrowski MA, Tess DA, Feng B, Litchfield J and Varma MV (2017) Quantitative Prediction of Human Renal Clearance and Drug-Drug Interactions of Organic Anion Transporter Substrates Using In Vitro Transport Data: A Relative Activity Factor Approach. Drug Metab Dispos 45:409-417.
Mayer JM, Hall SD and Rowland M (1988) Relationship between lipophilicity and tubular reabsorption for a series of 5‐alkyl‐5‐ethylbarbituric acids in the isolated perfused rat kidney preparation. J Pharm Sci 77:359-364.
Mayersohn M, Conrad KA and Achari R (1983) The influence of a cooked meat meal on creatinine plasma concentration and creatinine clearance. Br J Clin Pharmacol 15:227-230.
Mikami J, Oda K and Hongo M (1975) [Plasma concentration-time profile of chloramphenicol after oral-, intramuscular-, and intravenously- administration of chloramphenicol in healthy men (in Japanese language)]. Japan Society of Clinical Trials and Research 3:1862-1866.
Molander L, Hansson A and Lunell E (2001) Pharmacokinetics of nicotine in healthy elderly people. Clin Pharmacol Ther 69:57-65.
Nahata MC and Powell DA (1981) Bioavailability and clearance of chloramphenicol after intravenous chloramphenicol succinate. Clin Pharmacol Ther 30:368-372.
Neuhoff S, Gaohua L, Burt H, Jamei M, Li L, Tucker GT and Rostami-Hodjegan A (2013) Accounting for transporters in renal clearance: towards a mechanistic kidney model (Mech KiM), in Transporters in Drug Development (Sugiyama Y and Steffansen B eds) pp 155-177, Springer, New York.
Neuhoff S, Ungell A-L, Zamora I and Artursson P (2003) pH-dependent bidirectional transport of weakly basic drugs across Caco-2 monolayers: implications for drug–drug interactions. Pharm Res 20:1141-1148.
Newton R, Broughton L, Lind M, Morrison P, Rogers H and Bradbrook I (1981) Plasma and salivary pharmacokinetics of caffeine in man. Eur J Clin Pharmacol 21:45-52.
Notohamiprodjo M, Pedersen M, Glaser C, Helck AD, Lodemann KP, Jespersen B, Fischereder M, Reiser MF and Sourbron SP (2011) Comparison of Gd-DTPA and Gd-BOPTA for studying renal perfusion and filtration. J Magn Reson Imaging 34:595-607.
Perazella MA (1999) Crystal-induced acute renal failure. Am J Med 106:459-465.
Posada MM, Bacon JA, Schneck KB, Tirona RG, Kim RB, Higgins JW, Pak YA, Hall SD and Hillgren KM (2015) Prediction of Renal Transporter Mediated Drug-Drug Interactions for
This article has not been copyedited and formatted. The final version may differ from this version.JPET Fast Forward. Published on November 9, 2018 as DOI: 10.1124/jpet.118.251413
at ASPE
T Journals on A
ugust 13, 2019jpet.aspetjournals.org
Dow
nloaded from

JPET#251413
30
Pemetrexed Using Physiologically Based Pharmacokinetic Modeling. Drug Metab Dispos 43:325-334.
Rodgers T, Leahy D and Rowland M (2005) Physiologically based pharmacokinetic modeling 1: predicting the tissue distribution of moderate-to-strong bases. J Pharm Sci 94:1259-1276.
Rodgers T and Rowland M (2006) Physiologically based pharmacokinetic modelling 2: predicting the tissue distribution of acids, very weak bases, neutrals and zwitterions. J Pharm Sci 95:1238-1257.
Rose C, Parker A, Jefferson B and Cartmell E (2015) The Characterization of Feces and Urine: A Review of the Literature to Inform Advanced Treatment Technology. Crit Rev Environ Sci Technol 45:1827-1879.
Rovei V, Chanoine F and Strolin Benedetti M (1982) Pharmacokinetics of theophylline: a dose-range study. Br J Clin Pharmacol 14:769-778.
Sawyer MH, Webb DE, Balow JE and Straus SE (1988) Acyclovir-induced renal failure. Clinical course and histology. Am J Med 84:1067-1071.
Scotcher D, Jones C, Posada M, Rostami-Hodjegan A and Galetin A (2016a) Key to opening kidney for in vitro-in vivo extrapolation entrance in health and disease: Part I: In vitro systems and physiological data. AAPS J 18:1067-1081.
Scotcher D, Jones C, Rostami-Hodjegan A and Galetin A (2016b) Novel minimal physiologically-based model for the prediction of passive tubular reabsorption and renal excretion clearance. Eur J Pharm Sci 94:59-71.
Scotcher D, Jones CR, Galetin A and Rostami-Hodjegan A (2017) Delineating the Role of Various Factors in Renal Disposition of Digoxin through Application of Physiologically Based Kidney Model to Renal Impairment Populations. J Pharmacol Exp Ther 360:484-495.
Senekjian HO, Knight TF and Weinman EJ (1981) Micropuncture study of the handling of gentamicin by the rat kidney. Kidney Int 19:416-423.
Sharpstone P (1969) The renal handling of trimethoprim and sulphamethoxazole in man. Postgrad Med J 45:38-42.
Simerville J, Maxted W and Pahira J (2005) Urinalysis: a comprehensive review. Am Fam Physician 71:1153-1162.
Soul-Lawton J, Seaber E, On N, Wootton R, Rolan P and Posner J (1995) Absolute bioavailability and metabolic disposition of valaciclovir, the L-valyl ester of acyclovir, following oral administration to humans. Antimicrob Agents Chemother 39:2759-2764.
Takeda M, Khamdang S, Narikawa S, Kimura H, Kobayashi Y, Yamamoto T, Cha S, Sekine T and Endou H (2002) Human organic anion transporters and human organic cation transporters mediate renal antiviral transport. J Pharmacol Exp Ther 300:918-924.
Tang-Liu DD-S, Tozer TN and Riegelman S (1982) Urine flow-dependence of theophylline renal clearance in man. J Pharmacokinet Biopharm 10:351-364.
Tang-Liu DD, Tozer TN and Riegelman S (1983) Dependence of renal clearance on urine flow: a mathematical model and its application. J Pharm Sci 72:154-158.
Tanihara Y, Masuda S, Sato T, Katsura T, Ogawa O and Inui K (2007) Substrate specificity of MATE1 and MATE2-K, human multidrug and toxin extrusions/H (+)-organic cation antiporters. Biochem Pharmacol 74:359-371.
Tsamandouras N, Dickinson G, Guo Y, Hall S, Rostami-Hodjegan A, Galetin A and Aarons L (2015) Development and application of a mechanistic pharmacokinetic model for simvastatin and its active metabolite simvastatin acid using an integrated population PBPK approach. Pharm Res 32:1864-1883.
Tucker G (1981) Measurement of the renal clearance of drugs. Br J Clin Pharmacol 12:761-770.
This article has not been copyedited and formatted. The final version may differ from this version.JPET Fast Forward. Published on November 9, 2018 as DOI: 10.1124/jpet.118.251413
at ASPE
T Journals on A
ugust 13, 2019jpet.aspetjournals.org
Dow
nloaded from

JPET#251413
31
Tucker WE, Jr. (1982) Preclinical toxicology profile of acyclovir: an overview. Am J Med 73:27-30.
Tucker WE, Jr., Macklin AW, Szot RJ, Johnston RE, Elion GB, de Miranda P and Szczech GM (1983) Preclinical toxicology studies with acyclovir: acute and subchronic tests. Fundam Appl Toxicol 3:573-578.
Varma MV, Feng B, Obach RS, Troutman MD, Chupka J, Miller HR and El-Kattan A (2009) Physicochemical determinants of human renal clearance. J Med Chem 52:4844-4852.
Volpe DA (2008) Variability in Caco-2 and MDCK Cell-Based Intestinal Permeability Assays. J Pharm Sci 97:712-725.
Wan SH, Matin SB and Azarnoff DL (1978) Kinetics, salivary excretion of amphetamine isomers, and effect of urinary pH. Clin Pharmacol Ther 23:585-590.
Watanalumlerd P, Christensen JM and Ayres JW (2007) Pharmacokinetic modeling and simulation of gastrointestinal transit effects on plasma concentrations of drugs from mixed immediate-release and enteric-coated pellet formulations. Pharm Dev Technol 12:193-202.
Welling PG, Craig WA, Amidon GL and Kunin CM (1973) Pharmacokinetics of trimethoprim and sulfamethoxazole in normal subjects and in patients with renal failure. J Infect Dis 128:Suppl:556-566 p.
Ye J, Liu Q, Wang C, Meng Q, Peng J, Sun H, Kaku T and Liu K (2012) Inhibitory effect of JBP485 on renal excretion of acyclovir by the inhibition of OAT1 and OAT3. Eur J Pharm Sci 47:341-346.
Ye J, Liu Q, Wang C, Meng Q, Sun H, Peng J, Ma X and Liu K (2013) Benzylpenicillin inhibits the renal excretion of acyclovir by OAT1 and OAT3. Pharmacol Rep 65:505-512.
Yoshida K, Zhao P, Zhang L, Abernethy DR, Rekić D, Reynolds KS, Galetin A and Huang S-M (2017) In Vitro–In Vivo Extrapolation of Metabolism-and Transporter-Mediated Drug–Drug Interactions—Overview of Basic Prediction Methods. J Pharm Sci 106:2209-2213.
Zamek-Gliszczynski MJ, Lee CA, Poirier A, Bentz J, Chu X, Ellens H, Ishikawa T, Jamei M, Kalvass JC, Nagar S, Pang KS, Korzekwa K, Swaan PW, Taub ME, Zhao P and Galetin A (2013) ITC recommendations for transporter kinetic parameter estimation and translational modeling of transport-mediated PK and DDIs in humans. Clin Pharmacol Ther 94:64-79.
Zevin S, Jacob P, 3rd and Benowitz N (1997) Cotinine effects on nicotine metabolism. Clin Pharmacol Ther 61:649-654.
This article has not been copyedited and formatted. The final version may differ from this version.JPET Fast Forward. Published on November 9, 2018 as DOI: 10.1124/jpet.118.251413
at ASPE
T Journals on A
ugust 13, 2019jpet.aspetjournals.org
Dow
nloaded from

JPET#251413
32
Footnotes
Takanobu Matsuzaki is an employee of Shionogi & Co., Ltd. Daniel Scotcher was supported by a PhD
studentship from the Biotechnology and Biological Sciences Research Council UK [BB/J500379/1]
and AstraZeneca. Amin Rostami-Hodjegan is an employee of Simcyp Limited (A Certara Company).
This article has not been copyedited and formatted. The final version may differ from this version.JPET Fast Forward. Published on November 9, 2018 as DOI: 10.1124/jpet.118.251413
at ASPE
T Journals on A
ugust 13, 2019jpet.aspetjournals.org
Dow
nloaded from

JPET#251413
33
Figure Legends
Figure 1 Workflow of the development and qualification of the PBPK kidney model.
Figure 2 Representative simulated plasma concentration-time profiles using PBPK models
with MechKiM at urine pH of 6.2.
Bold black lines and dashed lines represent mean and 5th-95th percentile of 10 trials, respectively.
Symbols indicate observed data.
Figure 3 Effect of urine flow on predicted CLR in virtual population representative at
tubule pH of 4.5 (red line), 6.2 (green line), 8.0 (blue line) using MechKiM.
Purpled dashed line represents predicted CLR using the static model for comparison. Symbols indicate
observed data with urine pH of normal (green), acidic (red), and alkaline (blue) conditions. Fold
change in simulated CLR (lines) of drugs was calculated using simulated CLR at urine flow = 1mL/min
as baseline for each drug. The literature references for observed data are listed in Supplemental Table
S-10.
Figure 4 Effect of urine pH on predicted CLR in virtual healthy population (10 trials of 10
subjects) using MechKiM.
Black and grey lines represent mean and 5th-95th percentile of 100 subjects, respectively. Purpled
dashed line represents predicted CLR using the static model for comparison. Symbols indicate
observed data for individuals or each study (mean ± SD). The literature references for observed data
are listed in Supplemental Table S-10.
Figure 5 Effect of urine flow on simulated renal tubular concentration of acyclovir at
high-dose using MechKiM in virtual population representative.
(A) Simulated the maximum concentration of acyclovir in renal tubules after intravenously multiple
administration of acyclovir at 500 mg/m2 intravenous infusion over 60 min every 8 hours for 7 days at
urine flow of 0.2, 1.0, and 5.0 mL/min. (B) Simulated concentration-time profiles of medullary
This article has not been copyedited and formatted. The final version may differ from this version.JPET Fast Forward. Published on November 9, 2018 as DOI: 10.1124/jpet.118.251413
at ASPE
T Journals on A
ugust 13, 2019jpet.aspetjournals.org
Dow
nloaded from

JPET#251413
34
collecting duct tubule and urine at urine flow of 1 mL/min. Urine concentrations were calculated for
urine collection intervals of 0.25 h, 1 h, 3h or 6 h. Horizontal dashed line represents the solubility of
acyclovir (2.5 mg/mL).
Figure 6 Effect of urine flow and urine pH on simulated renal tubular concentration of
acyclovir and sulfamethoxazole using MechKiM.
(A) Effect of urine flow on simulated renal tubular concentration of acyclovir at low-dose in virtual
population representative. Simulated concentration-time profiles of acyclovir in medullary collecting
duct tubule after 5 mg/kg intravenous infusion over 90 min every 24 hours for 2 days. Horizontal
dashed line represents the solubility of acyclovir (2.5 mg/mL). (B) Effect of urine flow and urine pH
on simulated renal tubular concentration of sulfamethoxazole in virtual population representative.
Simulated concentration-time profiles of sulfamethoxazole in medullary collecting ducts tubule after
orally multiple administration of sulfamethoxazole at 25 mg/kg oral administration every 6 hours for
14 days. Dashed line represents the solubility of sulfamethoxazole from the published literature
(Dahlan et al., 1987).
This article has not been copyedited and formatted. The final version may differ from this version.JPET Fast Forward. Published on November 9, 2018 as DOI: 10.1124/jpet.118.251413
at ASPE
T Journals on A
ugust 13, 2019jpet.aspetjournals.org
Dow
nloaded from

JPET#251413
35
Tables
Table 1 Details of clinical studies used for verification and refinement of the PBPK
models for selected compounds
Compound Reference Optimisation/ Verification
Dose Information Subjects Information
Caffeine (Lelo et al., 1986) Refinement 270 mg Oral SD 6 male, 19-21 years
(Newton et al., 1981) Verification 50 mg Oral SD 5 male, 21-36 years
(Newton et al., 1981) Verification 300 mg Oral SD 5 male, 1 female, 21-36 years
(Newton et al., 1981) Verification 500 mg Oral SD 5 male, 1 female, 21-36 years
(Newton et al., 1981) Verification 750 mg Oral SD 5 male, 1 female, 21-36 years
Chloramphenicol (Burke et al., 1982) Refinement CAPS 502-1324 mg IV infusion
for average of 18 min SD 3 male, 5 female, 19-64 years
(Mikami et al., 1975) Verification 1000 mg IV SD, bolus (1min) 15 male, 40-53 years
(Nahata and Powell,
1981) Verification CAPS 100 mg/kg/day IV infusion
over 0.5 h 1 male, 20 years
Creatinine (Mayersohn et al.,
1983) Verification Baseline 6 male, 26-38 years
(Mayersohn et al.,
1983) Verification Cooked meat (340 mg Oral) 6 male, 26-38 years
Dextroamphetamine (Watanalumlerd et al., 2007)
Refinement 20 or 30 mg Oral Not reported
(Beckett et al., 1969) Refinement 8.7 mg Oral SD 2 male, 21 and 23 years
(Dolder et al., 2017) Verification 29.6 mg Oral SD 12 male, 12 female, 21-34
years
(Wan et al., 1978) Verification 10 mg Oral SD 4 male, 1 female, 22-26 years
Nicotine (Molander et al., 2001)
Refinement 0.028 mg/kg IV infusion for 10 min SD
10 male, 10 female, 22-43 years
(Benowitz and Jacob,
1993) Refinement
0.015 mg/kg IV infusion for 30 min SD
9 male, 2 female, 22-58 years
(Zevin et al., 1997) Verification 0.015 mg/kg IV infusion for 30
min SD 6 male, 6 female, 18-47 years
Sulfamethoxazole (Mannisto et al.,
1982) Refinement 1000 mg IV infusion for 60 min
SD 4 male, 2 female, 22-31 years
(Welling et al., 1973) Refinement 800 mg Oral SD 6 subjects
(Welling et al., 1973) Refinement 800 mg Oral SD 5 subjects
(Hutabarat et al.,
1991) Verification
10 mg/kg IV infusion for 60 min SD
7 male, 1 female, 22-27 years
(Kaplan et al., 1973) Verification 2000 mg Oral SD 24 male
(Kaplan et al., 1973) Verification 2000 mg Oral SD 8 male
Theophylline (Lelo et al., 1986) Refinement 250 mg Oral SD 6 male, 19-21 years
(Rovei et al., 1982) Verification 125 mg Oral SD 4 male, 4 female, 22-35 years
(Rovei et al., 1982) Verification 250 mg Oral SD 4 male, 4 female, 22-35 years
(Rovei et al., 1982) Verification 375 mg Oral SD 4 male, 4 female, 22-35 years
(Rovei et al., 1982) Verification 500 mg Oral SD 4 male, 4 female, 22-35 years
Acyclovir (Blum et al., 1982) Refinement 0.5-15 mg/kg, 1 or 6 h infusion Not reported
(Soul-Lawton et al.,
1995) Refinement 350 mg, 1h infusion 4 male, 8 female, 23-50 years
(Brigden et al., 1981) Verification 50 mg IV bolus SD 6 male, 26-38 years
(Brigden et al., 1981) Verification 50 mg IV 1 h infusion 2 male, 26-38 years
(Brigden et al., 1981) Verification 50 mg IV 10min infusion 2 male, 26-38 years
This article has not been copyedited and formatted. The final version may differ from this version.JPET Fast Forward. Published on November 9, 2018 as DOI: 10.1124/jpet.118.251413
at ASPE
T Journals on A
ugust 13, 2019jpet.aspetjournals.org
Dow
nloaded from

JPET#251413
36
(de Miranda et al.,
1981) Verification 0.5-2.5 mg/kg, IV infusion over
1h 1 male, 4 female, 25-68 years
(Laskin et al., 1982a) Verification 5 mg/kg IV infusion over 1h 1 male, 2 female, 24-67 years
(Laskin et al., 1982b) Verification 2.5 mg/kg, IV infusion over 1h 5 male, 8 female, 23-76 years
(Laskin et al., 1982b) Verification 5.0 mg/kg, IV infusion over 1h 5 male, 8 female, 23-76 years
(Laskin et al., 1982b) Verification 10 mg/kg, IV infusion over 1h 5 male, 8 female, 23-76 years
(Laskin et al., 1982b) Verification 15 mg/kg, IV infusion over 1h 5 male, 8 female, 23-76 years
CAPS, chloramphenicol succinate; IV, intravenouse; SD, single dose.
This article has not been copyedited and formatted. The final version may differ from this version.JPET Fast Forward. Published on November 9, 2018 as DOI: 10.1124/jpet.118.251413
at ASPE
T Journals on A
ugust 13, 2019jpet.aspetjournals.org
Dow
nloaded from

JPET#251413
37
Table 2 Tubular surface area used to calculate CLPD in MechKiM.
Tubular surface area
(cm2/ million tubule cells)
PT-1 2.98
PT-2 2.98
PT-3 2.98
LoH 0.0796
DT 0.101
CCD 0.0184
MCD 0.00374
PT, Proximal tubule; LoH, Loop of Henle; DT, Distal tubule; CCD, Cortical collecting duct; MCD, medullary collecting duct. Values recalculated from those reported for the 5-compartment model (Scotcher et al., 2016b)
This article has not been copyedited and formatted. The final version may differ from this version.JPET Fast Forward. Published on November 9, 2018 as DOI: 10.1124/jpet.118.251413
at ASPE
T Journals on A
ugust 13, 2019jpet.aspetjournals.org
Dow
nloaded from

JPET#251413
38
Table 3 Prediction accuracy of CLR of 7 drugs predicted using mechanistic kidney model
(MechKiM) and mechanistic renal tubular reabsorption model (static model). For simulation
using MechKim, urine/tubular pH at average condition was used as 7.4 (Simcyp default value) and 6.2
(Rose et al., 2015). Details of predictions are listed Supplementary Material, Table S-14.
AFE AAFE RMSE % of 2-fold % of 3-fold
MechKiM
(pH 7.4) 3.39 3.62 29.1 26.3 57.9
MechKiM
(pH 6.2) 2.69 2.87 37.9 52.6 68.4
Static modela 1.42 1.97 18.4 68.4 73.7
a(Scotcher et al., 2016b) AFE, average fold error; AAFE, absolute average fold error; RMSE, root mean square error.
This article has not been copyedited and formatted. The final version may differ from this version.JPET Fast Forward. Published on November 9, 2018 as DOI: 10.1124/jpet.118.251413
at ASPE
T Journals on A
ugust 13, 2019jpet.aspetjournals.org
Dow
nloaded from
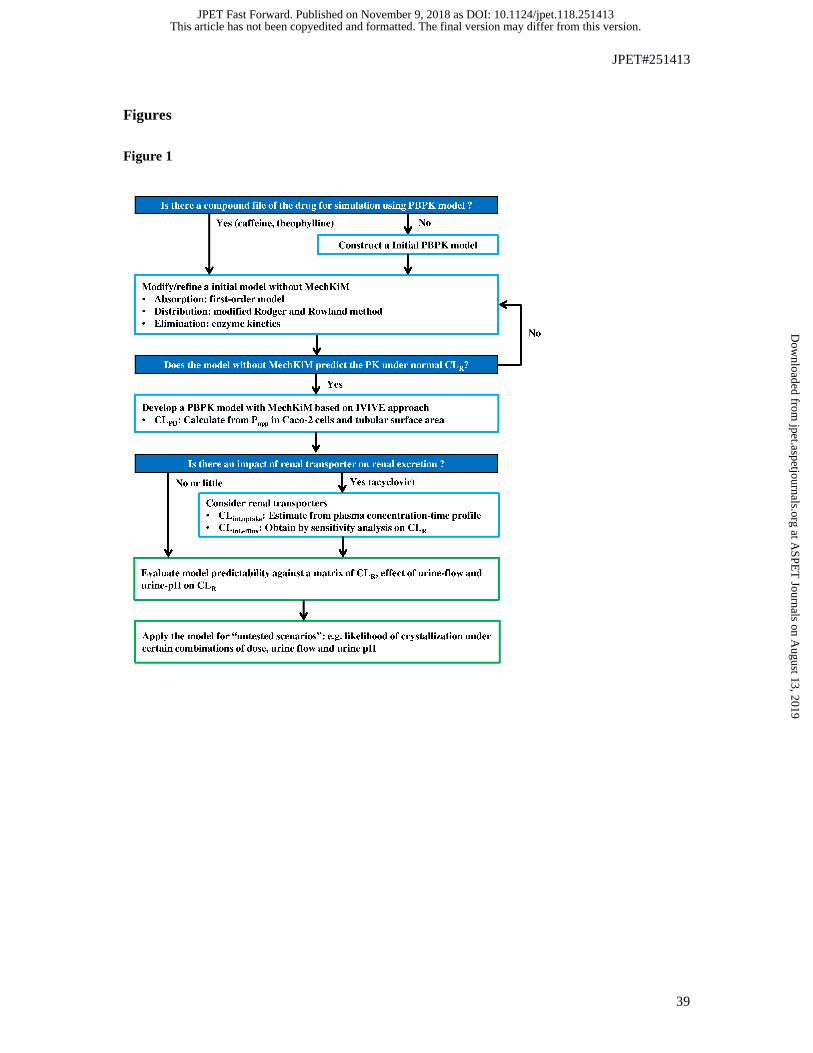
JPET#251413
39
Figures
Figure 1
This article has not been copyedited and formatted. The final version may differ from this version.JPET Fast Forward. Published on November 9, 2018 as DOI: 10.1124/jpet.118.251413
at ASPE
T Journals on A
ugust 13, 2019jpet.aspetjournals.org
Dow
nloaded from

JPET#251413
40
Figure 2
This article has not been copyedited and formatted. The final version may differ from this version.JPET Fast Forward. Published on November 9, 2018 as DOI: 10.1124/jpet.118.251413
at ASPE
T Journals on A
ugust 13, 2019jpet.aspetjournals.org
Dow
nloaded from

JPET#251413
41
Figure 3
This article has not been copyedited and formatted. The final version may differ from this version.JPET Fast Forward. Published on November 9, 2018 as DOI: 10.1124/jpet.118.251413
at ASPE
T Journals on A
ugust 13, 2019jpet.aspetjournals.org
Dow
nloaded from

JPET#251413
42
Figure 4
This article has not been copyedited and formatted. The final version may differ from this version.JPET Fast Forward. Published on November 9, 2018 as DOI: 10.1124/jpet.118.251413
at ASPE
T Journals on A
ugust 13, 2019jpet.aspetjournals.org
Dow
nloaded from

JPET#251413
43
Figure 5
This article has not been copyedited and formatted. The final version may differ from this version.JPET Fast Forward. Published on November 9, 2018 as DOI: 10.1124/jpet.118.251413
at ASPE
T Journals on A
ugust 13, 2019jpet.aspetjournals.org
Dow
nloaded from

JPET#251413
44
Figure 6
This article has not been copyedited and formatted. The final version may differ from this version.JPET Fast Forward. Published on November 9, 2018 as DOI: 10.1124/jpet.118.251413
at ASPE
T Journals on A
ugust 13, 2019jpet.aspetjournals.org
Dow
nloaded from