Towards excellence in adult social care: progress with adult social ...
68
Title │ Case studies Towards excellence in adult social care Progress with adult social care priorities England 2013/14 Sector-led improvement
Transcript of Towards excellence in adult social care: progress with adult social ...

Title │ Case studies
Towards excellence in adult social careProgress with adult social care priorities England 2013/14
Sector-led improvement
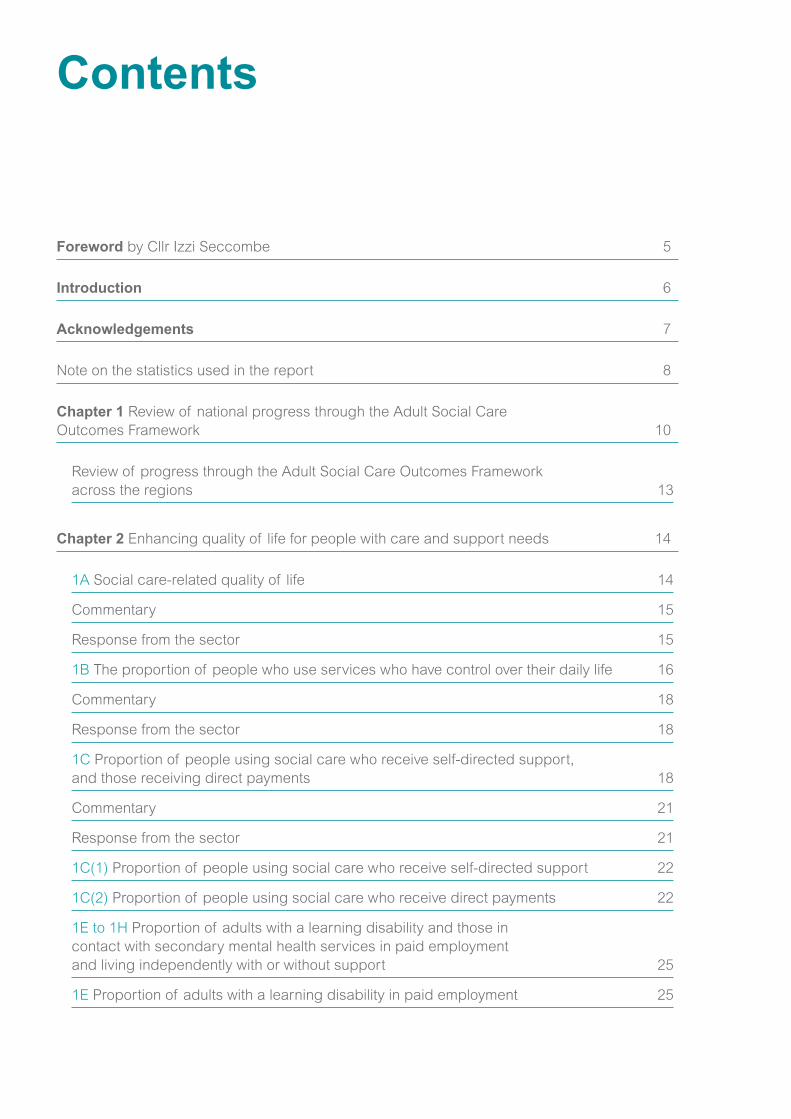
Contents
Foreword by Cllr Izzi Seccombe 5
Introduction 6
Acknowledgements 7
Note on the statistics used in the report 8
Chapter 1 Review of national progress through the Adult Social Care Outcomes Framework 10
Review of progress through the Adult Social Care Outcomes Framework across the regions 13
Chapter 2 Enhancing quality of life for people with care and support needs 14
1A Social care-related quality of life 14
Commentary 15
Response from the sector 15
1B The proportion of people who use services who have control over their daily life 16
Commentary 18
Response from the sector 18
1C Proportion of people using social care who receive self-directed support, and those receiving direct payments 18
Commentary 21
Response from the sector 21
1C(1) Proportion of people using social care who receive self-directed support 22
1C(2) Proportion of people using social care who receive direct payments 22
1E to 1H Proportion of adults with a learning disability and those in contact with secondary mental health services in paid employment and living independently with or without support 25
1E Proportion of adults with a learning disability in paid employment 25

3 Towards excellence in adult social care progress with adult social care priorities
Commentary 26
Response from the sector 26
1F Proportion of adults in contact with secondary mental health services in paid employment 27
Commentary 29
Response from the sector 29
1G Proportion of adults with a learning disability who live in their own home or with their family 29
Commentary 31
Response from the sector 31
1H Proportion of adults in contact with secondary mental health services who live independently, with or without support 31
Commentary 33
Response from the sector 33
1I Proportion of people who use services who reported that they had as much social contact as they would like 33
Commentary 35
Response from the sector 35
Chapter 3 Delaying and reducing the need for care and support 36
2A Permanent admissions to residential and nursing care homes, per 100,000 population 36
2A(1) Permanent admissions of younger adults aged 18 to 64 to residential and nursing care homes, per 100,000 population 37
2A(2) Permanent admissions of older people (aged 65 and over) to residential and nursing care homes, per 100,000 population 39
Commentary 41
Response from the sector 41
2B Proportion of older people (65 and over) who were still at home 91 days after discharge from hospital into reablement/rehabilitation services 42
2B(1) Proportion of older people (65 and over) who were still at home 91 days after discharge from hospital into reablement/rehabilitation services 42
2B(2) Proportion of older people (65 and over) who were still at home 91 days after discharge from hospital into reablement/rehabilitation services (offered the service) 45
Commentary 47

4 Towards excellence in adult social care progress with adult social care priorities
Response from the sector 47
2C Delayed transfers of care from hospital and those which are attributable to adult social care 48
2C(1) Delayed transfers of care from hospital per 100,000 population 49
2C(2) Delayed transfers of care from hospital which are attributable to adult social care per 100,000 population 51
Commentary 52
Response from the sector 52
Chapter 4 Ensuring that people have a positive experience of care and support 53
3A Overall satisfaction of people who use services with their care and support 53
Commentary 55
Response from the sector 55
3D(1) The proportion of people who use services who find it easy to find information about services 55
Commentary 56
Chapter 5 Safeguarding adults whose circumstances make them vulnerable and protecting them from avoidable harm 58
4A The proportion of people who use services who feel safe 58
4B The proportion of people who use services who say that those services have made them feel safe and secure 60
Commentary 62
Response from the sector 63
Glossary 65

5 Towards excellence in adult social care progress with adult social care priorities
Foreword
This report demonstrates how the adult social care sector has continued to improve and deliver services in these very challenging economic times.
The model of sector-led improvement in adult social care is now well established. Councils have published local accounts, many peer reviews have been undertaken and are planned, risk management processes and use of resources are now in place in many councils and regions. A wide range of other improvement activities have also taken place, or are planned. All these activities contribute to improving adult social care.
The data in this report shows that, in general, sector-led improvement is working well across social care but it also highlights some specific areas where councils need to improve outcomes, such as employment and accommodation for people who have a learning disability or mental health need. We must continue to ensure that in those areas we are supporting councils to help them tackle their individual challenges.
In particular, I am pleased the Community Wellbeing Board of the LGA has made mental health a priority as a result of this report, and has begun a programme of work to support councils in ensuring there is adequate and appropriate access to employment and accommodation for people with mental health needs. We know that housing departments and housing providers are already working closely to create such capacity, but there is more we can do to support them.
We also know that local employers are doing all they can to make jobs available where possible, but that it is increasingly difficult in the public sector with the financial constraints we face. We are also keen to ensure the stigma related to having a mental health need, is reduced supporting local communities to break down the barriers between people in the workplace, and to support people to live independently in their community.
The information outlined in this report reflects the continued hard work, dedication and commitment of the sector. However, I remain concerned that continual improvement in adult social care will not be possible on further reduced resources. Nevertheless this report shows that sector led improvement is a successful approach that continues to deliver improved performance and good accountability and effectively responds to local needs.
Councillor Izzi Seccombe Chair of the LGA Community Wellbeing Board

6 Towards excellence in adult social care progress with adult social care priorities
This report helps to inform and support improvement in adult social care. It also provides an overview of the progress of councils in England towards ensuring better care and support.
Maintaining and improving the level of performance or perception (ie in terms of quality of life) of social care has taken place in the context of the 26 per cent savings that have been required over the last four years. The report attributes some of this as a result of the transformation of adult social care in terms of the increased personalisation of services.
The recent publication of the LGA Adult Social Care efficiency report (July 2014)1 provides further evidence of the range of innovation in social care and the continued focus on improving performance. There are, however, no grounds for complacency for either central or local government. The report highlights that there are still considerable regional and local variations in some key areas of delivery. There may be particular circumstances which explain this, but it does provide a challenge for the sector to work together to help ensure consistency across regions, and a reduction in the level of variation from the best.
The critique of social care in terms of the raising of eligibility to care thresholds; the reduction in the numbers of people who receive help; commissioning practice of local authorities or what the Care Quality Commission have described as ‘unacceptable variation in quality’ are not measured in detail by the Adult Social Care Outcomes Framework (ASCOF) indicators.
There are more funding reductions planned and more pressure on social care services as a result of NHS pressures. As the recent National Audit Office report on adult social care indicated we are not aware of the capacity of local authorities to ‘absorb pressures’ whilst maintaining performance. It would be a mistake to assume that past experience is an indicator of future success as needs rise and resources continue to reduce.
However it is important to give credit and celebrate the many positive messages from this report. In relation to the areas evaluated in this report, the achievements are considerable and in context it is perhaps not too strong to say they are remarkable, a tribute to the determination and ingenuity of local authorities and the many thousands of providers who have helped to make this happen.
David Pearson President of the Association of Directors of Adult Social Services (ADASS) and Chair of the Towards Excellence in Adult Social Care (TEASC) Board
1 http://www.local.gov.uk/documents/10180/11779/LGA+Adult+Social+Care+Efficiency+Programme+-+the+final+report/8e042c7f-7de4-4e42-8824-f7dc88ade15d
Introduction

7 Towards excellence in adult social care progress with adult social care priorities
The work forms part of a series of planned information improvements commissioned by Towards Excellence in Adult Social Care (TEASC), to help councils improve the outcomes and performance of services. The sector-led initiative builds on the self-assessment and improvement work being carried out by councils in the regions.
The partnership comprises the following organisations:
Association of Directors of Adult Social Services
Department of Health
Social Care Institute for Excellence
Care Quality Commission
Health and Social Care Information Centre
Think Local Act Personal
SOLACE, and
Local Government Association
Thanks to all members of the TEASC Information to Support Improvement Reference Group, stategy and performance regional leads, members and employees of ADASS, Local Government Association (LGA) and Think Local Act Personal (TLAP) and HSCIC employees.
Thanks also to the following organisations for their help in supplying data:
Association of Directors of Adult Social Services Budget Survey 2014. Copyright © 2014. Re-used with the permission of The Association of Directors of Adult Social Services. All rights reserved.
The Health and Social Care Information Centre RAP, ASC-CAR, ASC and Carer Surveys, ASCOF Indicators 2013-14. Copyright © 2014. Re-used with the permission of the Health and Social Care Information Centre. All rights reserved.
Any enquiries about this report should be sent to: Kevin Halden Senior Advisor, Grant Funded Health Programmes Local Government Association [email protected]
Acknowledgements

8 Towards excellence in adult social care progress with adult social care priorities
Note on the statistics used in the reportThis report draws on data from Measures from the Adult Social Care Outcomes Framework (ASCOF), England – 2013-14, Final release2, published by the Health and Social Care Information Centre (HSCIC). Published annually since 2010-11, it draws on data from a number of collections. The ASCOF Handbook of Definitions3, published by the Department of Health, provides in-depth information on the purpose of the framework, construction of the constituent measures, and context for their interpretation. Charts and tables presented in this report were developed using the LGA’s LG Inform4 benchmarking data service.
Some ASCOF measures (1A, 1B, 1I, 3A, 3D, 4A and 4B) are drawn from surveys of users and carers – the Personal Social Services Adult Social Care Survey, and the Personal Social Services Survey of Adult Carers. As both surveys use sampling, differences in outcomes for the measures based on these data may not be significantly significant. Changes in survey outcomes are considered statistically significant when there are no overlapping confidence intervals between years. Data displayed in tables and charts in this report does not include confidence intervals, but they are taken into account in the commentary on improvement for England and the regions.
At a national and regional level results are based on larger samples and consequently confidence intervals are quite small. More care should be taken when reviewing change over time for individual authorities. In addition, in 2011/12 there were some changes in the way that the survey was carried out. Care should be taken when comparing 2010/11 data with later years. Further information is available in the HSCIC report2.
2 http://www.hscic.gov.uk/article/2021/Website-Search?productid=16655&q=ascof+2013+14&sort=Relevance&size=10&page=1&area=both#top
3 https://www.gov.uk/government/uploads/system/uploads/attachment_data/file/261281/Handbook_of_definitions_v8_0__2_.pdf
4 http://lginform.local.gov.uk/
For some measures the report highlights where councils whose results appear significantly different when compared to all other councils have been identified. In this context, ‘significantly different’ results are those which are more than two standard deviations from the mean. For survey based measures, this calculation does not take into account the confidence levels for individual authorities.
In Chapter 5, data from the Safeguarding Adults Return (SAR), Annual Report, England 2013-14, Experimental Statistics5, also published by the HSCIC is referred to. This is a mandatory collection covering the period from 1 April 2013 to 31 March 2014. It records information about individuals for who safeguarding referrals were opened during the reporting period (also referred to as adults at risk) and case details (also referred to as allegations) for safeguarding referrals which concluded during the reporting period. The purpose of the collection is to provide information which can help stakeholders to understand where abuse may occur and improve services for individuals affected by abuse.
The SAR is one of the outcomes of the zero based review of adult social care data collections and has replaced the Abuse of Vulnerable Adults (AVA) return. This is the first year of collection, and whilst it covers the same subject area as the AVA return, it is much smaller in size and there are no directly comparable data items. Time series analysis across the two returns is not possible.
5 http://www.hscic.gov.uk/article/2021/Website-Search?productid=16190&q=safeguarding+adults+return&sort=Relevance&size=10&page=1&area=both#top

9 Towards excellence in adult social care progress with adult social care priorities
OverviewThis is Towards Excellence in Adult Social Care’s (TEASC) third annual assessment of progress with priorities in adult social care, and the last using this set of ASCOF data. Following the zero based review the new dataset being collected in 2014/15 will set a new baseline for all authorities to work from.
It is therefore important that we identify where the sector has made progress over the last few years, and where the challenges still remain so that they are not lost in the new arrangements.
Overall, the progress made by councils in delivering services for people has been impressive, given the economic environment in which they have been asked to deliver. There is a consistent picture of improvement nationally against the ASCOF indicators despite the sector having made £3.53bn of savings over the period.
ADASS and the LGA work together with other partners through the TEASC sector-led improvement programme to assist councils in maintaining and improving this performance.
Regional ADASS Chairs and the LGA have developed peer challenge and delivered a range of support arrangements which have helped to deliver this improvement locally.
This report shows a continual improvement in people’s experience in receiving care and support services, particularly in the way they are delivered through a personal budget, giving them choice and control over their lives. The Care Act embeds the personalisation approach in a legislative framework ensuring that this way of working continues to empower people to live independently in their community.
There also continues to be improvement in the way the sector supports people who have been in hospital, with performance on social care delayed transfers improving nationally and in supporting people at home after a hospital stay. Improvement in this area is notable given a combination of
winter pressures and reduction of budgets. The Better Care Fund and the plans which support it will now be the vehicle for assessing what works to facilitate timely and effective discharge from hospital from 2015 through a local integrated approach to whole system performance.
It has remained a challenge for people with a learning disability and people with a mental health need to be able to get employment and in some places appropriate accommodation. This may also be a result of the economic environment but adult social care needs the support of housing authorities, local communities and local employers to create sustainable opportunities, particularly given some of the stigma which remains. The TEASC programme has picked up this very challenging but important issue and is starting work with councils to help them to ensure there are adequate and appropriate opportunities for people with mental health needs to access employment and accommodation.

10 Towards excellence in adult social care progress with adult social care priorities
When looking at national performance across all measures from the Adult Social Care Outcomes Framework in 2013/14. We can report that
• Social care related quality of life is improving.
• The proportion of people who say they have control over their daily life increased between 2011/12 and 2013/14.
• The proportion of people using social care who receive self-directed support and those who receive direct payments is increasing. However the overall number of people receiving care is reducing year on year. Significant changes to the Short and Long Term (SALT) return for 2014/15 will make comparison with current measures difficult.
• Levels of employment for adults with learning disabilities and those in contact with secondary mental health services in paid employment is worsening, however
• The proportion of adults with learning disabilities who live in their own home or with their family and those in contact with secondary mental health services who live independently is improving.
• 44.5 per cent of people who used services reported that they had as much social contact as they would like. This was reported as part of ASCOF for the first time in 2013/14. Earlier data, collected through question 8A of the Adult Social Care Survey indicates an improvement over the last 12 months and between 2013/14 and 2011/12.
1 Review of national progress through the Adult Social Care Outcomes Framework
Social care-related quality of life (score out of a possible 24) for England
2010/11
0 2 4 6 8 10 12 14 16 18 20
2011/12
2012/13
2013/14
Social care-related quality of life – England
Count

11 Towards excellence in adult social care progress with adult social care priorities
Paid employment for adults with learning disabilites and those in contact with secondary mental health services
Enhancing quality of life – user experience of care
0 10 20 30 40 50 60 70 80
Proportion who use services who reported that
they had as much social contact as they would like
(England)
Proportion of people who use services sho have
control over their daily life (England)
Per cent
2010/11 2011/12 2012/13 2013/14 (raw values)
0 1 2 3 4 5 6 7 8 9 10
Proportion of adults
with learning disabilities
in paid employment
(England)
Proportion of adults in contact
with secondary mental health
services in paid employment
(England)
Per cent
2010/11 2011/12 2012/13 2013/14 (raw values)

12 Towards excellence in adult social care progress with adult social care priorities
• The rate of permanent admissions to residential and nursing care homes for both younger adults (aged 18 to 64) and older people aged 65 and over has decreased over the last year, and when compared to the rates in 2010/11.
• The proportion of over 65s who were offered a reablement or rehabilitation service, and the proportion of those who were still at home 91 days after discharge from hospital is improving.
• The rate of delayed transfers of care from hospital per 100,000 population whilst slightly lower than in 2011/12 has increased slightly on last year. However the rate of delayed transfers which are attributable to adult social care has continued to decrease from 4.1 per 100,000 population in 2010/11 to 3.1 per 100,000 population in 2013/14.
• Overall satisfaction of people who use services with their care and support whilst showing no change over the last year has improved over the last two years.
• The proportion of people who use services who find it easy to find information about services has remained steady over the last few years. Whilst there has been a slight increase in the outcome measure over the last two years, as this evidence is based on a survey the improvement is not significant when taking account of the confidence intervals.
• The proportion of people who use services who feel safe and those who say that those services have made them feel safe and secure are both showing improvement year on year.
Delayed transfers of care from hospital per 100,000 population – total and those attributable to social care
0 2 4 6 8 1210
Delayed transfers of care from hospital per 100,000
population (England)
Delayed transfers of care from hospital per 100,000
population (England)
Per cent
2010/11 2011/12 2012/13 2013/14 (raw values)

13 Towards excellence in adult social care progress with adult social care priorities
Review of progress through the Adult Social Care Outcomes Framework across the regionsThe following four chapters provide a regional comparison of measures across all domains of the ASCOF framework. They include a commentary on progress made with local examples of ‘what works’ in enhancing services and experiences for service users and their carers.
A positive experience of care and feeling safe and secure
0 10 20 30 40 50 807060
Per cent
2010/11 2011/12 2012/13 2013/14 (raw values)
Proportion of people who use services who find it easy to find information
about sevices (England)
Overall satisfaction of people who use services
with their care and support (England)
Proportion of people who use services who feel
safe (England)
Proportion of people who use services who say
that those services have made them feel safe and
secure (England)

14 Towards excellence in adult social care progress with adult social care priorities
The first domain of the ASCOF focuses on enhancing quality of life for people with care and support needs.
1A Social care-related quality of lifeThis measure, reported as a score out of 24, gives an overarching view of the quality of life of users of social care. It is based on the outcome domains of social care-related quality of life identified in the Adult Social Care Outcomes Toolkit (ASCOT) developed by the Personal Social Services Research Unit. It is derived from an average quality of life score based on responses to the Adult Social Care Survey; a composite measure using responses to survey questions covering the eight domains identified in the ASCOT. These include control, dignity, personal care, food and nutrition, safety, occupation, social participation and accommodation. The social care-related quality of life measure tells us about outcomes for social care users, but does not isolate the impact that care and support services have on those outcomes.
Taking into account confidence intervals, there has been a significant improvement year on year for England from 2011/12 to 2013/14. At a regional level, South West, East of England, London, and the South East show a significant improvement in their average quality of life score since 2011/12. Whilst London has shown improvement it continues to report a lower average score than all other regions.
A review of scores across all councils identified three whose scores were significantly lower6 than the average for England. All three are in London. The London Social Care Partnership (LSCP) will address the issue in its 2015/16 work plan.
6 Significantly different results have been identified as those which are more than two standard deviations from the mean. It is designed to highlight councils where further understanding of performance may be needed. For survey based measures this calculation does not take into account the confidence level for individual authorities.
2 Enhancing quality of life for people with care and support needs

15 Towards excellence in adult social care progress with adult social care priorities
Commentary The lower rates in London are worthy of further consideration in terms of the cultural, demographic and economic reasons which may lie behind them. There are similar patterns in other large urban areas and some cross regional analysis will be helpful. Although the new data collection in 2014/15 may tell a different story so it will be important to review after those collections are made.
Response from the sectorContinuous improvement in this indicator demonstrates the success of the personalisation approach which has now been embedded in legislation in the Care Act. Even in the context of extreme financial constraint, the core elements of a personalised approach continue to deliver improved quality of life.
Case exampleThurrock Borough Council peer review on Community Engagement and Co-productionThurrock Borough Council received an LGA led peer review on ‘Community Engagement and Co-production’ late last year. Thurrock involved their Coalition of Disabled People in the peer review panel and as part of the process undertook a pre-assessment of ‘what people thought about the services provided’. The Sector Led Improvement Manager was also invited to be on the panel. The peer review was well received, and an action plan has been drawn up and the report has gone through their scrutiny process. The peer review report can be found on the following link http://www.sli.adasseast.org.uk/?p=290
AreaSocial care-related quality of life
2010/11 raw value
2011/12 raw value
2012/13 raw value
2013/14 raw value
2013/14 direction
2013/14 difference
East of England 18.6 18.8 18.9 19.1 Improving 0.2
East Midlands 18.6 18.8 18.7 18.9 Improving 0.2
London 18.0 18.1 18.3 18.5 Improving 0.2
North East 18.9 19.2 19.1 19.3 Improving 0.2
North West 18.9 18.9 18.9 19.0 Improving 0.1
South East 18.7 18.7 19.0 19.1 Improving 0.1
South West 18.9 18.9 19.0 19.2 Improving 0.2
West Midlands 18.6 18.8 18.9 18.9 No change 0.0
Yorkshire and Humberside 18.9 18.7 19.0 18.9 Worsening -0.1
England 18.7 18.7 18.8 19.0 Improving 0.2

16 Towards excellence in adult social care progress with adult social care priorities
1B The proportion of people who use services who have control over their daily life A key objective of the drive to make care and support more personalised is that support more closely matches the needs and wishes of the individual, putting users of services in control of their care and support. Therefore, asking users of care and support about the extent to which they feel in control of their daily lives is one means of measuring whether this outcome is being achieved. This measures one component of the overarching measure, (1A) social care-related quality of life. A preference study found that members of the public gave this domain the highest weight of the eight included, ie of all the domains included in the overarching measure, this is the one that is considered by the public to be most important.
The relevant question drawn from the Adult Social Care Survey is Question 3a ‘Which of the following statements best describes how much control you have over your daily life?’. The measure is defined by determining the percentage of all those responding who identify no needs in this area or no needs with help; ie by choosing the answer ‘I have as much control over my daily life as I want’ or ‘I have adequate control over my daily life’. These have been chosen to focus the measure on those individuals achieving the best outcomes, to allow for better use in benchmarking.
The measure gives an overall indication of the reported outcome for individuals; it does not at present, identify the specific contribution of councils’ adult social care towards the outcome.
Service users in the South East report the highest average score, at 79.1 per cent, on their experience of control over their daily life. Taking into account confidence intervals, three out of the nine regions, South East, East of England and London, and England as a whole, are showing significant improvement on this measure when compared to 2011/12.
As with the overall measure on quality of life, London whilst improving reports the lowest average score for service users who say they have control over their daily life than other regions. Five authorities were identified as having significantly lower than average scores6, and again all are London authorities. The London region will address this in its LSCP 2015/16 work plan.
Social care-related quality of life for England and all English regions
0369
1215182124
East
of E
nglan
dEa
st M
idlan
ds
Lond
on
North
Eas
t
North
Wes
t
Sout
h Ea
st
Sout
h W
est
Wes
t Midl
ands
York
shire
and
Hum
bers
ide
Engl
and
Social care-related quality of life 2010/11
Social care-related quality of life 2011/12
Social care-related quality of life 2012/13
Social care-related quality of life 2013/14
(raw values)
Score out of a possible 24

17 Towards excellence in adult social care progress with adult social care priorities
Area
Proportion of people who use services who have control over their daily life
2010/11 raw value
2011/12 raw value
2012/13 raw value
2013/14 raw value
2013/14 direction
2013/14 difference
East of England 73.6 75.5 77.3 78.4 Improving 1.1
East Midlands 74.6 74.8 75.6 75.9 Improving 0.3
London 71.1 69.9 70.9 72.4 Improving 1.5
North East 76.4 77.4 76.1 78.6 Improving 2.5
North West 75.8 76.1 77.0 76.8 Worsening -0.2
South East 77.0 76.7 78.0 79.1 Improving 1.1
South West 77.4 77.3 78.6 78.6 No change 0.0
West Midlands 73.9 74.5 75.2 74.6 Worsening -0.6
Yorkshire and Humberside 77.0 75.9 77.1 78.0 Improving 0.9
England 75.0 75.1 76.1 76.8 Improving 0.7
Proportion of people who use services who have control over their daily life for England and all English regions
0
20
40
60
80
100
East
of E
nglan
dEa
st M
idlan
ds
Lond
on
North
Eas
t
North
Wes
t
Sout
h Ea
st
Sout
h W
est
Wes
t Midl
ands
York
shire
and
Hum
bers
ide
Engl
and
Proportion of people who use services who have control over their daily life 2010/11
Proportion of people who use services who have control over their daily life 2011/12
Proportion of people who use services who have control over their daily life 2012/13
Proportion of people who use services who have control over their daily life 2013/14
(raw values)
Per
cen
t

18 Towards excellence in adult social care progress with adult social care priorities
Commentary The improvement nationally is encouraging but it does lead to consideration as to whether this improvement would have been greater had councils not been subjected to the funding constraints of the last two years as councils tighten eligibility criteria and resource allocation systems (State of the Nation 2014 LGA).
Response from the sectorTools have been developed to support local authorities and their partners to make best use of their resources. The ‘Use of Resources in Adult Social Care A guide for Local Authorities’7 identifies ways councils can save money and make efficiencies whilst maintaining and improving services. There are a number of impressive examples in this report of ways in which councils have transformed and improved services whilst making best use of their local resources. This work will now be built into the LGA peer challenge programme.
TEASC recently published a use of resources self assessment tool8 which enables councils to look at a range of key areas of delivery and identify best use of resources. Councils are now starting to use the tool to identify how they can make efficiencies whilst maintaining service delivery.
1C Proportion of people using social care who receive self-directed support, and those receiving direct paymentsResearch has indicated that personal budgets have a positive effect in terms of impact on wellbeing, increased choice and control, cost implications and improving outcomes. Studies have shown that direct payments make people more satisfied with the services they receive and are the purest form of personalisation.
As there are recognised limitations in the current measure meaning that 100 per cent provision of personal budgets is not possible nationally, the April 2013 objective was set at 70 per cent of people receiving a personal budget nationally. The April 2013 objective, along with the proposals in the Care and Support White Paper and draft Bill to place personal budgets into legislation as part of the care and support plan, will ensure that personalised care becomes standard practice. This measure reflects the success of councils in delivering personalised services, through self-directed support, including direct payments and also promotion of advocacy services.
To address the recognised limitations to the current measure, changes will be made from 2014/15 onwards. For example its scope includes some services and users of care and support for whom self-directed support may not be appropriate, and so it currently does not reflect the true extent of the provision of self-directed support and direct payments to those who are eligible.
To address these issues, implementation of the proposals of the zero based review will result in a strengthened measure 1C, by limiting its scope to people who only receive long term
7 http://www.local.gov.uk/adult-social-care/-/journal_content/56/10180/5516287/ARTICLE8 A Problem Shared: Making best use of resources,
http://www.thinklocalactpersonal.org.uk/Browse/useofresources/

19 Towards excellence in adult social care progress with adult social care priorities
support, for whom self-directed support is most relevant, to better reflect councils’ progress in delivering personalised services. The existing measure will also be replaced by two measures: one which focuses on users; and another measure will be introduced which focuses on carers. Each will have a sub-measure for users and for carers in receipt of direct payments, showing progress made on personalisation for users and carers separately. The final change is for this measure to be based on ‘snapshot’ rather than full-year data, to better reflect the progress made on personalisation at the end of the year.
This is a two-part measure which reflects both the proportion of people using services who receive self-directed support (1C part 1) and 1C(2) which is restricted to those who receive self-directed support in the form of a direct payment (through a personal budget or other means).
1C part 1 is presented as the number of adults, older people and carers receiving self-directed support in the year to 31st March as a percentage of all clients receiving community based services and carers receiving carer specific services. To be counted as receiving self-directed support, the person (adult, older person or carer) must either:
• be in receipt of a direct payment; or
• have in place a personal budget which meets all the following criteria:
1. The person (or their representative) has been informed about a clear, upfront allocation of funding, enabling them to plan their support arrangements; and
2. There is an agreed support plan making clear what outcomes are to be achieved with the funding; and
3. The person (or their representative) can use the funding in ways and at times of their choosing.
London and the North West have the highest proportion of service users with some form of personal payment mechanism at 67.5 per cent of users. The West Midlands has the lowest at 51.1 per cent. This compares with 61.9 per cent for England as a whole.
The East Midlands has the highest proportion of service users who receive direct payments at 25.3 per cent. The North East has the lowest at 15.0 per cent. This compares with 19.1 per cent for England as a whole.
On average the ratio of self directed support overall to direct payments is just over 3 to 1. However this varies from around 4 to 1 in the North East, to 2.6 to 1 in the East Midlands. All regions are showing an increase in the proportion of service users receiving self-directed support and direct payments, over the last year and since 2010/11.

20 Towards excellence in adult social care progress with adult social care priorities
Proportion of people using social care who receive self-directed support and those who receive direct payments for England and all English regions
0
20
40
80
60
East
of E
nglan
dEa
st M
idlan
ds
Lond
on
North
Eas
t
North
Wes
t
Sout
h Ea
st
Sout
h W
est
Wes
t Midl
ands
York
shire
and
Hum
bers
ide
Engl
and
Proportion of people using social care who receive self-directed support 2013/14
Proportion of people using social care who receive direct payments 2013/14
(raw values)
Per
cen
t
Proportion of people using social care who receive self-directed support for England and all English regions
0
100
East
of E
nglan
dEa
st M
idlan
ds
Lond
on
North
Eas
t
North
Wes
t
Sout
h Ea
st
Sout
h W
est
Wes
t Midl
ands
York
shire
and
Hum
bers
ide
Engl
and
(raw values)
Per
cen
t
Proportion of people using social care who receive self-directed support 2010/11
Proportion of people using social care who receive self-directed support 2011/12
Proportion of people using social care who receive self-directed support 2012/13
Proportion of people using social care who receive self-directed support 2013/14
50

21 Towards excellence in adult social care progress with adult social care priorities
Commentary The actual number of people using adult social care in the form of a direct payment and other forms of self-directed support is increasing and will continue to do so as councils implement the Care Act. However it also has to be recognised that the overall numbers of people receiving care and support has decreased. The recently published ADASS survey asked councils about their progress, and the report9 gives a comprehensive account of progress in personalisation and demonstrates a sector committed to improvement and transparency.
The ASCOF data shows the variation between regions on overall numbers and proportion in personalisation, and the ADASS survey shows the variation in the spend across all personal budgets and within different age and care groups, with mental health showing a need for the greatest investment in resource and cultural change. The report details a wide range of initiatives to develop the local social care market, arguably one of the biggest barriers to increased take up of personal budgets.
Response from the sectorADASS is now through TEASC working with regions using a sector-led approach to provide tailored and intensive support to those councils who need to develop increase in the take up of personal budgets.
The work on Integrated Personal Commissioning Budgets (IPC) by NHS England (NHSE), TLAP and ADASS will be a key driver to increase the take up of personal budgets for those people with multiple long term conditions and mental health needs, thereby helping to address the variations mentioned above. The Care Act will also put personalisation at the heart of care. Everyone who has needs that are eligible to be met by the local authority will have a legal right to a personal budget.
9 ADASS and TLAP Personalisation Survey 2014, http://www.adass.org.uk/uploadedFiles/adass_content/policy_networks/personalisation/policy_network_reports/ADASSPersonalisationSurveyReport03102014.pdf
Proportion of people using social care who receive direct payments for England and all English regions
0
50Ea
st of
Eng
land
East
Midl
ands
Lond
on
North
Eas
t
North
Wes
t
Sout
h Ea
st
Sout
h W
est
Wes
t Midl
ands
York
shire
and
Hum
bers
ide
Engl
and
(raw values)
Per
cen
t
Proportion of people using social care who receive direct payments 2010/11
Proportion of people using social care who receive direct payments 2011/12
Proportion of people using social care who receive direct payments 2012/13
Proportion of people using social care who receive direct payments 2013/14
25

22 Towards excellence in adult social care progress with adult social care priorities
1C(1) Proportion of people using social care who receive self-directed supportAll areas have shown an increase in the proportion of service users who receive self directed support. London and the North West have the highest proportion, both at 67.5 per cent.
In most cases, the increase from 2012/13 to 2013/14 is considerably smaller than the increase in the previous year. This is with the exception of the North East and East of England which have shown similar increases in both years, and the South West which showed an increase of 15.9 percentage points in the last year compared with 9.1 percentage points in the previous year.
1C(2) Proportion of people using social care who receive direct paymentsAs with self-directed support, all areas have shown an increase in the proportion of service users who receive direct payments. East Midlands has the highest proportion at 25.3 per cent.
In five out of nine regions the increase from 2012/13 to 2013/14 is smaller than the increase in the previous year. The East of England, East Midlands and London show a greater increase in the last year, and the South West the same in each year.
There is a lot of variation across the country in the extent to which service users receive self directed support or direct payments10.
10 Please note that for measures 1C (1) and (2) some councils have scores in excess of 100%. Where this occurs for data relating to carers this may be a result of the measure being sensitive to the frequency of carer assessments or reviews – figures greater than 100 per cent are possible where the assessment or review takes place less often than once a year. Where this occurs for data relating to service users, this is likely to be due to data quality issues in those councils’ Referrals, Assessments and Packages of Care (RAP) submissions.
Area
Proportion of people using social care who receive self-directed support
2010/11 raw value
2011/12 raw value
2012/13 raw value
2013/14 raw value
2013/14 direction
2013/14 difference
East of England 35.2 47.9 54.4 61.0 Increasing 6.6
East Midlands 28.3 45.4 63.7 65.3 Increasing 1.6
London 29.6 47.1 63.9 67.5 Increasing 3.6
North East 31.1 43.6 52.0 60.6 Increasing 8.6
North West 35.0 47.2 62.3 67.5 Increasing 5.2
South East 24.7 40.3 60.2 65.8 Increasing 5.6
South West 18.3 31.9 41.0 56.9 Increasing 15.9
West Midlands 28.8 36.4 49.4 51.1 Increasing 1.7
Yorkshire and Humberside 32.9 47.0 53.8 55.9 Increasing 2.1
England 29.2 43.0 56.2 61.9 Increasing 5.7

23 Towards excellence in adult social care progress with adult social care priorities
Area
Proportion of people using social care who receive direct payments
2010/11 raw value
2011/12 raw value
2012/13 raw value
2013/14 raw value
2013/14 direction
2013/14 difference
East of England 13.4 15.8 16.7 20.9 Increasing 4.2
East Midlands 13.5 18.0 21.1 25.3 Increasing 4.2
London 12.3 16.8 19.5 22.6 Increasing 3.1
North East 8.5 11.0 13.3 15.0 Increasing 1.7
North West 11.8 13.1 17.5 18.8 Increasing 1.3
South East 11.1 12.1 16.6 17.8 Increasing 1.2
South West 8.2 10.3 13.9 17.5 Increasing 3.6
West Midlands 14.1 14.0 16.7 16.8 Increasing 0.1
Yorkshire and Humberside 11.8 12.7 15.2 16.7 Increasing 1.5
England 11.7 13.7 16.8 19.1 Increasing 2.3
Proportion of people using social care who receive self-directed support for all English single tier and county councils
0
20
40
60
80
Per
cen
t
Proportion of people using social care who receive self-directed support 2013/14 (raw values)
100
120

24 Towards excellence in adult social care progress with adult social care priorities
Case exampleHow the Regional SLI Programme on Personalisation, in collaboration with ‘In Control’ has helped with improvement work in Essex.Essex County Council (ECC) has recently developed a Direct Payments action plan, which drew on knowledge shared through the regional network. This review took a whole-system approach incorporating joint work with ‘In Control’, using feedback from the POET11 survey and considering the requirements of the Care Act and local implementation of a new social care IT system for Adults Operations.
A key aspect of the plan is to enhance the citizen’s experience and ability to inform service design. To help deliver this, ECC worked with the Essex Coalition of Disabled People (ecdp) who led focused workshops on barriers, user experience and communication issues. Ecdp then produced an animated film and support in re-designing literature.
Other current threads of improvement work include on-line live chat support coupled with the introduction of the role of community ‘navigators’ or agents. There is a planned launch of skilled direct payments champions across Essex to support the changing culture of direct payments and work to improve outcomes for citizens. Work is also underway to streamline the financial assessment process and reduce the length of time for financial assessments.
11 Personal Budgets Outcomes and Evaluation Tool (POET)
Proportion of people using social care who receive direct payments for all English single tier and county councils
0
20
40
60
80
Per
cen
t
Proportion of people using social care who receive direct payments 2013/14 (raw values)
100

25 Towards excellence in adult social care progress with adult social care priorities
Case exampleLeeds City CouncilLeeds is actively involved alongside other partners in tackling independence issues for people with mental health issues with representation from expert practitioners and commissioning officers. During 2013/14 Leeds has established self-directed support champions in all mental health teams; review processes have been revised to provide a greater emphasis on outcomes and meetings between council commissioners and local third sector mental health providers in terms of increasing opportunities for independence through the better use of personal budgets have been held. As a result, an additional 82 recovery and independence focused personal budgets for people with mental health needs have been achieved in 2013/14.
1E to 1H Proportion of adults with a learning disability and those in contact with secondary mental health services in paid employment and living independently with or without support.The next four measures look at outcomes for two specific client groups; those with learning disabilities and those in contact with secondary mental health services. These measures are designed to improve outcomes for these groups, ensuring that all have the opportunity to find employment when they want, maintain a family and social life and contribute to community life, and avoid loneliness or isolation.
The employment measure is intended to improve the employment outcomes for these adults, thus reducing the risk of social exclusion. There is a strong link between employment and enhanced quality of life, including evidenced benefits for health and wellbeing and financial benefits. For adults with mental health problems, supporting someone to become and remain employed is a key part of the recovery process. Employment outcomes are a predictor of quality of life, and are indicative of whether care and support is personalised. Employment is a wider determinant of health and social inequalities.
The independent living measure is intended to improve outcomes for both adults with a learning disability and those with mental health problems by demonstrating the proportion in stable and appropriate accommodation. The nature of accommodation for both has a strong impact on their safety and overall quality of life and the risk of social exclusion.
1E Proportion of adults with a learning disability in paid employmentOverall for England, the percentage of adults with a learning disability in paid employment has decreased over the last two years. In six out of nine regions, the percentage has decreased over the last year with one staying the same. With the exception of the South West all regions are showing a smaller percentage of people with learning disabilities in paid employment compared with their position in 2011/12.

26 Towards excellence in adult social care progress with adult social care priorities
Commentary There are several reasons why this trend might continue downwards – the current economic climate and willingness of employers to provide opportunities, the closure of employment based services run by councils or the voluntary sector or increasing dependency within an ageing learning disability population which makes taking up employment more difficult. The LGA have a learning disability peer challenge as one of the modular peer challenges. It is hoped that this will identify areas of improvement and notable practice.
Response from the sectorThis has been a policy imperative for some time and needs particular focus and attention in 2015/16 to understand the cause of this continued downward trend and how it might be addressed. The provision of employment opportunities is not solely within the remit of adult social care. In order to work people need to have suitable accommodation, accessible transport and buildings as well as appropriate support in the workplace. A coordinated integrated approach across local government including public health, the NHS and the business community is required to create the climate and environment in which to offer real employment. Councils will want to assess whether their current learning disability strategies have the necessary focus on employment opportunities in today’s climate. TEASC will be working with colleagues in the LGA to look at how councils can work with partners locally to create those opportunities.
AreaProportion of adults with learning disabilities in paid employment
2010/11 raw value
2011/12 raw value
2012/13 raw value
2013/14 raw value
2013/14 direction
2013/14 difference
East of England 6.0 7.3 6.5 7.2 Improving 0.7
East Midlands 5.3 5.8 5.2 4.9 Worsening -0.3
London 8.6 9.3 9.1 8.8 Worsening -0.3
North East 5.7 5.7 5.5 5.5 No change 0.0
North West 4.9 5.4 5.5 5.2 Worsening -0.3
South East 9.6 9.6 9.7 8.1 Worsening -1.6
South West 5.7 5.8 7.3 8.1 Improving 0.8
West Midlands 5.5 6.3 5.6 4.9 Worsening -0.7
Yorkshire and Humberside 6.3 6.8 6.5 6.2 Worsening -0.3
England 6.6 7.1 7 6.7 Worsening -0.3

27 Towards excellence in adult social care progress with adult social care priorities
1F Proportion of adults in contact with secondary mental health services in paid employmentThe following table shows the proportion of adults in contact with secondary mental health services in paid employment. Whilst time series data are shown, it is important to note that there were changes to the dataset in April 2011 and April 2013. Furthermore the method for calculating the annual score was changed for 2013/14. These changes affect the comparability between the data over time.
Overall for England, the percentage of adults in contact with secondary mental health services in paid employment is 7.0 per cent.
West Midlands, at 10.4 per cent has the highest proportion of adults in contact with secondary mental health services in paid employment. The North East has the lowest at 5.1 per cent.
Proportion of adults with learning disabilities in paid employment for England and all English regions
0
5
East
of E
nglan
dEa
st M
idlan
ds
Lond
on
North
Eas
t
North
Wes
t
Sout
h Ea
st
Sout
h W
est
Wes
t Midl
ands
York
shire
and
Hum
bers
ide
Engl
and
(raw values)
Per
cen
t
Proportion of adults with learning disabilities in paid employment 2010/11
Proportion of adults with learning disabilities in paid employment 2011/12
Proportion of adults with learning disabilities in paid employment 2012/13
Proportion of adults with learning disabilities in paid employment 2013/14
10
15

28 Towards excellence in adult social care progress with adult social care priorities
Area
Proportion of adults in contact with secondary mental health services in paid employment
2010/11 raw value
2011/12 raw value
2012/13 raw value
2013/14 raw value
2013/14 direction
2013/14 difference
East of England 9.7 8.4 12.4 9.7 Worsening -2.7
East Midlands 11.1 13.4 8.5 6.7 Worsening -1.8
London 6.6 6.7 6.9 5.4 Worsening -1.5
North East 11.2 6.8 6.8 5.1 Worsening -1.7
North West 9.6 9.8 5.6 5.6 No change 0.0
South East 7.9 8.1 9.0 6.6 Worsening -2.4
South West 12.3 9.3 10.1 7.3 Worsening -2.8
West Midlands 11.4 10.3 11.5 10.4 Worsening -1.1
Yorkshire and Humberside 9.5 9.6 10.0 7.7 Worsening -2.3
England 9.5 8.9 8.8 7.0 Worsening -1.8
Proportion of adults in contact with secondary mental health services in paid employment for England and all English regions
0
5
East
of E
nglan
dEa
st M
idlan
ds
Lond
on
North
Eas
t
North
Wes
t
Sout
h Ea
st
Sout
h W
est
Wes
t Midl
ands
York
shire
and
Hum
bers
ide
Engl
and
(raw values)
Per
cen
t
Proportion of adults in contact with secondary mental health services in paid employment 2010/11Proportion of adults in contact with secondary mental health services in paid employment 2011/12
Proportion of adults in contact with secondary mental health services in paid employment 2012/13Proportion of adults in contact with secondary mental health services in paid employment 2013/14
10
15

29 Towards excellence in adult social care progress with adult social care priorities
Commentary Taking into consideration the changes to data collection, the picture for employment for people with mental health indicates a similar downward trend, and the same economic arguments might apply in terms of the opportunities available. We know however that employment is a key factor in aiding recovery but that stigma and prejudice in the workplace can deny people that opportunity.
The Department of Health publication ‘Closing the Gap’ makes a pledge to support employers to help more people into work and support them whilst they are working.12 The ‘Time to Change’ initiative, recently championed by the Minister for Care and Support Norman Lamb will also encourage employers to think again. A number of pilot sites will be developed and we will use that learning across the sector to implement change.
Response from the sectorThis issue remains a high priority for central and local government and health and wellbeing boards will want to be making it a priority locally. For all care groups ‘participation in work, education, training or recreation’ becomes a statutory responsibility under the duty to promote wellbeing in the Care Act 2014. This issue will also be a focus of discussion with regional improvement leads with a view to share best practice and ensure focus locally.
Case exampleRotherham has recently improved their performance in this area: ‘Our performance on employment was below average across the region.
At a very challenging economic time we helped 45 people with a learning disability and 60 people with mental health issues into employment. In the process we have narrowed the regional and national average ‘gap’ between Rotherham’s employment rate and other councils. We have done this through our improvement plans, which included our ‘buddying’ work with North East Lincolnshire. Our work regarding employment for people with learning disabilities and mental Health has helped us to deliver a stronger direction of travel in 2013/14 than the regional and national average.’
1G Proportion of adults with a learning disability who live in their own home or with their familyThere is a slightly more mixed picture with the proportion of adults with a learning disability who live in their own home or with their family. Overall the performance for England as a whole continues to improve. The North West has the highest percentage of adults with a learning disability living independently at 87.9 per cent.
Seven out of nine regions are showing improvement on 2012/13, and all regions are showing an improvement when compared with 2011/12.
There is some variation on this measure, with five authorities identified as significantly lower than the average for England. Councils in the south of the country and in particular London authorities appear to have lower levels of performance on this measure.
12 https://www.gov.uk/government/uploads/system/uploads/attachment_data/file/281250/Closing_the_gap_V2_-_17_Feb_2014.pdf

30 Towards excellence in adult social care progress with adult social care priorities
Area
Proportion of adults with learning disabilities who live in their own home or with their family
2010/11 raw value
2011/12 raw value
2012/13 raw value
2013/14 raw value
2013/14 direction
2013/14 difference
East of England 54.5 66.3 73.1 73.9 Improving 0.8
East Midlands 59.4 66.1 72.3 72.0 Worsening -0.3
London 58.8 65.7 68.1 68.6 Improving 0.5
North East 71.0 77.8 79.0 80.6 Improving 1.6
North West 59.6 77.8 85.3 87.9 Improving 2.6
South East 65.4 70.2 71.1 70.7 Worsening -0.4
South West 44.5 65.2 69.1 73.2 Improving 4.1
West Midlands 51.7 65.4 66.0 68.9 Improving 2.9
Yorkshire and Humberside 68.1 76.4 77.9 79.2 Improving 1.3
England 59.0 70.0 73.5 74.9 Improving 1.4
Proportion of adults with learning disabilities who live in their own home or with their family for England and all English regions
0
25
East
of E
nglan
dEa
st M
idlan
ds
Lond
on
North
Eas
t
North
Wes
t
Sout
h Ea
st
Sout
h W
est
Wes
t Midl
ands
York
shire
and
Hum
bers
ide
Engl
and
(raw values)
Per
cen
t
Proportion of adults with learning disabilities who live in their own home or with their family 2010/11
Proportion of adults with learning disabilities who live in their own home or with their family 2011/12
Proportion of adults with learning disabilities who live in their own home or with their family 2012/13Proportion of adults with learning disabilities who live in their own home or with their family 2013/14
50
75
100

31 Towards excellence in adult social care progress with adult social care priorities
Commentary The move to independence is an important one and one which social care cannot deliver alone. Appropriate, affordable accommodation in friendly communities is key to enabling people to live independently and requires a strong partnership with specialist providers and housing authorities. The difficult financial climate is likely to have had some effect on the delivery of such accommodation which could explain the performance in the south especially given the relative housing costs.
Response from the sectorThe cost of supporting people with a learning disability with complex needs in the community is high and needs the support of community health services if they are to be sustainable. Whilst this is challenging in the current economic environment for adult social care and the NHS, it remains a priority as part of the Transforming Care plans across the sector. Furthermore additional DH funding of £7 million has also been agreed for local authorities to help show what it is possible to achieve rapidly via adaptations to existing builds to support people with learning disabilities, autism and/or challenging behaviour to live in the community. This is not just about those currently within in-patient settings but also ensuring support for those who might otherwise be at risk of going into them in future.
1H Proportion of adults in contact with secondary mental health services who live independently, with or without supportThe following table shows the proportion of adults in contact with secondary mental health services living independently, with or without support. Whilst time series data are shown, it is important to note that there were changes to the dataset in April 2011 and April 2013. Furthermore the method for calculating the annual score was changed for 2013/14. These changes affect the comparability between the data over time.
Overall, the percentage of adults in contact with secondary mental health services who live independently, with or without support for England is 60.8 per cent. Across the regions this varies from 50.5 per cent in the South West to 78.6 per cent in London. Four authorities are idenitfied as significantly worse than average on this measure.

32 Towards excellence in adult social care progress with adult social care priorities
Area
Proportion of adults in contact with secondary mental health services who live independently, with or without support
2010/11 raw value
2011/12 raw value
2012/13 raw value
2013/14 raw value
2013/14 direction
2013/14 difference
East of England 64.2 45.7 65.5 66.0 Improving 0.5
East Midlands 70.6 59.8 54.4 51.5 Worsening -2.9
London 72.6 73.1 79.4 78.6 Worsening -0.8
North East 76.6 52.0 41.5 39.6 Worsening -1.9
North West 75.0 64.1 47.5 55.4 Improving 7.9
South East 53.4 42.7 56.3 51.5 Worsening -4.8
South West 62.8 44.8 50.1 50.5 Improving 0.4
West Midlands 69.1 51.2 60.3 72.2 Improving 11.9
Yorkshire and Humberside 52.7 55.3 63.1 63.2 Improving 0.1
England 66.8 54.6 58.5 60.8 Improving 2.3
Proportion of adults in contact with secondary mental health services who live independently, with or without support for England and all English regions
0
25
East
of E
nglan
dEa
st M
idlan
ds
Lond
on
North
Eas
t
North
Wes
t
Sout
h Ea
st
Sout
h W
est
Wes
t Midl
ands
York
shire
and
Hum
bers
ide
Engl
and
(raw values)
Per
cen
t
Proportion of adults in contact with secondary mental health services who live independently, with or without support 2010/11Proportion of adults in contact with secondary mental health services who live independently, with or without support 2011/12
Proportion of adults in contact with secondary mental health services who live independently, with or without support 2012/13Proportion of adults in contact with secondary mental health services who live independently, with or without support 2013/14
50
75
100

33 Towards excellence in adult social care progress with adult social care priorities
Commentary The overall picture appears to be improving and there will be a number of factors affecting the variations over the years and between regions; data collection, integration with the NHS and the economic situation. There may also be issues of stigma and low priority in the policy and transformation agenda which need addressing in 2015.13
Response from the sectorThe wellbeing principle in the Care Act also reinforces the need to support people with Mental Health needs to Iive independently for as long as possible and can be a fresh driver to these local conversations. Many councils provide a range of housing and social care related support to people with mental health needs including support to deal with rent arrears, budgeting, life skills, accessing training, education and employment. The Care Act also places new duties on local authorities to facilitate and shape their market for adult care and support as a whole, so that it meets the needs of all people in their area who need care and support. It is hoped that this will also help develop a range of support for people with secondary Mental Health needs.
1I Proportion of people who use services who reported that they had as much social contact as they would likeThis is a new measure for 2013/14. There is a clear link between loneliness and poor mental and physical health. A key element of the Government’s vision for social care is to tackle loneliness and social isolation, supporting people to remain connected to their communities and to develop and maintain connections to their friends and family. This measure will draw on self-reported levels of social contact as an indicator of social isolation for users of social care, with a further measure for carers. Developing services to address social isolation whilst resources reduce will be a challenge and there has to be wider public service, voluntary sector and community support solutions. The Campaign to End Loneliness and Age UK loneliness campaigns and the development of the new Silverline charity are good examples of support that can assist in this area.
The relevant question drawn from the Adult Social Care Survey is question 8a; ‘Thinking about how much contact you’ve had with people you like, which of the following statements best describes your social situation?’ The measure is defined by determining the percentage of users responding ‘I have as much contact as I want with people I like’. The measure gives an overall indication of the reported outcomes for individuals – it does not at present identify the specific contribution of councils’ adult social care towards the outcome.
The highest proportion of service users saying that they do have the social contact they want is in the North East at 48.6 per cent. The lowest is in London at 40.7 per cent.
The tables and charts include earlier years using data from the PSS Adult Social Care Survey and Survey of Adult Carers. Overall for England, there has been improvement over the last year and since 2011/12. Taking account of confidence intervals, the North East and East Midlands have shown improvement over the last year, but only the East of England and the South East have shown improvement over the longer period from 2011/12 to 2013/14. Two authorities were identified as significantly lower than average6 on this measure for 2013/14.
13 http://www.centreformentalhealth.org.uk/pdfs/Briefing47_Barriers_to_employment.pdf

34 Towards excellence in adult social care progress with adult social care priorities
Area
Proportion who use services who reported that they had as much social contact as they would like
2010/11 raw value
2011/12 raw value
2012/13 raw value
2013/14 raw value
2013/14 direction
2013/14 difference
East of England 40.5 41.3 44.3 44.6 Improving 0.3
East Midlands 41.3 41.4 39.7 43.1 Improving 3.4
London 38.5 39.1 39.8 40.7 Improving 0.9
North East 43.8 46.8 44.6 48.6 Improving 4.0
North West 44.2 43.4 44.8 45.6 Improving 0.8
South East 41.2 41.4 43.9 45.3 Improving 1.4
South West 42.9 43.5 44.8 45.0 Improving 0.2
West Midlands 42.8 43.8 42.3 44.9 Improving 2.6
Yorkshire and Humberside 42.8 42.1 45.4 44.2 Worsening -1.2
England 41.9 42.3 43.2 44.5 Improving 1.3
Proportion who use services who reported that they had as much social contact as they would like for England and all English regions
0
East
of E
nglan
dEa
st M
idlan
ds
Lond
on
North
Eas
t
North
Wes
t
Sout
h Ea
st
Sout
h W
est
Wes
t Midl
ands
York
shire
and
Hum
bers
ide
Engl
and
(raw values)
Per
cen
t
Proportion who use services who reported that they had as much social contact as they would like 2010/11Proportion who use services who reported that they had as much social contact as they would like 2011/12
Proportion who use services who reported that they had as much social contact as they would like 2012/13Proportion who use services who reported that they had as much social contact as they would like 2013/14
20
40
60

35 Towards excellence in adult social care progress with adult social care priorities
CommentaryThe first time reporting of this indicator shows significant variation and no regional pattern. Social isolation is a key factor in poor health particularly for the older population. This is addressed in the Care Act 2014 under the wellbeing principle as part of the universal offer to people who may not have eligible needs but who might be lonely and isolated. A loneliness and isolation toolkit for health and wellbeing boards has been designed by the Campaign to End Loneliness to support them in addressing loneliness and social isolation in their areas. In particular how they might build it into their Joint Strategic Needs Assessments (JSNAs) and Joint Health and Wellbeing Strategies (JHWSs).14
Response from the sectorThe recent Ageing Well programme delivered by the LGA was embraced by many councils and particularly focuses on how local government can take effective action to support older people to ensure they do not become socially excluded. The range of interventions for alleviating loneliness and social isolation can be grouped into one-to-one interventions, group services and wider community engagement. Those that look most effective include befriending, social group schemes and Community Navigators (SCIE preventing loneliness and social isolation amongst older people, SCIE Briefing 2012). The Care Act 2015 will require local authorities to promote individual wellbeing, this may include interventions that reduce loneliness or isolation.
14 http://campaigntoendloneliness.org/toolkit/

36 Towards excellence in adult social care progress with adult social care priorities
3 Delaying and reducing the need for care and support
Domain 2 of the ASCOF focuses on delaying and reducing the need for care and support. The measures focus on supporting improvement and progress in supporting recovery and regaining independence, delaying dependency and promoting independence, and the effectiveness of prevention and preventative services.
This domain included a number of placeholders in the 2013/14 and 2012/13 ASCOF, reflecting both the difficulty in articulating measures about delaying, and reducing the need for care and support in the context of adult social care, but also the paucity of data available to support this domain. There was a particular focus on this area in the development work supported by the zero based review.
2A Permanent admissions to residential and nursing care homes, per 100,000 populationAvoiding permanent placements in residential and nursing care homes is a good measure of delaying dependency, and the inclusion of this measure in the framework supports local health and social care services to work together to reduce avoidable admissions. Research suggests that, where possible, people prefer to stay in their own home rather than move into residential care.
This is a two part measure reflecting the number of admissions of younger adults (part 1) and older people (part 2) to residential and nursing care homes relative to the population size of each group. The measure compares council records with Office for National Statistics (ONS) population estimates.
People counted as a permanent admission should include:
• residents where the local authority makes any contribution to the costs of care, no matter how trivial the amount and irrespective of how the balance of these costs are met;
• supported residents in:
◦ local authority-staffed care homes for residential care;
◦ independent sector care homes for residential care;
◦ registered care homes for nursing care; and,
◦ residential or nursing care which is of a permanent nature and where the intention is that the spell of care should not be ended by a set date.
For people classified as permanent residents, the care home would be regarded as their normal place of residence.
Analysis shows that older people have a higher rate of permanent admissions than younger adults. Using a two-part measure means that we can separate age as a factor in the level of

37 Towards excellence in adult social care progress with adult social care priorities
admissions and focus on the contribution of services to reducing admissions. It will also help highlight, both nationally and locally, the separate issues that relate to the rates of permanent admissions for younger adults and for older people.
Data for 2011/12 is not directly comparable with other years as there was a recording change in the underlying data collection, which impacted on the number of permanent admissions. This was due to the Valuing People Now (VPN) initiative which changed the responsibility for, and funding of, some learning disability services which became commissioned by local authorities.The additional data requirement was only needed for one year, 2011/12, and was removed for 2012/13. The data has been left in the table to show any regional variation.
2A(1) Permanent admissions of younger adults aged 18 to 64 to residential and nursing care homes, per 100,000 population
Overall the rate of permanent admissions of younger adults to residential and nursing care homes has decreased over the last year. Seven local authorities are highlighted as having significantly higher than average rates of admissions. None were identified as significantly lower than average6.
The South West region has the highest rate of admissions at 18.5 per 100,000 population, whilst London has the lowest at 10.2 per 100,000 population.
Area
Permanent admissions of younger adults (aged 18 to 64) to residential and nursing care homes, per 100,000 population
2010/11 raw value
2011/12 raw value
2012/13 raw value
2013/14 raw value
2013/14 direction
2013/14 difference
East of England 17.4 17.7 18.1 16.7 Decreasing -1.4
East Midlands 15.1 16.5 15.5 16.8 Increasing 1.3
London 12.7 15.8 10.6 10.2 Decreasing -0.4
North East 12.7 24.5 15.4 16.6 Increasing 1.2
North West 16.7 16.8 14.8 14.4 Decreasing -0.4
South East 14.6 26.6 14.6 15.0 Increasing 0.4
South West 17.8 22.6 15.8 18.5 Increasing 2.7
West Midlands 13.2 18.3 18.2 14.5 Decreasing -3.7
Yorkshire and Humberside 14.7 14.3 15.3 11.0 Decreasing -4.3
England 15.0 19.1 15.0 14.4 Decreasing -0.6

38 Towards excellence in adult social care progress with adult social care priorities
Permanent admissions of younger adults (aged 18 to 64) to residential and nursing care homes, per 100,000 population for England and all English regions
0
Lond
onYo
rksh
ire a
nd
Hum
bers
ide
Engl
and
North
Wes
tW
est M
idlan
ds
Sout
h Ea
st
North
Eas
tEa
st of
Eng
land
East
Midl
ands
Sout
h W
est
Per
100
,000
pop
ulat
ion
Permanent admissions of younger adults (aged 18 to 64) to residential and nursing care homes, per 100,000 population (raw values)
5
15
10
20
Permanent admissions of younger adults (aged 18 to 64) to residential and nursing care homes, per 100,000 population for England and all English regions
0
East
of E
nglan
dEa
st M
idlan
ds
Lond
on
North
Eas
t
North
Wes
t
Sout
h Ea
st
Sout
h W
est
Wes
t Midl
ands
York
shire
and
Hum
bers
ide
Engl
and
(raw values)
Per
100
,000
pop
ulat
ion
Permanent admissions of younger adults (aged 18 to 64) to residential and nursing care homes, per 100,000 population 2010/11Permanent admissions of younger adults (aged 18 to 64) to residential and nursing care homes, per 100,000 population 2011/12
Permanent admissions of younger adults (aged 18 to 64) to residential and nursing care homes, per 100,000 population 2012/13Permanent admissions of younger adults (aged 18 to 64) to residential and nursing care homes, per 100,000 population 2013/14
10
20
30

39 Towards excellence in adult social care progress with adult social care priorities
2A(2) Permanent admissions of older people (aged 65 and over) to residential and nursing care homes, per 100,000 population
The rate of admissions of older people (aged 65 and over) to residential and nursing care homes has decreased in all regions over the last year. Overall, and in all regions with the exception of East Midlands and West Midlands the rate of admissions in 2013/14 is lower than it was three years ago.
The North East region has the highest rate of admissions at 803.4 per 100,000 population, whilst London has the lowest at 454 per 100,000 population.
A number of authorities report rates that are significantly different to the average6. Six London boroughs are identified as significantly lower than average. Four authorities were identified as having rates significantly higher than average.
Area
Permanent admissions of older people (aged 65 and over) to residential and nursing care homes, per 100,000 population
2010/11 raw value
2011/12 raw value
2012/13 raw value
2013/14 raw value
2013/14 direction
2013/14 difference
East of England 680.6 698.8 703.8 649.1 Decreasing -54.7
East Midlands 679.5 700.6 759.1 690.0 Decreasing -69.1
London 564.6 537.9 478.2 454.0 Decreasing -24.2
North East 895.6 877.9 831.4 803.4 Decreasing -28.0
North West 822.8 818.4 781.8 756.1 Decreasing -25.7
South East 639.6 694.4 714.1 625.8 Decreasing -88.3
South West 680.4 677.7 680.8 638.0 Decreasing -42.8
West Midlands 629.2 645.5 685.6 662.7 Decreasing -22.9
Yorkshire and Humberside 685.6 672.9 680.3 644.1 Decreasing -36.2
England 686.6 695.9 697.2 650.6 Decreasing -46.6

40 Towards excellence in adult social care progress with adult social care priorities
Permanent admissions of older people (aged 65 and over) to residential and nursing care homes, per 100,000 population for England and all English regions
0
Lond
onSo
uth
East
Sout
h W
est
York
shire
and
Hum
bers
ideEa
st of
Eng
land
Engl
and
Wes
t Midl
ands
East
Midl
ands
North
Wes
t
North
Eas
t
Per
100
,000
pop
ulat
ion
Permanent admissions of younger adults (aged 18 to 64) to residential and nursing care homes, per 100,000 population (raw values)
200
600
400
800
Permanent admissions of older people (aged 65 and over) to residential and nursing care homes, per 100,000 population for England and all English regions
0
East
of E
nglan
dEa
st M
idlan
ds
Lond
on
North
Eas
t
North
Wes
t
Sout
h Ea
st
Sout
h W
est
Wes
t Midl
ands
York
shire
and
Hum
bers
ide
Engl
and
(raw values)
Per
100
,000
pop
ulat
ion
Permanent admissions of older people (aged 65 and over) to residential and nursing care homes, per 100,000 population 2010/11Permanent admissions of older people (aged 65 and over) to residential and nursing care homes, per 100,000 population 2011/12
Permanent admissions of older people (aged 65 and over) to residential and nursing care homes, per 100,000 population 2012/13Permanent admissions of older people (aged 65 and over) to residential and nursing care homes, per 100,000 population 2013/14
200
600
800
400
1000

41 Towards excellence in adult social care progress with adult social care priorities
CommentaryThe trend of decreasing permanent admissions is welcome and reflects the increase in the use of personal budgets and provision of alternative care and support services. It may also show how some councils are already developing their market shaping and commissioning to ensure the wider range of care provision needed to support people to live independently.
Response from the sectorADASS, LGA, TLAP and the DH recently launched the ‘Commissioning for Social Care Outcomes’ self assessment toolkit for councils to use as part of a sector-led approach to continually improve the way we commission with a focus on partnership with providers, users of services, their carers and NHS colleagues.
The commissioning tool should ideally be used with the Use of Resources self assessment tool which helps to identify how services can be transformed to maintain people’s independence whilst making necessary savings and efficiencies. This tool is particularly helpful to councils who are needing to reduce their dependence on residential care for working age adults.
Case exampleReducing admissions to residential care in South TynesideSouth Tyneside along with several other councils in the programme looked to reduce admissions to residential care for older people through this programme. Over the previous few years the council experienced an increase in the number of people being assessed as needing residential care, which may have been explained by demographic pressures.
Neighbouring authority, North Tyneside, had begun to reduce the number of new admissions through a combination of culture change and tight managerial controls. From a peak of 336 new admissions to residential care at the start of the programme in 2011/12, South Tyneside reduced admissions to 235 in 2013/14, a 30 per cent reduction.
The approach taken by the council was to start with a series of training events which looked at social work assessment practice and developed a shared understanding amongst practitioners about what good looked like when helping a person to deliver their personal outcomes. Local commissioners were active participants in the training programme to ensure that they had an understanding of the type and range of services that older people needed and whether these were readily available in the market.
Over three quarters of the councils in the Adult Social Care Efficiency programme have plans in place to reduce admissions to residential care, usually through a combination of early intervention, the development of extra care housing as a genuine alternative to residential care and the closure of in-house provision.
(LGA Adult Social Care Efficiency (ACSE) Final Report 2014)

42 Towards excellence in adult social care progress with adult social care priorities
2B Proportion of older people (65 and over) who were still at home 91 days after discharge from hospital into reablement/rehabilitation servicesThere is strong evidence that reablement services lead to improved outcomes and value for money across the health and social care sectors. Reablement seeks to support people and maximise their level of independence, in order to minimise their need to ongoing support and dependence on public services.
This measures the benefit to individuals from reablement, intermediate care and rehabilitation following a hospital episode, by determining whether an individual remains living at home 91 days following discharge, the key outcome for many people using reablement services. It captures the joint work of social services and health staff and services commissioned by joint teams, as well as adult social care reablement.
This is a two-part measure which reflects both the effectiveness of reablement services (part 1), and the coverage of the service (part 2). The rationale for a two-part measure is to capture the volume of reablement offered as well as the success of the reablement service offered. This will prevent areas scoring well on the measure while offering reablement services to only a very small number of people. In 2011/12 there was a small change to the data collection behind this measure. Comparisons over time should be made with this in mind.
The measure includes social care-only placements. Therefore, those that were assessed just on social care needs would now be included in the data collection. In the future it may also be possible to expand the measure to include individuals assessed only on health needs, on the basis that this is a measure of joint working and is replicated in the NHS Outcomes Framework In circumstances where there has been an assessment conducted by the NHS not including social care needs, social care may still be involved in delivering the service to the individual.
2B(1) Proportion of older people (65 and over) who were still at home 91 days after discharge from hospital into reablement/rehabilitation servicesThere is a varied pattern of improvement on the effectiveness of reablement services. Overall, performance across England has improved over the last year, but is slightly worse than it was in 2011/12. London has the highest proportion of older people who were still at home 91 days after discharge, and has shown improvement over the last two years. Conversely East Midlands has the lowest percentage still at home, and this has decreased steadily year on year.
Six out of nine regions have shown an improvement in the last year, and all of these are showing an improvement on 2011/12. Eight authorities are identified as having a significantly lower than average6 percentage of older people still at home after 91 days.

43 Towards excellence in adult social care progress with adult social care priorities
Area
Proportion of over 65s who were still at home 91 days after discharge from hospital into reablement/rehabilitation
services (effectiveness of the service)2010/11 raw value
2011/12 raw value
2012/13 raw value
2013/14 raw value
2013/14 direction
2013/14 difference
East of England 78.4 80.7 81.5 82.2 Improving 0.7
East Midlands 82.7 79.7 77.5 76.0 Worsening -1.5
London 85.3 84.8 85.3 88.1 Improving 2.8
North East 82.4 85.3 84.9 87.2 Improving 2.3
North West 78.3 82.1 79.9 82.6 Improving 2.7
South East 83.6 85.0 82.5 80.1 Worsening -2.4
South West 82.6 80.8 81.1 79.6 Worsening -1.5
West Midlands 81.9 81.1 77.9 82.4 Improving 4.5
Yorkshire and Humberside 81.7 84.9 81.5 85.3 Improving 3.8
England 82.0 82.7 81.4 82.5 Improving 1.1
Proportion of over 65s who were still at home 91 days after discharge from hospital into reablement/rehabilitation services (effectiveness of the service) for England and all English regions
0
Lond
onSo
uth
East
Sout
h W
est
York
shire
and
Hum
bers
ideEa
st of
Eng
land
Engl
and
Wes
t Midl
ands
East
Midl
ands
North
Wes
t
North
Eas
t
Per
100
,000
pop
ulat
ion
Proportion of over 65s who were still at home 91 days after discharge from hospital into reablement/rehabilitation services (effectiveness of the service)
25
75
50
100

44 Towards excellence in adult social care progress with adult social care priorities
Proportion of older people (65 and over) who were still at home 91 days after discharge from hospital into reablement/rehabilitation services (effectiveness of the service) for England and all English regions
0
East
of E
nglan
dEa
st M
idlan
ds
Lond
on
North
Eas
t
North
Wes
t
Sout
h Ea
st
Sout
h W
est
Wes
t Midl
ands
York
shire
and
Hum
bers
ide
Engl
and
(raw values)
Per
100
,000
pop
ulat
ion
Proportion of older people (65 and over) who were still at home 91 days after discharge from hospital into reablement/rehabilitation services (effectiveness of the service) 2010/11
Proportion of older people (65 and over) who were still at home 91 days after discharge from hospital into reablement/rehabilitation services (effectiveness of the service) 2011/12
Proportion of older people (65 and over) who were still at home 91 days after discharge from hospital into reablement/rehabilitation services (effectiveness of the service) 2012/13
Proportion of older people (65 and over) who were still at home 91 days after discharge from hospital into reablement/rehabilitation services (effectiveness of the service) 2013/14
20
60
80
100
40

45 Towards excellence in adult social care progress with adult social care priorities
2B(2) Proportion of older people (65 and over) who were still at home 91 days after discharge from hospital into reablement/rehabilitation services (offered the service)Overall, performance across England has improved over the last year. London has the highest proportion of older people offered a reablement service at 5.0 per cent, and has shown improvement over the last two years. Yorkshire and Humberside has the lowest at 1.9 per cent which is a slight deterioration on previous years. Four out of nine regions have shown an improvement in the last year, with all of these showing improvement over the last two years.
Area
Proportion of over 65s who were still at home 91 days after discharge from hospital into reablement/rehabilitation services
(offered the service)2010/11 raw value
2011/12 raw value
2012/13 raw value
2013/14 raw value
2013/14 direction
2013/14 difference
East of England 3.0 2.4 2.3 3.0 Improving 0.7
East Midlands 2.3 2.7 2.9 3.4 Improving 0.5
London 4.3 4.8 4.5 5.0 Improving 0.5
North East 2.3 3.0 3.6 3.1 Worsening -0.5
North West 2.9 3.4 3.8 3.1 Worsening -0.7
South East 3.1 3.2 3.2 3.0 Worsening -0.2
South West 3.0 3.2 3.1 3.8 Improving 0.7
West Midlands 3.6 4.0 3.6 3.4 Worsening -0.2
Yorkshire and Humberside 1.7 2.0 2.0 1.9 Worsening -0.1
England 3.0 3.2 3.2 3.3 Improving 0.1

46 Towards excellence in adult social care progress with adult social care priorities
EnglandProportion of older people (65 and over) who were still at home 91 days after discharge from hospital into reablement/rehabilitation services (offered the service) for England and all English regions
0
Lond
onSo
uth
Wes
tEa
st M
idlan
dsW
est M
idlan
ds
Engl
and
North
Eas
t
North
Wes
tEa
st of
Eng
land
Sout
h Ea
stYo
rksh
ire a
nd
Hum
bers
ide
Per
cen
t
Proportion of over 65s who were still at home 91 days after discharge from hospital into reablement/rehabilitation services (offered the service) 2013/14 (raw value)
1
2
5
4
3
6
Proportion of older people (65 and over) who were still at home 91 days after discharge from hospital into reablement/rehabilitation services (offered the service) for England and all English regions
0
East
of E
nglan
dEa
st M
idlan
ds
Lond
on
North
Eas
t
North
Wes
t
Sout
h Ea
st
Sout
h W
est
Wes
t Midl
ands
York
shire
and
Hum
bers
ide
Engl
and
(raw values)
Per
cen
t
2010/11 2011/12 2012/13 2013/14
1
3
4
5
6
2

47 Towards excellence in adult social care progress with adult social care priorities
Commentary Enabling people to stay at home after a hospital stay has proved successful and is the product of already successful integrated working at a local level.
Response from the sectorThe Better Care Fund (BCF) plans locally will pick up the service transformation needed to continue this trend. The resources needed to provide the 7 day health and social care services in the community as the population grows will be substantial, and the workforce needed is likely to be easier to secure in some parts of the country than others.
The recent Care Quality Comission ‘State of Care’ 2013/14 report identifies workforce recruitment as one of their main concerns in the delivery of quality care; “We’re particularly concerned about the shortage of nurses in care homes”.
The recent Care Act stocktake has also identified workforce issues as a concern in the implementation of the Act, especially a potential shortage of experienced qualified social workers in the south of the country who will be key to delivering a personalised approach to complex cases being discharged from hospital.
Whilst a range of services are increasingly available to support people with dementia, social care services continue to be under pressure to assess and identify suitable accommodation.
Case examplesThe London Borough of Haringey has a successful Community Based Reablement Service to prevent avoidable dependency and reduce the strain on secondary health care. This multi-disciplinary service rests on the close working relationship between therapists (occupational therapists and physiotherapists), social care professionals and specially trained domiciliary care workers and a strong partnership between the council, Clinical Commissioning Group and Whittington Health Trusts. Packages of support are highly personalised and the outcomes provide a convincing demonstration of the results joined-up reablement can achieve, driving activity out of hospitals, reducing admissions and supporting independence. With 64 per cent of people referred to the service being fully independent at the period of intervention and a further 8 per cent being moved on to reduced long-term care packages the benefits achieved for individuals, their families and for the health and social care economy are clear.
(ADASS Personalisation survey 2014)
LutonNearly all older people who are discharged from hospital and who need care and support go through the reablement service. The service is now looking to make a similar offer to people living in the community.
Over half of the savings that Luton has made over the last three years can be put down to better interventions and reduced costs of care, to which reablement has been a critical contributor. The council is confident that the reablement service, coupled with a decision that there are to be no admissions to permanent residential care from hospital, has led to a 12 per cent reduction in admissions to residential care over the period of this programme (2011 to 2014). In addition, £400,000 of savings have been made in domiciliary care through recommissioning contracts and entering into a strategic partnership agreement with providers.
(LGA ACSE Final Report 2014)

48 Towards excellence in adult social care progress with adult social care priorities
2C Delayed transfers of care from hospital and those which are attributable to adult social careThis measures the impact of hospital services (acute, mental health and non-acute) and community-based care in facilitating timely and appropriate transfer from all hospitals for all adults. This indicates the ability of the whole system to ensure appropriate transfer from hospital for the entire adult population. It is an important marker of the effective joint working of local partners, and is a measure of the effectiveness of the interface between health and social care services. Minimising delayed transfers of care and enabling people to live independently at home is one of the desired outcomes of social care.
This is a two-part measure that reflects both the overall number of delayed transfers of care (2C part 1) and, as a subset, the number of these delays which are attributable to social care services (2C part 2).
A delayed transfer of care occurs when a patient is ready for transfer from a hospital bed, but is still occupying such a bed. A patient is ready for transfer when:
(a) a clinical decision has been made that the patient is ready for transfer and
(b) a multi-disciplinary team decision has been made that the patient is ready for transfer and
(c) the patient is safe to discharge/transfer.
Using a two-part measure means that we can maintain a focus on joint working, while balancing this with a measure that focuses more closely on the specific contribution of social care services.
Overall, the rate of delayed transfers of care from hospital has increased over the last year, but is lower than the rate in 2011/12. The rate of delayed transfers attributable to social care has continued to decrease, but with a smaller rate of change in the last year.
Delayed transfers of care from hospital per 100,000 population, and delayed transfers of care from hospital which are attributable to adult social care per 100,000 population for England and all English regions
0
East
of E
nglan
dEa
st M
idlan
ds
Lond
on
North
Eas
t
North
Wes
t
Sout
h Ea
st
Sout
h W
est
Wes
t Midl
ands
York
shire
and
Hum
bers
ide
Engl
and
Per
100
,000
pop
ulat
ion
Delayed transfers of care from hospital per 100,000 population2013/14 (raw value)
Delayed transfers of care from hospital which are attributable to adult social care per 100,000 population 2013/14 (raw value)
2.5
5
12.5
10
7.5
15

49 Towards excellence in adult social care progress with adult social care priorities
2C(1) Delayed transfers of care from hospital per 100,000 population
London has the lowest rate of delayed discharge at 6.8 per 100,000 population, and East Midlands the highest at 12.1 per 100,000 population.
Four out of nine regions are showing an improvement in the rate of delayed transfer of care from hospital in the last year, and all four have shown an improvement over the two years.
Five of the regions are showing worsening performance over the last year. Two of these have shown improvement over the two year period (South West and West Midlands). East of England, East Midlands and Yorkshire and Humberside have increased the rate of delayed transfer over the last two years.
Five local authority areas are identifed as having a significantly higher than average6 rate of delayed transfer of care from hospital.
AreaDelayed transfers of care from hospital per 100,000 population
2010/11 raw value
2011/12 raw value
2012/13 raw value
2013/14 raw value
2013/14 direction
2013/14 difference
East of England 9.9 8.6 10.5 11.5 Worsening 1.0
East Midlands 10.9 10.8 11.7 12.1 Worsening 0.4
London 7.4 7.3 6.9 6.8 Improving -0.1
North East 7.9 8.4 9.3 8.1 Improving -1.2
North West 8.7 7.6 7.7 7.3 Improving -0.4
South East 12.4 11.0 10.2 9.8 Improving -0.4
South West 13.1 12.5 10.6 11.7 Worsening 1.1
West Midlands 17.1 13.5 11.5 11.9 Worsening 0.4
Yorkshire and Humberside 7.5 7.8 7.8 9.1 Worsening 1.3
England 10.6 9.7 9.4 9.6 Worsening 0.2
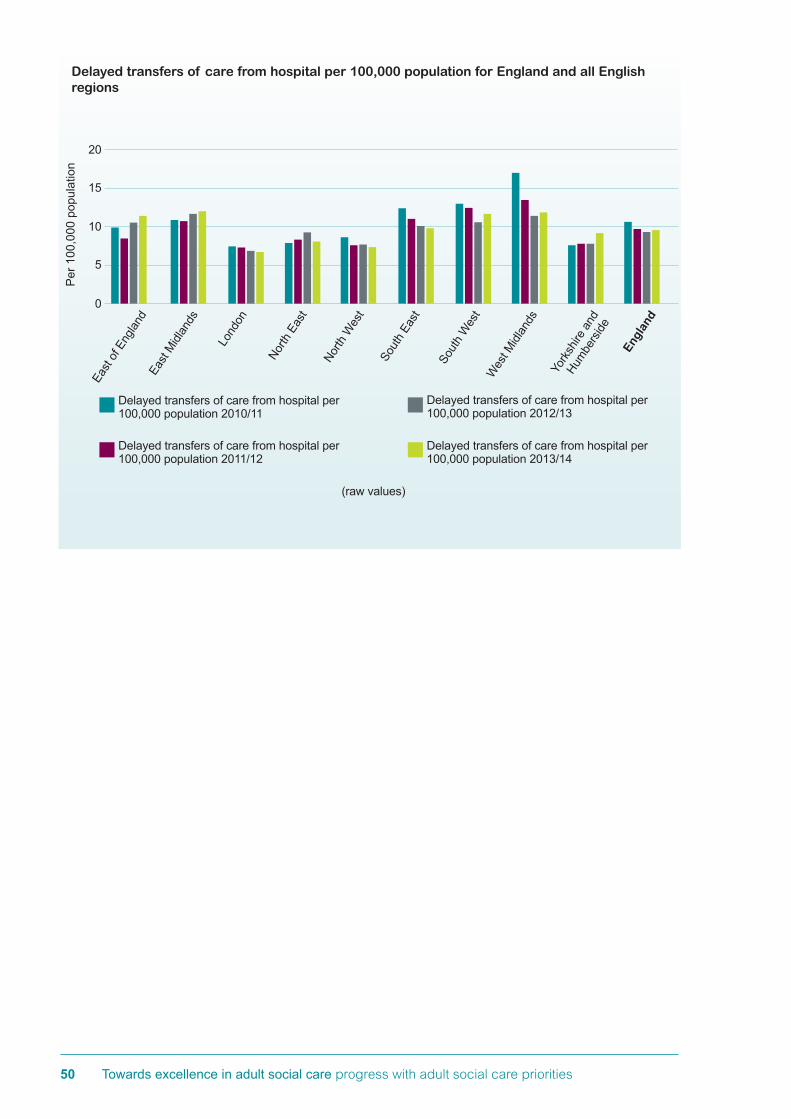
50 Towards excellence in adult social care progress with adult social care priorities
Delayed transfers of care from hospital per 100,000 population for England and all English regions
0
East
of E
nglan
dEa
st M
idlan
ds
Lond
on
North
Eas
t
North
Wes
t
Sout
h Ea
st
Sout
h W
est
Wes
t Midl
ands
York
shire
and
Hum
bers
ide
Engl
and
(raw values)
Per
100
,000
pop
ulat
ion
Delayed transfers of care from hospital per 100,000 population 2010/11
Delayed transfers of care from hospital per 100,000 population 2011/12
Delayed transfers of care from hospital per 100,000 population 2012/13
Delayed transfers of care from hospital per 100,000 population 2013/14
5
10
15
20

51 Towards excellence in adult social care progress with adult social care priorities
2C(2) Delayed transfers of care from hospital which are attributable to adult social care per 100,000 population
The North West has the lowest rate of delayed discharge attributable to social care at 1.6 per 100,000 population, and West Midlands the highest at 5.2 per 100,000 population. Five out of nine regions are showing an improvement in the rate of delayed transfer of care from hospital attributable to social care in the last year and all five have improved over two years.
Four of the regions are showing worsening improvement over the last year. Of these, two have shown improvement over the two year period (South West and East Midlands). East of England, and Yorkshire and Humberside have increased the rate of delayed discharge attributable to social care over the last two years.
Six local authority areas are identifed as having a significantly higher than average6 rate of delayed transfer of care attributable to social care from hospital. Three of these were also identified as having significantly higher than average delayed transfer of care overall.
Area
Delayed transfers of care from hospital which are attributable to adult social care per 100,000 population
2010/11 raw value
2011/12 raw value
2012/13 raw value
2013/14 raw value
2013/14 direction
2013/14 difference
East of England 4.1 3.0 3.4 3.6 Worsening 0.2
East Midlands 4.0 3.1 2.6 3.0 Worsening 0.4
London 3.0 2.9 2.6 2.3 Improving -0.3
North East 3.1 2.9 3.2 2.0 Improving -1.2
North West 2.6 2.3 2.2 1.6 Improving -0.6
South East 4.8 4.5 3.7 3.4 Improving -0.3
South West 5.1 4.7 3.8 4.1 Worsening 0.3
West Midlands 8.1 7.4 5.5 5.2 Improving -0.3
Yorkshire and Humberside 2.1 2.2 2.3 2.5 Worsening 0.2
England 4.1 3.7 3.2 3.1 Improving -0.1

52 Towards excellence in adult social care progress with adult social care priorities
Commentary There is a national recognition that councils have worked effectively with acute trusts to discharge people in a timely way, paying due regard to their safety and wellbeing.
Response from the sectorBetter Care Fund (BCF) plans will address this from next year and the national Systems Resilience Group made up of Monitor, NHSE, NHS Trust Development Authority (NTDA) and ADASS oversee the in-year delays on a weekly basis. A sector-led approach to supporting those councils and regions where there are difficulties is being developed. It remains important that the pressure felt by the system locally does not lead to individuals and their families making long term decisions in a crisis which do not promote independence and ensure older people have choice and control over their care and support.
Delayed transfers of care from hospital which are attributable to adult social care per 100,000 population for England and all English regions
0
East
of E
nglan
dEa
st M
idlan
ds
Lond
on
North
Eas
t
North
Wes
t
Sout
h Ea
st
Sout
h W
est
Wes
t Midl
ands
York
shire
and
Hum
bers
ide
Engl
and
(raw values)
Per
100
,000
pop
ulat
ion
Delayed transfers of care from hospital which are attributable to adult social care per 100,000 population 2010/11
Delayed transfers of care from hospital which are attributable to adult social care per 100,000 population 2011/12
Delayed transfers of care from hospital which are attributable to adult social care per 100,000 population 2012/13
Delayed transfers of care from hospital which are attributable to adult social care per 100,000 population 2013/14
5
2.5
7.5
10

53 Towards excellence in adult social care progress with adult social care priorities
4 Ensuring that people have a positive experience of care and supportThe outcomes in this domain can best be summarised at a high-level by the general satisfaction which people in contact with social care, including carers, express with the services they have received. This domain supports the Care and Support White Paper statement that, amongst other things, a high-quality service means that people should report having a ‘positive experience of care that meets my needs’, by allowing national and local comparison of how well local authorities are performing in ensuring that people have a positive experience of care and support.
3A Overall satisfaction of people who use services with their care and supportThis measures the satisfaction with services of people using adult social care, which is directly linked to a positive experience of care and support. Analysis of surveys suggests that reported satisfaction with services is a good predictor of people’s overall experiences of services. The relevant question is drawn from the Adult Social Care Survey, Question 1: ‘Overall, how satisfied or dissatisfied are you with the care and support services you receive?’. The measure is defined by determining the percentage of all those responding who identify strong satisfaction; ie by choosing the answer ‘I am extremely satisfied’ or the answer ‘I am very satisfied’.
As this measure is based on a survey and uses sampling, absolute differences in outcomes for the measures may not be statistically significant. Changes in survey outcomes are considered statistically significant when there are no overlapping confidence intervals between years.
When considering the confidence intervals, overall, satisfaction of service users with their care and support has improved across England over the last two years. Highest satisfaction levels are seen in the North East with 67.7 per cent of users satisfied with their care. Whilst showing improvement over the last two years, lowest satisfaction levels are seen in London at 60.3 per cent. Across all the satisfaction and user experience measures, London scores the lowest, or amongst the lowest when compared with the other regions.
Three out of nine regions are showing an improvement over the last two years Four authorities were highlighted as having significantly lower than average6 levels of satisfation. Three are in the London region.

54 Towards excellence in adult social care progress with adult social care priorities
Area
Overall satisfaction of people who use services with their care and support
2010/11 raw value
2011/12 raw value
2012/13 raw value
2013/14 raw value
2013/14 direction
2013/14 difference
East of England 58.7 60.5 62.3 65.6 Improving 3.3
East Midlands 61.3 63.7 65.2 64.4 Worsening -0.8
London 56.8 57.2 59.3 60.3 Improving 1.0
North East 65.6 66.8 66.2 67.7 Improving 1.5
North West 65.2 66.4 66.4 65.3 Worsening -1.1
South East 62.7 61.6 64.3 65.2 Improving 0.9
South West 63.7 64.4 65.2 66.4 Improving 1.2
West Midlands 62.1 63.3 64.0 64.9 Improving 0.9
Yorkshire and Humberside 64.0. 63.4 65.4 65.8 Improving 0.4
England 62.1 62.8 64.1 64.8 Improving 0.7
Overall satisfaction of people who use services with their care and support for England and all English regions
0
North
Eas
tSo
uth
Wes
tYo
rksh
ire a
nd
Hum
bers
ideEa
st of
Eng
land
North
Wes
t
Sout
h Ea
stW
est M
idlan
ds
Engl
and
East
Midl
ands
Lond
on
Per
cen
t
Overall satisfaction of people who use services with their care and support 2013/14 (raw value)
20
60
40
80

55 Towards excellence in adult social care progress with adult social care priorities
Commentary Improving satisfaction levels show that the current personalised delivery of care and support services in England is working and the sector welcomes it being embedded in the Care Act.
Response from the sectorThere will be very local and regional variations which affect satisfaction and councils will want to explore this with their local population in developing their Local Accounts. The increased transparency such engagment brings coupled with face to face consultation with users of services and their carers is likely to increase satisfaction levels for those people in receipt of services as well as those who are accessing advice and information services. The TEASC programme has made promoting the production of local accounts a priority for 2014/15. Examples of notable local accounts that reflect good levels of engagement and clearly identify local priorities are shared amongst regions.
3D(1) The proportion of people who use services who find it easy to find information about servicesThis measure reflects social services users’ experience of access to information and advice about social care. Information is a core universal service and a key factor in early intervention and reducing dependency. Improved and/or more information benefits carers and the people they support by helping them to have greater choice and control over their lives. This may help to sustain caring relationships through, for example, reduction in stress, improved welfare and physical health improvements. These benefits accrue only where information is accessed that would not otherwise have been accessed, or in those cases where the same information is obtained more easily.
Overall satisfaction of people who use services with their care and support for England and all English regions
0
East
of E
nglan
dEa
st M
idlan
ds
Lond
on
North
Eas
t
North
Wes
t
Sout
h Ea
st
Sout
h W
est
Wes
t Midl
ands
York
shire
and
Hum
bers
ide
Engl
and
(raw values)
Per
cen
t
25
50
75
2010/11 2011/12 2012/13 2013/14

56 Towards excellence in adult social care progress with adult social care priorities
This measure uses questions in the Adult Social Care Survey ‘In the past year, have you generally found it easy or difficult to find information and advice about support, services or benefits?’ The measure is the percentage of all those responding who select the response ‘very easy to find’ and ‘fairly easy to find’.
As this measure is based on a survey and uses sampling, absolute differences in outcomes for the measure may not be statistically significant. Changes in survey outcomes are considered statistically significant when there are no overlapping confidence intervals between years. Only the North East region has shown improvement over the last year, and there are no significant changes in performance overall, or across the regions for this measure over the two year period.
Highest satisfaction levels are seen in the North East with 79.9 per cent of service users and carers finding it easy to find information. Lowest satisfaction levels are seen in the East Midlands at 72.3 per cent. Three authorities were highlighted as having significantly lower than average6 levels of satisfation. Two are in the London region, and the other is in the South East.
Commentary Accessing information and advice is now built into the new duties of the Care Act and the significant improvement across England shows councils’ recognition of this. There are a number of tools available on the Care and Support Website and Social Care Institute for Excellence (SCIE) have produced particular guidance for councils.
Area
Proportion of people who use services who find it easy to find information about services
2010/11 raw value
2011/12 raw value
2012/13 raw value
2013/14 raw value
2013/14 direction
2013/14 difference
East of England 70.9 72.3 72.4 75.3 Improving 2.9
East Midlands 73.0 71.6 72.9 72.3 Worsening -0.6
London 72.0 72.0 72.8 72.8 No change 0.0
North East 78.6 79.6 76.8 79.9 Improving 3.1
North West 76.0 75.7 75.6 74.8 Worsening -0.8
South East 75.0 74.4 74.1 74.4 Improving 0.3
South West 73.9 75.0 74.5 76.8 Improving 2.3
West Midlands 75.1 72.1 72.9 72.5 Worsening -0.4
Yorkshire and Humberside 74.3 73.1 75.0 74.1 Worsening -0.9
England 74.2 73.8 74.1 74.5 Improving 0.4

57 Towards excellence in adult social care progress with adult social care priorities
0
North
Eas
tSo
uth
Wes
tEa
st of
Eng
land
North
Wes
t
Engl
and
Sout
h Ea
st
York
shire
and
Hum
bers
ide
Lond
on
Wes
t Midl
ands
East
Midl
ands
Per
cen
t
Proportion of people who use services who find it easy to find information about services 2013/14 (raw value)
20
60
40
80
100
Proportion of people who use services who find it easy to find information about services for England and all English regions
Proportion of people who use services who find it easy to find information about services for England and all English regions
0
East
of E
nglan
dEa
st M
idlan
ds
Lond
on
North
Eas
t
North
Wes
t
Sout
h Ea
st
Sout
h W
est
Wes
t Midl
ands
York
shire
and
Hum
bers
ide
Engl
and
(raw values)
Per
cen
t
25
50
75
100
2010/11 2011/12 2012/13 2013/14

58 Towards excellence in adult social care progress with adult social care priorities
5 Safeguarding adults whose circumstances make them vulnerable and protecting them from avoidable harmThe Care and Support White Paper states that a high-quality service must be one which keeps people safe from harm. In setting out safeguarding as one of the domains in the Adult Social Care Outcomes Framework, the need for services to safeguard adults whose circumstances make them vulnerable, and to protect them from avoidable harm is emphasised. Safeguarding is one of the core priorities of adult social care and the poor coverage of outcome measures in this domain reflects the paucity of national data available in this important area.
This area remains one of the critical development priorities for the future of the ASCOF, and as part of the zero based review, work has been taken forward to develop a potential measure of the outcomes of safeguarding interventions. However, defining and measuring outcomes in this domain remains a challenge and Safeguarding Adults Boards are key to driving forward outcomes work.
4A The proportion of people who use services who feel safeThis indicator measures one component of the overarching ‘social care-related quality of life’ measure. It provides an overarching measure for this domain. Safety is fundamental to the wellbeing and independence of people using social care, and the wider population. Feeling safe is a vital part of users’ experience of their care and support. There are legal requirements about safety in the context of service quality, including the Care Quality Commission’s (CQC) essential standards for registered services. There is also a vital role of being safe in the quality of the individual’s experience. The relevant question drawn from the Adult Social Care Survey is Question 7a: ‘Which of the following statements best describes how safe you feel?’. The measure is defined by determining the percentage of all those responding who choose the answer ‘I feel as safe as I want’.
The measure gives an overall indication of a reported outcome for individuals; it does not identify the specific contribution of councils’ adult social care towards to feeling safe (see measure 4B below). While the measure will identify those choosing the most positive response; ‘I feel as safe as I want’ – it will be important locally to analyse responses on safeguarding in the context of the distribution of answers across all four possible responses. For example, if a council has a relatively high proportion of respondents selecting ‘I feel as safe as I want’ (ie scores highly on the measure) but also has a relatively high proportion of respondents selecting ‘I don’t feel at all safe’, this could reflect gaps in safeguarding services.
As this measure is based on a survey and uses sampling, absolute differences in outcomes for the measure may not be statistically significant. Changes in survey outcomes are considered statistically significant when there are no overlapping confidence intervals between years. When considering the confidence intervals, overall for England as a whole, performance has improved in the last year and over the last two years. Four of the nine regions, Yorkshire and Humberside, West Midlands, South West and London,are showing improvement over the last two years.
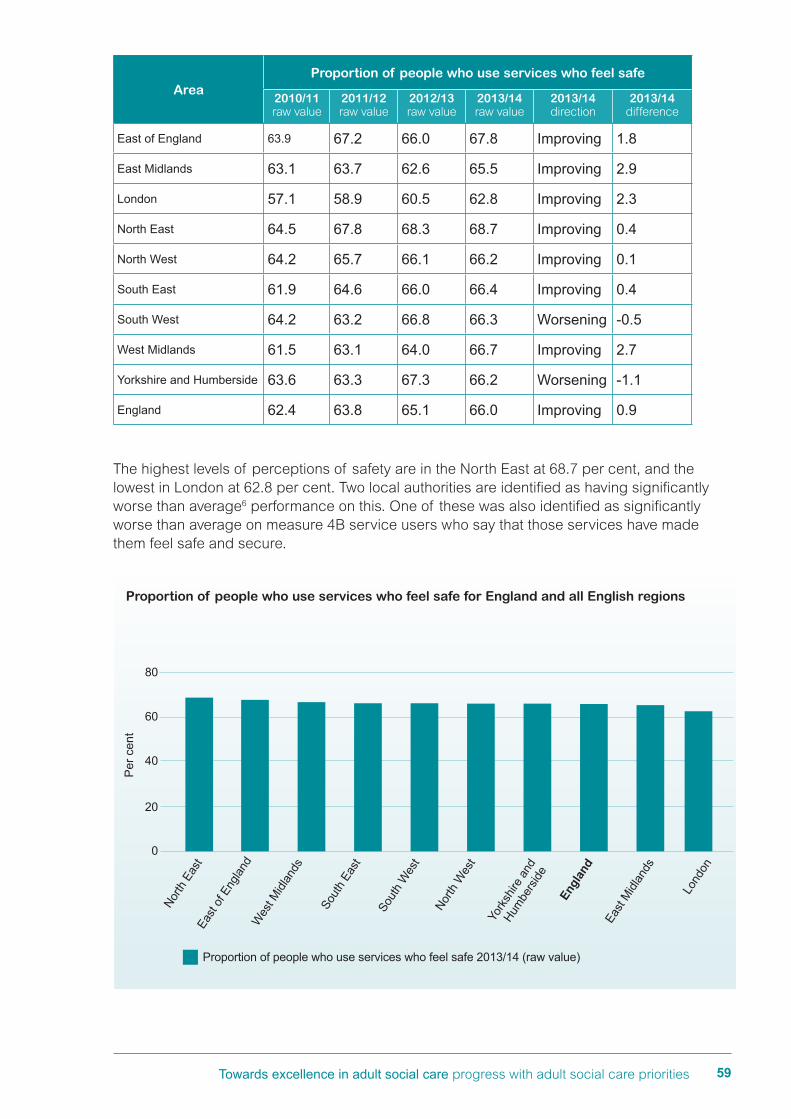
59 Towards excellence in adult social care progress with adult social care priorities
The highest levels of perceptions of safety are in the North East at 68.7 per cent, and the lowest in London at 62.8 per cent. Two local authorities are identified as having significantly worse than average6 performance on this. One of these was also identified as significantly worse than average on measure 4B service users who say that those services have made them feel safe and secure.
AreaProportion of people who use services who feel safe
2010/11 raw value
2011/12 raw value
2012/13 raw value
2013/14 raw value
2013/14 direction
2013/14 difference
East of England 63.9 67.2 66.0 67.8 Improving 1.8
East Midlands 63.1 63.7 62.6 65.5 Improving 2.9
London 57.1 58.9 60.5 62.8 Improving 2.3
North East 64.5 67.8 68.3 68.7 Improving 0.4
North West 64.2 65.7 66.1 66.2 Improving 0.1
South East 61.9 64.6 66.0 66.4 Improving 0.4
South West 64.2 63.2 66.8 66.3 Worsening -0.5
West Midlands 61.5 63.1 64.0 66.7 Improving 2.7
Yorkshire and Humberside 63.6 63.3 67.3 66.2 Worsening -1.1
England 62.4 63.8 65.1 66.0 Improving 0.9
0
North
Eas
tEa
st of
Eng
land
Wes
t Midl
ands
Sout
h Ea
st
Sout
h W
est
North
Wes
t
York
shire
and
Hum
bers
ide
Engl
and
East
Midl
ands
Lond
on
Per
cen
t
Proportion of people who use services who feel safe 2013/14 (raw value)
20
60
40
80
Proportion of people who use services who feel safe for England and all English regions

60 Towards excellence in adult social care progress with adult social care priorities
4B The proportion of people who use services who say that those services have made them feel safe and secureThis measure supports measure 4A by reflecting the extent to which users of care services feel that their care and support has contributed to making them feel safe and secure. As such, it goes some way to separate the role of care and support in helping people to feel safe from the influence of other factors, such as crime levels and socio-economic factors. The measure is based on the percentage of respondents who answer ‘yes’ to question 7b in the Adult Social Care Survey ‘Do care and support services help you in feeling safe?’ Whilst the overarching measure (4A) indicates a higher-level individual perspective on feeling safe, this measure complements this with a specific response on the impact of services on this outcome.
As this measure is based on a survey and uses sampling, absolute differences in outcomes for the measure may not be statistically significant. Changes in survey outcomes are considered statistically significant when there are no overlapping confidence intervals between years. When considering the confidence intervals, overall, for England as a whole, performance has improved over the last two years. Seven out of nine regions have shown an improvement in performance over the last two years.
The highest level of performance on this measure is in the East Midlands at 84.6 per cent, and the lowest in London at 76.8 per cent. Four local authorities are identified as having significantly worse than average performance on this measure.
Proportion of people who use services who feel safe for England and all English regions
0
East
of E
nglan
dEa
st M
idlan
ds
Lond
on
North
Eas
t
North
Wes
t
Sout
h Ea
st
Sout
h W
est
Wes
t Midl
ands
York
shire
and
Hum
bers
ide
Engl
and
(raw values)
Per
cen
t
20
40
60
80
2010/11 2011/12 2012/13 2013/14

61 Towards excellence in adult social care progress with adult social care priorities
Area
Proportion of people who use services who say that those services have made them feel safe and secure
2011/12 raw value
2012/13 raw value
2013/14 raw value
2013/14 direction
2013/14 difference
East of England 79.1 77.9 78.3 Improving 0.4
East Midlands 80.3 79.9 84.6 Improving 4.7
London 73.0 73.9 76.8 Improving 2.9
North East 77.2 80.1 78.2 Worsening -1.9
North West 73.0 76.3 77.2 Improving 0.9
South East 77.2 78.2 79.8 Improving 1.6
South West 73.4 82.5 80.0 Worsening -2.5
West Midlands 74.4 78.3 79.9 Improving 1.6
Yorkshire and Humberside 75.6 79.4 78.7 Worsening -0.7
England 75.5 78.1 79.1 Improving 1.0
0
East
Midl
ands
Sout
h W
est
Wes
t Midl
ands
Sout
h Ea
st
Engl
and
York
shire
and
Hum
bers
ideEa
st of
Eng
land
North
Eas
t
North
Wes
t
Lond
on
Per
cen
t
Proportion of people who use services who say that those services have made them feel safe and secure 2013/14 (raw value)
25
75
50
100
Proportion of people who use services who say that those services have made them feel safe and secure England and all English regions

62 Towards excellence in adult social care progress with adult social care priorities
Commentary There has been work this year to progress the development of an outcome measure for adult safeguarding for inclusion in the ASCOF. The aim is to develop and implement a standardised survey for councils to use with adults at risk, and those that support them, to gain valuable feedback about their experiences of safeguarding investigations which could then be used to help improve services.
‘Whilst the pilot survey has been well received by councils and question 6, which would potentially form the new ASCOF safeguarding outcomes measure known as 4C: Proportion of completed safeguarding referrals where people report that they feel safe, worked well providing useful results, further work is needed for the development of a worthwhile and usable ASCOF measure for safeguarding. Therefore the recommendation is that the survey is not a mandatory data collection for 2015/16 and consideration is given to the feasibility of a measure for 2016/17’.15
The Health and Social Care Information Centre (HSCIC) published the findings from the Safeguarding Adults Return, Annual Report, England 2013-14, Experimental Statistics5. This is a mandatory collection which records information about individuals for who safeguarding referrals were opened during the reporting period (also referred to as adults at risk) and case details (also referred to as allegations) for safeguarding referrals which concluded during the reporting period. The purpose of the collection is to provide information which can help stakeholders to understand where abuse may occur and improve services for individuals affected by abuse.
The SAR was one of the outcomes of the zero based review of adult social care data collections and it has replaced the Abuse of Vulnerable Adults (AVA) return. This is the first year the SAR has been collected, and whilst it covers the same subject area as the AVA return, it is much smaller in size and there are no directly comparable data items. Time series analysis across the two returns is not possible.
15 www.hscic.gov.uk/pubs/adusoccareof1314fin
Proportion of people who use services who say those services have made them feel safe and secure for England and all English regions
0
East
of E
nglan
dEa
st M
idlan
ds
Lond
on
North
Eas
t
North
Wes
t
Sout
h Ea
st
Sout
h W
est
Wes
t Midl
ands
York
shire
and
Hum
bers
ide
Engl
and
Per
cen
t
25
50
75
100
2011/12 2012/13 2013/14
63 Towards excellence in adult social care progress with adult social care priorities
Key findings are:
• Referrals were opened for 104,050 individuals during the reporting year. 60 per cent of these individuals were women and 63 per cent aged 65 or over. Just over half of the individuals had a physical disability, frailty or sensory impairment.
• The most common type was neglect and acts of omission, which accounted for 30 per cent of allegations, followed by physical abuse with 27 per cent.
• The alleged abuse most frequently occurred in the home of the adult at risk (42 per cent of allegations) or in a care home (36 per cent of allegations).
• The source of risk was most commonly someone known to the alleged victim but not in a social care capacity, accounting for 49 per cent of allegations. Social care employees were the source of risk in 36 per cent of allegations and for the remaining 15 per cent was someone unknown to the alleged victim.
• There were a total of 56 serious case reviews which included 100 adults at risk, of which 46 per cent suffered serious harm and died. The remaining 54 per cent suffered serious harm but survived.
The Making Safeguarding Personal (MSP) programme seeks to work with regional ADASS safeguarding leads to understand the trends in each region and work with councils to develop new ways of working in safeguarding to ensure that our response to abuse is sensitive and personalised.
Response from the sectorThe Making Safeguarding Personal (MSP) programme led by the LGA helps develop self-awareness and tools for local authorities to use to ensure that they are delivering a person not process centred approach to safeguarding. Nearly all of the councils have now signed up to MSP at different levels and a team of support advisors is now in place working with councils to deliver this new way of working, integral to the new requirements within the Care Act.
Becoming more outcomes focused in safeguarding demands a change of culture and social work practice which takes time to embed across organisations. Regional workshops are being held between December 2014 and February 2015, chaired by regional ADASS leads, to build the MSP programme into their implementation of the Care Act. An evaluation of the impact of MSP in 2014/15 with councils aims to collect data on the MSP measures:
• the number of people (or someone acting for them) who expressed the outcomes they wanted
• of the people who expressed their desired outcomes, the number of people whose outcomes were realised fully.
64 Towards excellence in adult social care progress with adult social care priorities
Case exampleCentral Bedfordshire CouncilA new recording framework was developed which has led to the capture of outcomes focused information on safeguarding. In the initial pilot 43 cases were recorded using a person centred evaluation tool. People were asked
• How safe do you feel?
• What three things would help you to feel safer or are most important to you?
• What might remain a wish?
• What is currently working and what is not working?
• What is in your control and what is in someone else’s control?
• How would you like to be kept up to date and informed about what happens from now?
These questions were re-visited towards the end of the intervention to assess whether the person’s view of safety had changed and whether the answers to the questions showed an improved situation.
The most common themes identified by the 43 people when asked ‘what three things would help you to feel safer or are most important to you?’ were:
• being with company
• better communication
• to live at home independently
• to see family regularly
• to have regular carers.

65 Towards excellence in adult social care progress with adult social care priorities
Glossary
ADASS – Associate Directors of Adult Social Services
ASCE – Adult Social Care Efficiency
ASCOF – Adult Social Care Outcomes Framework
ASCOT – Adult Social Care Outcomes Toolkit
AVA – Abuse of Vulnerable Adults
BCF – Better Care Fund
CQC – Care Quality Commission
DH – Department of Health
ecdp – Essex coalition of disabled people
HSCIC – Health and Social Care Information Centre
IPC – Integrated Personal Commissioning
LSCP – London Social Care Partnership
MSP – Making Safeguarding Personal
NHSE – National Health Service England
NTDA – NHS Trust Development Authority
ONS – Office for National Statistics
SAR – Safeguarding Adults Return
SCIE – Social Care Institute for Excellence
SDS – Self-Directed Support
TEASC – Towards Excellence in Adult Social Care
TLAP – Think Local Act Personal

66 Towards excellence in adult social care progress with adult social care priorities
Notes


Local Government Association Local Government House Smith Square London SW1P 3HZ
Telephone 020 7664 3000 Fax 020 7664 3030 Email [email protected] www.local.gov.uk
For a copy in Braille, larger print or audio, please contact us on 020 7664 3000. We consider requests on an individual basis. L14-709
© Local Government Association, February 2015