Towards Evidence Based ICT Policy and Regulation: e-Skills
25
Towards Evidence Based ICT Policy and Regulation: e-Skills Volume ONE 2008 Policy Paper 3 Jan Philipp Schmidt & Christoph Stork
Transcript of Towards Evidence Based ICT Policy and Regulation: e-Skills

Towards Evidence Based ICT Policy and Regulation:
e-SkillsVolume ONE 2008 Policy Paper 3
Jan Philipp Schmidt & Christoph Stork

Towards Evidence Based ICT Policy and Regulation:
e-SkillsVolume ONE 2008 Policy Paper 3
Jan Philipp Schmidt & Christoph Stork

Acknowledgement
Research ICT Africa (RIA) fi lls a strategic gap in the development of a sustainable information society and network knowledge economy by building the ICT policy and regulatory research capacity needed to inform eff ective ICT governance in Africa. The network was launched with seed funding from the International Development Research Centre (IDRC) and seeks to extend its activities through national, regional and continental partnerships. The establishment of the RIA network emanates from the growing demand for data and analysis necessary
for appropriate but visionary policy required to catapult the continent into the information age. Through network development RIA seeks to build an African knowledge base to support ICT policy and regulatory design processes and to monitor and review policy and regulatory developments on the continent. The research arising from a public interest agenda is available in the public domain and individuals and entities from the public and private sector and civil society are encouraged to use it for teaching, further research or to enable them to participate more eff ectively in national, regional and global ICT policy formulation and governance. This research is made possible by the signifi cant funding received from the IDRC, Ottawa, Canada and the network members would like to express their gratitude to the IDRC for its support. The network is hosted at The Edge Institute in Johannesburg under the directorship of Alison Gillwald.
This policy paper draws on a rich data set arising from the Household and Individual Access and Usage Survey conducted across 17 African countries under the project leadership of Dr Christoph Stork and contribution from: Dr Augustin Chabossou (Benin), Dr Sebusang Sebusag (Botswana), Dr Pam Zahonogo (Burkina Faso), Dr Olivier Nana Nzèpa (Cameroon), Prof Dr Arsene Kouadio (Cote d’Ivoire), Dr Lishan Adam (Ethiopia), Dr Godfred Frempong (Ghana), Dr Tim Waema (Kenya), Francisco Mabila (Mozambique), Dr Christoph Stork (Namibia and South Africa), Prof Dr Ike Mowete (Nigeria), Albert Nsengiyumva (Rwanda), Prof Dr Abdoulaye Diagne (Senegal), Dr Ray Mfungahema (Tanzania), Dr FF Tusubira (Uganda) and Sikaaba Mulavu (Zambia).
Series Editor: Alison GillwaldProduction Assistant: Alex Comninos
Towards Evidence Based ICT Policy and Regulation
Summary
This paper is part of a series that contributes to evidence-based Information Communication Technology (ICT) policy formulation and regulation on the continent by providing decision makers with the information and analysis necessary to assess the regulatory impact and policy outcomes of telecommunications reform against actual sector performance.
This paper reports on the fi ndings of the second household and individual user survey of access and usage conducted by Research ICT Africa between 2007 and 2008 across 17 African countries. It builds on the fi rst household survey conducted by RIA in 2004/5 and a number of supply side studies that have demonstrated that across the continent, even where there has been overall sector growth, sector performance has been sub-optimal. For the most part, the primary national policy objective of delivering aff ordable telecommunications access have not been met.
The focus of this paper is to link e-skills to readily available indicators and assess the quality of indicators currently used to capture e-skills. For this purposes an index is constructed from self-reported confi dence levels for a range of typical computing and Internet skills.
This research adds one tile to the overall picture by identifying an indicator that captures e-skills better than existing indicators in use. Indicators and indices are being used by international organisations such as the ITU to benchmark countries and monitor the impact of policy and regulatory interventions. The latest ITU index, ICT Development Index, uses the adult literacy rate and secondary and tertiary gross enrolment ratios to measure e-skills (ITU, 2009).
This paper fi nds that tertiary and secondary enrolment indicators do not capture the stock of individuals with completed secondary or tertiary education but only the projected educational output for the coming years. It would however be the second best indicator. Further, adult literacy captures the number of people with basic education and was not found to be a suitable indicator for e-skills. This is likely due to the fact that those with secondary or tertiary education are literate, yet those with basic literacy but lacking higher education are not able to use ICTs. The stock of citizens with completed secondary or tertiary education is the best indicator for e-skills.
This paper proposes the replacement of indicators used by the ITU, the UN and other institutions to capture e-skills, by the share of population, with completed secondary and tertiary education. This indicator allows one to track more closely e-skills development for diff erent countries and diff erent communities within countries.
www.researchICTafrica.net
Towards Evidence Based ICT Policy and Regulation
ii

Table of Contents
Introduction 1
Why are e-skills important? 6
How e-skills are currently measured 9
Constructing an e-skills index 12
Relationship between e-skills and formal education 16
Links between location of access and employment status and e-skills 20
Indicator for e-skills 23
African e-index 24
Conclusion 27
References 29
Appendix: survey methodology 31
www.researchICTafrica.net
iii

Towards Evidence Based ICT Policy and Regulation
www.researchICTafrica.net
iv

Introduction
While mobile telephony is addressing the gap between those who have voice services and those who do not, the divide between those who are able to access the Internet and the range of enhanced services that have become necessary for eff ective citizenry and consumer participation, and those who are not, has widened. This is borne out by the less than 5% of households with a working Internet connection across the 17 countries surveyed in the 2007- 2008 demand-side survey conducted by
Research ICT Africa (RIA), with most countries below 1%.Internet penetration and usage is uneven across the continent and within countries, though public access appears
to be more pervasive in West and East Africa, most particularly in Nigeria, Tanzania and Kenya. However, with the low home-PC penetration rates across the continent, private access remains very limited, very expensive, and way below the critical mass required for it to impact signifi cantly on the economy and society. Reasons provided by respondents in the survey for not using Internet services or restricted usage relate to perceptions of its unreliability due to poor network quality, limited bandwidth and high costs, or the fact that people with whom respondents wished to communicate were not using the Internet.
The dismal penetration rates for fi xed services and their stagnant growth across the continent, together with their business and urban bias, are unlikely to change in the short to medium term to address problems of accessibility. Prices tend not to be cost based and are either very high or below cost and mask hidden subsidies that make further network investment unfeasible. Most African countries have struggled to attract foreign direct investment to privatise their incumbents or liberalise the market segment. Internet penetration, as a result, remains low, with many countries having statistically insignifi cant numbers of subscribers. Broadband penetration is worse, with minimal penetration in sub-Saharan Africa.
While mobile access to the Internet is punted as the solution to Internet access for Africa, most of the handsets in use on the continent are not enabled even for EDGE and GPRS, not to speak of third generation mobile data services.
Towards Evidence Based ICT Policy and Regulation:
e-Skills
www.researchICTafrica.net
1
Towards Evidence Based ICT Policy and Regulation

FIGURE 1: COMPUTER OWNERSHIP AND INTERNET CONNECTION AT HOME
One of the reasons for the high cost of mobile- or fi xed-Internet service on the continent is the exceptionally high cost of international bandwidth. This is largely because of the monopoly on international gateways held by incumbents in many countries and their dependence on the SAT-3 cable. Membership of the club consortium that operates the undersea cable endorses national exclusivity for their members and restricts even intra-club competition in the provision of bandwidth. Even where there is international gateway competition, competitors are still compelled, in the absence of other options, to link to SAT-3. These monopolistic practices have impacted negatively, not only on the development of the ICT sector, but also, since it is a major input cost of business, on national economies.
* Results for Zambia and Nigeria are extrapolations to the national level but are not nationally representative
Ethiopia
Rwanda
Tanzania
Uganda
Côte d’Ivoire
Burkina Faso
Zambia*
Benin
Mozambique
Cameroon
Senegal
Botswana
Nigeria*
Ghana
Kenya
Namibia
South Africa
Households with combuter
Households with working internet connection
0 2 4 6 8 10 12 14 16 18 20 % in %
0.20.1
0.30.0
1.00.0
1.20.0
1.30.5
1.30.0
1.60.6
1.90.1
3.80.9
4.11.2
4.40.9
4.50.1
5.10.6
5.10.3
5.52.2
11.23.3
14.84.8
www.researchICTafrica.net
2
Towards Evidence Based ICT Policy and Regulation

The primary point of access to the Internet for many people is the Internet Café. Access at work is the main access point in Botswana, Mozambique, Namibia, Tanzania and Uganda. Even in terms of wider access to the Internet, whether at work or at public access points such as cyber cafés, only 15% of adults in the highest scoring country were using the Internet, while in most countries this fi gure was only between 1% and 6%. Interestingly, of those limited numbers of people who are accessing the Internet, most are doing so at least once a week and in many cases daily.
* Results for Zambia and Nigeria are extrapolations to the national level but are not nationally representative
Benin
Botswana
Burkina Faso
Cameroon
Côte d’Ivoire
Ethiopia
Ghana
Kenya
Mozambique
Namibia
Nigeria*
Rwanda
Senegal
South Africa
Tanzania
Uganda
Zambia*
CYBER / Internet, Cafe’
at home or another persons home
at an educational institution or library
using a mobile phone
at work
0.83.9
0.012.0 85.1
1.434.5
0.037.9 31.5
0.25.6
0.37.5 92.0
6.04.2
1.63.5 95.0
7.48.2
8.212.7 84.9
12.930.8
0.023.7 60.0
5.40.9
1.619.3 77.1
10.920.8
14.020.2 65.5
32.135.4
21.7233.3 27.9
30.423.0
6.735.3 24.3
5.93.3
0.65.8 89.0
3.37.9
0.07.6 86.5
11.517.7
0.015.7 70.0
25.333.0
6.632.4 45.9
2.09.6
1.741.7 68.9
3.621.1
2.052.9 51.5
8.812.6
19.646.7 79.1
FIGURE 2: POINTS OF ACCESS FOR THOSE WHO USE THE INTERNET
www.researchICTafrica.net
3
Towards Evidence Based ICT Policy and Regulation
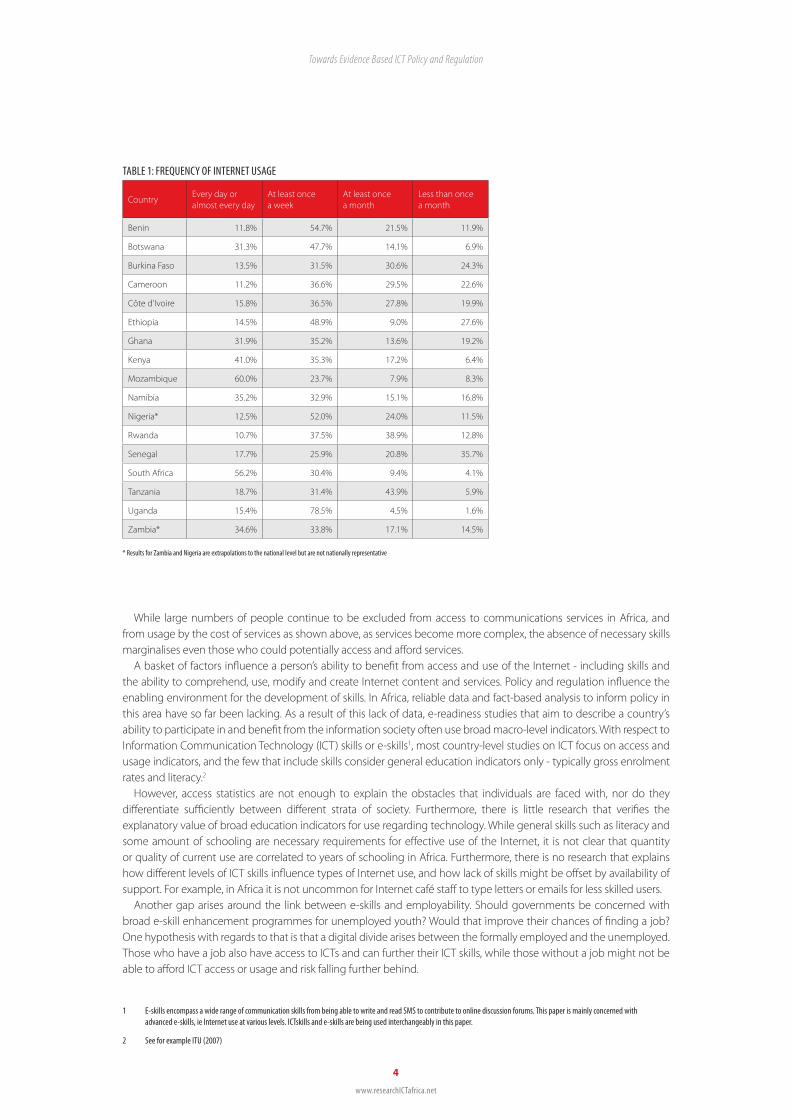
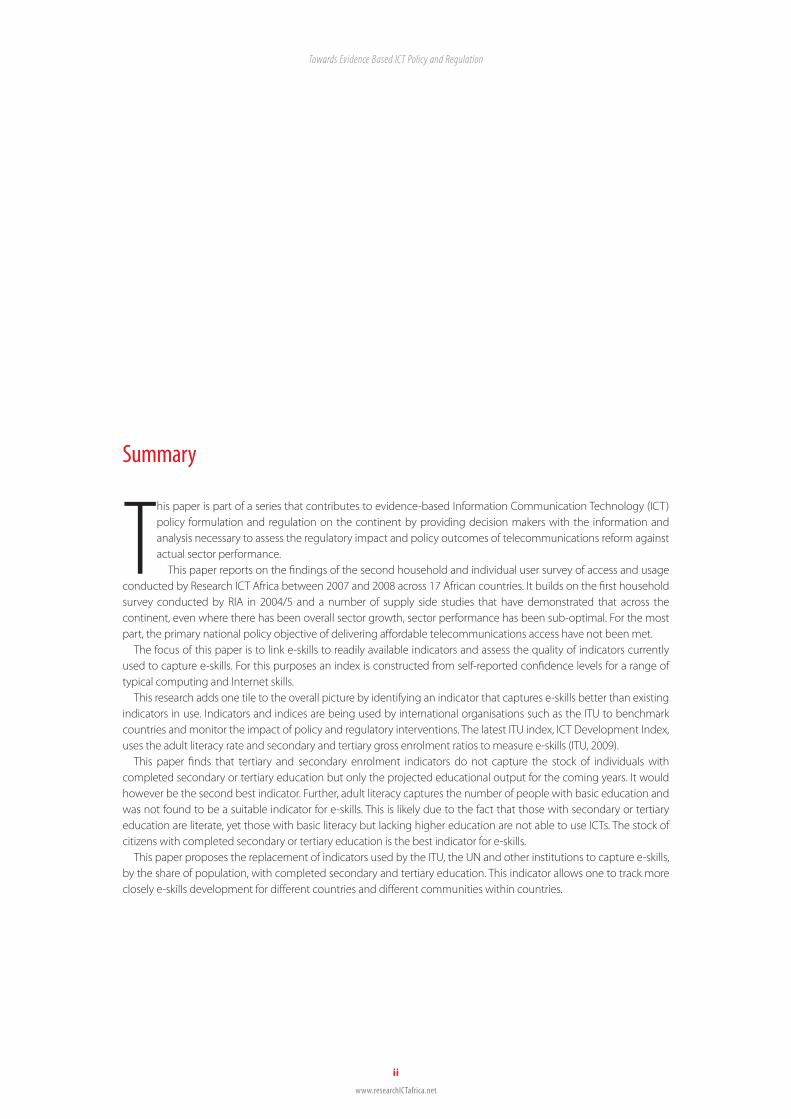
TABLE 1: FREQUENCY OF INTERNET USAGE
CountryEvery day or almost every day
At least once a week
At least once a month
Less than once a month
Benin 11.8% 54.7% 21.5% 11.9%
Botswana 31.3% 47.7% 14.1% 6.9%
Burkina Faso 13.5% 31.5% 30.6% 24.3%
Cameroon 11.2% 36.6% 29.5% 22.6%
Côte d’Ivoire 15.8% 36.5% 27.8% 19.9%
Ethiopia 14.5% 48.9% 9.0% 27.6%
Ghana 31.9% 35.2% 13.6% 19.2%
Kenya 41.0% 35.3% 17.2% 6.4%
Mozambique 60.0% 23.7% 7.9% 8.3%
Namibia 35.2% 32.9% 15.1% 16.8%
Nigeria* 12.5% 52.0% 24.0% 11.5%
Rwanda 10.7% 37.5% 38.9% 12.8%
Senegal 17.7% 25.9% 20.8% 35.7%
South Africa 56.2% 30.4% 9.4% 4.1%
Tanzania 18.7% 31.4% 43.9% 5.9%
Uganda 15.4% 78.5% 4.5% 1.6%
Zambia* 34.6% 33.8% 17.1% 14.5%
While large numbers of people continue to be excluded from access to communications services in Africa, and from usage by the cost of services as shown above, as services become more complex, the absence of necessary skills marginalises even those who could potentially access and aff ord services.
A basket of factors infl uence a person’s ability to benefi t from access and use of the Internet - including skills and the ability to comprehend, use, modify and create Internet content and services. Policy and regulation infl uence the enabling environment for the development of skills. In Africa, reliable data and fact-based analysis to inform policy in this area have so far been lacking. As a result of this lack of data, e-readiness studies that aim to describe a country’s ability to participate in and benefi t from the information society often use broad macro-level indicators. With respect to Information Communication Technology (ICT) skills or e-skills1, most country-level studies on ICT focus on access and usage indicators, and the few that include skills consider general education indicators only - typically gross enrolment rates and literacy.2
However, access statistics are not enough to explain the obstacles that individuals are faced with, nor do they diff erentiate suffi ciently between diff erent strata of society. Furthermore, there is little research that verifi es the explanatory value of broad education indicators for use regarding technology. While general skills such as literacy and some amount of schooling are necessary requirements for eff ective use of the Internet, it is not clear that quantity or quality of current use are correlated to years of schooling in Africa. Furthermore, there is no research that explains how diff erent levels of ICT skills infl uence types of Internet use, and how lack of skills might be off set by availability of support. For example, in Africa it is not uncommon for Internet café staff to type letters or emails for less skilled users.
Another gap arises around the link between e-skills and employability. Should governments be concerned with broad e-skill enhancement programmes for unemployed youth? Would that improve their chances of fi nding a job? One hypothesis with regards to that is that a digital divide arises between the formally employed and the unemployed. Those who have a job also have access to ICTs and can further their ICT skills, while those without a job might not be able to aff ord ICT access or usage and risk falling further behind.
1 E-skills encompass a wide range of communication skills from being able to write and read SMS to contribute to online discussion forums. This paper is mainly concerned with
advanced e-skills, ie Internet use at various levels. ICTskills and e-skills are being used interchangeably in this paper.
2 See for example ITU (2007)
* Results for Zambia and Nigeria are extrapolations to the national level but are not nationally representative
www.researchICTafrica.net
4
Towards Evidence Based ICT Policy and Regulation
The focus of this paper is to link e-skills to readily available indicators and an assessment of the quality of indicators currently used to capture e-skills. For this purposes an index is constructed from self-reported confi dence levels for a range of typical computing skills and its link to formal education is explored. Furthermore the link between being full-time employed and being confi dent about e-skills is being analysed to test whether a digital divide arises through the employment factor.
Why are e-skills important?It is clear that e-skills permit those who have them to participate more eff ectively in the global information economy and society, access opportunities to conduct business or more simply just to engage and transact more effi ciently. Understanding what factors enable some people to optimise these opportunities or adopt new technologies and services is somewhat more complex.
“As more people start using the Web for communication and information retrieval, it becomes less useful to merely look at binary classifi cations of who is online when discussing questions of inequality in relation to the Internet (DiMaggio and Hargittai, 2001). Rather, we need to start looking at diff erences in how those who are online use the medium, that is, diff erences in people’s online skills. It is important to expand the research agenda to allow analyses of the diff erences among Internet users” (Hargittai, 2002).
A set of certain skills (sometimes referred to as digital literacy) is a prerequisite to benefi ting from access to ICTs. The survey results show that a large number of respondents who do not currently use the Internet identifi ed their lack of computer knowledge as a reason for not using it (see Table 2). In 9 of the 17 countries surveyed, lack of skills was the most commonly cited reason for non-usage of the Internet.
Despite the negative eff ect that a lack of skills has on Internet use, measurements that inform policy mostly focus on issues preventing access. Yet access statistics do not explain the “potential inequalities stemming from diff erentiated Internet use” (Hargittai, 2005: 372). Diff erences in skill levels might increase access-related diff erences, and increase the falling behind of those already disadvantaged.
TABLE 2: OBSTACLES TO/REASONS FOR NOT USING THE INTERNET – FROM THOSE WHO KNOW WHAT THE INTERNET IS
CountryI do not have access to a computer
I do not know how to use computers
I do not want to use the Internet
I have no one to send email to
I do not have access to any Internet facilities
I cannot read or write
I cannot aff ord to use the Internet
Benin 48.2% 49.7% 13.1% 10.9% 4.6% 4.3% 2.2%
Botswana 52.7% 17.4% 3.0% 6.0% 63.5% 0.0% 6.9%
Burkina Faso 23.1% 68.9% 2.3% 18.7% 0.6% 4.2% 11.5%
Cameroon 67.0% 66.7% 14.0% 16.5% 50.5% 1.7% 33.8%
Côte d’Ivoire 61.3% 57.0% 3.3% 0.0% 20.1% 1.1% 8.5%
Ethiopia 86.7% 81.1% 2.1% 2.8% 3.8% 1.6% 5.4%
Ghana 49.9% 70.8% 6.3% 25.0% 25.9% 4.9% 7.8%
Kenya 35.0% 40.9% 24.7% 27.9% 37.8% 0.0% 2.2%
Mozambique 68.5% 33.6% 7.1% 20.6% 13.8% 0.3% 7.4%
Namibia 63.2% 15.3% 3.9% 5.2% 38.0% 0.3% 13.5%
Nigeria* 47.0% 48.4% 3.1% 15.5% 30.2% 0.6% 1.6%
Rwanda 28.5% 73.6% 9.6% 23.3% 22.6% 2.1% 9.4%
Senegal 30.3% 54.1% 7.0% 11.7% 18.2% 43.0% 7.6%
South Africa 53.1% 25.4% 8.0% 10.0% 38.1% 0.5% 12.9%
Tanzania 64.6% 71.5% 5.6% 18.9% 19.3% 0.2% 15.4%
Uganda 41.6% 42.1% 1.6% 31.0% 50.2% 2.3% 13.8%
Zambia* 26.7% 20.2% 0.9% 3.4% 70.1% 0.1% 10.4%
Furthermore, the common practice of assuming that ICT access implies users with suffi cient ICT skills (in order to use the technology) leads to a number of potential inaccuracies, including:
* Results for Zambia and Nigeria are extrapolations to the national level but are not nationally representative
www.researchICTafrica.net
5
Towards Evidence Based ICT Policy and Regulation
• Not allowing for the study of which particular skills a user needs to make effi cient use of the Internet, and therefore what factors infl uence development of these skills and what focused strategies (beyond general education) might be needed to support such skills development;
• A binary understanding of usage (using a service or not), excluding qualitative diff erences from analysis. Skill levels are likely to infl uence effi ciency and productivity levels of ICT use. For example, a knowledge worker with lower levels of the required skills might take more time to fi nd appropriate research results online (Hargittai, 2002); • Only considering usage, and not taking into account those potential users who have skills, but do not use the Internet
(Barrantes, 2005).3
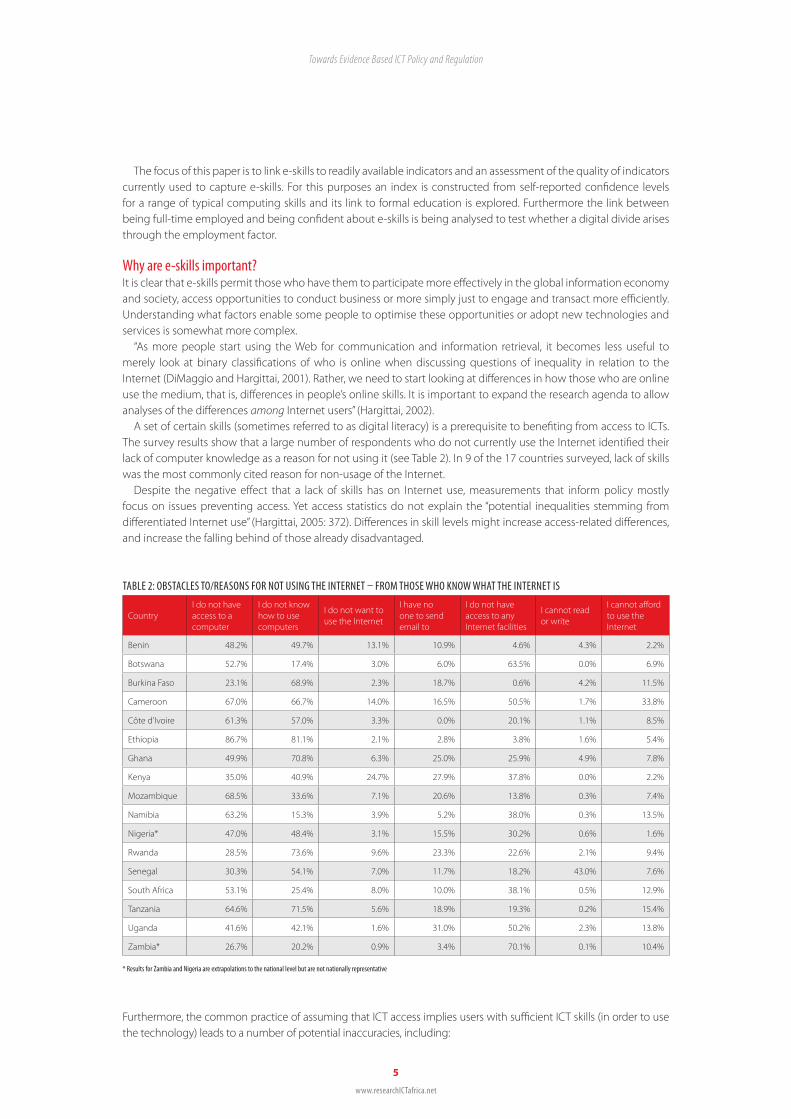
Another missing link is the relationship between ICT skills and the market value of the labour force. Are all skills equally important for job seekers? Or are there some skills that increase the probability of employment more than others? Agricultural contract workers in South Africa are, for example, often required to have a mobile phone. Some companies will send text messages to the workers whenever they are needed. Not being able to operate a mobile phone and to read and write SMSs would exclude a person from employment by those companies. Finally, being able to use technology enables job seekers to access information about employment opportunities and communicate more easily with potential employers.
TABLE 3: ICT AND EMPLOYABILITY
CountryUsing a mobile phone helps me to fi nd jobs
Listening to the radio helps me to fi nd a job
Watching TV helps me to fi nd a job
Benin 51.6% 13.0% 6.5%
Botswana 68.4% 36.7% 34.0%
Burkina Faso 54.2% 40.0% 23.8%
Cameroon 38.0% 23.7% 21.7%
Côte d’Ivoire 5.2% 6.7% 6.3%
Ethiopia 35.9% 2.8% 4.5%
Ghana 58.3% 5.1% 6.0%
Kenya 69.5% 41.1% 35.3%
Mozambique 44.9% 18.8% 30.9%
Namibia 74.7% 50.0% 13.2%
Nigeria* 37.7% 6.0% 6.7%
Rwanda 50.7% 19.5% 34.3%
Senegal 47.7% 4.0% 2.8%
South Africa 55.3% 35.5% 27.3%
Tanzania 52.3% 22.5% 19.5%
Uganda 54.7% 25.5% 15.6%
Zambia* 38.3% 22.4% 27.0%
How e-skills are currently measuredMost e-readiness studies fall into one of three categories with respect to ICT skills and education. They either (i) do not consider ICT skills at all, (ii) interpret use as an indicator of the ability to use (implied presence of necessary skills), or (iii) include widely available education indicators, such as adult literacy.
Though the ITU’s Defi nitions of World Telecommunication/ICT Indicators (April 2007) does not contain any reference to education or skills. The ITU’s Digital Opportunity Index (DOI) 2006 was created with the aim of going beyond the traditional access-focused telecommunications indicators. It is widely used and cited and available for a larger number
3 This is a shortcoming that applies to some degree also to the household survey we draw our data from, but we have designed strategies to deal with this.
* Results for Zambia and Nigeria are extrapolations to the national level but are not nationally representative
www.researchICTafrica.net
6
Towards Evidence Based ICT Policy and Regulation

of countries than any of the other indices. The DOI is a combination of ITU’s previous Digital Access Index (DAI) and Orbicom’s Measuring the Information Society framework, and groups 11 indicators into three areas: opportunity, infrastructure and utilisation. It contains a sub-index on skills, which is calculated from two variables, adult literacy and gross enrolment levels, but does not consider specifi c skills or the current education level of a user.
Orbicom’s Monitoring the Digital Divide framework uses the concept of the ‘infostate’ as a combination of ‘infodensity’ and ‘info-use’. Infodensity is described in the terms of the basic production function, with productive capacity determined by ICT Infrastructure (capital) and ICT Skills (labour). Info-use describes the level and quality of ICT use (but does not consider skills as prerequisites for uptake, only as a factor infl uencing production).4 The Annex on Methodologies states, “[t]he measurement of Infodensity calls for the measurement of ICT capital and ICT skills. No adequate statistical information exists to measure either of these components at a detailed level.” In the absence of such data, the ICT Skills index was constructed from the following four indicators for which data was available: adult literacy, and gross enrolment rates in primary, secondary and tertiary education.5
Although the infostate framework was applied in a joint Orbicom-ITU report “From the Digital Divide to Digital Opportunities, Measuring Infostates for Development” (Sciadas 2005b) and linked to the Plan of Action of the World Summit on the Information Society (WSIS, Geneva 2003) only two of its education indicators were transferred into the DOI as described above.
The OECD’s Directorate for Science and Technology and Industry (DSTI) defi nes 15 Key ICT Indicators from various publications and databases and off ers data for OECD countries, but does not include any indicators for skills or education.
To address the lack of reliable data on the eff ects of ICT on socio-economic development, the Partnership on Measuring ICT for Development was formed in 2004 by many of the most active organisations that had started working in this fi eld, including: ITU, OECD, UNCTAD, the UNESCO Institute for Statistics, the UN Regional Commissions (UNECLAC, UNESCWA, UNESCAP, UNECA), the World Bank, and EUROSTAT.6
In its report on Core ICT Indicators, the Partnership groups indicators into four categories: (i) ICT infrastructure and access; (ii) access to, and use of, ICT by households and individuals; (iii) use of ICT by businesses; and (iv) ICT sector and trade in ICT goods. It recommends that education indicators be collected in ICT surveys (identifying “Highest education level achieved” as one possibility), yet it subsequently eliminated the one indicator that could have included skills variables (the indicator was termed barriers to use) which was described in earlier documents (PMICTD, 2005) (PMICTDb, 2005: 27).
While education and skills have been scarce in the traditional reports of ICT access and use, in the last few years initiatives and projects have noted this, and started addressing it by including readily available education indicators.
The United Nations Statistical Commission reviewed and endorsed the work of the Partnership on Measuring ICT for Development but also “recommended future expansion of the core list to include areas such as government, education and impact measurement” (UNCTAD, 2007).
The EUROSTAT model questionnaire on ICT usage and e-commerce in enterprises (2007) contains a separate module on skills, but does not consider skills at household level (Annexe 3: UNCTAD, 2007).
The World Bank’s Knowledge for Development Program also publishes a set of score cards based on the Knowledge Assessment Methodology (KAM) that allows combinations of 83 variables, and data for 140 countries. The Knowledge Economy Index (KEI), produced by the World Bank, is based on KAM and uses 12 variables to describe a country’s overall preparedness for the Knowledge Economy. Three education variables, secondary and tertiary enrolment rates and adult literacy are included.
The Networked Readiness Index (NRI) was fi rst developed at Harvard University’s Center for International Development and refi ned for use in the Global Information Technology Report published annually by the World Economic Forum and INSEAD. It contains data for a large number of countries (127 countries are covered in the 2007/2008 report) and considers additional education variables. It breaks readiness into three components: (i) environment, (ii) readiness, and (iii) usage. It contains a number of education-related indicators: public expenditure on education and tertiary enrolment. However, the NRI contains a very large number of variables (68 in the latest version), so that the infl uence of particular individual variables becomes relatively small. In addition, two of the education variables were collected through perception surveys, which make reproduction diffi cult (see Goswami 2006 for an in-depth critique of the index).
4 See Sciadas 2005 for the theoretical framework
5 An in-depth review of many more ICT access and use frameworks and initiatives can be found in Sciadas 2004.
6 The Partnership aims: “(i) To agree on a common set of core ICT indicators that are comparable at the international level; (ii) To assist in building the statistical capacity in developing
countries, and (iii) To set up a global database for hosting data on core ICT indicators. See http://new.unctad.org/default____600.aspx
www.researchICTafrica.net
7
Towards Evidence Based ICT Policy and Regulation

The latest ITU index, ICT Development Index, uses adult literacy rate and secondary and tertiary gross enrolment ratios to measure e-skills as well (ITU, 2009).
The common thread that runs through the majority of ICT indices is an understanding of access to ICTs as physical access (and sometimes aff ordability), which does not regard in detail the necessary condition of fundamental skills. Those reports that include education variables (notably the GIRT and the KEI) do so without reliable evidence that the variables selected adequately describe the skills needed to eff ectively use ICTs. This limits the reliability of these reports as policy instruments, especially for developing countries.
The most common measurement of ICT skills is educational attainment. In a study of Internet skills (using both observed capacity and self-reported skills) among US users, Hargittai (2002) fi nds that education is correlated with Internet skills. Furthermore, higher education levels imply more exposure to technology, which increases the ability to adapt more quickly to new technologies, and in many countries educational institutions are the fi rst point of aff ordable access for many users (Kiiski & Pohjola, 2002).
However, using educational attainment as an indicator can have certain weaknesses. First, in those studies that use years of completed schooling, a linear relationship between education level and ICT skills is assumed. This linear relationship has not been tested with respect to breaks in the education system (primary, secondary, tertiary) and their infl uence on ICT skills and usage. In addition, eff orts to use educational attainment generally do not take into account the signifi cant qualitative diff erences of education systems between countries, and especially the strength or weakness of the predictive power of specifi c education indicators with respect to ICT skills. A student who has completed secondary education in Norway has invariably been exposed to computers and the Internet, while her peer in Ethiopia is almost certainly not so lucky. Measuring the ICT skills of both countries using the same indicator in the same way can lead to inaccurate conclusions. Finally, using primary schooling levels focuses on the weaker members of society, who might remain below a potential skills threshold for eff ective use of ICTs. Others have started arguing that secondary and tertiary enrolment are more appropriate indicators, since print literacy, critical thinking skills, and ability to refi ne, produce, and share new knowledge are typically developed at this level (Shaver, 2007), but there has not been any data to support this claim.
Using self-reported confi dence levels to measure e-SkillsAn alternative measure is self-reported confi dence levels, which have become a popular indicator in small-scale studies in developed countries7, but which are typically not available at household level. Some studies go beyond self-reported skills, and observe and test the actual skills of computer users to review the accuracy of self-reported skills. Compared to self-reported skills, Hargittai (2005) fi nds that familiarity with a certain sub-set of technical terms related to the Internet holds slightly stronger explanatory power for actual performance (completing a number of tasks in the lowest possible time), but the diff erence is very small.
For the purposes of this study, an index constructed from self-reported confi dence levels for a range of typical computing skills is used as the dependent variable. The infl uence of a range of potential explanatory factors for ICT skills is tested. The idea is to link e-skills to readily available indicators and assess the quality of indicators currently used to capture e-skills and or to suggest new indicators.
As Hargittai (2005) shows, self-reported skills have slightly lower predictive power than a set of test questions on familiarity with certain concepts. However, she also shows considerable diff erences in the predictive power of certain questions – some work, others don’t and are likely to be culturally biased. Identifying these questions across the 17 countries that were covered by the 2007/2008 RIA ICT Access and Usage Survey would not have been feasible. Instead two e-skills indices are constructed based on the responses to the question in the text box below.
Please rate on a scale from 1 to 5 how confi dent you would feel if you had to carry out the following tasks, with 1 meaning not confi dent at all and 5 very confi dent:
Using a search engine to fi nd information
Using e-mail to communicate
Typing a letter or CV on the computer
Participating in an online discussion forum
Making a call over the Internet
7 see Hargittai 2005 for a list.
www.researchICTafrica.net
8
Towards Evidence Based ICT Policy and Regulation

Cronbach’s alpha was computed to assess whether the responses to the fi ve questions form a reliable scale. The alpha for the fi ve responses was 0.77, which indicates that the items form a scale that has reasonable internal consistency reliability. The alpha could not have been increased by dropping any of the fi ve items and all corrected item-total correlations are above 0.4.
TABLE 4: RELIABILITY TEST OF SELF-REPORTED
Cronbach’s Alpha 0.77
Scale 1 to 5 Mean Std. deviation NCorrected item-total correlation
Cronbach’s Alpha if Item deleted
Using a search engine to fi nd information on the Internet
3.70 1.546 2170 .512 .738
Using e-mail to communicate with others 4.08 1.362 2170 .477 .749
Typing a letter or CV on the computer 3.53 1.685 2170 .569 .719
Participating in an online discussion forum on a topic of your interest
2.56 1.640 2170 .639 .692
Making a call over the Internet 2.29 1.612 2170 .513 .738
Since we have self-reported skills only for those users who use the Internet, we expand the sample when considering all respondents for a second index, by assuming that:• Respondents who do not know what the Internet is have the lowest possible skills score of 0• Respondents who do know what the Internet is, but don’t use it because of lack of skills, have the second lowest
Internet skills score of 1.
The mechanics of the index construction is captured in Table 5.
TABLE 5: E-SKILLS INDICES - ALL AND INTERNET USERS ONLY
Level of e-skills e-skills7 (all individuals 16+) e-skills5 (Internet user only)
Does not know what the Internet is 0 na
Does know what the Internet is 1 na
Does know what the Internet is but does not use it 1 na
Does know what the Internet is and uses it 2 na
How confi dent are you to perform the following tasks:
Rounded averages over all 5 questions: Min 1, Max 5
Rounded averages over all 5 questions: Min 1, Max 5
Using a search engine to fi nd information on the Internet
Using e-mail to communicate with others
Typing a letter or CV on the computer
Participating in online discussion forum on a topic of your interest
Making a call over the Internet
Sum Min 0, Max 7 Min 0, Max 5
www.researchICTafrica.net
9
Towards Evidence Based ICT Policy and Regulation
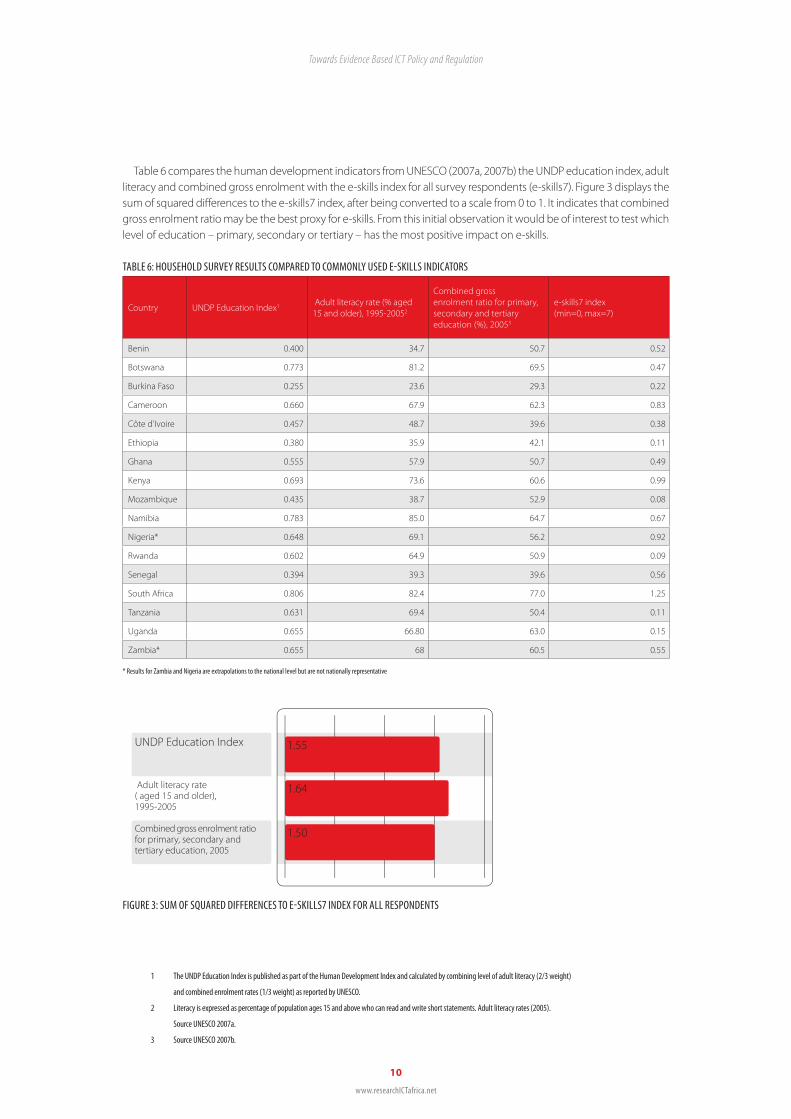
Table 6 compares the human development indicators from UNESCO (2007a, 2007b) the UNDP education index, adult literacy and combined gross enrolment with the e-skills index for all survey respondents (e-skills7). Figure 3 displays the sum of squared diff erences to the e-skills7 index, after being converted to a scale from 0 to 1. It indicates that combined gross enrolment ratio may be the best proxy for e-skills. From this initial observation it would be of interest to test which level of education – primary, secondary or tertiary – has the most positive impact on e-skills.
TABLE 6: HOUSEHOLD SURVEY RESULTS COMPARED TO COMMONLY USED E-SKILLS INDICATORS
Country UNDP Education Index1 Adult literacy rate (% aged 15 and older), 1995-20052
Combined gross enrolment ratio for primary, secondary and tertiary education (%), 20053
e-skills7 index (min=0, max=7)
Benin 0.400 34.7 50.7 0.52
Botswana 0.773 81.2 69.5 0.47
Burkina Faso 0.255 23.6 29.3 0.22
Cameroon 0.660 67.9 62.3 0.83
Côte d’Ivoire 0.457 48.7 39.6 0.38
Ethiopia 0.380 35.9 42.1 0.11
Ghana 0.555 57.9 50.7 0.49
Kenya 0.693 73.6 60.6 0.99
Mozambique 0.435 38.7 52.9 0.08
Namibia 0.783 85.0 64.7 0.67
Nigeria* 0.648 69.1 56.2 0.92
Rwanda 0.602 64.9 50.9 0.09
Senegal 0.394 39.3 39.6 0.56
South Africa 0.806 82.4 77.0 1.25
Tanzania 0.631 69.4 50.4 0.11
Uganda 0.655 66.80 63.0 0.15
Zambia* 0.655 68 60.5 0.55
FIGURE 3: SUM OF SQUARED DIFFERENCES TO E-SKILLS7 INDEX FOR ALL RESPONDENTS
1 The UNDP Education Index is published as part of the Human Development Index and calculated by combining level of adult literacy (2/3 weight)
and combined enrolment rates (1/3 weight) as reported by UNESCO.
2 Literacy is expressed as percentage of population ages 15 and above who can read and write short statements. Adult literacy rates (2005).
Source UNESCO 2007a.
3 Source UNESCO 2007b.
* Results for Zambia and Nigeria are extrapolations to the national level but are not nationally representative
www.researchICTafrica.net
10
Towards Evidence Based ICT Policy and Regulation

Relationship between e-skills and formal educationWe use an ordered logistic regression model (Ologit) to test for the relationship between formal education and the e-skills7 index, since the e-skills7 index can take values from 0 to 7. Ologit models assume logistically distributed error terms. The assumption about the error term is arbitrary and its validity cannot be tested. A model can only be identifi ed once an assumption is imposed on the mean and variance of the error term. This implies that coeffi cients cannot be interpreted directly since they are infl uenced by the necessary assumptions. Changing the assumptions about the error term changes the values of the coeffi cients uniformly (Long, 2006), but it does not aff ect the probability of an event occurring. It aff ects the spread of the distribution but not the proportion of the distribution above or below the threshold (Long, 2006).
TABLE 7: OLOGIT MODEL SPECIFICATION WITH E-SKILLS AS DEPENDENT VARIABLE
Variable Name Type of variable Expected sign Comment
Income (I)Continuous variable: Individual income in US$
PositiveIncome is assumed to be the main barrier to ICT adoption. It is also an indicator of an individual having a job and the type of job (formal or informal) the individual has.
Gender (G)Dichotomous variable: female = 1, male = 0
Not signifi cant The assumption is that there is no gender diff erence when it comes to e-skills.
Age (A) In years Negative
Technology being a domain of the younger generation a negative coeffi cient is expected. Also tertiary education completed in 1960 would have a diff erent impact on e-skills compared to tertiary education completed in 2008. The age variable tries to capture this eff ect together with the educational variables.
Tertiary (T)Highest education tertiary= 1, otherwise 0
Positive
Education should enable individuals to use ICTs, while also being an indicator of income. The model would drop variables if multi-collinearity persists. Having primary education as highest education is likely to lead to negative coeffi cients with respect to e-skills.
Secondary (S)Highest education secondary = 1, otherwise 0
Positive
Primary (P)Highest education primary, remedial or traditional = 1, otherwise 0;
Negative
Full-time employed (FT)
Full-time employed or self-employed = 1, otherwise 0
PositiveSomeone being full-time employed might be required to work with ICTs and hence would build up ICT skills.
Part-time employed (PT)
Part-time employed or self-employed = 1, otherwise 0
Not signifi cantSomeone being employed part-time might also be required to work with ICTs and hence would build up ICT skills. The employment factor is expected to be less signifi cant.
Full-time Student (ST)
Full-time student = 1, otherwise 0
PositiveIndividuals that are 16 years or older and are full-time students would be expected to be taught e-skills and have no income. This variable is therefore crucial to interpret together with income.
Other Urban (OU)
Other urban = 1, else = 0 NegativeThere are fewer ICT facilities like Internet cafés etc. in other urban areas compared to major urban (metropolitan) and other urban areas, and lower e-skills are therefore expected.
Rural Rural = 1, else = 0 NegativeMobile network coverage is less in rural areas compared to urban (major urban and other urban) ones and therefore less adoption is expected.
Constant NegativeCaptures various factors that are either constant for a country, such as the price of Internet access, and serves as reference for dichotomous variables such as the educational and employment variables.
Respondents to the household survey were asked for their highest education level achieved.8 The responses have been spread across three dichotomous variables for highest education, being primary (P), secondary (S) or tertiary (T). Any other education or no education is captured through the constant. Additional variables included in the model are age (A), gender (G), living in a rural area (R) and living in an urban area which is not metropolitan (OU), respondents being full-time (FT), part-time (PT) employed or student (ST) and income in US$.
8 In compliance with the Partnership on Measuring ICT for Development
www.researchICTafrica.net
11
Towards Evidence Based ICT Policy and Regulation

TABLE 8: NATIONALLY REPRESENTATIVE OLOGIT RESULTS FOR EACH COUNTRY
CountryPseudo R2
Prob > Chi2
Positive Coeffi cients + = signifi cant at 0.1 level, ++ = signifi cant at 0.05 level, +++ = signifi cant at 0.01 levelNegative Coeffi cients - = signifi cant at 0.1 level, -- = signifi cant at 0.05 level, --- = signifi cant at 0.01 level
Ns = not signifi cant; Skip = skipped because of multi-collinearity
I G A T S P FT PT ST R OU
Benin 0.3569 0.00 ++ -- -- +++ +++ + Ns Ns Ns --- Ns
Botswana 0.2282 0.00 + -- -- +++ Ns -- Ns Ns +++ Ns Ns
Burkina Faso 0.2891 0.00 Ns -- Ns +++ +++ +++ + Ns +++ - Ns
Cameroon 0.2086 0.00 Ns Ns -- +++ +++ +++ Ns Ms +++ --- ---
Côte d’Ivoire 0.2148 0.00 +++ -- --- +++ +++ Ns Ns + + -- Ns
Ethiopia 0.2936 0.00 ++ Ns Ns +++ +++ Ns Ns Ns Ns --- ---
Ghana 0.1905 0.00 Ns --- --- +++ +++ +++ Ns Ns Ns --- ---
Kenya 0.1806 0.00 Ns --- - +++ ++ Ns Ns Ns ++ --- ---
Mozambique 0.4913 0.00 Ns Ns Ns +++ +++ + ++ Ns ++ --- ---
Namibia 0.2392 0.00 +++ Ns --- +++ +++ Ns Ns Ns Ns --- ---
Nigeria* 0.1000 0.00 ++ Ns Ns +++ ++ Ns ++ Ns +++ --- ---
Rwanda 0.3690 0.00 Ns Ns --- +++ +++ +++ Ns -- -- --- Ns
Senegal 0.3139 0.00 Ns --- --- +++ +++ Ns Ns Ns +++ --- --
South Africa 0.2109 0.00 Ns --- --- +++ +++ Ns +++ Ns Ns --- ---
Tanzania 0.2019 0.00 Ns Ns -- +++ +++ +++ Ns ++ Ns --- -
Uganda 0.2452 0.00 +++ --- Ns Ns Ns + Ns -- + --- ---
Zambia* 0.1025 0.00 +++ Ns --- +++ +++ + Ns Ns Ns Skip Skip
The results show that the model is valid for all 17 countries with pseudo R2 ranging between 0.1 and 0.49. In 16 out of 17 countries the strongest positive and signifi cant eff ect on probability of higher e-skills can be attributed to having completed tertiary education. Having completed secondary education provides less predictive power and was a signifi cant factor for 15 countries.
Hargittai (2002) fi nds that age is inversely related to the ability to fi nd information online. This is confi rmed by the ordered logistic regression results. Age has a negative signifi cant coeffi cient for 12 countries, ie the probability of an individual having e-skills declines with increasing age. In the same study Hargittai shows that users older than 60 are an exception and able to complete certain tasks faster than younger participants. The model fails to shed light on whether the negative age eff ect is limited by level of education attained, but the demographic diff erences between Hargittai’s US participants and respondents from Africa make a similar result highly unlikely.
Gender disadvantages capture diff erences in how women and men are educated, which the education indicators would otherwise not capture. Hargittai (2002) fi nds no clear link between gender and Internet skills, but her study was conducted in a wealthy area of the US that might not exhibit strong gender diff erentials. Our results show that being a woman reduces the probability of high e-skills in nine out of 17 countries.
An interesting fi nding is that the urban or rural location of an individual is not relevant to the possession of e-skills in Botswana, while it is signifi cant for all other countries. A possible explanation could be how rural areas are defi ned by the national census in Botswana compared to the other countries. This will need to be investigated further.
Surprisingly, income is only signifi cant in eight out of 17 countries, with a positive coeffi cient in each. One needs to keep in mind that the coeffi cients do not express marginal variation in the dependent variable, but the eff ect on probabilities of a higher e-skills index. The positive coeffi cient confi rms that higher income individuals have a higher probability of being ICT skilled. The reverse could also be true, i.e individuals can earn a higher income due to higher ICT skills.
The employment status of individuals allows one to predict e-skills in only four out of 17 countries, while being a full-time student increases the chance of higher e-skills in nine countries. Looking at where people access the Internet reveals that the place of work is a very important access point.
* Results for Zambia and Nigeria are extrapolations to the national level but are not nationally representative
www.researchICTafrica.net
12
Towards Evidence Based ICT Policy and Regulation

Link between location of access and employment status and e-skillsFigure 2 shows where Internet users access the Internet. Very few users are accessing the Internet at work in Benin, Burkina Faso, Cameroon, Côte d’Ivoire, Nigeria and Rwanda. Only in Uganda is work access the dominant form of access. A way of testing whether people accessing the Internet through work are more or less skilled then other users is a Mann-Whitney U Mean Rank comparison. The results for all Internet users, not distinguishing by country due to sample size considerations, are provided in Table 9.
TABLE 9: MEAN RANK COMPARISON – INTERNET USERS GROUPED BY ACCESS TO THE INTERNET AT WORK FOR E-SKILLS5 INDEX
Access to the Internet at work N Mean Rank Sum of Ranks
e-skills of Internet users
No 1 634 999.45 1 633 107.5
Yes 533 1 343.19 715 920.5
Total 2 167
Mann-Whitney U 297 312.50
Wilcoxon W 1 633 107.50
Z -11.39
Asymp. Sig. (2-tailed) 0.000
The mean rank comparison confi rms that there is a signifi cant diff erence in ICT skills between those who access the Internet at work and those who access it elsewhere. It shows that people with work access have higher perceived e-skills compared to the others. This is also confi rmed by a Kruskal Wallis Mean Rank test for the e-skills5 index grouped by main activity of individuals during the last six months. The test reveals that full-time employees have on average the highest level of e-skills (see Table 10). Interestingly, Students and pupils have the second highest confi dence level in e-skills providing a possible explanation why income was not a good predictor for e-skills in some countries.
TABLE 10: KRUSKAL WALLIS MEAN RANK TEST – INTERNET USERS BY MAIN ACTIVITY IN LAST SIX MONTHS FOR E-SKILLS5 INDEX
Main activity in the last six months N Mean Rank
Other 448 1 035.66
e-skills of Internet users
Full-time employed 736 1 203.28
Full-time self-employed 270 1 050.30
Student/pupil 716 1 008.90
Total 2 170
Chi-Square 2 667.71
df 3
Asymp. Sig. .000
Using the expanded e-skills7 index for all individuals lets students and pupils 16 years or older overtake full-time employees in e-skills. The diff erence between e-skills7 and e-skills5 is the inclusion of knowledge about the Internet and Internet use. The results for the Kruskal Wallis tests for both indices grouped by main activity hence reveal that students and pupils are more likely to know what the Internet is and make use of it more often than any other group. It further shows that among Internet users the full-time employed have the highest confi dence in their e-skills, most likely founded in continuous exposure to computers and the Internet at work.
www.researchICTafrica.net
13
Towards Evidence Based ICT Policy and Regulation

TABLE 11: KRUSKAL WALLIS MEAN RANK TEST – ALL INDIVIDUALS 16+ GROUPED BY MAIN ACTIVITY IN LAST SIX MONTHS FOR E-SKILLS7 INDEX
Main activity in the last 6 months N Mean Rank
e-skills of individuals 16+
Other 10 691 9 911.66
Full time employed 3 671 13 583.82
Full time self-employed 5 246 10 419.93
Student/pupil 2 838 14 597.60
Total 22 446
Chi-Square 2 667.71
df 3
Asymp. Sig. .000
The Kruskal Wallis Mean Rank test can also be applied to the e-skills7 index grouping by highest education level attained. The results confi rm the obvious: individuals with the highest level of education, being tertiary education, have the highest e-skills on average. It also reveals, however, that individuals whose highest education is vocational are more skilled then those with only secondary education. This is not surprising, since in most instances completion of secondary education, and in some cases even tertiary education (eg charted accountants), is a prerequisite for vocational training.
TABLE 12: KRUSKAL WALLIS TEST MEAN RANK TEST – ALL INDIVIDUALS 16+ GROUPED BY HIGHEST EDUCATION FOR E-SKILLS7 INDEX
Highest Education attained N Mean Rank
e-skills of individuals 16+
None or only pre-school 4 245 8 143.30
Primary traditional or remedial education 7 627 9 208.70
Secondary education 8 211 12 841.43
Tertiary education 1 800 18 202.67
Vocational education 490 14.852.78
Total 22 373
Chi-Square 6 733.54
df 4
Asymp. Sig. .000
Asymp. Sig. (2-tailed) 0.000
Indicator for e-skillsCompletion of either tertiary or secondary education as the highest education level attained is both highly signifi cant and has a strong positive eff ect on probability of high e-skills. Capturing the number of individuals with completed tertiary or secondary education would hence be a better indicator of e-skills than adult literacy or secondary and tertiary enrolment. Tertiary and secondary enrolment indicators do not capture the stock of individuals with completed tertiary or secondary education but only the educational output for the coming years. It would however be the second best indicator. Adult literacy captures the number of people with basic education and would not be a suitable indicator for e-skills. This indicator should be readily available for most countries since completed education is usually captured by census surveys. These results from the survey suggest that indicators used by the ITU, the UN and other institutions that are meant to capture e-skills should be replaced with completed secondary and tertiary education data. These indicators would allow closer tracking of e-skills development for diff erent countries and diff erent communities within countries.
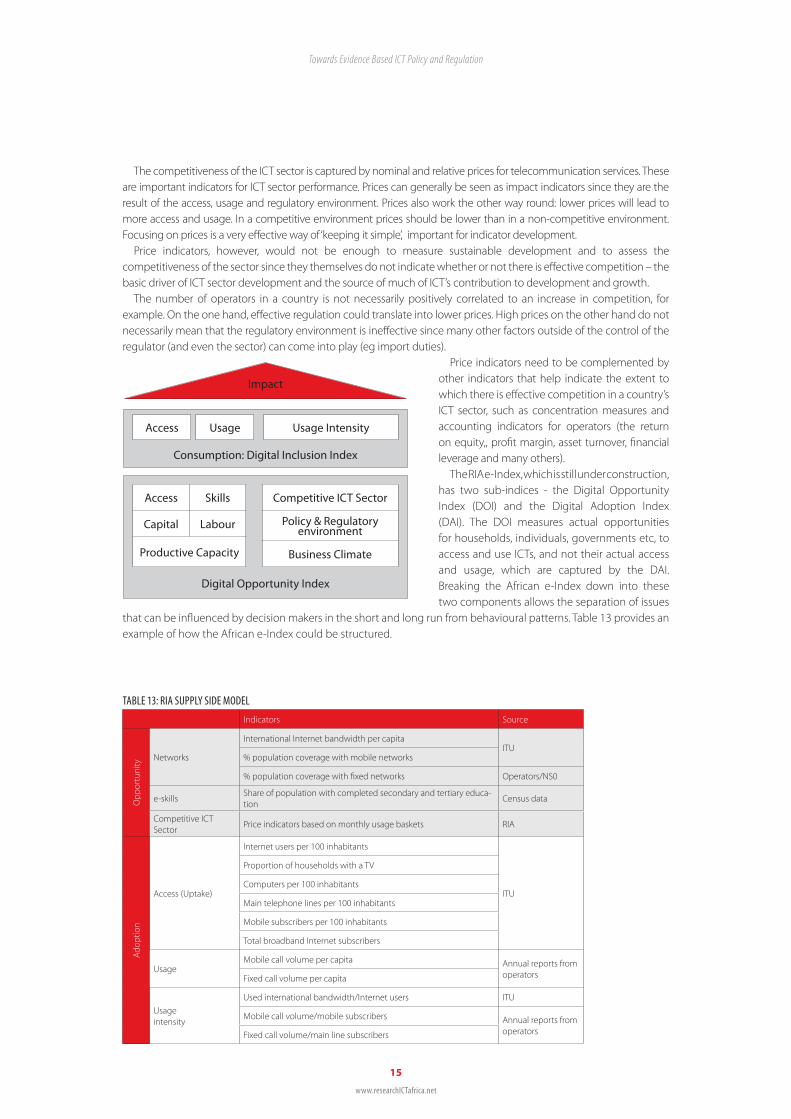
African e-indexCombining indicators into useful indices or models that refl ect the overall state of ICT development and its contribution to eff ective policy formulation is a challenging task. The RIA index is based on the conceptual framework of George Sciadas’s (2005) Infostate Model. The Infostate model explains consumption (access, usage and usage intensity) by productive capital, capital and labour, which translate into Network and Skills. The RIA model extends the Infostate model by a third factor, the policy and regulatory environment, which infl uences the competitiveness of the ICT sector to a large extent.
www.researchICTafrica.net
14
Towards Evidence Based ICT Policy and Regulation
The competitiveness of the ICT sector is captured by nominal and relative prices for telecommunication services. These are important indicators for ICT sector performance. Prices can generally be seen as impact indicators since they are the result of the access, usage and regulatory environment. Prices also work the other way round: lower prices will lead to more access and usage. In a competitive environment prices should be lower than in a non-competitive environment. Focusing on prices is a very eff ective way of ‘keeping it simple’, important for indicator development.
Price indicators, however, would not be enough to measure sustainable development and to assess the competitiveness of the sector since they themselves do not indicate whether or not there is eff ective competition – the basic driver of ICT sector development and the source of much of ICT’s contribution to development and growth.
The number of operators in a country is not necessarily positively correlated to an increase in competition, for example. On the one hand, eff ective regulation could translate into lower prices. High prices on the other hand do not necessarily mean that the regulatory environment is ineff ective since many other factors outside of the control of the regulator (and even the sector) can come into play (eg import duties).
Price indicators need to be complemented by other indicators that help indicate the extent to which there is eff ective competition in a country’s ICT sector, such as concentration measures and accounting indicators for operators (the return on equity,, profi t margin, asset turnover, fi nancial leverage and many others).
The RIA e-Index, which is still under construction, has two sub-indices - the Digital Opportunity Index (DOI) and the Digital Adoption Index (DAI). The DOI measures actual opportunities for households, individuals, governments etc, to access and use ICTs, and not their actual access and usage, which are captured by the DAI. Breaking the African e-Index down into these two components allows the separation of issues
that can be infl uenced by decision makers in the short and long run from behavioural patterns. Table 13 provides an example of how the African e-Index could be structured.
Competitive ICT Sector
Policy & Regulatoryenvironment
Business Climate
Access Skills
Capital Labour
Productive Capacity
Access Usage Usage Intensity
Consumption: Digital Inclusion Index
Digital Opportunity Index
Impact
Indicators Source
Opp
ortu
nity
Networks
International Internet bandwidth per capitaITU
% population coverage with mobile networks
% population coverage with fi xed networks Operators/NS0
e-skillsShare of population with completed secondary and tertiary educa-tion
Census data
Competitive ICT Sector
Price indicators based on monthly usage baskets RIA
Adop
tion
Access (Uptake)
Internet users per 100 inhabitants
ITU
Proportion of households with a TV
Computers per 100 inhabitants
Main telephone lines per 100 inhabitants
Mobile subscribers per 100 inhabitants
Total broadband Internet subscribers
UsageMobile call volume per capita Annual reports from
operators Fixed call volume per capita
Usageintensity
Used international bandwidth/Internet users ITU
Mobile call volume/mobile subscribers Annual reports from operators Fixed call volume/main line subscribers
TABLE 13: RIA SUPPLY SIDE MODEL
www.researchICTafrica.net
15
Towards Evidence Based ICT Policy and Regulation
ConclusionICT indicators are commonly used in policy development frameworks. The most frequent indicators found are supply side access indicators collected by the ITU. These indicators are usually the most easily obtained, which explains their preponderance in ICT measurement literature. A holistic picture needs to be provided for measuring the access, usage and impact of ICTs, rather than just a focus on supply side indicators. This means that diff erent measurement tools such as household surveys, need to be used to inform the selection of easily supply side indicators. In addition, a new set of indicators that would provide information about the eff ectiveness of the regulatory environment and the competitiveness of the ICT sector is proposed for future research. This integrated approach would go some way towards providing useful indicators for measuring ICT progress across countries. The African e-Index sets out a framework to do this.
This research adds one tile to the overall picture by identifying an indicator that captures e-skills well. Indicators and indices are being used by international organisations such as the ITU to benchmark countries and monitor the impact of policy and regulatory interventions. The latest ITU index, ICT Development Index, uses the adult literacy rate and secondary and tertiary gross enrolment ratios to measure e-skills (ITU, 2009).
This paper fi nds that tertiary and secondary enrolment indicators do not capture the stock of individuals with completed secondary or tertiary education but only the projected educational output for the coming years. It would however be the second best indicator. Further, adult literacy captures the number of people with basic education and was not found to be a suitable indicator for e-skills. This is likely due to the fact that those with secondary or tertiary education are literate, yet those with basic literacy but lacking higher education are not able to use ICTs.
The stock of citizens with completed secondary and tertiary education is the best indicator for e-skills. This indicator should be easy to calculate for most countries
since completed education is usually captured by census surveys. Formal employment also seems to be a good indicator for ICT skills even though employment and income were mostly insignifi cant in the Ologit model. The main reason for that is that formal education and formal employment as well as income are likely to be widely overlapping characteristics. Further research would be needed to look into what type of employment and in what sectors would make a good indicator for ICT skills.
This paper proposes the replacement of indicators used by the ITU, the UN and other institutions that are meant to capture e-skills by the share of population with completed secondary and tertiary education. This indicator allows us to track more closely e-skills development for countries and diff erent communities within countries. It also indicates the importance of an integrated education and ICT policy if the objective in most national policies of developing national information societies and knowledge economies is to be met. To reach the critical mass of people with the necessary skills to create such modern social and economic formations national policies will need not only to ensure aff ordable access to Internet services and content, but to co-ordinate these with long term education policies that will ensure the attainment of tertiary education in far greater numbers than is currently the case across the continent.
www.researchICTafrica.net
16
Towards Evidence Based ICT Policy and Regulation

References
Barrantes, R (2005), Analysis of ICT Demand: What is Digital Poverty and How to Measure It? in Digital Poverty: The Latin American
Experience (Galperin H and Maiscal J Eds), Redis-Dirsi, Peru, Nov 2005.
Goswami, D (2006), A Review of the Network Readiness Index, available at http://www.regulateonline.org/content/view/823/74/.
Hargittai, E (1999). Weaving the western web: explaining diff erences in Internet connectivity among OECD countries. Telecommunications
Policy, 23(10-11):701–718, 1999.
Hargittai, E (2002). Second-level digital divide: Diff erences in people’s online skills. First Monday, 7(4), April 2002.
Hargittai, E (2005). Survey Measures of Web-Oriented Digital Literacy. Social Science Computer Review, 23(3):371–379, 2005.
ITU (2006). The Digital Opportunity Index (DOI), World Information Society Report 2006, ITU Geneva, 2006.
ITU (2007). Measuring the information Society, ICT Opportunity Index and World Telecommunication / ICT Indicators, ITU, Geneva, 2007.
ITU (2009). Measuring the Information Society - The ICT Development Index, ITU, Geneva, 2009.
Kiiski, S and Pohjola, M (2002). Cross-country diff usion of the Internet. Information Economics and Policy, (14): 297–310, 2002.
Long, S (1997). Regression Models for Categorical and Limited Dependent Variables, Advanced Quantitative Techniques in the Social
Science Series, Sage Publications, ISBN 0-8039-7374-8.
Long, S. & Freese, J (2006). Regression Models for Categorical Dependent Variables Using Stata, Stata Press, ISBN1-59718-011-4.
OECD (2004). Organisation for Economic Co-operation and Development handbook for internationally comparative education statistics.
OECD Publishing, Paris, 2004.
PMICTD (2005a). Partnership on Measuring ICT for Development - Measuring ICT: The Global Status of ICT Indicators, by The United
Nations Information and Communication Technologies Task Force, New York. http://measuring-ict.unctad.org .
PMICTD Partnership on Measuring ICT for Development (2005b). Core ICT Indicators, UN ESCWA, Beirut. http://measuring-ict.unctad.org
PMICTD Partnership on Measuring ICT for Development (2007). Report of the Partnership to the 38th session of the United Nations
Statistical Commission (27February - 2March2007, New York). E/CN.3/2007/5, http://unstats.un.org/unsd/statcom/doc07/2007-
5e-ICT.pdf
Sciadas, G. (edt.) 2005b, The Digital Divides to Digital Opportunities, Measuring Infostrates for Development, Orbicom: Montreal 2005.
Sciadas, G (2004). International Benchmarking for the Information Society, A background paper for the ITU-KADO Digital Bridges
Symposium, Asia Telecom 2004, Busan, Republic of Korea, September 10 -11 2004.
Sciadas, G (2005). Infostates across countries and over time: Conceptualization, modeling, and measurements of the digital divide,
Information Technology for Development, Vol 11 No 3, Pp 299-304, 2005.
Shaver, L. (2008). Defi ning and measuring access to knowledge: Towards an a2k index. I/S: A Journal of Law and Policy for the
Information Society, 2008.
UNCTAD (2007). Manual for the Production of Statistics on the Information Economy, United Nations, Geneva.
UNESCO (2007a). (United Nations Educational, Scientifi c and Cultural Organization) Institute for Statistics. 2007a. Correspondence on
adult and youth literacy rates. May. Montreal.
UNESCO (2007b). (United Nations Educational, Scientifi c and Cultural Organization) Institute for Statistics. 2007b Correspondence on
gross and net enrolment ratios, children reaching grade 5 and tertiary education. April. Montreal.
Worldbank (2007). Knowledge Economy Index (KEI) 2007 Rankings, World Bank, Knowledge for Development Program, Washington, DC,
available online at http://siteresources.worldbank.org/KFDLP/Resources/461197-1170257103854/KEI.pdf .
WSIS (2003b) “Plan of Action”, Document WSIS-03/GENEVA/DOC/5-E, December 12.
www.researchICTafrica.net
17
Towards Evidence Based ICT Policy and Regulation

Appendix: survey methodology
This paper contains an analysis of representative household-level and individual data on ICT use and access for 17 Africa countries from the 2007/8 RIA e-Access & Usage Household Survey. The data stems from surveys conducted by RIA in 17 African countries during the end of 2007 and the beginning of 2008. The data is nationally representative on a household level for individuals 16 years of age or older except for Nigeria and Zambia (where the data only allows national extrapolations due to sampling protocol violations). The survey was stratifi ed into metropolitan, other urban and rural areas. Enumerator areas (EAs) were sampled for each stratum using probability proportional to size (pps) from national census sample frames. EA sample frames were constructed through listing all households within an EA. Households were then sampled using simple random sampling. The RIA questionnaire was divided in three sections. The fi rst part, the household roster, collected information about all household members. The second part collected household-related information. The head of the household or someone that manages the household answered parts one and two. The third part, the individual section, was answered by an individual, 16 years of age or older, randomly selected from those household members and visitors that slept in the house on the night of the interview.
TABLE 14: RIA SAMPLE
Country Major Urban Other Urban Rural Total
Benin 432 336 333 1 101
Botswana 348 241 229 818
Burkina Faso 416 329 332 1 077
Cameroon 490 347 398 1 235
Côte d’Ivoire 502 312 298 1 112
Ethiopia 1 173 631 551 2 355
Ghana 473 324 295 1 092
Kenya 472 557 432 1 461
Mozambique 562 312 257 1 131
Namibia 311 294 280 885
Nigeria 895 1 012 844 2 751
Rwanda 415 333 330 1 078
Senegal 432 312 337 1 081
South Africa 779 465 527 1 771
Tanzania 634 393 463 1 490
Uganda 436 347 344 1 127
Zambia 405 212 264 881
Total 9 175 6 757 6 514 22 446
www.researchICTafrica.net
18
Towards Evidence Based ICT Policy and Regulation

t h e e d g e i n s t i t u t e
ISSN: 2073-0845