Towards Climate Resilient Cities in the Global South ......Before Pallikaranai Marshland, Chennai...
36
Olga Chepelianskaia | International Consultant |Founder of UNICITI 4th Global Policy Conference (GCPC)| 16 August 2018 Towards Climate Resilient Cities in the Global South: Leveraging on Spatial Planning
Transcript of Towards Climate Resilient Cities in the Global South ......Before Pallikaranai Marshland, Chennai...

Olga Chepelianskaia | International Consultant |Founder of UNICITI
4th Global Policy Conference (GCPC)| 16 August 2018
Towards Climate Resilient Cities in the Global South:
Leveraging on Spatial Planning

40 countries in Asia and Europe| 25 Asian cities| ADB, CDIA, Rockefeller Foundation, UNDP, UNECE, UNEP, UNESCAP
International think tank and consultancyThriving cities harnessing on their unique natural and cultural assets
Sustainable Urban Development | Climate Resilient Urban Planning | Heritage Revival
Policy and governance|Climate Finance|Clean Energy
Rapid urbanisation in the Global South
.
96% of all urbanization by 2030 will occur in the developing world (World Bank, 2014)
0
10
20
30
40
50
60
70
80
90
100
Africa Asia Latin America
Urbanisation Rate
2018 2050

GS cities are major GDP contributors. At the cost of social challenges.
Share of National Population and GDP in Key Cities in Developing Countries
15% global GDP from GS cities (McKinsey Global Institute, 2011)
25.50%
61%
13.40%
Global slum population distribution by region
Africa Asia Latin America
World slum dwellers
2018: 1 billion
2030: 2 billion(UN-HABITAT)

..further exacerbated by climate change
Global distribution of vulnerability to climate change
Combined National Indices of Exposure and Sensitivity
Sea Level RiseIncreasing
temperatures
Water scarcity and
sanitation issuesDisaster
Proneness
Health Risks360 million urban residents live in coastal areas less than 10 meters above
sea level and are vulnerable to flooding and storm surges (World Bank)

Cities – major contributors to climate change
Cities consume
78% of world’s
energy
Cities produce
>70% of global
GHG emissions
“Cities are where the climate battle will be won or lost,” Patricia Espinosa, executive secretary of the U.N. Framework Convention on Climate Change (UNFCCC)
70% of world
population will
be urban by
2050
80% of global
GDP comes
from cities

Cities projected to receive at least 0.5 meters of sea level rise by the 2050s under RCP8.5
Urban poor particularly vulnerable to climate risks and extreme weather events
77% of Latin American population
at risk from sea level rise
live in cities.410 million Asian urban dwellers
at risk of coastal floods by 2025
African cities to suffer
disproportionately as the region
is warming up 1.5 times
faster than the global average.

Natural or man made disasters?
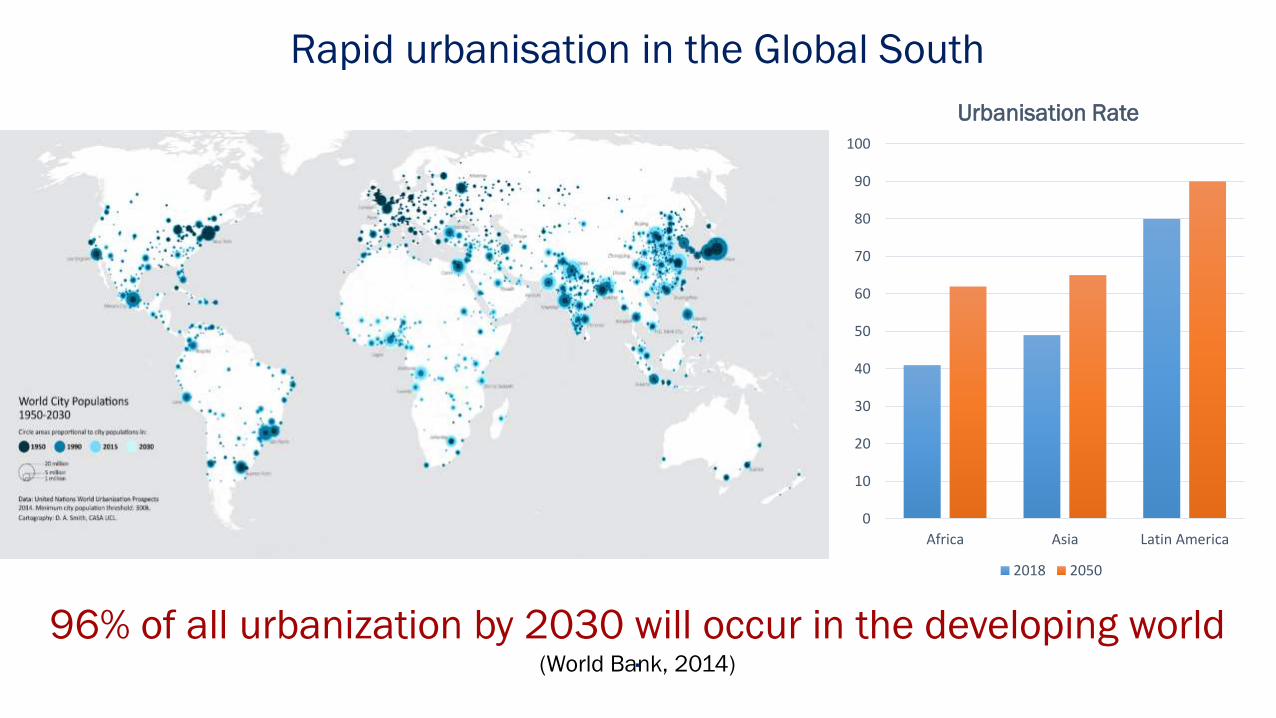
Site for Phoenix mall in 2000
Phoenix mall 2017
Chennai flood 2015 - Largest flood
in 10 years, economic loss of $2.2
billion, 41% of total economic loss in
India due to disasters in 2015.
Chennai lost 90% of its water bodies
over last 40 years
Encroachment of Natural Ecosystems
Chennai floods 2015

IT Corridor
Software industry as well
Before AfterPallikaranai Marshland, Chennai
Software Companies

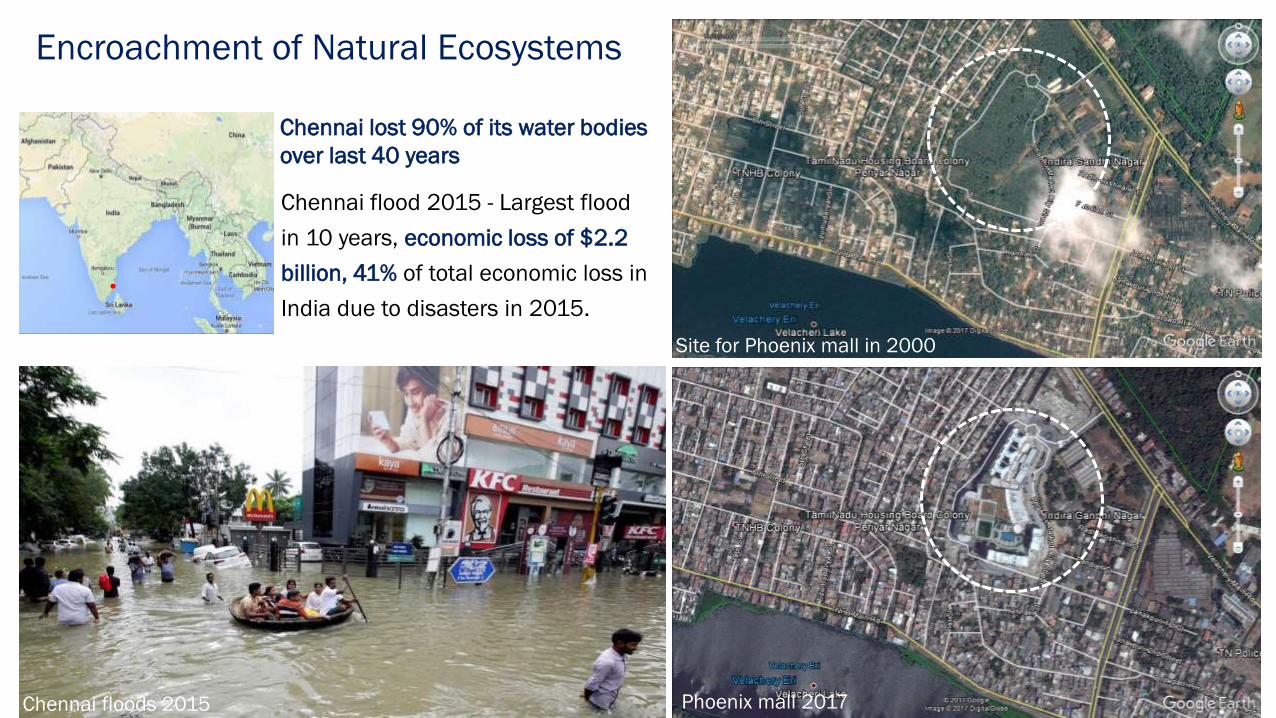
Hat Yai, Thailand
201720102000
Hat Yai DistrictSongkhla ProvinceHat Yai City,
Thailand
• From 1982 to 2002, forest resources
in the basin’s upstream decreased
from 48,281 to 26,781 ha
• An equivalent reduction of 44.5 %
forest cover
• Major floods in 1983, 2000 & 2010
Key role of peri-urban natural ecosystems
U ta phao canal
Nearly 80% land area of Hat Yai is low-lying and
vulnerable to hazards such as heavy precipitations and
sea level rise.
Hat Yai, Thailand
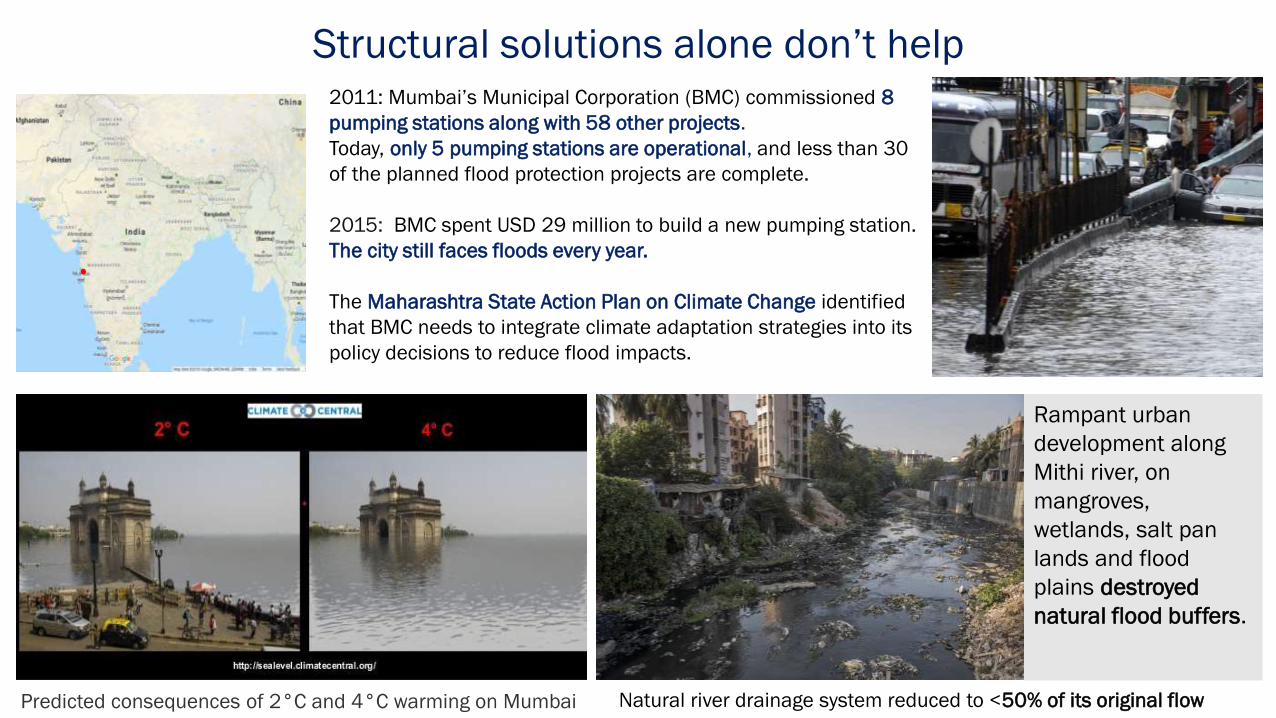
Structural solutions alone don’t help2011: Mumbai’s Municipal Corporation (BMC) commissioned 8
pumping stations along with 58 other projects.
Today, only 5 pumping stations are operational, and less than 30
of the planned flood protection projects are complete.
2015: BMC spent USD 29 million to build a new pumping station.
The city still faces floods every year.
The Maharashtra State Action Plan on Climate Change identified
that BMC needs to integrate climate adaptation strategies into its
policy decisions to reduce flood impacts.
Rampant urban
development along
Mithi river, on
mangroves,
wetlands, salt pan
lands and flood
plains destroyed
natural flood buffers.
Natural river drainage system reduced to <50% of its original flowPredicted consequences of 2°C and 4°C warming on Mumbai
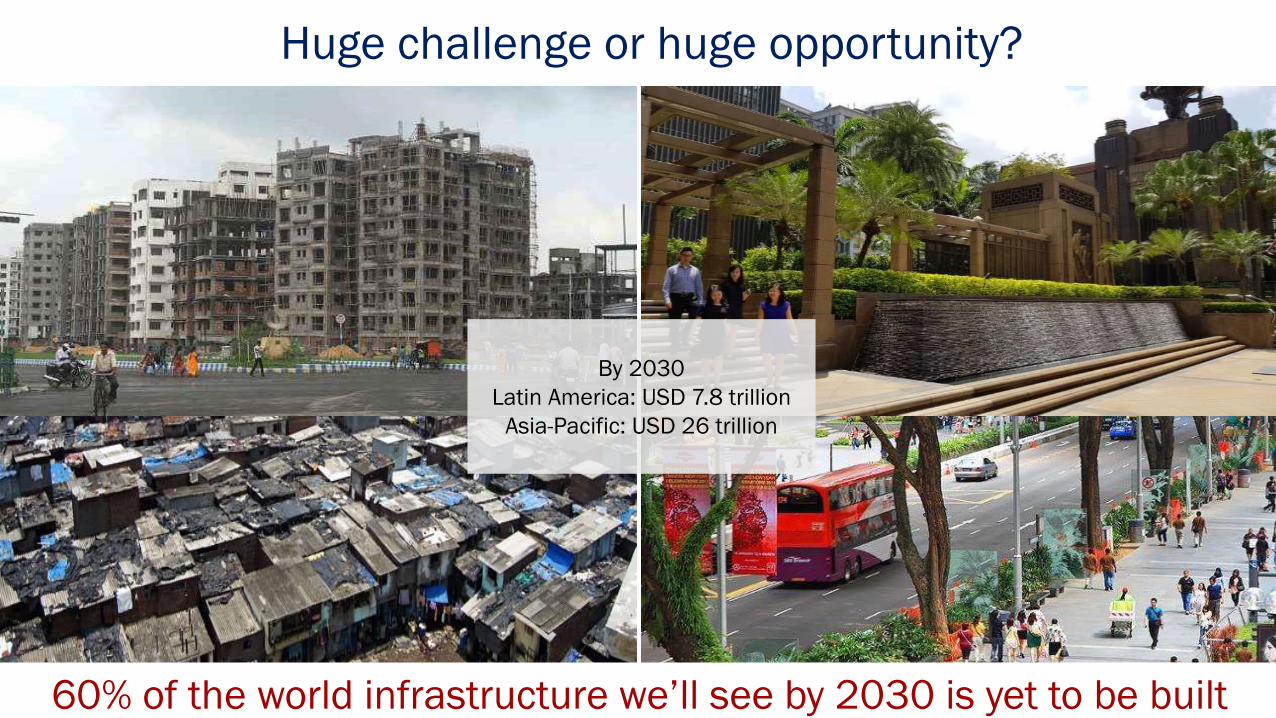
60% of the world infrastructure we’ll see by 2030 is yet to be built
Huge challenge or huge opportunity?
By 2030
Latin America: USD 7.8 trillion
Asia-Pacific: USD 26 trillion
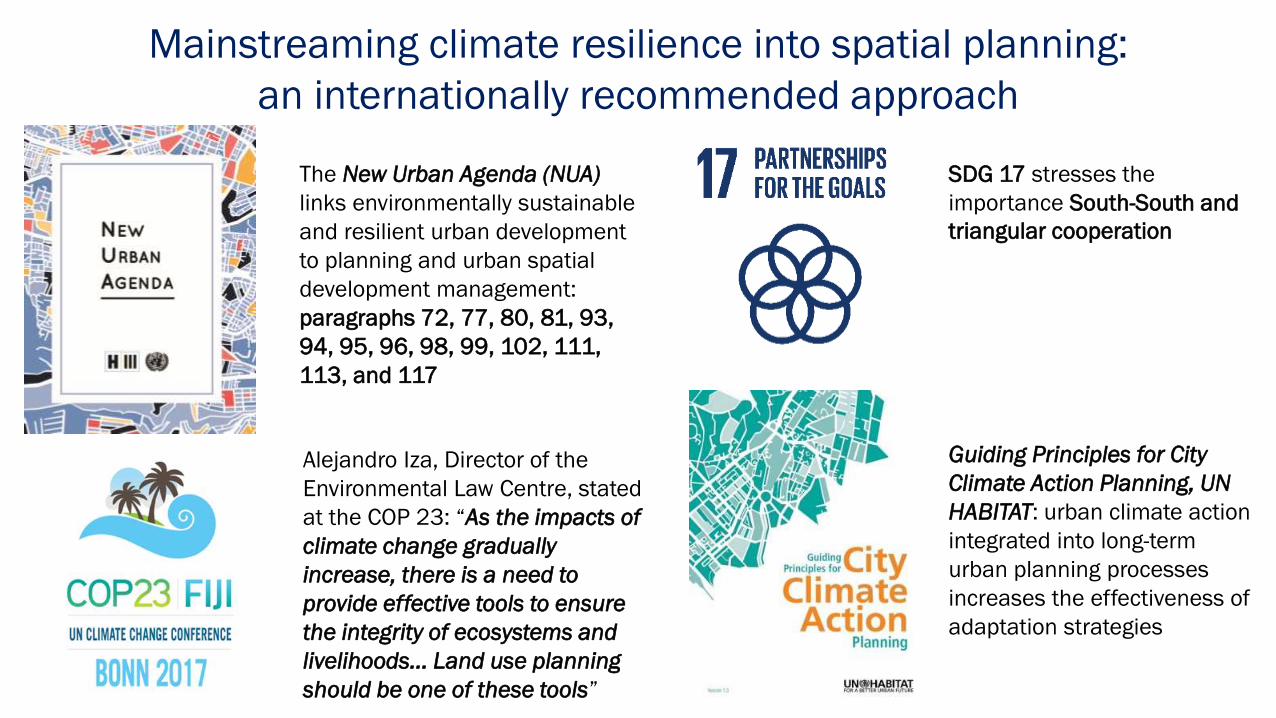
Mainstreaming climate resilience into spatial planning:
an internationally recommended approach
The New Urban Agenda (NUA)
links environmentally sustainable
and resilient urban development
to planning and urban spatial
development management:
paragraphs 72, 77, 80, 81, 93,
94, 95, 96, 98, 99, 102, 111,
113, and 117
Alejandro Iza, Director of the
Environmental Law Centre, stated
at the COP 23: “As the impacts of
climate change gradually
increase, there is a need to
provide effective tools to ensure
the integrity of ecosystems and
livelihoods... Land use planning
should be one of these tools”
Guiding Principles for City
Climate Action Planning, UN
HABITAT: urban climate action
integrated into long-term
urban planning processes
increases the effectiveness of
adaptation strategies
SDG 17 stresses the
importance South-South and
triangular cooperation

Climate resilience through spatial planning:
National policies in Asia

Holistic approach and strict land use regulations: Singapore
Population: 5.6 million
Climate challenges:
Town planning legislated in 1959
Dedicated planning body – Urban
Redevelopment Authority – established
in 1974
All spatial plans and regulations
integrate ecological urbanism and green
strategies to achieve climate resilience
since 1960s
• Concept Plan - integrated land use and
transportation plan to guide city’s
development for 40 to 50 years, reviewed
every 10 years
• Green and blue spaces - nature reserves,
parks and open spaces - protected and
augmented
Annual frequency of days with heavier rainfall
Rainfall rise from 2192mm to 2727mm in 34 yrs
Temperature rise from 26.6°C to 27.7°C in 42 yrs
Sea level rise from 1.2mm to 1.7mm in 34 yrs
Singapore is ranked 1st in ND-GAIN
climate adaptation readiness index

Singapore's green and blue spaces – land use plan 2030.
flood prone area reduced from 3,178 ha in 1970s to only 34 ha in 2013
The green increased from 36% in the 1980s to 47% now
Restored natural river in Bishan park, permeable surfaces, shaded streets,
green and blue spaces, TOD
Active, Beautiful, Clean Waters
(ABC Waters) program
Landscaping for Urban Spaces and
High-rises (LUSH) program
Green Mark Rating scheme
Specific program examples:
Ecosystem based adaptation

Integrating spatial planning into the national climate action program: Taiwan
Population: 23.5 million
Climate challenges:
Annual mean temperature increased by 1.4 °C between 1911
and 2009.
From 1993 to 2003, the sea level rose by 5.7 mm/yr, twice
the rising rate over the past 50 years
New Taipei’s Climate Action Plan (2015) – initial outcomes:
The city is cleaner: in 2018 New Taipei named cleanest city in Taiwan for the
7th consecutive year
The waste volume has decreased: the annual waste volume of New Taipei
reduced from 108.48 tons to 34,19 tons from 2013 to 2016.
Energy saved: electricity saving rate in New Taipei reached 1.24% in 2015.
Smart Transport: Share of citizens using public transportation increased from
25% to 34% in 2103-2016.
Ecosystems conservation: Freshwater conservation areas (blue belt) with
woodlands and grasslands (green belt) demarcated
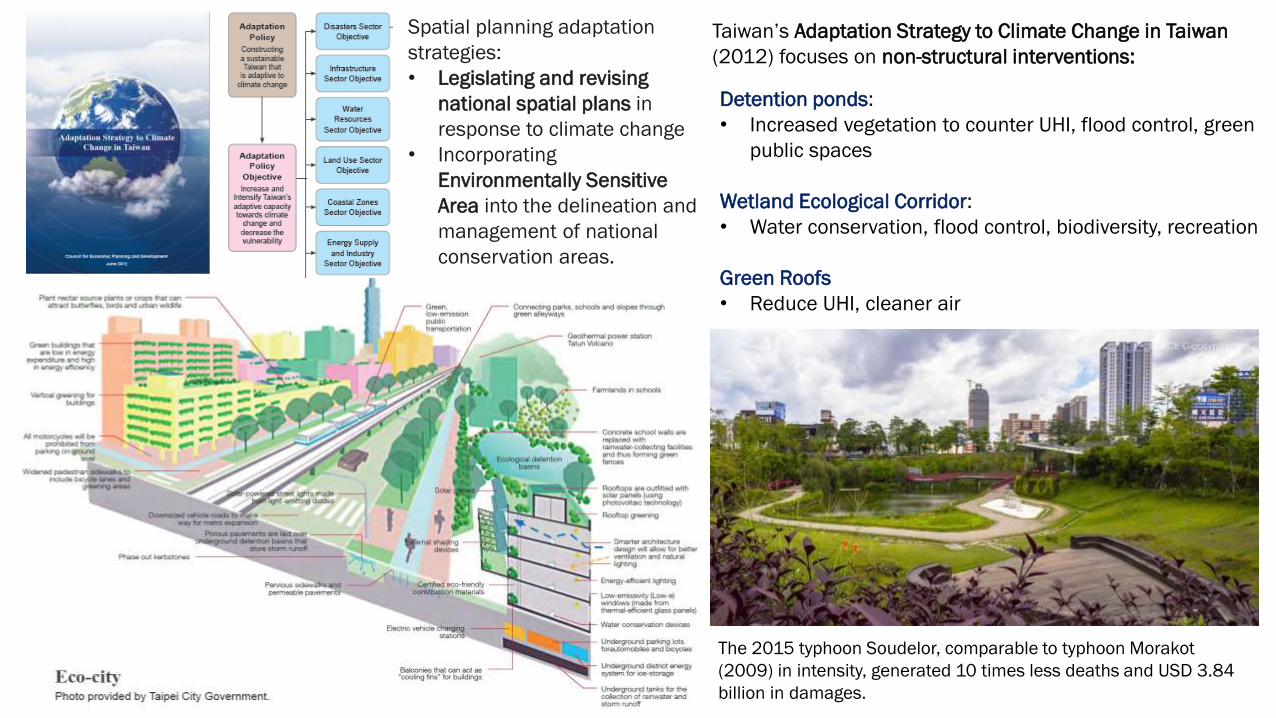
Taiwan’s Adaptation Strategy to Climate Change in Taiwan
(2012) focuses on non-structural interventions:
The 2015 typhoon Soudelor, comparable to typhoon Morakot
(2009) in intensity, generated 10 times less deaths and USD 3.84
billion in damages.
Detention ponds:
• Increased vegetation to counter UHI, flood control, green
public spaces
Wetland Ecological Corridor:
• Water conservation, flood control, biodiversity, recreation
Green Roofs
• Reduce UHI, cleaner air
Spatial planning adaptation
strategies:
• Legislating and revising
national spatial plans in
response to climate change
• Incorporating
Environmentally Sensitive
Area into the delineation and
management of national
conservation areas.
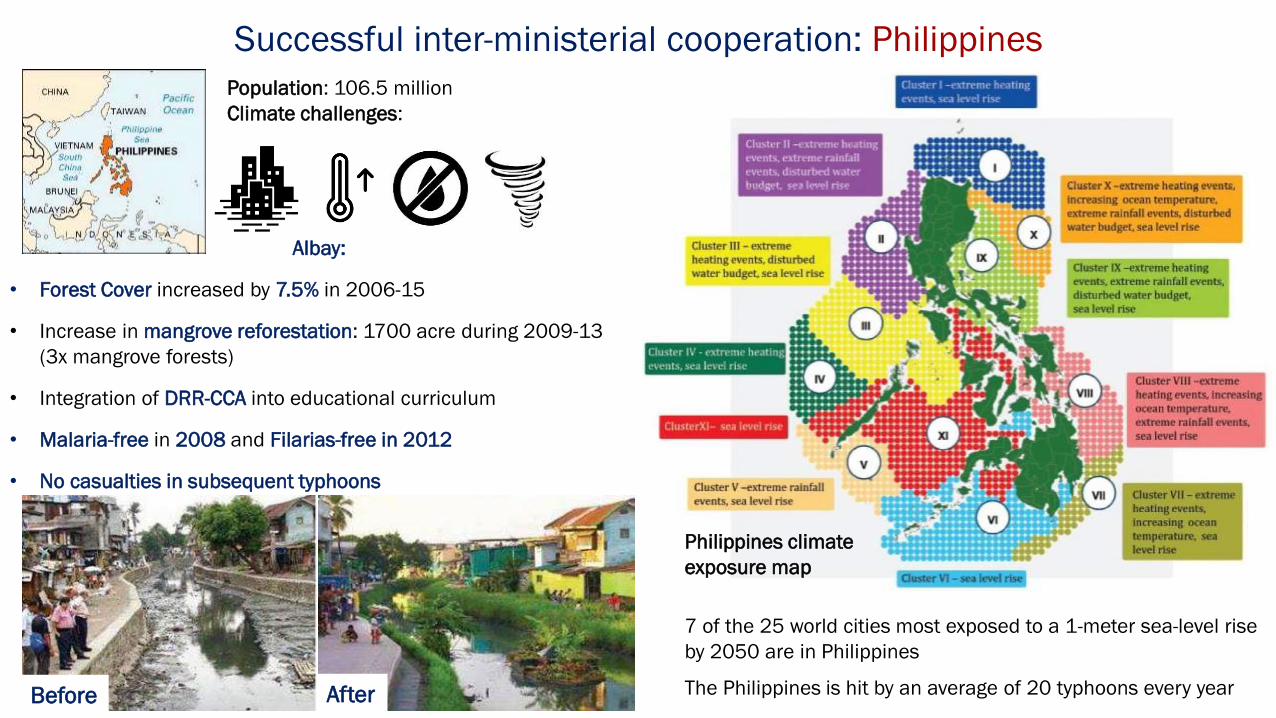
Successful inter-ministerial cooperation: Philippines
Population: 106.5 million
Climate challenges:
Albay:
• Forest Cover increased by 7.5% in 2006-15
• Increase in mangrove reforestation: 1700 acre during 2009-13
(3x mangrove forests)
• Integration of DRR-CCA into educational curriculum
• Malaria-free in 2008 and Filarias-free in 2012
• No casualties in subsequent typhoons
Before After
7 of the 25 world cities most exposed to a 1-meter sea-level rise
by 2050 are in Philippines
The Philippines is hit by an average of 20 typhoons every year
Philippines climate
exposure map
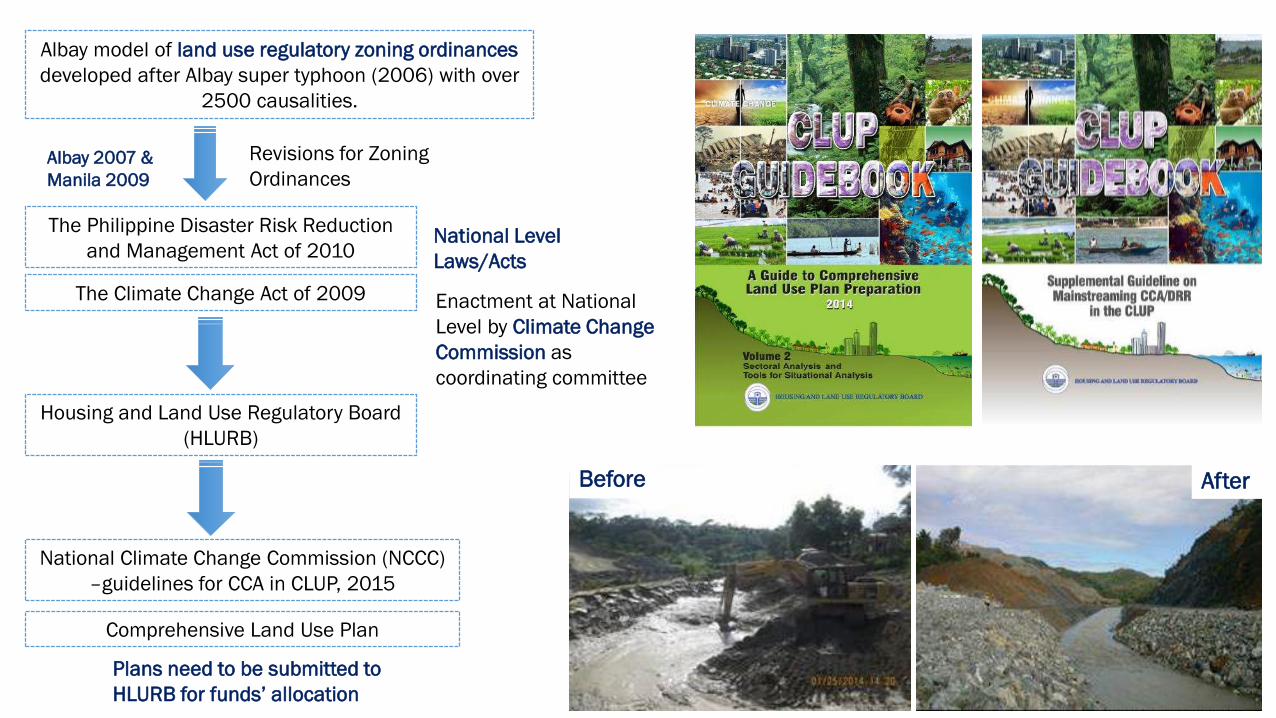
Albay model of land use regulatory zoning ordinances
developed after Albay super typhoon (2006) with over
2500 causalities.
The Philippine Disaster Risk Reduction
and Management Act of 2010
The Climate Change Act of 2009
National Level
Laws/Acts
Albay 2007 &
Manila 2009
Revisions for Zoning
Ordinances
Enactment at National
Level by Climate Change
Commission as
coordinating committee
Housing and Land Use Regulatory Board
(HLURB)
Comprehensive Land Use Plan
Plans need to be submitted to
HLURB for funds’ allocation
Before After
National Climate Change Commission (NCCC)
–guidelines for CCA in CLUP, 2015

Climate resilience through spatial planning:
City level policies in Latin America
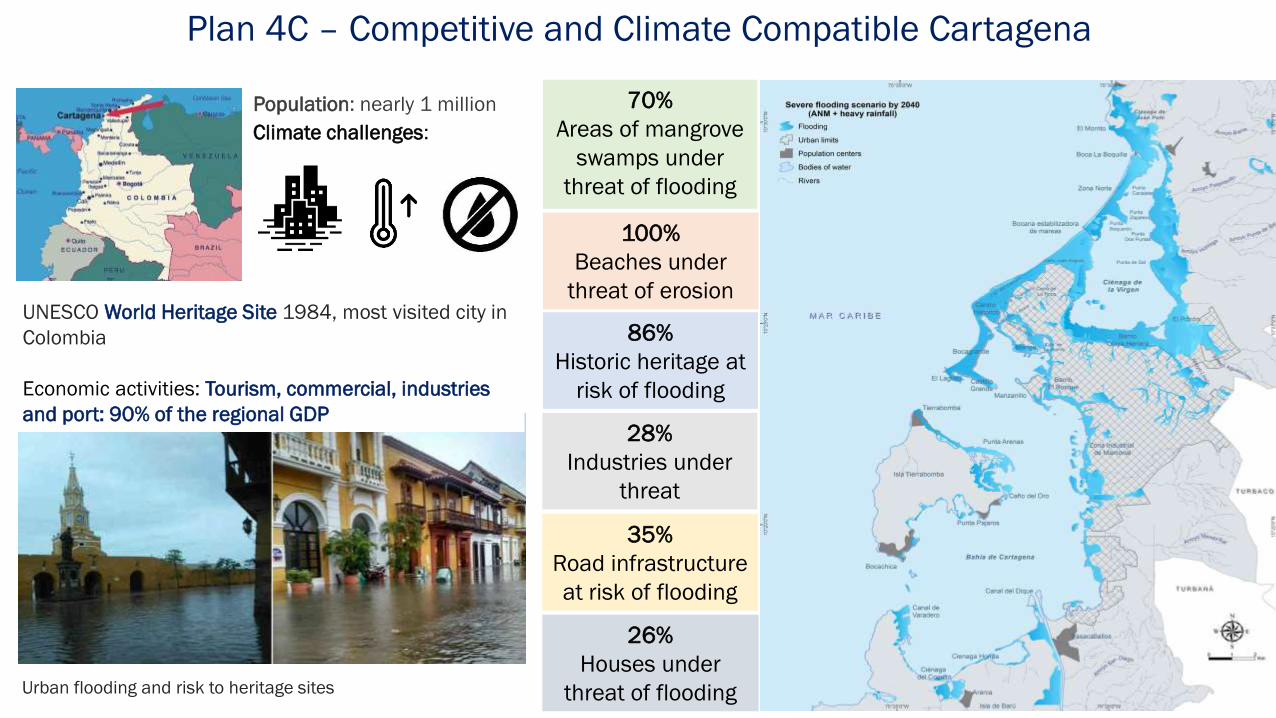
Population: nearly 1 million 70%
Areas of mangrove
swamps under
threat of flooding
100%
Beaches under
threat of erosion
86%
Historic heritage at
risk of flooding
28%
Industries under
threat
35%
Road infrastructure
at risk of flooding
26%
Houses under
threat of flooding
Climate challenges:
Urban flooding and risk to heritage sites
Plan 4C – Competitive and Climate Compatible Cartagena
UNESCO World Heritage Site 1984, most visited city in
Colombia
Economic activities: Tourism, commercial, industries
and port: 90% of the regional GDP

Plan 4C – Competitive and Climate Compatible Cartagena
First coastal city in Columbia to create long-term vision for climate
resilient development. Key principles:
• Ecosystem-based adaptation
• Climate compatible ports and industries;
• Tourism sector committed to climate change;
• Protection of historic heritage;
• Neighbourhoods adapted to climate change;
Plan 4C-comprehensive local
level climate action plan
adopted in 2009
Promotion of ecosystem
based adaptation and
urban planning
Resilient ecosystems
Protection of assets of
cultural interest from
climate change
Greener historic center and
buffer areas with reduced
emissions
Natural green and blue axes plan of the Cartagena de Indias district.
Mangroves protection
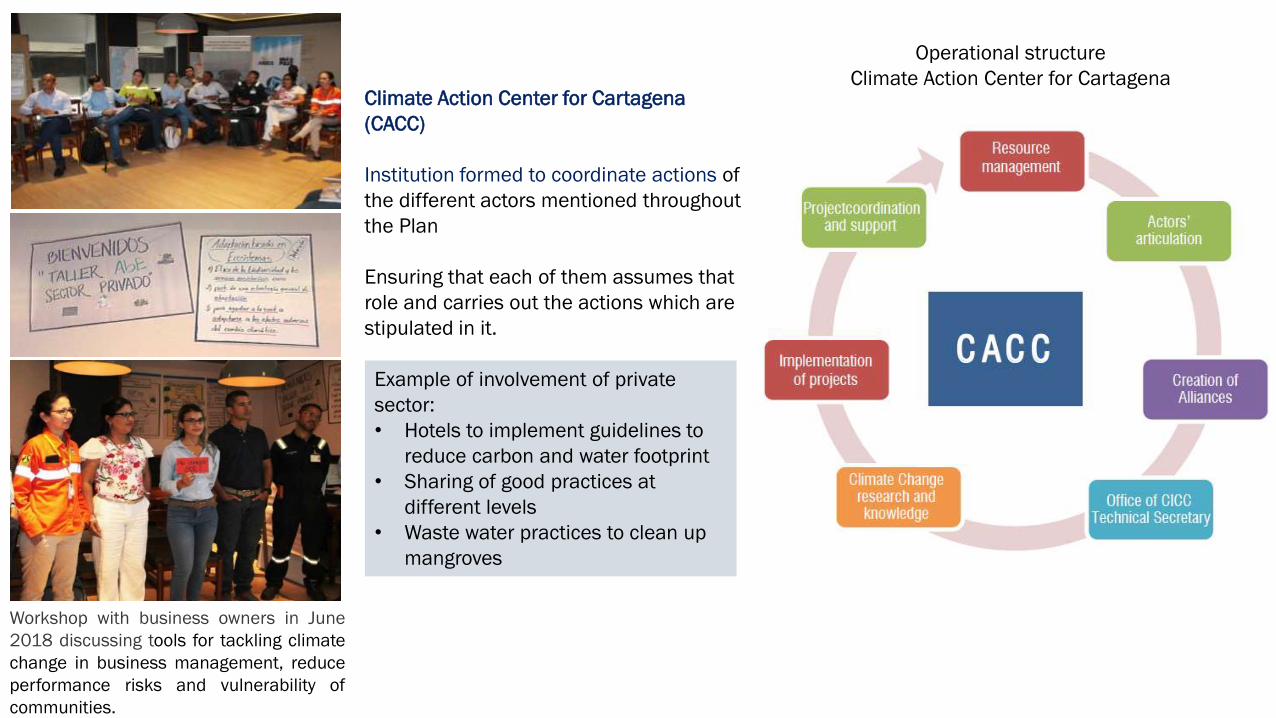
Workshop with business owners in June
2018 discussing tools for tackling climate
change in business management, reduce
performance risks and vulnerability of
communities.
Operational structure
Climate Action Center for CartagenaClimate Action Center for Cartagena
(CACC)
Institution formed to coordinate actions of
the different actors mentioned throughout
the Plan
Ensuring that each of them assumes that
role and carries out the actions which are
stipulated in it.
Example of involvement of private
sector:
• Hotels to implement guidelines to
reduce carbon and water footprint
• Sharing of good practices at
different levels
• Waste water practices to clean up
mangroves

Actors of the Inter-Institutional Commission of Climate Change for Cartagena de Indias

Mainstreaming Climate Resilience into Local Spatial Planning
Medellin, Colombia: Green Belt plan, 2012
1. ‘protection zone’ preserves natural hillside
ecosystems;
2.‘transition zone’ includes new parks, bike paths and
risk management infrastructure;
3. ‘consolidation zone,’ re-conquers the valley with new
parks, multi-family housing and multi-modal
transportation networks.
Recife, Brazil: Municipal Green Roof Law (18.112/15),
2014
Roofs of buildings over 4 floors and commercial
buildings >400 m2 to be covered with native vegetation.
Green Building Certification Scheme (2016) for rainwater
capture, energy efficiency, sustainable design, and use
of recyclable materials in buildings
Urban sprawl and concrete jungle urban development model
for the Global South?
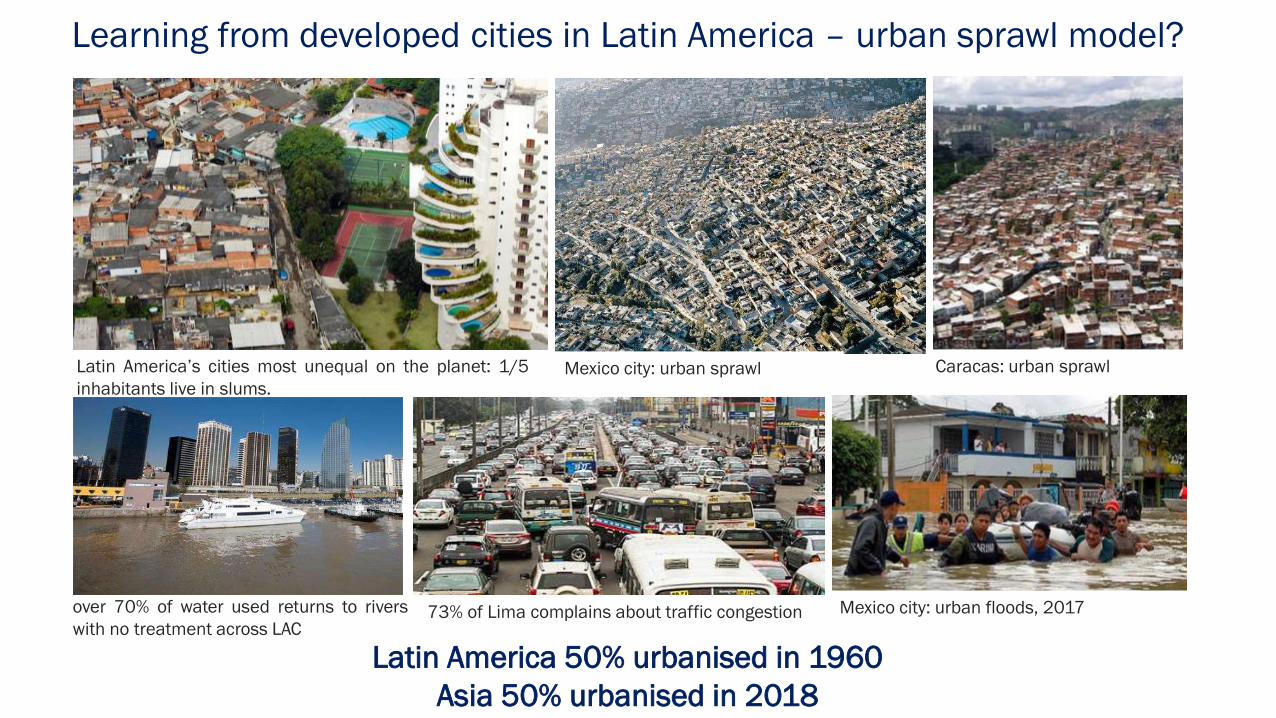
Learning from developed cities in Latin America – urban sprawl model?
Latin America 50% urbanised in 1960
Asia 50% urbanised in 2018
Latin America’s cities most unequal on the planet: 1/5
inhabitants live in slums.
Mexico city: urban floods, 2017
Mexico city: urban sprawl
73% of Lima complains about traffic congestionover 70% of water used returns to rivers
with no treatment across LAC
Caracas: urban sprawl

Site for Phoenix mall in 2000
Phoenix mall 2017
Urban sprawl and concrete jungle: an aspiration?
Sao Paulo
Population: 22 million
Urban sprawl: explosive suburban growth – from
200,000 to 8,4 million people since 1950
Green coverage:
• loss of 53km2 between 1990 and 2000
• 2.6 m2 green space per capita (WHO
recommends 9m2)
Water stress: amongst top 10 cities likely to run out
of water (deforestation and increased concrete/
asphalt surfaces)
Air pollution: 5000 premature deaths and US$15.1
billion losses annually

Annual infrastructure investments till 2030 (ADB)
Developing Asia: $1.7 trillion
Africa $130-170 billion
Forecasted urban population growth 2010-2050
Governments to take critical decisions
that will determine the future of their cities
for decades

Conclusions
1. National policies are key to leverage on spatial
planning for climate resilience
2. Local leadership can transform the city.
UN-Habitat National
Urban Policy process
to mainstream
climate resilience into
spatial planningMayor Aníbal Gaviria of Medellin announced
the construction of 46 mile long
Metropolitan Green Belt (Jardin Circunvalar)
in 2012.
4. Learning from grown cities to take the right
decisions
3. Multi stakeholder engagement, simplified administrative
hierarchies and adequate distribution of responsibilities
Enrique Peñalosa, Mayor of Bogotá,
shifted city’s policy from car oriented to
transit oriented in late 1990s.
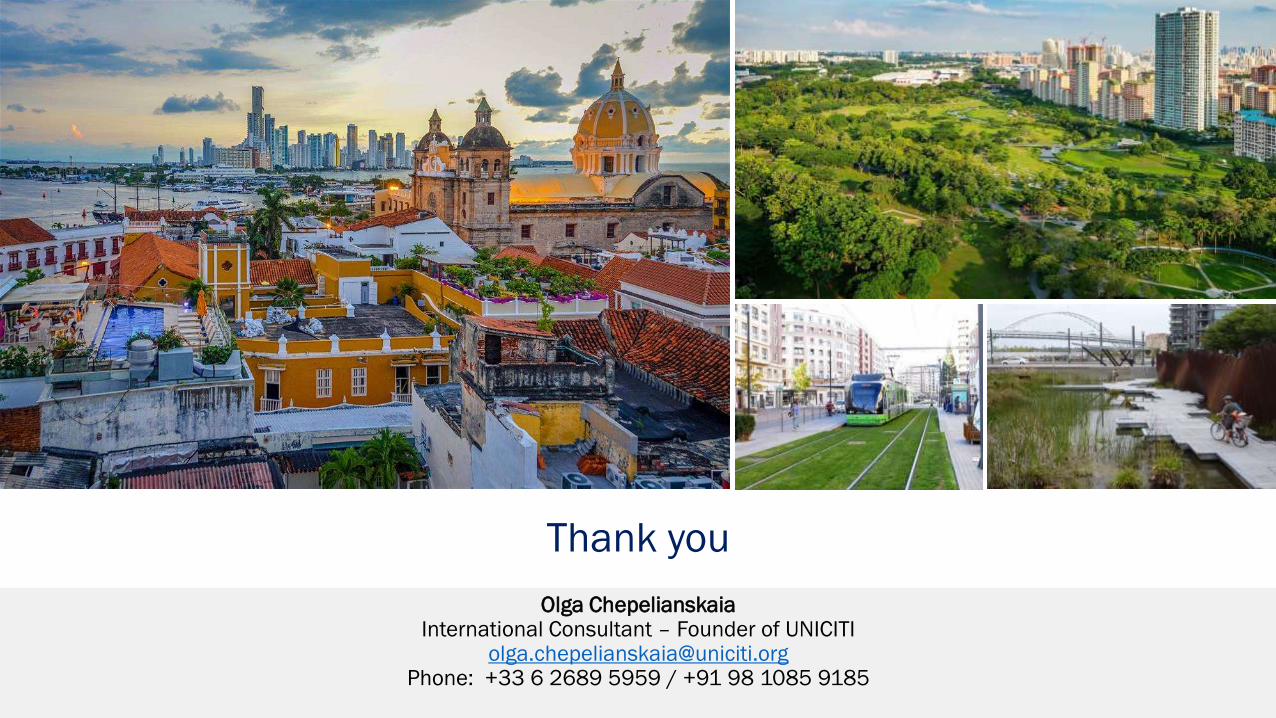
Thank you
Olga ChepelianskaiaInternational Consultant – Founder of UNICITI
[email protected]: +33 6 2689 5959 / +91 98 1085 9185

Notre Dame Global Adaptation Index- Climate Change Readiness map
ND-GAIN Readiness
measures a country’s
ability to leverage
investments and
convert them to
adaptation actions.
Global South is least
ready for climate
adaptation.

Climate finance approved for explicitly urban projects 2010-14, by country and income level (in USD millions)