Towards achieving the Sustainable Development Goals in the ... · Sustainable Development Goal...
104
Towards achieving the Sustainable Development Goals in the UNECE region A statistical portrait of progress and challenges
Transcript of Towards achieving the Sustainable Development Goals in the ... · Sustainable Development Goal...
Towards achieving the Sustainable Development Goals in the UNECE region
A statistical portrait of progress and challenges
UNITED NATIONS ECONOMIC COMMISSION FOR EUROPE
Towards achieving the Sustainable Development Goals
in the UNECE region
A statistical portrait of progress and challenges
United Nations Geneva, 2020

3
Foreword
In the first five years since signing the 2030 Agenda for Sustainable Development, UNECE countries have taken action to integrate the Goals and targets into their national development plans and to align policies and institutions with them. The system of measuring the implementation of the Agenda has also developed, with increasing availability of data on Sustainable Development Goal indicators.
2020 marks the beginning of the Decade of Action and Delivery for Sustainable Development, the United Nations Secretary-General’s initiative that calls for accelerating action by mobilizing all actors, raising ambition, and finding and applying solutions that bring results. Reviewing the progress achieved so far is essential for understanding how to better focus such actions.
This first UNECE regional report on Sustainable Development Goals therefore arrives at a key junction of the follow-up and review of the 2030 Agenda. It describes the levels and trends of selected indicators relevant for the region, and highlights challenges in measuring, to inform the Regional Forum on Sustainable Development in the UNECE region (Geneva, 19 March 2020). The UNECE Statistical Division led the preparation of the report.
The findings show many areas where UNECE countries have achieved good progress as well as those where the region is not yet advancing at the speed or scale required and where decisive action is needed to accelerate progress.
It is expected that the information in this report will be valuable for member countries in the follow-up and review of the 2030 Agenda for Sustainable Development.
4
Contents
Introduction................................................................................................................................................................ 5 Why this report? ..................................................................................................................................... 8 Statistics for SDGs in the UNECE region ........................................................................................ 8 Indicators and data sources ............................................................................................................... 9
Summary of findings ............................................................................................................................................ 10 Goal 1: End poverty in all its forms everywhere ........................................................................................ 14 Goal 2: End hunger, achieve food security and improved nutrition and promote
sustainable agriculture ...................................................................................................................... 19 Goal 3: Ensure healthy lives and promote well-being for all at all ages .......................................... 21 Goal 4: Ensure inclusive and equitable quality education and promote lifelong learning
opportunities for all ............................................................................................................................ 34 Goal 5: Achieve gender equality and empower all women and girls ................................................ 40 Goal 6: Ensure availability and sustainable management of water and sanitation for all ......... 46 Goal 7: Ensure access to affordable, reliable, sustainable and modern energy for all ............... 54 Goal 8: Promote sustained, inclusive and sustainable economic growth, full and
productive employment and decent work for all.................................................................... 57 Goal 9: Build resilient infrastructure, promote inclusive and sustainable industrialization
and foster innovation ......................................................................................................................... 63 Goal 10: Reduce inequality within and among countries ...................................................................... 70 Goal 11: Make cities and human settlements inclusive, safe, resilient and sustainable ............. 74 Goal 12: Ensure sustainable consumption and production patterns ................................................ 76 Goal 13: Take urgent action to combat climate change and its impacts ........................................ 81 Goal 14: Conserve and sustainably use the oceans, seas and marine resources for
sustainable development ................................................................................................................. 83 Goal 15: Protect, restore and promote sustainable use of terrestrial ecosystems,
sustainably manage forests, combat desertification, and halt and reverse land degradation and halt biodiversity loss ........................................................................................ 86
Goal 16: Promote peaceful and inclusive societies for sustainable development, provide access to justice for all and build effective, accountable and inclusive institutions at all levels .............................................................................................................................................. 86
Goal 17: Strengthen the means of implementation and revitalize the Global Partnership for Sustainable Development ......................................................................................................... 95
Closing remarks ................................................................................................................................................... 102 Acronyms and abbreviations .......................................................................................................................... 103
5
List of Figures
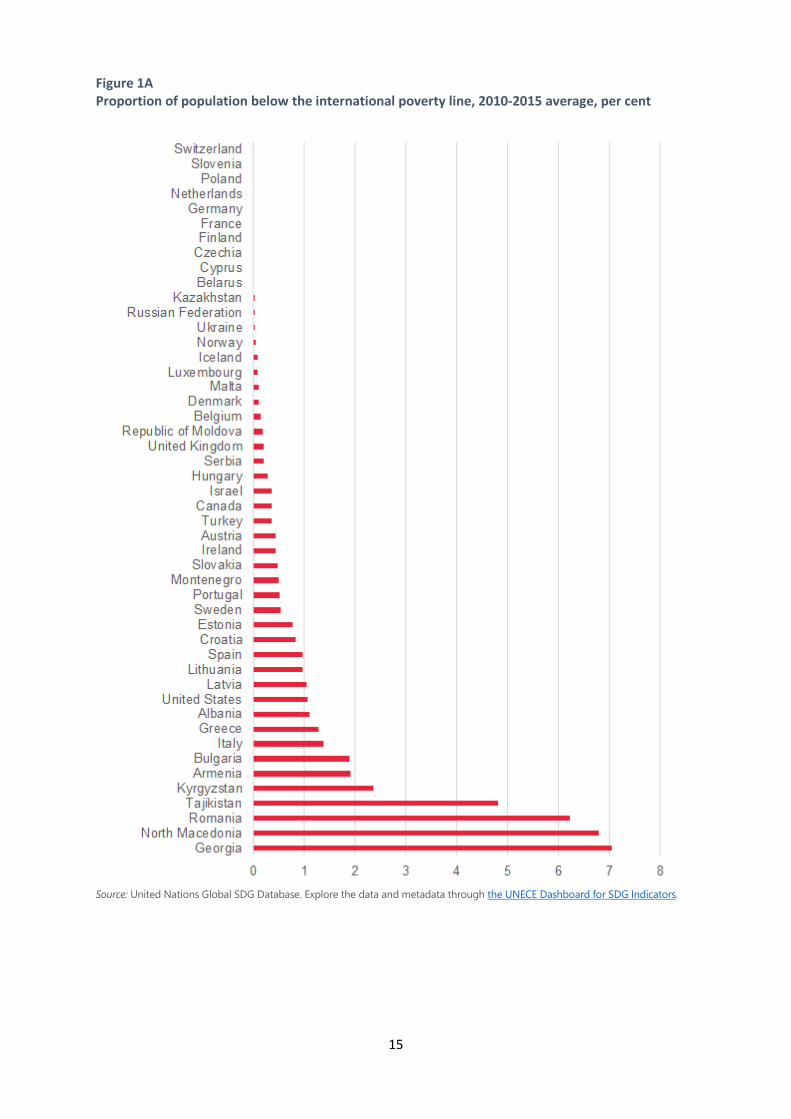
Figure 1A Proportion of population below the international poverty line, 2010-2015 average, per cent ................................................................................................................ 15
Figure 1B Change in the proportion of population below the national poverty line from 2010 to 2017 (or closest year with data), percentage points ................. 16
Figure 1C Proportion of population covered by social protection floors/systems, distinguishing mothers with newborns, older persons, unemployed and persons with severe disabilities, 2016, per cent ..................................................... 18
Figure 2A Proportion of children moderately or severely wasted, latest available year, per cent ....................................................................................................................... 20
Figure 2B Proportion of children moderately or severely overweight, latest available year, per cent ....................................................................................................................... 20
Figure 3A Maternal mortality ratio in 2017 with changes from 2012 (or closest year with data), per 100,000 live births ................................................................................ 22
Figure 3B Neonatal mortality rate in 2018 with change from 2013, per 1,000 live births ....................................................................................................................................... 23
Figure 3C Under-five mortality rate in 2018 with change from 2013, per 1,000 live births ....................................................................................................................................... 24
Figure 3D Number of road traffic accident fatalities from 2000 to 2017 .......................... 27 Figure 3E Road traffic accident fatalities in 2017, per million population ........................ 28 Figure 3F Adolescent birth rate per 1,000 women aged 15-19 years, in 2017 with
change from 2012 .............................................................................................................. 29 Figure 3G Proportion of women of reproductive age (15-49 years) whose demand
for family planning is satisfied by modern contraceptive methods, in 2018 with change from 2010, per cent ...................................................................... 31
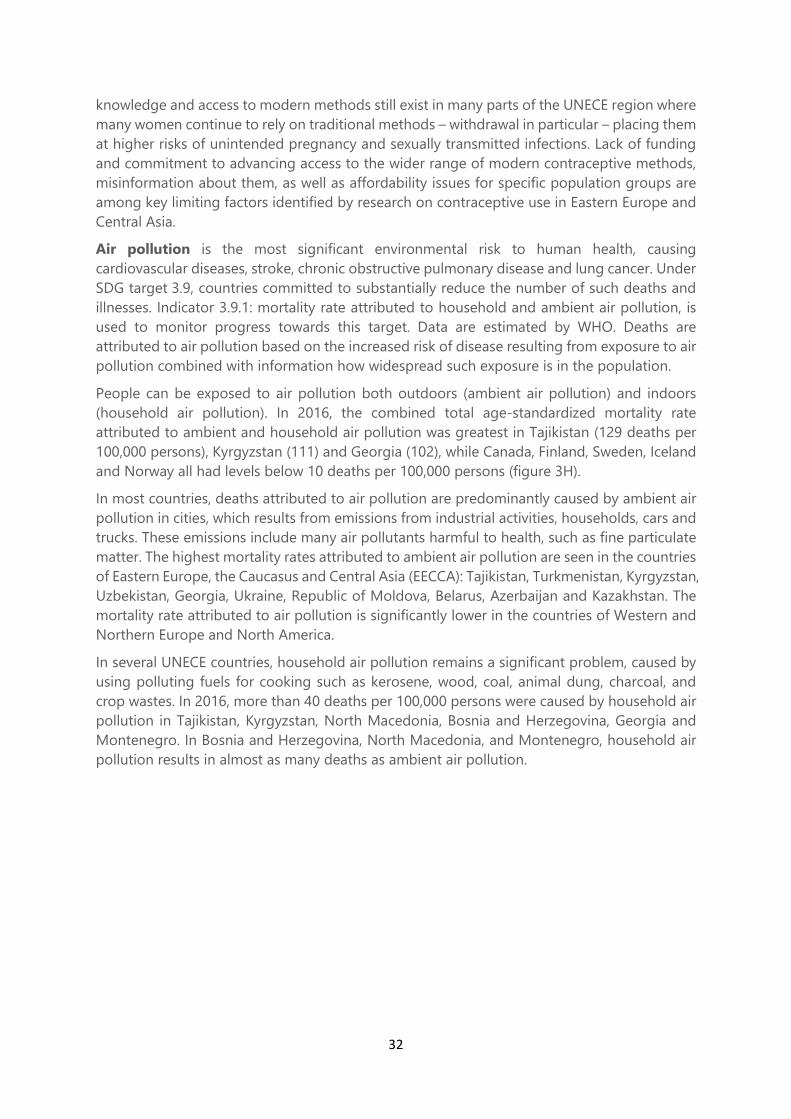
Figure 3H Age-standardized mortality rate attributed to household air pollution, ambient air pollution, and household and ambient air pollution jointly, in 2016, deaths per 100,000 persons ............................................................................... 33
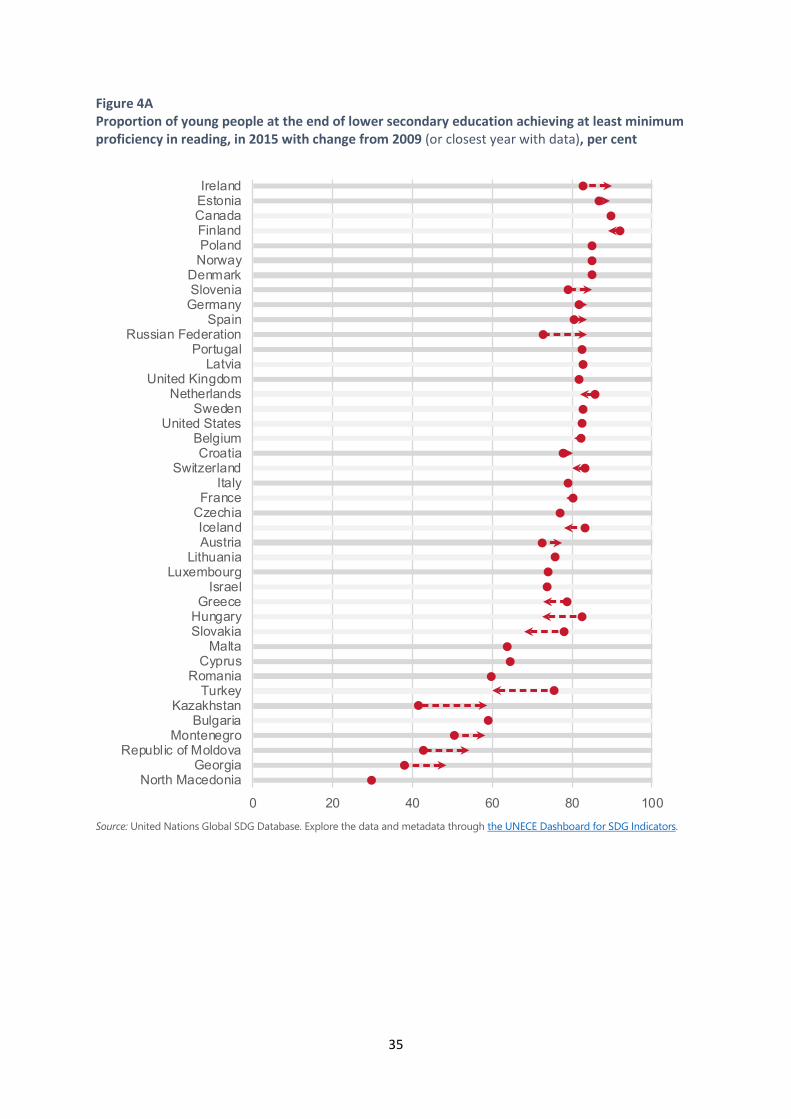
Figure 4A Proportion of young people at the end of lower secondary education achieving at least minimum proficiency in reading, in 2015 with change from 2009, per cent ........................................................................................................... 35
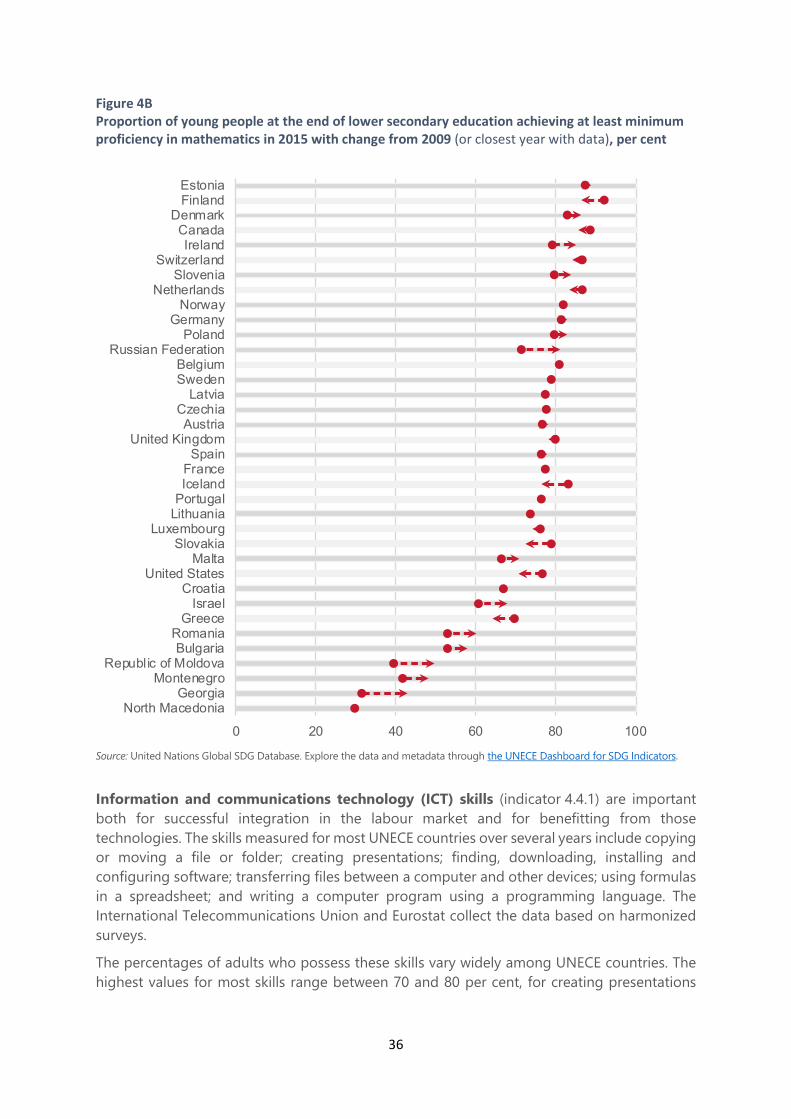
Figure 4B Proportion of young people at the end of lower secondary education achieving at least minimum proficiency in mathematics in 2015 with change from 2009, per cent ........................................................................................... 36
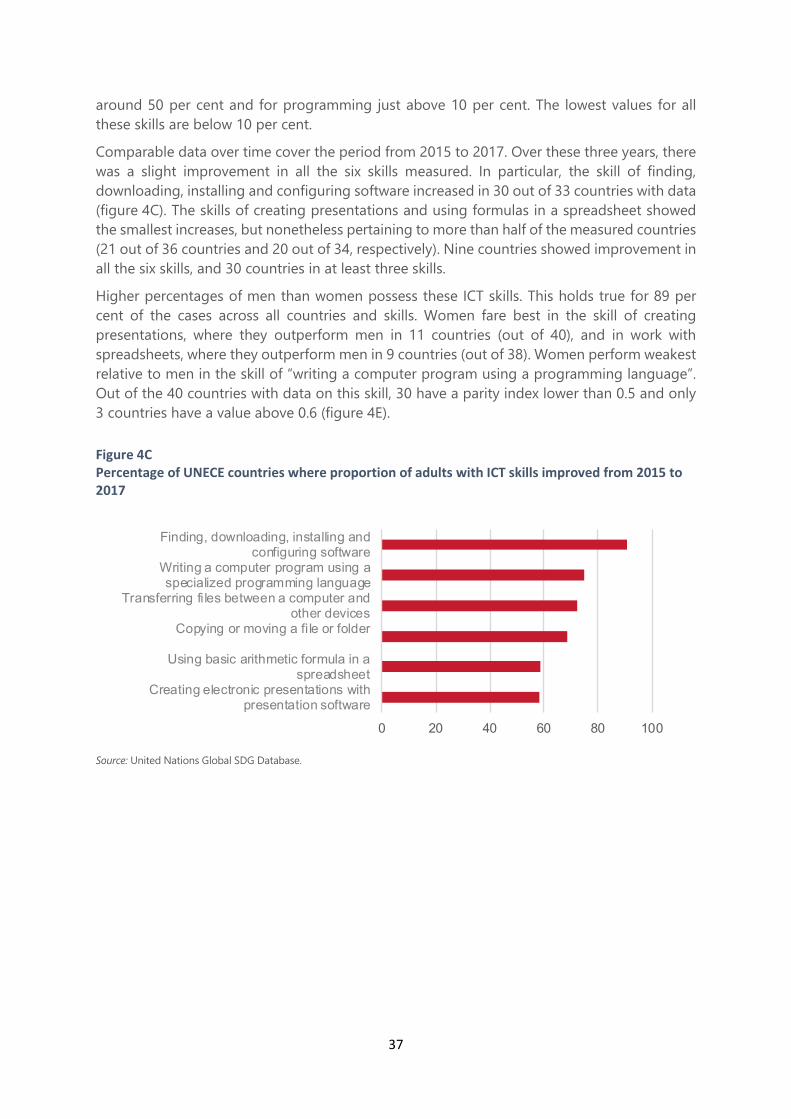
Figure 4C Percentage of UNECE countries where proportion of adults with ICT skills improved from 2015 to 2017 ......................................................................................... 37
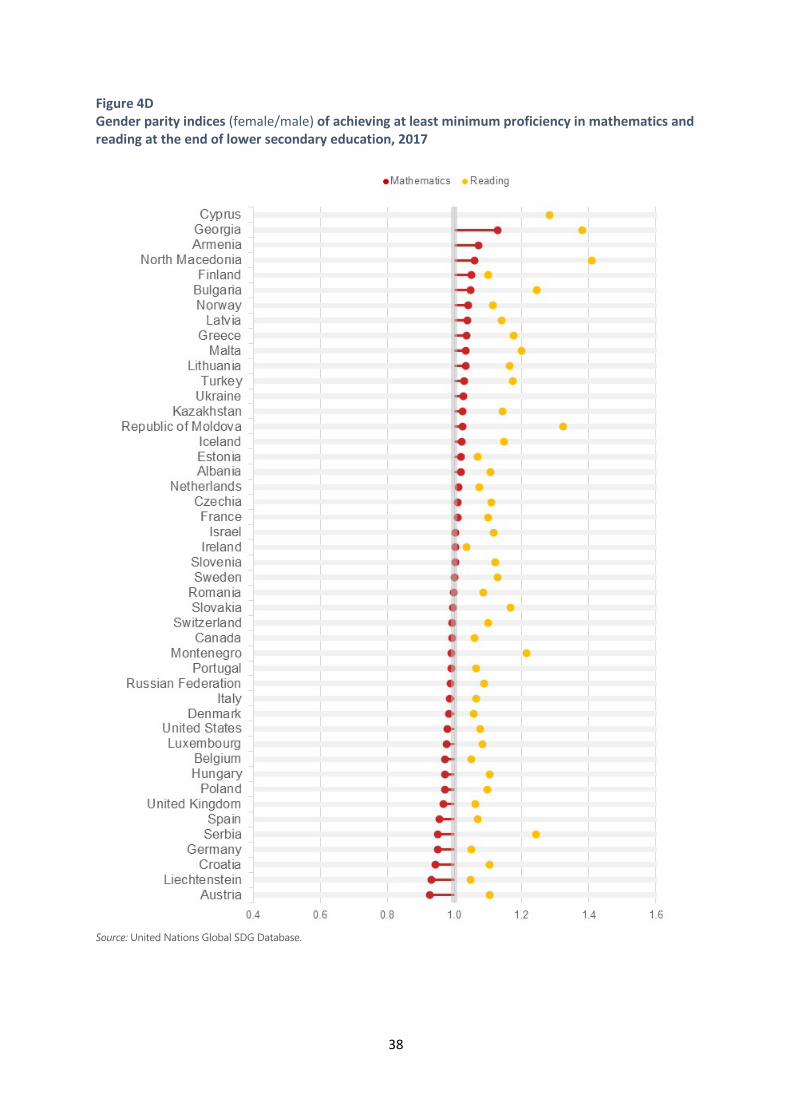
Figure 4D Gender parity indices (female/male) of achieving at least minimum proficiency in mathematics and reading at the end of lower secondary education, 2017 .................................................................................................................. 38
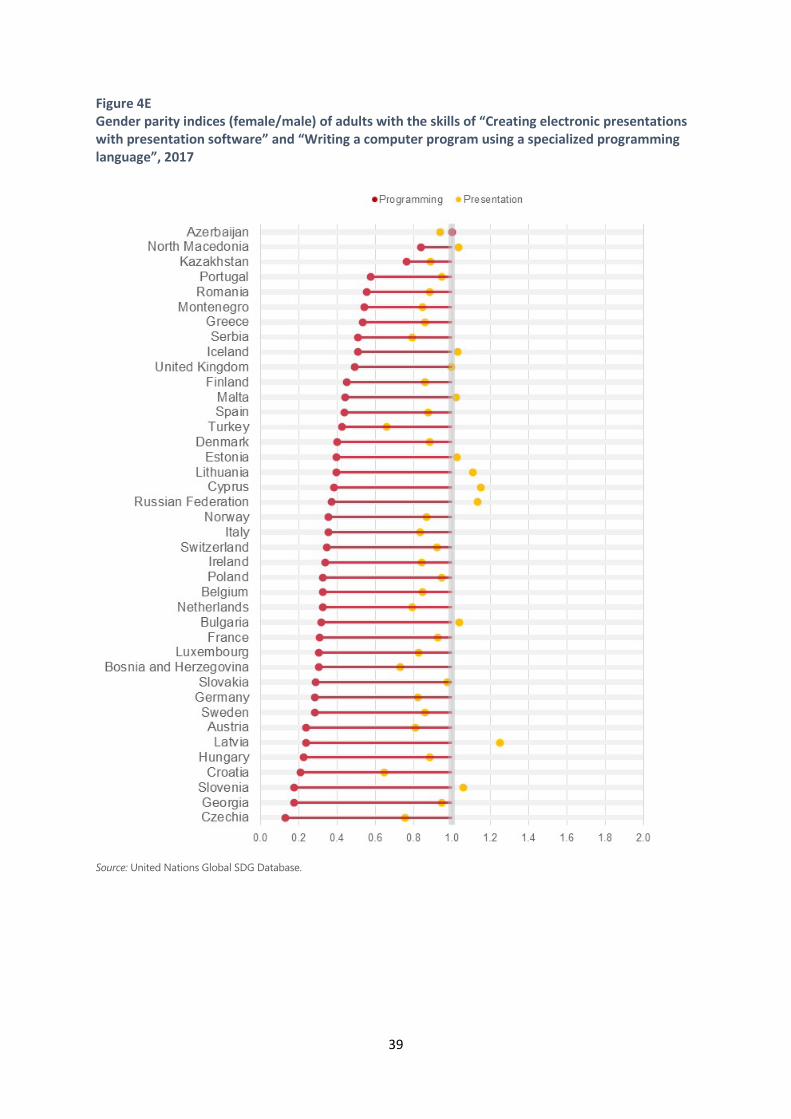
Figure 4E Gender parity indices (female/male) of adults with the skills of “Creating electronic presentations with presentation software” and “Writing a computer program using a specialized programming language”, 2017 ...... 39
Figure 5A Time spent on domestic and care work by women and men, most recent year available, hours per day ......................................................................................... 41
6
Figure 5B Proportion of seats held by women in national parliaments in 2019 with change from 2015, per cent ........................................................................................... 42
Figure 5C Proportion of local government seats held by women, most recent year available ................................................................................................................................. 44
Figure 5D Proportion of women among managers in 2017 with change from 2012 (or closest year with data), per cent ............................................................................ 45
Figure 6A Proportion of transboundary basin area with an operational arrangement for water cooperation, latest available year (2017 or 2018), per cent ............ 47
Figure 6B Water stress: freshwater withdrawal as proportion of available freshwater resources, latest available year, per cent ................................................................... 48
Figure 6C Proportion of domestic wastewater safely treated in 2018, per cent ............ 49 Figure 6D Proportion of bodies of water with good ambient water quality in 2017,
per cent .................................................................................................................................. 50 Figure 6E Proportion of population using safely managed sanitation services in
2017 with change from 2000, per cent ...................................................................... 53 Figure 7A Average change in renewable share in total final energy consumption,
2012-2016 and 2002-2006, percentage points ...................................................... 55 Figure 7B Change in intensity level of primary energy 2006-2016, Megajoules per
unit of gross domestic product (2011 Purchasing Power Parity) ..................... 56 Figure 8A Annual growth rate of real gross domestic product per capita in 2000-
2017, simple average, per cent ..................................................................................... 59 Figure 8B Annual average growth rate of real gross domestic product per
employed person in 2000-2018, simple average, per cent ................................ 59 Figure 8C Proportion of youth (aged 15-24 years) not in education, employment or
training, in 2017 with change from 2010, per cent ............................................... 60 Figure 8D Domestic material consumption per unit of gross domestic product in
2017 with change from 2000, kilogrammes per constant 2010 United States dollar .......................................................................................................................... 62
Figure 9A Research and development expenditure as a proportion of gross domestic product in 2016 with change from 2006, per cent ............................ 64
Figure 9B Proportion of medium and high-tech industry value added in total value added in 2016 with change from 2006, per cent ................................................... 65
Figure 9C Freight volumes by mode of transport in 2018, per cent ................................... 67 Figure 9D Carbon dioxide emissions per unit of gross domestic product, 2016 with
change from 2011, kilogrammes of carbon dioxide per constant 2010 United States dollar ........................................................................................................... 69
Figure 10A Labour share in gross domestic product in 2017 with change from 2000 (or closest year with data), per cent ............................................................................ 72
Figure 10B Remittance costs as a proportion of the amount remitted in 2018, per cent …………………………………………………………………………………………………………... 73
Figure 11A Annual mean levels of fine particulate matter (PM2.5) in cities in 2016, micrograms per cubic metre .......................................................................................... 75
Figure 12A Fossil fuel subsidies as a proportion of gross domestic product in 2013 and 2015, per cent ............................................................................................................. 77
Figure 12B Meeting obligations to transmit information as required by international multilateral environmental agreements on hazardous waste and other chemicals, 2015-2019, per cent .................................................................................... 80
7
Figure 13A Number of deaths and missing persons attributed to disasters per 100,000 population, latest available period ............................................................. 82
Figure 13B Proportion of local governments that adopt and implement local disaster risk reduction strategies in line with national disaster risk reduction strategies, latest available period, per cent .............................................................. 82
Figure 14A Coverage of protected areas in relation to marine areas (Exclusive Economic Zones), 2018, per cent ................................................................................. 84
Figure 14B Average proportion of Marine Key Biodiversity Areas covered by protected areas, 2019 with change since 2000, per cent .................................... 85
Figure 15A Forest cover as a proportion of total land area in 2015 with change from 2000, per cent ...................................................................................................................... 87
Figure 15B Average proportion of Freshwater Key Biodiversity Areas covered by protected areas, in 2019 with change from 2000, per cent ............................... 89
Figure 15C Average proportion of Terrestrial Key Biodiversity Areas covered by protected areas, in 2019 with change from 2000, per cent ............................... 90
Figure 16A Number of victims of intentional homicide per 100,000 population, in 2017 with change from 2012 ......................................................................................... 93
Figure 16B Proportion of unsentenced detainees in overall prison population in 2017 with change from 2005, per cent ................................................................................. 94
Figure 17A Net Official Development Assistance as a proportion of OECD Development Assistance Committee donors’ Gross National Income, 2018, per cent ...................................................................................................................... 96
Figure 17B Volume of remittances in United States dollars as a proportion of total gross domestic product in 2017 with change from 2007, per cent ................ 97
Figure 17C Fixed Internet broadband subscriptions in 2017 with change from 2007, number per 100 inhabitants ........................................................................................... 99
Figure 17D Proportion of high-speed fixed Internet broadband subscriptions among all-speed from selected countries in 2017 with change from 2012, per cent .......................................................................................................................................... 100
Figure 17E Internet users in 2017 with change from 2007, number per 100 inhabitants ............................................................................................................................ 101
8
Introduction
Why this report?
The 2030 Agenda cannot be fulfilled without relevant and timely statistics to track progress. Data are needed for designing and monitoring the results and impact of policy actions, as well as for identifying areas, groups or regions that risk being left behind.
The 2030 Agenda recognizes the pivotal role of the regional dimension in implementation, follow-up and review. Actions at the regional level will bridge the global and national levels, and provide the necessary focus for international exchanges of experience and peer learning. The Regional Forum for Sustainable Development and the Platform for Statistics on Sustainable Development Goals (SDGs) are prominent examples of such action in the UNECE region, which comprises 56 countries of Europe, North America and Central Asia.
The global indicator framework for the Goals and targets of the 2030 Agenda includes 232 indicators. As regional priorities vary, so too do the regional importance and relevance of the global indicators. The Economic and Social Council of the United Nations has endorsed recommendations for “a more cohesive, impactful, transparent and efficient regional response to SDGs”, which include development of coherent regional data ecosystems as well as knowledge management hubs in each region. Data availability and needs for measuring SDGs vary greatly among the world regions, and a single global database would not suffice as one international source to satisfy regional needs. Work on regional platforms for disseminating data on SDGs is proceeding in all five regional commissions.
The 68th session of the United Nations Economic Commission for Europe (Geneva, 9-10 April 2019), the governing body of UNECE, requested the Secretariat “to publish a yearly report on the implementation of the 2030 Agenda for Sustainable Development in the UNECE region to support the discussions at the sessions of the Regional Forum on Sustainable Development”. The UNECE Statistical Division led the preparation of the present first annual report to inform the 2020 Regional Forum on Sustainable Development for the UNECE Region (Geneva, 19 March 2020).
Statistics for SDGs in the UNECE region
Since the inception of the 2030 Agenda for Sustainable Development, UNECE countries have joined forces to support statistical work for measuring SDGs. Following the 2015 Conference of European Statisticians Declaration on the central role of national statistical offices in measuring SDGs, the UNECE Steering Group on Statistics for SDGs launched work on developing a Road Map to guide countries on how to set up a system for providing statistics and indicators for SDGs. The Road Map was published in 2017, followed in 2018 by a Practical Guide on establishing national reporting platforms and other guidance materials to support countries – members of the Conference of European Statisticians (CES) – in implementing the Road Map. Many countries in the region are setting up national reporting platforms providing an authoritative source of country data on SDGs.
9
As agreed by the United Nations Statistical Commission, the regional commissions do not collect SDG data directly from countries. However, they are all working on SDG platforms to disseminate information relevant for the regions. The UNECE Secretariat and a task team of several national statistical offices has developed such a platform for the UNECE region, which consists of (a) the UNECE Knowledge Hub for SDGs, (b) the UNECE Dashboard of SDG Indicators and (c) the UNECE Database of SDG Indicators. The purpose of the platform is to communicate developments on measuring SDGs in the UNECE region, and to provide easy access to up-to-date data on SDG indicators. The present report draws on the data compiled for the UNECE Database and Dashboard, extracted from the United Nations Global SDG Database.
Indicators and data sources
The report reviews the situation and developments by using selected indicators under each of the 17 Sustainable Development Goals. The indicators have been selected based on their relevance to the UNECE region and availability of data. The findings pertain to the selected indicators and the corresponding SDG targets. Conclusions about individual targets do not necessary apply to entire goals, since each goal includes targets on a wide range of areas, and progress is not uniform. In total, the report reviews 49 indicators, some of which consist of several components. For most indicators, the report looks at change over recent years. Under each goal, the reviewed targets and indicators are explained. Links to the corresponding sections of the UNECE Dashboard for SDG Indicators are provided to allow users find more data and metadata (information about the data). It is acknowledged that more information needs to be made available about the data sources and measurement issues that influence comparability across countries, and that some of the data presented may be sensitive to differences in measurement and methodology. The data are used to provide a general impression of the variation among countries and the direction of trends. For the most part, the report relies on the data available in the United Nations Global SDG Database as of 20 December 2019. The Global Database is compiled through the United Nations System in preparation for the Secretary-General's annual report on "Progress towards the Sustainable Development Goals". The custodian agencies – the United Nations bodies and other international organizations assigned responsibility for the indicators under their areas of expertise – validate and harmonize the data, which may lead to differences from the data originally submitted by member countries. The United Nations Department of Economic and Social Affairs consolidates data according to the SDG indicator framework, ensures quality control, and stores the data and metadata. For some indicators, the report relies on the UNECE statistical database. This is the case where the UNECE database, through its existing data collection, has a more comprehensive coverage of countries or data on more recent years for UNECE countries, or where the UNECE database provides more precise or consistent measurements for the UNECE region. This concerns indicators 3.6.1 on road traffic deaths, 3.7.2 on adolescent birth rate, and 9.1.2 on passenger and freight volumes. Indicator 3.7.1 on family planning is sourced from the United Nations Population Division.
10
Summary of findings
This report describes the levels and trends of selected SDG indicators relevant for UNECE countries and points out challenges in measuring and monitoring SDGs in the region. It highlights areas where countries have already fulfilled targets or are making good progress, draws attention to those areas where additional efforts will be needed to ensure the goals are met by 2030, and examines variation across the region.
The results pertain to the 49 selected indicators relevant for the UNECE region. The present summary refers to the situation and trends at the most general level. It is acknowledged that variation among countries is significant in all reviewed areas and that there are exceptions to the general description provided below. The reader is invited to consult the details in the subsequent parts of the report.
The findings are summarized here through the lens of the 2030 Agenda’s five integrating dimensions: people, planet, prosperity, peace, and partnership.
People
Several findings illustrate good progress of UNECE countries towards ending poverty and hunger, and ensuring that all people can fulfil their potential in dignity and equality and in a healthy environment. Extreme poverty is rarely seen in the UNECE region. In most countries, the proportion of underweight children below the age of five is low, ranging between 2 and 4 per cent.
A large majority of the population in the UNECE region is covered by social protection schemes. All countries have pension provisions for persons above statutory retirement age. The proportion of older persons covered by pension schemes is universal in about half of the countries. In 30 countries out of 41 with data, everyone with severe disabilities receives a disability cash benefit.
In many UNECE countries most of the need for family planning is satisfied with modern contraceptive methods, although some barriers in access to these remain. In three quarters of the countries, every mother with a newborn receives a cash benefit.
For maternal, infant and child mortality, almost all UNECE countries have rates that are largely below the global SDG targets. In the few countries with rates still above the targets, they have fallen substantially over recent years. Disaster-related mortality is low throughout the UNECE region. Most countries in the UNECE region with available data already have rates of mortality and missing persons attributed to disasters that are below the 2005-2015 global average.
Yet in many areas, progress is slow or partial. Although births to adolescents have fallen in most countries of the region and have reached low levels in Western Europe, they remain relatively high in parts of Eastern Europe and Central Asia, and in six countries adolescent fertility has increased recently.
11
Generally good progress has been made in reducing road fatalities since 2007. Yet in recent years progress has stalled or even reversed in some countries, and the region is far from reaching the global target of halving the number of fatalities. Nearly 290 people die each day on the region’s roads.
At the end of lower secondary education, proficiency levels in reading and mathematics are improving, as well as the possession of ICT skills in the adult population, although progress is uneven across the region.
Most countries have progressed towards gender equality as indicated by the increase in the proportion of women among parliamentarians and managers, and the narrowing of the gender gap in domestic and care work. Yet very few countries are close to gender parity.
The indicators analyzed also reveal areas where little or no progress has been made. Overweight rates among children in the UNECE region are high, ranging from 5 to 15 per cent in most countries with data. The proportion of local governments with disaster risk reduction strategies varies widely across the region: nine countries have full coverage while an equal number of countries have no such strategies at the local level.
Planet
UNECE countries have progressed in several areas that protect the planet from degradation. The protection of Marine Key Biodiversity Areas has greatly expanded in the region. In about half of the countries with access to the sea, more than 80 per cent of such Biodiversity Areas are covered by protected areas. In contrast to worldwide trends, forest cover in the UNECE region has been expanding over the past two decades, with a net increase of 28 million ha between 2000 and 2015.
Two thirds of UNECE countries provide safely managed sanitation services for more than 80 per cent of their population, with improvements since 2000 seen in 40 countries. Energy intensity, the amount of energy used to power the economy, has decreased in most UNECE countries in recent years, with the largest reductions in Eastern and South-eastern Europe and Central Asia. This suggests these countries’ economies are becoming more energy efficient.
UNECE countries have a very high rate of fulfilment of the obligations to transmit information as required by four key multilateral environmental agreements. Almost all UNECE countries comply with information transmission obligations for agreements on protecting the ozone layer and disposing of hazardous waste. Most countries report implementation of all relevant international instruments aiming to combat illegal, unreported and unregulated fishing.
Yet successes are not universal. Only 14 UNECE countries have all their transboundary waters covered by operational arrangements. About half of UNECE countries can be considered not to be facing water scarcity as they withdraw less than 25 per cent of their renewable freshwater resources; however, three countries withdraw more than they renew. Half of UNECE countries treat safely more than 80 per cent of their wastewater, yet in six countries this percentage is below 50. Most groundwater bodies in the UNECE region meet the target of good ambient water quality, whereas more needs to be done to achieve this goal in river water bodies and open water bodies.
12
Renewable energy consumption as a share of all energy consumption has increased steadily in UNECE countries over recent years, but remains below the global average. In most of the UNECE region there is close to zero subsidization of fossil fuels. The countries still having such subsidies in Central Asia have seen large reductions.
Fulfilment of the information transmission obligations has increased in many countries on the agreement on pesticides and industrial chemicals, but appears to have fallen in 27 countries on the agreement on persistent organic pollutants.
Only ten countries in the UNECE region have levels of air pollution with fine particulate matter below the limit recommended by the WHO air quality guidelines. The target of protecting at least 10 per cent of marine areas is reached by 14 countries whereas 23 countries report levels below that threshold.
Passenger cars remain the dominant form of moving people in the UNECE region, and their share has remained constant over time, reflecting similar growth of both private cars and public transport. Road transport dominates freight movements as well, although there are many countries where rail and inland waterways transport the majority of goods.
Prosperity
Some indicators show good progress towards more prosperous and fulfilling lives. The share of value added coming from medium and high-tech industry has increased in half of UNECE countries, and the share of the population with fixed Internet broadband subscriptions has increased in all countries. Countries with lower levels of Internet use have been catching up, reaching levels above 50 per cent of the population in almost all countries in 2017.
Economic growth in UNECE countries is relatively stable, but the pace is still slower than before the financial crisis of 2008.
Economic growth has been driven by increases in both employment and productivity. The share of labour income in GDP in Western Europe and North America has been relatively high and stable, while it varies considerably in other parts of the UNECE region. Over recent years, average labour share in GDP has gradually decreased. The share of youth not in employment, education or training has declined in recent years but remains at pre-financial crisis levels.
Expenditure on research and development as a proportion of GDP has grown in 21 countries and declined in 18 countries. In Western and Central Europe, medium and high-tech industry contributes as much as half of all value added. The lowest shares, below 10 per cent, are found in South-eastern Europe, the Caucasus and Central Asia.
The cost of remittances has been on the decline, but the region’s average of 5.4 per cent of the total amount sent still exceeds the agreed target of 3 per cent transaction costs.
Peace
The number of homicide victims is decreasing, with countries with relatively high homicide levels having the largest reductions, supporting the development towards societies free from
13
fear and violence. Most UNECE countries have reduced the proportion of unsentenced detainees, which signifies growing respect for the principle that persons awaiting trial should not be unnecessarily detained in custody. However, in some countries unsentenced detainees make up close to half of the prison population.
Partnership
Remittances in some countries are an important source of income, amounting to as much as 30 to 35 per cent of gross domestic product.
Only five UNECE countries meet the target of allocating 0.7 per cent of their gross national income to assistance to developing countries.
14
End poverty in all its forms everywhere
Poverty manifests itself in many ways. Target 1.1 calls for eradication of extreme poverty and target 1.2 for halving poverty in all its dimensions by 2030. Target 1.3 calls for social protection for the poor and vulnerable, increased access to basic services and support for people at risk of harm from climate-related extreme events and other economic, social and environmental shocks and disasters. This section looks at the proportion of population below the international and national poverty lines (indicators 1.1.1 and 1.1.2) and at the implementation of social protection systems (indicator 1.3.1). The poverty data in the United Nations Global SDG Database come from the World Bank’s World Development Indicators database; the data on social protection systems come from ILO.
The international poverty line is currently set at $1.90 a day at 2011 international prices. This represents extreme poverty measured by the simple average (mean) of the national poverty lines of the 15 poorest countries in the world. Such a low threshold is largely inapplicable for the UNECE countries. In most of the 48 UNECE countries with available data, the proportion of population below the international poverty line is less than one per cent on average during the period 2010-2015 (or closest years with data) (figure 1A). Georgia and North Macedonia, which are among the few countries with relatively higher rates (12.2 and 10.4 per cent in 2010, respectively) have reduced extreme poverty by half during the observed period. For the rest of the countries, the rates have shown very little variation. It is generally agreed that additional computation of poverty rates according to thresholds of $3.90, $5.00 or $10.00 would be more suited for the countries in this region.
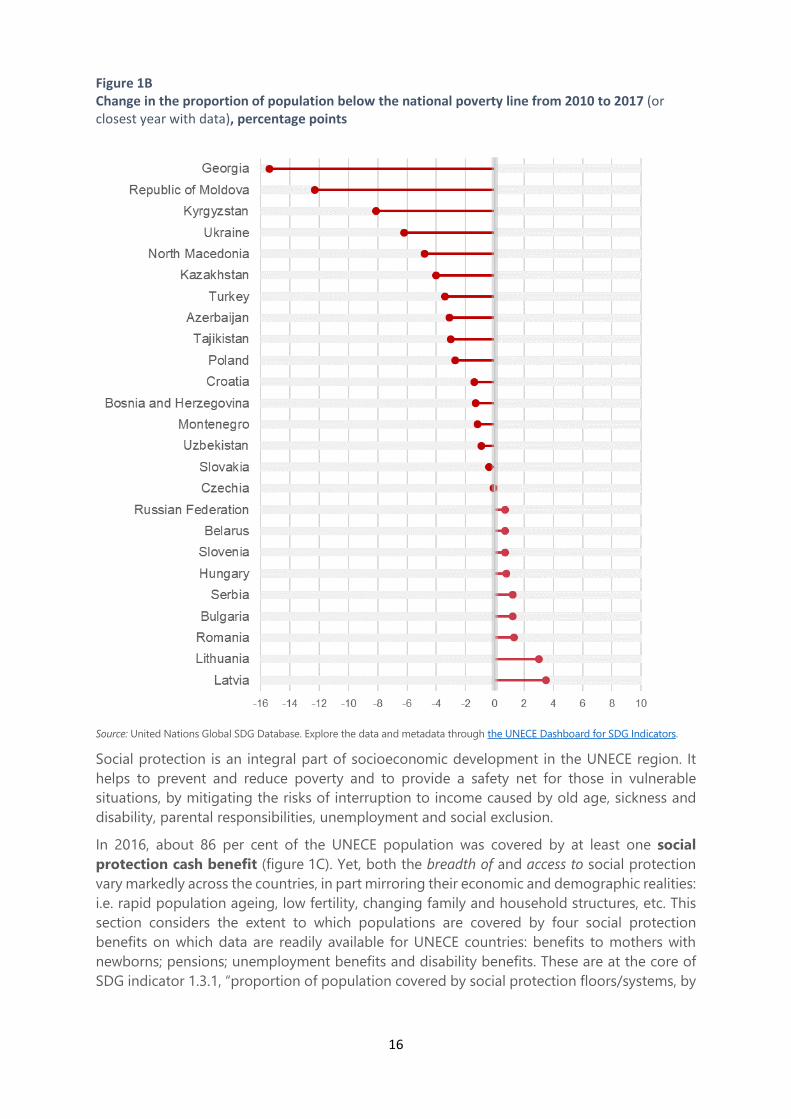
National poverty lines are defined on the basis of a country’s specific economic and social circumstances and policy needs. They are not intended for international comparisons. However, they provide useful information on poverty development in a country over time (figure 1B). Between 2010 and 2017, 13 of the 25 UNECE countries that reported data according to national poverty lines saw more than one per cent of their population moving out of poverty (reduction of the poverty rate by more than one percentage point). Reductions were largest in Georgia where 15 per cent of the population moved out of poverty, the Republic of Moldova (12), Kyrgyzstan (8) and Ukraine (6 per cent). In seven countries, the proportion of the population below the national poverty line remained practically unchanged (change less than one percentage point), and five countries saw a small increase.
The international poverty line of $1.90 represents extreme
poverty, which is rarely seen in the UNECE region. Additional
poverty lines at $3.90, $5.00 or $10.00 are recommended for more meaningful analysis of trends in the UNECE region.
Half of the countries that reported data according to
national poverty lines saw a notable reduction in poverty
since 2010.
15
Figure 1A Proportion of population below the international poverty line, 2010-2015 average, per cent
Source: United Nations Global SDG Database. Explore the data and metadata through the UNECE Dashboard for SDG Indicators.
16
Figure 1B Change in the proportion of population below the national poverty line from 2010 to 2017 (or closest year with data), percentage points
Source: United Nations Global SDG Database. Explore the data and metadata through the UNECE Dashboard for SDG Indicators.
Social protection is an integral part of socioeconomic development in the UNECE region. It helps to prevent and reduce poverty and to provide a safety net for those in vulnerable situations, by mitigating the risks of interruption to income caused by old age, sickness and disability, parental responsibilities, unemployment and social exclusion.
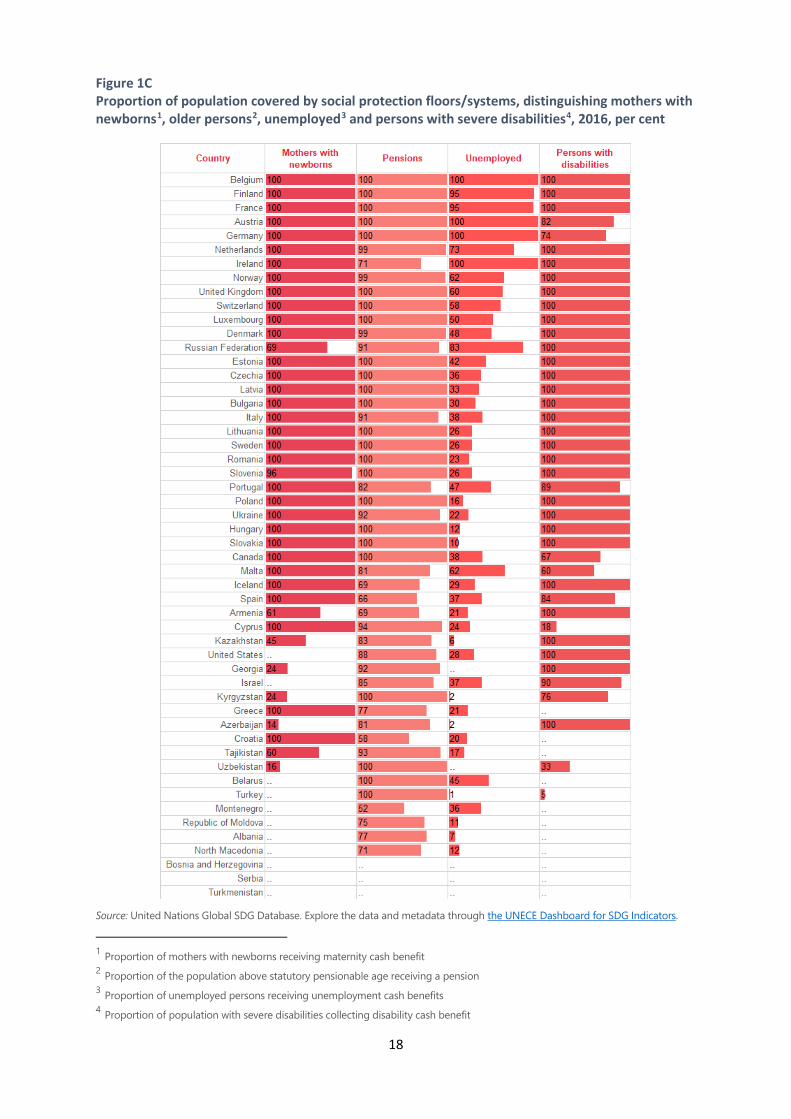
In 2016, about 86 per cent of the UNECE population was covered by at least one social protection cash benefit (figure 1C). Yet, both the breadth of and access to social protection vary markedly across the countries, in part mirroring their economic and demographic realities: i.e. rapid population ageing, low fertility, changing family and household structures, etc. This section considers the extent to which populations are covered by four social protection benefits on which data are readily available for UNECE countries: benefits to mothers with newborns; pensions; unemployment benefits and disability benefits. These are at the core of SDG indicator 1.3.1, “proportion of population covered by social protection floors/systems, by
17
sex, distinguishing children, unemployed persons, older persons, persons with disabilities, pregnant women, newborns, work-injury victims and the poor and vulnerable”.
Social protection systems are continuously evolving. Over the last several years many UNECE countries have broadened their family support measures and increased targeted social assistance to the poorest and other disadvantaged population groups. Pension schemes are also undergoing reforms in a number of countries. In many cases such reform involves a gradual increase in the statutory retirement age and/or equalizing the retirement age for women and men.
In three quarters of the UNECE countries for which data are available, every mother with a newborn receives a cash benefit. In the rest of the countries these maternity cash benefits are means-tested or available only for the second or third child. The smallest proportion of mothers with newborns receiving cash benefits is reported in countries with higher fertility rates: Azerbaijan (14 per cent), Uzbekistan (16), and Kyrgyzstan (24 per cent).
Currently all UNECE countries have pension provisions for persons above statutory retirement age. In 2016, the proportion of older persons covered by pension schemes was universal (100 per cent) in about a half of UNECE countries, while the lowest coverage was reported for Montenegro (53 per cent) and Croatia (57 per cent). The proportion of older women receiving pension remains lower in a number of countries.
According to ILO data, only in a few UNECE countries – Austria, Belgium, Germany and Ireland – does every unemployed person receive unemployment benefit, while in Finland and France the coverage reaches 95 per cent. In three quarters of UNECE countries, the share of unemployed receiving unemployment benefits is below 60 per cent with the lowest coverage – below 2 per cent – reported in Turkey, Azerbaijan and Kyrgyzstan.
In 2016, in 30 out of 41 countries with available data, 100 per cent of people with severe disabilities received a disability cash benefit. In eight countries, the coverage was between 60 and 90 per cent, and in further three countries, one third or lower.
A large majority of the UNECE population is covered by social protection schemes: in 2016, about 86 per cent of the UNECE population was covered by at least one social protection cash benefit. In three quarters of the UNECE countries for which data are available, every mother with a newborn receives a cash benefit.
All UNECE countries have pension provisions for persons above statutory retirement age. In 2016, the proportion of older persons covered by pension schemes was universal (100 per cent) in about a half of UNECE countries.
In 30 out of 41 countries with available data, 100 per cent of people with severe disabilities received a disability cash benefit.
18
Figure 1C Proportion of population covered by social protection floors/systems, distinguishing mothers with newborns1, older persons2, unemployed3 and persons with severe disabilities4, 2016, per cent
Source: United Nations Global SDG Database. Explore the data and metadata through the UNECE Dashboard for SDG Indicators.
1 Proportion of mothers with newborns receiving maternity cash benefit 2 Proportion of the population above statutory pensionable age receiving a pension 3 Proportion of unemployed persons receiving unemployment cash benefits 4 Proportion of population with severe disabilities collecting disability cash benefit
19
End hunger, achieve food security and improved nutrition and promote sustainable agriculture
Goal 2 aims to end hunger and malnutrition and to ensure that all people, especially children, have enough nutrition throughout the year. This involves promoting sustainable agriculture through support to small-scale farmers, implementing resilient agricultural practices and conservation of plant and animal genetic resources for food and agriculture. It also requires investment in infrastructure and technology to improve productivity and efficiency of the agricultural sector.
Malnutrition in early age, which comprises both undernutrition and overweight, is associated with increased child mortality and morbidity and impaired child development. This section looks at indicator 2.2.2: prevalence of malnutrition (weight for height >+2 or <-2 standard deviations from the median of the WHO Child Growth Standards) among children under five years of age, for both wasting and overweight.
The data are collected by the World Health Organization (WHO) and are published in the WHO Global Database on Child Growth and Malnutrition. The data are based on nutritional surveys, and are therefore available only for the years in which the surveys were conducted. The data are presented for the latest survey after 2009.
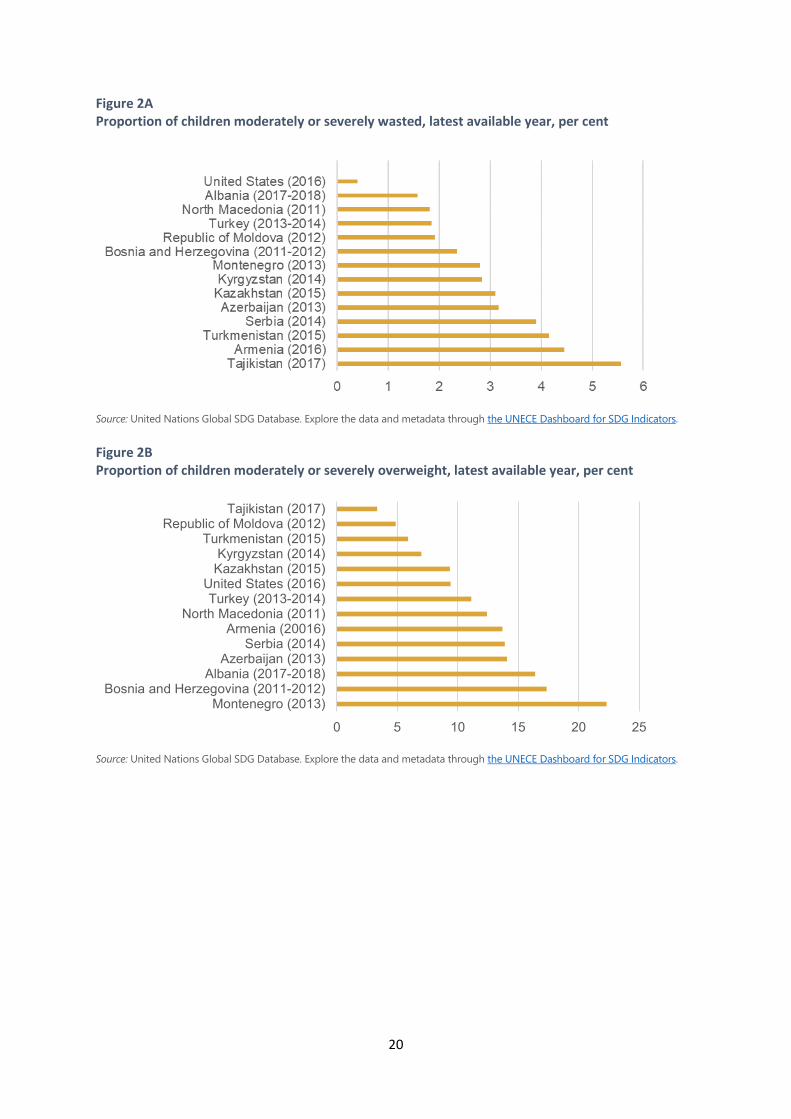
In the UNECE region, wasting (low weight for height) is less prevalent than overweight for children below the age of five. In most countries, the proportion of underweight children below five is low, in the range of 2 to 4 per cent (figure 2A). In contrast, the overweight rates range between 5 and 15 per cent for most countries with data, and exceed 15 per cent in three countries (figure 2B).
In most UNECE countries, the proportion of underweight children below five is low,
ranging between 2 and 4 per cent. In contrast, the overweight rates are higher, ranging from 5 to 15 per cent in most countries
with data.
20
Figure 2A Proportion of children moderately or severely wasted, latest available year, per cent
Source: United Nations Global SDG Database. Explore the data and metadata through the UNECE Dashboard for SDG Indicators. Figure 2B Proportion of children moderately or severely overweight, latest available year, per cent
Source: United Nations Global SDG Database. Explore the data and metadata through the UNECE Dashboard for SDG Indicators.
0 5 10 15 20 25
Montenegro (2013)Bosnia and Herzegovina (2011-2012)
Albania (2017-2018)Azerbaijan (2013)
Serbia (2014)Armenia (20016)
North Macedonia (2011)Turkey (2013-2014)
United States (2016)Kazakhstan (2015)Kyrgyzstan (2014)
Turkmenistan (2015)Republic of Moldova (2012)
Tajikistan (2017)
21
Ensure healthy lives and promote well-being for all at all ages
Goal 3 aims to improve the health of people, increase life expectancy, reduce maternal and child mortality, fight against leading diseases, and improve access to essential health services.
This section looks at some of the key factors impacting the health and life chances of populations in the UNECE region; maternal mortality (target 3.1), neonatal and child mortality (target 3.2), mortality due to road traffic injuries (target 3.6), access to family planning and adolescent fertility (target 3.7), and mortality attributed to household and ambient air pollution (target 3.9).
In all of these areas there has been significant progress over recent years. However, some countries still have a way to go to reach the global SDG targets.
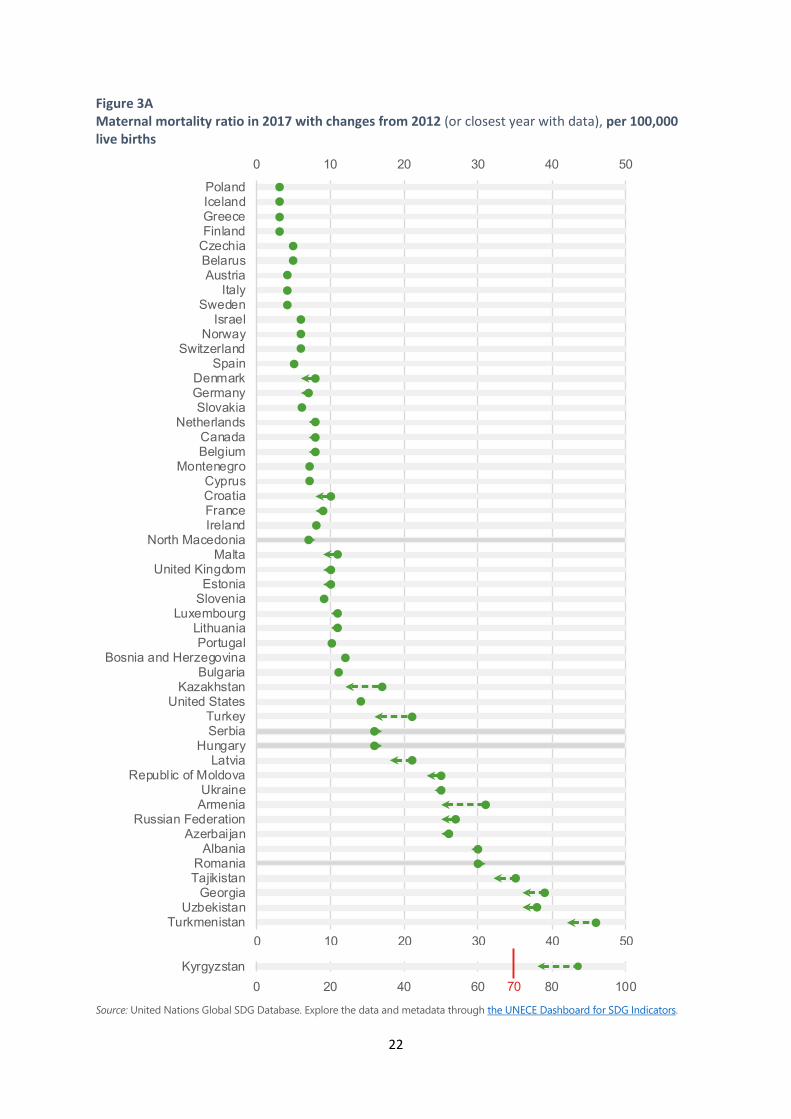
Maternal mortality is an important measure of the overall effectiveness of health care delivery systems, serving as a proxy for an assessment of general medical care and, more specifically, obstetric health care. SDG target 3.1 calls for a reduction in the global maternal mortality ratio to less than 70 per 100,000 live births by 2030. The data in the Global SDG Database are estimated by WHO.
In 2017, only Kyrgyzstan has a ratio above the target level of 70 maternal deaths per 100,000 live births, although its ratio has decreased substantially, from 87 per 100,000 in 2012 to 76 per 100,000 in 2017 (figure 3A). A decrease in this five-year period was observed in all countries where the 2012 level was above 30 per 100,000. The maternal mortality ratio decreased in Turkmenistan from 46 to 42 per 100,000, in Georgia from 39 to 36, in Tajikistan from 35 to 32, and in Armenia from 31 to 25. Other countries which saw significant declines in the maternal mortality ratio between 2012 and 2017 are Turkey (from 21 to 16 per 100,000) and Kazakhstan (from 17 to 12 per 100,000 live births).
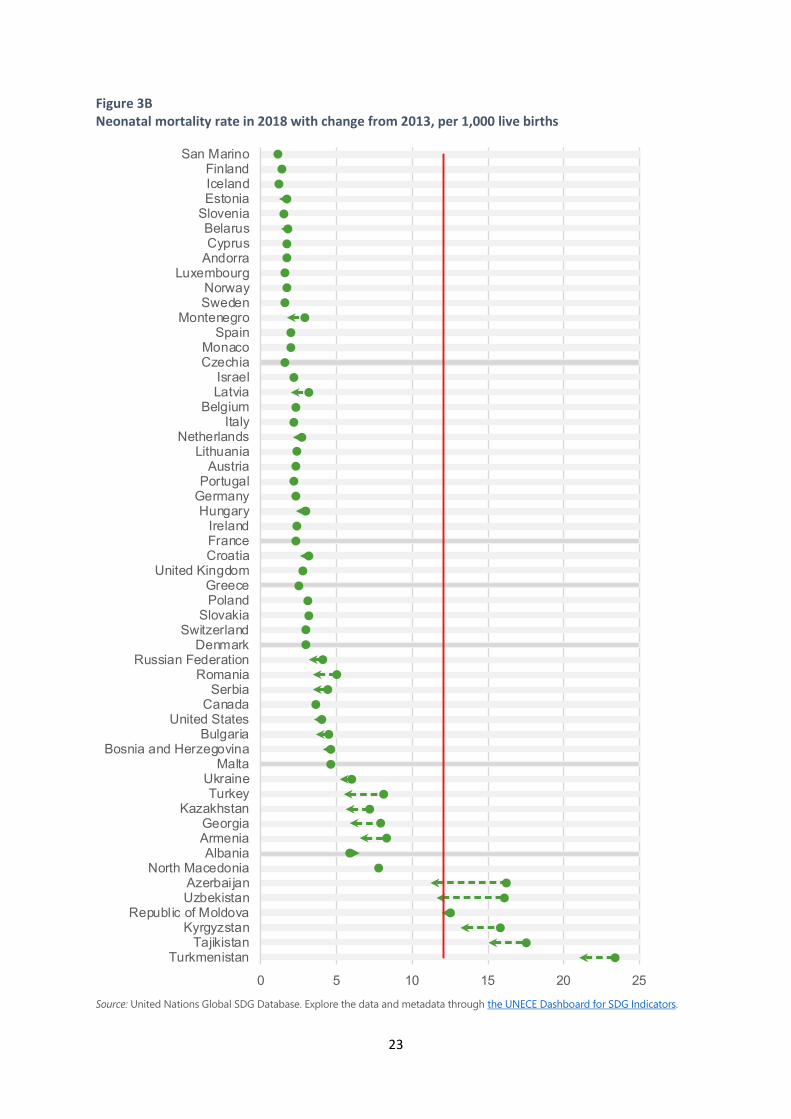
Target 3.2 calls for ending by 2030 preventable deaths of newborns and children under five years of age, with all countries aiming to reduce neonatal mortality (deaths in the first 28 days of life) to at least as low as 12 per 1,000 live births and under‑5 mortality to at least as low as 25 per 1,000 live births. The rates in the Global SDG Database are estimated by the United Nations Inter-agency Group for Child Mortality Estimation.
Maternal mortality in almost all UNECE countries is below the global target. In countries that had a relatively high maternal mortality in 2012, the level has decreased substantially.
For both neonatal and under-5 mortality, almost all UNECE countries have rates that are below the global SDG targets. In the few countries with rates above the targets, infant and child mortality have fallen significantly over recent years.
22
Figure 3A Maternal mortality ratio in 2017 with changes from 2012 (or closest year with data), per 100,000 live births
Source: United Nations Global SDG Database. Explore the data and metadata through the UNECE Dashboard for SDG Indicators.
0 10 20 30 40 50
0 10 20 30 40 50Turkmenistan
UzbekistanGeorgia
TajikistanRomania
AlbaniaAzerbaijan
Russian FederationArmeniaUkraine
Republic of MoldovaLatvia
HungarySerbiaTurkey
United StatesKazakhstan
BulgariaBosnia and Herzegovina
PortugalLithuania
LuxembourgSloveniaEstonia
United KingdomMalta
North MacedoniaIrelandFranceCroatiaCyprus
MontenegroBelgiumCanada
NetherlandsSlovakia
GermanyDenmark
SpainSwitzerland
NorwayIsrael
SwedenItaly
AustriaBelarusCzechiaFinlandGreeceIcelandPoland
0 20 40 60 80 100Kyrgyzstan
70
23
Figure 3B Neonatal mortality rate in 2018 with change from 2013, per 1,000 live births
Source: United Nations Global SDG Database. Explore the data and metadata through the UNECE Dashboard for SDG Indicators.
0 5 10 15 20 25
TurkmenistanTajikistan
KyrgyzstanRepublic of Moldova
UzbekistanAzerbaijan
North MacedoniaAlbania
ArmeniaGeorgia
KazakhstanTurkey
UkraineMalta
Bosnia and HerzegovinaBulgaria
United StatesCanada
SerbiaRomania
Russian FederationDenmark
SwitzerlandSlovakia
PolandGreece
United KingdomCroatiaFranceIreland
HungaryGermanyPortugal
AustriaLithuania
NetherlandsItaly
BelgiumLatviaIsrael
CzechiaMonaco
SpainMontenegro
SwedenNorway
LuxembourgAndorraCyprusBelarus
SloveniaEstoniaIcelandFinland
San Marino
24
Figure 3C Under-five mortality rate in 2018 with change from 2013, per 1,000 live births
Source: United Nations Global SDG Database. Explore the data and metadata through the UNECE Dashboard for SDG Indicators.
0 10 20 30 40 50 60
TurkmenistanTajikistan
AzerbaijanUzbekistanKyrgyzstan
Republic of MoldovaArmenia
TurkeyNorth Macedonia
KazakhstanGeorgiaAlbaniaUkraine
RomaniaRussian Federation
BulgariaMalta
United StatesBosnia and Herzegovina
SlovakiaSerbia
CanadaCroatiaGreecePoland
United KingdomHungaryDenmark
SwitzerlandFrance
LithuaniaNetherlands
LatviaPortugal
IrelandGermany
IsraelBelgiumAustria
CzechiaBelarusMonaco
SpainItaly
AndorraSwedenEstoniaNorway
MontenegroLuxembourg
CyprusSlovenia
IcelandSan Marino
Finland
25
In almost all UNECE member countries, in 2018 the neonatal mortality rate was under 10 deaths per 1,000 live births (figure 3B). Among countries with high neonatal mortality in 2013, significant reductions were observed in Turkmenistan (from 23 to 21 deaths per 1,000 live births), Tajikistan (from 18 to 15), Kyrgyzstan (from 16 to 13), Uzbekistan (from 16 to 12), and Azerbaijan (from 16 to 11).
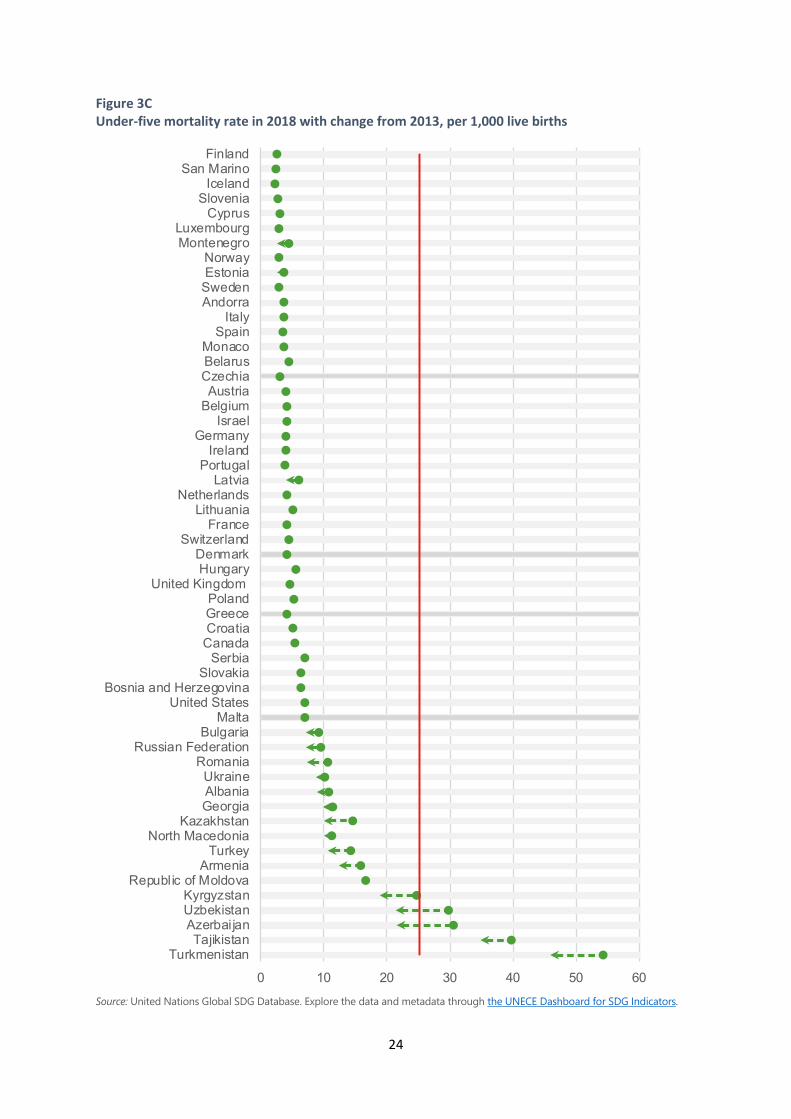
Only a few countries in the UNECE region had rates of under‑5 mortality above 25 deaths per 1,000 live births, and between 2013 and 2018 the rates have fallen significantly in all these countries: from 54 to 46 deaths per 1,000 live births in Turkmenistan, from 40 to 35 in Tajikistan, from 31 to 22 in Azerbaijan, from 30 to 21 in Uzbekistan, and from 25 to 19 in Kyrgyzstan (figure 3C).
This section looks at road traffic accident fatalities; specifically at SDG target 3.6 which is to halve the number of global deaths and injuries from road traffic accidents by 2020.
From 2007 to 2017, the total number of fatalities in road traffic accidents decreased by 30 per cent in the UNECE region, to approximately 105,000. This trend was particularly pronounced between 2007 and 2010 where an average annual decrease of almost 9 per cent was reported. Yet this positive trend still means that nearly 290 people are dying each day on the region’s roads. In addition to these deaths, over 5 million people were injured in 2017 on the roads.
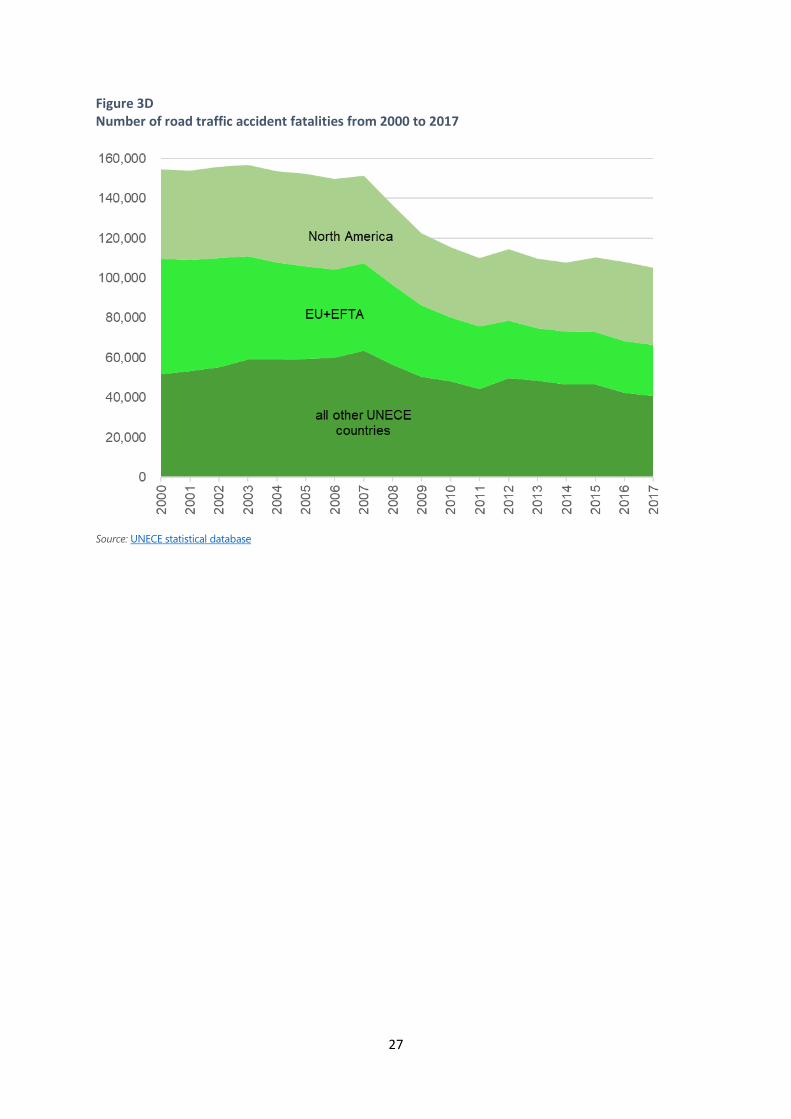
There are marked sub-regional differences in both the fatality rate (defined as road fatalities per million inhabitants) and the trend over time: EU and EFTA countries reported a decrease of 42 per cent in road traffic deaths during 2007-2017; North America reported a decrease of 11 per cent and the rest of UNECE countries 37 per cent (figure 3D).
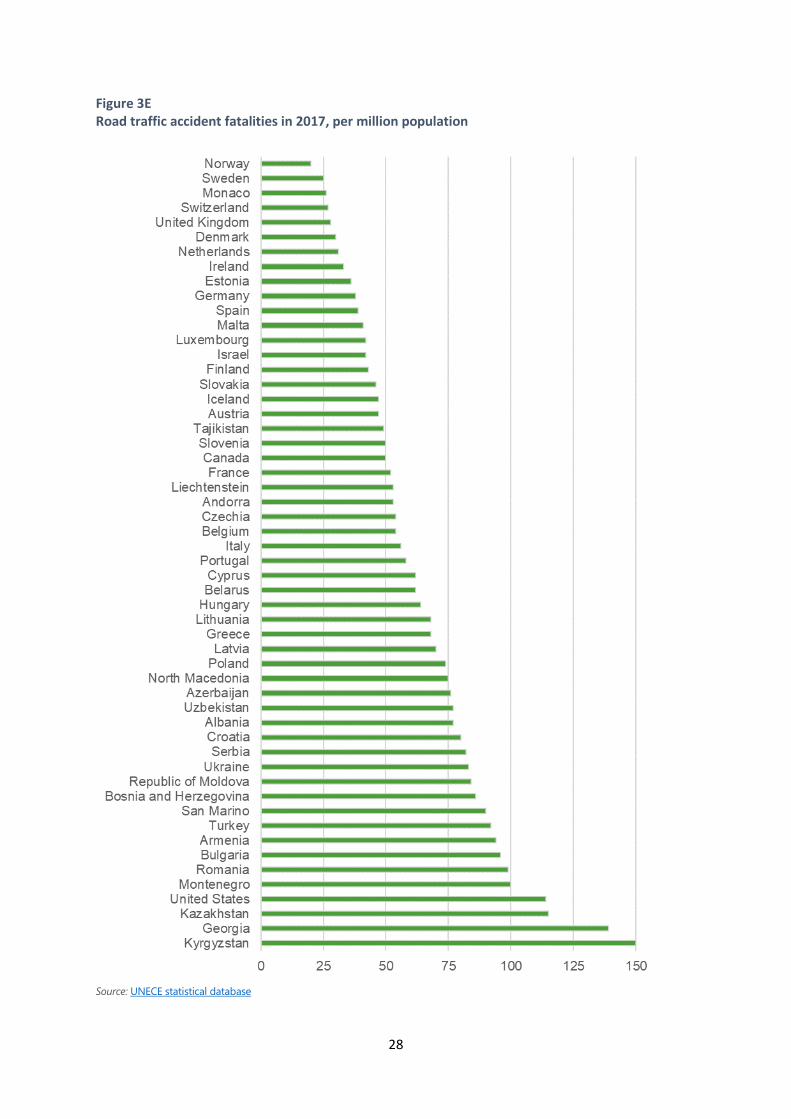
Data on road traffic fatalities per inhabitant show large disparities between countries. In 2017, the member States with the highest fatality rates reported incident rates almost ten times higher than those with the lowest fatality rates (figure 3E).
The highest fatality rates among countries with available data were reported in Kyrgyzstan (147 fatalities per million inhabitants), Georgia (139), Kazakhstan (115) and the United States (114). Many EU and EFTA countries report comparatively low road traffic fatality rates, with Norway (20 per million inhabitants), Sweden (26) and Switzerland (27) reporting the lowest rates.
Although all types of road users are at risk of being injured or killed in a road traffic accident, there are notable differences in fatality rates between women and men. In 2017, males accounted for 74 per cent of all road traffic fatalities in the 40 UNECE member States with available data. Road traffic fatality rates are higher among men than among women in all countries. The gender difference in fatality rates is likely related to the longer times for which men typically drive, an increased likelihood of male drivers being under the influence of alcohol, or other less well-documented factors such as different driving patterns or different attitudes to risk (both in accepting exposure to risk in the first place and indulging in risk-taking
Good progress has been made on reducing road fatalities since 2007, yet in recent years progress has stalled or even reversed in some countries, and the region is far from reaching the global target of halving the number of fatalities.
Nearly 290 people die each day on the region’s roads.
26
behaviour). The reported difference in fatality rates between the sexes is consistent and noticeable for all countries with available data.
Although the number of fatalities has continued to decrease in the region, there are clear differences between countries in their trends over time. The largest decrease over the period 2007-2017 is seen in Estonia, where fatalities fell by 76 per cent. The reported rate decreased by similarly large percentages in Lithuania and Latvia, whereas six countries saw decreases of less than 20 per cent, or even increases.
When looking at more recent changes – tracking progress since 2013 rather than since 2007 – much more modest progress is seen in the UNECE region, with just a 4 per cent improvement, and increase in 18 countries.
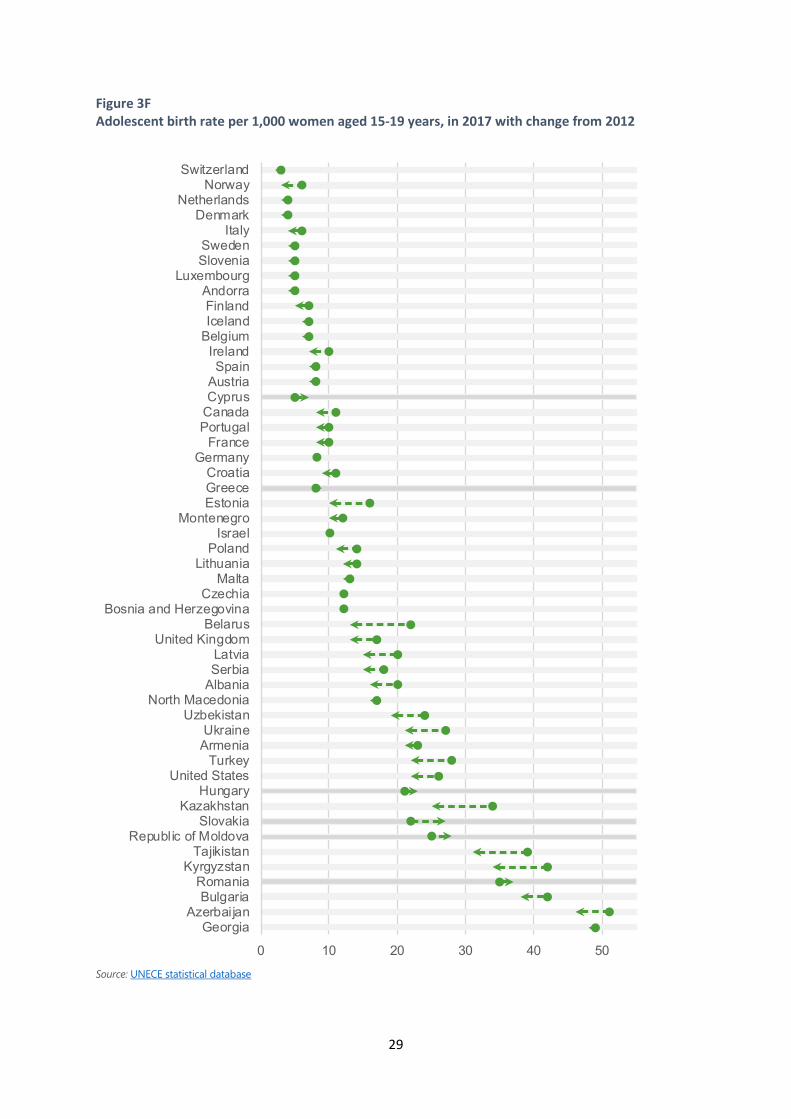
The fundamental necessity of ensuring the fulfilment of reproductive rights is reflected in target 3.7, which calls for ensuring universal access to sexual and reproductive health-care services, including for family planning, information and education, and the integration of reproductive health into national strategies and programmes, by 2030. Among the indicators used to track progress towards this target is indicator 3.7.2, the age-specific fertility rate for women aged 15-19, which measures adolescent fertility. Reducing adolescent fertility is essential as the risks in childbirth and pregnancy among this age group are especially high, both for mother and child. Furthermore, having children at a young age imposes constraints on young mothers’ lives, limiting their social and economic opportunities throughout the life course.
From 2013 to 2017, adolescent fertility decreased in most countries, with the largest absolute reductions in Belarus, Kazakhstan, Tajikistan and Kyrgyzstan (figure 3F). In six UNECE countries, in contrast, adolescent fertility increased between 2013 and 2017, with the highest increase observed in Slovakia (from 22 to 27 live births per 1,000 women aged 15-19). In Western Europe, the rates showed low levels, as distinct from the relatively high levels observed in countries of Eastern Europe and Central Asia.
Target 3.7 calls on countries to ensure universal access to sexual and reproductive health-care services, including for family planning, information and education, and the integration of reproductive health into national strategies and programmes. This target reaffirms the member States’ commitment under the Programme of Action of the International Conference on Population and Development (Cairo, 1994), to enable all couples and individuals to decide freely and responsibly on the number and spacing of their children, to make informed choices on reproductive matters and to have access to a full range of safe and effective contraceptive methods.
Births to adolescents have fallen in most countries of the region, reaching low levels in Western Europe but remaining relatively high in parts of Eastern Europe and Central Asia. In six countries of the region, adolescent fertility has increased since 2013.
27
Figure 3D Number of road traffic accident fatalities from 2000 to 2017
Source: UNECE statistical database
28
Figure 3E Road traffic accident fatalities in 2017, per million population
Source: UNECE statistical database
29
Figure 3F Adolescent birth rate per 1,000 women aged 15-19 years, in 2017 with change from 2012
Source: UNECE statistical database
0 10 20 30 40 50
GeorgiaAzerbaijan
BulgariaRomania
KyrgyzstanTajikistan
Republic of MoldovaSlovakia
KazakhstanHungary
United StatesTurkey
ArmeniaUkraine
UzbekistanNorth Macedonia
AlbaniaSerbiaLatvia
United KingdomBelarus
Bosnia and HerzegovinaCzechia
MaltaLithuania
PolandIsrael
MontenegroEstoniaGreeceCroatia
GermanyFrance
PortugalCanadaCyprusAustriaSpain
IrelandBelgiumIcelandFinland
AndorraLuxembourg
SloveniaSweden
ItalyDenmark
NetherlandsNorway
Switzerland
30
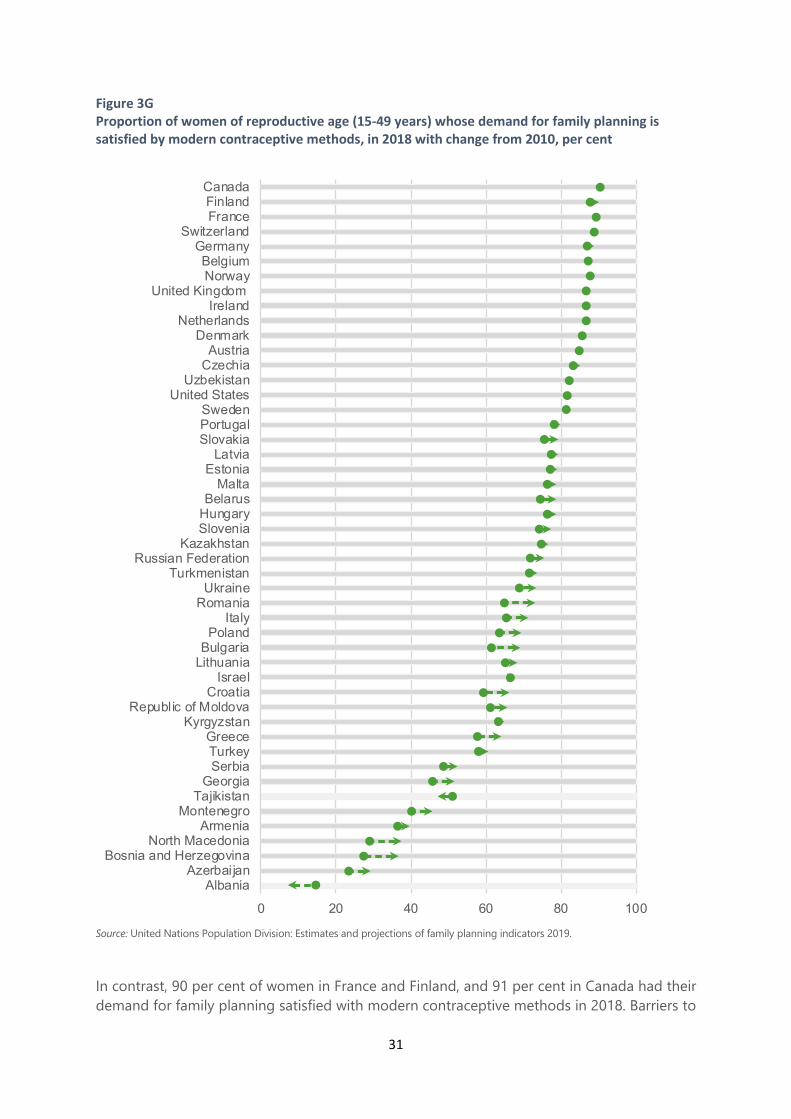
Indicator 3.7.1, measuring the proportion of women of reproductive age (15-49 years) who have their need, or demand, for family planning satisfied by using modern methods of contraception, encapsulates the progress in achieving SDG target 3.7. To monitor it, the United Nations Population Division compiles national data and produces estimates and projections of family planning indicators. Data from the most recent, 2019 revision of this compilation, that now covers all women of reproductive age and not only those married or in-union, are used for this report (figure 3G).
In Europe and North America, the proportion of women of reproductive age (15-49 years) who had their need for family planning satisfied with modern contraceptive methods increased from 78.1 per cent in 2010 to 80.4 per cent in 2018. Gains were stronger in Southern and Eastern Europe (up by 4.1 and 4.4 percentage points, respectively). In Central Asia, however, the share of women whose demand for family planning was satisfied with modern methods dropped slightly. From 2010 to 2018, in all UNECE countries except for Albania and Tajikistan, the proportion of women of reproductive age who had their demand for family planning satisfied with modern contraceptive methods increased or remained unchanged.
In many UNECE countries most of the need for family planning is satisfied with modern contraceptive methods, although some barriers in access to these remain.
Between 2010 and 2018, in all UNECE countries except for Albania and Tajikistan, the proportion of women of reproductive age who had their demand for family planning satisfied with modern contraceptive methods increased or remained virtually unchanged.
31
Figure 3G Proportion of women of reproductive age (15-49 years) whose demand for family planning is satisfied by modern contraceptive methods, in 2018 with change from 2010, per cent
Source: United Nations Population Division: Estimates and projections of family planning indicators 2019.
In contrast, 90 per cent of women in France and Finland, and 91 per cent in Canada had their demand for family planning satisfied with modern contraceptive methods in 2018. Barriers to
0 20 40 60 80 100
AlbaniaAzerbaijan
Bosnia and HerzegovinaNorth Macedonia
ArmeniaMontenegro
TajikistanGeorgia
SerbiaTurkeyGreece
KyrgyzstanRepublic of Moldova
CroatiaIsrael
LithuaniaBulgariaPoland
ItalyRomania
UkraineTurkmenistan
Russian FederationKazakhstan
SloveniaHungaryBelarus
MaltaEstonia
LatviaSlovakiaPortugalSweden
United StatesUzbekistan
CzechiaAustria
DenmarkNetherlands
IrelandUnited Kingdom
NorwayBelgium
GermanySwitzerland
FranceFinlandCanada
32
knowledge and access to modern methods still exist in many parts of the UNECE region where many women continue to rely on traditional methods – withdrawal in particular – placing them at higher risks of unintended pregnancy and sexually transmitted infections. Lack of funding and commitment to advancing access to the wider range of modern contraceptive methods, misinformation about them, as well as affordability issues for specific population groups are among key limiting factors identified by research on contraceptive use in Eastern Europe and Central Asia.
Air pollution is the most significant environmental risk to human health, causing cardiovascular diseases, stroke, chronic obstructive pulmonary disease and lung cancer. Under SDG target 3.9, countries committed to substantially reduce the number of such deaths and illnesses. Indicator 3.9.1: mortality rate attributed to household and ambient air pollution, is used to monitor progress towards this target. Data are estimated by WHO. Deaths are attributed to air pollution based on the increased risk of disease resulting from exposure to air pollution combined with information how widespread such exposure is in the population.
People can be exposed to air pollution both outdoors (ambient air pollution) and indoors (household air pollution). In 2016, the combined total age-standardized mortality rate attributed to ambient and household air pollution was greatest in Tajikistan (129 deaths per 100,000 persons), Kyrgyzstan (111) and Georgia (102), while Canada, Finland, Sweden, Iceland and Norway all had levels below 10 deaths per 100,000 persons (figure 3H).
In most countries, deaths attributed to air pollution are predominantly caused by ambient air pollution in cities, which results from emissions from industrial activities, households, cars and trucks. These emissions include many air pollutants harmful to health, such as fine particulate matter. The highest mortality rates attributed to ambient air pollution are seen in the countries of Eastern Europe, the Caucasus and Central Asia (EECCA): Tajikistan, Turkmenistan, Kyrgyzstan, Uzbekistan, Georgia, Ukraine, Republic of Moldova, Belarus, Azerbaijan and Kazakhstan. The mortality rate attributed to air pollution is significantly lower in the countries of Western and Northern Europe and North America.
In several UNECE countries, household air pollution remains a significant problem, caused by using polluting fuels for cooking such as kerosene, wood, coal, animal dung, charcoal, and crop wastes. In 2016, more than 40 deaths per 100,000 persons were caused by household air pollution in Tajikistan, Kyrgyzstan, North Macedonia, Bosnia and Herzegovina, Georgia and Montenegro. In Bosnia and Herzegovina, North Macedonia, and Montenegro, household air pollution results in almost as many deaths as ambient air pollution.
33
Figure 3H Age-standardized mortality rate attributed to household air pollution, ambient air pollution, and household and ambient air pollution jointly, in 2016, deaths per 100,000 persons
Source: United Nations Global SDG Database. Explore the data and metadata through the UNECE Dashboard for SDG Indicators.
34
Ensure inclusive and equitable quality education and promote lifelong learning opportunities for all
This section looks at learning outcomes (target 4.1) and skills (target 4.4), and at gender parity in achieving these (target 4.5).
Reaching a minimum proficiency level in reading and mathematics (indicator 4.1.1) reflects the achievement of key education targets, which is measured for most UNECE countries referring to the end of lower secondary education. The UNESCO Institute for Statistics compiles the data based on cross-national learning assessments. For presenting the levels and trends, data from the Programme for International Student Assessment (PISA) assessments of 2009 and 2015 are used below.
While no country reports levels close to universal proficiency, levels above 80 per cent in 2015 are reported for 20 countries (out of 41 with comparable data) for reading proficiency, and for 12 (out of 35) for mathematics proficiency (figures 4A and 4B). The highest reading proficiency levels of 89 per cent are observed in Ireland, Estonia, Canada and Finland; in mathematics, Estonia has the highest level of 89 per cent. Yet, in four countries, less than half of students reach minimum proficiency in mathematics; in two countries this is the case for reading.
From 2009 to 2015, proficiency levels increased in most countries for reading (22 out of 41) as well as in mathematics proficiency (22 out of 35). In both mathematics and reading, the countries with the lowest proficiency levels in 2009 were the strongest improvers, notably Kazakhstan – where reading proficiency increased from 41 to 59 per cent – as well as Georgia and the Republic of Moldova with increases of more than 10 percentage points in both reading and mathematics. While countries with improving proficiency levels are in the majority, progress is uneven, with decreases of more than 5 percentage points in six countries for mathematics proficiency and in five countries for reading proficiency.
At the end of lower secondary education, girls outperform boys in reading proficiency in all countries (figure 4D). The gender parity index in reading proficiency (the ratio of the percentages of proficient girls and boys) even exceeds 1.5 in three countries (North Macedonia, Georgia, Republic of Moldova). In 31 countries, the ratio is above 1.1 and no country has a value below 1.05. In mathematics proficiency, the gender difference is smaller and does not follow a clear pattern—in some countries girls outperform boys and in other countries the opposite is true. Girls do better (a gender parity index above 1.01) in 24 countries while boys do better in 13 countries (index below 0.99). Fifteen countries show almost equal performances (index values from 0.99 to 1.01).
At the end of lower secondary education, proficiency levels in reading and mathematics are
improving. Yet progress is uneven and most countries
remain far from full proficiency.
In the last few years, the proportion of adults with ICT skills has improved in all skill areas measured. Women lag
behind men, especially in programming skills.
35
Figure 4A Proportion of young people at the end of lower secondary education achieving at least minimum proficiency in reading, in 2015 with change from 2009 (or closest year with data), per cent
Source: United Nations Global SDG Database. Explore the data and metadata through the UNECE Dashboard for SDG Indicators.
0 20 40 60 80 100
North MacedoniaGeorgia
Republic of MoldovaMontenegro
BulgariaKazakhstan
TurkeyRomania
CyprusMalta
SlovakiaHungaryGreece
IsraelLuxembourg
LithuaniaAustriaIceland
CzechiaFrance
ItalySwitzerland
CroatiaBelgium
United StatesSweden
NetherlandsUnited Kingdom
LatviaPortugal
Russian FederationSpain
GermanySloveniaDenmark
NorwayPolandFinlandCanadaEstoniaIreland
36
Figure 4B Proportion of young people at the end of lower secondary education achieving at least minimum proficiency in mathematics in 2015 with change from 2009 (or closest year with data), per cent
Source: United Nations Global SDG Database. Explore the data and metadata through the UNECE Dashboard for SDG Indicators.
Information and communications technology (ICT) skills (indicator 4.4.1) are important both for successful integration in the labour market and for benefitting from those technologies. The skills measured for most UNECE countries over several years include copying or moving a file or folder; creating presentations; finding, downloading, installing and configuring software; transferring files between a computer and other devices; using formulas in a spreadsheet; and writing a computer program using a programming language. The International Telecommunications Union and Eurostat collect the data based on harmonized surveys.
The percentages of adults who possess these skills vary widely among UNECE countries. The highest values for most skills range between 70 and 80 per cent, for creating presentations
0 20 40 60 80 100
North MacedoniaGeorgia
MontenegroRepublic of Moldova
BulgariaRomania
GreeceIsrael
CroatiaUnited States
MaltaSlovakia
LuxembourgLithuaniaPortugalIcelandFranceSpain
United KingdomAustria
CzechiaLatvia
SwedenBelgium
Russian FederationPoland
GermanyNorway
NetherlandsSlovenia
SwitzerlandIreland
CanadaDenmark
FinlandEstonia
37
around 50 per cent and for programming just above 10 per cent. The lowest values for all these skills are below 10 per cent.
Comparable data over time cover the period from 2015 to 2017. Over these three years, there was a slight improvement in all the six skills measured. In particular, the skill of finding, downloading, installing and configuring software increased in 30 out of 33 countries with data (figure 4C). The skills of creating presentations and using formulas in a spreadsheet showed the smallest increases, but nonetheless pertaining to more than half of the measured countries (21 out of 36 countries and 20 out of 34, respectively). Nine countries showed improvement in all the six skills, and 30 countries in at least three skills.
Higher percentages of men than women possess these ICT skills. This holds true for 89 per cent of the cases across all countries and skills. Women fare best in the skill of creating presentations, where they outperform men in 11 countries (out of 40), and in work with spreadsheets, where they outperform men in 9 countries (out of 38). Women perform weakest relative to men in the skill of “writing a computer program using a programming language”. Out of the 40 countries with data on this skill, 30 have a parity index lower than 0.5 and only 3 countries have a value above 0.6 (figure 4E).
Figure 4C Percentage of UNECE countries where proportion of adults with ICT skills improved from 2015 to 2017
Source: United Nations Global SDG Database.
0 20 40 60 80 100
Creating electronic presentations withpresentation software
Using basic arithmetic formula in aspreadsheet
Copying or moving a fi le or folder
Transferring fi les between a computer andother devices
Writing a computer program using aspecialized programming language
Finding, downloading, installing andconfiguring software
38
Figure 4D Gender parity indices (female/male) of achieving at least minimum proficiency in mathematics and reading at the end of lower secondary education, 2017
Source: United Nations Global SDG Database.
39
Figure 4E Gender parity indices (female/male) of adults with the skills of “Creating electronic presentations with presentation software” and “Writing a computer program using a specialized programming language”, 2017
Source: United Nations Global SDG Database.
40
Achieve gender equality and empower all women and girls
This section looks at unpaid care and domestic work (target 5.4) and at women’s participation and equal opportunities for leadership (target 5.5). In both areas, the gender gap has been narrowing but remains large in most UNECE countries.
The typically unequal distribution of paid and unpaid work between women and men means that data on time use are essential for analysis of progress towards gender equality. Unpaid work both maintains households and generates household income. Understanding the range of activities undertaken by women and by men, including how much of their time is devoted to unpaid care and domestic work, sheds important light on how gender inequalities play out in people’s day-to-day lived experiences.
Measuring women’s and men’s contributions to unpaid care work is notoriously challenging, as it relies on complex and expensive time-use surveys. For this reason, many countries, including some with highly developed statistical systems, lack recent data. Only data from 2010 or later have been included in this analysis. Discrepancies between the globally-held data presented here and the equivalent data available on the UNECE statistical database arise, in most cases, from different age groups under consideration, as well as differences in reference years for some reported surveys.
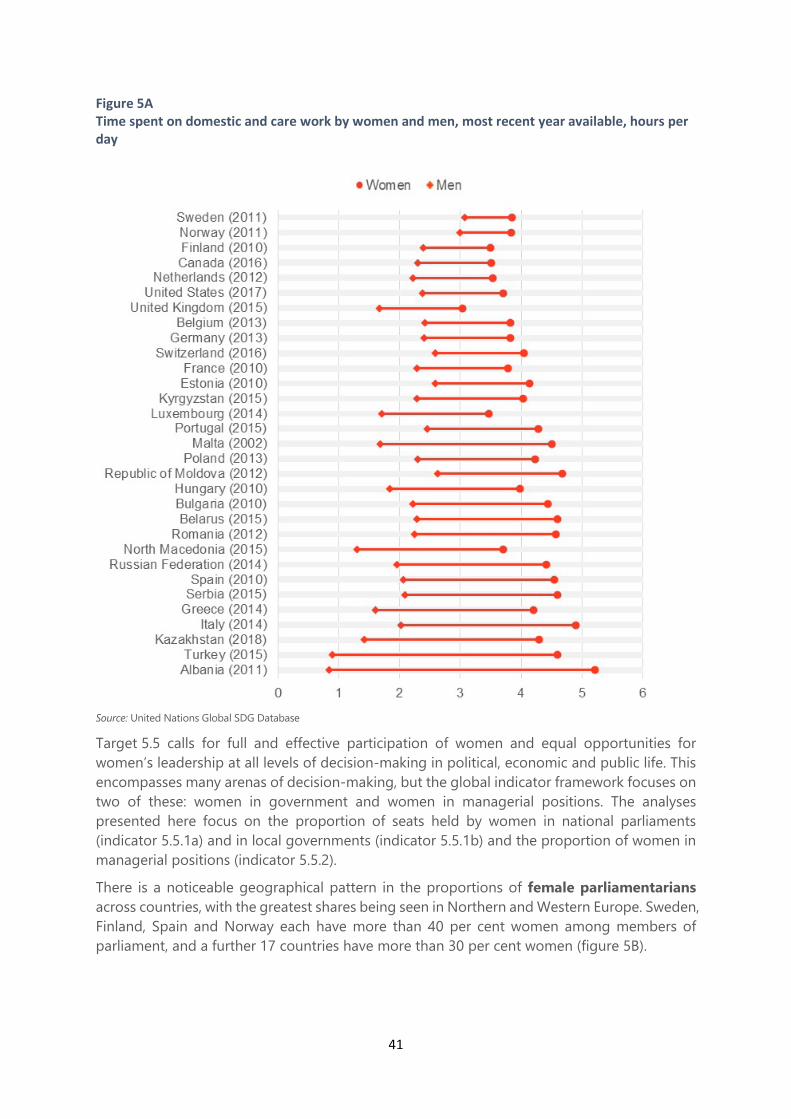
Whilst UNECE countries vary greatly in the amount of time women and men spend in domestic and care work, in all the 30 countries with available data, women spend more time in domestic and care work than men (figure 5A). In Albania the time women spend on these tasks amounts to five hours per day, whereas in the United Kingdom women spend three hours per day on these activities. Other countries are rather evenly distributed in the range of around 3.5 to 4.5 hours.
The gap between women and men is generally largest in the countries where women are most heavily involved in domestic and care work. The largest differences are observed in Albania, where women spend 5.2 hours and men 0.8 hours on these activities; Turkey (4.6 and 0.9 hours); and Kazakhstan (4.3 and 1.4 hours). The gap between women and men is smallest in the Nordic countries – Sweden (3.9 hours for women and 3.1 for men), Norway (3.8 and 3.0) and Finland (3.5 and 2.4).
Women do more domestic and care work than men—and in
countries where women do a lot of such work, there is usually
also a large gender gap.
In most countries, the gender gap in domestic and care work
has been narrowing—yet it remains large.
The representation of women in national parliaments has
increased over the past five years.
The share of women among local government
representatives is close to gender parity in only four UNECE
countries.
The proportion of women among managers has increased since 2012 in three-quarters of
countries, but very few countries are approaching gender parity.
41
Figure 5A Time spent on domestic and care work by women and men, most recent year available, hours per day
Source: United Nations Global SDG Database
Target 5.5 calls for full and effective participation of women and equal opportunities for women’s leadership at all levels of decision-making in political, economic and public life. This encompasses many arenas of decision-making, but the global indicator framework focuses on two of these: women in government and women in managerial positions. The analyses presented here focus on the proportion of seats held by women in national parliaments (indicator 5.5.1a) and in local governments (indicator 5.5.1b) and the proportion of women in managerial positions (indicator 5.5.2).
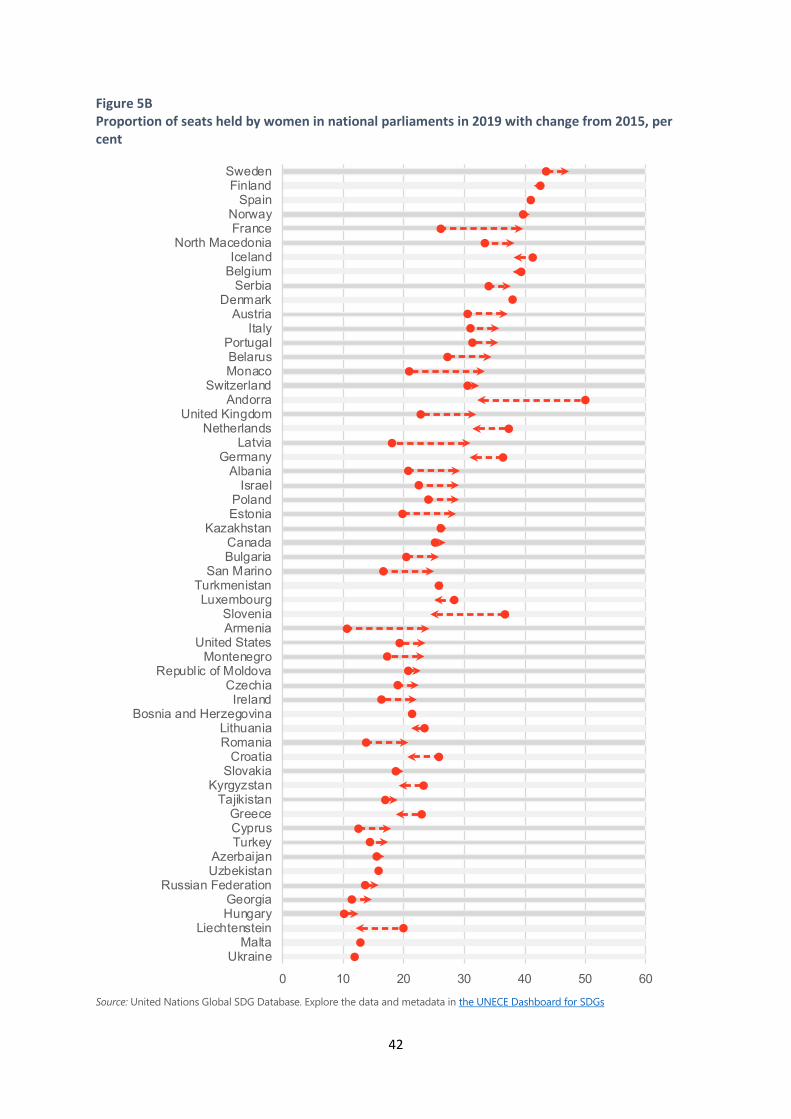
There is a noticeable geographical pattern in the proportions of female parliamentarians across countries, with the greatest shares being seen in Northern and Western Europe. Sweden, Finland, Spain and Norway each have more than 40 per cent women among members of parliament, and a further 17 countries have more than 30 per cent women (figure 5B).
42
Figure 5B Proportion of seats held by women in national parliaments in 2019 with change from 2015, per cent
Source: United Nations Global SDG Database. Explore the data and metadata in the UNECE Dashboard for SDGs
0 10 20 30 40 50 60
UkraineMalta
LiechtensteinHungaryGeorgia
Russian FederationUzbekistanAzerbaijan
TurkeyCyprusGreece
TajikistanKyrgyzstan
SlovakiaCroatia
RomaniaLithuania
Bosnia and HerzegovinaIreland
CzechiaRepublic of Moldova
MontenegroUnited States
ArmeniaSlovenia
LuxembourgTurkmenistan
San MarinoBulgariaCanada
KazakhstanEstoniaPoland
IsraelAlbania
GermanyLatvia
NetherlandsUnited Kingdom
AndorraSwitzerland
MonacoBelarus
PortugalItaly
AustriaDenmark
SerbiaBelgiumIceland
North MacedoniaFranceNorway
SpainFinland
Sweden
43
In 36 countries across the region the share of women parliamentarians increased between 2015, when the SDGs were adopted, and 2019. Among these, four showed a marked increase of more than ten percentage points (Armenia, France, Latvia and Monaco). Meanwhile, six countries (Andorra, Slovenia, Liechtenstein, the Netherlands, Germany and Croatia) saw reductions of more than 5 per cent in the same time period. In the case of Andorra, as for other small nations, it is clear that the small total number of seats in the parliament means that a small absolute change results in a relatively large percentage change.
It is noteworthy that change over time has by no means been either smooth or unidirectional in many countries. Some countries, such as Greece, the United States, Canada, Israel, Albania, Portugal, Italy and North Macedonia have observed steady increases in the share of female parliamentarians, even when viewed over a longer time period since 2000. Others have experienced sharp increases, perhaps reflecting legislative changes such as quotas or rules for gender-balanced candidate lists. Still other countries have witnessed recent retrogression in the share of women in their parliaments.
Another arena of political decision-making power is in local government. The power exercised in local government is of a different kind to that of parliamentarians, and while the same overall trend towards an increase in female representation exists, the shares are different (figure 5C). Belarus, Iceland, Sweden and France have reached or exceeded the threshold of 40 per cent women among seats held in local government, a threshold sometimes considered as approximate gender parity. With 48 per cent women holding seats in the local government, Belarus has the largest proportion. Armenia, Turkey and Romania have the smallest proportions, with 9, 10 and 13 per cent, respectively.
The sex distribution of managers is a reflection of a variety of interlinked influences: different subject-choices between girls and boys and between women and men in education; differential levels of educational attainment and career success; competing demands upon the time of women and men, such as child care, elder care and domestic work; and, in some instances, discrimination. In 2017, approximately one third of all managerial positions across the UNECE region were held by women, with the proportion ranging from 15 per cent in Turkey to 46 per cent in Latvia (figure 5D).
The proportion of women among managers increased over the five-year period in 32 of the 47 countries with data. In ten of these countries the increase was of three percentage points or more, and in three of these (Norway, Albania and Estonia) the increase was of more than six percentage points. Conversely, the proportion of women among managers fell over the same time period in 15 countries, with the greatest falls in Iceland (8 percentage points), Montenegro and France (6 percentage points).
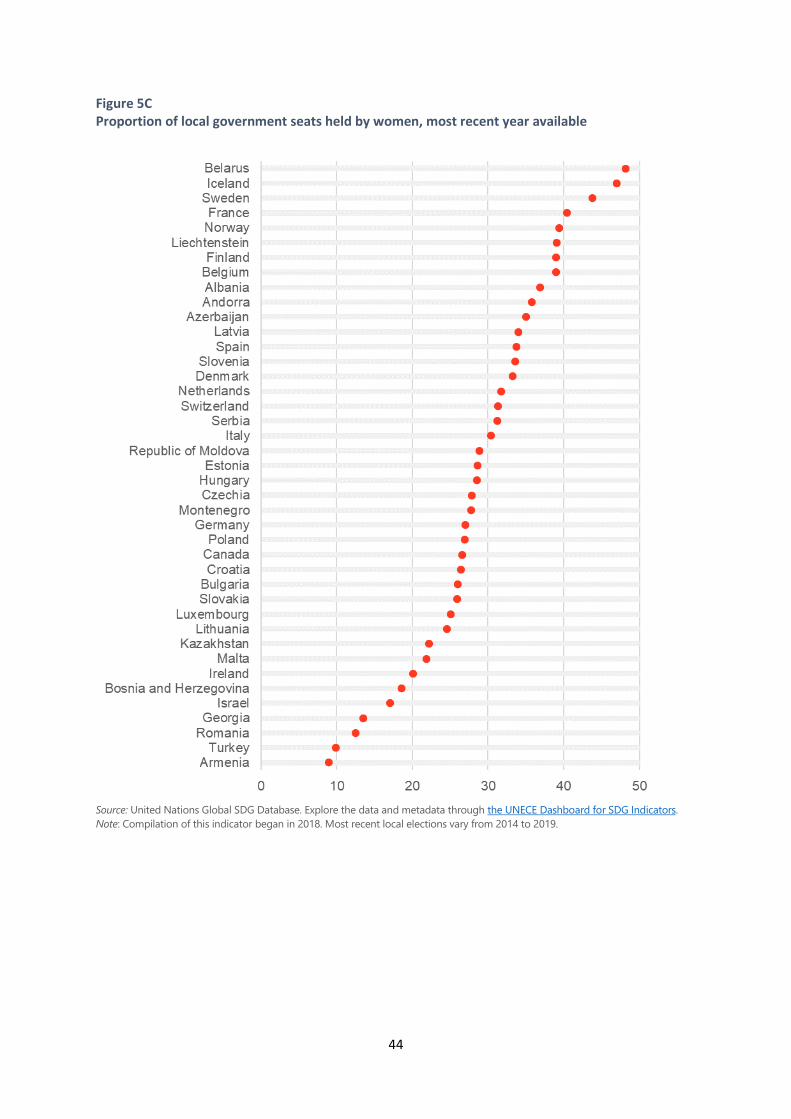
44
Figure 5C Proportion of local government seats held by women, most recent year available
Source: United Nations Global SDG Database. Explore the data and metadata through the UNECE Dashboard for SDG Indicators. Note: Compilation of this indicator began in 2018. Most recent local elections vary from 2014 to 2019.
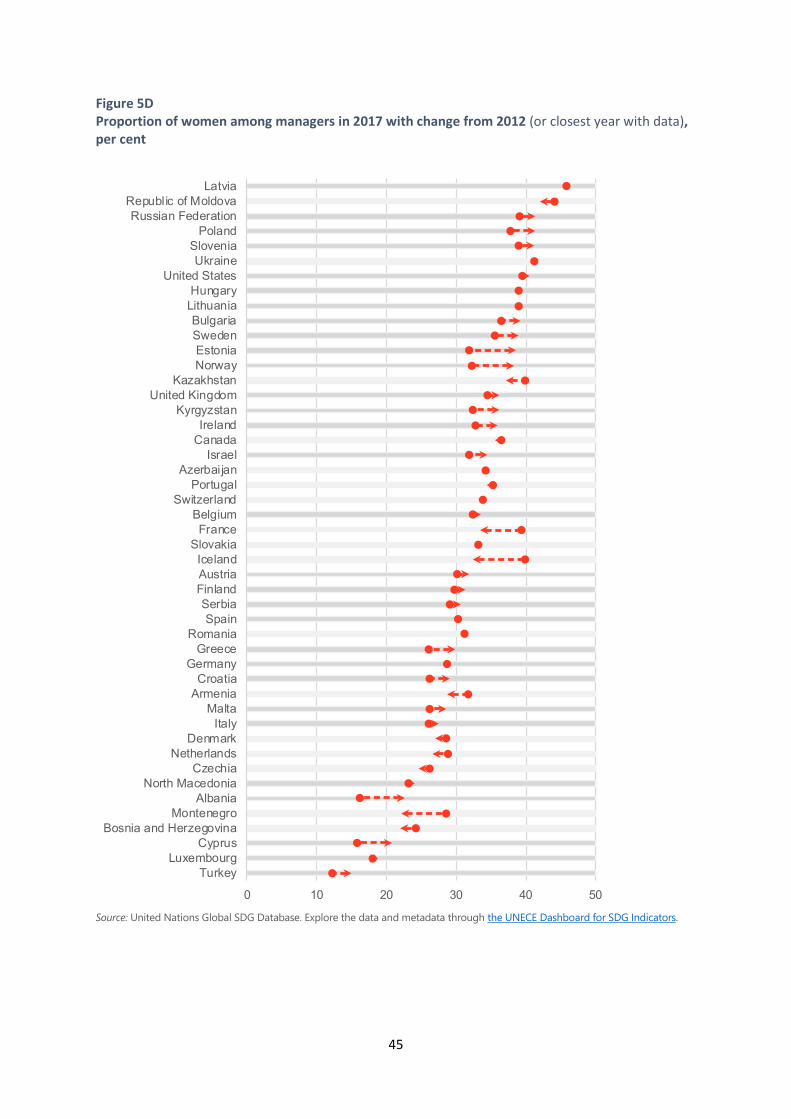
45
Figure 5D Proportion of women among managers in 2017 with change from 2012 (or closest year with data), per cent
Source: United Nations Global SDG Database. Explore the data and metadata through the UNECE Dashboard for SDG Indicators.
0 10 20 30 40 50
TurkeyLuxembourg
CyprusBosnia and Herzegovina
MontenegroAlbania
North MacedoniaCzechia
NetherlandsDenmark
ItalyMalta
ArmeniaCroatia
GermanyGreece
RomaniaSpain
SerbiaFinlandAustriaIceland
SlovakiaFrance
BelgiumSwitzerland
PortugalAzerbaijan
IsraelCanadaIreland
KyrgyzstanUnited Kingdom
KazakhstanNorwayEstoniaSwedenBulgaria
LithuaniaHungary
United StatesUkraine
SloveniaPoland
Russian FederationRepublic of Moldova
Latvia
46
Ensure availability and sustainable management of water and sanitation for all
Goal 6 is concerned with ensuring availability of water and sustainable management of water and sanitation for all. This section looks at management and cooperation over water resources, in particular at the transboundary level (target 6.5), withdrawals and supply of freshwater (target 6.4), quality and treatment of water (target 6.3), and use of safely managed
sanitation services (target 6.1).
Most of the water resources are shared between countries in the UNECE region. Since the development and management of water resources has an impact across transboundary basins, cooperation among countries is required. Water resources are unevenly distributed across the UNECE region, leading to water stress situations in areas where a relative scarcity of renewable water resources meets with a relatively high level of water abstraction (mainly for agricultural irrigation). In some countries the actual annual water abstraction even exceeds the average amount of naturally renewed water, leading to a continuous depletion of water resources in terms of both quantity and quality.
Target 6.5 seeks to implement integrated water resources management (IWRM) at all levels, including through transboundary cooperation. SDG indicator 6.5.2 monitors the proportion of a transboundary basin (river, lake or aquifer system) covered by an ‘operational arrangement’. UNECE and UNESCO collect the data from countries.
Of the 56 UNECE member countries, 52 share transboundary rivers, lakes and aquifers. In the 30 countries with data for 2017 or 2018, on average 80 per cent of national transboundary basins are covered by an operational arrangement (figure 6A). Relatively high levels of operational arrangements throughout UNECE countries reflect a long tradition of cooperation across the region, strengthened by the 1992 Convention on the Protection and Use of Transboundary Watercourses and International Lakes (Water Convention) that counts 41 Parties in the UNECE region. Parties to the Water Convention show higher rates of cooperation, with an average value of 89 per cent for the 27 Parties with data. However, only 14 cover all their transboundary basins by operational arrangements, which implies that much more effort is needed to expand operational cooperation across transboundary waters.
Only 14 UNECE countries have all their transboundary waters
covered by operational arrangements.
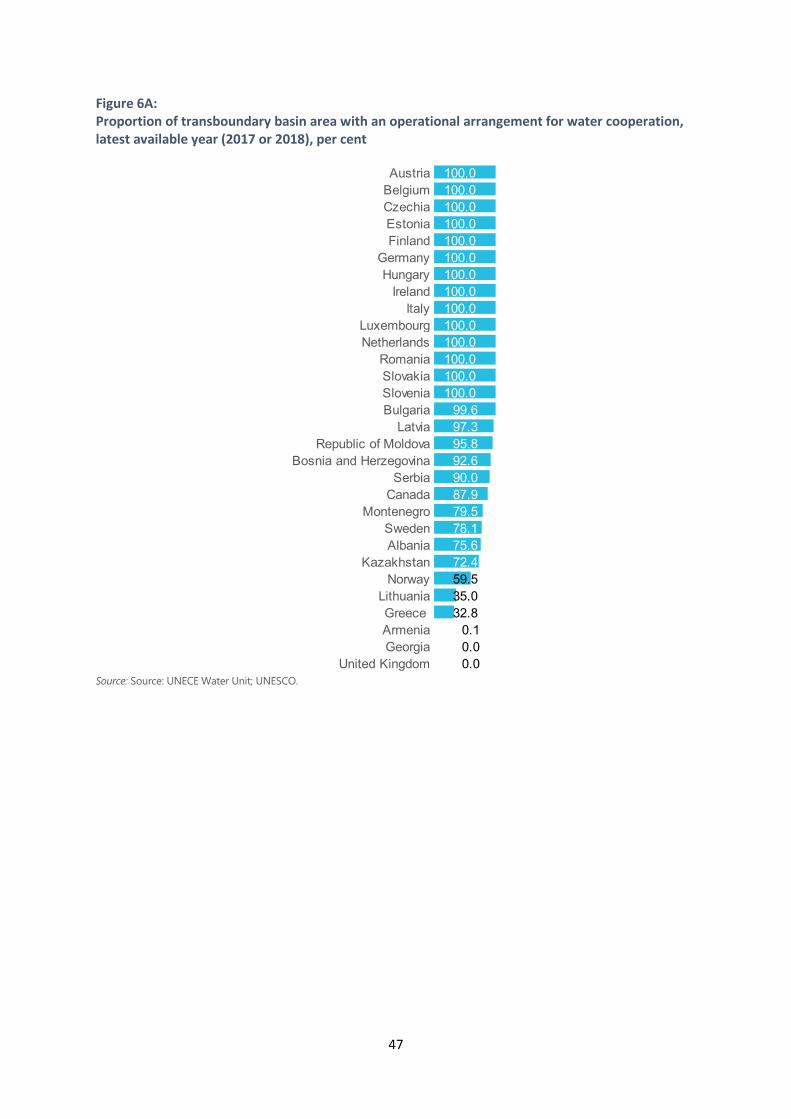
47
Figure 6A: Proportion of transboundary basin area with an operational arrangement for water cooperation, latest available year (2017 or 2018), per cent
Source: Source: UNECE Water Unit; UNESCO.
Austria 100.0Belgium 100.0Czechia 100.0Estonia 100.0Finland 100.0
Germany 100.0Hungary 100.0
Ireland 100.0Italy 100.0
Luxembourg 100.0Netherlands 100.0
Romania 100.0Slovakia 100.0Slovenia 100.0Bulgaria 99.6
Latvia 97.3Republic of Moldova 95.8
Bosnia and Herzegovina 92.6Serbia 90.0
Canada 87.9Montenegro 79.5
Sweden 78.1Albania 75.6
Kazakhstan 72.4Norway 59.5
Lithuania 35.0Greece 32.8 Armenia 0.1Georgia 0.0
United Kingdom 0.0
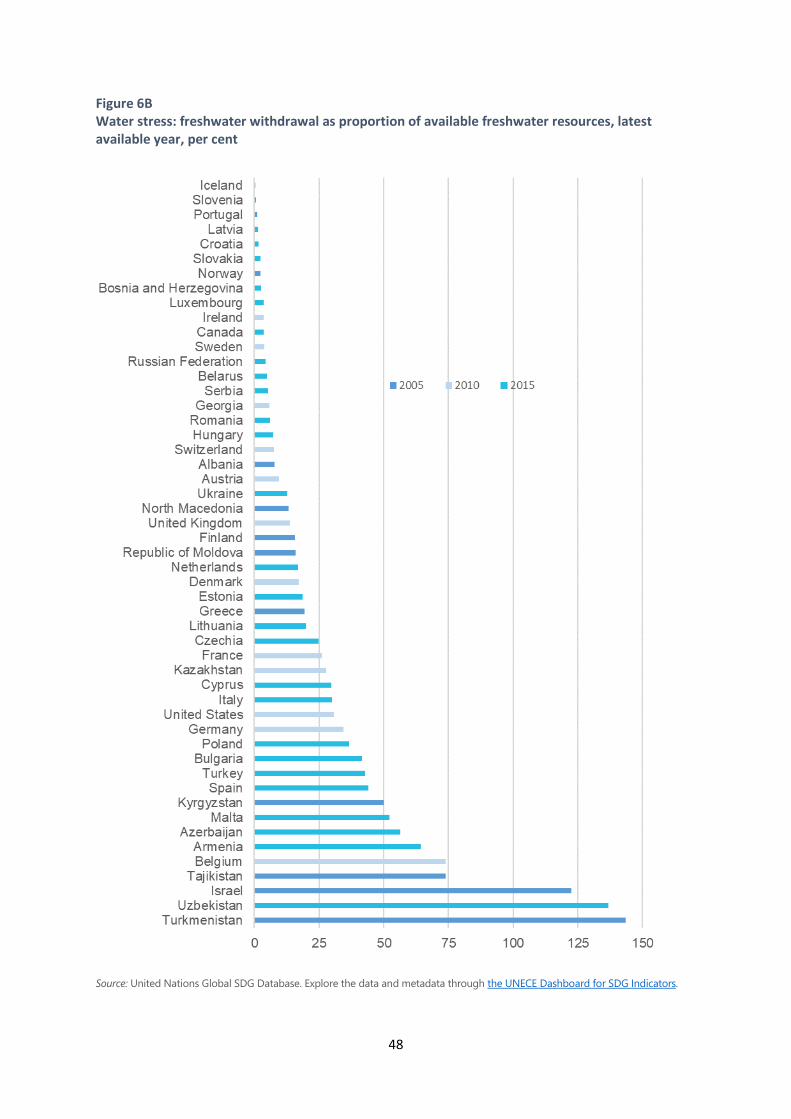
48
Figure 6B Water stress: freshwater withdrawal as proportion of available freshwater resources, latest available year, per cent
Source: United Nations Global SDG Database. Explore the data and metadata through the UNECE Dashboard for SDG Indicators.
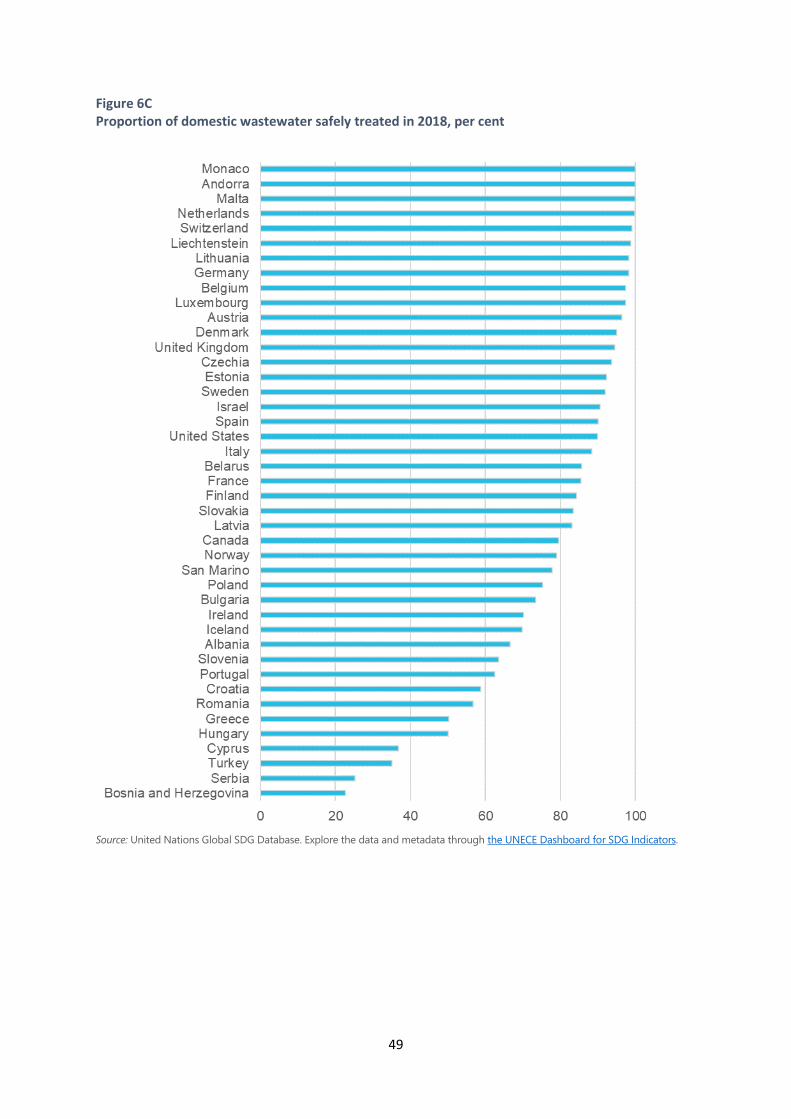
49
Figure 6C Proportion of domestic wastewater safely treated in 2018, per cent
Source: United Nations Global SDG Database. Explore the data and metadata through the UNECE Dashboard for SDG Indicators.
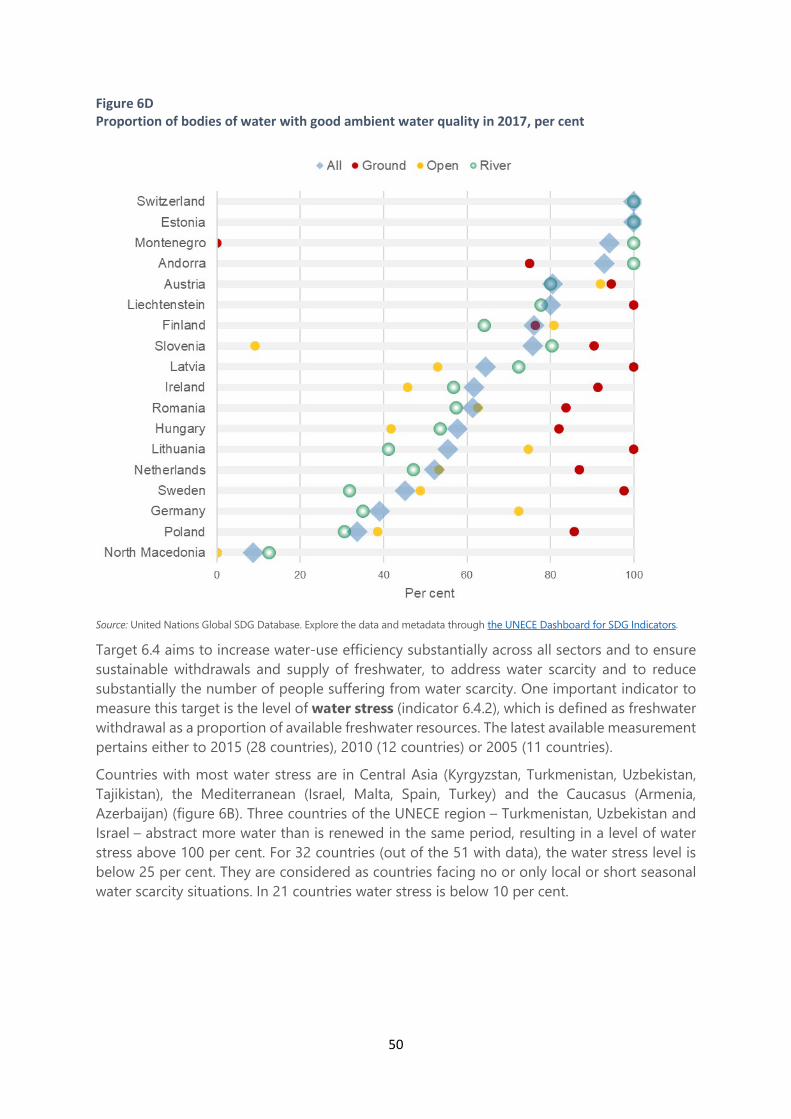
50
Figure 6D Proportion of bodies of water with good ambient water quality in 2017, per cent
Source: United Nations Global SDG Database. Explore the data and metadata through the UNECE Dashboard for SDG Indicators.
Target 6.4 aims to increase water-use efficiency substantially across all sectors and to ensure sustainable withdrawals and supply of freshwater, to address water scarcity and to reduce substantially the number of people suffering from water scarcity. One important indicator to measure this target is the level of water stress (indicator 6.4.2), which is defined as freshwater withdrawal as a proportion of available freshwater resources. The latest available measurement pertains either to 2015 (28 countries), 2010 (12 countries) or 2005 (11 countries).
Countries with most water stress are in Central Asia (Kyrgyzstan, Turkmenistan, Uzbekistan, Tajikistan), the Mediterranean (Israel, Malta, Spain, Turkey) and the Caucasus (Armenia, Azerbaijan) (figure 6B). Three countries of the UNECE region – Turkmenistan, Uzbekistan and Israel – abstract more water than is renewed in the same period, resulting in a level of water stress above 100 per cent. For 32 countries (out of the 51 with data), the water stress level is below 25 per cent. They are considered as countries facing no or only local or short seasonal water scarcity situations. In 21 countries water stress is below 10 per cent.
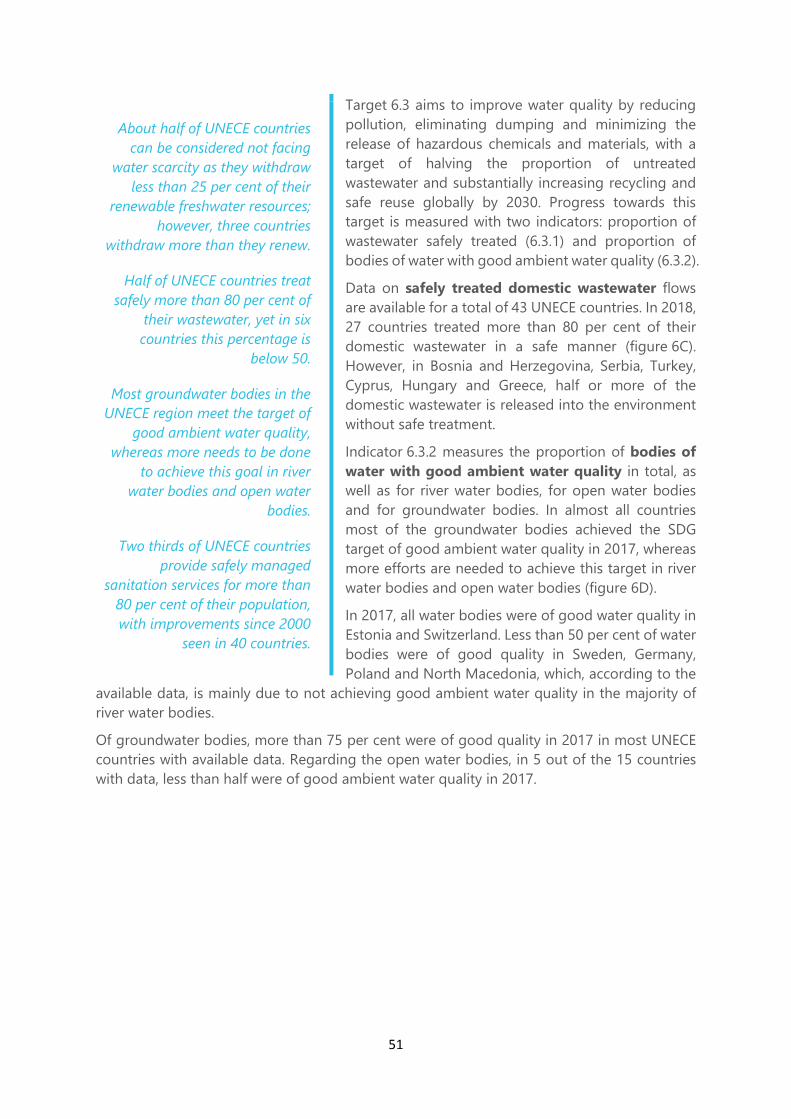
51
Target 6.3 aims to improve water quality by reducing pollution, eliminating dumping and minimizing the release of hazardous chemicals and materials, with a target of halving the proportion of untreated wastewater and substantially increasing recycling and safe reuse globally by 2030. Progress towards this target is measured with two indicators: proportion of wastewater safely treated (6.3.1) and proportion of bodies of water with good ambient water quality (6.3.2).
Data on safely treated domestic wastewater flows are available for a total of 43 UNECE countries. In 2018, 27 countries treated more than 80 per cent of their domestic wastewater in a safe manner (figure 6C). However, in Bosnia and Herzegovina, Serbia, Turkey, Cyprus, Hungary and Greece, half or more of the domestic wastewater is released into the environment without safe treatment.
Indicator 6.3.2 measures the proportion of bodies of water with good ambient water quality in total, as well as for river water bodies, for open water bodies and for groundwater bodies. In almost all countries most of the groundwater bodies achieved the SDG target of good ambient water quality in 2017, whereas more efforts are needed to achieve this target in river water bodies and open water bodies (figure 6D).
In 2017, all water bodies were of good water quality in Estonia and Switzerland. Less than 50 per cent of water bodies were of good quality in Sweden, Germany, Poland and North Macedonia, which, according to the
available data, is mainly due to not achieving good ambient water quality in the majority of river water bodies.
Of groundwater bodies, more than 75 per cent were of good quality in 2017 in most UNECE countries with available data. Regarding the open water bodies, in 5 out of the 15 countries with data, less than half were of good ambient water quality in 2017.
About half of UNECE countries can be considered not facing
water scarcity as they withdraw less than 25 per cent of their
renewable freshwater resources; however, three countries
withdraw more than they renew.
Half of UNECE countries treat safely more than 80 per cent of
their wastewater, yet in six countries this percentage is
below 50.
Most groundwater bodies in the UNECE region meet the target of
good ambient water quality, whereas more needs to be done
to achieve this goal in river water bodies and open water
bodies.
Two thirds of UNECE countries provide safely managed
sanitation services for more than 80 per cent of their population, with improvements since 2000
seen in 40 countries.
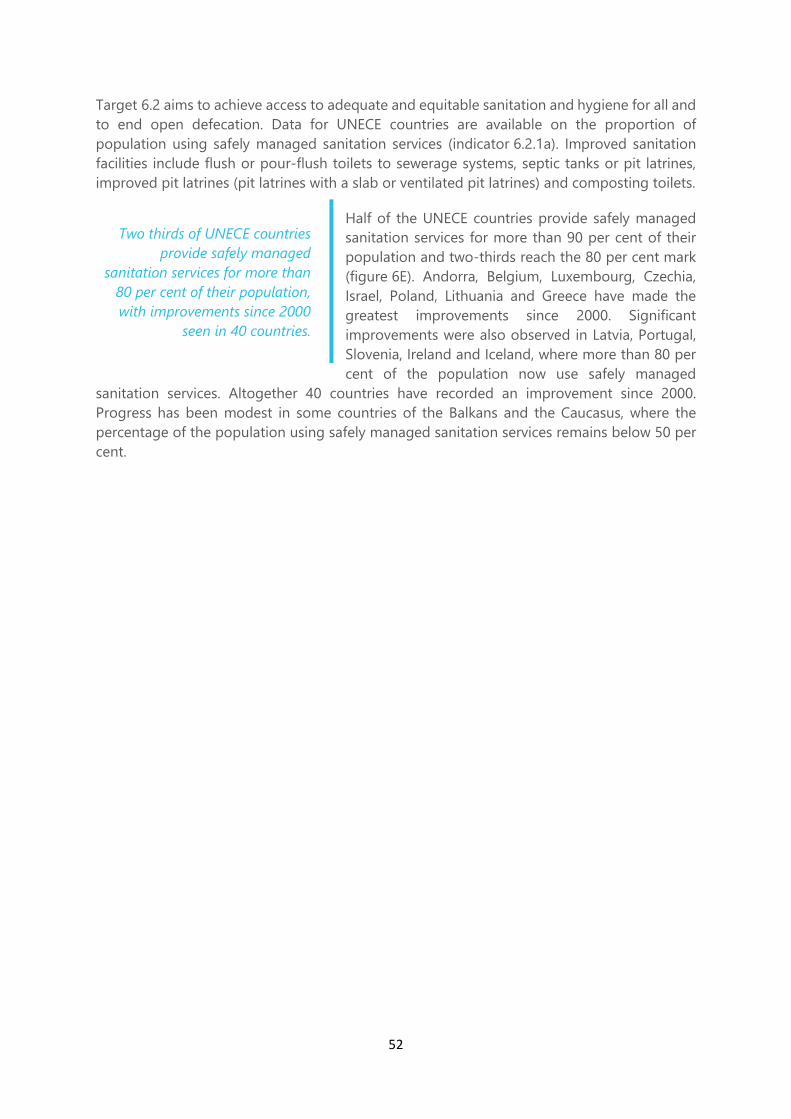
52
Target 6.2 aims to achieve access to adequate and equitable sanitation and hygiene for all and to end open defecation. Data for UNECE countries are available on the proportion of population using safely managed sanitation services (indicator 6.2.1a). Improved sanitation facilities include flush or pour-flush toilets to sewerage systems, septic tanks or pit latrines, improved pit latrines (pit latrines with a slab or ventilated pit latrines) and composting toilets.
Half of the UNECE countries provide safely managed sanitation services for more than 90 per cent of their population and two-thirds reach the 80 per cent mark (figure 6E). Andorra, Belgium, Luxembourg, Czechia, Israel, Poland, Lithuania and Greece have made the greatest improvements since 2000. Significant improvements were also observed in Latvia, Portugal, Slovenia, Ireland and Iceland, where more than 80 per cent of the population now use safely managed
sanitation services. Altogether 40 countries have recorded an improvement since 2000. Progress has been modest in some countries of the Balkans and the Caucasus, where the percentage of the population using safely managed sanitation services remains below 50 per cent.
Two thirds of UNECE countries provide safely managed
sanitation services for more than 80 per cent of their population, with improvements since 2000
seen in 40 countries.
53
Figure 6E Proportion of population using safely managed sanitation services in 2017 with change from 2000, per cent
Source: United Nations Global SDG Database. Explore the data and metadata through the UNECE Dashboard for SDG Indicators.
0 20 40 60 80 100
North MacedoniaBosnia and Herzegovina
SerbiaGeorgiaAlbania
ArmeniaCroatia
Russian FederationBulgaria
TurkeyUkraineCyprusNorway
RomaniaSan Marino
EuropeBelarusIcelandIreland
SlovakiaSloveniaPortugal
LatviaFrance
United StatesGreece
LithuaniaMalta
PolandSweden
IsraelCzechia
GreenlandDenmarkHungary
ItalySpain
LuxembourgAustria
BelgiumGermany
EstoniaNetherlands
United KingdomFinland
SwitzerlandLiechtenstein
MonacoAndorra
54
Ensure access to affordable, reliable, sustainable and modern energy for all
Goal 7 aims to ensure access to affordable, reliable, sustainable and modern energy for all. Energy is crucial for achieving the Sustainable Development Goals. Access to affordable energy is an indispensable prerequisite for development of the economy and infrastructure. The switch to clean sources of energy and greater energy efficiency are also indispensable for climate action to be effective (as seen in the targets under SDG 13). In the UNECE region, the proportion of the population with access to electricity is reported to be 100 per cent. To analyze progress towards goal 7, this section therefore focuses on the share of renewable energy in the energy mix (target 7.2) and on energy efficiency (target 7.3). For both targets, steady improvements have been observed in the region in the period from 2000 to 2016.
Target 7.2 is to increase substantially the share of renewable energy in the global mix. It is assessed by indicator 7.2.1: renewable energy share in total final energy consumption. Renewable energy includes solar, wind, ocean, hydropower, geothermal resources, and bioenergy. The change in the share of renewables in percentage points is shown for 43 countries of the UNECE region between the two five-year periods 2002-2006 and 2012-2016 (figure 7A). These five-year-averages were taken to smooth out the weather effects in single years, since renewable energy production and consumption in many countries depend to a large extent on wind, solar radiation, precipitation and temperatures. In all countries, the share of renewable energy consumption rose in the observed period. In 2016, Europe and North America, with a renewable energy share of 12.3 per cent, were well below the global average of 17.5 per cent.
Target 7.3 is to double the global rate of improvement in energy efficiency by 2030. Here, indicator 7.3.1: energy intensity measured in terms of primary energy and GDP serves as the basis for analysis. Energy intensity is an indication of how much energy is used to produce one unit of economic output. It is hence a proxy and not an exact measure of energy efficiency, and it can be affected by several factors, such as climate, the structure of the economy, the nature of economic activities, etc., that are not necessarily linked to pure efficiency. In the dataset this is visible in the increase in energy intensity for many countries during or after the global financial crisis. This can be assumed to stem from a drop in GDP in that period rather than from a structural change in energy consumption.
Renewable energy consumption as a share of all energy consumption has increased steadily in UNECE countries over recent years.
In 2016, the renewable energy share of 12.3 per cent in Europe and North America was below the global average of 17.5 per cent.
Energy intensity, the amount of energy used to power the economy, has decreased in most UNECE countries in recent years, with the largest reductions in Eastern and South-eastern Europe and Central Asia. This suggests these countries’ economies are becoming more energy efficient.
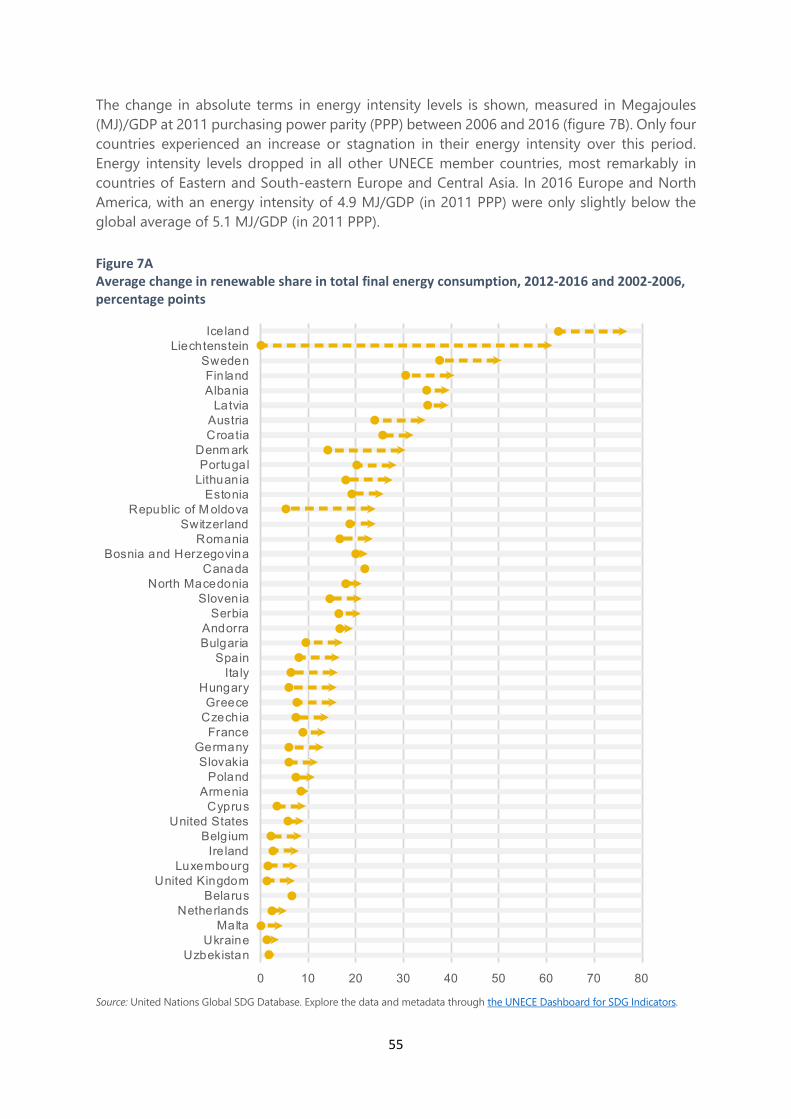
55
The change in absolute terms in energy intensity levels is shown, measured in Megajoules (MJ)/GDP at 2011 purchasing power parity (PPP) between 2006 and 2016 (figure 7B). Only four countries experienced an increase or stagnation in their energy intensity over this period. Energy intensity levels dropped in all other UNECE member countries, most remarkably in countries of Eastern and South-eastern Europe and Central Asia. In 2016 Europe and North America, with an energy intensity of 4.9 MJ/GDP (in 2011 PPP) were only slightly below the global average of 5.1 MJ/GDP (in 2011 PPP).
Figure 7A Average change in renewable share in total final energy consumption, 2012-2016 and 2002-2006, percentage points
Source: United Nations Global SDG Database. Explore the data and metadata through the UNECE Dashboard for SDG Indicators.
0 10 20 30 40 50 60 70 80
UzbekistanUkraine
MaltaNetherlands
BelarusUnited Kingdom
LuxembourgIreland
BelgiumUnited States
CyprusArmenia
PolandSlovakia
GermanyFrance
CzechiaGreece
HungaryItaly
SpainBulgariaAndorra
SerbiaSlovenia
North MacedoniaCanada
Bosnia and HerzegovinaRomania
SwitzerlandRepublic of M oldova
EstoniaLithuaniaPortugal
Denm arkCroatiaAustriaLatvia
AlbaniaFinland
SwedenLiechtenstein
Iceland
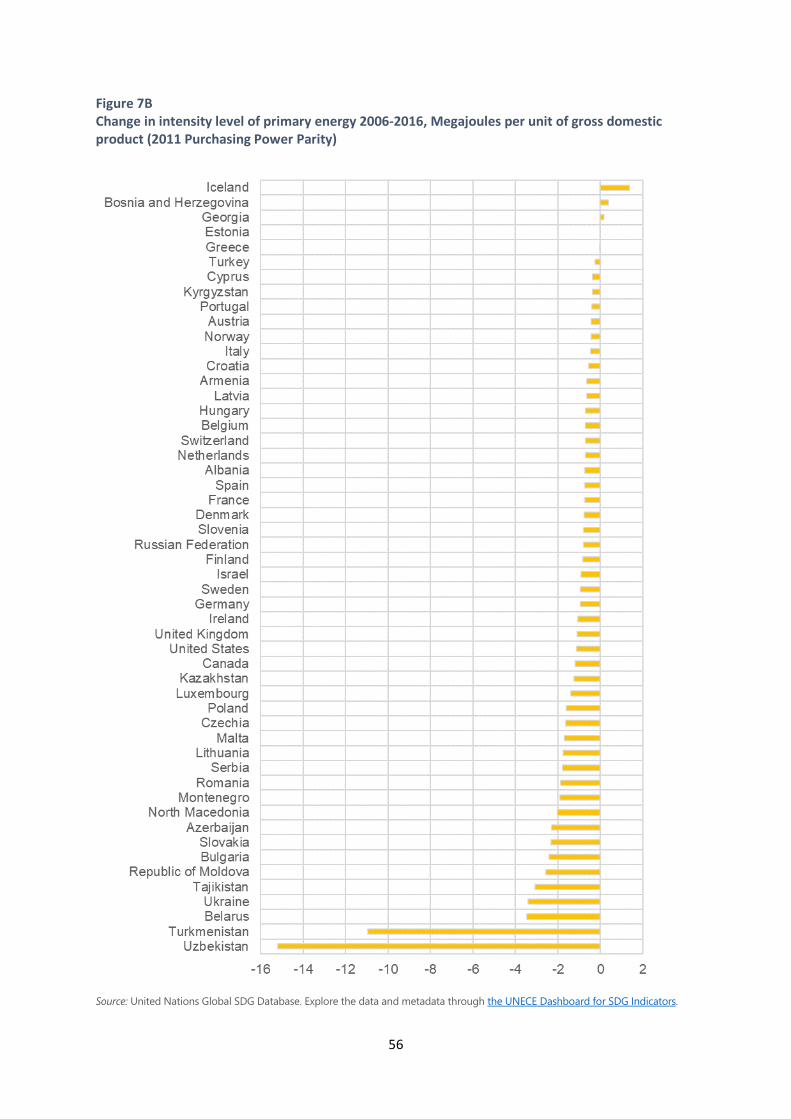
56
Figure 7B Change in intensity level of primary energy 2006-2016, Megajoules per unit of gross domestic product (2011 Purchasing Power Parity)
Source: United Nations Global SDG Database. Explore the data and metadata through the UNECE Dashboard for SDG Indicators.
57
Promote sustained, inclusive and sustainable economic growth, full and productive employment and decent work for all
Goal 8 aims at promoting sustained, inclusive and sustainable economic growth, full and productive employment and decent work for all. Progress towards this goal requires, for instance, innovations and new production technologies, improved labour productivity, reduced unemployment (especially among young people) and policies towards creating societies with decent and equal job opportunities. This section reviews how UNECE countries are faring to sustain per capita economic growth (target 8.1) and achieve higher levels of economic productivity (target 8.2). This section also looks at target 8.6 which is to reduce the proportion of youth not in employment, education or training.
Target 8.1 is monitored by indicator 8.1.1: annual growth rate of real gross domestic product (GDP) per capita. GDP per capita is often taken as a proxy for the average standard of living of a country’s population. GDP is a measure of economic welfare and does not take into account social and environmental aspects of well-being.
The simple average of GDP growth rates in UNECE countries and in certain subgroups illustrates the key trends (figure 8A). Real GDP per capita has grown faster in the countries of Eastern Europe, the Caucasus and Central Asia (EECCA) than in other countries in the UNECE region – except in 2015 and 2016. In addition, Western Balkan countries (Albania, Bosnia and Herzegovina, Montenegro, North Macedonia and Serbia) have slightly surpassed the UNECE average in most years. Since 2015, the average growth rate of real GDP per capita in EU member countries has also been above the UNECE average. The real GDP per capita has grown every year since 2000 in Albania, Poland, Tajikistan, Turkmenistan and Uzbekistan.
Target 8.2 is monitored by indicator 8.2.1: annual growth rate of real GDP per employed person. This is a measure of labour productivity, that is, the amount of output produced by those who are employed. It does not consider another important factor of economic growth – increased employment.
The patterns of growth are illustrated for the same subregions of UNECE as were shown for indicator 8.1.1 (figure 8B) and are broadly similar for the two indicators. On average, the growth rate of real GDP per employed person is typically a touch below the per capita growth. However, the financial crisis changed this pattern for two years. In 2009, the real GDP per employed person diminished less than did GDP per capita – since a smaller share of the total population was employed during this time. In the following year, this indicator showed
Economic growth in UNECE countries is stable, but the pace
is still slower than before the financial crisis of 2008.
Economic growth has been driven by increasing
employment more than by productivity growth.
Increased employment explains a larger share of economic
growth than improved labour productivity.
The share of youth not in employment, education or
training has declined in recent years but remains at pre-
financial crisis levels.
58
somewhat faster growth. The only countries in which real GDP per employed person has grown every year since 2000 are Poland and Tajikistan.
Real GDP per capita has been growing at a faster pace than GDP per employed person. This indicates that the contribution of increasing employment to GDP growth has been greater than that of improved labour productivity. Increases in both employment and productivity are needed, however, to progress towards the Sustainable Development Goals.
The share of youth not in employment, education or training (the youth NEET rate, indicator 8.6.1) represents the share of young people who have the potential to contribute to economic growth and to their own personal development but are not able or willing to do so. This measure goes beyond youth unemployment and inactivity rates as it looks at all young people – those outside the labour force and those not undertaking any learning activities.
Substantially reducing the youth NEET rate is an important element of the decent work and economic growth goal since not being in education or employment might have further implications throughout a young person’s life, such as reduced financial security, fewer opportunities for work or restricted prospects for personal growth. The measure also provides an indication of the untapped potential of youth who would potentially be available for work and thus contributing to the economic growth of a country, but are not doing so – hence, reducing the youth NEET rate would mean increasing the contribution of youth to economic growth.
The overall NEET rate varies greatly among UNECE countries (figure 8C). The lowest proportions of youth not in education, employment or training in 2017 were in Iceland (4 per cent), the Netherlands (4) and Norway (5), while the highest values were seen in Armenia (37 per cent), Moldova (28) and North Macedonia (25).
The median NEET rate for UNECE countries has declined in recent years. The largest decreases between 2010 and 2017 can be seen in Israel, Ireland, Turkey and Armenia. The NEET rate dropped between 2010 and 2017 in 36 out of the 44 countries presented, and the median rate decreased by 2.8 percentage points between 2010 (13.8 per cent) and 2017 (11.0 per cent). However, the median NEET rate for the UNECE region in 2007 was 11.0 per cent – the same as in 2017. The large fluctuations in NEET rates over time can be attributed to the financial crisis and its impact on youth employment.
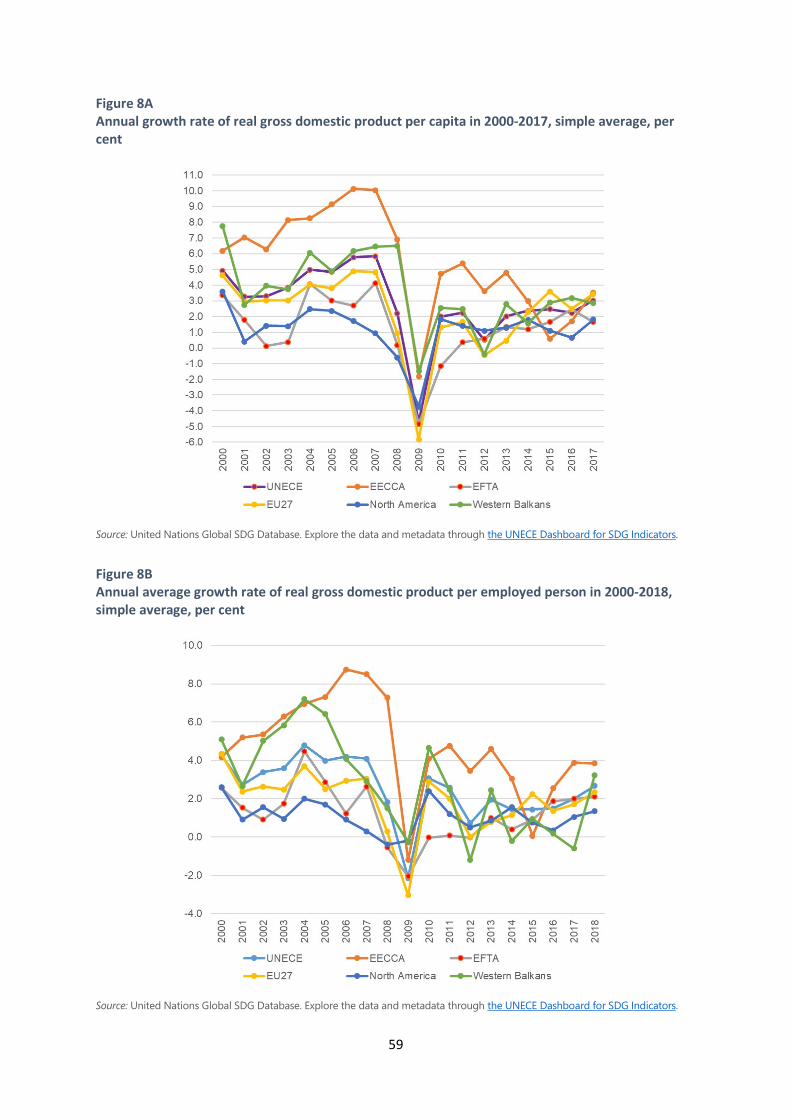
59
Figure 8A Annual growth rate of real gross domestic product per capita in 2000-2017, simple average, per cent
Source: United Nations Global SDG Database. Explore the data and metadata through the UNECE Dashboard for SDG Indicators.
Figure 8B Annual average growth rate of real gross domestic product per employed person in 2000-2018, simple average, per cent
Source: United Nations Global SDG Database. Explore the data and metadata through the UNECE Dashboard for SDG Indicators.
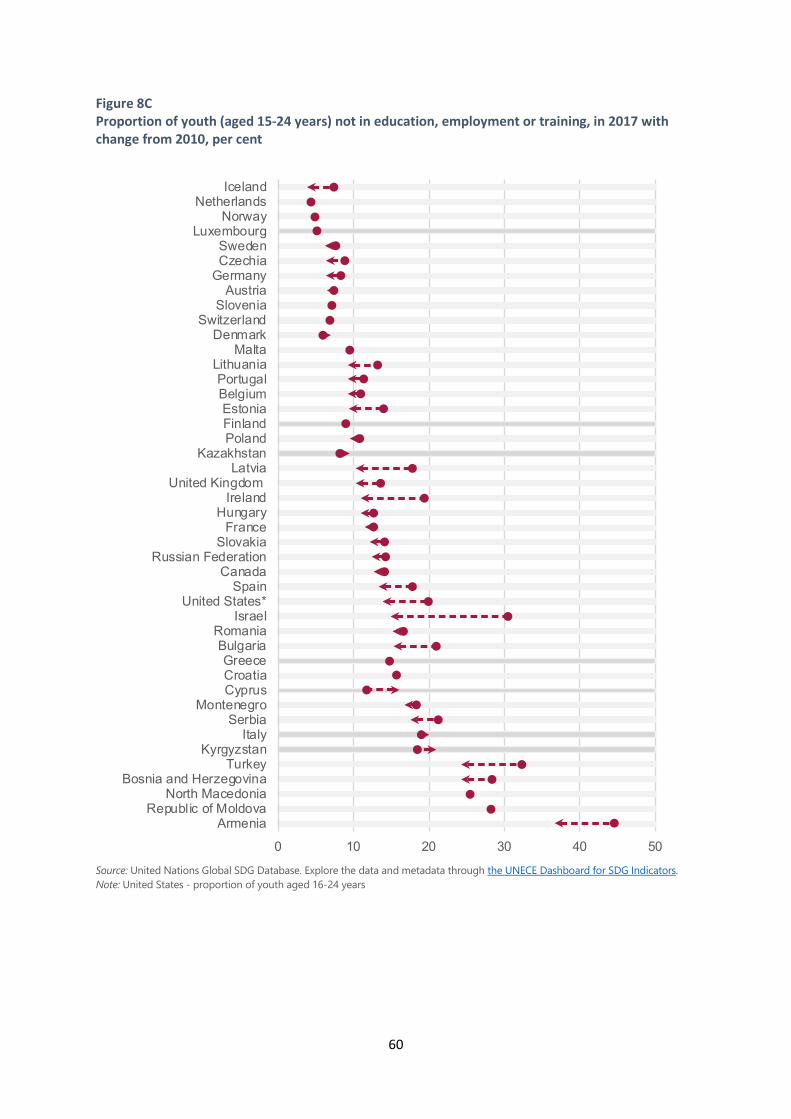
60
Figure 8C Proportion of youth (aged 15-24 years) not in education, employment or training, in 2017 with change from 2010, per cent
Source: United Nations Global SDG Database. Explore the data and metadata through the UNECE Dashboard for SDG Indicators. Note: United States - proportion of youth aged 16-24 years
0 10 20 30 40 50
ArmeniaRepublic of Moldova
North MacedoniaBosnia and Herzegovina
TurkeyKyrgyzstan
ItalySerbia
MontenegroCyprusCroatiaGreece
BulgariaRomania
IsraelUnited States*
SpainCanada
Russian FederationSlovakia
FranceHungary
IrelandUnited Kingdom
LatviaKazakhstan
PolandFinlandEstoniaBelgiumPortugal
LithuaniaMalta
DenmarkSwitzerland
SloveniaAustria
GermanyCzechiaSweden
LuxembourgNorway
NetherlandsIceland
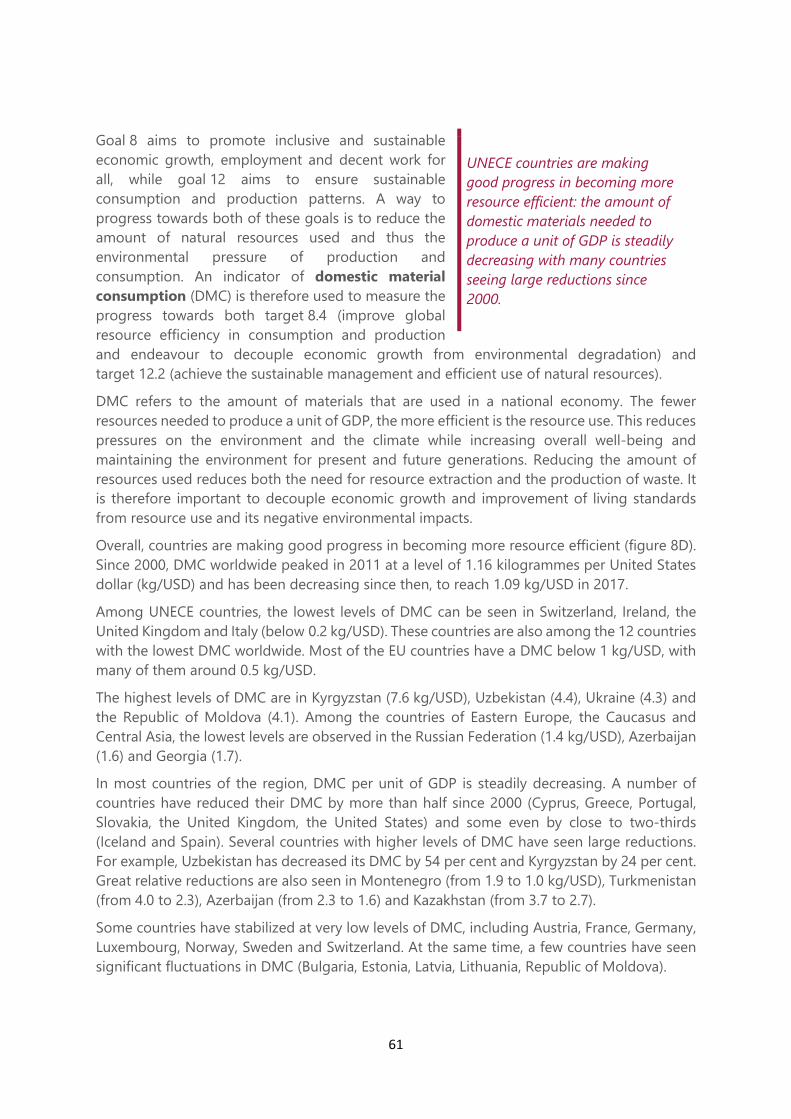
61
Goal 8 aims to promote inclusive and sustainable economic growth, employment and decent work for all, while goal 12 aims to ensure sustainable consumption and production patterns. A way to progress towards both of these goals is to reduce the amount of natural resources used and thus the environmental pressure of production and consumption. An indicator of domestic material consumption (DMC) is therefore used to measure the progress towards both target 8.4 (improve global resource efficiency in consumption and production and endeavour to decouple economic growth from environmental degradation) and target 12.2 (achieve the sustainable management and efficient use of natural resources).
DMC refers to the amount of materials that are used in a national economy. The fewer resources needed to produce a unit of GDP, the more efficient is the resource use. This reduces pressures on the environment and the climate while increasing overall well-being and maintaining the environment for present and future generations. Reducing the amount of resources used reduces both the need for resource extraction and the production of waste. It is therefore important to decouple economic growth and improvement of living standards from resource use and its negative environmental impacts.
Overall, countries are making good progress in becoming more resource efficient (figure 8D). Since 2000, DMC worldwide peaked in 2011 at a level of 1.16 kilogrammes per United States dollar (kg/USD) and has been decreasing since then, to reach 1.09 kg/USD in 2017.
Among UNECE countries, the lowest levels of DMC can be seen in Switzerland, Ireland, the United Kingdom and Italy (below 0.2 kg/USD). These countries are also among the 12 countries with the lowest DMC worldwide. Most of the EU countries have a DMC below 1 kg/USD, with many of them around 0.5 kg/USD.
The highest levels of DMC are in Kyrgyzstan (7.6 kg/USD), Uzbekistan (4.4), Ukraine (4.3) and the Republic of Moldova (4.1). Among the countries of Eastern Europe, the Caucasus and Central Asia, the lowest levels are observed in the Russian Federation (1.4 kg/USD), Azerbaijan (1.6) and Georgia (1.7).
In most countries of the region, DMC per unit of GDP is steadily decreasing. A number of countries have reduced their DMC by more than half since 2000 (Cyprus, Greece, Portugal, Slovakia, the United Kingdom, the United States) and some even by close to two-thirds (Iceland and Spain). Several countries with higher levels of DMC have seen large reductions. For example, Uzbekistan has decreased its DMC by 54 per cent and Kyrgyzstan by 24 per cent. Great relative reductions are also seen in Montenegro (from 1.9 to 1.0 kg/USD), Turkmenistan (from 4.0 to 2.3), Azerbaijan (from 2.3 to 1.6) and Kazakhstan (from 3.7 to 2.7).
Some countries have stabilized at very low levels of DMC, including Austria, France, Germany, Luxembourg, Norway, Sweden and Switzerland. At the same time, a few countries have seen significant fluctuations in DMC (Bulgaria, Estonia, Latvia, Lithuania, Republic of Moldova).
UNECE countries are making good progress in becoming more resource efficient: the amount of domestic materials needed to produce a unit of GDP is steadily decreasing with many countries seeing large reductions since 2000.
62
Figure 8D Domestic material consumption (DMC) per unit of gross domestic product in 2017 with change from 2000, kilogrammes per constant 2010 United States dollar
Source: United Nations Global SDG Database.
0 2 4 6 8 10
KyrgyzstanUzbekistan
UkraineRepublic of M oldova
TajikistanNorth Macedonia
BelarusKazakhstan
ArmeniaSerbia*
BulgariaTurkmenistan
AlbaniaBosnia and Herzegovina
EstoniaGeorgia
AzerbaijanRussian Federation
TurkeyPoland
RomaniaLatvia
HungaryMontenegro*
LithuaniaCzechiaCanada
MaltaSloveniaSlovakiaFinlandGreeceCyprusCroatia
IsraelBelgium
United StatesPortugal
AustriaGermanySwedenFrance
NetherlandsDenm ark
LuxembourgSpain
NorwayIceland
ItalyUnited Kingdom
IrelandSwitzerland
63
Build resilient infrastructure, promote inclusive and sustainable industrialization and foster innovation
Goal 9 aims to build resilient infrastructure, promote inclusive and sustainable industrialization and foster innovation. Investment in sustainable infrastructure and scientific and technological research increases economic growth, creates jobs and promotes prosperity. Increased resource-use efficiency and greater adoption of clean and environmentally sound technologies and industrial processes are necessary to make infrastructure and industries sustainable by 2030.
Target 9.5 on scientific research and technological capabilities is measured by indicator 9.5.1: research and development (R&D) expenditure as a proportion of gross domestic product (GDP). This ratio is referred to as R&D/GDP. Of the 46 countries with available data, 21 experienced an increase in the R&D/GDP ratio between 2006 and 2016, while seven countries saw a decrease (figure 9A). In the remaining 18 countries the R&D/GDP ratio remained constant or almost constant. Looking at the R&D/GDP ratios in 2016, expenditure on research and development represents between close to 0 per cent and just above 4 per cent of GDP. With a few exceptions, countries with R&D/GDP ratios above 1 per cent are in Western Europe and North America, while countries with ratios below 1 per cent are mainly in South-Eastern Europe, the Caucasus and Central Asia. Only three countries – Israel, Sweden and Austria – have an R&D/GDP ratio above 3 per cent. A larger group of countries – Germany, Denmark, Finland, the United States, Belgium, France, Iceland, Norway, the Netherlands and Slovenia – have R&D/GDP ratios between 2 and 3 per cent. Five countries have ratios at 0.2 per cent or below.
Target 9.b on domestic technology development and innovation can be tracked by measures including indicator 9.b.1: proportion of medium and high-tech industry value added in total value added. This is an indication of the extent to which developing and advancing technology and fostering new ideas contribute to the economy. Half of the 50 countries with data experienced an increase in the share of medium and high-tech value added between 2006 and 2016 (figure 9B). Ten countries experienced a decrease. In the remaining countries the ratio of medium and high-tech value added stayed almost constant. Looking at the share of medium and high-tech industry value added in 2016, a group of nine countries (Switzerland, Germany, Hungary, Ireland, Denmark, Sweden, Czechia, Slovakia and France) experienced ratios above
Expenditure on research and development as a proportion of
GDP increased between 2006 and 2016 in 21 out of 46 countries, decreased in 7
countries and remained stable in 18 countries.
In 2016, research and development accounted for
between 1 per cent and 4 per cent of GDP in Western Europe, the United States and Canada.
In South-Eastern Europe, the Caucasus and Central Asia this
share was below 1 per cent.
The share of value added coming from medium and high-tech industry increased in half of the countries between 2006 and
2016.
In Western and Central Europe medium and high-tech industry
contributes as much as half of all value added. The lowest
shares, below 10 per cent, are found in South-Eastern Europe, the Caucasus and Central Asia.
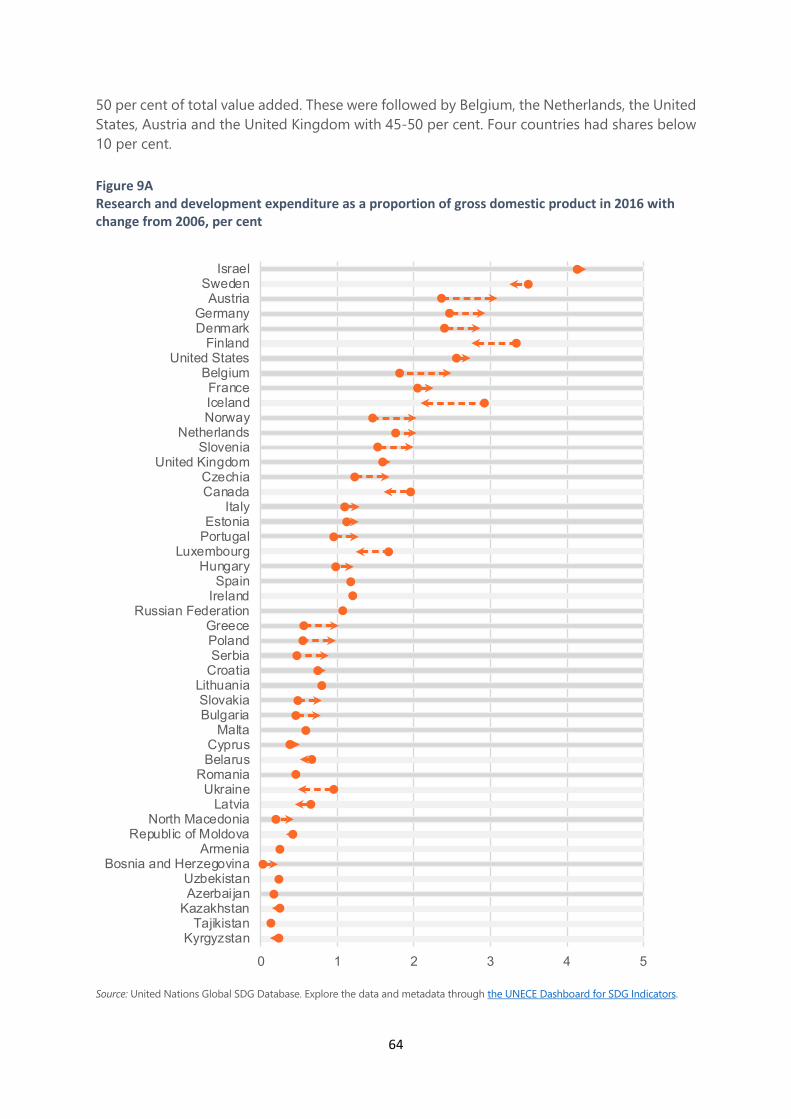
64
50 per cent of total value added. These were followed by Belgium, the Netherlands, the United States, Austria and the United Kingdom with 45-50 per cent. Four countries had shares below 10 per cent.
Figure 9A Research and development expenditure as a proportion of gross domestic product in 2016 with change from 2006, per cent
Source: United Nations Global SDG Database. Explore the data and metadata through the UNECE Dashboard for SDG Indicators.
0 1 2 3 4 5
KyrgyzstanTajikistan
KazakhstanAzerbaijanUzbekistan
Bosnia and HerzegovinaArmenia
Republic of MoldovaNorth Macedonia
LatviaUkraine
RomaniaBelarusCyprus
MaltaBulgariaSlovakia
LithuaniaCroatiaSerbiaPolandGreece
Russian FederationIrelandSpain
HungaryLuxembourg
PortugalEstonia
ItalyCanadaCzechia
United KingdomSlovenia
NetherlandsNorwayIcelandFrance
BelgiumUnited States
FinlandDenmarkGermany
AustriaSweden
Israel
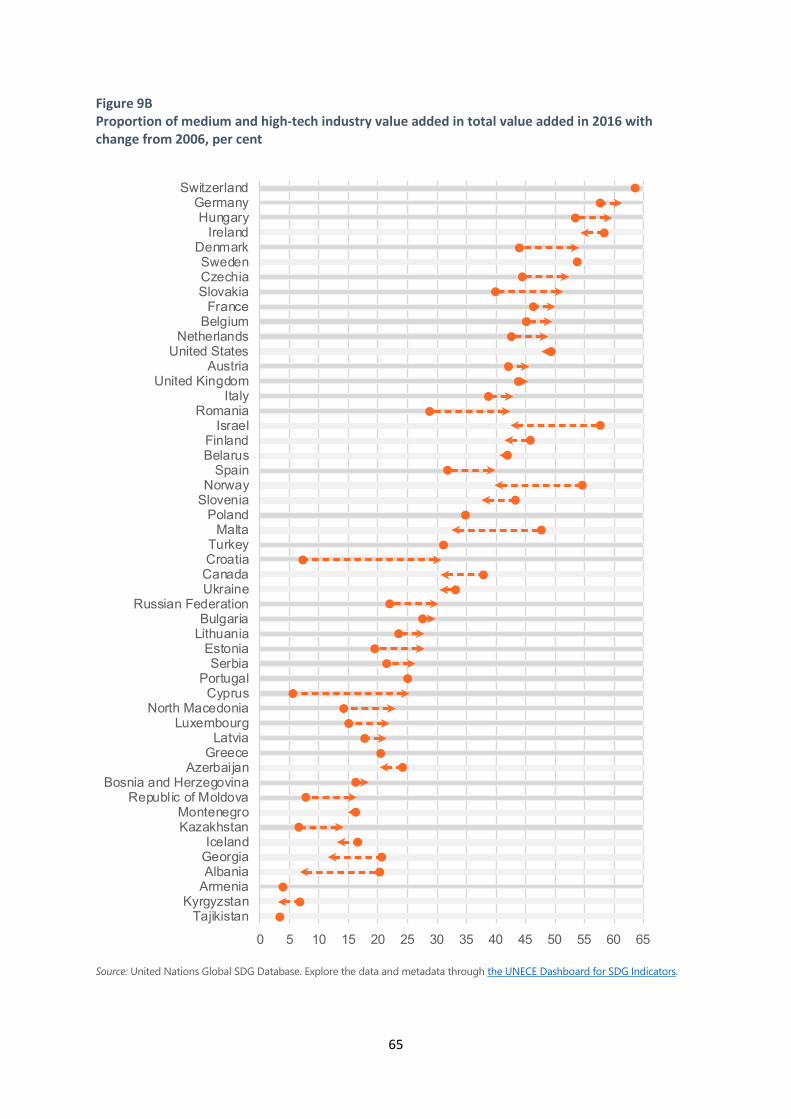
65
Figure 9B Proportion of medium and high-tech industry value added in total value added in 2016 with change from 2006, per cent
Source: United Nations Global SDG Database. Explore the data and metadata through the UNECE Dashboard for SDG Indicators.
0 5 10 15 20 25 30 35 40 45 50 55 60 65
TajikistanKyrgyzstan
ArmeniaAlbaniaGeorgiaIceland
KazakhstanMontenegro
Republic of MoldovaBosnia and Herzegovina
AzerbaijanGreece
LatviaLuxembourg
North MacedoniaCyprus
PortugalSerbia
EstoniaLithuaniaBulgaria
Russian FederationUkraineCanadaCroatiaTurkey
MaltaPoland
SloveniaNorway
SpainBelarusFinland
IsraelRomania
ItalyUnited Kingdom
AustriaUnited States
NetherlandsBelgiumFrance
SlovakiaCzechiaSweden
DenmarkIreland
HungaryGermany
Switzerland
66
This section looks at indicator 9.1.2 on passenger and freight transport. The modal split – that is, the relative shares of different modes of transport used for both passengers and freight – can be analyzed to shed light on the different distributions across countries of the various negative externalities inherent with each mode. These include greenhouse gas emissions and local pollutants, noise, transport safety, time lost to commuting, urban space, and health effects. With transport being one of the few sectors for many UNECE countries in which greenhouse gas emissions continue to rise, shifting transport activities to less polluting modes remains an effective way to reduce carbon intensity. All data are sourced from the UNECE transport database, based on official statistics from national sources.
The modal split for passenger transport is led by passenger cars in all UNECE countries with available data, with its share ranging from 70 per cent in Turkey to 92 per cent in Uzbekistan. The relative differences between countries reflect the prioritization and development of public transport, while also being influenced by a country’s wealth. Within public transport, passenger-kilometres range from being nearly exclusively buses in some countries such as North Macedonia, to being dominated by rail in other countries such as the Netherlands and Switzerland.
The modal split has stayed broadly constant over the last ten years for countries with available data, with rail slightly increasing its share at the expense of passenger cars. However, this overall picture masks a mix of different situations, with fast increases in motorization in some countries, such as the Republic of Moldova and Turkey, contrasting with improvements in public transport service in others, including Denmark and North Macedonia.
Turning to freight transport or the transport of goods, the modal split in countries with available data is much more varied (Figure 9C). While many countries see road freight dominate, with a share of above 80 per cent in 16 countries (out of 42), there were also nine countries where rail and inland waterways made up more than 50 per cent of the modal split, with rail alone making up 84 per cent of Georgia’s freight modal split.
Inland water transport does not appear at all in the mix of the majority of countries, yet it surpasses 10 per cent of total freight transport in five countries, approaching 40 per cent in the Netherlands. These quantities are thus important to consider when looking at inland modal split, given differing impacts of different modes.
Over the last ten years, as for passenger transport, the overall distributions for freight transport in the available countries have barely changed, with road freight just slightly increasing its overall share from 63 to 64 per cent, at the expense of both inland waterways and road. All three sectors grew in absolute terms over the time period.
Passenger cars remain the dominant form of moving
people in the UNECE region, and their share has remained flat
over time, reflecting similar growth of both private cars and
public transport.
Road transport dominates freight movements as well,
although there are many countries where rail and inland
waterways transport the majority of goods.
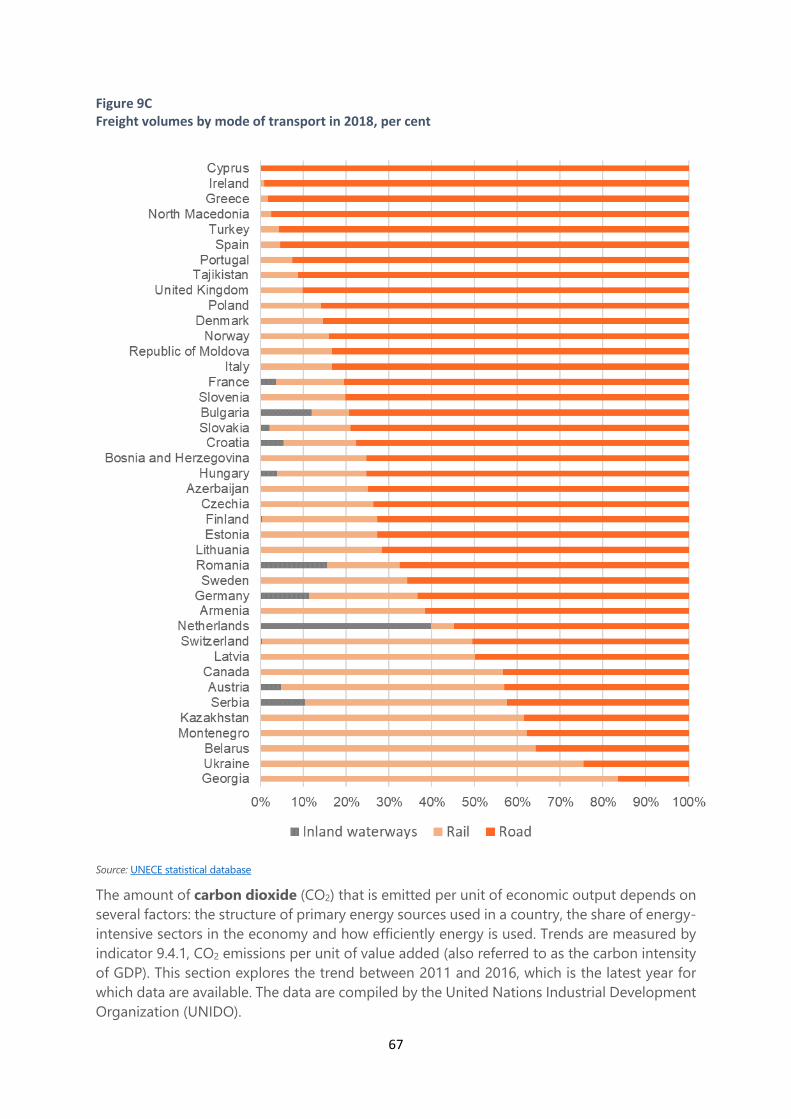
67
Figure 9C Freight volumes by mode of transport in 2018, per cent
Source: UNECE statistical database
The amount of carbon dioxide (CO2) that is emitted per unit of economic output depends on several factors: the structure of primary energy sources used in a country, the share of energy-intensive sectors in the economy and how efficiently energy is used. Trends are measured by indicator 9.4.1, CO2 emissions per unit of value added (also referred to as the carbon intensity of GDP). This section explores the trend between 2011 and 2016, which is the latest year for which data are available. The data are compiled by the United Nations Industrial Development Organization (UNIDO).
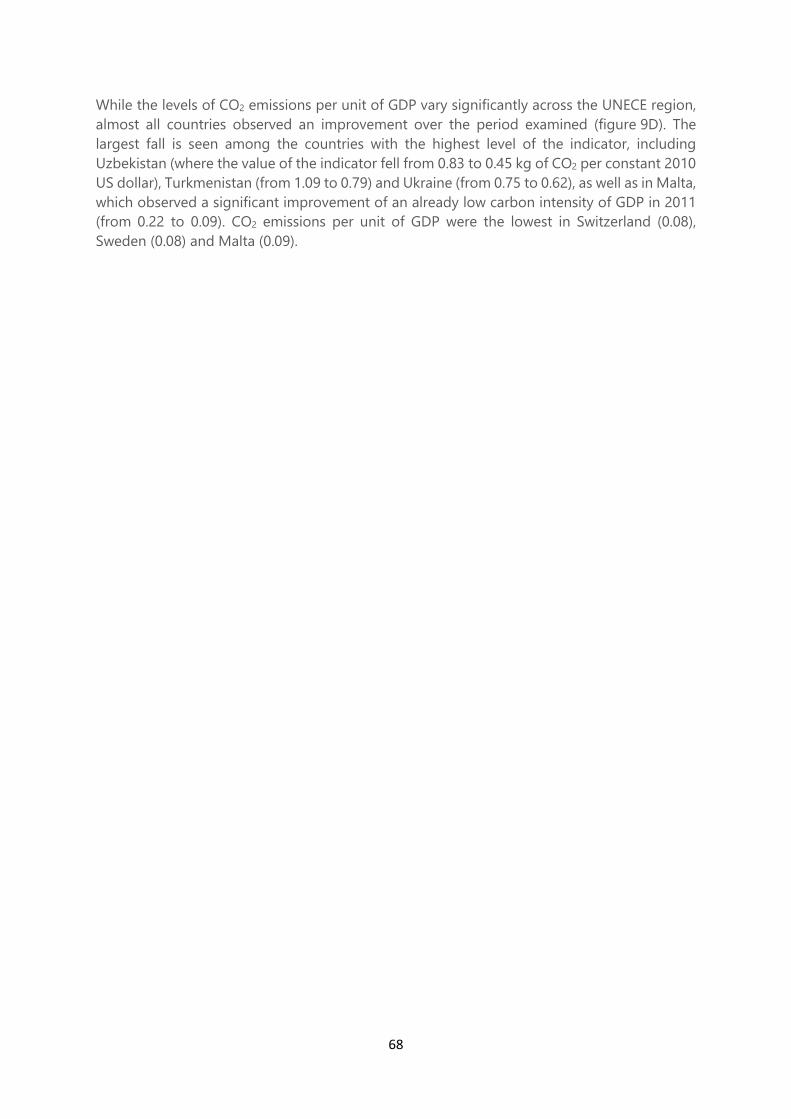
68
While the levels of CO2 emissions per unit of GDP vary significantly across the UNECE region, almost all countries observed an improvement over the period examined (figure 9D). The largest fall is seen among the countries with the highest level of the indicator, including Uzbekistan (where the value of the indicator fell from 0.83 to 0.45 kg of CO2 per constant 2010 US dollar), Turkmenistan (from 1.09 to 0.79) and Ukraine (from 0.75 to 0.62), as well as in Malta, which observed a significant improvement of an already low carbon intensity of GDP in 2011 (from 0.22 to 0.09). CO2 emissions per unit of GDP were the lowest in Switzerland (0.08), Sweden (0.08) and Malta (0.09).
69
Figure 9D Carbon dioxide emissions per unit of gross domestic product, 2016 with change from 2011, kilogrammes of carbon dioxide per constant 2010 United States dollar
Source: United Nations Global SDG Database. Explore the data and metadata through the UNECE Dashboard for SDG Indicators.
0.0 0.2 0.4 0.6 0.8 1.0 1.2
TurkmenistanUkraine
Bosnia and HerzegovinaKazakhstan
SerbiaEstonia
KyrgyzstanUzbekistan
Republic of M oldovaRussian Federation
CanadaBelarus
BulgariaCzechiaPoland
United StatesNorth Macedonia
GeorgiaGreeceCyprus
IsraelSlovenia
MontenegroFinland
ArmeniaGermany
AzerbaijanBelgium
NetherlandsTajikistanSlovakia
CroatiaHungary
TurkeyRomania
AustriaPortugal
LuxembourgItaly
SpainLatvia
United KingdomLithuania
IcelandDenm ark
IrelandAlbaniaFrance
NorwayMalta
SwedenSwitzerland
70
Reduce inequality within and among countries
Goal 10 aims to achieve greater equality within and among nations in order to ensure inclusive and sustainable growth. Despite efforts at narrowing disparities and positive growth for the poorest populations in many countries, income inequality continues to be a concern.
This section looks at labour share of gross domestic product (target 10.4) and remittance costs as proportion of the amount remitted (target 10.c.1).
Labour share provides information on the relative share of gross domestic product allocated to labour remuneration—that is, paid work. It is measured by the wages and salaries and social protection transfers that are paid to employees, both in cash and in kind. Since salaries are the main source of income for a majority of households, they are also a key factor for determining household consumption and well-being.
In 2017 the labour shares for most countries in Western Europe and North America were in the range of 50 to 60 per cent, with the highest level of 65 per cent observed in Switzerland (figure 10A). Values varied considerably in other parts of the UNECE region. In five countries the labour share in GDP was below 40 per cent.
The labour share in GDP for the UNECE member countries (measured as simple average of the countries for which data for the full period are available) decreased to 52.8 per cent in 2017 from 54.4 per cent in 2000 reflecting challenges for many households. Some of the largest Western economies experienced a slow decline over the period. The decrease in labour share amounted to 5.3 percentage points in the United States, 2.4 in Germany, 4.5 in Spain and 12.3 in Ireland, while in France it increased by 2.2 percentage points.
In Central and Eastern Europe the trends are more mixed, with the largest increases in labour share over the 2000-2017 period being observed in Bulgaria (9.3 percentage points), Latvia (4.7), Estonia (4.3) and Czechia (3.3), and the largest decreases in North Macedonia (-14.8), Croatia (-14.4) and Poland (-8.3).
Remittances are financial transfers from non-residents to residents of a country, such as workers abroad sending money to family and friends. Often they involve many small transactions and the cost for remitting can be relatively high compared both to the amount sent and to the low incomes of migrant workers or their families in the remittance-receiving country.
Target 10.c.1 aims to reduce the transaction costs of migrant remittances to three per cent or less by 2030. The target is measured by looking at the global average cost of sending the equivalent of 200 United States dollars. The same target also calls for elimination of remittance
The average share of labour income in GDP has decreased
slowly in UNECE countries over recent years.
The labour share in Western Europe and North America is
relatively high and stable, while it varies considerably in other
parts of the UNECE region.
In 2018, remittances cost an average of 5.38 per cent of the
total amount sent, representing a decline from the previous year
but still exceeding the target of 3 per cent transaction costs.
71
corridors with costs higher than five per cent. Examples of most common remittance corridors are banks, post offices, mobile operators or money transfer operators.
In 2018, for a majority of countries that receive remittances in the UNECE region, the transaction costs as proportion of the amount remitted exceeded the 3 per cent target level (figure 10B). The remittance costs ranged from as high as 10.2 per cent in North Macedonia to as low as 1.3 per cent in Georgia and Azerbaijan. For the 23 countries presented, on average the remittances cost is 5.4 per cent of the amount sent. This represents a decline of 1 percentage point from the 2017 average cost of 6.4 per cent.
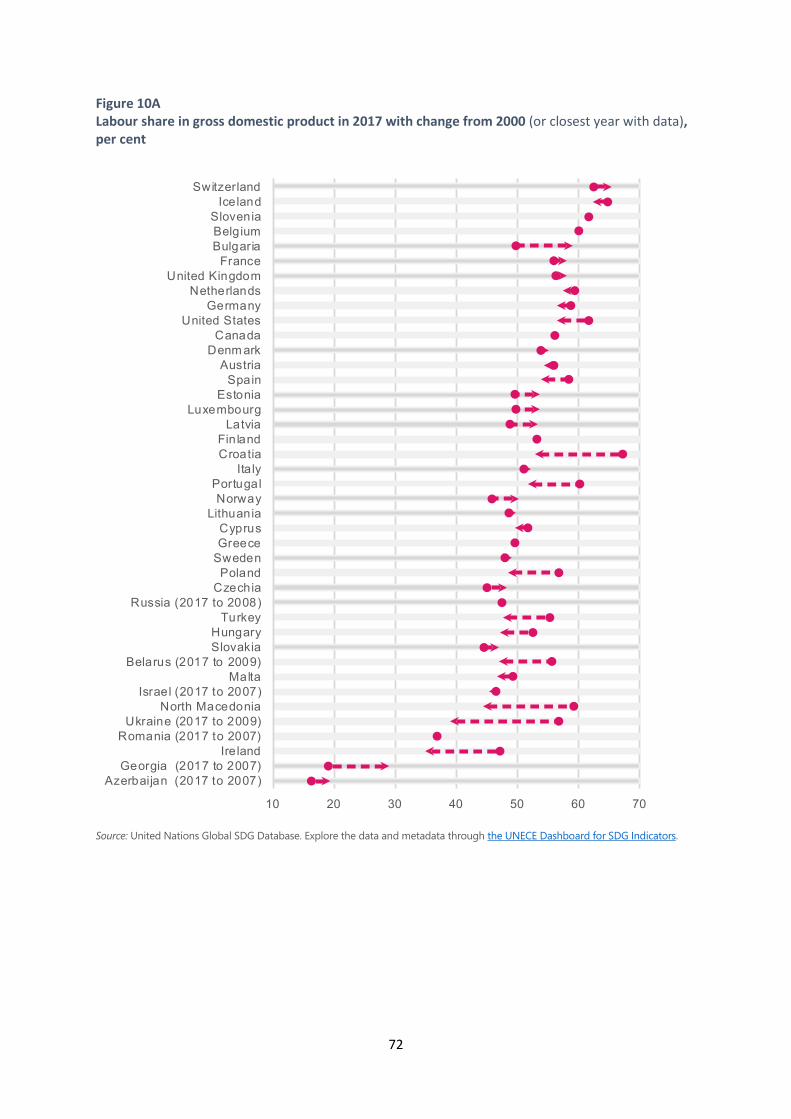
72
Figure 10A Labour share in gross domestic product in 2017 with change from 2000 (or closest year with data), per cent
Source: United Nations Global SDG Database. Explore the data and metadata through the UNECE Dashboard for SDG Indicators.
10 20 30 40 50 60 70
Azerbaijan (2017 to 2007)Georgia (2017 to 2007)
IrelandRomania (2017 to 2007)
Ukraine (2017 to 2009)North Macedonia
Israel (2017 to 2007)Malta
Belarus (2017 to 2009)SlovakiaHungary
TurkeyRussia (2017 to 2008)
CzechiaPoland
SwedenGreeceCyprus
LithuaniaNorway
PortugalItaly
CroatiaFinland
LatviaLuxembourg
EstoniaSpain
AustriaDenm ark
CanadaUnited States
GermanyNetherlands
United KingdomFrance
BulgariaBelgiumSlovenia
IcelandSwitzerland
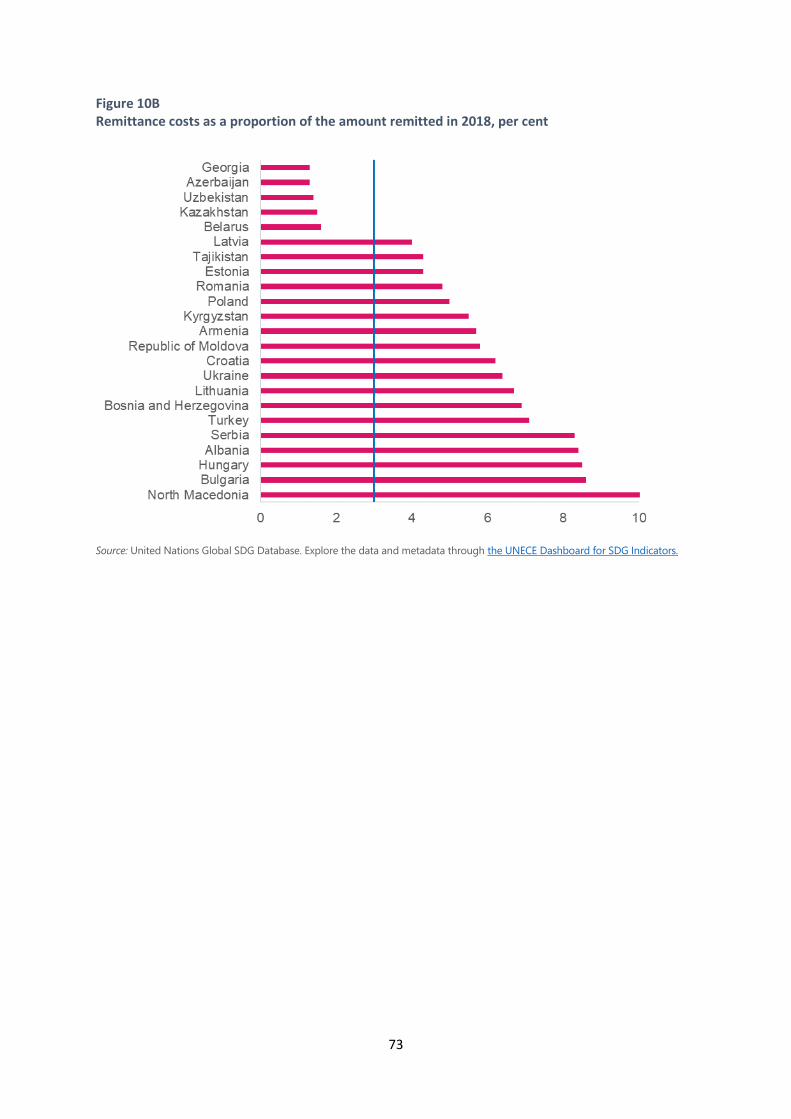
73
Figure 10B Remittance costs as a proportion of the amount remitted in 2018, per cent
Source: United Nations Global SDG Database. Explore the data and metadata through the UNECE Dashboard for SDG Indicators.
74
Make cities and human settlements inclusive, safe, resilient and sustainable
Urban settlements offer great economic, social and cultural opportunities, but they also present many challenges, especially in terms of environmental impact. Goal 11 calls for renewing and planning cities and other human settlements in a way that offers opportunities for all, with access to basic services, energy, housing, transportation and green public spaces, while reducing resource use and environmental impact. Such environmental impact can be assessed, among other measures, by indicator 11.6.1: annual mean levels of fine particulate matter in cities, weighted by population.
Air pollutants, such as fine suspended particles of 10 microns in diameter (coarse particulate matter, PM10) can penetrate and lodge in the respiratory tract.
Particles smaller than 2.5 microns in diameter (fine particulate matter, PM2.5) represent a greater risk for human health, as they can penetrate deeper the respiratory tract and enter the bloodstream, thus increasing the morbidity and mortality rates from respiratory infections and diseases, lung cancer, and some cardiovascular diseases.
The lowest values of fine particulate matter air pollution in cities (6 micrograms per cubic metre) are seen in Sweden and Iceland (figure 11A). The pattern seen here is closely linked to that seen for indicator 3.9.1: mortality rate attributed to household and ambient air pollution, since mortality from air pollution is of course highly correlated with the levels of such pollution.
The WHO air quality guidelines recommend a limit of 10 micrograms per cubic metre for the average annual level of fine particulate matter, beyond which the level of pollution is considered to be harmful to health. Only ten countries in the UNECE region have levels under this threshold: Iceland, Sweden, Finland, Canada, Estonia, the United States, Norway, Portugal, Ireland and Spain. Another 43 countries have levels between 10 and 35—a level common in many cities in developing countries, and two countries have levels above 35.
Only ten countries in the UNECE region have levels of air
pollution with fine particulate matter below the limit
recommended by the World Health Organization.
The populations of two countries in the region are exposed to
particulate matter in concentrations exceeding levels
seen in many cities in developing countries.
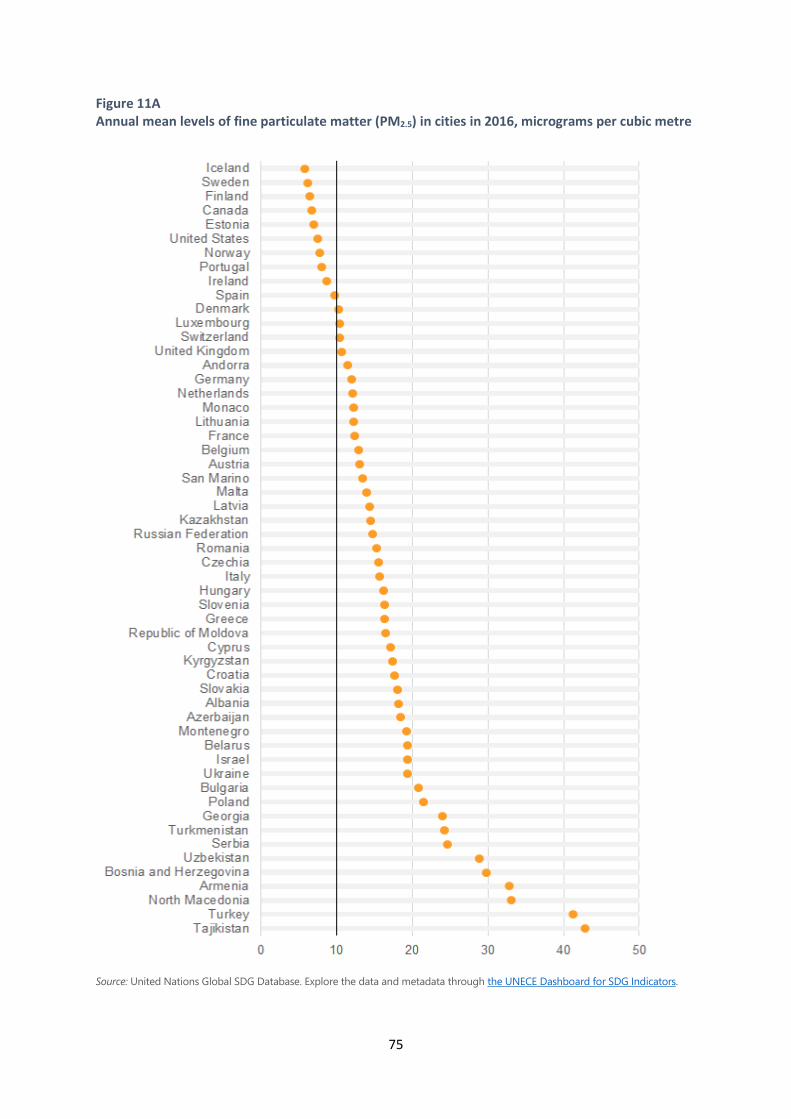
75
Figure 11A Annual mean levels of fine particulate matter (PM2.5) in cities in 2016, micrograms per cubic metre
Source: United Nations Global SDG Database. Explore the data and metadata through the UNECE Dashboard for SDG Indicators.
76
Ensure sustainable consumption and production patterns
Goal 12 calls for a comprehensive set of actions from businesses, policymakers, researchers and consumers to adapt to sustainable practices. It calls for sustainable production and consumption based on advanced technological capacity, resource efficiency and reduced global waste. This section focuses on the efforts of countries in the UNECE region to decouple economic
growth and living standards from using fossil fuels, thus reducing the pressure on natural resources and the environmental impact of economic activity. Indicator 12.c.1: amount of fossil fuel subsidies as a proportion of GDP, aims to quantify the existence of subsidies that distort markets and encourage consumption. The indicator includes subsidies of fossil fuels used in production or for consumption purposes.
Increasing quality of life does not necessarily involve intensifying the use of natural resources. But rationalizing fossil fuel use requires economies to be structured in such a way that environmental impacts are reflected in prices and subsidies. This may require innovative approaches that take into account the needs and conditions of each country and which protect vulnerable communities.
From 2013 to 2015 fossil fuel subsidies declined in almost all UNECE countries (figure 12A). The largest reductions are observed in Kyrgyzstan, Turkmenistan and Uzbekistan, although the levels of subsidies in these countries remain well above the regional average. The situation differs for much of Europe and North America, where efforts are made to support recycling and to reduce the use of fossil fuel resources for energy production. In these countries, fossil fuel subsidies as a proportion of GDP are close to zero.
In most of the UNECE region there is close to zero subsidization of
fossil fuels. In Central Asia there have been large reductions since
2013.
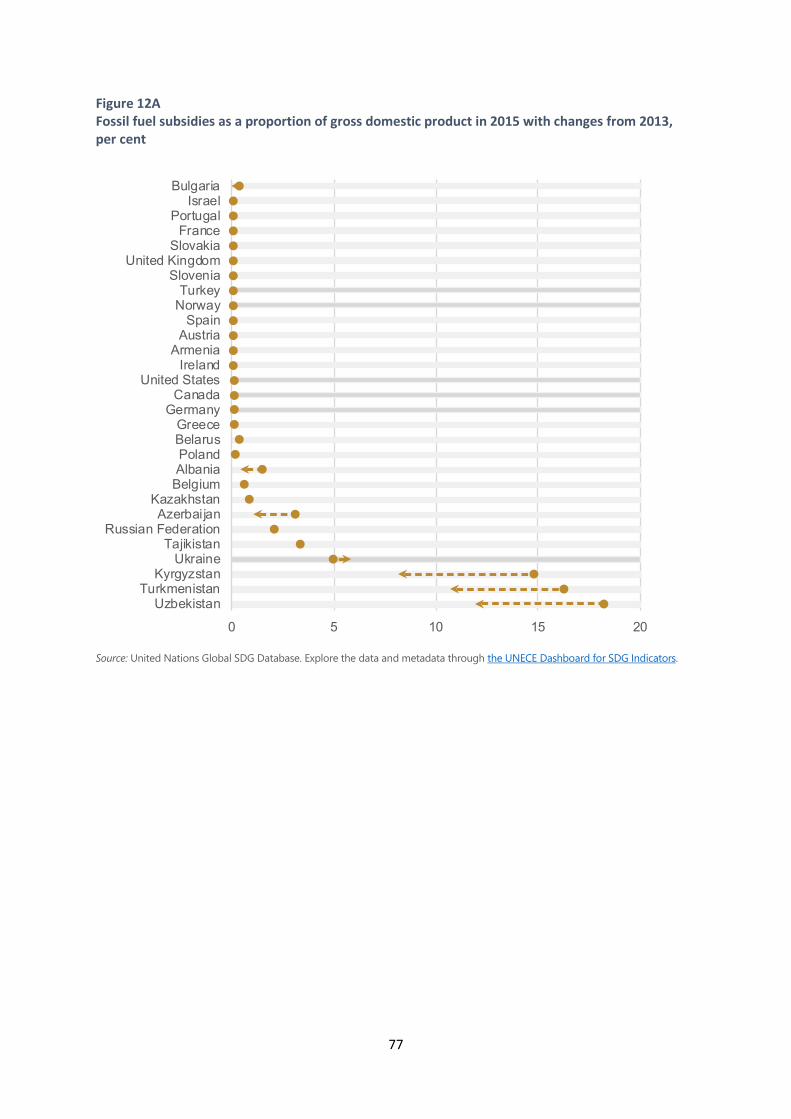
77
Figure 12A Fossil fuel subsidies as a proportion of gross domestic product in 2015 with changes from 2013, per cent
Source: United Nations Global SDG Database. Explore the data and metadata through the UNECE Dashboard for SDG Indicators.
0 5 10 15 20
UzbekistanTurkmenistan
KyrgyzstanUkraine
TajikistanRussian Federation
AzerbaijanKazakhstan
BelgiumAlbaniaPolandBelarusGreece
GermanyCanada
United StatesIreland
ArmeniaAustriaSpain
NorwayTurkey
SloveniaUnited Kingdom
SlovakiaFrance
PortugalIsrael
Bulgaria
78
Target 12.4 aims to achieve environmentally sound management of chemicals and all wastes throughout their life cycle, in accordance with agreed international frameworks, and to reduce significantly their release to air, water and soil to minimize their adverse impacts on human health and the environment. Indicator 12.4.1 measures the extent to which countries are meeting their obligations to transmit information as required by four multilateral environmental agreements (MEAs):
1. Basel Convention on the Control of Transboundary Movements of Hazardous Wastes and their Disposal
2. Rotterdam Convention on the prior informed consent procedure for certain hazardous chemicals and pesticides in international trade
3. Stockholm Convention on Persistent Organic Pollutants
4. Montreal Protocol on Substances that Deplete the Ozone Layer.
The indicator is reported every five years: the values for 2015 summarize how far countries have met their obligations to transmit information to the secretariats of the conventions during the period 2010-2014, and values for 2020 summarize this for the period 2015-2019 (figure 12B). The information transmission obligations for the Rotterdam and Stockholm Conventions have increased for the period 2015-2019. Therefore the compliance rates may have decreased for countries that have simply provided the same kinds of information as for the previous period. This underscores the need for constant attention from countries to keep abreast of and comply with the information transmission obligations. The data come from the United Nations Environment Programme (UNEP).
The Montreal protocol is a success story: it entered into force in 1989 and has been ratified by 197 Parties, making the two ozone treaties under the Montreal Protocol the first universally-ratified treaties in the history of the United Nations. Their aim is to phase out the production of substances that cause ozone depletion. All UNECE countries are fully compliant with information transmission obligations under the protocol, as are all other countries of the world. As a result, the ozone hole in Antarctica is slowly recovering, expected to return to 1980 levels between 2050 and 2070.
The Basel Convention, which entered into force in 1992, regulates the transboundary movements of hazardous and other waste and their disposal. With increasing environmental awareness in the developed countries has come a growing public resistance to the disposal of
UNECE countries have a very high rate of fulfilment of the obligations to transmit information as required by four key multilateral environmental agreements
Almost all UNECE countries comply with information transmission obligations for agreements on protecting the ozone layer and disposing of hazardous waste
Fulfilment of the information transmission obligations has increased in many countries on the agreement on pesticides and industrial chemicals, but appears to have fallen in 27 countries on the agreement on persistent organic pollutants
The obligations to transmit information can change over time, so countries need to stay vigilant to ensure that their rate of fulfilment of these obligations does not fall by simply providing the same kinds of information as usual.
79
hazardous wastes (the so-called ‘NIMBY’: Not In My Back Yard syndrome) – and an escalation of disposal costs. This has led to waste producers seeking cheap disposal options for hazardous wastes in the developing world where environmental awareness and regulations are much weaker. The Basel Convention was therefore negotiated to combat this ‘toxic trade’. All UNECE countries except for San Marino and the United States are Parties to the Convention. Close to half of UNECE countries fulfil all the information transmission obligations and another quarter of countries fulfil them to a level of 80 per cent. Fifteen countries have improved their rate of fulfilment of these obligations from 2015 to 2020, while for 20 countries this rate has decreased.
The Rotterdam convention, which entered into force in 2004, regulates international trade and environmentally sound use of pesticides and industrial chemicals that have been banned or severely restricted for health or environmental reasons by Parties. In the UNECE region 47 countries are Parties to the convention. Among these, 70 per cent of countries meet fully or almost fully the requirements to transmit information. Several UNECE countries have considerably improved the degree to which they meet these obligations since 2015, the first year for which the indicator is available (Armenia, Bosnia and Herzegovina, Georgia, Kazakhstan, Malta, Montenegro, the Russian Federation, Turkey, Ukraine).
The Stockholm Convention, which entered into force in 2004, aims to protect human health and the environment from Persistent Organic Pollutants (POP). POPs remain intact in the environment for a long time and spread widely. They accumulate in humans and wildlife and have harmful impacts on human health and the environment. They can lead to cancer, birth defects, dysfunctional immune and reproductive systems, greater susceptibility to disease, and damage to the nervous systems. The Convention requires its Parties to take measures to eliminate or reduce the release of POPs into the environment. Of the UNECE member States, 49 are Parties to the Convention. While in 2015, 15 countries met fully the information transmission obligations, in 2020 the rate of meeting these obligations has decreased for several countries and only six countries meet the obligations fully. For 15 countries the rate has improved from 2015, while for 27 countries it has decreased.
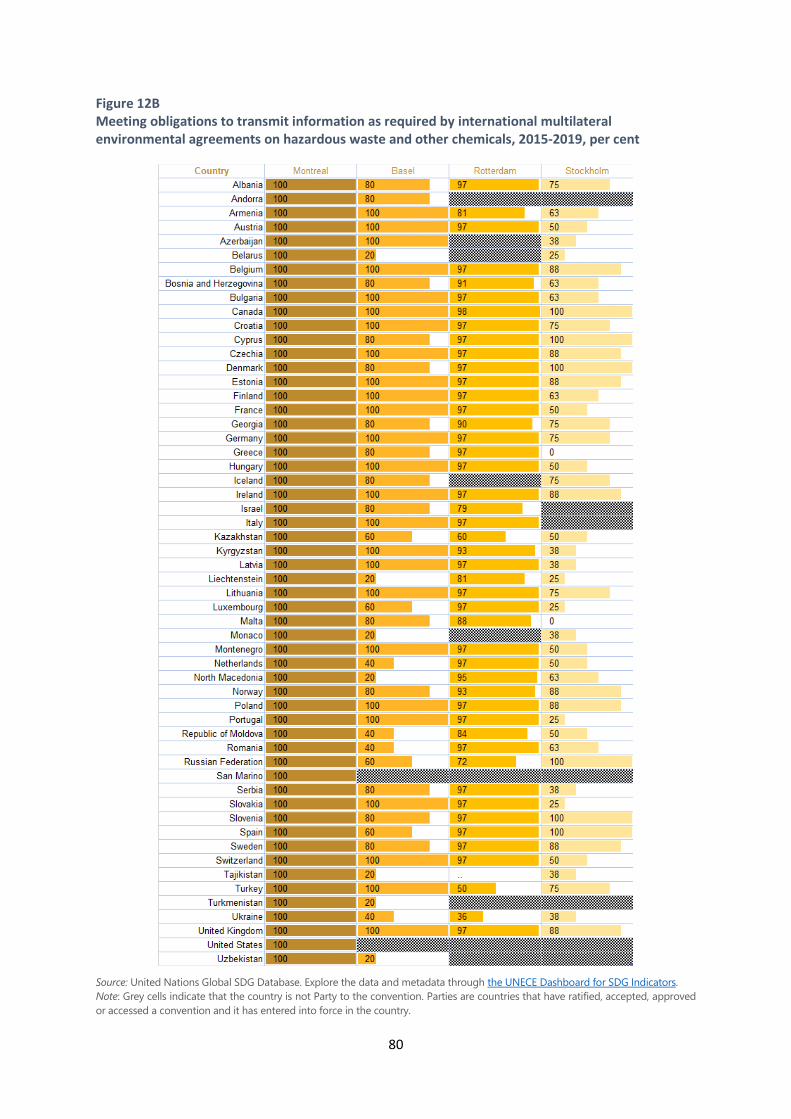
80
Figure 12B Meeting obligations to transmit information as required by international multilateral environmental agreements on hazardous waste and other chemicals, 2015-2019, per cent
Source: United Nations Global SDG Database. Explore the data and metadata through the UNECE Dashboard for SDG Indicators. Note: Grey cells indicate that the country is not Party to the convention. Parties are countries that have ratified, accepted, approved or accessed a convention and it has entered into force in the country.
81
Take urgent action to combat climate change and its impacts
Reducing the likelihood of disasters and mitigating the risks of death, injury and economic loss caused by disasters are fundamental to ensuring that development is sustainable in the long term. Rapid urbanization and climate change combine to produce increasing risk levels, making the management and reduction of disaster risk ever more important.
This section focuses on target 13.1, which aims to strengthen resilience and adaptive capacity to climate-related hazards and natural disasters. One of the indicators of progress towards this target is indicator 13.1.1: number of deaths, missing persons and persons affected by disasters per 100,000 people. The centrality of disaster resilience to sustainable development means that this indicator is also used to measure progress towards targets 11.5 and 1.5. The data come from the United Nations Office for Disaster Risk Reduction. The second indicator considered in this section, 13.1.2: number of countries with national and
local disaster risk reduction strategies, measures countries’ disaster preparedness. This indicator is also used to measure progress towards targets 11.b and 1.5. Data are collected by the Sendai Framework Monitoring System.
The disaster-related targets in the SDG framework are aligned with the Sendai Framework for Disaster Risk Reduction 2015-2030, which was adopted by United Nations Member States in March 2015 as a global policy for disaster risk reduction. Among the objectives of the Sendai Framework is the aim of reducing global disaster-related mortality compared to the values seen over the period 2005-2015: a global level of 1.5 per 100,000 population. In five UNECE countries, the rates of disaster-attributable mortality and missing persons exceed this global baseline (figure 13A).
Local governments play a key role in implementing appropriate disaster risk reduction strategies. The proportion of local governments that adopt and implement local disaster risk reduction strategies in line with national disaster risk reduction strategies varies widely among the 22 UNECE countries with data (figure 13B). In nine countries, all local governments have such strategies whereas another nine countries have no such strategies at the local level.
Disaster-related mortality is low throughout the UNECE region.
Most countries in the UNECE region with available data
already have rates of mortality and missing persons attributed to disasters that are below the
2005-2015 global average.
The proportion of local governments with disaster risk
reduction strategies varies widely across the region: 9
countries have full coverage while an equal number of
countries have no such strategies at the local level.
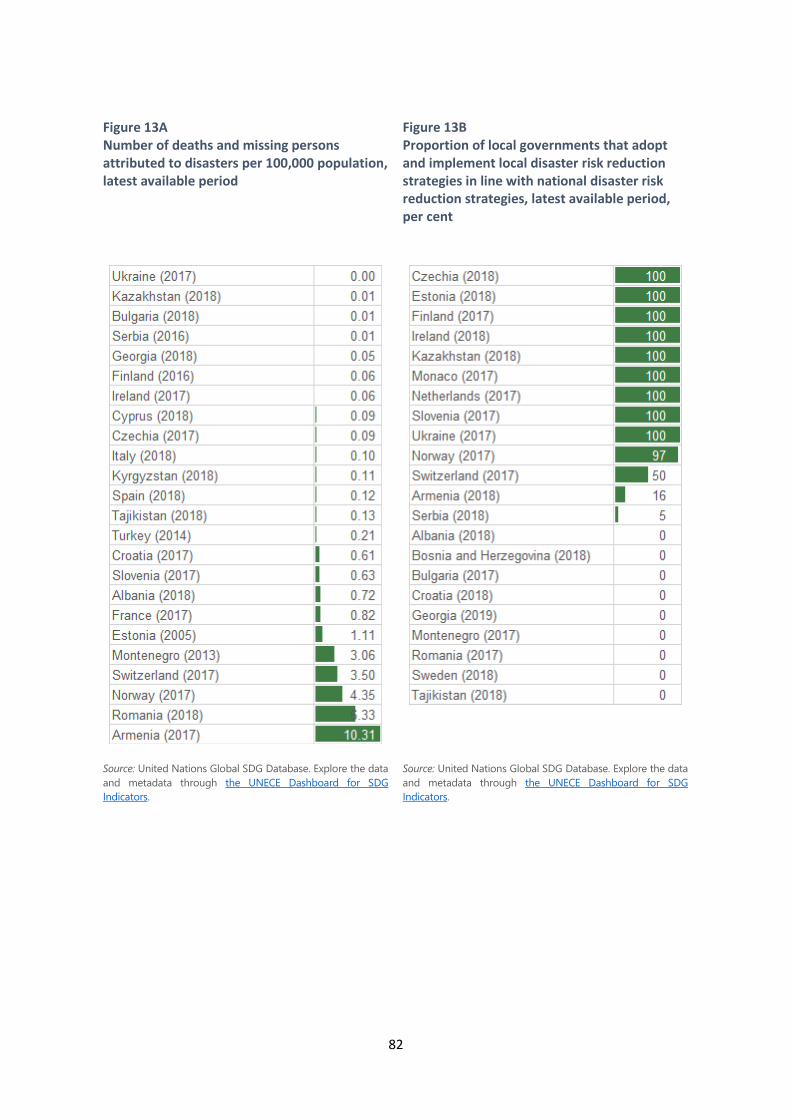
82
Figure 13A Number of deaths and missing persons attributed to disasters per 100,000 population, latest available period
Figure 13B Proportion of local governments that adopt and implement local disaster risk reduction strategies in line with national disaster risk reduction strategies, latest available period, per cent
Source: United Nations Global SDG Database. Explore the data and metadata through the UNECE Dashboard for SDG Indicators.
Source: United Nations Global SDG Database. Explore the data and metadata through the UNECE Dashboard for SDG Indicators.
83
Conserve and sustainably use the oceans, seas and marine resources for sustainable development
Increased efforts to conserve and sustainably use ocean resources are required to support the fulfilment of Goal 14. Target 14.5 calls for at least 10 per cent of coastal and marine areas to be protected by conservation measures by this year, 2020. With the same timeline, target 14.6 aims to end harmful fishing subsidies and to stop unreported, unregulated and destructive fishing practices. This section looks at these two targets, by considering the coverage of protected areas in relation to marine areas (indicator 14.5.1) and the degree of implementation of international instruments aiming to combat illegal, unreported and unregulated fishing (14.6.1). Data come from the World Database of Protected Areas.
The overall coverage of marine protected areas is reflected in their proportion in a country's Exclusive Economic Zone (EEZ), for which data are available for 2018 only. Monaco’s zone consists almost entirely of protected area, followed by Slovenia with 88 per cent (figure 14A). In Germany, 45 per cent is protected and in the United States, 41 per cent. In total 18 countries protect more than the target level of 10 per cent and 20 countries report percentages below that threshold. In eight countries, marine protected areas constitute
less than one per cent of their Exclusive Economic Zone.
Since biodiversity is not spread evenly across a country’s Exclusive Economic Zone, a more focused conservation measure is the average proportion of marine Key Biodiversity Areas (KBAs) covered by protected areas.
Of the 36 UNECE countries with access to the sea, 17 have this proportion above 80 per cent and 7 countries above 90 per cent (figure 14B). In 2000, only three countries – the Netherlands, Belgium and Denmark – were above the 80 per cent mark and in no country did the proportion exceed 90 per cent. Since 2000, the average proportion of KBAs has grown in 33 out of the 34 countries with data. Estonia, Bulgaria, Slovenia, Croatia, Poland, France, Albania and France progressed the most, increasing the average proportion of their protected KBAs by more than 50 percentage points each. In six countries, protected areas cover less than 30 per cent of marine KBAs.
Implementation of international instruments aiming to combat illegal, unreported and unregulated (IUU) fishing is measured by a score based on the degree of implementation of
The target of protecting at least 10 per cent of areas rich in
marine biodiversity is reached by 14 countries, whereas 23
countries report levels below this threshold.
UNECE countries have greatly expanded the protection of
marine Key Biodiversity Areas. In about half of the countries with access to the sea, more than 80
per cent of such Key Biodiversity Areas are covered by protected
areas.
Most countries (30 out of 37) report implementation of all
relevant international instruments aiming to combat
illegal, unreported and unregulated fishing.
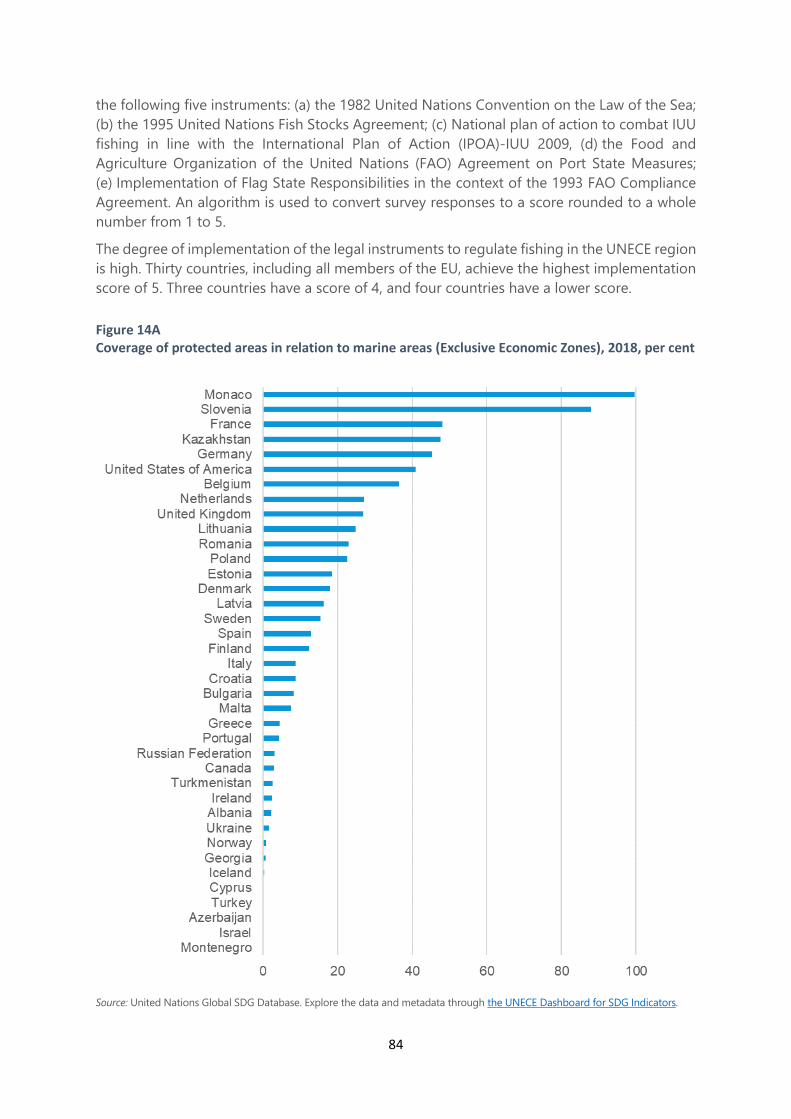
84
the following five instruments: (a) the 1982 United Nations Convention on the Law of the Sea; (b) the 1995 United Nations Fish Stocks Agreement; (c) National plan of action to combat IUU fishing in line with the International Plan of Action (IPOA)-IUU 2009, (d) the Food and Agriculture Organization of the United Nations (FAO) Agreement on Port State Measures; (e) Implementation of Flag State Responsibilities in the context of the 1993 FAO Compliance Agreement. An algorithm is used to convert survey responses to a score rounded to a whole number from 1 to 5.
The degree of implementation of the legal instruments to regulate fishing in the UNECE region is high. Thirty countries, including all members of the EU, achieve the highest implementation score of 5. Three countries have a score of 4, and four countries have a lower score.
Figure 14A Coverage of protected areas in relation to marine areas (Exclusive Economic Zones), 2018, per cent
Source: United Nations Global SDG Database. Explore the data and metadata through the UNECE Dashboard for SDG Indicators.
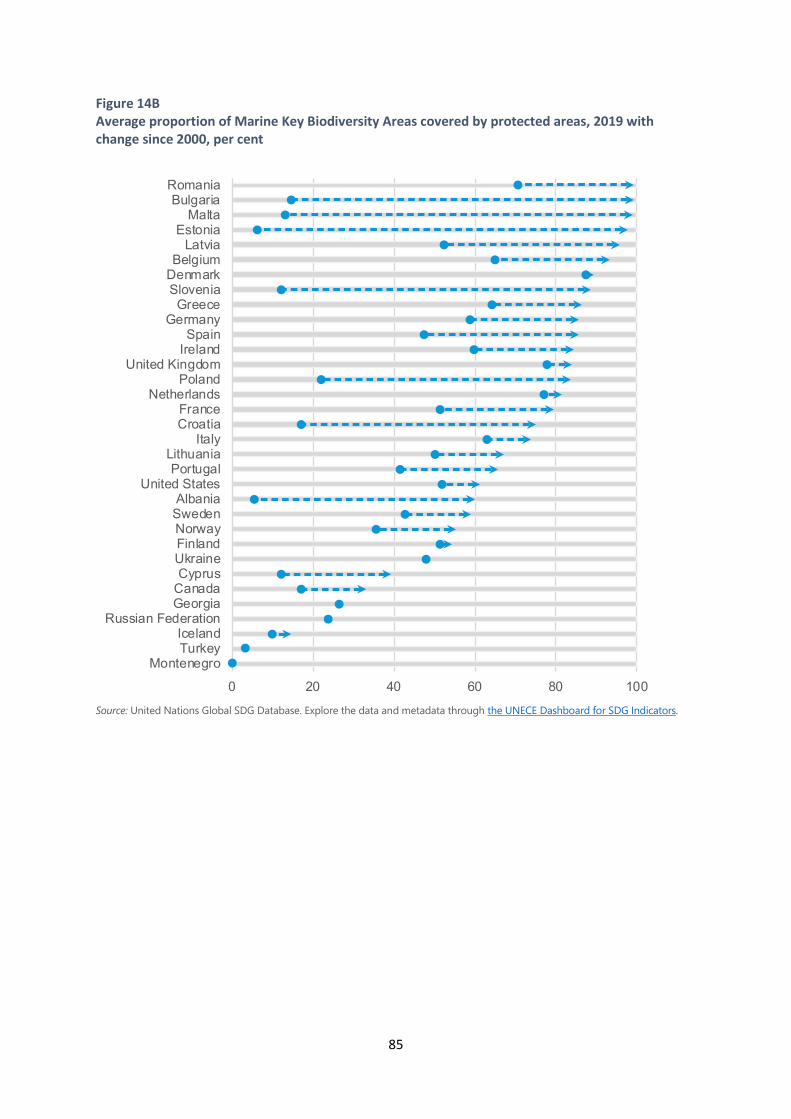
85
Figure 14B Average proportion of Marine Key Biodiversity Areas covered by protected areas, 2019 with change since 2000, per cent
Source: United Nations Global SDG Database. Explore the data and metadata through the UNECE Dashboard for SDG Indicators.
0 20 40 60 80 100
MontenegroTurkeyIceland
Russian FederationGeorgiaCanadaCyprus
UkraineFinlandNorwaySwedenAlbania
United StatesPortugal
LithuaniaItaly
CroatiaFrance
NetherlandsPoland
United KingdomIrelandSpain
GermanyGreece
SloveniaDenmarkBelgium
LatviaEstonia
MaltaBulgaria
Romania
86
Protect, restore and promote sustainable use of terrestrial ecosystems, sustainably manage forests, combat desertification, and halt and reverse land degradation and halt biodiversity loss
Goal 15 aims to protect, restore and promote sustainable use of terrestrial ecosystems, sustainably manage forests, combat desertification and halt and reverse land degradation and biodiversity loss. This section focuses on the progress achieved in the UNECE region towards increasing forest area as a proportion of total land area (indicator 15.1.1). Examining changes in the share of forest area can provide an insight into the extent to which the forests in a country are being protected or restored.
Overall across the UNECE region, forest cover has been expanding over the past two decades. The net increase between 2000 and 2015 (the latest year for which comprehensive data are available) was 28.1 million ha, or 1.5 per cent of the total area of forest and other wooded land in 2000. The extent of forest coverage varies significantly between countries, even between those in the same sub-region: only about 0.5 per cent of the total land area in Iceland is under forests, while the share in Finland is 76 per cent and in Sweden 69 per cent (figure 15A). Likewise, forest distribution in the UNECE region is highly uneven: only three UNECE member States – the Russian Federation, Canada and the United States – account for a total of 85 per cent of
the region’s forest and wooded land.
Several countries experienced a marked increase in their area of forest and other wooded land between 2000 and 2015: Montenegro (from 46.5 to 61.4 per cent), Bulgaria (from 31.0 to 35.2), Italy (from 28.4 to 31.6), Hungary (from 21.1 to 22.8), Ireland (from 9.2 to 10.9), Israel (from 7.1 to 7.6), and Iceland (from 0.3 to 0.5 per cent).
Natural expansion of forests – which occurs when agricultural land is no longer managed for agriculture and tree formation replaces its former uses – is the main reason behind the recorded increases in forest area in the UNECE region. Afforestation – an increase of forest area resulting from planned expansion – is the second most important reason behind the increase, especially in Croatia, Ireland, Spain and the United Kingdom. This increase in forest area, in turn, exceeds considerably the loss of forests to urban and infrastructure uses.
The trend of increasing forest cover in the UNECE region contrasts markedly with the situation worldwide, where, between 2000 and 2015, the share of forest area out of the world’s total land area decreased from 31.1 to 30.7 per cent, due largely to conversion of forest land for agricultural use.
Forest coverage of UNECE countries varies greatly: from
less than 1 per cent of total land area in Iceland to over 76 per
cent in Finland. Canada, the United States and the Russian Federation account for 85 per cent of the region’s forest and
other wooded land.
In contrast to worldwide trends, forest cover in the UNECE region
has been expanding over the past two decades, with a net
increase of 28 million ha between 2000 and 2015.
Expansion onto former agricultural lands is behind most
of the increase in the share of forested land, followed by
countries’ afforestation efforts.
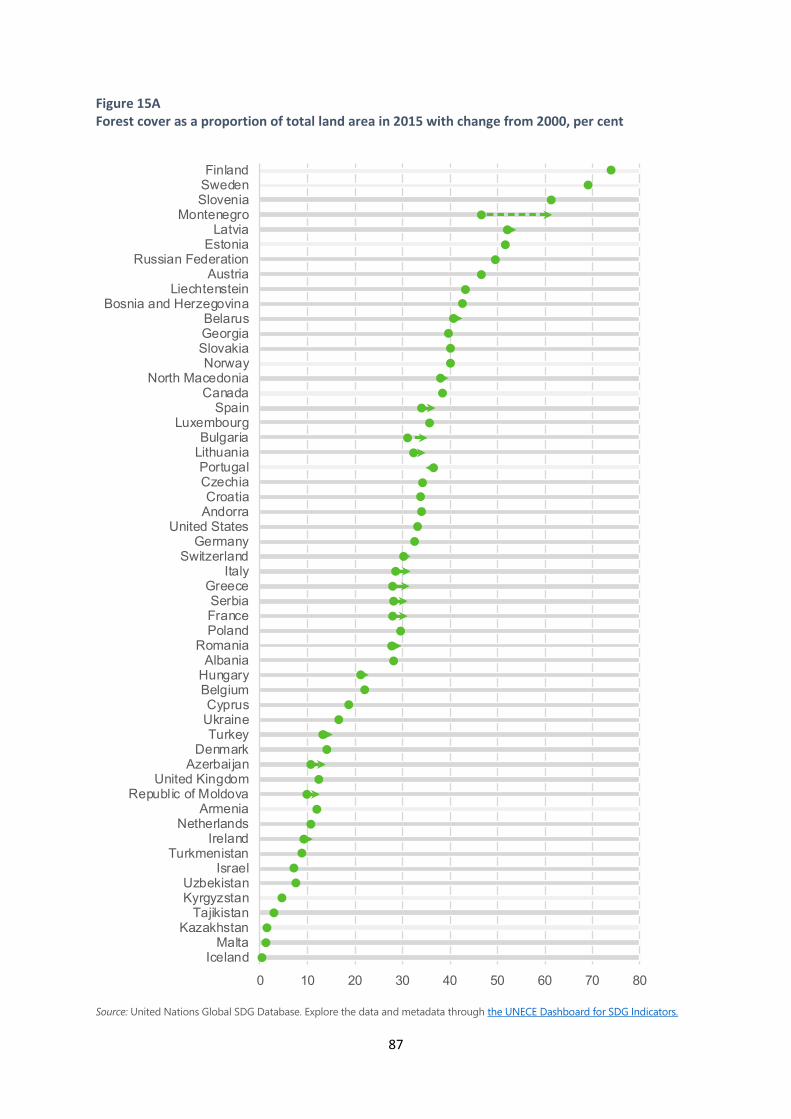
87
Figure 15A Forest cover as a proportion of total land area in 2015 with change from 2000, per cent
Source: United Nations Global SDG Database. Explore the data and metadata through the UNECE Dashboard for SDG Indicators.
0 10 20 30 40 50 60 70 80
IcelandMalta
KazakhstanTajikistan
KyrgyzstanUzbekistan
IsraelTurkmenistan
IrelandNetherlands
ArmeniaRepublic of Moldova
United KingdomAzerbaijan
DenmarkTurkey
UkraineCyprus
BelgiumHungaryAlbania
RomaniaPolandFranceSerbia
GreeceItaly
SwitzerlandGermany
United StatesAndorraCroatia
CzechiaPortugal
LithuaniaBulgaria
LuxembourgSpain
CanadaNorth Macedonia
NorwaySlovakiaGeorgiaBelarus
Bosnia and HerzegovinaLiechtenstein
AustriaRussian Federation
EstoniaLatvia
MontenegroSloveniaSwedenFinland
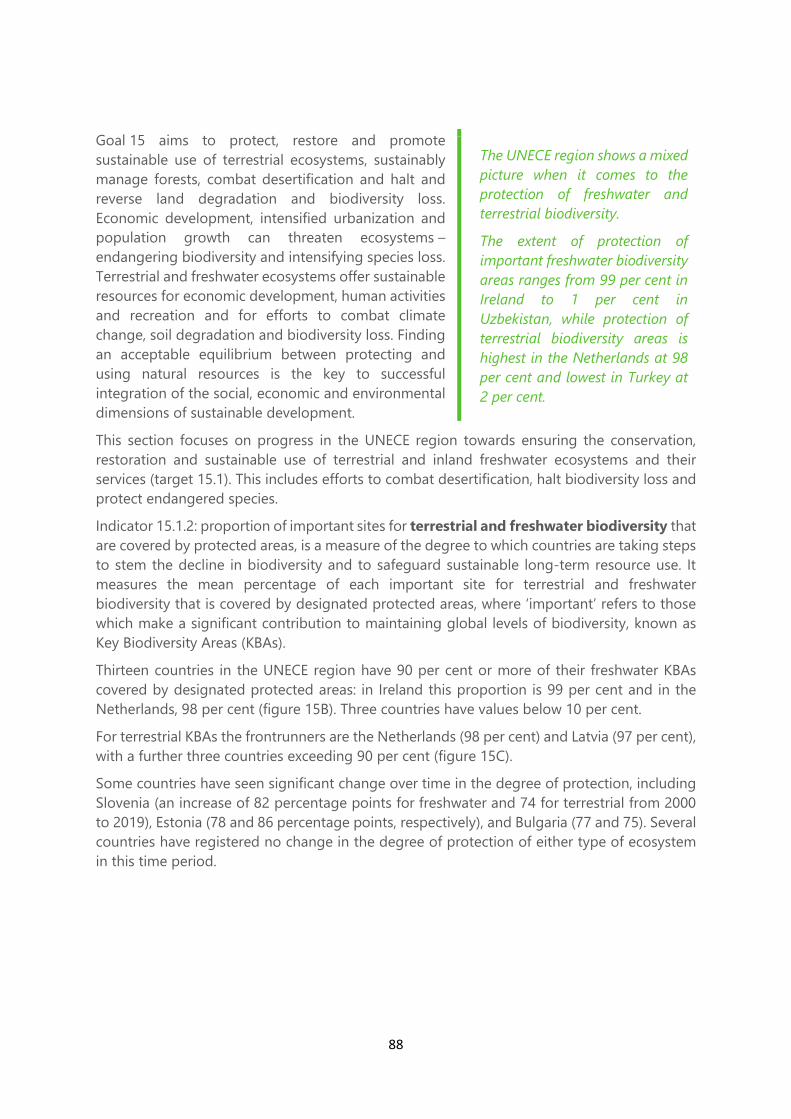
88
Goal 15 aims to protect, restore and promote sustainable use of terrestrial ecosystems, sustainably manage forests, combat desertification and halt and reverse land degradation and biodiversity loss. Economic development, intensified urbanization and population growth can threaten ecosystems – endangering biodiversity and intensifying species loss. Terrestrial and freshwater ecosystems offer sustainable resources for economic development, human activities and recreation and for efforts to combat climate change, soil degradation and biodiversity loss. Finding an acceptable equilibrium between protecting and using natural resources is the key to successful integration of the social, economic and environmental dimensions of sustainable development.
This section focuses on progress in the UNECE region towards ensuring the conservation, restoration and sustainable use of terrestrial and inland freshwater ecosystems and their services (target 15.1). This includes efforts to combat desertification, halt biodiversity loss and protect endangered species.
Indicator 15.1.2: proportion of important sites for terrestrial and freshwater biodiversity that are covered by protected areas, is a measure of the degree to which countries are taking steps to stem the decline in biodiversity and to safeguard sustainable long-term resource use. It measures the mean percentage of each important site for terrestrial and freshwater biodiversity that is covered by designated protected areas, where ‘important’ refers to those which make a significant contribution to maintaining global levels of biodiversity, known as Key Biodiversity Areas (KBAs).
Thirteen countries in the UNECE region have 90 per cent or more of their freshwater KBAs covered by designated protected areas: in Ireland this proportion is 99 per cent and in the Netherlands, 98 per cent (figure 15B). Three countries have values below 10 per cent.
For terrestrial KBAs the frontrunners are the Netherlands (98 per cent) and Latvia (97 per cent), with a further three countries exceeding 90 per cent (figure 15C).
Some countries have seen significant change over time in the degree of protection, including Slovenia (an increase of 82 percentage points for freshwater and 74 for terrestrial from 2000 to 2019), Estonia (78 and 86 percentage points, respectively), and Bulgaria (77 and 75). Several countries have registered no change in the degree of protection of either type of ecosystem in this time period.
The UNECE region shows a mixed picture when it comes to the protection of freshwater and terrestrial biodiversity.
The extent of protection of important freshwater biodiversity areas ranges from 99 per cent in Ireland to 1 per cent in Uzbekistan, while protection of terrestrial biodiversity areas is highest in the Netherlands at 98 per cent and lowest in Turkey at 2 per cent.
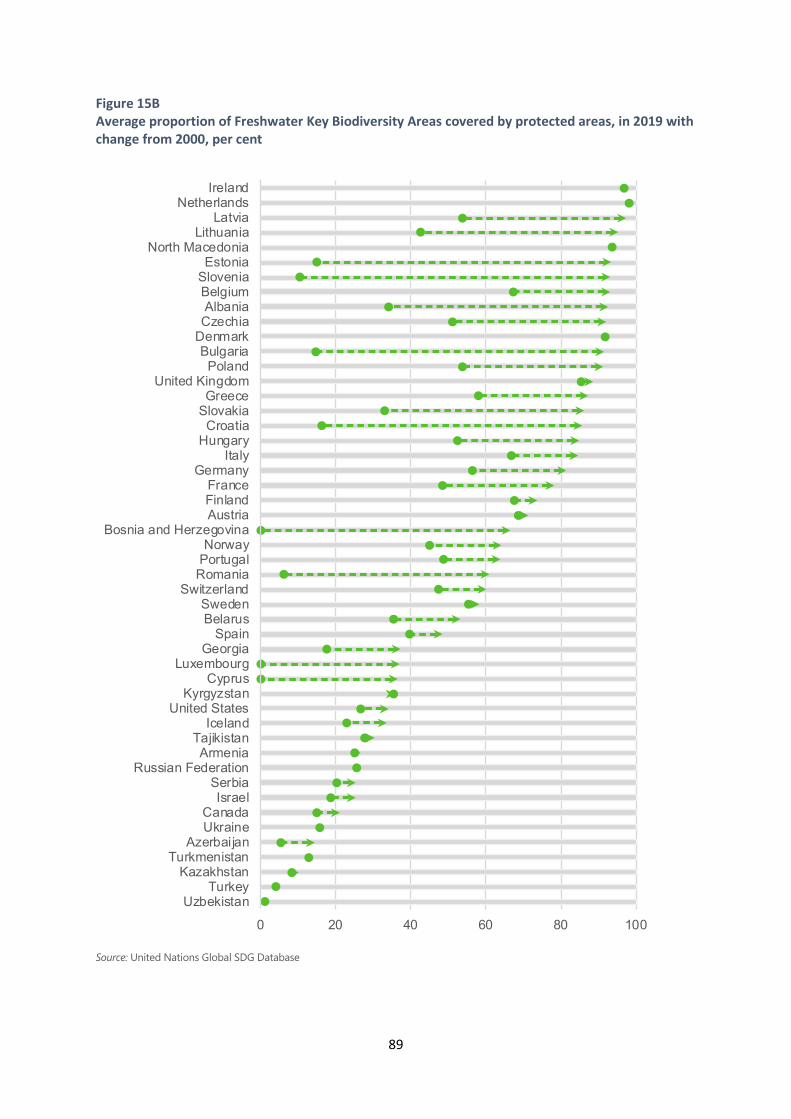
89
Figure 15B Average proportion of Freshwater Key Biodiversity Areas covered by protected areas, in 2019 with change from 2000, per cent
Source: United Nations Global SDG Database
0 20 40 60 80 100
UzbekistanTurkey
KazakhstanTurkmenistan
AzerbaijanUkraineCanada
IsraelSerbia
Russian FederationArmenia
TajikistanIceland
United StatesKyrgyzstan
CyprusLuxembourg
GeorgiaSpain
BelarusSweden
SwitzerlandRomaniaPortugalNorway
Bosnia and HerzegovinaAustriaFinlandFrance
GermanyItaly
HungaryCroatia
SlovakiaGreece
United KingdomPoland
BulgariaDenmarkCzechiaAlbaniaBelgiumSloveniaEstonia
North MacedoniaLithuania
LatviaNetherlands
Ireland
90
Figure 15C Average proportion of Terrestrial Key Biodiversity Areas covered by protected areas, in 2019 with change from 2000, per cent
Source: United Nations Global SDG Database
0 20 40 60 80 100
TurkeyUzbekistan
MontenegroKazakhstan
TurkmenistanTajikistan
Bosnia and HerzegovinaIceland
IsraelArmeniaUkraine
Russian FederationKyrgyzstan
North MacedoniaAndorra
SerbiaCanada
SwitzerlandAzerbaijan
GeorgiaBelarus
United StatesAlbania
SpainNorwaySwedenAustriaFinland
PortugalCyprus
RomaniaCroatia
ItalyGermany
FranceLiechtensteinLuxembourg
HungaryUnited Kingdom
BelgiumMalta
SlovakiaIrelandGreece
DenmarkPoland
BulgariaSloveniaLithuaniaCzechiaEstonia
LatviaNetherlands
91
Promote peaceful and inclusive societies for sustainable development, provide access to justice for all and build effective, accountable and inclusive institutions at all levels
This section looks at intentional homicides as an indicator of violence (target 16.1) and unsentenced detainees as an indicator for the rule of law (target 16.3). The data presented originate from national criminal justice systems and are collected through the United Nations Surveys on Crime Trends and the Operations of Criminal Justice Systems.
The number of victims of intentional homicide per 100,000 population (indicator 16.1.1) is a measure of most extreme form of violent crime and a direct indication of lack of security. Security from violence is a prerequisite for individuals to enjoy a safe and active life and for societies and economies to develop freely.
In countries of the UNECE region, levels of intentional homicide in 2017 range from no homicides in countries
with very small populations (Andorra, Liechtenstein and Monaco) to more than 5 per 100,000 population in three countries (figure 16A). Half of UNECE countries have levels of 1.2 or less.
From 2012 to 2017, the number of homicide victims in the UNECE region decreased slightly, from 3.8 to 3.7 per 100,000 (average weighted by population size), in 33 out of 51 countries with data. Countries with higher homicide levels showed the largest decreases. The seven countries with highest values in 2012 all reduced their level by more than 2 victims per 100,000 population. The largest reductions were seen in Georgia (from 4.4 to 1.0), Albania (from 5.4 to 2.3) and Kyrgyzstan (from 6.8 to 4.2). While countries with decreasing homicide levels are in the majority, progress is uneven. Increases of more than 0.5 per 100,000 are recorded in five countries. In the vast majority of countries, men are more likely to become a homicide victim than women, with the region’s average rate (weighted) in 2017 at 5.4 per 100,000 for men and 1.7 for women.
Indicator 16.3.2: unsentenced detainees as a proportion of overall prison population, signifies overall respect for the principle that persons awaiting trial should not be detained in custody unnecessarily, anchored in the right to be presumed innocent until proven guilty. Extensive use of pre-sentence detention – when not necessary for justified reasons – can divert criminal justice system resources and exert burdens on the accused and his or her family.
Data on this indicator are available for 2005 and 2017 for 51 UNECE countries (figure 16B). The proportion of unsentenced detainees varies largely, with four countries having values between 40 and 50 per cent and eight countries below 10 per cent. In the observed 12-year interval, 33 countries saw a decline in the proportion of unsentenced detainees. The simple (unweighted) average proportion for the region declined from 25 to 22 per cent. The two countries with the
In 2017, slightly fewer people fell victim to a homicide in the
UNECE region than five years earlier, with countries that have
relatively high homicide levels seeing the largest reductions.
Most UNECE countries have reduced the proportion of
unsentenced detainees, yet in some countries they make up
close to half of the prison population.
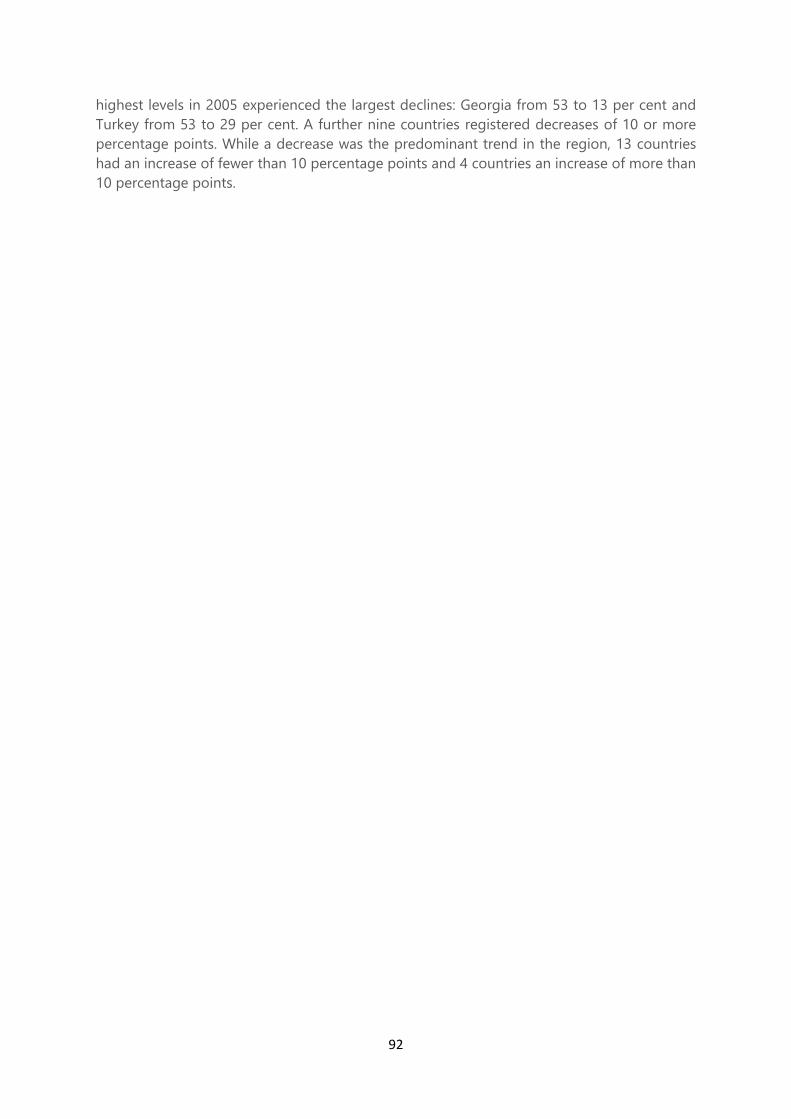
92
highest levels in 2005 experienced the largest declines: Georgia from 53 to 13 per cent and Turkey from 53 to 29 per cent. A further nine countries registered decreases of 10 or more percentage points. While a decrease was the predominant trend in the region, 13 countries had an increase of fewer than 10 percentage points and 4 countries an increase of more than 10 percentage points.
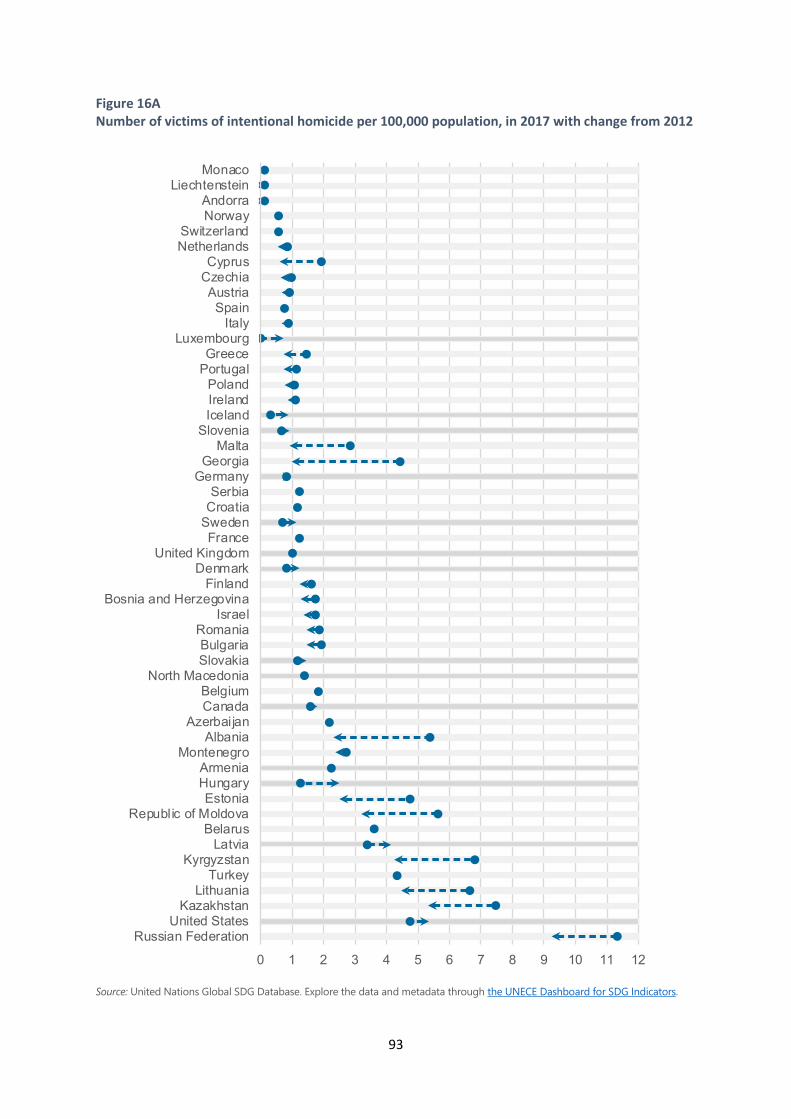
93
Figure 16A Number of victims of intentional homicide per 100,000 population, in 2017 with change from 2012
Source: United Nations Global SDG Database. Explore the data and metadata through the UNECE Dashboard for SDG Indicators.
0 1 2 3 4 5 6 7 8 9 10 11 12
Russian FederationUnited States
KazakhstanLithuania
TurkeyKyrgyzstan
LatviaBelarus
Republic of MoldovaEstonia
HungaryArmenia
MontenegroAlbania
AzerbaijanCanadaBelgium
North MacedoniaSlovakiaBulgaria
RomaniaIsrael
Bosnia and HerzegovinaFinland
DenmarkUnited Kingdom
FranceSwedenCroatiaSerbia
GermanyGeorgia
MaltaSlovenia
IcelandIrelandPoland
PortugalGreece
LuxembourgItaly
SpainAustria
CzechiaCyprus
NetherlandsSwitzerland
NorwayAndorra
LiechtensteinMonaco
94
Figure 16B Proportion of unsentenced detainees in overall prison population in 2017 with change from 2005, per cent
Source: United Nations Global SDG Database. Explore the data and metadata through the UNECE Dashboard for SDG Indicators.
0 10 20 30 40 50 60
AlbaniaAndorra
LuxembourgSwitzerland
CanadaMonacoArmenia
DenmarkBelgiumUkraine
LatviaGreeceTurkeyFrance
LiechtensteinMontenegro
IsraelNetherlands
SwedenNorway
MaltaCyprusCroatiaEstonia
GermanyHungary
AustriaFinland
Republic of MoldovaKyrgyzstan
ItalyAzerbaijan
IrelandPortugal
SerbiaBosnia and Herzegovina
KazakhstanSloveniaSlovakiaIceland
SpainGeorgiaBelarus
LithuaniaRussian Federation
North MacedoniaBulgariaCzechiaPoland
Romania
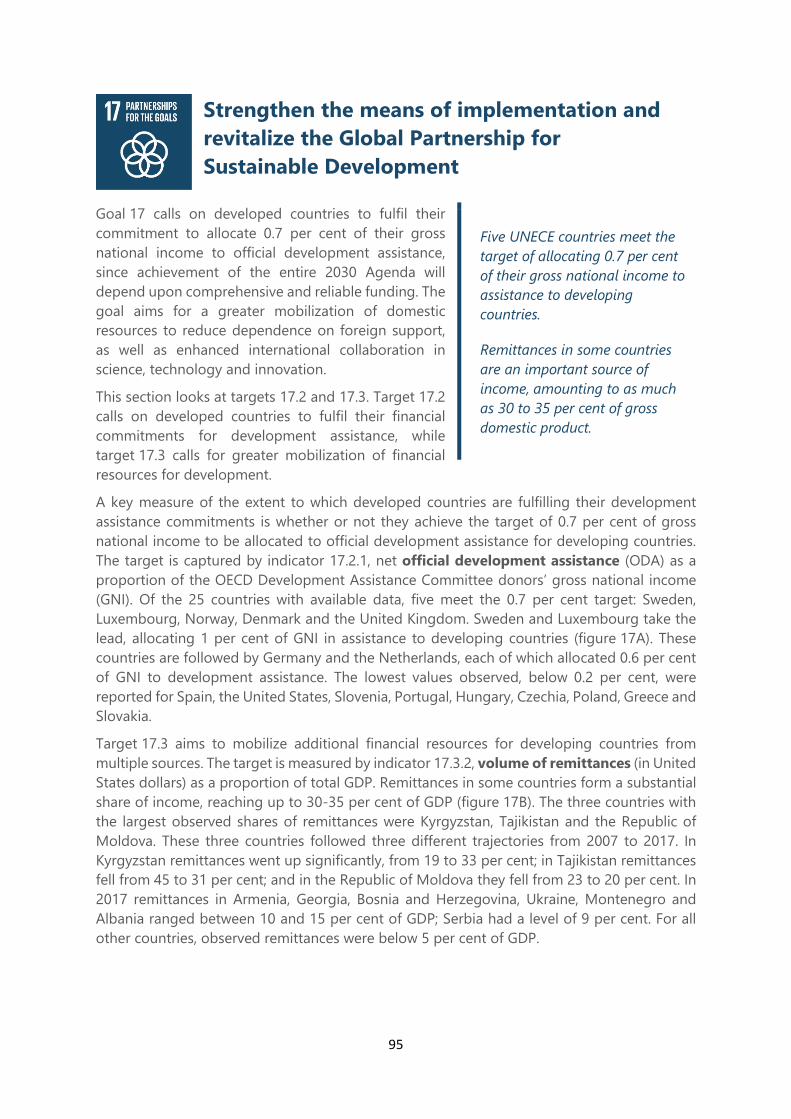
95
Strengthen the means of implementation and revitalize the Global Partnership for Sustainable Development
Goal 17 calls on developed countries to fulfil their commitment to allocate 0.7 per cent of their gross national income to official development assistance, since achievement of the entire 2030 Agenda will depend upon comprehensive and reliable funding. The goal aims for a greater mobilization of domestic resources to reduce dependence on foreign support, as well as enhanced international collaboration in science, technology and innovation.
This section looks at targets 17.2 and 17.3. Target 17.2 calls on developed countries to fulfil their financial commitments for development assistance, while target 17.3 calls for greater mobilization of financial resources for development.
A key measure of the extent to which developed countries are fulfilling their development assistance commitments is whether or not they achieve the target of 0.7 per cent of gross national income to be allocated to official development assistance for developing countries. The target is captured by indicator 17.2.1, net official development assistance (ODA) as a proportion of the OECD Development Assistance Committee donors’ gross national income (GNI). Of the 25 countries with available data, five meet the 0.7 per cent target: Sweden, Luxembourg, Norway, Denmark and the United Kingdom. Sweden and Luxembourg take the lead, allocating 1 per cent of GNI in assistance to developing countries (figure 17A). These countries are followed by Germany and the Netherlands, each of which allocated 0.6 per cent of GNI to development assistance. The lowest values observed, below 0.2 per cent, were reported for Spain, the United States, Slovenia, Portugal, Hungary, Czechia, Poland, Greece and Slovakia.
Target 17.3 aims to mobilize additional financial resources for developing countries from multiple sources. The target is measured by indicator 17.3.2, volume of remittances (in United States dollars) as a proportion of total GDP. Remittances in some countries form a substantial share of income, reaching up to 30-35 per cent of GDP (figure 17B). The three countries with the largest observed shares of remittances were Kyrgyzstan, Tajikistan and the Republic of Moldova. These three countries followed three different trajectories from 2007 to 2017. In Kyrgyzstan remittances went up significantly, from 19 to 33 per cent; in Tajikistan remittances fell from 45 to 31 per cent; and in the Republic of Moldova they fell from 23 to 20 per cent. In 2017 remittances in Armenia, Georgia, Bosnia and Herzegovina, Ukraine, Montenegro and Albania ranged between 10 and 15 per cent of GDP; Serbia had a level of 9 per cent. For all other countries, observed remittances were below 5 per cent of GDP.
Five UNECE countries meet the target of allocating 0.7 per cent of their gross national income to assistance to developing countries.
Remittances in some countries are an important source of income, amounting to as much as 30 to 35 per cent of gross domestic product.
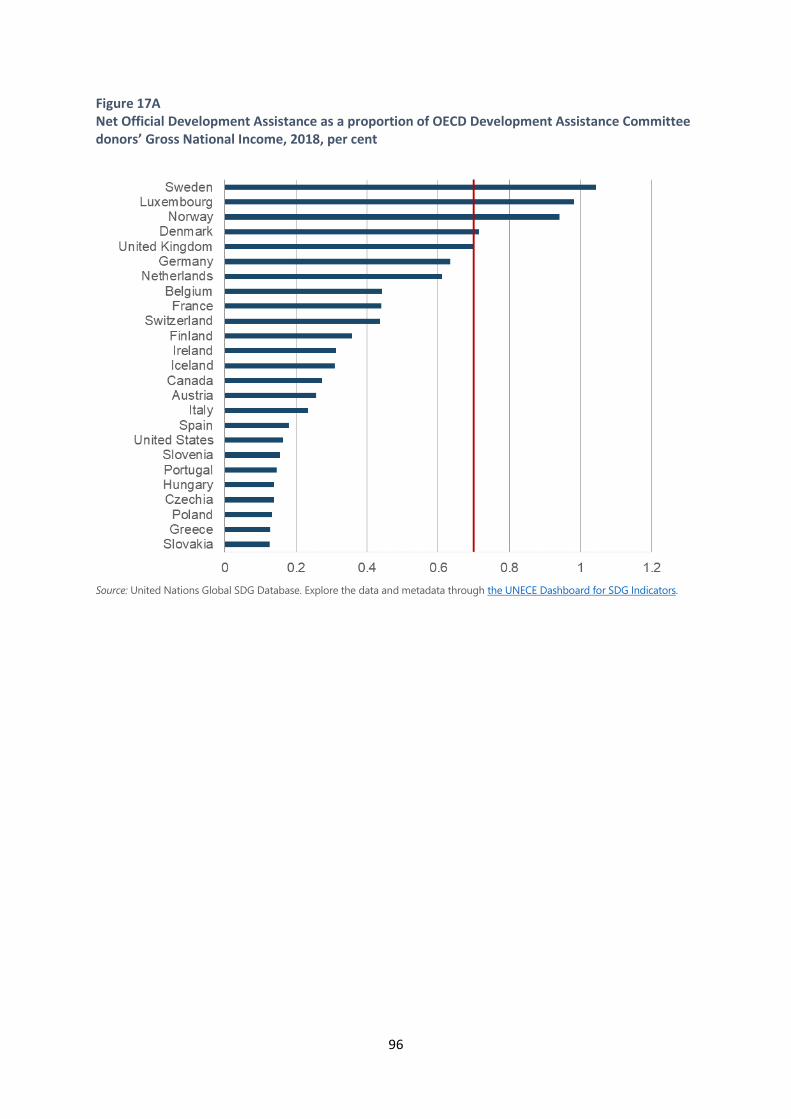
96
Figure 17A Net Official Development Assistance as a proportion of OECD Development Assistance Committee donors’ Gross National Income, 2018, per cent
Source: United Nations Global SDG Database. Explore the data and metadata through the UNECE Dashboard for SDG Indicators.
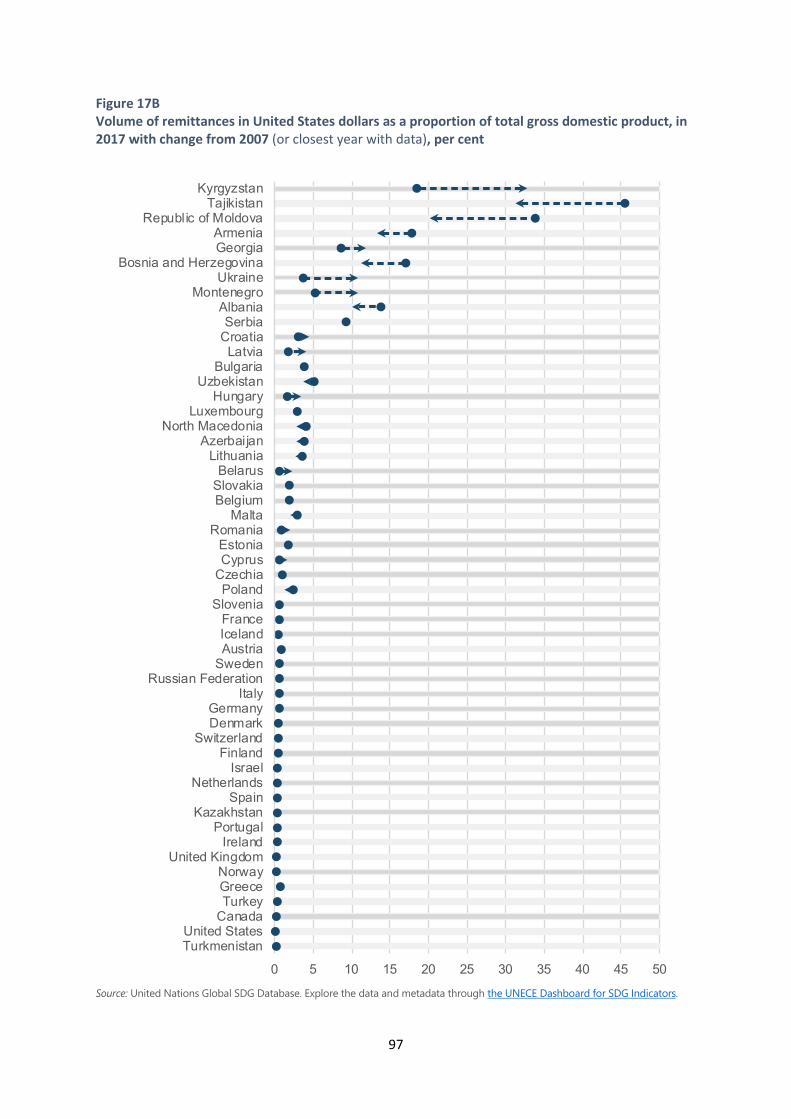
97
Figure 17B Volume of remittances in United States dollars as a proportion of total gross domestic product, in 2017 with change from 2007 (or closest year with data), per cent
Source: United Nations Global SDG Database. Explore the data and metadata through the UNECE Dashboard for SDG Indicators.
0 5 10 15 20 25 30 35 40 45 50
TurkmenistanUnited States
CanadaTurkeyGreeceNorway
United KingdomIreland
PortugalKazakhstan
SpainNetherlands
IsraelFinland
SwitzerlandDenmarkGermany
ItalyRussian Federation
SwedenAustriaIcelandFrance
SloveniaPoland
CzechiaCyprusEstonia
RomaniaMalta
BelgiumSlovakiaBelarus
LithuaniaAzerbaijan
North MacedoniaLuxembourg
HungaryUzbekistan
BulgariaLatvia
CroatiaSerbia
AlbaniaMontenegro
UkraineBosnia and Herzegovina
GeorgiaArmenia
Republic of MoldovaTajikistan
Kyrgyzstan
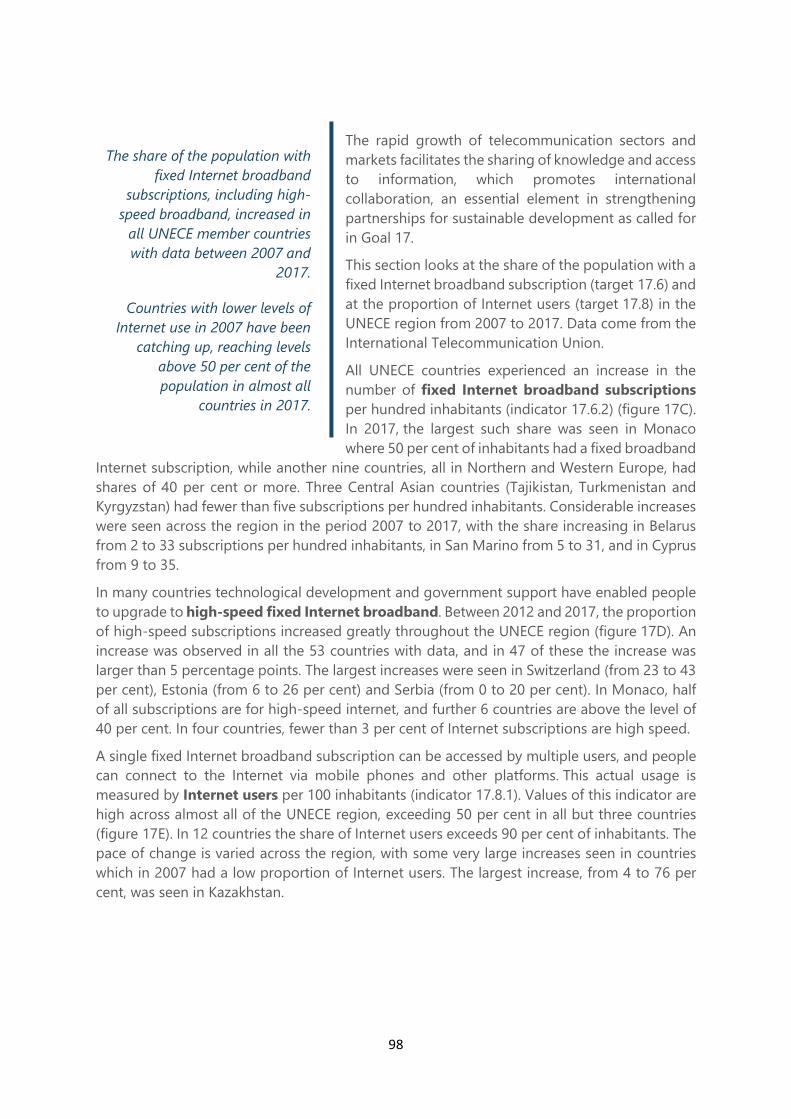
98
The rapid growth of telecommunication sectors and markets facilitates the sharing of knowledge and access to information, which promotes international collaboration, an essential element in strengthening partnerships for sustainable development as called for in Goal 17.
This section looks at the share of the population with a fixed Internet broadband subscription (target 17.6) and at the proportion of Internet users (target 17.8) in the UNECE region from 2007 to 2017. Data come from the International Telecommunication Union.
All UNECE countries experienced an increase in the number of fixed Internet broadband subscriptions per hundred inhabitants (indicator 17.6.2) (figure 17C). In 2017, the largest such share was seen in Monaco where 50 per cent of inhabitants had a fixed broadband
Internet subscription, while another nine countries, all in Northern and Western Europe, had shares of 40 per cent or more. Three Central Asian countries (Tajikistan, Turkmenistan and Kyrgyzstan) had fewer than five subscriptions per hundred inhabitants. Considerable increases were seen across the region in the period 2007 to 2017, with the share increasing in Belarus from 2 to 33 subscriptions per hundred inhabitants, in San Marino from 5 to 31, and in Cyprus from 9 to 35.
In many countries technological development and government support have enabled people to upgrade to high-speed fixed Internet broadband. Between 2012 and 2017, the proportion of high-speed subscriptions increased greatly throughout the UNECE region (figure 17D). An increase was observed in all the 53 countries with data, and in 47 of these the increase was larger than 5 percentage points. The largest increases were seen in Switzerland (from 23 to 43 per cent), Estonia (from 6 to 26 per cent) and Serbia (from 0 to 20 per cent). In Monaco, half of all subscriptions are for high-speed internet, and further 6 countries are above the level of 40 per cent. In four countries, fewer than 3 per cent of Internet subscriptions are high speed.
A single fixed Internet broadband subscription can be accessed by multiple users, and people can connect to the Internet via mobile phones and other platforms. This actual usage is measured by Internet users per 100 inhabitants (indicator 17.8.1). Values of this indicator are high across almost all of the UNECE region, exceeding 50 per cent in all but three countries (figure 17E). In 12 countries the share of Internet users exceeds 90 per cent of inhabitants. The pace of change is varied across the region, with some very large increases seen in countries which in 2007 had a low proportion of Internet users. The largest increase, from 4 to 76 per cent, was seen in Kazakhstan.
The share of the population with fixed Internet broadband
subscriptions, including high-speed broadband, increased in
all UNECE member countries with data between 2007 and
2017.
Countries with lower levels of Internet use in 2007 have been
catching up, reaching levels above 50 per cent of the population in almost all
countries in 2017.
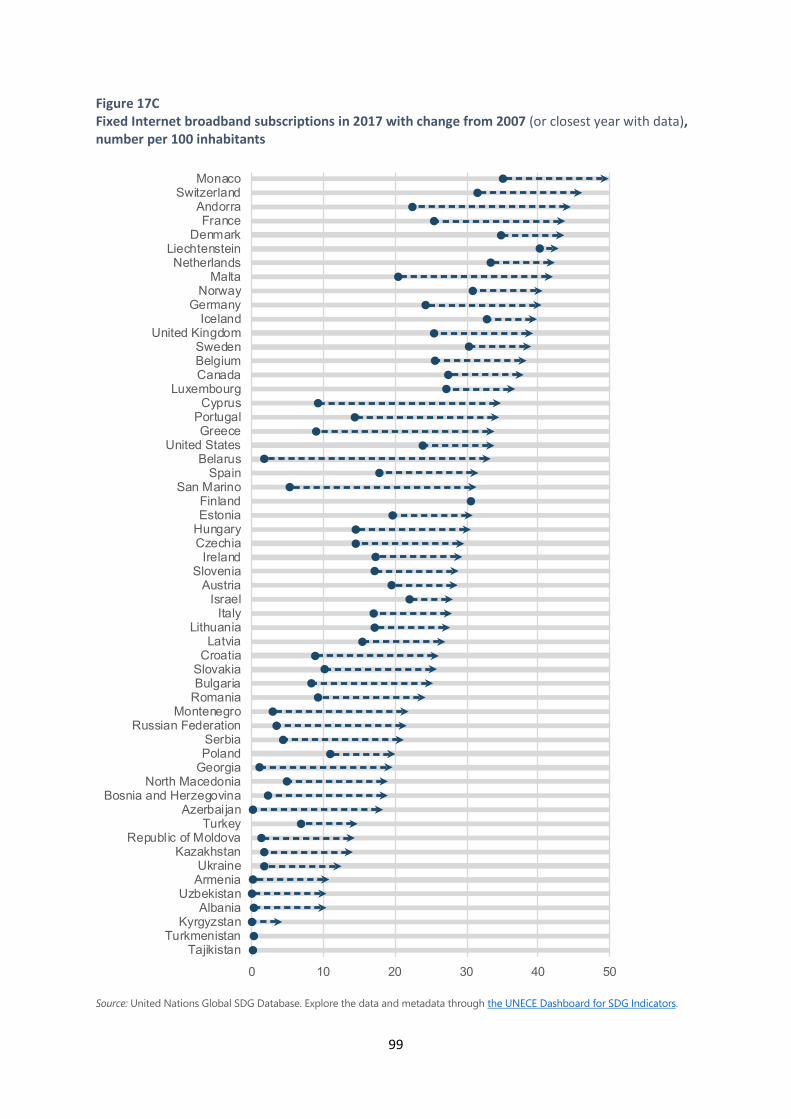
99
Figure 17C Fixed Internet broadband subscriptions in 2017 with change from 2007 (or closest year with data), number per 100 inhabitants
Source: United Nations Global SDG Database. Explore the data and metadata through the UNECE Dashboard for SDG Indicators.
0 10 20 30 40 50
TajikistanTurkmenistan
KyrgyzstanAlbania
UzbekistanArmeniaUkraine
KazakhstanRepublic of Moldova
TurkeyAzerbaijan
Bosnia and HerzegovinaNorth Macedonia
GeorgiaPolandSerbia
Russian FederationMontenegro
RomaniaBulgariaSlovakia
CroatiaLatvia
LithuaniaItaly
IsraelAustria
SloveniaIreland
CzechiaHungaryEstoniaFinland
San MarinoSpain
BelarusUnited States
GreecePortugal
CyprusLuxembourg
CanadaBelgiumSweden
United KingdomIceland
GermanyNorway
MaltaNetherlands
LiechtensteinDenmark
FranceAndorra
SwitzerlandMonaco
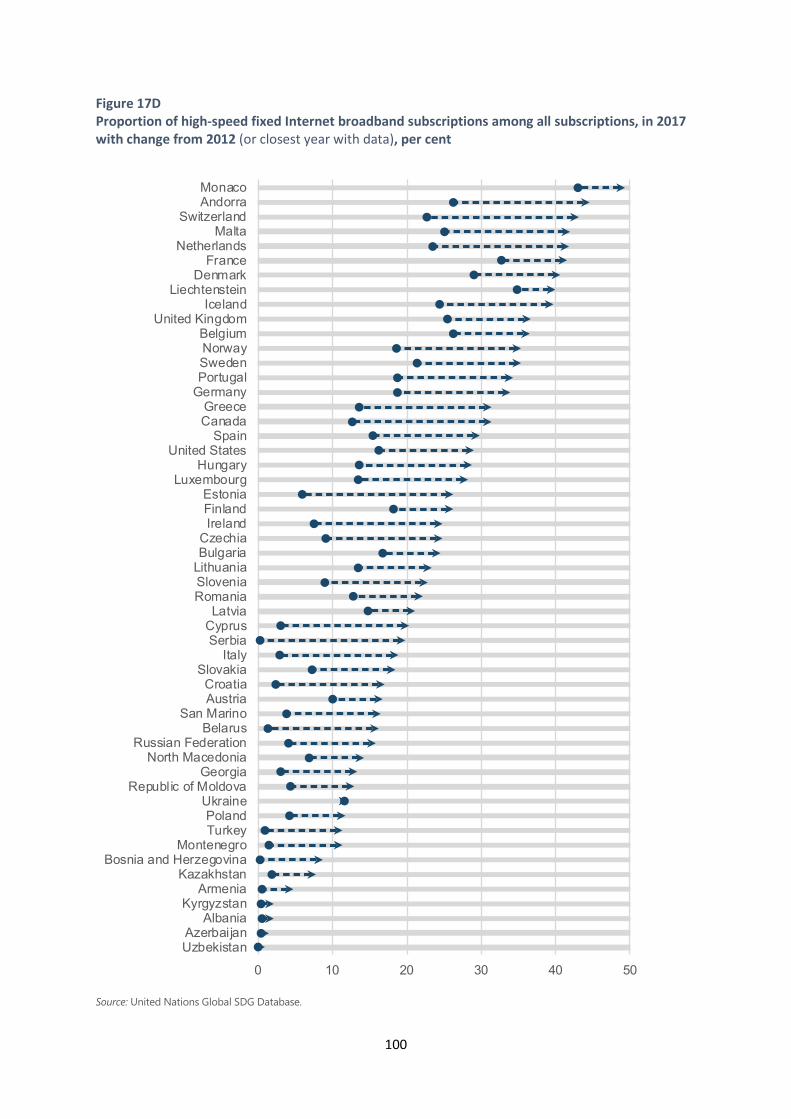
100
Figure 17D Proportion of high-speed fixed Internet broadband subscriptions among all subscriptions, in 2017 with change from 2012 (or closest year with data), per cent
Source: United Nations Global SDG Database.
0 10 20 30 40 50
UzbekistanAzerbaijan
AlbaniaKyrgyzstan
ArmeniaKazakhstan
Bosnia and HerzegovinaMontenegro
TurkeyPoland
UkraineRepublic of Moldova
GeorgiaNorth Macedonia
Russian FederationBelarus
San MarinoAustriaCroatia
SlovakiaItaly
SerbiaCyprusLatvia
RomaniaSloveniaLithuaniaBulgariaCzechiaIrelandFinlandEstonia
LuxembourgHungary
United StatesSpain
CanadaGreece
GermanyPortugalSwedenNorwayBelgium
United KingdomIceland
LiechtensteinDenmark
FranceNetherlands
MaltaSwitzerland
AndorraMonaco
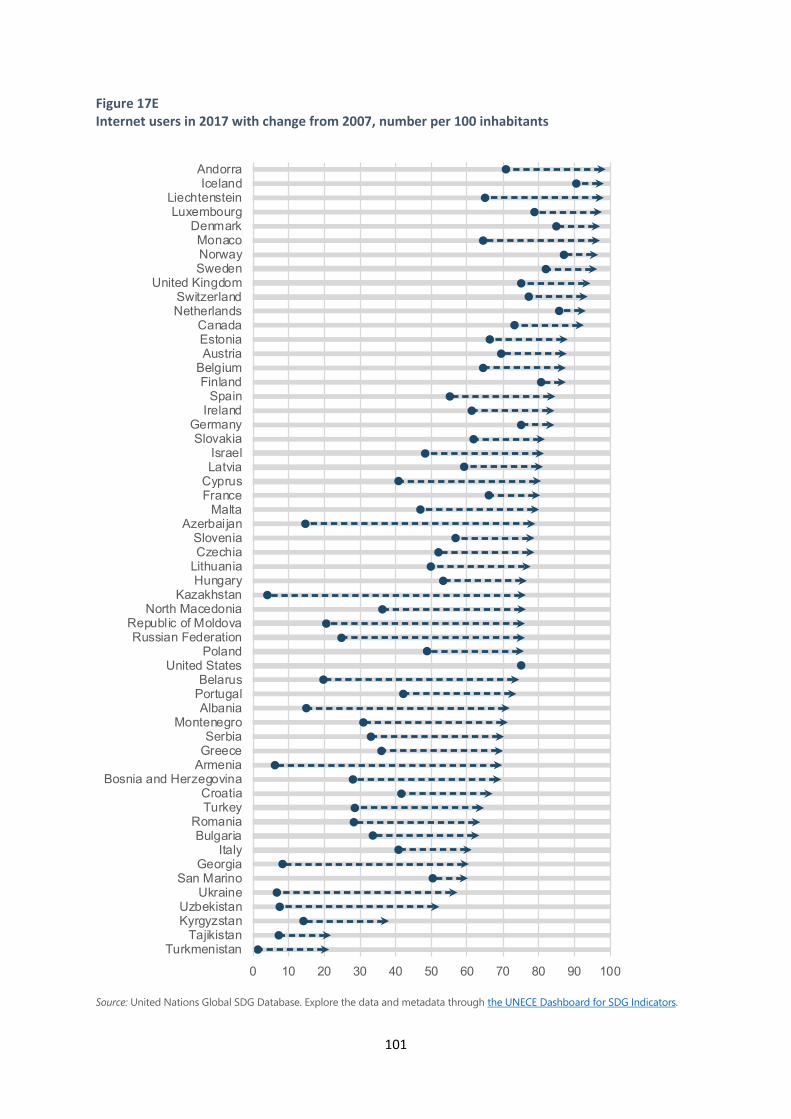
101
Figure 17E Internet users in 2017 with change from 2007, number per 100 inhabitants
Source: United Nations Global SDG Database. Explore the data and metadata through the UNECE Dashboard for SDG Indicators.
0 10 20 30 40 50 60 70 80 90 100
TurkmenistanTajikistan
KyrgyzstanUzbekistan
UkraineSan Marino
GeorgiaItaly
BulgariaRomania
TurkeyCroatia
Bosnia and HerzegovinaArmeniaGreeceSerbia
MontenegroAlbania
PortugalBelarus
United StatesPoland
Russian FederationRepublic of Moldova
North MacedoniaKazakhstan
HungaryLithuaniaCzechiaSlovenia
AzerbaijanMalta
FranceCyprusLatviaIsrael
SlovakiaGermany
IrelandSpain
FinlandBelgiumAustriaEstoniaCanada
NetherlandsSwitzerland
United KingdomSwedenNorwayMonaco
DenmarkLuxembourg
LiechtensteinIceland
Andorra
102
Closing remarks
This first UNECE regional report on Sustainable Development Goals arrives at a key junction of the follow-up and review of the 2030 Agenda. It describes the levels and trends of selected indicators most relevant for the region.
UNECE countries are fulfilling targets or making good progress in many of the topics covered in this report. These include targets directly aimed at people, such as eradicating extreme poverty, covering the population with social protection, providing modern means for family planning, and having low levels of maternal, infant and child mortality; as well as actions geared towards preserving the planet – such as expanding forest cover, providing safely managed sanitation, lowering the energy intensity of the economy and complying with environmental agreements.
On the other hand, in areas such as air pollution, protection of marine areas, development assistance, and disaster-risk reduction strategies, more needs to be done to meet the targets.
The 2030 Agenda cannot be fulfilled without relevant, comparable and timely statistics to track progress. In this respect, work on the report brought to the surface several challenges that are familiar to the community of statisticians. Many indicators still do not have an internationally-agreed methodology and therefore a third of the indicators are not yet reported in the Global SDG Indicator Database. Data on several indicators are not available for a large number of countries. More information needs to be made available about the data sources and measurement issues that influence comparability across countries. In view of this, some of the data presented in the report may be sensitive to differences in measurement and methodology. The data are used to provide a general impression of the variation among countries and the direction of trends.
Furthermore, this first regional report looks at average values of the countries, except for the few cases that consider the values by sex. A larger effort and better data availability is needed to expand such regional reporting to breakdowns by cross-cutting variables, to assess how far the objective of leaving no one behind is being met in different areas.
This report therefore brings to the fore the importance of investing in data for the full implementation of the 2030 Agenda.
It is expected that the information presented in this report for each of the 17 Sustainable Development Goals will be valuable for member countries in the follow-up and review of the 2030 Agenda for Sustainable Development in the UNECE region.
103
Acronyms and abbreviations
CES Conference of European Statisticians CO2 Carbon dioxide DMC Domestic material consumption EECCA Eastern Europe, the Caucasus and Central Asia EEZ Exclusive Economic Zone EFTA European Free Trade Association EU European Union FAO Food and Agriculture Organization of the United Nations GDP Gross domestic product GNI Gross national income ha hectare ICT Information and Communications Technology IPOA International Plan of Action ITU International Telecommunication Union IUU Illegal, unreported and unregulated IWW Inland waterways KBA Key Biodiversity Area km kilometre KPA Key Protected Area MEA Multilateral Environmental Agreement MJ Megajoules NEET Not in employment, education or training ODA Official Development Assistance OECD Organisation for Economic Co-operation and Development PISA Programme for International Student Assessment PM2.5, PM10 Fine Particulate Matter, Coarse Particulate Matter POPs Persistent Organic Pollutants PPP Purchasing power parity R&D Research and Development RTA Road traffic accident SDG Sustainable Development Goal US United States (of America) USD United States Dollars WHO World Health Organization