Towards a global biological information infrastructure · 1 Towards a global biological information...
33
Towards a global biological information infrastructure Challenges, opportunities, synergies, and the role of entomology Edited by: H. Saarenmaa and E. S. Nielsen † Project manager: Hannu Saarenmaa European Environment Agency Technical report 70
-
Upload
nguyendang -
Category
Documents
-
view
220 -
download
2
Transcript of Towards a global biological information infrastructure · 1 Towards a global biological information...

1
Towards a global biologicalinformation infrastructure
Challenges, opportunities,synergies, and the role of entomology
Edited by:H. Saarenmaa and E. S. Nielsen †
Project manager:Hannu Saarenmaa
European Environment Agency
Technical report 70

2 Towards a global biological information structure
Legal notice
Neither the European Environment Agency nor any person or company acting on behalf of the Agency is responsible for the use that may be made of the information contained in this report.
A great deal of additional information on the European Union is available on the Internet.It can be accessed through the Europa server (http://europa.eu.int).
© EEA, Copenhagen, 2002 and© Authors of their respective articles.
Reproduction is authorised provided the source is acknowledged.
European Environment AgencyKongens Nytorv 6DK-1050 Copenhagen KTel. (45) 33 36 71 00Fax (45) 33 36 71 99E-mail: [email protected]: http://www.eea.eu.int
3
Contents
Preface: Towards a global biological information infrastructure: Challenges, opportunities, synergies, and the role of entomologyH. Saarenmaa . . . . . . . . . . . . . . . . . . . . . . . . . . . . . . . . . . . . . . . . . . . . . . . . . . . . . 4
The Tree of Life project: A multi-authored, distributed Internet project containing information about phylogeny and biodiversityD.R. Maddison, W.P. Maddison, J. Frumkin and K.-S. Schulz . . . . . . . . . . . . . . . . . 5
Issues of quality control in large, mixed-origin entomological databasesJ. Soberón , L. Arriaga and L. Lara . . . . . . . . . . . . . . . . . . . . . . . . . . . . . . . . . . . . . 15
Interactive identification using the Internet M. Dallwitz, T.A. Paine and E.J. Zurcher . . . . . . . . . . . . . . . . . . . . . . . . . . . . . . . . 23
New approaches to creating global species databases in entomologyM.J. Scoble . . . . . . . . . . . . . . . . . . . . . . . . . . . . . . . . . . . . . . . . . . . . . . . . . . . . . . 34
An information infrastructure for German insect collections including multimedia and GIS toolsK.-H. Lampe and K. Riede . . . . . . . . . . . . . . . . . . . . . . . . . . . . . . . . . . . . . . . . . . . 43
Engineering considerations for biodiversity softwareR.A. Morris, M. Passell, J. Wan, R.D. Stevenson and W. Haber. . . . . . . . . . . . . . . . 49
Technological opportunites and challenges in building a global biological information infrastructureH. Saarenmaa . . . . . . . . . . . . . . . . . . . . . . . . . . . . . . . . . . . . . . . . . . . . . . . . . . . . . 60
4 Towards a global biological information structure
Preface
Towards a global biological information infrastructure: Challenges, opportunities, synergies, and the role of entomology
We have now enetered the 21st century. The world is going towards Information Society. For entomologists this time is particularly challenging because of the wealth of data that is potentially available in this field. Being able to share data efficiently would allow entomologists to make a major contribution to the conservation of biodiversity. The combination of new technologies with systematics and collections based research may offer an opportunity to strengthen such activities in the future. There are many good ways of framing the activities such as the Clearing House Mechanism (CHM) and Global Biodiversity Information Facility (GBIF).
This all calls for a new approach. Biodiversity informatics and taxonomy are emerging as information sciences. We believe that if we are able to create a useful information infrastructure for entomology, it should directly address the burning questions of the time, such as the slow rate of discovery of new species, and extinction that follows from lack of knowledge and value on biodiversity. If data, information, and knowledge could be shared more efficiently than has been the case in the past, it would increase the credibility of the taxonomic community in the eyes of funding organisations, and have a positive snowball effect over a wide range of activities.
The papers in this volume are results of a one-day symposium that was held during the XXI International Congress of Entomology in Iguassu Falls, Brasil, on 24 August 2000. The symposium was called upon to make an inventory of the ongoing activities and possibly to lay down some foundations for further cooperation among the various projects. Twelve presentations were made. Seven of them were turned into papers during the Autumn of 2000 and are printed in this volume. Four other papers that covered 1) Entomology at the Costa Rican InBio, 2) Beetles and beetle larvae of the world: An interactive identification and information systems for families and subfamilies, 3) Developing and sharing data globally: The Global Butterfly Information System GLOBIS, 4) The BioSystematic Database of World Diptera: the first global master species database, are available as abstracts in the Congress volumes. There also is a website that links to all the presented systems (1).
Looking at the list of projects and the systems presented, it all looks very exiting. Yet the bigger picture might be still missing. Is there interoperability between the systems? If we compare entomological information management with other areas, such as plant information, it is easy to realise that we still have some way to go. How these challenges will be met was covered by Ebbe Nielsen in the opening speech on the GBIF.
En route to the first meeting of the GBIF Governing Board, the co-editor of this volume Ebbe Nielsen passed away on 7 March 2001. The worldwide entomology and biodiversity informatics communities sustained a huge loss. We dedicate this small work to his memory.
April 2001Hannu Saarenmaa
(1) http://www.eionet.eu.int/Topic_Areas/Nature_Protection_Biodiversity/Biodiversity/GBII

The Tree of Life project 5
The Tree of Life projectA multi-authored, distributed Internet project containing information about phylogeny and biodiversity
David R. Maddison (2), Wayne P. Maddison (3), Jeremy Frumkin (4), and Katja-Sabine Schulz (2)
Abstract
The Tree of Life project (ToL) is a collaborative effort among biologists to portray the relationships and characteristics of organisms. Experts on groups of organisms synthesize available information and portray their view of the phylogeny of that group, including discussion of evidence and alternative hypotheses, alongside additional information about the organisms' characteristics. The ToL is currently a series of static HTML web pages, but in the near future it will be converted into a dynamic, database-driven system. Presentations of the information in the ToL database will then be customizable, allowing the project to better serve a diversity of audiences. The ToL database will be able to communicate with other databases, serving phylogenetic and other information about a group of organisms to other databases, and in turn receiving additional information about taxa from other databases.
Keywords: evolutionary tree; organismal characteristics; database.
The affinities of all the beings of the same class have sometimes been represented by a great tree… As buds give rise by growth to fresh buds, and these, if vigorous, branch out and overtop on all sides many a feebler branch, so by generation I believe it has been with the great Tree of Life, which fills with its dead and broken branches the crust of the earth, and covers the surface with its ever branching and beautiful ramifications.
(Darwin, 1859)
Introduction
Organisms we see today are but leaves on the tips of Darwin's Tree of Life. The diversity of species arose by the branching of the evolutionary tree, and the diversity in form of these species by evolutionary change along those branches. As the evolutionary tree is the conduit along which the genes (and therefore traits) of organisms flowed, it is not surprising that knowledge of the shape of this phylogeny can be critical for understanding modern biodiversity (e.g., Ridley, 1983; Felsenstein, 1985; Harvey and Pagel, 1991; Maddison and Maddison, 1992; Martins, 1996; Pagel, 1999).
The Tree of Life Project (http://phylogeny.arizona.edu/tree/phylogeny.html) uses phylogeny as the central organizing principle for information about organisms and biodiversity. It is a collaborative effort among biologists providing a collection of information, available over the Internet, about the phylogeny and diversity of life on Earth. It consists of a series of web pages, each illustrating and discussing an individual species or a group of species, linked together in the form of a current view of the evolutionary tree of life. Along with pictures and introductory information of interest to the general public and students of all levels, Tree of Life pages feature specialized sections (on morphology, phylogeny, biogeography, etc.) addressing the needs of researchers in the field. There are currently over 300 biologists in 21 countries authoring pages of the Tree.
The Tree of Life Project (ToL) currently has three primary goals: (1) to provide comprehensive and authoritative information on the phylogenetic relationships among all species of organism, living and extinct (a goal that will never be fully achieved); (2) to provide information about the characteristics of groups of organisms; (3) to provide information on every species of organism.
(2) Department of Entomology, University of Arizona, Tucson, AZ, 85721, USA, [email protected] (3) Department of Ecology and Evolutionary Biology, University of Arizona, Tucson, AZ, 85721, USA(4) University of Arizona Library, University of Arizona, Tucson, AZ, 85721, USA
6 Towards a global biological information structure
Although initial thoughts of creating an electronic system to organize biological information in a phylogenetic framework were formulated in the late 1980s by DRM, it was not until 1994 that action was taken to create the ToL. DRM and WPM designed the project and built the tools to create it in late 1994, and wrote the first skeletal branch pages. In January of 1995, the project was announced. During 1995 and 1996 progress was made by DRM and WPM in making the tools for authors easier to use and in providing better documentation, as well increasing participation by other systematists. DRM has served as coordinator, editor, designer, and program since that time. In 1997 KS began work on the ToL, helping authors create pages and writing much of the technical documentation on the home site; she now serves as managing editor and technical assistant. Although there has been relatively little change in the technical structure or design of the ToL in the last five years, many new pages have been added. Growth of the ToL has been sporadic, with bursts of growth along particular branches, and stasis in others. In 1999 JF joined the project to help turn the ToL into a database.
In this paper, we will first describe the current ToL. A description of the plans for future changes in the ToL will be followed by a discussion of the place of the ToL among active biodiversity database projects, and its interactions with other projects.
Current form of the ToL
Leaf, branch, and accessory pages
The portion of the ToL that is visible on the Web is a collection of about 1600 static HTML files with associated graphics files.
The 1600 pages fall into two categories. About 300 of these are leaf pages, that focus on individual species, describing the characteristics of the species and any other information the authors deem relevant (geographic distribution, ecological relationships, conservation status, etc.) As there are millions of living species of organisms (plus a much smaller number of known, extinct forms), the ToL’s representation of species diversity is still very incomplete. The remaining 1300 pages are branch pages that describe groups of species (genera, families, orders, etc.). For the time being, the core effort of the project is the creation of branch pages.
Branch pages provide general information about each group, such as diversity and habitat information, defining characteristics, maps showing where the organisms live, literature references, links to other sources of information on the Internet, etc. Their key elements are a phylogenetic tree (or a simple classification if the phylogeny has not yet been elucidated) depicting the current hypothesis about the relationships of subgroups and a discussion of the evidence for the relationships proposed. Based on the hierarchical structure provided by these trees, the pages for different groups of organisms are then linked together to reflect the shape of the evolutionary tree of life. The pages focusing on groups of species represent the internal branches of the ToL, and chains of such branch pages connect the pages for individual species, which represent the tips of the ToL.
As an example, an excerpt of the page for beetles (Coleoptera) is shown in Figure 1. At the top of the page is a navigational tool bar. The tree diagram below the pictures of beetles shows the current hypothesis for the phylogeny of major lineages of beetles. Below this are several text sections: Introduction, Characteristics, The Suborders of Coleoptera, Discussion of Phylogenetic Relationships, and References. (Other sections can be included; for example, the page for Fungi includes sections on the fossil record and biogeography of fungi, and notable fungi.) These sections are followed by information about the authors, including contact information, links to other relevant sites on the Internet, and another navigational tool bar.
The phylogeny near the top of the page serves as the navigational center. It is from this local tree that one can move down to deeper branches in the Tree of Life (by clicking on the local tree's root), or up to descendent clades (by clicking on the terminal taxa in the local tree). For example, if one clicked on the terminal taxon Adephaga in the beetle page, one would be
The Tree of Life project 7
taken to the page for the beetle suborder Adephaga. On that page, the local tree depicts the relationship of adephagan families; clicking on the terminal taxon Carabidae would take one to the page for the beetle family Carabidae. Continuing in this fashion up the branches of the ToL would eventually lead one to leaf pages for individual species of beetles. If one moved down the branches, to more inclusive groups, one would eventually reach the page for all life.
In order to cover all groups of living things, we will need a total of at least 150 000 branch pages; thus, at present less than 1% of all eventual branch pages are represented. The ToL's branches vary in their completeness. While there are complete pages on some fungi, some archaebacteria, frogs, extinct jawless fishes, beetles, jumping spiders, crayfish, and cephalopods, among others, some regions of the ToL are but buds, and some contain only temporary pages. Notably lacking are mammals (except for bats and some rodents), lizards, many birds, most flowering plant groups, and most unicellular organisms.
In addition to branch and species pages, the project contains linked pages that are not part of the primary tree structure. These accessory pages provide additional information that would not reasonably fit on a branch or species page. For example, the Terrestrial Vertebrates page has four accessory pages attached to it, which contain discussion of variation in life history, breathing, hearing in terrestrial vertebrates, as well as a detailed discussion of the controversies about relationships of the major lineages of terrestrial vertebrates. On other branches there can be a type of accessory page called a Treehouse, which is a web site for children about that particular group of organisms.
The ToL itself is distributed, with different branches on different computers. Current pages are distributed on 20 computers in four countries (U.S.A., United Kingdom, Canada, Brasil), with the largest and root portion on the home computer in Arizona.
Constructing pages
The HTML files that constitute the branch and leaf pages of the ToL are currently created with a special version of the phylogenetics program MacClade (Maddison and Maddison, 2000a). Raw data for ToL pages are stored in text files in the NEXUS format (Maddison et al., 1997), a tagged format designed for housing systematic data that is shared among a number of programs. This special version of MacClade contains editors for manipulating the ToL information contained in the NEXUS file (as described at http://phylogeny.arizona.edu/tree/sep/usingmacclade.html). When an author has completed editing the information, MacClade creates the HTML file, which is the actual web page that will be placed on a web server. MacClade's creation of the HTML file ensures that the pages are of uniform format, and that the author does not need to learn details of HTML.
In the HTML pages it creates, MacClade embeds codes containing information about the taxa on a page, images, and so on. This information is gathered by a web crawler that wanders up the branches of the ToL, through the 20 computers containing the various pages, and harvests the information contained in the embedded codes. The database produced by the web crawler is then used to build the searchable index.
MacClade's editing system, while functional, has a number of disadvantages. For example, the editing tools are available only for the MacOS®. While Macintosh® computers are common among evolutionary biologists, the MacOS-only editor does make it more difficult for some biologists to contribute to the project. Authors using the editing tools see the information in a format very different from its eventual appearance on a ToL page, making it more difficult for some authors to easily imagine the consequences of their efforts.
Administration and quality control
David Maddison currently serves as lead coordinator and editor of the project and makes final decisions about design, policy, contributors, and acceptance or rejection of pages. (The administrative structure is likely to change as the project grows.) The project is hierarchically managed, with coordinators of particular groups of organisms serving as associate editors for

8 Towards a global biological information structure
subgroup pages, coordinators for subgroup pages serving as associate editors for sub-subgroups, and so on.
Figure 1. Portions of the current branch page for Coleoptera (beetles) in the Tree of Life project
Phylogeny of group;navigational center formoving up and downbranches of the ToL
Navigational toolbar
Text sectionsintroducing group,describing characters,natural history,evidence andcontroversies regardingphylogeny, etc.
Navigational toolbar
Links to otherinformation on theInternet
...
...

The Tree of Life project 9
Each Tree of Life page is authored by one or more biologists, who are chosen and invited to contribute by the coordinators of a given group of organisms, in conjunction with the editor. Coordinators are advised to base their selection of authors on a detailed list of criteria including relevant research in recent years, willingness to represent diverse approaches and views of their group's evolution, and ability to coordinate efforts within subgroups. For each individual page, we aim to enlist the cooperation of the world experts of the given group, and if a field is characterized by controversies, communication between different schools of thought is encouraged.
Quality control is important, and it begins with careful choices of editors, coordinators, and authors. However, a more thorough means of oversight is needed, and for this reason, a standard peer-review process has recently been implemented. It is currently optional, with pages successfully undergoing peer-review being so marked. Eventually it will become mandatory for all major pages, at least. One for coming years is to increase the quality of all existing pages, and to replace those current pages that are out of date or incomplete.
Coping with controversy
There will always be disagreement about some of the information presented in the Tree of Life project, including the shape of the phylogeny for some groups. For this reason we require authors to discuss reasonable alternative phylogenetic hypotheses on their pages. In general the ToL attempts to track the community consensus on a subject, but there is always the danger of thereby choosing overly conservative beliefs based on partial evidence. The other approach, of presenting more novel, less popular ideas, may often cater to radical beliefs that will not stand the test of time. Choosing the right point in the wave of each controversy will hopefully be accomplished with the appropriate combination of associate editors, authors, and peer-review.
To some pages, a moderated forum for discussion will be added, where multiple participants can discuss their views about the phylogenetic relationships of the group. This will allow for a better representation of diverse views than might be accomplished by confining the description of the state of the field to a single contribution.
A forum will not allow competing hypotheses about relationships to be built into the structure of the tree itself, however, and for this reason we will also explore the possibility of allowing multiple trees for a particular group. In some cases, competing trees may not be feasibly contained within the tree's backbone, if they are very different (for example, if they contain different terminal taxa).
Future form of the ToL
Growth in content
The ToL will grow in several different directions over the next few years. The content of the ToL will be expanded by the addition or completion of numerous pages. First versions of most primary branch pages will be completed, including the major groups of organisms, and the entire paths up to focal groups such as Homo, Mus, Escherichia, Saccharomyces, Caenorhabditis, Drosophila, and Arabidopsis. The ToL's use in education and conservation biology will be expanded. Several model Treehouses will be built, in order to explore their use and nature. The format of ToL pages will be redesigned, and new features will be added, such as live analyses of data.
The ToL as a database
In the near future, the Tree of Life will be transformed from a series of NEXUS files and HTML pages into a database, and associated applications for display of the data and their entry will be created. This will have many advantages over its current form.
With a databased ToL, pages can be tailored for different audiences, and flexibility can be given to users in how the data are displayed. We will be able to create several display formats,
10 Towards a global biological information structure
such that educational users could see the ToL displayed with features specific to their needs, or researchers could choose to have their Tree of Life pages displayed with sections specific to their research field. Others will be able to create new display formats as well. We will develop the applications that are used to access the database using the open source model, thereby not only making it possible for others to create modules or accessing the data in the ToL, but encouraging it as well.
Many new features will eventually be possible with the ToL reconstructed as a database. The administration of the ToL will be much more efficient, as we will be able to track the status of pages more effectively; for example, applications associated with the database could easily generate lists of pages completed some time ago, and thus potentially requiring revision. Cataloguing and archiving previous versions of peer-reviewed pages will be easier. A ‘you are here’ view can be created, which shows a bird's eye view of a larger portion of the phylogenetic tree than is evident on a standard page, thus allowing users to get a better sense of their location in the entire Tree of Life. The veracity of any links on a page can automatically be checked, automatic glossary systems can be incorporated, and so on. As a major goal of our data model is to ensure flexibility for future expansion, many other novel elements might eventually be added to the ToL.
Movement of the current data into the new database
As the current data resides in tagged NEXUS files, it will be fairly simple to convert and import the information from those files into the ToL database. MacClade can easily be modified to take each NEXUS file and export the data in a format designed to be easily imported into the database.
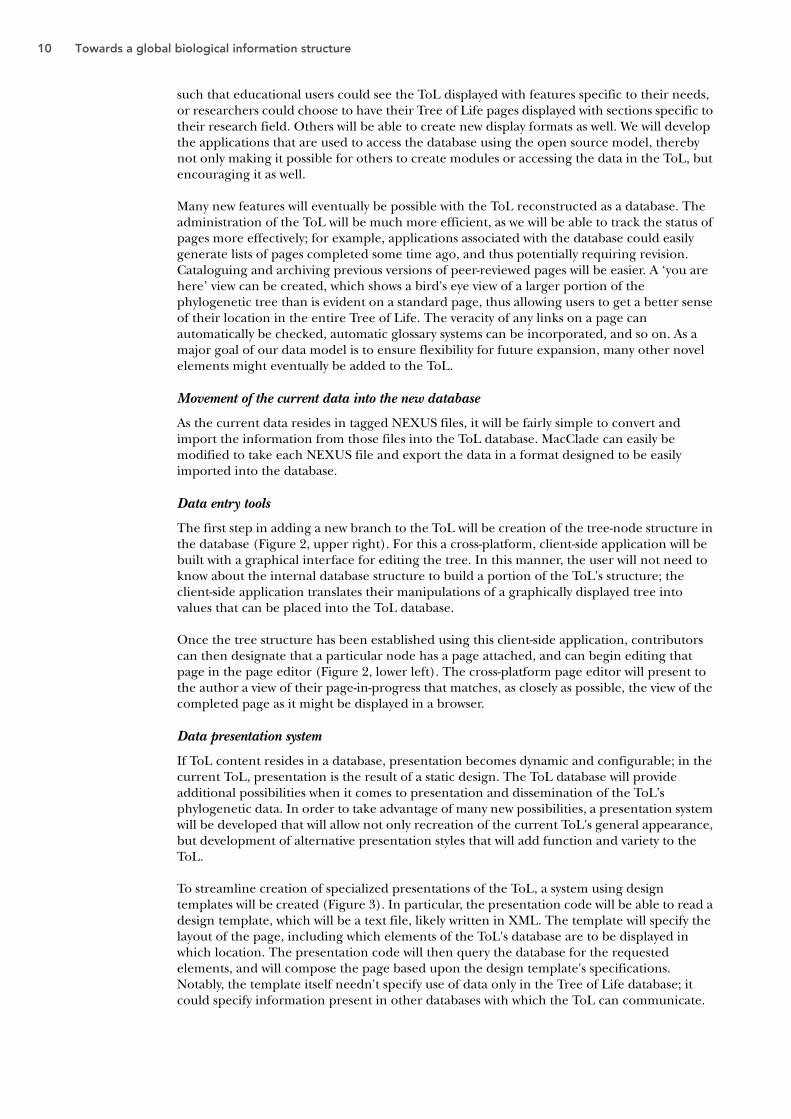
Data entry tools
The first step in adding a new branch to the ToL will be creation of the tree-node structure in the database (Figure 2, upper right). For this a cross-platform, client-side application will be built with a graphical interface for editing the tree. In this manner, the user will not need to know about the internal database structure to build a portion of the ToL's structure; the client-side application translates their manipulations of a graphically displayed tree into values that can be placed into the ToL database.
Once the tree structure has been established using this client-side application, contributors can then designate that a particular node has a page attached, and can begin editing that page in the page editor (Figure 2, lower left). The cross-platform page editor will present to the author a view of their page-in-progress that matches, as closely as possible, the view of the completed page as it might be displayed in a browser.
Data presentation system
If ToL content resides in a database, presentation becomes dynamic and configurable; in the current ToL, presentation is the result of a static design. The ToL database will provide additional possibilities when it comes to presentation and dissemination of the ToL’s phylogenetic data. In order to take advantage of many new possibilities, a presentation system will be developed that will allow not only recreation of the current ToL's general appearance, but development of alternative presentation styles that will add function and variety to the ToL.
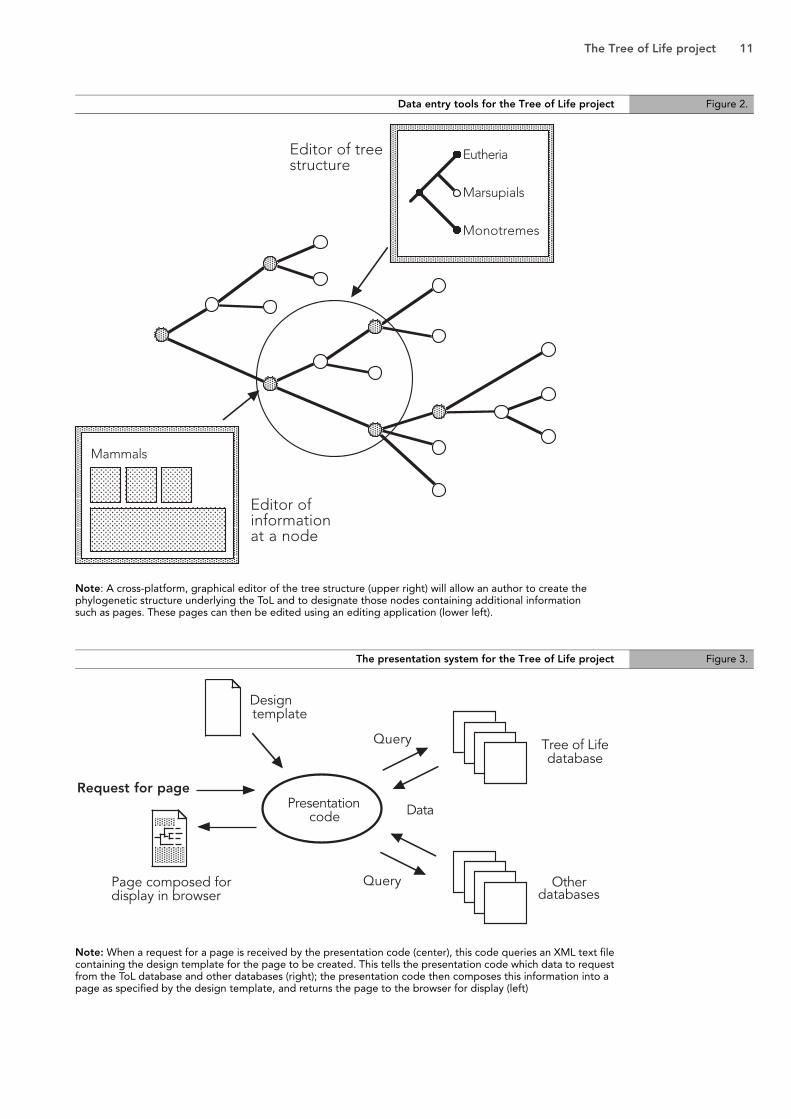
To streamline creation of specialized presentations of the ToL, a system using design templates will be created (Figure 3). In particular, the presentation code will be able to read a design template, which will be a text file, likely written in XML. The template will specify the layout of the page, including which elements of the ToL's database are to be displayed in which location. The presentation code will then query the database for the requested elements, and will compose the page based upon the design template's specifications. Notably, the template itself needn't specify use of data only in the Tree of Life database; it could specify information present in other databases with which the ToL can communicate.
The Tree of Life project 11
Note: A cross-platform, graphical editor of the tree structure (upper right) will allow an author to create thephylogenetic structure underlying the ToL and to designate those nodes containing additional information such as pages. These pages can then be edited using an editing application (lower left).
Note: When a request for a page is received by the presentation code (center), this code queries an XML text filecontaining the design template for the page to be created. This tells the presentation code which data to requestfrom the ToL database and other databases (right); the presentation code then composes this information into apage as specified by the design template, and returns the page to the browser for display (left)
Data entry tools for the Tree of Life project Figure 2.
The presentation system for the Tree of Life project Figure 3.
Eutheria
Marsupials
Monotremes
Editor of tree structure
Editor of information at a node
Mammals
Presentation code
Tree of Life database
Page composed for display in browser
Request for page
Other databases
Data
Query
Query
Design template
12 Towards a global biological information structure
Another foreseeable advantage of the presentation system is that it can eventually be developed to allow for user-specific ToL designs. That is, a particular user could tailor the presentation of the ToL to their own personal preferences, without affecting standard ToL presentation(s). For example, an instructor teaching a high school biology course could modify a template to reflect the needs of the class being taught.
Communication with other databases
The ToL's database will be built to allow communication with other databases through various means (such as SQL commands, XML files, and an API). This will allow the ToL to serve its data (phylogenetic structure, images, introductory text, references, etc.) to other databases. In addition the presentation code to be developed will be designed to communicate with other databases, allowing elements of other databases to be incorporated in ToL pages (with appropriate credit given).
Many elements might be added to ToL pages through communication with other databases. Species distribution maps might be retrieved from another database and included in a ToL page. Lists of GenBank sequences might be displayed on a page. Specification of which elements would be included would be built into the design template used by the presentation system.
The ability of others to pick specific, identified pieces of content out of the ToL provides many possibilities for the use of the ToL’s content. While we can imagine other databases accessing the image database, or the list of references for a group of organisms, or a text description of the characteristics of the group, at its core the ToL's role may be to serve the shape of the phylogenetic tree to other databases. Included with the phylogenetic tree may be information about peer-review, authorship, and so on, which would allow the user to judge the tree within the context of the display presented by the remote database.
While many systems will be able to access the ToL’s content directly by SQL queries into the database, there may be systems that cannot, or circumstances in which accessing the ToL’s data through a live connection is inefficient. To accommodate communication and interoperability with those systems, we will build an XML-based export / import module. This module will export portions of the ToL's content to an XML file, which can then be downloaded via a browser or ftp. Likewise, we will then be able to import XML data files from other projects into the ToL. Addtionally, with the creation of an API into the ToL, other systems will be able to access and use Tree components in an object-oriented manner.
It is likely that communication between the ToL and other databases will need to be routed through a name server that will allow resolution of taxonomic synonyms and homonyms.
Data analysis
The ToL database will not only be able to communicate with other databases and the ToL's presentation system, but its information will be accessible to special-purpose applications, including those that conduct data analysis. For example, one might imagine an application requesting the phylogeny of a large group from the ToL, and then using this tree for a phylogenetic analysis of the evolution of a particular character. Data on the distribution of the character's states might reside locally on the same computer as the application conducting the analysis, or they might be in some other database on the Internet. We plan to modify Mesquite (Maddison and Maddison, 2000b), a cross-platform system for phylogenetic analysis, to be able to access the phylogenetic information contained in the ToL, and others could build analytical applications as well.
Open source and intellectual property rights
There are three primary portions of code created in this project: the database structure, the presentation code, and the data entry tools. These will be treated as open-source (Perens et al., 2000; Raymond, 2000) projects. By providing these as open source, we allow others who are interested to enhance and improve the code.

The Tree of Life project 13
The data themselves will all include the name of the owner of the intellectual property rights, and any database or other presentation engine accessing the data would be required (by the license granting authorized access to the data and the open-source license) to present relevant copyright information, and respect any restrictions. We currently maintain information about copyright owners for all images and text in the project; this information will be transferred into the ToL's new database.
Relationship to other projects
The ToL, at its core, contains information about groups of organisms, and their phylogeny, synthesized and resolved from available data by experts. There are other projects that contain phylogenetic trees contained in the literature (most notably TreeBase, http://herbaria.harvard.edu/treebase/), but the ToL uniquely presents a synthetic review authored by researchers on each taxon.
The purpose of the ToL is not merely to depict the phylogenetic tree, but also to describe the characteristics of groups of organisms, such as their structural features, life history, geographic distribution, and so on. In addition to the summary information provided on the ToL branch pages themselves, we anticipate that the links to information on other web sites will enable the ToL to serve as a phylogenetic organizer for information beyond its own boundaries.
As information contained on branch pages about groups of organisms is the central feature of the Tree of Life project, the status of the project as repository of information about individual species is less clear. There are other projects that contain or will contain information about individual species, such as Species2000 (http://www.sp2000.org/) and INBio (http://www.inbio.ac.cr/), or that coordinate such efforts (GBIF, http://www.gbif.org/). It may be that the ToL plays a prominent role in the storage of species pages, or it may be that increasingly that role will be played by other projects. If the future favors the latter course, the ToL may contain fewer species pages, with many of the species pages served to the ToL by other databases. Wherever species information will be stored, theTree of Life project will continue to serve information about the phylogeny and characteristics of organisms.
Acknowledgments
We are very grateful to the following for their efforts in support of the Tree of Life project. The University of Arizona, especially the Library, College of Agriculture and Life Sciences, and office of the Vice President for Research, provides support and funding. Funds have also been provided by the David and Lucile Packard Foundation Fellowship for Science and Engineering (WPM) and the Research Training Group in the Analysis of Biological Diversification at the University of Arizona. Funds from the National Science Foundation are enabling us to restructure the ToL as a database-driven system.
References
Darwin, C., 1859. The Origin of Species by Means of Natural Selection or The Preservation of Favoured Races in the Struggle for Life. John Murray, London.
Felsenstein, J., 1985. Phylogenies and the comparative method. Am. Nat., 125:1–15.
Harvey, P. H., Pagel, M.D., 1991. The Comparative Method in Evolutionary Biology. Oxford Univ. Press, Oxford.
Maddison, W.P., Maddison, D.R., 1992. MacClade version 3: Analysis of phylogeny and character evolution. Sinauer Associates, Sunderland Massachusetts.

14 Towards a global biological information structure
Maddison, D.R., Maddison, W.P., 2000a. MacClade ToL. 28.7. http://phylogeny.arizona.edu/tree/sep/usingmacclade.html.
Maddison, W.P., Maddison, D.R., 2000b. Mesquite: a modular system for phylogenetic analysis. http://mesquite.biosci.arizona.edu/mesquite/mesquite.html.
Maddison, D.R., Swofford, D.L., Maddison, W.P., 1997. NEXUS: an extendible file format for systematic information. Systematic Biology, 46:590-621.
Martins, E.P., 1996. Phylogenies and the comparative method in animal behavior. Oxford Univ. Press.
Pagel, M., 1999. Inferring the historical patterns of biological evolution. Nature 401(6756): 877-884.
Perens, B., et al. 2000. The open source definition version 1.7. Jan 2000. http://www.opensource.org/osd.html
Raymond, E., 2000. The open source page. Jan 2000. http://www.opensource.org/
Ridley, M., 1983. The Explanation of Organic Diversity. Oxford Univ. Press, Oxford.
Issues of quality control in large, mixed-origin entomological databases 15
Issues of quality control in large, mixed-origin entomological databases
Jorge Soberón (5), Laura Arriaga (5), Liliana Lara (5)
Abstract
This paper analyzes the problems of working with large, mixed-origin taxonomic databases. The analyses were based in an example of a database that included more than 50 000 specimens of Papilionidae and Pieridae butterflies of Mexico, obtained from ca. twenty different museums. The major problems and errors present in this database were classified as errors of structure, consistency, and content. Errors of structure referred to faulty normalization or lack of referential integrity. Lack of consistency referred to contradictions among data fields, while errors of content included mistakes found from mere typos to factual errors like misidentified specimens, faulty taxonomy or imprecise and equivocal georeferencing. Several ways of identifying and correcting errors are presented and discussed.
Keywords: Butterflies, Papilionidae, Pieridae, databases, bioinformatics, quality control.
Introduction
The data contained in the labels of the museums and herbaria of the world is one of the largest repositories of biological information available today. It is estimated that collections worldwide contain in the order of a few billion specimens (Hawksworth et al., 1995). Unfortunately, access to this wealth of information has been severely hindered by the distributed nature of the collections and by lack of efficient methods for information retrieval. However, in recent times an increasing amount of labels in museum’s specimens is being computerized (ICBP, 1992; Scott, Tear and Davies, 1996; Miller, 1994; Soberón, Llorente and Benítez, 1996; Umminger and Young, 1997; Bisby, 2000; Edwards et al., 2000) and often made accessible through the Internet (REMIB, http://www.conabio.gob.mx/remib/remib.html, and Species Analyst, http://habanero.nhm.ukans.edu/TSA/, represent the two best examples of distributed data of museums labels). This opens the door to the creation of databases in the orders of 104 to 106 records that can be used (and are being used) for applications that include basic science, like the study of evolutionary questions (Peterson et al., 1999; Zhong, 1999); management issues, like biodiversity exploration (Jones et al., 1997; Lobo et al., 1997) and the assessment of the potential damage of pests (Sanchez Cordero and Martinez Meyer, 2000) or routes for invasive species (Higgins et al., 1999), to name just a few examples.
Most recently created databases tend to be implemented as a relational model expressed as in entity-relationship diagrams. Many taxonomic databases are composed by from one to 15 or 20 tables (entities), often with several thousand georeferenced localities and from tens of thousands to hundred of thousand of specimens (Pankhurst, 1991). The requirements of the relational model (maintenance of referential integrity and normalization, among other things) are not always followed: by pooling together data that come from a variety of sources, mixed-origin taxonomic databases are created that often degrade the original relational model, if it was present.
Such mixed databases present several challenges in terms of their quality. For example: the degree of taxonomic expertise used in their curation may be variable or the taxonomy may be
(5) Comisión Nacional para el Conocimiento y Uso de la Biodiversidad, (CONABIO)Avenida Liga Periférico - Insurgentes Sur No. 4903, Col. Parques del Pedregal, Delegación Tlalpan. 14010 México, D. F. e-mail:[email protected]

16 Towards a global biological information structure
unstable (McNeill, 1993; Solow et al., 1995) and georeferencing may be imprecise or equivocal (Chapman and Busby, 1994). Data quality control becomes indispensable as an integral part of the compilation and use of such databases (Chapman and Busby, 1994; Soberón and Koleff, 1997).
To establish links and share information among biological databases standards might be required (Williams 1997). Several tools have already been developed to analyze database and to identify errors and inconsistencies in data, using statistical analysis and knowledge-based systems technology (Ricciuti, 1993), but no integrated software has been developed yet to address data quality of taxonomical/biogeographical information. In the present, this task still requires the direct participation of experts, supervising any work that it is done by the computer.
In the past eight years, CONABIO, the Mexican national commission on biodiversity has assembled data (obtained from museums in Mexico and abroad) in about 300 databases, to obtain more than 5 millions of specimen labels in electronic formats (Soberon and Koleff, 1997). This has lead to an acute realization of the importance of quality control for taxonomic databases. In our experience, problems and errors in mixed-origin taxonomic databases can be reduced to a few major categories, like logical structure and scheme encoding, consistency, and content errors. Errors of structure in the relational model, like faulty normalization or lack of referential integrity are discussed in basic books on the relational model for databases (Hogan 1990, Bobak 1997, Date 1997, Celko 1999). Essentially, they refer to poor logical design that often is conducive to commitment of other errors. Bad scheme encoding (Celko 1999) is discussed less often than referential integrity and normalization, but years of experience tells us that encoding schemes that do not allow the growth of the model, include ambiguous fields or lack codes for ‘missing’, ‘unknown’ and ‘not applicable’ states tend to be hard to translate, difficult to interpret and in time become useless.
Consistency means lack of ‘contradictions’ among data fields. Examples of inconsistent data might be specimens of the same genus assigned to two different families, or the geographical coordinates of a locality appearing in a province different from the one in the label. Of course data may be thoroughly consistent and at the same time contain factual errors.
Errors of content mean the existence of mistakes, from mere typos to factual errors like misidentified specimens, faulty taxonomy or sloppy georeferencing. These are the most difficult to detect, and in fact, many of them cannot be identified without an expert actually checking the original data (the specimen or the field books). However, as we shall see, consistency analysis very often leads to spotting factual errors.
In this work we will use an example of a database of about 55 000 records of Papilionidae and Pieridae butterflies of Mexico, obtained from nearly twenty different museums, to explore some of the major problems of such databases and ways of identifying and correcting them. The thesis of the work is that although probably all large, mixed-origin databases are fraught with problems, techniques already exist to deal with some of those problems and to extract useful knowledge from the databases.
Description of the database
Between the years of 1978 and 1995 (Llorente et al., 1997) a compilation was made of the data in about 55 000 specimens in major American and Mexican butterfly collections. This work served to create a database of the Mexican Pierids and Papilionids (sulphur and swallowtail butterflies). The institutions consulted appear in Llorente et al. (1997). This database contains the largest amount of specimen data available in the world for these two families in Mexico, with the exception of the collection at the Instituto de Biología, UNAM, which at that time was not yet computerized. A significant part of the data in the private de la Maza family collection was included using the extensive literature published by the de la Mazas (see Llorente and Luis, 1993 and Llorente et al., 1997 for reviews).

Issues of quality control in large, mixed-origin entomological databases 17
The taxonomy follows Tyler et al. (1994) and Llorente et al. (1997). Different subspecies were regarded as different entities for a total of 176 different subspecies, 70 of the Papilionidae and 106 of the Pieridae. The 55 000 specimens were aggregated into 36,685 registers, that is, groups of specimens with the same name, date, collector and associated georeferenced locality.
Data model of the original database, including 6 unlinked tables and 43 data fields Figure 1.
Data model of the database used by Llorente et al. (1997), including 7 linked tables and 33 data fields Figure 2.

18 Towards a global biological information structure
The original database consisted of a main flat file (39 301 records by 20 data fields), with some auxiliary tables with the names and the coordinates of 2 330 localities and bibliographic and information about collectors and collections. Some of the localities were easily identified and represent well-defined sites (field stations, for example) but others are more subject to interpretation. All localities were georeferenced to the next minute using extensive geographic gazetteers and 1:250 000 charts of Mexico. The process of georeferencing the localities was time consuming and difficult. A report on a previous version of the database, together with a detailed printout of all the geographical information as well as illustrations of each species appear in Llorente et al. (1997).
The original database was created over a period of several years of visiting museums to capture the data in the labels, and often by obtaining printed or electronic catalogues of the collections. Despite this effort the database was not properly modeled and was full of problems due to lack of referential integrity and normalization. The main problems are described below.
Logical structure problems
The original database was not modeled as a relational database. Altogether six unlinked tables or entities with a total of 43 data fields or attributes composed it. Not being relational, the model was not normalized (i.e., there were many types of redundancies in the data, leading to higher chances of introducing errors). These redundancies appeared in the following attributes: number of georeferred records, records associated to localities, collected specimens, records of species and subspecies, collections and collectors. The model also lacked referential integrity. For example, the identity keys for some bibliographic references were empty (Figure 1).
A first attempt to convert the database to a relational model yielded six linked tables, 33 data fields and 36,685 records (Figure 2). This process unveiled the fact that some tables were full of redundancies and that literally hundreds of thousands of fields were empty, since in the original database the bibliographical fields were almost empty. This was due in good part to
Figure 3. Data model of the revised database (RD), including 29 data fields and 20 identification (ID) fields to build the keys and foreign keys in 11 tables
Issues of quality control in large, mixed-origin entomological databases 19
an overenthusiastic design of the first database that left too many fields unpopulated. In this model (Llorente et al. 1997) referential integrity was established.
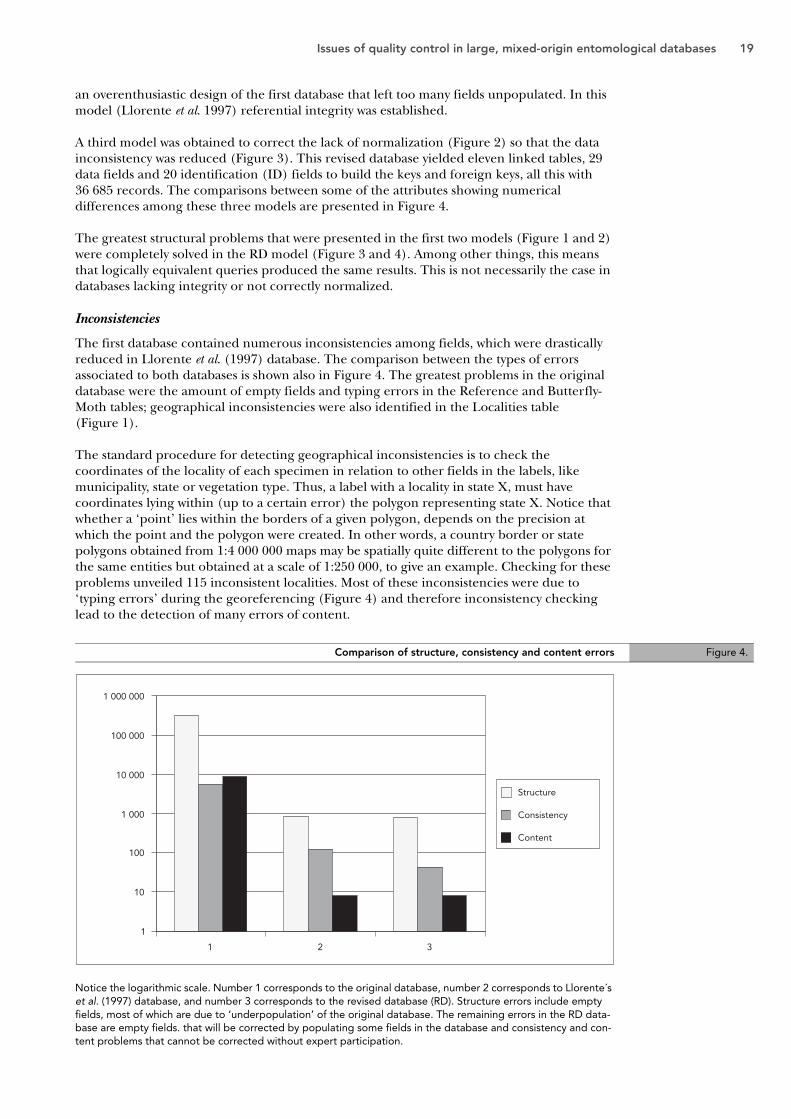
A third model was obtained to correct the lack of normalization (Figure 2) so that the data inconsistency was reduced (Figure 3). This revised database yielded eleven linked tables, 29 data fields and 20 identification (ID) fields to build the keys and foreign keys, all this with 36 685 records. The comparisons between some of the attributes showing numerical differences among these three models are presented in Figure 4.
The greatest structural problems that were presented in the first two models (Figure 1 and 2) were completely solved in the RD model (Figure 3 and 4). Among other things, this means that logically equivalent queries produced the same results. This is not necessarily the case in databases lacking integrity or not correctly normalized.
Inconsistencies
The first database contained numerous inconsistencies among fields, which were drastically reduced in Llorente et al. (1997) database. The comparison between the types of errors associated to both databases is shown also in Figure 4. The greatest problems in the original database were the amount of empty fields and typing errors in the Reference and Butterfly-Moth tables; geographical inconsistencies were also identified in the Localities table (Figure 1).
The standard procedure for detecting geographical inconsistencies is to check the coordinates of the locality of each specimen in relation to other fields in the labels, like municipality, state or vegetation type. Thus, a label with a locality in state X, must have coordinates lying within (up to a certain error) the polygon representing state X. Notice that whether a ‘point’ lies within the borders of a given polygon, depends on the precision at which the point and the polygon were created. In other words, a country border or state polygons obtained from 1:4 000 000 maps may be spatially quite different to the polygons for the same entities but obtained at a scale of 1:250 000, to give an example. Checking for these problems unveiled 115 inconsistent localities. Most of these inconsistencies were due to ‘typing errors’ during the georeferencing (Figure 4) and therefore inconsistency checking lead to the detection of many errors of content.
Notice the logarithmic scale. Number 1 corresponds to the original database, number 2 corresponds to Llorente´s et al. (1997) database, and number 3 corresponds to the revised database (RD). Structure errors include empty fields, most of which are due to ‘underpopulation’ of the original database. The remaining errors in the RD data-base are empty fields. that will be corrected by populating some fields in the database and consistency and con-tent problems that cannot be corrected without expert participation.
Comparison of structure, consistency and content errors Figure 4.
1
10
100
1 000
10 000
100 000
1 000 000
1 2 3
Structure
Consistency
Content

20 Towards a global biological information structure
The original database also presented a high number of records that were ambiguous due to lack of standardization in the names of the states of Mexico (Figure 4). For example, both the states of Chiapas and Chihuahua might be abbreviated to CHI. by different authors. These ambiguities might lead to inconsistencies, if, for example, a set of coordinates for Chiapas, are labeled as inconsistent because they appear outside Chihuahua. These problems were avoided with the normalization.
Problems with content
For this particular database, taxonomical problems were few, since the providers of the database (Llorente et al., 1997) gave special consideration to this issue. The only taxonomy problems we spotted were three species for which subspecies were not determined (Catasticta ochracea ssp., C. teutila ssp1, C. teutila ssp2) and a genus that had no specimens determined to species level (Catasticta sp1).
A necessary requisite to detect certain kinds of errors is to have the taxonomy fields checked against authority dictionaries, which in its simplest form consist of validated orthography for all the names, and may in the other extreme consist of full checklists, with the synonyms labeled as such. Of course, these dictionaries are difficult to obtain and very difficult to maintain updated. An example of a web-based dictionary of names is the ITIS catalogue of the United States, Canada and Mexico Government http://www.itis.usda.gov/itis).
All the taxonomical names in this database were correctly spelled and used and no taxonomic inconsistencies were found.
A difficult content problem is faulty but consistent georeferencing. For certain taxonomic groups (butterflies, cacti, orchids), it is not uncommon to have specimens collected by amateurs and by commercial providers. In certain cases this may lead to specimens being labeled carelessly and in some extreme cases, with false information.
In our example, we spotted 5 examples of such ‘impossible’ localities by visual inspection of the maps displaying the localities of each species. All were cases of species very strictly associated to certain types of vegetation or biogeographic regions, but labeled to localities completely outside their normal ranges. For example, Parides sesostris sestos, which is a strictly tropical rainforest species, had reports by a commercial collector for localities in the pine highlands of the Oaxacan plateau. People experienced in the taxa in question can spot this kind of very unlikely georeferencing. However, there might be many non-obvious georeferencing mistakes that can be very difficult to detect. A tool that may help is bioclimatic modeling. A bioclimatic surface can be generated for each species and outliers may be studied specifically (Chapman and Busby, 1994).
Thousands of other errors were spotted (Figure 4). Most of them are obvious typos that can be corrected by non-experts, like a space character at the beginning of a field, or lack of spacing between words, but others require the participation of the expert for their correction, for example, variations in the name of a collector (R. de la Maza; Roberto de la Maza; de la Maza, R.; R. de la Maza E. and so on). These problems can be spotted but are not corrected, since this is a task for the experts responsible for the database.
Conclusion
The creation of large, mixed-origin databases is becoming very common mainly because: 1) the growing interest of many countries to computerize and repatriate data about specimens collected in their territories (Soberón, Llorente and Benítez, 1996) and, 2) increasing Internet accessibility to museum holdings (Soberón, 1999; Bisby, 2000; Edwards et al., 2000).
Without proper quality control of those mixed-origin databases, their use is fraught with potential mistakes. However, the experience of the Australian Environmental Resources Information Network (ERIN, Chapman and Busby, 1994; Austin, 1998) as well as the Mexican Comisión Nacional de Biodiversidad (CONABIO, Soberón and Koleff, 1997) clearly show

Issues of quality control in large, mixed-origin entomological databases 21
that a very large percentage of such errors can be detected and corrected, and the resulting databases can be used to tackle both basic scientific questions as well as applied ones. In this contribution we discussed some of the most basic categories of problems. These can be disaggregated in a very detailed way, which depends to an extent on the specifics of the data model one is using. The CONABIO data model currently requires 83 different checks in its quality control process.
One of the responsibilities of future data providers, especially if they are going to distribute information using the Web, would be to be very specific about the type of quality control steps the database has undertaken. Without such metadata information, it may be very difficult to assess the quality of a database. Another possibility is the development and widespread use of taxonomic data managers with built-in quality control routines. Such software is becoming increasingly available. Examples are CONABIO´s Biotica® (http://www.conabio.gob.mx/biotica_ingles/acerca_biotica.html) and CSIRO´s Biolink (http://www.ento.csiro.au/biolink/).
The existence of such large amounts of good-quality, on-line data will encourage a multiplicity of users. Many will be taxonomists, biogeographers and ecologists, but probably many more will be NGOs and the general public. This trend should be welcomed, but it also will impose an extra responsibility on the data providers and distributors. Developing tools and procedures to spot and correct problems in the type of data we have discussed here will have to become a priority for the near future.
Acknowledgements
Authors would like to thank Gerardo Rodríguez , Roxana Acosta and Patricia Feria for revising the database according to CONABIO´s standards. Jorge Llorente, Armando Luis, Isabel Vargas and Leonor Oñate were very generous allowing access to different versions of their butterfly database. Raul Jimenez gave us thorough and expert advise on several technical questions related to the structure of the databases. This work was done with the financial support of the National Council for Science and Technology of Mexico (CONACYT), project number DAJ-J002/0728/99.
References
Bisby, F. A. (2000). The Quiet Revolution: Biodiversity Informatics and the Internet. Science 289: 2309-2312
Bobak, A. 1997. Data modeling and design for today´s architectures. Artech House, Boston, MA.
Chapman, A. and J. R. Busby 1994. Linking plant species information to continental biodiversity inventory, climate modeling and environmental monitoring. In R. I. Miller (editor) Mapping the Diversity of Nature. Chapman & Hall, London
Date, C.J. & Darwen, H. 1997. A Guide to the SQL Standard. Fourth Edition. Addison Wesley.
Celko J. 1999. Joe Celko’s data & databases: Concepts in practice. Morgan Kaufmann.
Edwards, J. L., Lane, M. A., Nielsen, E. S. (2000). Interoperability of Biodiversity Databases: Biodiversity Information on Every Desktop. Science 289: 2312-2314
Hawksworth, D. L., B. Aguirre, B. Hudson, B. Barlow, B. Boom, T. Cullen, M. N. Dadd, J. Engels, N. R. Flesness, D. Gordon, J. Hall, J. Hanson, G. Hinkle, P.K. Holmgren, S. Lanou, P. Lasserre, G. Pattison, D. Smith, M. L. Sogin, H. Sugawara, D. Sumithraarachchi & P. Wyse Jackson 1995. The resource base for biodiversity assesments. In: Heywood, V. H. & R. T. Watson (eds.) Global biodiversity assessment. UNEP, Cambridge University Press.
22 Towards a global biological information structure
Hickel, E. R. 1995. ENTOMON: A software for entomological collections. Anais Da Sociedade Entomologica do Brasil. 24(1): 187-188.
Hogan, R. 1990. A practical guide to data base design. Prentice Hall, Englewood Cliffs, NJ.
ICBP (International Council for Bird Preservation). 1992. Putting biodiversity on the map: Priority areas for global conservation. International Council for Bird Preservation, Cambridge, U.K.
Lobo, J.M., Lumaret, J.P. & Jay-Robert, P. 1997. Taxonomic databases as tools in spatial biodiversity research. Annales de la Societé Entomologique de France 33(2): 129-138.
Llorente, J. L., Oñate, A.Luis. & Vargas, I. 1997. Papilionidae y Pieridae de México: Distribución Geográfica e Ilustración. CONABIO and UNAM, México D.F.
Miller, R. 1994. Mapping the diversity of nature. Chapman and Hall, London.
Pankhurst, R. 1991. Practical taxonomy computing. Cambridge University Press, Cambridge.
Ricciuti, M. 1993. How to clean up your dirty data. Datamation. 39: 51-52.
Scott, M., Tear, T. Davies, F. 1996. Gap Analysis. A landscape approach to biodiversity planning. The American Society for Photogrammetry and Remote Sensing, Maryland. 320 pp.
Soberón, J. 1999. Linking biodiversity information sources. Trends in Ecology and Evolution 14(7):291
Soberón, J., Llorente, J. and Benítez, H. 1996. An international view of national biological surveys. Annals of the Missouri Botanical Gardens 83:562-573.
Soberón, J. and Koleff, P. 1997. The national biodiversity information system of Mexico. In Raven, P. (editor) Nature and human society. The quest for a sustainable world. NSRC., Washington, D.C.
Tyler, H., Brown, K.S., Jr. &Wilson, K. 1994. Swallowtail Butterflies of the Americas. A study in biological dynamics, ecological diversity, biosystematics, and conservation. Gainesville, Scientific Publishers.
Umminger, B. Young, S. 1997. Information management for biodiversity: A proposed U.S. National Biodiversity Information Center. In: Reaka-Kudla, M., Wilson, E. & Wilson, E.O. (eds.) Biodiversity II. Understanding and protecting our biological resources. Joseph Henry Press, Washington D. C.
Williams, N. 1997. How to get databases talking the same language. Science. 275: 301-302.
Zhong Y., Luo, Y., Pramanik, S. & Beaman, J.H. 1999. HICLAS: A taxonomic database system for displaying and comparing biological classification and phylogenetic trees. Bioinformatics 15(2): 149-156.
Interactive identification using the Internet 23
Interactive identification using the Internet
M. J. Dallwitz (6), T. A. Paine (6), E. J. Zurcher (6)
Abstract
Computer-based interactive keys have several advantages over conventional keys: characters can be used, and their values changed, in any order; a correct identification can be made in spite of errors by the user or in the data; errors which were circumvented by the error-tolerance mechanism can be located; the user can express uncertainty by entering more than one state value, or a range of numerical values; numeric characters can be used directly, without being divided into ranges. Other features important for efficient and reliable identification include: advice on the most suitable characters to use at any stage of an identification; notes on the interpretation of characters; illustrations of characters and taxa; finding the differences and similarities between taxa; finding diagnostic descriptions. Interactive identification can be made available over the Internet in the following ways:
1. A stand-alone program.2. A program (Java or JavaScript) running in a Web browser.3. Cooperating programs running in a Web browser and server.4. A program running on a Web server, and generating HTML pages.
Programs of type 1 must first be installed, and most are available for only one operating system (usually MS-Windows). Programs of types 1 and 2 download the data matrix at the start of a session. The user cannot proceed until the downloading is completed, but afterwards response is fast, and there is no further load on the network and server, except when subsidiary files, such as images, are required. The programs can also be used off line. In programs of types 3 and 4, the data matrix is not downloaded. Each operation requires an Internet transaction, so responses tend to be slow, and a continuing load is placed on the network and server. The programs cannot be used off line. In programs of type 4, the user interface is familiar to Web users, but may become cumbersome for some operations, particularly with large data sets. Programs of types 2–4 are potentially independent of the user’s operating system and browser, but in practice there may be problems. Currently available programs of types 2–4 lack many of the features required for efficient and reliable identification.
Keywords: DELTA, Intkey, keys, interactive, identification, Internet.
Introduction
Identification is the process of finding the taxon to which a specimen belongs. Several methods are available for aiding this process (e.g. Pankhurst 1991). The most important are conventional identification keys and interactive keys.
A conventional identification key is a tree with characters at the internal nodes and taxon names at the terminal nodes. Each branch corresponds to a state of the character or characters at the node from which it arises. The user starts at the root of the tree, and follows the branches corresponding to the character states exhibited by the specimen until the taxon name is reached.
Authors of conventional keys try to provide some flexibility for the user by placing alternative characters at each node, but the possibilities for doing this are limited, because the characters must have identical distributions of their states among the taxa remaining in contention at that node. An error by the user in assigning a character state to the specimen inevitably leads
(6) CSIRO Entomology, GPO Box 1700, Canberra ACT 2601, Australia. Email: [email protected]

24 Towards a global biological information structure
to a wrong identification, unless the author has allowed for the possibility of this error by placing the taxon name in the subtree corresponding to the wrongly assigned state, as well as in the subtrees corresponding to states actually exhibited by the taxon. The author’s use of this mechanism must also be limited, because each possible error (taxon/character-state combination) treated in this way adds a terminal node to the tree. This increases the size of the printed key (proportional to the number of terminal nodes), and the average number of characters which must be used to obtain an identification (proportional to the logarithm of the number of terminal nodes).
After any identification, it is good practice to check its accuracy by comparing the specimen with a description or illustrations of the taxon, or with other specimens known to belong to the taxon. When a conventional key is being used, the only way to recover from a wrong identification due to an error by the user is to guess where the error was made, return to that node, and try following another branch. If the error is in the key itself (that is, an error was made by the author), recovery is not possible.
An interactive key is an interactive computer program in which the user enters attributes (character-state values) of the specimen. The program eliminates taxa whose attributes do not match those of the specimen. This process is continued until only one taxon remains. The taxon attributes are usually stored as a characters-by-taxa ‘matrix’. It is also possible to store the attributes as ‘rules’, but this kind of program is generally less satisfactory (Dallwitz 1992).
Dallwitz et al. (2000) give a comprehensive discussion of the principles of interactive keys. Dallwitz (1996) gives a list of available interactive-key programs, and contact information for them, and Dallwitz (2000) gives a detailed comparison of several of these programs.
We will use the program Intkey (Dallwitz et al. 1993, 1995) to exemplify some of the features of interactive keys.
Advantages over conventional keys
A well designed interactive key has several advantages over a conventional key.
Unrestricted character use. Any characters can be used, in any order. Characters which are not available on the specimen, or whose interpretation is not clear to the user, can be avoided (provided that there is sufficient redundancy in the data).
Character deletion and changing. The values of any character can be changed at any stage of the identification, or any character deleted from the identification.
Error tolerance. A correct identification can be made in spite of errors by the user or in the data. Taxa are normally eliminated when they differ from the specimen in any way. If it is known or suspected that an error has been made, the program can be instructed to eliminate taxa only if they differ from the specimen in more than one attribute. It is immaterial where the error occurred, and whether it was made by the user or by the author of the data.
In Intkey, this function is controlled by the ‘Tolerance’ parameter, whose value may be 0 or any positive integer. Taxa are eliminated if they differ from the specimen in more attributes than the current value of ‘Tolerance’. The parameter may be set to any permitted value at any time in the identification process, but typically it would be incremented by 1 when an identification has been made and found to be incorrect. The identification process is then continued, exactly as before. If all the taxa are eliminated, the program can increment ‘Tolerance’ automatically. If a single taxon remains, the program has no way of knowing whether this is the correct identification, and it is up to the user to check the identification, and, if necessary, increment ‘Tolerance’ manually.
Locating errors. The program should be able to locate user and/or data errors which were circumvented by the error-tolerance mechanism. The identification of user errors helps to
Interactive identification using the Internet 25
improve the user’s interpretation of characters. Data errors can be reported to the author for correction in later versions.
In Intkey, errors can be located by using the ‘Differences’ command to display the differences between the specimen and the remaining taxon.
Expressing uncertainty. The user can express uncertainty by entering more than one state value, or a range of numerical values. A user who is not sure which character-state value applies to the specimen may nevertheless sometimes be confident that some state values do not apply. Entering all the values which may conceivably apply to the specimen eliminates those taxa which never exhibit any of those values.
Numeric characters. Numeric characters can be used directly, without being divided into ranges. In conventional keys, numeric characters such as lengths must be divided into ranges before being incorporated in the key, that is, they are expressed as multistate characters. This usually results in loss of information. In an interactive key, the actual range of values exhibited by each taxon can be recorded in the data, and the taxon eliminated if the specimen’s value does not fall within this range.
Easy updating. The key is maintained simply by making corrections and additions to the data matrix. Updating of conventional keys is relatively difficult. Even when the key is generated by computer from a data matrix, major changes to the matrix, particularly the addition of new characters and taxa, can have a large effect on the key structure, which has to be checked and possibly re-optimized.
Important features for interactive keys
Interactive keys require other features for efficient and reliable identification. A few of the most important are described here; see Dallwitz et al. (2000) for a comprehensive list.
Advice on the most suitable characters to use at any stage of an identification. The program should be able to advise the user on the most suitable characters for use at any stage of an identification. Because of the very large number of paths which may be taken through an interactive key, the ranking of the characters should be calculated directly from the data matrix for the set of taxa actually remaining at each stage of the identification. It is unsatisfactory to pre-assign rankings for a relatively small number of cases, as, for example, in a rule-based expert system.
The character-ranking algorithm used in Intkey is the same as that used in the key-generation program, Key (Dallwitz 1974). Unlike most such algorithms, it has a theoretical basis and gives sensible results for characters with three or more states, and for numeric characters. The relative weight of the separating power and the ‘reliability’ of the character (a subjective measure, usually supplied by the author, of the character’s accuracy and/or ease of use) can be controlled by both the author and the user.
Ranking of the characters can take a considerable time in large data sets, so it is important that the computation is as efficient as possible, and that the user does not have to wait for the ranking to be completed before choosing a character.
‘Best’ algorithms should be able to handle numeric characters, as these often have high separating power. For example, the data set ‘Festuca of North America’ (Aiken et al. 1996) has 29 numeric characters and 67 multistate characters. When Intkey ranks these characters by their separating power, the top 17 characters are numeric. A similar tendency is shown in ‘The Families of Flowering Plants’ (Watson and Dallwitz 1992), which has 39 numeric characters and 459 multistate characters (excluding ‘characters’ used to define the classification). When the characters are ranked by separating power, 4 of the top 5, and 14 of the top 30, are numeric.
The high separating power of numeric characters is surprising to most taxonomists, as numeric characters are generally not very useful in conventional keys. There are two reasons

26 Towards a global biological information structure
for this. (1) Conventional keys must use multistate characters for numeric data, and this causes a loss of separating power. (2) Numeric characters often show a large amount of overlap between taxa; in conventional keys, this results in multiple occurrences of taxa, and an increase in the printed length of the key. Neither of these factors apply to interactive keys.
Notes on the interpretation of characters. Extensive text to aid interpretation of characters should be conveniently available.
Illustrations of characters. Illustrations to aid interpretation of characters should be conveniently available. State selection, and changing of the selections, should be possible from the illustration screens (that is, it should not be necessary to return to a text-based screen for these operations). There should be no restrictions on the number of illustrations for each character and/or character state.
Illustrations of taxa. Taxon illustrations are useful for confirming identifications. Display of these illustrations should be flexible: there should be no limits on the number of illustrations of a taxon, the illustrations should be selectable by subject (e.g. habit, habitat, flowers, fruits, distribution map), and it should be possible to display illustrations of different taxa simultaneously.
Finding the differences and similarities between taxa. The program should be able to find the differences between members of a set of taxa, in terms of a selected set of characters. There should be no restrictions on the size of the set of taxa.
Finding diagnostic descriptions. The program should be able to find diagnostic descriptions, which distinguish a given taxon from all the other taxa. These provide a quick way of confirming the identity of a specimen. The characters should be chosen from those which have not been used in the current identification, in order to provide an independent confirmation.
Intkey has a parameter, ‘DiagLevel’, which specifies the minimum number of characters for which the diagnostic description should differ from all the other taxa. Another parameter, ‘DiagType’, distinguishes between specimen-diagnostic and taxon-diagnostic descriptions. The latter are allowed to contain characters which may sometimes be inapplicable to specimens belonging to the taxon.
Interactive identification over the Internet
Interactive identification can be made available over the Internet in several ways, which differ in whether the processing is done on a Web server or the user’s machine, and in the method of loading and running the software on the user’s machine. Each method has advantages and disadvantages, particularly in the times taken for various operations. The times given below are for a 133MHz Pentium, with an Internet connection running at about 15Kbytes per second.
A stand-alone program
Programs of this type must be downloaded and installed before their first use. This process usually takes a few minutes, depending on the size of the program and the speed of the Internet connection. Most are available for only one operating system (usually MS-Windows). The programs download the data matrix at the start of a session. The user cannot proceed until the downloading is completed, but afterwards response is fast, and there is no further load on the network and server, except when subsidiary files, such as images, are required. (The images can be downloaded with the data matrix (e.g. Dallwitz et al. 1997), but this would usually make the downloading time prohibitively large). The user interface can be compact and simple, and can utilize the full capabilities of the operating system. The programs can (potentially) be set up as ‘helper applications’, so that they can automatically run a specified data set by clicking on a link in a Web page. They can also be used off line. Powerful programs are already available.
Interactive identification using the Internet 27
Examples of this type of program are:
Intkey http://biodiversity.uno.edu/delta/LucID http://www.lucidcentral.com/
Intkey is free for non-commercial use and is available at the above URL by following the links ‘Programs and documentation > Intkey’. A complete, annotated example of an identification using Intkey is also available by following the links ‘Overview of the DELTA System > An Intkey example: identification’.
The full version of LucID is commercial, but there is a free version with some of the features disabled. Both versions lack many features important for efficient, accurate identification (see Dallwitz 2000).
The Intkey installation file is about 2.1MB in size. It takes about 150 seconds to download, and a further 60 seconds to install. The installed files occupy about 2.3MB (not counting the installation file, which can be deleted after installation), and are placed entirely in a separate directory — no files are added or overwritten in the Windows directories.
The Web site also has links to many Intkey data sets. One of these, ‘The Families of Flowering Plants’ (Watson and Dallwitz 1992), was used for timing tests. It contains 582 characters and 585 taxa. When running the data from the Internet, program startup and downloading of the data took 50 seconds. Thereafter the program works entirely locally, except for downloading images and description files when required (descriptions can also be generated from the data without reference to external files). Simple operations such as using a character in an identification take less than 0.5 seconds. When calculating the ‘Best’ characters for an identification, the characters found so far are displayed after 2 seconds, and the rest after the calculation is complete. The characters are examined in descending order of character reliability, so a suitable character is almost always available within the first 2 seconds. About 320 characters were processed in this initial period.
The following Intkey sample screens were taken from ‘Elateriformia of the World’, also available at the above site.
Figure 1 shows the main screen, part way through an identification. Two characters have been used, reducing the number of possible taxa from 167 to 14. The characters that can separate the remaining taxa have been automatically displayed in the ‘Best Characters’ pane, ranked as described above. One of these is about to be selected.
Intkey main screen Figure 1.
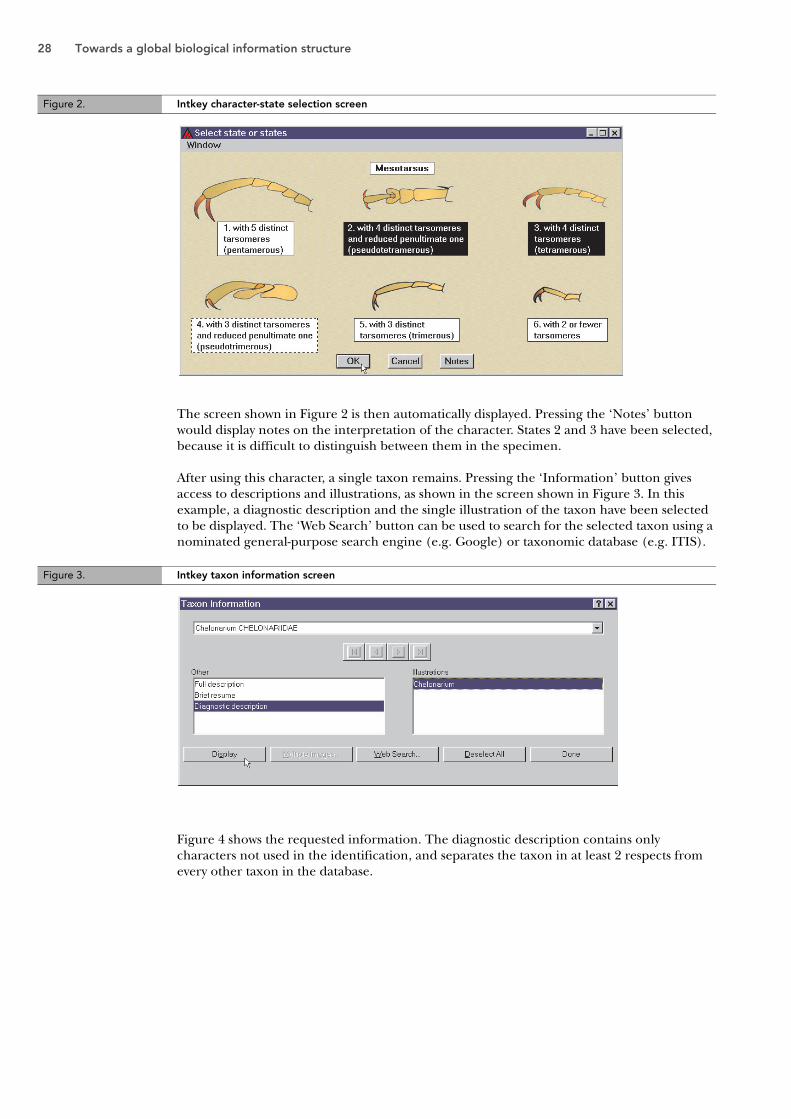
28 Towards a global biological information structure
The screen shown in Figure 2 is then automatically displayed. Pressing the ‘Notes’ button would display notes on the interpretation of the character. States 2 and 3 have been selected, because it is difficult to distinguish between them in the specimen.
After using this character, a single taxon remains. Pressing the ‘Information’ button gives access to descriptions and illustrations, as shown in the screen shown in Figure 3. In this example, a diagnostic description and the single illustration of the taxon have been selected to be displayed. The ‘Web Search’ button can be used to search for the selected taxon using a nominated general-purpose search engine (e.g. Google) or taxonomic database (e.g. ITIS).
Figure 4 shows the requested information. The diagnostic description contains only characters not used in the identification, and separates the taxon in at least 2 respects from every other taxon in the database.
Figure 2. Intkey character-state selection screen
Figure 3. Intkey taxon information screen
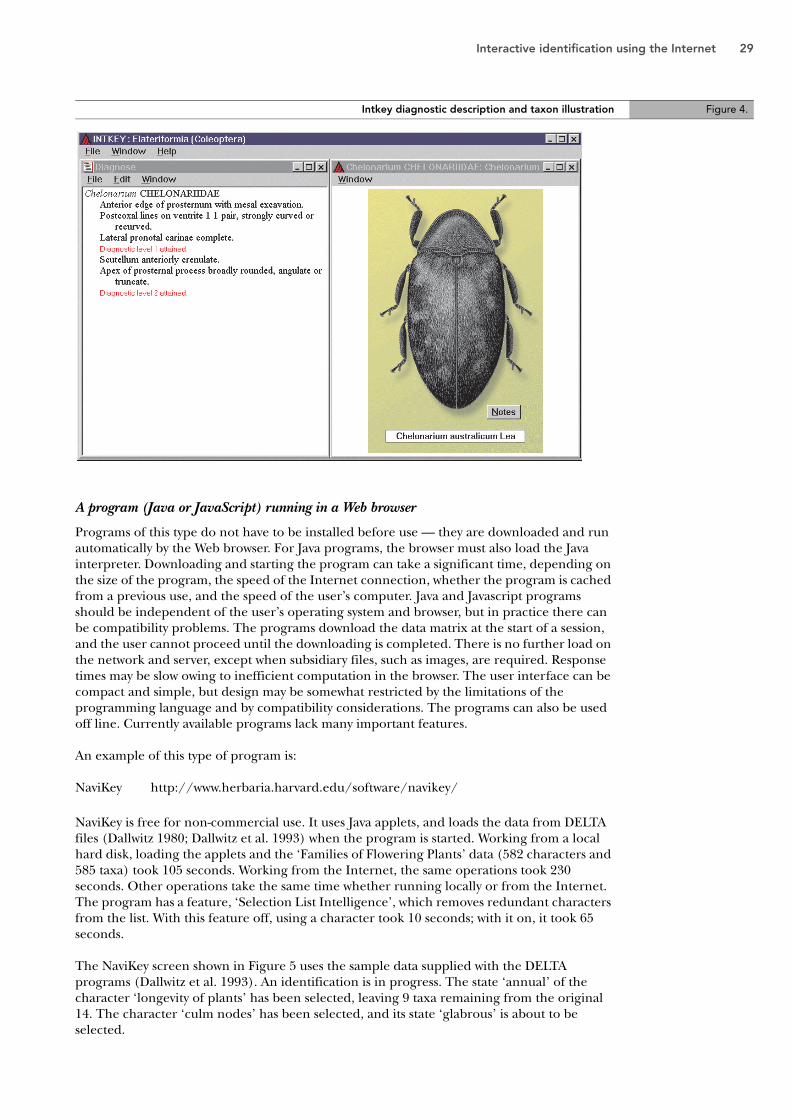
Interactive identification using the Internet 29
A program (Java or JavaScript) running in a Web browser
Programs of this type do not have to be installed before use — they are downloaded and run automatically by the Web browser. For Java programs, the browser must also load the Java interpreter. Downloading and starting the program can take a significant time, depending on the size of the program, the speed of the Internet connection, whether the program is cached from a previous use, and the speed of the user’s computer. Java and Javascript programs should be independent of the user’s operating system and browser, but in practice there can be compatibility problems. The programs download the data matrix at the start of a session, and the user cannot proceed until the downloading is completed. There is no further load on the network and server, except when subsidiary files, such as images, are required. Response times may be slow owing to inefficient computation in the browser. The user interface can be compact and simple, but design may be somewhat restricted by the limitations of the programming language and by compatibility considerations. The programs can also be used off line. Currently available programs lack many important features.
An example of this type of program is:
NaviKey http://www.herbaria.harvard.edu/software/navikey/
NaviKey is free for non-commercial use. It uses Java applets, and loads the data from DELTA files (Dallwitz 1980; Dallwitz et al. 1993) when the program is started. Working from a local hard disk, loading the applets and the ‘Families of Flowering Plants’ data (582 characters and 585 taxa) took 105 seconds. Working from the Internet, the same operations took 230 seconds. Other operations take the same time whether running locally or from the Internet. The program has a feature, ‘Selection List Intelligence’, which removes redundant characters from the list. With this feature off, using a character took 10 seconds; with it on, it took 65 seconds.
The NaviKey screen shown in Figure 5 uses the sample data supplied with the DELTA programs (Dallwitz et al. 1993). An identification is in progress. The state ‘annual’ of the character ‘longevity of plants’ has been selected, leaving 9 taxa remaining from the original 14. The character ‘culm nodes’ has been selected, and its state ‘glabrous’ is about to be selected.
Intkey diagnostic description and taxon illustration Figure 4.
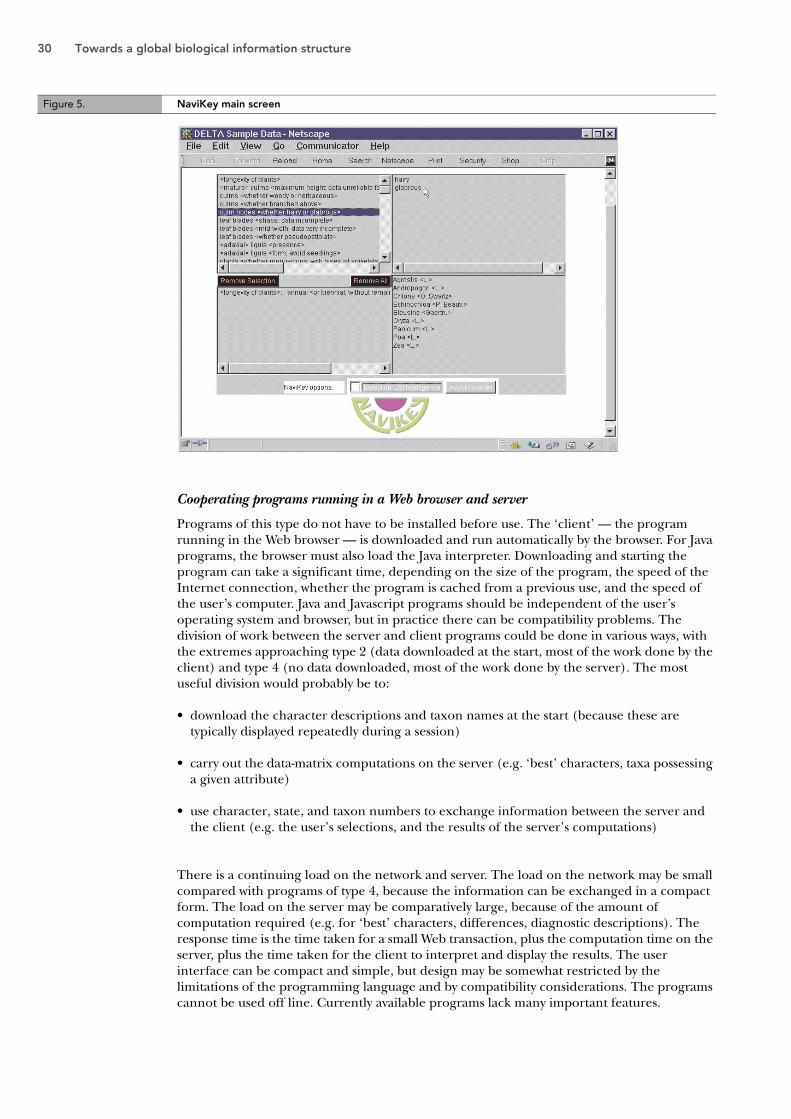
30 Towards a global biological information structure
Cooperating programs running in a Web browser and server
Programs of this type do not have to be installed before use. The ‘client’ — the program running in the Web browser — is downloaded and run automatically by the browser. For Java programs, the browser must also load the Java interpreter. Downloading and starting the program can take a significant time, depending on the size of the program, the speed of the Internet connection, whether the program is cached from a previous use, and the speed of the user’s computer. Java and Javascript programs should be independent of the user’s operating system and browser, but in practice there can be compatibility problems. The division of work between the server and client programs could be done in various ways, with the extremes approaching type 2 (data downloaded at the start, most of the work done by the client) and type 4 (no data downloaded, most of the work done by the server). The most useful division would probably be to:
• download the character descriptions and taxon names at the start (because these are typically displayed repeatedly during a session)
• carry out the data-matrix computations on the server (e.g. ‘best’ characters, taxa possessing a given attribute)
• use character, state, and taxon numbers to exchange information between the server and the client (e.g. the user’s selections, and the results of the server’s computations)
There is a continuing load on the network and server. The load on the network may be small compared with programs of type 4, because the information can be exchanged in a compact form. The load on the server may be comparatively large, because of the amount of computation required (e.g. for ‘best’ characters, differences, diagnostic descriptions). The response time is the time taken for a small Web transaction, plus the computation time on the server, plus the time taken for the client to interpret and display the results. The user interface can be compact and simple, but design may be somewhat restricted by the limitations of the programming language and by compatibility considerations. The programs cannot be used off line. Currently available programs lack many important features.
Figure 5. NaviKey main screen

Interactive identification using the Internet 31
Examples of this type of program are:
FloraSearch http://www.reticule.co.uk/flora/index.htmlNaviKey (client-server version) http://www.herbaria.harvard.edu/software/navikey/
All are free for non-commercial use. No tests have been carried out on these programs.
A program running on a Web server, and generating HTML pages
Programs of this type do not have to be installed before use, as they reside entirely in the server. The Web browser handles only standard HTML pages generated by the server. Typically, many of the HTML pages contain the whole character list or a substantial part of it, which may have to be downloaded afresh after a transaction. There is therefore a continuing heavy load on the network and server. Response times may be slow because of the amount of information downloaded at each transaction, and because of slow computation in the server if it is also carrying out tasks for other users. The user interface tends to be cumbersome, because of the limitations of HTML. The programs cannot be used off line. Currently available programs lack many important features.
Examples of this type of program are:
DAP (Delta Access Perl) http://www.axel-findling.de/programs/dap/DAWI (Delta Access Web Interface) http://www.axel-findling.de/programs/dawi/PollyClave http://prod.library.utoronto.ca/polyclave/index.html
All are free for non-commercial use. There are examples of keys using DAP and DAWI at http://www.mycology.net/lias/index.cfm, and examples of keys using PollyClave at above site.
Only small PollyClave data sets are available on the Internet. The response times for these are typical of small Web transactions — about 2–4 seconds. With a data matrix of about 500 characters and 500 taxa, I estimate that loading the character list would take about 20 seconds. This operation may be required at each cycle of the identification, but the browser’s ‘back’ button can be used in some circumstances (even that would take 8 seconds). In each cycle, states may be selected from 1 or more characters, though using several characters without the guidance of ‘Best’ will increase the chance of errors. After states have been selected, it would take about 7 seconds for the program to respond with the list of remaining taxa.
PollyClave main screen Figure 6.
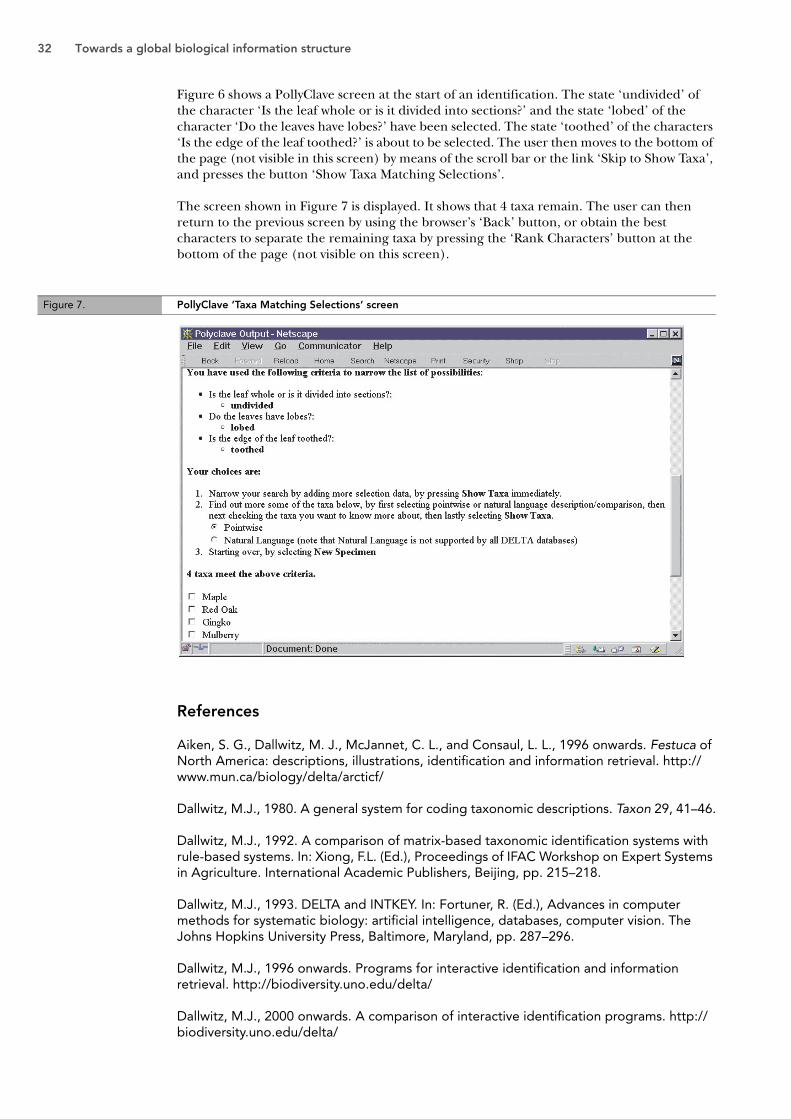
32 Towards a global biological information structure
Figure 6 shows a PollyClave screen at the start of an identification. The state ‘undivided’ of the character ‘Is the leaf whole or is it divided into sections?’ and the state ‘lobed’ of the character ‘Do the leaves have lobes?’ have been selected. The state ‘toothed’ of the characters ‘Is the edge of the leaf toothed?’ is about to be selected. The user then moves to the bottom of the page (not visible in this screen) by means of the scroll bar or the link ‘Skip to Show Taxa’, and presses the button ‘Show Taxa Matching Selections’.
The screen shown in Figure 7 is displayed. It shows that 4 taxa remain. The user can then return to the previous screen by using the browser’s ‘Back’ button, or obtain the best characters to separate the remaining taxa by pressing the ‘Rank Characters’ button at the bottom of the page (not visible on this screen).
References
Aiken, S. G., Dallwitz, M. J., McJannet, C. L., and Consaul, L. L., 1996 onwards. Festuca of North America: descriptions, illustrations, identification and information retrieval. http://www.mun.ca/biology/delta/arcticf/
Dallwitz, M.J., 1980. A general system for coding taxonomic descriptions. Taxon 29, 41–46.
Dallwitz, M.J., 1992. A comparison of matrix-based taxonomic identification systems with rule-based systems. In: Xiong, F.L. (Ed.), Proceedings of IFAC Workshop on Expert Systems in Agriculture. International Academic Publishers, Beijing, pp. 215–218.
Dallwitz, M.J., 1993. DELTA and INTKEY. In: Fortuner, R. (Ed.), Advances in computer methods for systematic biology: artificial intelligence, databases, computer vision. The Johns Hopkins University Press, Baltimore, Maryland, pp. 287–296.
Dallwitz, M.J., 1996 onwards. Programs for interactive identification and information retrieval. http://biodiversity.uno.edu/delta/
Dallwitz, M.J., 2000 onwards. A comparison of interactive identification programs. http://biodiversity.uno.edu/delta/
Figure 7. PollyClave ‘Taxa Matching Selections’ screen

Interactive identification using the Internet 33
Dallwitz, M.J., Paine, T.A., Zurcher, E.J., 1993 onwards. User’s guide to the DELTA system: a general system for processing taxonomic descriptions. http://biodiversity.uno.edu /delta/
Dallwitz, M.J., Paine, T.A., and Zurcher, E.J. (1995 onwards). User’s guide to Intkey: a program for interactive identification and information retrieval. 1st edition. http://biodiversity.uno.edu/delta/
Dallwitz, M. J., Paine, T. A. and Zurcher, E. J., 1997 onwards. Butterflies and moths: demonstration data for the interactive identification program Intkey. http://biodiversity.uno.edu/delta/.
Dallwitz, M.J., Paine, T.A., Zurcher, E.J., 2000 onwards. Principles of interactive keys. http://biodiversity.uno.edu/delta/
Pankhurst, R.J., 1991. Practical Taxonomic Computing. Cambridge University Press, Cambridge.
Watson, L., and Dallwitz, M.J., 1992 onwards. The families of flowering plants: descriptions, illustrations, identification, and information retrieval. http://biodiversity.uno.edu/delta/