
Toward understanding the physical link between … understanding the physical link between turbines...
23
Toward understanding the physical link between turbines and microclimate impacts from in situ measurements in a large wind farm Daniel A. Rajewski 1 , Eugene S. Takle 1 , John H. Prueger 2 , and Russell K. Doorenbos 1 1 Department of Agronomy, Iowa State University, Ames, Iowa, USA, 2 National Laboratory for Agriculture and the Environment, Ames, Iowa, USA Abstract Recent wind farm studies have revealed elevated nighttime surface temperatures but have not validated physical mechanisms that create the observed effects. We report measurements of concurrent differences in surface wind speed, temperature, fluxes, and turbulence upwind and downwind of two turbine lines at the windward edge of a utility-scale wind farm. On the basis of these measurements, we offer a conceptual model based on physical mechanisms of how wind farms affect their own microclimate. Periods of documented curtailment and zero-power production of the wind farm offer useful opportunities to rigorously evaluate the microclimate impact of both stationary and operating turbines. During an 80 min nighttime wind farm curtailment, we measured abrupt and large changes in turbulent fluxes of momentum and heat leeward of the turbines. At night, wind speed decreases in the near wake when turbines are off but abruptly increases when turbine operation is resumed. Our measurements are compared with Moderate Resolution Imaging Spectroradiometer Terra and Aqua satellite measurements reporting wind farms to have higher nighttime surface temperatures. We demonstrate that turbine wakes modify surface fluxes continuously through the night, with similar magnitudes during the Terra and Aqua transit periods. Cooling occurs in the near wake and warming in the far wake when turbines are on, but cooling is negligible when turbines are off. Wind speed and surface stratification have a regulating effect of enhancing or decreasing the impact on surface microclimate due to turbine wake effects. 1. Introduction An increasing number of studies suggest that wind farms, like urban areas, surrounded by homogenous land- scapes have elevated nighttime surface temperatures. Urban areas have internal sources of heat and surface conditions that absorb and retain more heat than surrounding areas. But since turbines do not add/remove sensible or latent heat, nor do they change heat-absorbing or heat-retaining characteristics of the landscape, why should wind farms have higher near-surface air temperatures? Previous reports of elevated nighttime temperatures due to wind farms have not focused on physical mechanisms that create these observed noc- turnal warm regions associated. We provide measurements and offer a conceptual model based on physical principles to explain how wind farms affect surface temperatures. In the U.S. Midwest, large wind plants cover several thousand acres of cropland, but it is unclear whether tur- bines influence these agricultural ecosystems [LeBeau et al., 2014; Winder et al., 2014]. Unlike from offshore wind plants [Barthelmie et al., 2005, 2007, 2009; Hansen et al., 2012], few field experiments have measured wind turbine flow fields or wake conditions from land-based wind plants [Rajewski et al., 2013; Smith et al., 2013]. Numerical simulations [Baidya Roy, 2004, 2011; Adams and Keith, 2007; Cervarich et al., 2013; Fitch et al., 2013] and satellite-derived analyses [Walsh-Thomas et al., 2012; Zhou et al., 2012a, 2013] report a com- bination of surface warming and drying within wind plants and several kilometers downwind. Moderate Resolution Imaging Spectroradiometer (MODIS) satellite analyses [Zhou et al., 2012a, 2012b, 2013; Harris et al., 2014; Slawsky et al., 2015; Xia et al., 2015] also indicate a stronger warming at the time of the MODIS Terra overpass in the premidnight hours than during the overpass of the MODIS Aqua satellite in the postmidnight hours. The intensity of warming among studies depended on location, with lower values (0.3–0.6 K) for wind farms within agricultural crop landscapes in Iowa and Northern Illinois [Harris et al., 2014; Slawsky et al., 2015] and higher warming on rangeland (0.75–1.5 K) within wind farms in western Texas [Zhou et al., 2012a, 2012b, 2013; Xia et al., 2015]. Mechanisms causing nighttime warming have been proposed but not confirmed by RAJEWSKI ET AL. MICROCLIMATE WITH TURBINES ON VERSUS OFF 13,392 PUBLICATION S Journal of Geophysical Research: Atmospheres RESEARCH ARTICLE 10.1002/2016JD025297 Key Points: • Nighttime fluxes and wind speed increase when turbines are on and wind speed decreases for turbines off • No distinction of stronger warming between nighttime Terra and Aqua satellite overpass periods • Nighttime fluxes simultaneously revert to ambient levels during an 80 min shutdown of the wind farm Correspondence to: D. A. Rajewski, [email protected] Citation: Rajewski, D. A., E. S. Takle, J. H. Prueger, and R. K. Doorenbos (2016), Toward understanding the physical link between turbines and microclimate impacts from in situ measurements in a large wind farm, J. Geophys. Res. Atmos., 121, 13,392–13,414, doi:10.1002/ 2016JD025297. Received 29 APR 2016 Accepted 2 NOV 2016 Accepted article online 7 NOV 2016 Published online 26 NOV 2016 ©2016. The Authors. This is an open access article under the terms of the Creative Commons Attribution-NonCommercial-NoDerivs License, which permits use and distri- bution in any medium, provided the original work is properly cited, the use is non-commercial and no modifications or adaptations are made.
Transcript of Toward understanding the physical link between … understanding the physical link between turbines...

Toward understanding the physical link between turbinesand microclimate impacts from in situ measurementsin a large wind farmDaniel A. Rajewski1, Eugene S. Takle1, John H. Prueger2, and Russell K. Doorenbos1
1Department of Agronomy, Iowa State University, Ames, Iowa, USA, 2National Laboratory for Agriculture and theEnvironment, Ames, Iowa, USA
Abstract Recent wind farm studies have revealed elevated nighttime surface temperatures but have notvalidated physical mechanisms that create the observed effects. We report measurements of concurrentdifferences in surface wind speed, temperature, fluxes, and turbulence upwind and downwind of two turbinelines at the windward edge of a utility-scale wind farm. On the basis of these measurements, we offer aconceptual model based on physical mechanisms of how wind farms affect their own microclimate. Periodsof documented curtailment and zero-power production of the wind farm offer useful opportunities torigorously evaluate the microclimate impact of both stationary and operating turbines. During an 80minnighttime wind farm curtailment, we measured abrupt and large changes in turbulent fluxes of momentumand heat leeward of the turbines. At night, wind speed decreases in the near wake when turbines are off butabruptly increases when turbine operation is resumed. Our measurements are compared with ModerateResolution Imaging Spectroradiometer Terra and Aqua satellite measurements reporting wind farms to havehigher nighttime surface temperatures. We demonstrate that turbine wakes modify surface fluxescontinuously through the night, with similar magnitudes during the Terra and Aqua transit periods. Coolingoccurs in the near wake and warming in the far wake when turbines are on, but cooling is negligible whenturbines are off. Wind speed and surface stratification have a regulating effect of enhancing or decreasing theimpact on surface microclimate due to turbine wake effects.
1. Introduction
An increasing number of studies suggest that wind farms, like urban areas, surrounded by homogenous land-scapes have elevated nighttime surface temperatures. Urban areas have internal sources of heat and surfaceconditions that absorb and retain more heat than surrounding areas. But since turbines do not add/removesensible or latent heat, nor do they change heat-absorbing or heat-retaining characteristics of the landscape,why should wind farms have higher near-surface air temperatures? Previous reports of elevated nighttimetemperatures due to wind farms have not focused on physical mechanisms that create these observed noc-turnal warm regions associated. We provide measurements and offer a conceptual model based on physicalprinciples to explain how wind farms affect surface temperatures.
In the U.S. Midwest, large wind plants cover several thousand acres of cropland, but it is unclear whether tur-bines influence these agricultural ecosystems [LeBeau et al., 2014; Winder et al., 2014]. Unlike from offshorewind plants [Barthelmie et al., 2005, 2007, 2009; Hansen et al., 2012], few field experiments have measuredwind turbine flow fields or wake conditions from land-based wind plants [Rajewski et al., 2013; Smith et al.,2013]. Numerical simulations [Baidya Roy, 2004, 2011; Adams and Keith, 2007; Cervarich et al., 2013; Fitchet al., 2013] and satellite-derived analyses [Walsh-Thomas et al., 2012; Zhou et al., 2012a, 2013] report a com-bination of surface warming and drying within wind plants and several kilometers downwind. ModerateResolution Imaging Spectroradiometer (MODIS) satellite analyses [Zhou et al., 2012a, 2012b, 2013; Harriset al., 2014; Slawsky et al., 2015; Xia et al., 2015] also indicate a stronger warming at the time of the MODISTerra overpass in the premidnight hours than during the overpass of the MODIS Aqua satellite in thepostmidnight hours.
The intensity of warming among studies depended on location, with lower values (0.3–0.6 K) for wind farmswithin agricultural crop landscapes in Iowa and Northern Illinois [Harris et al., 2014; Slawsky et al., 2015] andhigher warming on rangeland (0.75–1.5 K) within wind farms in western Texas [Zhou et al., 2012a, 2012b,2013; Xia et al., 2015]. Mechanisms causing nighttime warming have been proposed but not confirmed by
RAJEWSKI ET AL. MICROCLIMATE WITH TURBINES ON VERSUS OFF 13,392
PUBLICATIONSJournal of Geophysical Research: Atmospheres
RESEARCH ARTICLE10.1002/2016JD025297
Key Points:• Nighttime fluxes and wind speedincrease when turbines are on andwind speed decreases for turbines off
• No distinction of stronger warmingbetween nighttime Terra and Aquasatellite overpass periods
• Nighttime fluxes simultaneouslyrevert to ambient levels during an80 min shutdown of the wind farm
Correspondence to:D. A. Rajewski,[email protected]
Citation:Rajewski, D. A., E. S. Takle, J. H. Prueger,and R. K. Doorenbos (2016), Towardunderstanding the physical linkbetween turbines and microclimateimpacts from in situ measurements in alarge wind farm, J. Geophys. Res. Atmos.,121, 13,392–13,414, doi:10.1002/2016JD025297.
Received 29 APR 2016Accepted 2 NOV 2016Accepted article online 7 NOV 2016Published online 26 NOV 2016
©2016. The Authors.This is an open access article under theterms of the Creative CommonsAttribution-NonCommercial-NoDerivsLicense, which permits use and distri-bution in any medium, provided theoriginal work is properly cited, the use isnon-commercial and no modificationsor adaptations are made.

measurements of surface turbulence and rotor layer properties of wind and temperature [Xia et al., 2015].Previous reports of in situ measurements of surface fluxes and lidar profiles from the Crop Wind EnergyExperiment (CWEX) over a utility-scale wind plant in Iowa indicate that turbines modify surface heat fluxand flow fields both above and below the turbine rotor layer within a few leading lines of turbines[Rajewski et al., 2013; Rhodes and Lundquist, 2013]. Turbines increase daytime transpiration, photosynthesis,and nighttime respiration within a few hundred meters downwind from the first turbine line [Rajewskiet al., 2014]. The characteristics of turbine interactions with the crop surface depend on three primary factors:ambient wind speed (which controls the power generation), ambient turbulence intensity [Clifton et al., 2013]and thermal stability (which modifies wake properties of vertical and horizontal propagation and dissipation)[Aitken et al., 2014; Iungo and Porté-Agel, 2014; Abkar and Porté-Agel, 2015], and wind direction (which some-times creates situations where turbines are not directly pointed into the wind) [Barthelmie et al., 2010; Porté-Agel et al., 2013; Rajewski et al., 2014].
Most studies of wind farm effects on surface temperature do not include critical information about whetheror not the turbines were operating (periods of low wind or wind farm curtailment) or whether agricultural orother land use operations (e.g., grazing, irrigation, mowing, tillage, or other vegetation management activ-ities) that potentially would impact temperature were being conducted during the measurement period.Nighttime surface temperatures taken within a wind farm located in a peat bog were reported to have animpact of less than 0.2 K for operating turbines as compared to a controlled period with turbines off[Armstrong et al., 2016]. Our analysis differs from this study in that we measured impact as a differencebetween concurrent measurements upwind and downwind of a single turbine and two consecutive turbinelines, whereas Armstrong et al. [2016] measured impact as a concurrent difference of each sensor from thenetwork (101 sensors) mean.
Wind tunnel studies [Chamorro and Porté-Agel, 2009, 2010; Markfort et al., 2012; Hancock and Pascheke, 2013;Zhang et al., 2013b; Hancock and Farr, 2014] and KA band radar scans [Hirth and Schroeder, 2013; Hirth et al.,2014] as well as numerical simulations [Lu and Porté-Agel, 2011; Abkar and Porté-Agel, 2014; Aitken et al., 2014;Mirocha et al., 2014, 2015; Sescu and Meneveau, 2015; Abkar et al., 2016] provide visualizations of turbinewakes being generated and transported downwind. The wake consists of a conical region of flow withreduced mean wind and enhanced turbulence compared to the undisturbed flow. Under stable stratificationthe wake region extends downwind 20 or more rotor diameters (D). A 5° cone has been proposed as typicalover water in stable conditions [Barthelmie et al., 2009, 2010], while KA band radar reveals a smaller angle ofexpansion over land in stable conditions [Hirth and Schroeder, 2013]. Under unstable conditions the wakecone typically has a larger angle, dissipates faster due to ambient convection, and reverts to ambient condi-tions at less than ~10 D.
Our conceptual model of the wake interaction with the surface comes from surface flux measurements inCWEX 10, 11, and 13 [Rajewski et al., 2013, 2014; Lundquist et al., 2014; Takle et al., 2014]. The wake expandsdownward toward the surface and can be detected by a flux station from enhanced turbulence kineticenergy, enhanced crosswind turbulent velocity, and reduced or enhanced wind speed. If a station is locatednear the turbine under an elevated wake, it can experience a disruption of ambient turbulent exchangebecause the wake is effectively cutting off linkage of large eddies above the wake from influencing surfacefluxes. The near-turbine flux station may also record a velocity “speed-up” due to acceleration from the hor-izontal pressure gradient (high upwind and low downwind) created by flow blockage from the rotatingblades. Turbine wakes provide scales of turbulence that are quite different from ambient turbulence, bothday and night. Flux stations located downwind of turbines will measure speed, temperatures, and fluxes thatare strongly influenced by the scales of turbulence (wake or ambient) occurring at and above that surfacemeasurement point. Slightly warmer daytime temperatures can be expected in the near lee of turbines,whereas enhanced mixing in the wake promotes slightly cooler temperatures farther downwind. However,at night, ambient surface wind speed is much lower than speeds at turbine hub height such that wake tur-bulencemixes higher speeds from aloft to the surface. We expect some warming underneath the wake (wakenot reaching the surface) in the near lee of the turbine. A larger (cumulative) warming is expected fartherdownwind underneath a single wake or underneath and between two single wakes and if the wake has inter-sected the surface, the warming also is larger than in the near lee. Our conceptual model of wind turbineinfluences on surface wind speed, temperature, and heat flux is depicted in Figures 1a and 1b for idealizeddaytime and nighttime conditions.
Journal of Geophysical Research: Atmospheres 10.1002/2016JD025297
RAJEWSKI ET AL. MICROCLIMATE WITH TURBINES ON VERSUS OFF 13,393

We describe our measurement site, instrumentation, wake conditions during measurement periods, and ana-lysis methods in section 2. Results are given in section 3. We use downwind-upwind differences in windspeed, temperature, and heat flux to reveal impacts of turbines during day versus night (section 3.1), duringperiods of satellite observations versus no satellite observations (section 3.2), when a turbine wake wasoverhead versus not overhead (section 3.3), and for various wind speed intensities and thermal stratifi-cation (sections 3.4 and 3.5). We conclude the results section with an analysis of Fourier spectral char-acteristics of turbulence before, during, and after a unique and well-defined nighttime wind farm80min curtailment period to examine impacts of turbines on near-surface turbulence when turbineswere on and off (sections 3.6 and 3.7). Discussion and conclusions are presented in sections 4 and5, respectively.
Figure 1. Idealized conceptualization of wind farm modification of wind speed and flux differences downwind of turbinesduring: (a) DAY and (b) NIGHT.
Journal of Geophysical Research: Atmospheres 10.1002/2016JD025297
RAJEWSKI ET AL. MICROCLIMATE WITH TURBINES ON VERSUS OFF 13,394

2. Measurements and Analyses2.1. Field Site
Iowa State University and the National Laboratory for Agriculture and the Environment (NLAE) installed foursurface flux stations over corn fields within the first two upwind lines of turbines of a 350MWwind plant for a2.5month period from late June to early September of 2010 [Rajewski et al., 2013]. The crop reached its max-imum height of 2.8m inmid-July. Each stationmeasured wind speed and air temperature at 9m and 5m, andturbulent momentum and heat fluxes were measured by using eddy covariance at 6.5m above the soil sur-face. The reference station (NLAE 1) was located 450m (4.5 D, D = 77m, the turbine rotor diameter) upwind ofthe first line of turbines and three other stations (NLAE 2, NLAE 3, and NLAE 4) were positioned at a distance of2.5 D north of the first turbine line, 17.5 D north of the first turbine line, and 9.5 D north of the second turbineline, respectively. These two turbine lines were separated by a distance of 24.5 D. The owner of the wind plantprovided 10min SCADA (Supervisory Control And Data Acquisition) data of nacelle wind speed, yaw, powerproduced, and ambient temperature from the 13 turbines within the first two lines of turbines.
Figure 2a provides a layout of the flux stations and turbines within the southwest portion of the wind farm.The turbine-based SCADA measurements used in our study included nacelle wind speed, yaw angle, powergenerated, and temperature (Figure 2b). From the SCADA data we determined that most of the low-power-producing periods during our experiment had wind directions from the northwest clockwise through theeast-southeast sectors during which the turbines in Figure 2a were influenced by wakes from turbines sur-rounding the CWEX area (Figures 2c and 2d). For the wind roses calculated for Turbine 154 and from the refer-ence station (NLAE 1) we observed the highest speeds for the seasonally prevailing wind direction(southwesterly to south southeasterly). SCADA 80m wind speed and direction measurements taken on thenacelle leeward of the rotor likely differ somewhat from ambient conditions. We have discussed these
Figure 2. (a) Locations of four CWEX-10 surface flux stations and 13 turbines within the southwest portion of the wind farm;(b) frequency distributions of SCADA 10min power from Turbine 154 for steady daytime, nighttime, and boundary layertransition periods as defined by the reference flux station net radiation; (c) wind rose from the nacelle wind speed and yawfrom Turbine 154; and (d) wind rose from the 9m wind speed and 6.5m direction at the reference flux station NLAE 1. Thered dashed lines in Figure 2d indicate the sector used in determining the composite ON and OFF flux station differences.
Journal of Geophysical Research: Atmospheres 10.1002/2016JD025297
RAJEWSKI ET AL. MICROCLIMATE WITH TURBINES ON VERSUS OFF 13,395

differences [Rajewski et al., 2013, 2014; Takle et al., 2014] and caution that speeds likely have a low bias. Use ofyaw for determining rotor-layer wake direction, however, is preferable to surface wind direction due toknown surface layer veering, particularly at night [Walton et al., 2014]. We separate our data into two cate-gories based on SCADA power production data: turbine on (ON) cases and turbines off (OFF) cases. Thisenables us to measure separately the effects of the wind farm as a collection of tall stationary objects (tur-bines off) and effects of an operating wind farm (turbines on). For each category we made composite ana-lyses of impacts of turbines on temperature, wind speed, and surface heat flux compared to conditionsnearby outside the wind farm in an identical landscape.
2.2. Analysis of Flux Difference Composites2.2.1. Quality Control MetricsWe selected 30min flux data when the NLAE 2 station wind direction (south-southeast clockwise to west)confirmed that conditions in our 13-turbine cluster were not influenced by wakes from surrounding wind tur-bines in the wind farm. We determined a wind directional window for each turbine wake according to a 5°wake expansion factor [Barthelmie et al., 2010; Rajewski et al., 2013]. We additionally removed observationsduring rainfall events or in other periods for which we have less than 96% of quality controlled data for eachflux averaging period [Rajewski et al., 2014]. The working data set contains about 65% of the observations.Day, night, and transitional boundary layer periods are identified according to a simple metric for the condi-tions below (1–3) using the net radiation (Rnet) at the NLAE 1 station [Rajewski et al., 2014].
DAY : Rnet≥300 W m�2 (1)
NIGHT : Rnet≤0 W m�2 (2)
TRANSITION : 0 W m�2 < Rnet < 300 W m�2 (3)
2.2.2. Satellite DataWe separate and categorize our quality-controlled flux measurements during both the ON and OFF periodsaccording to the satellite transit time to compare with previously reported observations of land surface tem-perature derived byMODIS Terra and Aqua imagery [Zhou et al., 2012a, 2012b]. The nighttime warming docu-mented over and downwind of the wind farms is measured by the radiating surface temperature, so our insitu measurements evaluate the consistency between the reported turbine effects on surface radiating tem-perature with measured effects on near-surface air temperature. Previous analyses from satellite-derived landsurface temperatures determined the MODIS satellite times according to the overpass at the equator as1030/2230 local standard time (LST) for Terra and 1330/0130 for Aqua. We confirmed the actual transit timesover the Midwest continental U.S. from the Terra and Aqua Orbit Tracks map archives by the University ofWisconsin Space Science and Engineering Center (http://www.ssec.wisc.edu/datacenter/terra/GLOBAL.html)and (http://www.ssec.wisc.edu/datacenter/aqua/GLOBAL.html). We found that during CWEX-10, satelliteoverpass times vary within a 2 h interval centered on the aforementioned equatorial transit periods. We iden-tify a 2 h window for which either satellite is measuring surface radiation: Terra from 2130 to 2330 LST at nightand 1030 to 1230 LST during the day and Aqua from 0130 to 0330 LST at night and 1230 to 1430 LST duringthe day. We designate a no-satellite-transit period (NoSAT) as being between and outside of the Terra andAqua periods.2.2.3. Turbines ON/OFF CharacterizationWe use the SCADA power measurements to determine the ON/OFF periods for the turbines. The 2010 seasonprovided us with 183 h of data samples for when the turbines were off, including a 12 day period when thewind farm was not in operation. In comparison to 2010, our available OFF periods from other CWEX cam-paigns were much less (73 h in 2011 and 48 h in 2013). In contrast to the OFF periods our measurements from2010 contain 592 h with turbines on. OFF periods are designated when the turbine power for all 13 turbines is≤0 kW, and we denote that the ON condition for power at all 13 turbines is ≥100 kW [Rajewski et al., 2014]. Weremoved from the data set any observations from the 13-turbine composite with a mixture of both OFF andON conditions. We create 10min averages of surface fluxes by using the same procedures as for the 30mindata sets. Surface flux differences were categorized according to day and night periods from the net radiationat NLAE 1, and wind directions were categorized from the sonic anemometer measurements at the first sta-tion downwind of the turbine line (NLAE 2). We determined mean quantities of the flux differences by sub-tracting downwind station values from the reference upwind station. We normalized wind speed by thereference station wind speed (e.g., ΔU/U0 ), but we retain absolute differences in temperature (K) and heat
Journal of Geophysical Research: Atmospheres 10.1002/2016JD025297
RAJEWSKI ET AL. MICROCLIMATE WITH TURBINES ON VERSUS OFF 13,396

flux (Km s�1) to relate to wind farmmicroclimate differences previouslyreported from satellite data. We didnot calculate the dry component of
sensible heat flux,w ′T ′, at all four sta-tions (due to limited instrumenta-tion); therefore, we use only thesonic anemometer-measured heat
flux w ′T ′v in our composite differ-ences. We calculated the 95% confi-dence interval of each meandifference as a measure of the statis-
tical strength of our observational evidence for wind farmmodification of surface fluxes [Rajewski et al., 2013,2014; Takle et al., 2014]. The number of 30min observations for each of the three satellite categories (Terra,Aqua, and NoSAT) and the turbine ON/OFF composites are presented in Table 1.2.2.4. Wake Influence at Flux Station LocationsWe expanded on the 30min difference composites for operational periods by comparing downwind differ-ences in the surface variables relative to the reference station NLAE 1 during periods of high solar heating(continuously Rnet> 300Wm�2) representing “daytime” and surface cooling (continuously Rnet< 0Wm�2)representing “nighttime” conditions [Rajewski et al., 2014]. We used wind direction categories from NLAE 2to identify periods when individual turbine wakes are influencing surface measurement stations. These cate-gories of predominantly southerly wind direction were sized by a 5° wake window for each turbine or thewindow of wind directions between each turbine wake from the first line of turbines [Barthelmie et al.,2009; Rajewski et al., 2013, 2014; Takle et al., 2014]. We also compared the ON and OFF composites withthe individual categories of turbine wake and between-wake sectors for the operational periods as inTable 2. There were too few observations for a wind directional partition in the OFF condition and for aseparation of conditions for satellite and nonsatellite transit times. We also designate a “No wake” categorywhen winds are from the west when approach flow to the downwind stations does not pass throughany turbines.2.2.5. Surface Stratification and Wind Speed VariabilityWe determine the relationship between thermal stability and turbine influences on the 30min averageddownwind-upwind differences dependent on the magnitude of wind speed, temperature, and sonic heat
flux by calculating the virtual potential temperature gradient at the reference station NLAE 1, ∂θv∂z . We use tem-
perature and relative humidity measurements from the 9.0m and 5.0m levels above the surface. Compositesof the ON versus OFF differences are categorized according to bin sizes for the following increments �0.05,�0.02,�0.01, 0.0, 0.01, 0.02, 0.05, 0.10, 0.20, and 0.50° Km�1. Wind turbine influence on fluxes is also inferredto be dependent on wind speed. In the absence of measurements for the upwind 80m wind speed, we char-acterize the wind speed variability on the downwind-upwind flux and scalar differences by the 6.5m sonicwind speed at NLAE 1. Speed categories are in 0.5m s�1 increments with bins spanning �0.25m s�1 oneither side of each interval up to 7.0m s�1. Composite differences when wind speeds are greater than7.0m s�1 are omitted because of so few cases. We additionally sort the composite differences for specificstratification categories [Takle et al., 2014; Mirocha et al., 2015]. We present only the results for the “stable”condition which we determined from the reference Obukhov length L [Stull, 1988] as
L ¼ �θv u3�kg w ’ θ′3� �
s
(4)
where θv is the surface virtual potential temperature, w ′θ′v� �
sis the surface moist sensible heat flux, u* is the
friction velocity measured by the sonic anemometer, k is the von Karman constant (0.4), and z is the height ofthe flux measurement (6.5m). We combine the stability classes [Gryning et al., 2007], which would includecL = 2 (50m ≤ L< 200m), cL = 3 (10m ≤ L< 50m), and another category we designate as cL = 4 for(0m< L< 10m) to describe an extremely strong stratification. We set up the stability range of(0m< L< 200m) as our stable category.
Table 1. Sample Sizes for Satellite Overpass Categoriesa
Satellite Category Sample Size DAY Sample Size NIGHT
NoSAT_ON 244 709Terra_ON 124 214Aqua_ON 142 193NoSAT_OFF 90 145Terra_OFF 46 36Aqua_OFF 48 39
aSatellite category sectors Terra, Aqua, and NoSAT of surface fluxes insoutherly direction for turbines on the leading line of turbines at the windfarm. Composites are included for turbines ON and turbines OFF with DAYand NIGHT categories.
Journal of Geophysical Research: Atmospheres 10.1002/2016JD025297
RAJEWSKI ET AL. MICROCLIMATE WITH TURBINES ON VERSUS OFF 13,397

2.3. Spectral Analysis
Sonic anemometer-derived time series of the virtual temperature and wind speed at a sampling rate of20Hz were selected for a complete record of quality controlled data. The data were corrected for tilt anddirectional filtering to isolate flux tower shadowing effects on the instrument [Wilczak et al., 2001;Leuning, 2005]. We calculate from the time series the power spectra and cospectra of turbulence fluxeswhen the turbines were off and on. In the nighttime event of 27–28 August we compared turbulence sig-natures before, during, and after an 80min period when the wind farm was shutdown. We designated forour analyses the following three 1 h periods: ON from 2100 to 2200 LST 27 August, OFF from 2300 LST 27August to 0000 LST 28 August, and ON from 0100 to 0200 28 August. We followed a linear detrending ofthe time series and a taper window of 10% before the FFT was calculated [Stull, 1988]. A linear smootherusing 120 point average was applied after the computation of the spectra and cospectra to reduce thesharp vertical lined appearance of the spectral curves over much of the high-frequency portion of the spec-tral domain. We characterized the one-sided spectral energy density according to twice the value of thesquare of the inverse fast Fourier transform (FFT) for any variable x (x= u,v,w) for a range of frequenciesup to the Nyquist frequency (e.g., 10 Hz) as
Pxx fð Þ ¼ 2 Fx fð Þj j2Δf
(5)
where Δf is the difference between frequencies (i.e., 1) and Fx(f) is the product of the real part (Fx) and com-plex conjugate F�x
� �of Fx(f) related to the variance according to
σ2x ¼ ∑ftotal�1f¼1 Fx fð Þj j2 (6)
Similar for the covariance we obtain
Pxy fð Þ ¼ 2 Fxy fð Þ�� ��Δf
(7)
where Fxy(f) is the product of the real part (Fy) of Fy(f) and complex conjugate F�x� �
of Fx(f).
Power spectral and cospectral energy densities were normalized as f Pxxu�2�� �
, fCoxyu�2�� �
, for turbulence
quantities of momentum and f PxxT�2�� �
, fCoxyu�1� T�1�� �
for turbulent components of heat where f is the fre-
quency, Pxx is the component of the power spectra, Coxy is the component of the cospectra, u* is the refer-ence station friction velocity, and T* is the reference station temperature scale calculated as
T� ¼ w’Tv’
!=u� (8)
As in the composite downwind-upwind differences of heat flux, for the spectra and cospectra we did not cal-culate the dry component of sensible heat flux at all four stations (due to limited instrumentation); therefore,
we substitute Tv * for T* by using the sonic anemometer-measured heat flux w ′T ′v .
Table 2. Sample Sizes for Wake Directional Categoriesa
Case Direction CategoryTurbine WakeIndicator and Wake Wind
Directions (α)Sample Size
DAYSample Size
NIGHT
Between wakes 154 and 50 Gap between Turbines 154 and 50 (α = 147°–188°) 157 456Within wake 154 Turbine 154 wake (α = 188°–220°) 61 50Between wakes 18 and 154 Gap between Turbines 18 and 154 (α = 220°–232°) 31 18Within wake 18 Turbine 18 wake (α = 232°–253°) 6 34ON (Combination turbines on) 255 558OFF (Combination turbines off) 92 110No wake Westerly no-wake (α = 253°–276°) 28 50
aWind direction sectors corresponding to the turbine wake or gap (between turbine) flow for turbines on the leadingline of turbines at the wind farm. Composites of these direction sectors are included for when the turbines were on. Thenumber of observations in the DAY and NIGHT cases is included.
Journal of Geophysical Research: Atmospheres 10.1002/2016JD025297
RAJEWSKI ET AL. MICROCLIMATE WITH TURBINES ON VERSUS OFF 13,398
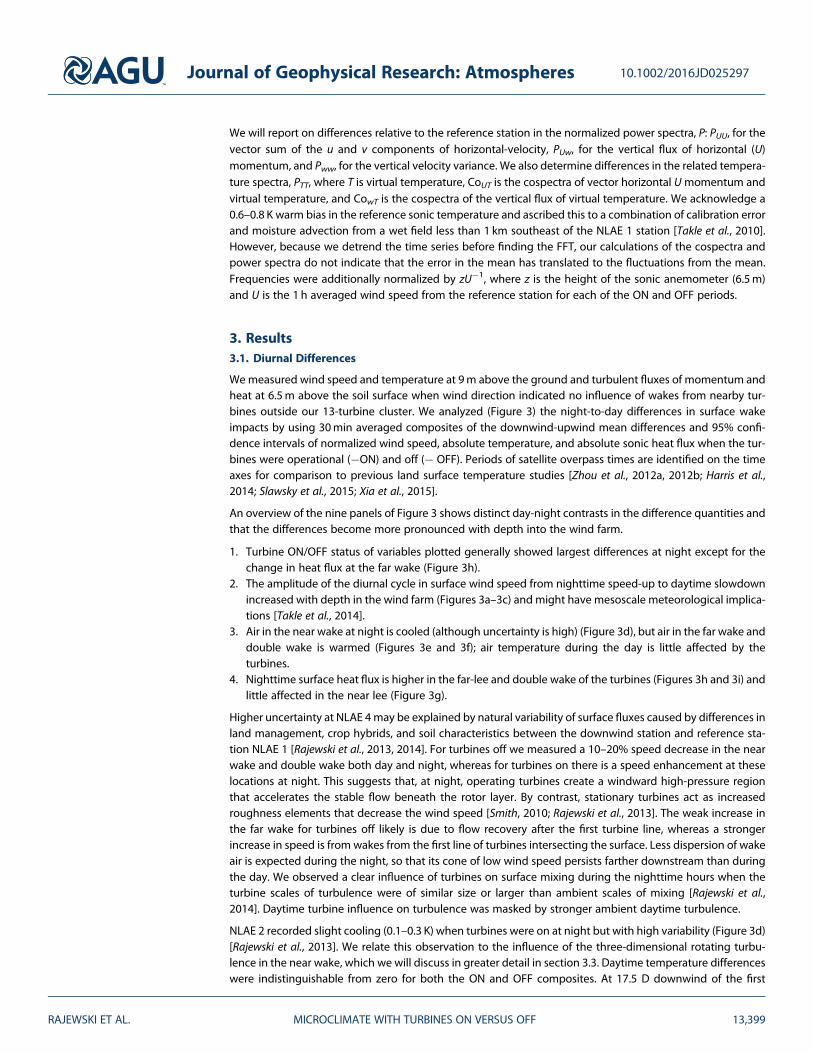
We will report on differences relative to the reference station in the normalized power spectra, P: PUU, for thevector sum of the u and v components of horizontal-velocity, PUw, for the vertical flux of horizontal (U)momentum, and Pww, for the vertical velocity variance. We also determine differences in the related tempera-ture spectra, PTT, where T is virtual temperature, CoUT is the cospectra of vector horizontal Umomentum andvirtual temperature, and CowT is the cospectra of the vertical flux of virtual temperature. We acknowledge a0.6–0.8 K warm bias in the reference sonic temperature and ascribed this to a combination of calibration errorand moisture advection from a wet field less than 1 km southeast of the NLAE 1 station [Takle et al., 2010].However, because we detrend the time series before finding the FFT, our calculations of the cospectra andpower spectra do not indicate that the error in the mean has translated to the fluctuations from the mean.Frequencies were additionally normalized by zU�1, where z is the height of the sonic anemometer (6.5m)and U is the 1 h averaged wind speed from the reference station for each of the ON and OFF periods.
3. Results3.1. Diurnal Differences
Wemeasured wind speed and temperature at 9m above the ground and turbulent fluxes of momentum andheat at 6.5m above the soil surface when wind direction indicated no influence of wakes from nearby tur-bines outside our 13-turbine cluster. We analyzed (Figure 3) the night-to-day differences in surface wakeimpacts by using 30min averaged composites of the downwind-upwind mean differences and 95% confi-dence intervals of normalized wind speed, absolute temperature, and absolute sonic heat flux when the tur-bines were operational (�ON) and off (� OFF). Periods of satellite overpass times are identified on the timeaxes for comparison to previous land surface temperature studies [Zhou et al., 2012a, 2012b; Harris et al.,2014; Slawsky et al., 2015; Xia et al., 2015].
An overview of the nine panels of Figure 3 shows distinct day-night contrasts in the difference quantities andthat the differences become more pronounced with depth into the wind farm.
1. Turbine ON/OFF status of variables plotted generally showed largest differences at night except for thechange in heat flux at the far wake (Figure 3h).
2. The amplitude of the diurnal cycle in surface wind speed from nighttime speed-up to daytime slowdownincreased with depth in the wind farm (Figures 3a–3c) and might have mesoscale meteorological implica-tions [Takle et al., 2014].
3. Air in the near wake at night is cooled (although uncertainty is high) (Figure 3d), but air in the far wake anddouble wake is warmed (Figures 3e and 3f); air temperature during the day is little affected by theturbines.
4. Nighttime surface heat flux is higher in the far-lee and double wake of the turbines (Figures 3h and 3i) andlittle affected in the near lee (Figure 3g).
Higher uncertainty at NLAE 4may be explained by natural variability of surface fluxes caused by differences inland management, crop hybrids, and soil characteristics between the downwind station and reference sta-tion NLAE 1 [Rajewski et al., 2013, 2014]. For turbines off we measured a 10–20% speed decrease in the nearwake and double wake both day and night, whereas for turbines on there is a speed enhancement at theselocations at night. This suggests that, at night, operating turbines create a windward high-pressure regionthat accelerates the stable flow beneath the rotor layer. By contrast, stationary turbines act as increasedroughness elements that decrease the wind speed [Smith, 2010; Rajewski et al., 2013]. The weak increase inthe far wake for turbines off likely is due to flow recovery after the first turbine line, whereas a strongerincrease in speed is from wakes from the first line of turbines intersecting the surface. Less dispersion of wakeair is expected during the night, so that its cone of low wind speed persists farther downstream than duringthe day. We observed a clear influence of turbines on surface mixing during the nighttime hours when theturbine scales of turbulence were of similar size or larger than ambient scales of mixing [Rajewski et al.,2014]. Daytime turbine influence on turbulence was masked by stronger ambient daytime turbulence.
NLAE 2 recorded slight cooling (0.1–0.3 K) when turbines were on at night but with high variability (Figure 3d)[Rajewski et al., 2013]. We relate this observation to the influence of the three-dimensional rotating turbu-lence in the near wake, which we will discuss in greater detail in section 3.3. Daytime temperature differenceswere indistinguishable from zero for both the ON and OFF composites. At 17.5 D downwind of the first
Journal of Geophysical Research: Atmospheres 10.1002/2016JD025297
RAJEWSKI ET AL. MICROCLIMATE WITH TURBINES ON VERSUS OFF 13,399

turbine line we observed a few tenths of a degree (K) warming at night and also around 0.2 K cooling duringthe day when the turbines were on as shown in Figure 3e. At NLAE 4, downwind of two lines of turbines, tem-peratures were nearly 0.5 K higher at night, but indistinguishable from the reference temperature during theday (Figure 3f). When turbines were off NLAE 4 registered slightly cooler temperatures during the day. Whenturbines were off during the night we observed an average 0.2 K cooler but variable temperature at NLAE 4.We have no explanation for this based on local conditions, so we suggest that it may be attributed to some(unidentified) mesoscale influence. In the daytime for turbines in both the ON and OFF composites, weobserved high variability and small heat flux differences between the reference station (NLAE 1) and theother three downwind locations. As we have previously reported [Rajewski et al., 2014; Takle et al., 2014] tur-bine wakes enhanced downward heat fluxes at each of stations 2.5 D, 17.5 D, and 34.0 D downwind of thefirst turbine line during the evening transition of the atmospheric boundary layer when strong stratificationdevelops in the surface layer. Later at night this difference in heat flux between the reference station and theother stations decreases as wakes remain more elevated with less coupling to the surface layer.
3.2. Turbine Influences During Satellite Observing Periods
In Figure 4 we indicate the periods of satellite overpass. It is noteworthy that in situ surface measurementsmade during periods of satellite observations were quite representative of all turbine ON periods (NoSAT-ON, Terra-ON, and Aqua-ON all cluster together) and for all turbine OFF periods (NoSAT-OFF, Terra-OFF,and Aqua-OFF all cluster together). The only exception is for turbine ON daytime heat flux deep in the wind
Figure 3. The 30min average differences (downwind-upwind) and 95% confidence intervals for (a) 9m normalized wind speed, (d) 9m air temperature, and (g)6.5m sonic heat flux in the near wake of the first turbine line (NLAE 2); (b, e, and h) in the far wake of the first turbine line (NLAE 3); and (c, f, and i) in the wakenorth of the second line of turbines (NLAE 4). The symbols shown compare the turbine ON and turbine OFF periods. The orange and aqua outlined rectangles abovethe time axes indicate Terra and Aqua satellite pass time for ease in comparison to previous land surface temperature studies.
Journal of Geophysical Research: Atmospheres 10.1002/2016JD025297
RAJEWSKI ET AL. MICROCLIMATE WITH TURBINES ON VERSUS OFF 13,400

farm (distance ~34 D in Figure 4c) where heat fluxes during satellite observing times were higher by a factorof 2 over those at other times (see later discussion). A comparison of surface and hub-height wind conditionsprovides additional insight on conditions affecting surface variables and fluxes. We recognize that the nacellespeed and yaw direction (being measured behind the rotor) differ slightly from the undisturbed flow due toturbine wake influences; however, it is a better measure of ambient flow at hub height than for wind fields at6.5m. For conditions with turbines on we observed a rise in hub-height wind speed from the evening transi-tion 1 h before sunset until 1 h before sunrise (Figure 5a). Wind speed was 2 to 3 times faster at 80m than atthe surface because strongly stable stratification prevents vertical mixing between the rotor layer and the sur-face until the morning transition sets in at 0700–0800 LST. In Figure 5b we also observed a 10–30° directionalshear between the surface and 80m levels during the nighttime period. Although measurements above hubheight were limited, we previously reported that nocturnal low-level jets (NLLJs) do influence the rotor layerover several nights with clear skies and minimal mesoscale influences [Rajewski et al., 2013; Rhodes andLundquist, 2013; Lundquist et al., 2014].
3.3. Between Wakes and Within Wake Variability of Wind Speed, Temperature, and Heat Flux
The influence of individual wakes on surface microclimate is revealed in Figure 6. For various wind directionsthe surface stations may be directly underneath a wake or underneath a region between wakes. As in Figure 4, turbines reduced surface wind speed during the day (Figure 6a) and increased wind speed at night (Figure 6b), weakly decreased temperature during the day (Figure 6c) and increased temperature at night (Figure 6d),and increased outgoing heat flux strongly during the day deep in the wind farm (Figure 6e) and increasedincoming heat flux weakly at night (Figure 6f).
For daytime wind speed, we observed a 15% speed reduction in the near-wake location (2.5 D) and when thecenter of the wake from the closest turbine (Turbine 154) was overhead of the station. We attributed thisreduction (Figure 6a) to decoupling of the overlying free boundary layer flow from the surface due to the pre-sence of the wake. When wakes were not directly over the station, the speed deficit at the surface was 5–10%.In the two no-wake subcategories (OFF and No wake) normalized speed deficits were less than 5%. Our mea-surements indicated that speeds in the wake return to quasi-ambient levels at 17.5 D downwind of the firstturbine line, whereas wakes from the first and second turbine lines reduced speeds by 15–20% at 34.0 Ddownwind of the leading turbine line.
In the 9m air temperature daytime differences (Figure 6b) we observed weak cooling in the far wake andbehind the second line of turbines for both waked-flow and no-wake conditions. These results are consistent
Figure 4. Turbine ON/OFF composites of satellite flyover Terra and Aqua periods and nonsatellite period (NoSAT) of downwind-upwind mean differences and 95%confidence intervals in 9m normalized wind speed for the (a) DAY and (d) NIGHT cases, 9m air temperature for the (b) DAY and (e) NIGHT cases, and 6.5m sonic heatflux for the (c) DAY and (f) NIGHT cases. The different sizes of symbols indicate the sample size for each composite.
Journal of Geophysical Research: Atmospheres 10.1002/2016JD025297
RAJEWSKI ET AL. MICROCLIMATE WITH TURBINES ON VERSUS OFF 13,401

with previous observations of daytime perturbations in sensible and latent heat fluxes over multiple locationswith different crop and soil variability [Rajewski et al., 2014]. Also, the daytime temperature differences wereless than 0.3 K, only slightly larger than the instrument uncertainty. Daytime heat flux values were insensitiveto changes in wind turbine turbulence at 2.5 D and 17.5 D downwind of the first turbine line when turbineswere both on and off (Figure 6c). For the ON state, we observed a slightly reduced flux (<0.005 Km s�1) at the2.5 D downwind station but when it was between the overhead wakes from Turbines 18 and 154. Several
Figure 5. Diurnal composites of mean and 95% confidence intervals of the mean from NLAE flux station and SCADA fromTurbines 154 in the leading south turbine line and Turbine 133 in the north turbine line for (a) 80m and 9mwind speed and80m and (b) 6.5m wind direction. The orange and aqua dashed rectangles above the time axes indicate Terra and Aquasatellite pass time for ease in comparison to previous land surface temperature studies.
Journal of Geophysical Research: Atmospheres 10.1002/2016JD025297
RAJEWSKI ET AL. MICROCLIMATE WITH TURBINES ON VERSUS OFF 13,402

studies [Markfort et al., 2012; Zhang et al., 2013a, 2013b; Rajewski et al., 2014] indicated the possibility of coun-ter gradient transport on the lower descending branch of the rotating swirl created from the turbine blades.The heat flux decrease at NLAE 2 when turbines were off cannot be explained by wakes but rather may bedue to the static pressure perturbation zones around nonrotating turbine blades and 80m tall pedestals asobstacles to the flow [Smith, 2010; Rajewski et al., 2013, 2014; Takle et al., 2014]. However, at 34.0 D fromthe first turbine line (10.0 D downwind of the second line of turbines), we clearly observed a twofold to three-fold increase in the heat flux for wind directions when wakes from the second line of turbines were intersect-ing the surface. We speculate that the reason for higher heat flux at NLAE 4 is that the wake from the first
Figure 6. Turbine wake and between wake sector downwind-upwind mean differences and 95% confidence intervals in9m normalized wind speed for the (a) DAY and (d) NIGHT cases, 9m air temperature for the (b) DAY and (e) NIGHTcases, and 6.5m sonic heat flux for the (c) DAY and (f) NIGHT cases. The different sizes of symbols indicate a smaller or largernumber of samples for each composite.
Journal of Geophysical Research: Atmospheres 10.1002/2016JD025297
RAJEWSKI ET AL. MICROCLIMATE WITH TURBINES ON VERSUS OFF 13,403

turbine line was dissipated by NLAE 3 so that the increased flux is likely caused by wakes from turbines down-windof the second turbine line.Wewill revisit this contrast of higher flux at the downwind location in section 4.
Nighttime wind speeds were reduced about 5% at the station directly downwind of Turbine 154 whether theturbines were on or off. Our results in both the daytime and nighttime turbine OFF composites suggest thatthis decline in speed at 2.5 D downwind from the turbine line is consistent with the influence of the pertur-bation pressure field around the line of turbines [Smith, 2010; Rajewski et al., 2013, 2014]. In the daytime weobserved that speed deficits were highest within the middle of the wake. During the night, however, the lar-gest flow enhancement (10–30%) occurred when the station measured conditions between the wakes ofTurbines 18 and 154 or between the wakes of Turbines 154 and 50 (Figure 6d). At 17.5 D from the turbineline, we measured the wake intersecting the surface with a 20–40% nighttime speed increase. This patternof high speeds between wakes is repeated for the far wake of the first turbine line and behind the secondline of turbines. Speeds are enhanced by a factor of at least twice the ambient level and are 50% higher thanwithin the center position of wakes. These “overspeeding” regions of near-surface air between turbines areanalogous to elevated flow accelerations between turbines reported by using scanning radars [Hirth andSchroeder, 2013; Hirth et al., 2014].
Nighttime temperature differences of Figure 6e revealed asymmetric near-wake details attributable to thethree dimensionality of the rotating wake: cooling on the upward rotating (east) side of the wake and warm-ing on the downward rotating (west) side of the wake from Turbine 154 under southerly flow. The warmingranges from 0.1 to 0.2 K at the westernmost wake of Turbine 18 for a distance of 5.5 D downwind to ~0.4 K at3.3 D downwind of Turbine 154. As the wind direction shifted from southwest to more southerly, the near-wake station recorded more of the upward branch of the Turbine 154 wake and therefore led to cooling atthe measurement height. As the turbulent mixing of ambient and wake air increased with downwind dis-tance, we observed a slight warming of 0.2 K at the 17.5 D far-wake distance comparable to warming inthe near-wake position at the 5.5 D distance. At both these stations the higher temperatures occurred whenthe flow was between two single turbine wakes. We observed slightly higher warming (0.3–0.4 K) behind thesecond line of turbines, which we attribute to a combination of wakes from the first and second lines thatproduced more downward mixing of warmer air aloft.
At night, heat flux differences between the upwind station and the downwind stations were smaller in mag-nitude than in the daytime (�0.01 Km s�1), but each difference for the wake or between-wake sectors indi-cated a progressively higher downward transport of heat to the surface at increasing distances from theleading turbine line when turbines are on (Figure 6f). Wake turbulence at 5.5 D downwind of Turbine 154increased downward heat transport by 50% of the ambient flux, but between the wakes of Turbines 18and 154 and within the wake of Turbine 18 our measurements indicated higher variability but a doublingof the flux from the reference station at a slightly farther distance downstream (3.3 D and 5.5 D) of the leadingturbine line. We observed slightly lower departures of heat flux when wakes were located 17.5 D down-stream, and we interpret this as a result of our composite wind directional averaging over wakes fromTurbines 50, 75, and 158 and from a 12-turbine line that is 1.2 km east-southeast of the upwind station.The combination of wakes from Turbines 50, 75, and 158 in the first turbine line and Turbines 23, 151, 133,and 148 in the second turbine line produced a doubling of the downward heat flux at 34.0 D downwind fromthe leading turbine line. Our differences of heat flux with turbines on are significant as we measure only adownwind-upwind flux contrast of �0.005 Km s�1 for turbines OFF or when no wake was present.
3.4. Influence of Temperature Stratification
The dependence of flux differences on thermal stratification is represented in Figure 7 for each of the near-wake, far-wake, and double-wake locations.
1. Overall, speed deficit is insensitive to changes in stratification except for strongly stable conditions (e.g.,∂θv∂z ≥ 0.20 Km
�1) (Figures 7a–7c). Temperature differences are higher in the far wake and behind the sec-ond turbine line in the daytime (both ON versus OFF) than in the near wake in weakly unstable to weaklystable conditions (Figures 7d–7f). Heat flux differences are minimal for weakly unstable to weakly stablestratification, whereas turbine wakes enhance surface heat flux differences during strongly stratified con-ditions (Figures 7g–7i).
2. Higher nighttime speed up, warmer temperatures, and stronger downward heat flux occur farther down-wind in the wind farm only for conditions that are strongly stable when turbines are on. We expect an
Journal of Geophysical Research: Atmospheres 10.1002/2016JD025297
RAJEWSKI ET AL. MICROCLIMATE WITH TURBINES ON VERSUS OFF 13,404

increased spatial influence of wake turbulence at the surface when the thermal stratification inhibits dis-sipation of turbine scales of turbulence [Rajewski et al., 2014].
3. Daytime unstable to neutral periods indicate similar surface cooling (0.2 K) in the far-wake location whenturbines are on or off, whereas at the near-wake location and the station downwind of two turbine lines,there is more dependence on turbine ON/OFF status. Our results again suggest a mixture of turbine influ-ences and field-scale variations at NLAE 3 and NLAE 4 [Rajewski et al., 2014]. At night we observed similarcooling in the near-wake position when turbines were on or off, whereas in the far-wake and double-wakelocations temperatures are consistent with our previous results (Figures 7d–7f) of having warmer tem-peratures when turbines are on versus off. We, however, note in very strong stability (∂θv∂z ≥ 0.50 Km�1)mesoscale effects (e.g., presence of NLLJs) reduce the distinction between turbines ON versus turbinesOFF.
4. For the heat flux differences during unstable conditions, only the northernmost location (NLAE 4) standsout as significantly different when turbines are on versus off. We observe a quasi-linear decline of the posi-tive flux enhancement which changes sign when under weakly stable conditions.
3.5. Flux Differences According to Surface Wind Speed in Stable Conditions
Comparison of the flux differences according to changes in wind speed for (0< L< 200m) in Figure 8 foreach of the near-wake, far-wake, and double-wake station differences from the ambient reveals thefollowing:
Figure 7. Thermal stratification influence on 30min average differences (downwind-upwind) and 95% confidence intervals for (a) 9m normalized wind speed, (d)9m air temperature, and (g) 6.5m sonic heat flux in the near wake of the first turbine line (NLAE 2); (b, e, and h) in the far wake of the first turbine line (NLAE 3); and (c,f, and i) in the wake north of the second line of turbines (NLAE 4). Stratification categories are in nonlinear format to better depict changes of downwind-upwindstation differences during both day and night periods. Symbols shown compare the turbine ON and turbine OFF periods. The different sizes of symbols indicate thesample size for each composite.
Journal of Geophysical Research: Atmospheres 10.1002/2016JD025297
RAJEWSKI ET AL. MICROCLIMATE WITH TURBINES ON VERSUS OFF 13,405

1. The largest nighttime speed up at all downwind locations in Figures 8a–8c occurs when surfacespeeds were lowest (indicative of moderately stable conditions from Figure 7) for both the ON versusOFF composites. As previously noted (Figures 4–7), turbine influence on wind speed increases withdistance into the wind farm, here showing a 10% increase in speed at each successive downwindlocation.
2. Cooling in the near-wake (Figure 8d) does not follow a linear dependence on the strength of wind speed,which may be caused by a combination of cold air advection at the edge of the wind farm and the per-turbation pressure in the rotor lee. However, temperatures were consistently warmer in the far-wakeand double-wake locations (Figures 8e and 8f) when turbines were on.
3. The increase in downward heat flux in Figures 8g–8i at all three downwind stations also indicates a sharpcutoff of turbine impact with surface wind speeds between 3.0 and 5.0m s�1 when turbines are on.However, fluxes become slightly positive for speeds above this window. These periods of high surfacespeed and stable conditions are reflective of weakly stable periods, which are similar to the differencesin Figures 7g–7i when the reference station temperature gradient ∂θv
∂z = 0.20 Km�1.4. Heat flux differences are near zero when turbines are off at low speeds and only exhibit high variability
under 1.0m s�1.
Comparing the differences according to hub-height wind speeds could more clearly indicate the depen-dence of turbine speed onmodification of surface fluxes and scalars, but we save this investigation in a futurereport where measurements of both ambient surface and hub-height wind speeds are available.
Figure 8. Wind speed influence for stable conditions on 30min average differences (downwind-upwind) and 95% confidence intervals for (a) 9m normalized windspeed, (d) 9m air temperature, and (g) 6.5m sonic heat flux in the near wake of the first turbine line (NLAE 2); (b, e, and h) in the far wake of the first turbine line (NLAE3); and (c, f, and i) in the wake north of the second line of turbines (NLAE 4). Symbols shown compare the turbine ON and turbine OFF periods. The different sizes ofsymbols indicate the sample size for each composite.
Journal of Geophysical Research: Atmospheres 10.1002/2016JD025297
RAJEWSKI ET AL. MICROCLIMATE WITH TURBINES ON VERSUS OFF 13,406

3.6. A Nighttime Curtailment Period From Turbine SCADA and Surface Measurements
We provide further evidence of nighttime surface modification from turbine wakes in the case study from1800 LST on 27 August to 0600 LST on 28 August. The 80min shutdown of the turbines is marked inFigures 9a–9d. Winds were low at the surface (2–4m s�1) and above 8m s�1 at turbine hub height(Figure 9a). Wind directions at hub height in Figure 9b are south-southeast to south for most of the overnightperiod, while at the surface the wind direction was southeast to south-southeast. Nacelle wind speed andyaw, in comparison to surface measurements, suggested NLLJ influence on rotor-layer speeds and winddirections. (The nearby wind profiler data from Slater, IA, indicated a 10m s�1 enhancement of wind speedin the 1–1.5 km layer for the first four overnight hours after sunset.) From 1800 to 2100 there was a ramp-up in hub-height speeds from 8 to near 12m s�1, followed by a drop to 9m s�1 during the period whenthe turbines are off (2250–0020). Wind speed increased to near 11m s�1 for the remainder of the night.We observed slight deviations in the speed and direction between the two nacelle points (Turbine 50 inthe leading line and Turbine 133 in the line north of the lead line). We observed a 1.0m s�1 higher windspeed downwind of the leading line and second line of turbines than was measured at the NLAE 1 referencestation. We also detected a veering in surface wind direction from south-southeast to south for stationslocated behind the first and second lines of turbines (NLAE 2 and NLAE 4). We attributed this feature tothe pressure perturbation field between each turbine line [Smith, 2010; Rajewski et al., 2013, 2014]. Positivedeflections of wind directions from the normal angle (e.g., south) were observed for winds approaching fromthe southeast, whereas a negative deflection occurred for winds from the southwest [Selvaraj et al., 2013;Takle et al., 2014]. This is consistent with our previous results of local deflection of the wind angle aroundshelterbelts [Wang and Takle, 1995, 1996]. Normalized power in Figure 9c indicates that all 13 turbines wereat 60–90% of operating potential except for the 80min period when the wind farm was shutdown. Highertemperatures by 0.5 to 1.0 K in Figure 9d were clearly observed at NLAE 4 when the turbines were on versus
Figure 9. Time series for the night of 27–28 August 2010 of 10min averages for (a) 9 mwind speed and two SCADA nacellespeeds, (b) 6.5m sonic wind direction and nacelle yaw angle from two SCADA measurements, (c) normalized power fromthe 13 turbines in the study area, and (d) 9m air temperature and two SCADA temperatures. The red rectangles above timeaxes in all four panels indicate the 80min period for which the wind farm was off.
Journal of Geophysical Research: Atmospheres 10.1002/2016JD025297
RAJEWSKI ET AL. MICROCLIMATE WITH TURBINES ON VERSUS OFF 13,407

the short off period. Throughout the night, nacelle-level and surface temperatures indicate strong long-waveradiative cooling at the surface and a quasi linear drop in hub-height temperature.
3.7. Turbulence Spectra During the Nighttime Curtailment Period
We expand on speed differences shown in Figure 9 with investigation of variance and covariance Fourierspectra of surface momentum fluxes (Figure 10) and of heat fluxes (Figure 11). Our results of surface-basedspectra demonstrate consistency to those reported at hub height in both numerical and wind tunnel simula-tions [Chamorro and Porté-Agel, 2010; Chamorro et al., 2011, 2012a, 2012b; Jiménez et al., 2011; Lu and Porté-Agel, 2011; Markfort et al., 2012; Newman et al., 2014] .3.7.1. Streamwise Velocity Power SpectrumIn the power spectra of horizontal momentum (for a streamwise component u) we note higher values down-wind of the leading two lines of turbines than at NLAE 1 when the turbines are on (Figure 10a). In the first ONperiod a few hours prior to shutdown (27 August 2100–2200 LST), momentum is sequentially higher from thefirst downwind station (NLAE 2) to the second (NLAE 3), and then there is a nearly fourfold increase of thespectral peak at the station downwind of the second turbine line (NLAE 4) as compared to NLAE 1. The fre-quency band of the peak intensity at downwind stations (NLAE 2 and NLAE 3) occurs at smaller scales(fzU�1 = 0.02) than for NLAE 1 (fzU�1 = 0.01). This shift was consistent among spectra calculated from hub-height mast measurements downwind of turbines in two different wind farms in complex terrain [Jiménezet al., 2011]. When the turbines were off, the difference in energy peaks between the reference and down-wind stations was negligible and the shifting of the peak intensity spectral band also appeared weak[Rajewski et al., 2014]. The second ON period (28 August 0100–0200 LST) demonstrates similar enhancementas in the first ON period (27 August 2100–2200 LST) of the momentum spectra with a slight double peaknoted within two frequency bands (fzU�1 = 0.0075 and fzU�1 = 0.02) at NLAE 4.3.7.2. Vertical Velocity Power SpectrumForw-momentum power spectra we also found increasing perturbations in vertical turbulence farther down-stream from the leading turbine line (Figure 10b). Peak energy at the northernmost station was nearly 2 to 4times higher than the ambient location during the first and second ON periods. However, as in the u-momentum spectra during the curtailment period, we observed a return to the reference-station level ofpeak energy at all downwind locations. Unlike the u-momentum spectra, the w-momentum spectra at
Figure 10. (bottom row) South to (top row) north (i.e., upwind to downwind) comparison of spectra of the ON period of 2100–2200 LST on 27 August 2010, OFFperiod of 2300–0000 LST on 27–28 August 2010, ON period of 0100–0200 LST 28 August 2010 for (a) streamwise u-momentum power spectra, (b) w-momentumpower spectra, and (c) u-w momentum co spectra.
Journal of Geophysical Research: Atmospheres 10.1002/2016JD025297
RAJEWSKI ET AL. MICROCLIMATE WITH TURBINES ON VERSUS OFF 13,408

stations downwind of the turbines indicate less shift of the peak frequency bands [Rajewski et al., 2014]. Inboth periods when the turbines were on or curtailed the peak energy exists around fzU�1 = 1.0. The spectrafor the first ON period at NLAE 4 also indicates a secondary local maximum at the frequency band of aboutfzU�1 = 0.02. Spectra taken over homogenous land and ocean surfaces [Larsén et al., 2013] usually have a sin-gle peak, whereas spectra over heterogeneous terrain (e.g., shelterbelts and forest edges) [Högström et al.,2002; Katurji et al., 2011] typically have multiple peaks. Turbines are known to introduce a range of scalesup to the size of the rotor [Kelley, 2011; Chamorro et al., 2012a; Markfort et al., 2012]. Our results demonstratethat wind turbines may cause one or more of the multiple peaks in our w spectra.3.7.3. Vertical-Streamwise CospectrumTurbine wakes enhanced the u-w cospectra—by at least 50% at NLAE 2 and about 150% at NLAE 3 (Figure 10c).The cospectral peak at NLAE 4 is 4 to 5 times larger than the peak at the reference location. A spectralshift in the frequency band is less clear at NLAE 2 and NLAE 3 possibly because the combination of theu and v components removes some of this pattern. At NLAE 4 the spectral peak is about 3 times higherthan at NLAE 1, and there is also a bimodal peak at energy scales of fzU�1 = 0.015 and fzU�1 = 0.04. Thispattern is linked to the previously mentioned secondary maximum in the w-momentum spectra. Forstations downwind of turbines, the u-w cospectra returned to the reference location spectrum when theturbines are off. In the cospectra of these same variables for the second ON period the deviations fromthe reference spectra were reduced but still demonstrated that the turbines enhance vertical mixing by50–75% above the reference levels.3.7.4. Power Spectrum of Virtual TemperatureThe power spectrum of virtual temperature indicates relative insensitivity to turbine influence at all thedownwind locations except at NLAE 3 for both the two ON and the single OFF periods (Figure 11a).However, we note a higher peak for the second ON period at NLAE 3 but do not have an explanation forthe doubling of peak intensity and the shift in peak intensity to lower frequency. For this particular night tur-bine turbulence does not change the variability of virtual temperature, although we have evidence from laterCWEX campaigns that the flux contributions of virtual temperature variance may be increased by wind-turbine turbulence depending on downwind distance within a wake and on other ambient meteorologicalfactors (e.g., wind speed, wind direction, and surface stratification).3.7.5. Horizontal-Streamwise Cospectrum of HeatOur cospectra of horizontal momentum and temperature in Figure 11b posit an enhanced effect on the hor-izontal transport of heat deeper into the wind farm. Peak intensities at NLAE 4 increased by 50% in both ON
Figure 11. Same as for Figure 10 but for (a) virtual temperature power spectra, (b) u-T cospectra of heat, and (c) w-T cospectra of heat.
Journal of Geophysical Research: Atmospheres 10.1002/2016JD025297
RAJEWSKI ET AL. MICROCLIMATE WITH TURBINES ON VERSUS OFF 13,409
periods. The high maximum atNLAE 3 for the second ON periodis related to the aforementionedlarge peak in the power spectrumof temperature. At NLAE 2 there isan apparent shift to higher fre-quencies, which may also indicatea different mechanism of turbineinfluence (e.g., decoupling of thetemperature and momentum inthe near wake of the rotor lee ver-sus enhancement of wake-layermomentum and heat fartherdownwind of a single wake or twoconsecutive wakes).3.7.6. Vertical-StreamwiseCospectrum of HeatIn Figure 11c we observe a clearincrease of vertical transport oftemperature farther downwindinto the wind farm. Peak intensitiesof wT cospectra are doubled atNLAE 4 and increase at NLAE 3 byabout 66% compared to the refer-ence spectra at NLAE 1. The sharpseparation of submaxima low andhigh peaks from fzU�1 = 0.2 tofzU�1 = 10 also corresponds to theblending of turbulent scales thatis taking place in the turbine wake.At NLAE 2 the cospectra has a 33%enhancement of peak energy forthe first ON period, but this featureis absent in the later ON period afterthe curtailment [Rajewski et al.,2014]. Other factors such as the
variability of the wake at NLAE 2 (between wakes or within a wake) may explain the return of the cospectrain the second ON period to reference levels as during the shutdown. We again note the similarity of cospectrapeaks and spectral curves at all four stations during the turbine curtailment. This suggests that the low-levelboundary layer properties can recover to ambient levels within a relatively short time (e.g.,<10min formomen-tum and 30min for scalars) as indicated previously in Figures 9a, 9b, and 9d.
4. Discussion
Our analyses highlight distinct differences in mean quantities of daytime and nighttime wind speed, night-time temperature, and nighttime turbulent fluxes of momentum of heat between the turbines on and tur-bines off conditions and for westerly no-wake flow. In both ON and OFF conditions there was littledistinction in turbine influences between satellite and nonsatellite transit times. We detect negligible day-time temperature differences (<� 0.2 K) for ON and OFF and between satellite and nonsatellite overpasstimes unlike the slightly cooler but more variable daytime land surface temperature differences at 1030LST reported in large wind farms by using the MODIS Terra and Aqua data [Zhou et al., 2012a; Xia et al.,2015]. These and other studies using the remote sensing technique [Zhou et al., 2012b; Harris et al., 2014;Slawsky et al., 2015] also report warmer nighttime temperatures (0.75 K) within and downwind of a large windfarm at the 2230 LST Terra satellite flyover as compared to the lower warming (0.2–0.5 K) during the Aqua
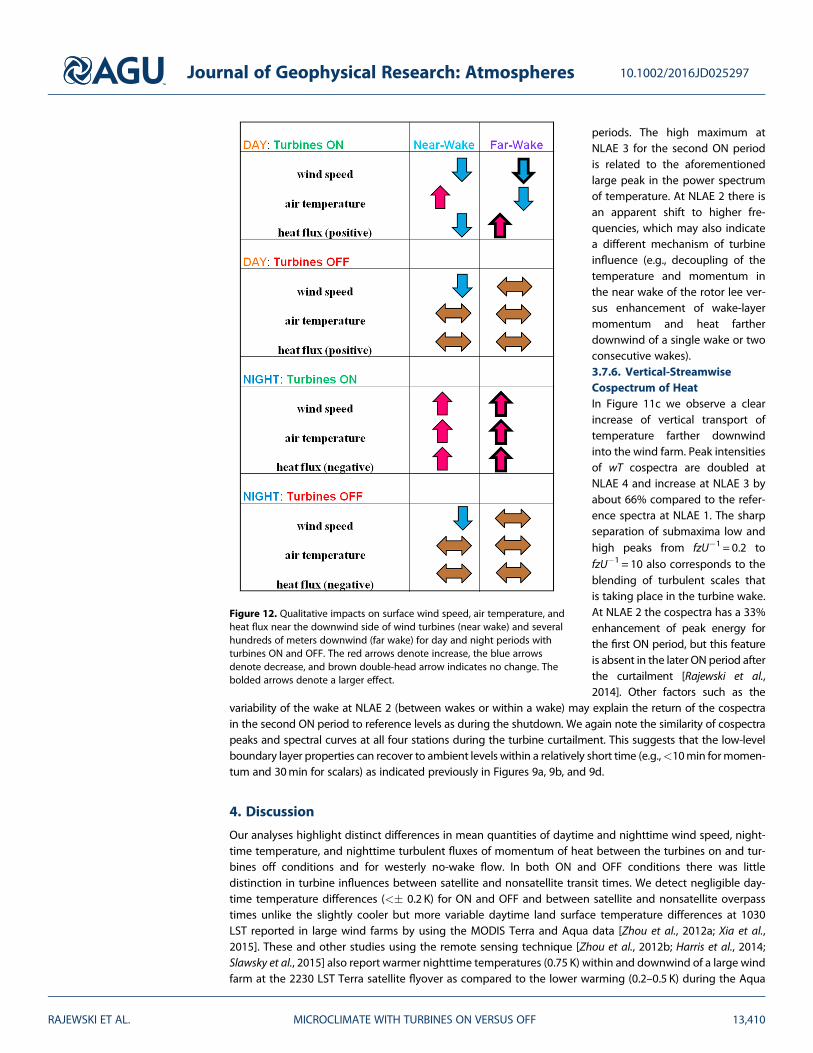
Figure 12. Qualitative impacts on surface wind speed, air temperature, andheat flux near the downwind side of wind turbines (near wake) and severalhundreds of meters downwind (far wake) for day and night periods withturbines ON and OFF. The red arrows denote increase, the blue arrowsdenote decrease, and brown double-head arrow indicates no change. Thebolded arrows denote a larger effect.
Journal of Geophysical Research: Atmospheres 10.1002/2016JD025297
RAJEWSKI ET AL. MICROCLIMATE WITH TURBINES ON VERSUS OFF 13,410

transit at 0130 LST. Our measurements indicate much less warming (0.4 K) on average among all southerlyupwind free-streamflow cases but up to 1.0 K (as seen in the 27–28 August case study) for specific wind direc-tions that indicate a merging of turbulent constituents from the first turbine line into the wakes from the sec-ond turbine line. We distinguish slightly lower or negligible change in warming at the Terra flyover periodscompared to the Aqua and instead attribute the highest warming (when it does occur) to wake interactionwith the NLLJ. Future measurements will be reported to verify the influence of mesoscale effects on turbinewakes and surface microclimate. Our spectral analyses demonstrate an increase in low-frequency and high-frequency scales of turbulence at the surface when turbines are on. In contrast, low-frequency scales presum-ably from the NNLJ were unable to penetrate the surface unless turbines are producing substantialpower (≥100 kW).
For the daytime sonic heat flux, we observed larger variations in nonsatellite and satellite periods at 34.0 D. Inour breakdown of flux differences according to wind direction we detected higher flux downwind of turbineswhen wakes from the first and second lines of turbines merge together before reaching the flux station. Theincrease in heat flux is associated with lower wind speed by 0.75–1.0m s�1 and reduced turbulence kineticenergy by 0.1–0.2m2 s�2 depending on the particular turbine wakes influencing the station (figure notshown). The result seems counterintuitive as we would expect enhancement of turbulence to increase anupward (positive) heat flux. Rather, we see an increased flux with little difference between the upwind anddownwind air temperature (within instrument uncertainty).
We caution the reader on the interpretation of the heat flux that we are measuring (i.e., uncorrected sonicheat flux), which includes both constituents of moisture and dry air. We were unable to partition the flux intosensible and latent components from the limitation in instrumentation at the northern two stations. As pre-viously reported [Rajewski et al., 2014] we acknowledge that differences in heating are also caused by fieldvariability of crop and soil characteristics between NLAE 1 and downwind stations NLAE 3 and NLAE 4.However, there is clear contrast in the heat flux and wind speed patterns between NLAE 4 and NLAE 1. AtNLAE 3 we do not see the same magnitude of difference, which also like NLAE 4 has different crop cultivar,field management, and soil characteristics than at the NLAE 2 and NLAE 1 stations. In this presentation of dif-ferences between turbines on versus turbines off conditions for multiple sorting categories we infer that tur-bine wakes are the responsible mechanism for increasing daytime heat flux changes deeper within thewind farm.
5. Conclusions
Our results demonstrate the importance of ambient conditions (e.g., variability of wind speed, wind direction,and surface layer stability) in creating turbine modification of surface flow fields. In summary, we detectedsmall but statistically significant differences in mean speed, temperature, and heat flux when turbines areoff. When turbines are on, our measurements reveal the impacts of turbine wakes and also some effects thatare not explained by wakes. Further modeling and measurements are needed to confirm that wind farm flowfields and microclimates are influenced by pressure fields due to both stationary turbines (turbines off) andoperating turbines (turbines on) in the ways that our data suggest. In Figure 12 we provide a qualitativereview of how surface wind speed, air temperature, and heat flux are modified by wind farms with turbineson versus off and during the daytime and nighttime.
Our analysis of two separate satellite overpass periods during the nighttime suggests that wind farmsincrease warming after local midnight rather than hours before midnight. During the latter time we suggestthat the position and intensity of the NLLJ are responsible for enhancing wake movement to the surface[Whiteman et al., 1997; Rhodes and Lundquist, 2013]. Spectral analyses indicate that at night turbines canchange momentum fluxes within a relatively short period (e.g., 10min). For both on-off and off-on transitionssurface turbulence responds to the turbine-generated flow perturbations (or lack thereof) very quickly,whereas we observe a 30 to 40min lag in the response of scalars (e.g., temperature). Similar and significant(doubling or more) enhancement of turbulence downwind of two turbine lines is recorded in multiple night-time spectra in similar conditions of southerly wind and a strongly stable surface layer, whereas we noticemoderate (50–75%) increases in the fluxes when the wake from a single turbine is 5.0 D from the station.In contrast, when turbines are off we do not observe at the downwind stations a substantial difference fromthe small scales of nighttime turbulence at the reference stations. Our surface detection of wakes illustrates
Journal of Geophysical Research: Atmospheres 10.1002/2016JD025297
RAJEWSKI ET AL. MICROCLIMATE WITH TURBINES ON VERSUS OFF 13,411

that turbines and wind plants are most effective at perturbing momentum, heat, and moisture during mod-erately strong stable stratification, but mesoscale influences apparently reduce impact to the surface whenstability is highly stratified. Additional measurements are needed to detect the interaction of turbulencescales from natural and forced (i.e., wind farm) sources. Future studies will address surface layer scalingto the flux differences in a more comprehensive relationship to rotor layer wind speed, shear, anddirectional veer in strongly stable conditions. Tall tower instrumentation both inside and outside the windfarm with a consistent measurement platform of turbulent fluxes at several layers within the rotor layer andbetween the rotor layer and surface will facilitate a holistic understanding of wind farmenvironmental interactions.
ReferencesAbkar, M., and F. Porté-Agel (2014), Mean and turbulent kinetic energy budgets inside and above very large wind farms under
conventionally-neutral condition, Renewable Energy, 70, 142–152, doi:10.1016/j.renene.2014.03.050.Abkar, M., and F. Porté-Agel (2015), Influence of atmospheric stability on wind-turbine wakes: A large-eddy simulation study, Phys. Fluids,
27(3), 35104, doi:10.1063/1.4913695.Abkar, M., A. Sharifi, and F. Porté-Agel (2016), Wake flow in a wind farm during a diurnal cycle, J. Turbul., 17(4), 420–421, doi:10.1080/
14685248.2015.1127379.Adams, A. S., and D. W. Keith (2007), Wind energy and climate: Modeling the atmospheric impacts of wind energy turbines, Eos Trans. AGU,
88(52) Fall Meet. Suppl., Abstract B44B-08.Aitken, M. L., B. Kosović, J. D. Mirocha, and J. K. Lundquist (2014), Large eddy simulation of wind turbine wake dynamics in the stable
boundary layer using the Weather Research and Forecasting Model, J. Renewable Sustainable Energy, 6(3), 33137, doi:10.1063/1.4885111.Armstrong, A., R. R. Burton, S. E. Lee, S. Mobbs, N. Ostle, V. Smith, S. Waldron, and J. Whitaker (2016), Ground-level climate at a peatland wind
farm in Scotland is affected by wind turbine operation, Environ. Res. Lett., 11(4), 44024, doi:10.1088/1748-9326/11/4/044024.Baidya Roy, S. (2004), Can large wind farms affect local meteorology?, J. Geophys. Res., 109, D19101, doi:10.1029/2004JD004763.Baidya Roy, S. (2011), Simulating impacts of wind farms on local hydrometeorology, J. Wind Eng. Ind. Aerodyn., 99(4), 491–498, doi:10.1016/j.
jweia.2010.12.013.Barthelmie, R. J., et al. (2007), Modelling and measurements of wakes in large wind farms, J. Phys. Conf. Ser., 75, 12,049, doi:10.1088/1742-
6596/75/1/012049.Barthelmie, R. J., et al. (2009), Modelling and measuring flow and wind turbine wakes in large wind farms offshore, Wind Energy, 12(5),
431–444, doi:10.1002/we.348.Barthelmie, R. J., S. C. Pryor, S. T. Frandsen, K. S. Hansen, J. G. Schepers, K. Rados, W. Schlez, A. Neubert, L. E. Jensen, and S. Neckelmann (2010),
Quantifying the impact of wind turbine wakes on power output at offshore wind farm, J. Atmos. Oceanic Technol., 27(8), 1302–1317,doi:10.1175/2010JTECHA1398.1.
Barthelmie, R., O. F. Hansen, K. Enevoldsen, J. Højstrup, S. Frandsen, S. Pryor, S. Larsen, M. Motta, and P. Sanderhoff (2005), Ten years ofmeteorological measurements for offshore wind farms, J. Sol. Energy Eng., 127(2), 170–176, doi:10.1115/1.1850489.
Cervarich, M. C., S. B. Roy, and L. Zhou (2013), Spatiotemporal structure of wind farm-atmospheric boundary layer interactions, EnergyProcedia, 40, 530–536, doi:10.1016/j.egypro.2013.08.061.
Chamorro, L. P., and F. Porté-Agel (2009), A wind-tunnel investigation of wind-turbine wakes: Boundary-layer turbulence effects, Bound.Layer Meteorol., 132(1), 129–149, doi:10.1007/s10546-009-9380-8.
Chamorro, L. P., and F. Porté-Agel (2010), Effects of thermal stability and incoming boundary-layer flow characteristics on wind-turbinewakes: A wind-tunnel study, Bound. Layer Meteorol., 136(3), 515–533, doi:10.1007/s10546-010-9512-1.
Chamorro, L. P., R. E. A. Arndt, and F. Sotiropoulos (2011), Turbulent flow properties around a staggered wind farm, Bound. Layer Meteorol.,141(3), 349–367, doi:10.1007/s10546-011-9649-6.
Chamorro, L. P., M. Guala, R. E. A. Arndt, and F. Sotiropoulos (2012a), On the evolution of turbulent scales in the wake of a wind turbine model,J. Turbul., 13, N27, doi:10.1080/14685248.2012.697169.
Chamorro, L. P., R. E. Arndt, and F. Sotiropoulos (2012b), Reynolds number dependence of turbulence statistics in the wake of wind turbines:Reynolds dependence of wind turbine wakes, Wind Energy, 15(5), 733–742, doi:10.1002/we.501.
Clifton, A., S. Schreck, G. Scott, N. Kelley, and J. K. Lundquist (2013), Turbine inflow characterization at the National Wind Technology Center,J. Sol. Energy Eng., 135(3), 31017.
Fitch, A. C., J. K. Lundquist, and J. B. Olson (2013), Mesoscale influences of wind farms throughout a diurnal cycle, Mon. Weather Rev., 141(7),2173–2198, doi:10.1175/MWR-D-12-00185.1.
Gryning, S.-E., E. Batchvarova, B. Brümmer, H. Ejsing Jørgensen, S. E. Larsen, S.-E. Gryning, E. Batchvarova, B. Brümmer, H. Ejsing Jørgensen,and S. E. Larsen (2007), On the extension of the wind profile over homogeneous terrain beyond the surface boundary layer, Bound. LayerMeteorol., 124(2), 251–268, doi:10.1007/s10546-007-9166-9.
Hancock, P. E., and F. Pascheke (2013), Wind-tunnel simulation of the wake of a large wind turbine in a stable boundary layer. Part 2: Thewake flow, Bound. Layer Meteorol., 151(1), 23–37, doi:10.1007/s10546-013-9887-x.
Hancock, P. E., and T. D. Farr (2014), Wind-tunnel simulations of wind-turbine arrays in neutral and non-neutral winds, J. Phys. Conf. Ser.,524(1), 12166, doi:10.1088/1742-6596/524/1/012166.
Hansen, K. S., R. J. Barthelmie, L. E. Jensen, and A. Sommer (2012), The impact of turbulence intensity and atmospheric stability on powerdeficits due to wind turbine wakes at Horns Rev wind farm, Wind Energy, 15(1), 183–196, doi:10.1002/we.512.
Harris, R., L. Zhou, and G. Xia (2014), Satellite observations of wind farm impacts on nocturnal land surface temperature in Iowa, Remote Sens.,6(12), 12,234–12,246, doi:10.3390/rs61212234.
Hirth, B. D., and J. L. Schroeder (2013), Documenting wind speed and power deficits behind a utility-scale wind turbine, J. Appl. Meteorol.Climatol., 52(1), 39–46, doi:10.1175/JAMC-D-12-0145.1.
Hirth, B. D., J. L. Schroeder, W. S. Gunter, and J. G. Guynes (2014), Coupling Doppler radar-derived wind maps with operational turbine data todocument wind farm complex flows, Wind Energy, 18, 529–540, doi:10.1002/we.1701.
Journal of Geophysical Research: Atmospheres 10.1002/2016JD025297
RAJEWSKI ET AL. MICROCLIMATE WITH TURBINES ON VERSUS OFF 13,412
AcknowledgmentsPartial funding for CWEX-10 was pro-vided by the Ames Laboratory (DOE)and the Center for Global and RegionalEnvironmental Research at theUniversity of Iowa. Partial funding wasprovided by the Pioneer Hi-BredProfessorship in Agronomy. Surface fluxstations deployed during the studywere provided by NLAE, and under-graduate student participation wassupplemented by funding from an NSFResearch Experience forUndergraduates program under grant1063048. Data analysis was supportedin part by the National ScienceFoundation under the State of IowaEPSCoR Grant IA-EPS 1101284. The sur-face flux data from CWEX-10 are avail-able from the authors upon request([email protected]). The data arearchived in the Department ofAgronomy at Iowa State University. Wealso thank the team who collected theCWEX-10 data set, including JerryHatfield and Richard Pfeifer at NLAE.The authors acknowledge the windfarm manager and land owner/operatorcooperation in conducting CWEX. TheSCADA data were provided by theowner of the wind plant under a non-disclosure agreement. We additionallythank the reviewers for their commentsin improving the manuscript.

Högström, U., J. C. R. Hunt, and A.-S. Smedman (2002), Theory and measurements for turbulence spectra and variances in the atmosphericneutral surface layer, Bound. Layer Meteorol., 103(1), 101–124.
Iungo, G. V., and F. Porté-Agel (2014), Volumetric scans of wind turbine wakes performed with three simultaneous wind LiDARs under dif-ferent atmospheric stability regimes, J. Phys. Conf. Ser., 524, 12164, doi:10.1088/1742-6596/524/1/012164.
Jiménez, Á., E. Migoya, M. Esteban, D. Giménez, J. García, and A. Crespo (2011), Influence of topography and wakes on wind turbulence:Measurements and interpretation of results: Topography and wakes effects on wind turbulence,Wind Energy, 14(7), 895–908, doi:10.1002/we.492.
Katurji, M., A. Sturman, and P. Zawar-Reza (2011), An investigation into ridge-top turbulence characteristics during neutral and weakly stableconditions: Velocity spectra and isotropy, Bound. Layer Meteorol., 139(1), 143–160, doi:10.1007/s10546-010-9576-y.
Kelley, N. D. (2011), Turbulence-Turbine Interaction: The Basis for the Development of the TurbSim Stochastic Simulator, National RenewableEnergy Laboratory (NREL), Golden, Colo.
Larsén, X. G., C. Vincent, and S. Larsen (2013), Spectral structure of mesoscale winds over the water, Q. J. R. Meteorol. Soc., 139(672), 685–700,doi:10.1002/qj.2003.
LeBeau, C. W., J. L. Beck, G. D. Johnson, and M. J. Holloran (2014), Short-term impacts of wind energy development on greater sage-grousefitness: Greater sage-grouse survival and wind energy, J. Wildl. Manage., 78(3), 522–530, doi:10.1002/jwmg.679.
Leuning, R. (2005), Measurements of trace gas fluxes in the atmosphere using eddy covariance: WPL corrections revisited, in Handbook ofMicrometeorology, pp. 119–132, Springer, Netherlands.
Lu, H., and F. Porté-Agel (2011), Large-eddy simulation of a very large wind farm in a stable atmospheric boundary layer, Phys. Fluids, 23(6),65,101, doi:10.1063/1.3589857.
Lundquist, J. K., et al. (2014), Lidar observations of interacting wind turbine wakes in an onshore wind farm, Proc EWEA2014 Barc. Spain.[Available at http://www.leosphere.com/wp-content/uploads/2014/03/Lundquist_Boquet_EWEA_2014_CWEX13_final.pdf, Accessed 4November 2014.]
Markfort, C. D., W. Zhang, and F. Porté-Agel (2012), Turbulent flow and scalar transport through and over aligned and staggered wind farms,J. Turbul., 13, N33, doi:10.1080/14685248.2012.709635.
Mirocha, J. D., B. Kosovic, M. L. Aitken, and J. K. Lundquist (2014), Implementation of a generalized actuator disk wind turbine model into theweather research and forecasting model for large-eddy simulation applications, J. Renewable Sustainable Energy, 6(1), 13104, doi:10.1063/1.4861061.
Mirocha, J. D., D. A. Rajewski, N. Marjanovic, J. K. Lundquist, B. Kosović, C. Draxl, and M. J. Churchfield (2015), Investigating wind turbineimpacts on near-wake flow using profiling lidar data and large-eddy simulations with an actuator disk model, J. Renewable SustainableEnergy, 7(4), 43143, doi:10.1063/1.4928873.
Newman, A. J., D. A. Drew, and L. Castillo (2014), Pseudo spectral analysis of the energy entrainment in a scaled down wind farm, RenewableEnergy, 70, 129–141, doi:10.1016/j.renene.2014.02.003.
Porté-Agel, F., Y.-T. Wu, and C.-H. Chen (2013), A numerical study of the effects of wind direction on turbine wakes and power losses in a largewind farm, Energies, 6(10), 5297–5313, doi:10.3390/en6105297.
Rajewski, D. A., et al. (2013), CropWind Energy Experiment (CWEX): Observations of surface-layer, boundary layer, andmesoscale interactionswith a wind farm, Bull. Am. Meteorol. Soc., 94(5), 655–672, doi:10.1175/BAMS-D-11-00240.1.
Rajewski, D. A., E. S. Takle, J. K. Lundquist, J. H. Prueger, R. L. Pfeiffer, J. L. Hatfield, K. K. Spoth, and R. K. Doorenbos (2014), Changes in fluxes ofheat, H2O, and CO2 caused by a large wind farm, Agric. For. Meteorol., 194, 175–187, doi:10.1016/j.agrformet.2014.03.023.
Rhodes, M. E., and J. K. Lundquist (2013), The effect of wind-turbine wakes on summertime US Midwest atmospheric wind profiles asobserved with ground-based Doppler lidar, Bound. Layer Meteorol., 149(1), 85–103, doi:10.1007/s10546-013-9834-x.
Selvaraj, S., Chaves, J. A., Tackle, S. E., and Sharma A. (2013), Numerical prediction of flow convergence phenomenon in windfarms, Conf. onWind Energy Science and Technology, Ankara.
Sescu, A., and C. Meneveau (2015), Large-eddy simulation and single-column modeling of thermally stratified wind turbine arrays for fullydeveloped, stationary atmospheric conditions, J. Atmos. Oceanic Technol., 32(6), 1144–1162, doi:10.1175/JTECH-D-14-00068.1.
Slawsky, L., L. Zhou, S. Roy, G. Xia, M. Vuille, and R. Harris (2015), Observed thermal impacts of wind farms over northern Illinois, Sensors, 15(7),14,981–15,005, doi:10.3390/s150714981.
Smith, C. M., R. J. Barthelmie, and S. C. Pryor (2013), In situ observations of the influence of a large onshore wind farm on near-surfacetemperature, turbulence intensity and wind speed profiles, Environ. Res. Lett., 8(3), 34006, doi:10.1088/1748-9326/8/3/034006.
Smith, R. B. (2010), Gravity wave effects on wind farm efficiency, Wind Energy, 13(5), 449–458, doi:10.1002/we.366.Stull, R. B. (1988), An Introduction to Boundary Layer Meteorology, 1st ed., Springer, New York.Takle, E. S., et al. (2010), Wind and flux measurements in a windfarm co-located wth agricultural production (Invited), Abstract A44D-05
presented at 2010 Fall Meeting, AGU, San Francisco, Calif., 13–17 Dec.Takle, E. S., D. A. Rajewski, J. K. Lundquist, W. A. G. Jr, and A. Sharma (2014), Measurements in support of wind farm simulations and
power forecasts: The Crop/Wind-energy Experiments (CWEX), J. Phys. Conf. Ser., 524(1), 12174, doi:10.1088/1742-6596/524/1/012174.
Walsh-Thomas, J. M., G. Cervone, P. Agouris, and G. Manca (2012), Further evidence of impacts of large-scale wind farms on land surfacetemperature, Renewable Sustainable Energy Rev., 16(8), 6432–6437, doi:10.1016/j.rser.2012.07.004.
Walton, R. A., E. S. Takle, and W. A. Gallus Jr. (2014), Characteristics of 50–200 m winds and temperatures derived from an Iowa tall towernetwork, J. Appl. Meteorol. Climatol., 53, 2387–2393, doi:10.1175/JAMC-D-13-0340.1.
Wang, H., and E. S. Takle (1995), Numerical simulations of shelterbelt effects on wind direction, J. Appl. Meteorol., 34, 2206–2219.Wang, H., and E. S. Takle (1996), On shelter efficiency of shelterbelts in oblique wind, Agric. For. Meteorol., 81(1), 95–117, doi:10.1016/0168-
1923(95)02311-9.Whiteman, C. D., X. Bian, and S. Zhong (1997), Low-level jet climatology from enhanced rawinsonde observations at a site in the southern
Great Plains, J. Appl. Meteorol., 36(10), 1363–1376.Wilczak, J. M., S. P. Oncley, and S. A. Stage (2001), Sonic anemometer tilt correction algorithms, Bound. Layer Meteorol., 99(1), 127–150.Winder, V. L., L. B. McNew, A. J. Gregory, L. M. Hunt, S. M. Wisely, and B. K. Sandercock (2014), Effects of wind energy development on survival
of female greater prairie-chickens, J. Appl. Ecol., 51(2), 395–405, doi:10.1111/1365-2664.12184.Xia, G., L. Zhou, J. M. Freedman, S. B. Roy, R. A. Harris, and M. C. Cervarich (2015), A case study of effects of atmospheric boundary layer
turbulence, wind speed, and stability on wind farm induced temperature changes using observations from a field campaign, Clim. Dyn.,46, 2179–2196, doi:10.1007/s00382-015-2696-9.
Zhang, W., C. D. Markfort, and F. Porté-Agel (2013a), Experimental study of the impact of large-scale wind farms on land–atmosphereexchanges, Environ. Res. Lett., 8(1), 15002, doi:10.1088/1748-9326/8/1/015002.
Journal of Geophysical Research: Atmospheres 10.1002/2016JD025297
RAJEWSKI ET AL. MICROCLIMATE WITH TURBINES ON VERSUS OFF 13,413

Zhang, W., C. D. Markfort, and F. Porté-Agel (2013b), Wind-turbine wakes in a convective boundary layer: A wind-tunnel study, Bound. LayerMeteorol., 146(2), 161–179, doi:10.1007/s10546-012-9751-4.
Zhou, L., Y. Tian, S. Baidya Roy, Y. Dai, and H. Chen (2012a), Diurnal and seasonal variations of wind farm impacts on land surface temperatureover western Texas, Clim. Dyn., 41, 307–326, doi:10.1007/s00382-012-1485-y.
Zhou, L., Y. Tian, S. Baidya Roy, C. Thorncroft, L. F. Bosart, and Y. Hu (2012b), Impacts of wind farms on land surface temperature, Nat. Clim.Change, 2, 539–543, doi:10.1038/nclimate1505.
Zhou, L., Y. Tian, H. Chen, Y. Dai, and R. A. Harris (2013), Effects of topography on assessing wind farm impacts using MODIS data, EarthInteract., 17(13), 1–18, doi:10.1175/2012EI000510.1.
Journal of Geophysical Research: Atmospheres 10.1002/2016JD025297
RAJEWSKI ET AL. MICROCLIMATE WITH TURBINES ON VERSUS OFF 13,414